a transgenomic cytogenetic sorghum (sorghum … · technique to production of the first detailed...
TRANSCRIPT

Copyright � 2007 by the Genetics Society of AmericaDOI: 10.1534/genetics.107.080846
A Transgenomic Cytogenetic Sorghum (Sorghum propinquum) BacterialArtificial Chromosome Fluorescence in Situ Hybridization Map of
Maize (Zea mays L.) Pachytene Chromosome 9, Evidence forRegions of Genome Hyperexpansion
F. Ina E. Amarillo and Hank W. Bass1
Department of Biological Science, Florida State University, Tallahassee, Florida 32306-4370
Manuscript received August 20, 2007Accepted for publication September 23, 2007
ABSTRACT
A cytogenetic FISH map of maize pachytene-stage chromosome 9 was produced with 32 maize marker-selected sorghum BACs as probes. The genetically mapped markers used are distributed along the linkagemaps at an average spacing of 5 cM. Each locus was mapped by means of multicolor direct FISH with afluorescently labeled probe mix containing a whole-chromosome paint, a single sorghum BAC clone, andthe centromeric sequence, CentC. A maize-chromosome-addition line of oat was used for brightunambiguous identification of the maize 9 fiber within pachytene chromosome spreads. The locations ofthe sorghum BAC–FISH signals were determined, and each new cytogenetic locus was assigned acentiMcClintock position on the short (9S) or long (9L) arm. Nearly all of the markers appeared in thesame order on linkage and cytogenetic maps but at different relative positions on the two. The CentCFISH signal was localized between cdo17 (at 9L.03) and tda66 (at 9S.03). Several regions of genomehyperexpansion on maize chromosome 9 were found by comparative analysis of relative marker spacing inmaize and sorghum. This transgenomic cytogenetic FISH map creates anchors between various maps ofmaize and sorghum and creates additional tools and information for understanding the structure andevolution of the maize genome.
THE genome of maize (Zea mays L.) has been stud-ied as a model for eukaryotic genetics, cereal
crops, and monocot genome evolution (Chandler andBrendel 2002), but its size and organizational com-plexity complicate resolution of its structure. The pres-ence of large gene-poor areas, segmental duplications,abundant retrotransposons, and microvariation amonglines of maize all confound efforts to develop a fullyassembled physical map of the entire maize genome(Kumar and Bennetzen 1999; Gaut et al. 2000; Meyers
et al. 2001; Yuan et al. 2003; Messing et al. 2004;Swigonova et al. 2004; Paterson et al. 2005). Despitethese complexities, several different kinds of maps havebeen developed to characterize its structure and func-tion at the DNA and chromosome levels. Many linkagemaps have been developed, including those based onmutant phenotypes (Emerson et al. 1935) and morerecently those that include thousands of additionalmolecular markers such as restriction fragment lengthpolymorphisms (RFLPs), simple sequence repeats (SSRs),single-nucleotide polymorphisms (SNPs), and insertion–deletion polymorphisms (indels) (Helentjaris et al.1986; Coe et al. 1987; Burr et al. 1988; Causse et al.
1996; Senior and Heun 1993; Taramino and Tingey
1996; Harushima et al. 1998; Davis et al. 1999; Lee et al.2002; Sharopova et al. 2002; Bowers et al. 2003; Fu
et al. 2006). Physical maps of overlapping clones havebeen produced and anchored to the linkage map bymeans of molecular probes (De Jong et al. 1999;Bennetzen et al. 2001; Chandler and Brendel 2002;Gardiner et al. 2004; Messing et al. 2004; Bowers et al.2005; Song et al. 2005; Hass-Jacobus et al. 2006).Another type of physical map is the cytological mapproduced by direct microscopic inspection of the chro-mosomes that make up the nuclear genome. Cytoge-netic maps are valuable because they can place geneticloci directly within the entire chromosome, the ultimatecontig, providing information on the location, order,and distribution of DNA sequences in relation to othergenetic markers along the chromosomes (Sadder et al.2000; Anderson et al. 2004; Kim et al. 2005a,b). In con-trast to those of the well-developed linkage maps andclone- or sequence-based physical maps, the construc-tion of high-density cytogenetic maps is nascent andrelatively underdeveloped.
Cytological analysis of maize meiotic chromosomesprovided fundamental insights into transmission ge-netics and the dynamic nature of the maize genome.The early insights included the physical basis of ge-netic recombination, the discovery of transposable DNA
1Corresponding author: Department of Biological Science, Florida StateUniversity, Tallahassee, FL 32306-4370. E-mail: [email protected]
Genetics 177: 1509–1526 (November 2007)

elements, the capping properties of telomeres, and evi-dence in support of the chromosome theory of inheri-tance (Creighton and McClintock 1931; Rhoades
and McClintock 1935; McClintock 1941, 1978; Rhoades
1950; and reviewed by Carlson 1988). These earlierstudies also provided the basis for the meiotic chromo-some karyotype of maize, in which chromosome-spreadpreparations allow the 10 individual maize chromo-somes to be recognized. Cytological chromosome stainsreveal the presence of chromosomal landmarks, such asthe knobs and centromeres, but the meiotic as well asthe somatic karyotype of maize has lacked extensive ge-netic detail for many decades (Carlson 1988; Dempsey
1994; Chen et al. 2000; Adawy et al. 2004).Advances in molecular biology and genomics offered
new tools for cytological localization of DNA sequencesand prospects for further cytogenetic map developmentin maize (De Jong et al. 1999; Harper and Cande 2000;Sadder et al. 2000). The development of cytogeneticFISH maps of maize has progressed from mapping re-peat sequences such as knobs, centromeres, and telo-meres to mapping RFLP markers, single-copy genes, andindividual transposons on mitotic and meiotic chromo-somes (Shen et al. 1987; Coe 1994; Chen et al. 2000;Sadder et al. 2000; Sadder and Weber 2001, 2002;Koumbaris and Bass 2003; Kato et al. 2004, 2005;Wang et al. 2006; Lamb et al. 2007). FISH mapping ofpachytene chromosomes has proved to be useful formany other plant species such as tomato (Zhong et al.1996a,b; Peterson et al. 1999), potato (Song et al. 2000),Arabidopsis (Fransz et al. 1996; Lysak et al. 2001),Medicago (Kulikova et al. 2001), rice (Cheng et al. 2001a,b,2002), sorghum (Islam-Faridi et al. 2002; Kim et al.2005a,b), Brassica (Howell et al. 2002), and soybean(Walling et al. 2006).
Mitotic and meiotic chromosomes have been success-fully used to create cytogenetic maps of maize. Themitotic chromosomes are easier to prepare, but meioticchromosomes have the advantage of longer axial fibersfor improved localization within chromosome arms(Pedersen and Linde-Laursen 1994; Cheng et al.2001a,b; Desel et al. 2001; Kulikova et al. 2001).Another advantage of meiotic chromosomes is that thepachytene-based cytogenetic maps can be compared toand integrated directly with recombination nodule-basedmaps and translocation breakpoint data (Anderson et al.2004; Sheridan and Auger 2006).
Major challenges for any FISH-based mapping tech-nique include the detection of small gene-size frag-ments, target chromosome identification, and probespecificity. Probe-detection limits can be overcome iflarge insert clones are used, such as those carried inBAC, YAC, or cosmid vectors (Woo et al. 1994; Hanson
et al. 1995; Jiang et al. 1995; Ohmido et al. 1998; Zwick
et al. 1998; Zhong et al. 1999; Dong et al. 2000; Kulikova
et al. 2001). The advantage of increased signal strengthwith increasing probe size is offset, however, by the
commensurate increase in the likelihood of detectingunintended targets such as repetitive sequences. Thisproblem is acute in maize, where intergenic repetitivesequence elements abound and any given maize BACclone may only contain a few kilobase pairs of unique,single-copy sequence (Liu et al. 2007). One approach toFISH mapping in maize is to use large maize genomicDNA fragments in conjunction with competitive in situsuppression hybridization (Sadder et al. 2000; Sadder
and Weber 2002). Another approach is to find relativelylarge single-gene fragments (.3 kbp) for loci to bemapped (Wang et al. 2006). Yet another strategy is touse genomic BAC clones from the small-genome rela-tive sorghum (Koumbaris and Bass 2003). The cross-hybridization of DNA probes from one species to targetchromosomes of another species can help overcomedetection limits if the two species have different ordivergent classes of interspersed repetitive sequences,as is the case for sorghum and maize. Transgenomicmapping and large-fragment FISH have been suc-cessfully used in maize and in other plant species forcomparative genomics (Hulbert et al. 1990; Fuchs
et al. 1996; Gomez et al. 1997; Zwick et al. 1998; Jackson
et al. 2000; Bowers et al. 2003; Koumbaris and Bass
2003).Koumbaris and Bass (2003) developed a technique
combining transgenomic and BAC–FISH mapping toovercome the probe-detection limit and establish anindirect way to define the cytogenetic location of se-quences corresponding to targets such as RFLP probes,many of which are ,1 kb. The method takes advantageof genomic and genetic resources in maize and sor-ghum. Here we report results from extension of thistechnique to production of the first detailed trans-genomic BAC–FISH map of any maize chromosome.The locations of 32 genetically mapped markers wereplaced on the cytogenetic map, and their distributionrevealed distinct irregularities with implications formaize genome assembly and evolution.
MATERIALS AND METHODS
Meiotic chromosome spreads: Chromosome spreads wereprepared from a disomic maize chromosome-addition line ofoat (OMAd9.2b from Kynast et al. 2001), referred to as ‘‘oat–maize 9’’ in this study, that was grown in plant growthchambers or in a greenhouse (Mission Road Facility, Bi-ological Science, Florida State University, Tallahassee, FL).Meiosis-stage florets were harvested and fixed in Carnoy’ssolution (3 parts absolute ethanol:1 part glacial acetic acid) for1–2 days on a rotatory shaker at 4�. After fixation, the floretswere rinsed with distilled water and stored in 70% ethanol at�20� until used. The meiotic stage was determined for one ofthe three anthers from a floret by the acetocarmine method.Anthers from florets with pachytene-stage meiocytes werecollected and stored in 70% ethanol at �20� until used.Anthers were digested with enzymes as described by Zhong
et al. (1996b), and during pachytene spread preparation, slideswere given an extra three to five rounds of water vapor–acetic
1510 F. I. E. Amarillo and H. W. Bass

acid exposure, which allowed more spreading of pachytenechromosomes (Koumbaris and Bass 2003). The quality ofspreads was evaluated by differential interference contrastmicroscopy. Slides with numerous well-spread chromosomeslocated in the middle of the slide, with good chromosomemorphology and minimal cellular debris, were stored at �20�until used for FISH.
Identification and selection of sorghum BAC clones:Sorghum BAC clones used as FISH probes were screened byhybridization with maize RFLP probes (as described below andby Koumbaris and Bass 2003) or with overgo probes (carriedout by Bowers et al. 2005) designed to detect various maizemarker probes. For RFLP-selected BACs, Sorghum propinquumgenomic BAC grid-library filter arrays were obtained from A.H. Paterson (YRL filter pair; University of Georgia, Athens,GA). The detected S. propinquum BAC clones (typically four toseven overlapping BACs for each RFLP probe) were grown andthe BAC DNA was initially isolated by the plasmid miniprepmethod with the QIAprep Spin Miniprep kit (no. 27104;QIAGEN, Valencia, CA). Southern blot analysis was then usedon the restriction enzyme-digested miniprep DNA to verifyclone identity. The criteria for BAC clone selection were (1)the BAC should belong to a group of overlapping clonesdetected by the probe and within one contig, (2) the BACshould be centrally located within this group of probe-detected overlapping BACs, and (3) the BAC should containthe same size restriction enzyme fragment as that observedwith most or all of the other probe-detected overlapping BACclones. A single selected sorghum BAC clone for each locuswas then grown for large-scale BAC DNA preparation with theQIAGEN Large Construct kit (no. 12462), according tomanufacturer’s instructions. Highly purified BAC DNA wasdigested with EcoRI enzyme and then direct labeled for FISHby random-primed labeling. The YRL filters were reused afterstripping by two to three washes for 30 min each with 15 mm
sodium phosphate buffer (pH 6.9) at 80�. In addition to theseBACs, we obtained others as gifts, including a S. bicolor BACcorresponding to the maize waxy1 locus (BAC 131L1, Gen-Bank accession AF488412), from J. Ma and J. Bennetzen andseveral other S. bicolor BACs (sbb18256/191b4 and sb16685/174g5) that had been used as FISH probes on pachytenechromosomes (Islam-Faridi et al. 2002) from P. E. Klein(Texas A&M University, College Station, TX).
Slide pretreatment and FISH with pachytene chromosomespreads: The overall FISH procedure was performed asdescribed by Koumbaris and Bass (2003) with minor mod-ifications. Pachytene chromosomes were denatured in 70%formamide in 23 SSC at 70� for 3–5 min and then dehydratedfor 3 min in each concentration of an ice-cold ethanol series(70, 90, and 100%). The BAC clones were labeled withChromaTide Alexa Fluor 546-16-OBEA-dCTP (Invitrogen,San Diego). The labeled FISH probes were concentrated byethanol precipitation, redissolved in TE, and stored at �20�until used. The probe mix was denatured for 10 min at 90�,quick cooled on ice, and then combined with formamide, SSC,and dextran sulfate. The final FISH probe mixture consistedof 100 mg/ml Alexa fluor 488-labeled maize DNA (inbredKWF), centromere-specific CentC probe (10 mg/ml Alexa 647-labeled CentC repeat (Ananiev et al. 1998) DNA or 5–10 mg/mlof the oligonucleotide probe MCCY (labeled with Cy5),200–300 mg/ml Alexa 546-labeled sorghum BAC DNA, 1 mg/mlcalf thymus DNA, and 180 mg/ml S. bicolor (genotype Tx623)genomic DNA in 23 SSC, 50% formamide, and 10% dextransulfate. The probe mix was added to the slide bearing thetarget pachytene chromosomes. The SSC content was de-creased to as little as 0.53 SSC in cases where high backgroundwas initially observed. Hybridization was carried out at 37� onslides (20–25 ml per slide) with rubber cement-sealed cover-
slips with the twin tower block of the DNA engine tetrad (PTC-225; MJ Research, Watertown, MA) for 18–20 hr. After hy-bridization, slides were washed three times (5 min each) with50% formamide plus 0.5–23 SSC at 37� and then washed atroom temperature with 23 SSC three times (5 min each),washed with 13 PBS three times (5 min each), stained with3–5 mg/ml DAPI, washed with 1 mm DTT in 13 PBS, and thenmounted with Vectashield (Vector Labs, Burlingame, CA) formicroscopy.
Data collection and image processing: The FISH prepara-tions were analyzed with an Olympus microscope equippedwith a CCD camera (Applied Precision, Issaquah, WA). Three-dimensional (3D) images of oat–maize chromosome fibers,maize pachytene chromosome 9, sorghum BAC–FISH signal,and maize centC MCCY signal were acquired on the DAPI,FITC, RHOD, and Cy5 channels, respectively. The 3D imagestacks (with Z sections spaced at 0.2–0.3 mm for a total depth of5–8 mm) were subjected to iterative 3D deconvolution, andnuclei showing well-stained maize pachytene fibers were usedto trace and computationally straighten maize 9 chromosomesfor cytogenetic mapping. Pachytene fibers with little or nobackground staining were straightened and analyzed as de-scribed in Koumbaris and Bass (2003).
FISH locus determination and nomenclature: The arm ofinterest was divided into 20–40 bins of equal length, and anyFISH signal on the arm was assigned to a bin on the basis of itsfractional distance from the centromere (position 0.0) to thetelomere (position 1.0). Frequency histograms were inspectedto identify regions with significant, above-background signalsas described by Koumbaris and Bass (2003). The measuredpositions for all FISH signals that fell within these peak regionswere averaged. The mean value, standard error (SEM), andsample size (n) are given in Table 1 for each locus incentiMcClintock (cMC) units. The nomenclature system (asdescribed in http://www.maizegdb.org/CMMprotocols.php)for a FISH locus consists of (1) the sorghum BAC source (sbbfor S. bicolor or spb for S. propinquum), (2) location on thelinkage map (CBM for core bin marker or just the resident binnumber for other markers), and (3) the cytogenetic mapposition, followed by (4) the maize RFLP marker name inparentheses.
RESULTS
Selection of maize markers for cytogenetic mapping:A detailed pachytene-stage cytogenetic FISH map ofmaize chromosome 9 was created with sorghum BACsthat correspond to well-characterized maize RFLP probes.Maize RFLP probes have been used in hundreds oflinkage studies but most of these probes are smallerthan the lower limit of FISH detection on meiotic chro-mosomes as recently determined by Wang et al. (2006).We used an indirect mapping strategy that overcomesthis detection limit by treating maize marker-selectedsyntenic sorghum BACs as surrogate FISH probes. Thisstrategy was initially described by Koumbaris and Bass
(2003) for three loci and is extended here for an ad-ditional 32 cytogenetic loci.
We initially selected 52 markers that are spaced�5 cMapart covering the entire linkage map, as shown in Fig-ure 1, using the University of Missouri-Columbia (UMC)98 linkage map as our base linkage map (Davis et al.1999). This high-density map is saturated with maize
Sorghum BAC–FISH Map of Maize 9 1511

RFLP marker loci for which many public probes areavailable (T. A. Musket and G. L. Davis, University ofMissouri-Columbia RFLP Laboratory). Figure 1 showsthe genetic map positions of the maize 9 markers
initially chosen for FISH mapping. Very closely linkedmarkers whose order is not resolved are listed together,separated by commas or by branching lines (e.g., sus1,csu43). The estimated position of the centromere (Fig-ure 1, cent9, solid box) resides in bin 9.03 and its regionis shown enlarged (Figure 1B). On the basis of this map,the centromere for chromosome 9 was not specificallymapped but was placed between wx1 and csu193 (Davis
et al. 1999).Selection of sorghum BAC clones for use as FISH
probes: We made use of a well-developed fingerprint-contig (FPC) physical map of S. propinquum derived fromrestriction fragment analysis of the YRL BAC library(Lin et al. 1999). Clones from this library of partially di-gested HindIII restriction fragments of genomic DNAhave an average insert size of 126 kb. A pair of nylonfilters containing a gridded array of up to 36,864 YRLBACs are available for hybridization and these filtershave been screened with genetic markers such as overgoand RFLP probes (Lin et al. 1999; Bowers et al. 2003)and used to select sorghum BACs for use as FISH probes(Koumbaris and Bass 2003). High-stringency hybrid-ization (Tm�12�) carried out by us on the YRL sorghumBACs with maize RFLP probes resulted in the detectionof an average of 5.3 BACs per probe, consistent with thesixfold genomic coverage of the two filter sets.
This RFLP-based BAC selection procedure is illus-trated in Figure 2 for the maize marker, csu145a(pck),and the hybridization results are summarized in Table 1for all the markers mapped in the study reported here.This marker probe hybridized to 6 BAC clones on thefirst filter (Figure 2A, left) and 5 on the second (Figure2A, right). We determined the addresses of these BACsin the library and searched the online Sorghum FPCMap for them (http://www.genome.arizona.edu/fpc/sorghum/). Only 8 of the 11 BACs detected by probecsu145 (Figure 2A) were found to be overlapping in asingle S. propinquum contig, no. 191 (Figure 2D, arrows).BAC a0035C01 was detected by many different maizeRFLP probes used and was therefore considered arecurring false positive and excluded from the lists ofloci detected. The contig to which the other two BACs(a0028H16 and a0026D19) belong could not be iden-tified with the FPC map. We grew and isolated theremaining 8 detected BACs using a DNA miniprepprocedure and subjected them to Southern blot analysisto verify that they did indeed contain a csu145-cross-hybridizing sequence (Figure 2, B and C). The sameprobe that was used to screen the YRL filters alsohybridized to a single band in EcoRI-digested DNAminipreps (Figure 2, B and C, lanes 8–15) and to itself(lane 7) but not to other BACs on the same blot (lanes2–5). Once confirmed by these procedures, a singleBAC could be chosen for use as a FISH probe. In somecases, we used a BAC that was previously identified byovergo probe hybridization and subsequently con-firmed by us using the corresponding RFLP probe.
Figure 1.—Location of RFLP markers chosen for cytoge-netic FISH mapping and their position on the linkage map ofmaize chromosome 9. (A) Partial linkage map of chromosome9 adapted from UMC 98 9 (Davis et al. 1999). Core bin markers(CBM) are in boxes and their corresponding cumulative mapposition in centimorgans is indicated on the left. The geneticbins (9.00, 9.01, etc.) are indicated in boldface type and the cen-timorgandistancebetweenadjacentmarkers is indicated(smallnumbers between loci). Markers with the same linkage-map po-sitionsare listedtogetherandseparatedbycommasor indicatedby branching lines. (B) Magnified version of the linkage mapbetween CBM 9.03 (wx1) and CBM 9.04 (csu147), showingmarkers around the centromere. The estimated position ofthe centromere is indicated (solid box, cent9).
1512 F. I. E. Amarillo and H. W. Bass

We found that probes for several different but closelylinked markers sometimes hybridized to BACs in thesame sorghum contig or even to the same sorghum BACclones (Table 1). The plasmid clones that identified thesame contigs but selected different groups of clones areas follows: (1) csu392 and csu710 (contig 188); (2)umc148 and php10005 (contig 389); and (3) csu145,csu28, asg44, and cdo1387 (contig 191) (Figure 2D).Sorghum RFLP markers cdo1387 (Figure 2D, solidcircle) and csu28 (Figure 2D, arrowhead) were alreadymapped on this physical contig along with othermarkers and overgo probes. From the positions of theBAC clones detected by maize RFLP markers asg44(Figure 2D, asterisks) and csu145 (Figure 2D, arrows),
we have determined their approximate position on theFPC map (Figure 2D, below the line). From left to right,the order of loci in the contig map for the four men-tioned markers is cdo1387-asg44-csu28-csu145, the sameorder as that for the maize linkage map.
Overall, we set out to select BACs for 52 loci to beFISH mapped. We performed BAC filter hybridizationfor all of the available RFLPs (n ¼ 47) and used theinformation from these or previous overgo hybridiza-tions (Bowers et al. 2003) to select BAC probes forFISH. Nine RFLP probes resulted in a failure to detectsorghum BACs on the YRL BAC grid-array filters (n¼ 9,YN in Table 1) and seven RFLP probes resulted in afailure to detect sorghum BAC restriction fragments at
Figure 2.—Identification, selection, and verifi-cation of maize RFLP marker csu145-selected sor-ghum BAC clones. (A) Autoradiographs ofSorghum propinquum YRL filters showing six de-tected clones in the first filter (left) and five inthe second (right). BAC a0067L02 is encircledand magnified to show one of the unique two-spot patterns from which the BAC identificationis decoded. (B and C) An electrophoretic gel andautoradiograph of a blot containing the maizemarker csu145, the positive control (lane 7),and the eight BACs it detected (lanes 8–15). Alsoincluded are the maize marker csu183 (lane 2),the three clones it detected (lanes 3–5), andthe lambda marker (lane 1), which served as neg-ative controls. (D) Fingerprint contig map no. 191(http://www.genome.arizona.edu/fpc/sorghum/)showing the BACs detected by the followingmarkers: five BACs by cdo1387 (solid circles),seven BACs by asg44 (asterisks), five BACs bycsu28 (arrowheads), and eight BACs by csu145(arrows).
Sorghum BAC–FISH Map of Maize 9 1513

TA
BL
E1
Iden
tifi
cati
on
and
sele
ctio
no
fso
rgh
um
BA
Cs
Lo
cus
Bin
RF
LP
size
(bp
)P
rob
ety
pea
Pro
be
nam
e
Sorg
hu
mF
PC
con
tigs
No
.o
fB
AC
sh
itSe
lect
edso
rgh
um
BA
Csb
FIS
Hp
rob
ese
lect
edcM
c
Mea
n6
SEM
(n)d
FIS
Hlo
cus
(cM
C)e
Cyt
olo
cus
nam
e
agrr
118b
9.00
500
Rag
rr11
8YN
0.0
bn
l9.0
7a9.
0024
00R
bn
l9.0
7YN
10.1
um
c109
(CB
M9.
01)f
9.01
800
Ru
mc1
0912
207
a005
5A15
,a0
055B
21,
a006
4C07
,a0
004M
18,
a006
8L03
,a0
085L
22,
a004
0A04
a000
4M18
15.5
9S.7
9sp
b-C
BM
9.01
_S79
(um
c109
)
um
c148
9.01
520
Ru
mc1
4838
95
a003
0K10
,a0
038L
23,
a003
8N20
,a0
094A
07,
a001
3E22
a003
8L23
16.4
FN
rz14
4a9.
0115
00O
SOG
1672
389
1a0
030K
10a0
030K
1017
.40.
815
60.
004
(15)
9S.8
2sp
b-9
.01_
S82
(rz1
44a)
rz14
4c9.
0115
00O
SOG
1672
389
1a0
030K
10a0
030K
1021
.40.
745
60.
004
(12)
9S.7
5sp
b-9
.01_
S75
(rz1
44c)
ph
p10
005
9.01
850
Rp
hp
1000
538
95
a007
3F07
,a0
014C
11,
a006
8G09
,a0
045A
20,
a001
7D11
a004
5A20
24.8
0.73
06
0.00
2(3
1)9S
.73
spb
-9.0
1_S7
3(p
hp
1000
5)cs
u95
a9.
0111
00O
SOG
0620
130
1a0
012H
11a0
012H
1127
.70.
678
60.
002
(10)
9S.6
8sp
b-9
.01_
S68
(csu
95a)
csu
95a
9.01
1100
Rcs
u95
390
8a0
018G
19,
a009
4O05
,a0
095J
06,
a009
5O12
,a0
060M
11,
a009
6I01
,a0
095L
23,
a004
2B21
um
c248
a9.
0160
0R
um
c248
YN27
.7sh
19.
0125
00R
p24
6A39
27
a008
4C09
,a0
094F
18,
a002
1O07
,a0
015M
03,
a008
8L22
,a0
021O
04,
a009
1L24
a001
5M03
36.4
0.66
16
0.00
1(1
8)9S
.66
spb
-9.0
1_S6
6(s
h1)
bz1 (C
BM
9.02
)f
9.02
1500
Rp
BZ
1308
2a0
028C
12,
a002
0G06
a002
0G06
39.3
9S.6
5sp
b-C
BM
9.02
_S65
(bz1
)cs
u47
19.
0285
0R
csu
471
393
11a0
005O
05,
a003
4A09
,a0
043E
13,
a004
4I06
,a0
057D
08,
a006
3M03
,a0
061M
22,
a006
8O17
,a0
075C
01,
a001
6H09
,a0
015L
15
a007
5C01
42.8
0.63
66
0.00
2(5
5)9S
.64
spb
-9.0
2_S6
4(c
su47
1)
um
c256
a9.
0270
0R
um
c256
805
7SN
43.2
csu
486a
9.02
1350
Rcs
u48
639
48
a006
4N21
,a0
086K
22,
a001
4H21
,a0
053H
23,
a000
5O15
,a0
086N
18,
a000
7E04
,a0
024L
14
a008
6K22
45.5
0.38
56
0.00
3(3
4)9S
.39
spb
-9.0
2_S3
9(c
su48
6)
prc
19.
0210
80R
5C02
A05
394
9a0
064N
21,
a008
6K22
,a0
014H
21,
a005
3H23
,a0
005O
15,
a008
6N18
,a0
007E
04,
a002
4L14
,a0
076L
04
a007
6L04
50.2
0.37
36
0.00
2(4
2)9S
.37
spb
-9.0
2_S3
7(p
rc1)
um
c105
a9.
0261
0R
um
c105
396
3a0
016B
24,
a008
4H21
,a0
054A
13a0
054A
1354
.70.
276
60.
003
(17)
9S.2
8sp
b-9
.02_
S28
(um
c105
)cs
u22
8(p
fk)
9.02
1190
Rcs
u22
839
76
a003
8I11
,a0
043G
06,
a002
5D24
,a0
044C
12,
a003
9P12
,a0
095E
12
a004
3G06
59.7
0.26
96
0.00
3(2
4)9S
.27
spb
-9.0
2_S2
7½c
su22
8(p
fk)�
(con
tin
ued
)
1514 F. I. E. Amarillo and H. W. Bass

TA
BL
E1
(Co
nti
nu
ed)
Lo
cus
Bin
RF
LP
size
(bp
)P
rob
ety
pea
Pro
be
nam
e
Sorg
hu
mF
PC
con
tigs
No
.o
fB
AC
sh
itSe
lect
edso
rgh
um
BA
Csb
FIS
Hp
rob
ese
lect
edcM
c
Mea
n6
SEM
(n)d
FIS
Hlo
cus
(cM
C)e
Cyt
olo
cus
nam
e
wx1
(CB
M9.
03)
9.03
2300
Gu
mc2
513
1L1
(Ben
net
zen
,U
GA
)13
1L1
63.7
0133
60.
005
(16)
9S.1
3sb
b-C
BM
9.03
_S13
(wx1
)w
x1(C
BM
9.03
)9.
0323
00R
um
c25
YNtd
a66d
9.03
300
Rtd
a66
893
a007
4N08
,a0
054I
24,
a006
4A03
a005
4I24
63.7
0.03
16
0.00
1(2
5)9S
.03
spb
-9.0
3_S0
3(t
da6
6d)
cdo
179.
0390
0O
SOG
0101
874
5a0
011N
04,
a004
7J04
,a0
060M
19,
a008
2G20
,a0
093K
24a0
047J
0467
.70.
027
60.
003
(15)
9L.0
3sp
b-9
.03_
L03
(cd
o17
)rf
29.
0312
00R
rf2a
383
3a0
060G
13,
a007
0K10
,a0
090D
12a0
090D
1267
.7F
Ncs
u68
0d9.
0315
50R
csu
680
202
6a0
047C
15,
a000
5O02
,a0
060L
03,
a005
8B07
,a0
064I
11,
a005
1F17
a005
8B07
67.7
FN
csu
680d
9.03
1550
OSO
G13
5620
23
a005
8B07
,a0
064I
11,
a005
1F17
a005
1F17
bn
l7.2
4a9.
0321
00R
bn
l7.2
41
3SN
68.7
bn
l5.3
3c9.
0321
00R
bn
l5.3
353
5a0
067P
21,
a002
6E11
,a0
093B
10,
a002
0L09
,a0
032H
22a0
020L
0968
.70.
043
60.
002
(64)
9L.0
4sp
b-9
.03_
L04
(bn
l5.3
3c)
csu
321
9.03
750
Rcs
u32
113
615
a008
2L07
,a0
081N
24,
a002
0F10
,a0
024F
19,
a004
1D08
a002
0F10
69.1
0.03
56
0.00
2(4
0)9L
.04
spb
-9.0
3_L
04(c
su32
1)rg
pr3
235a
9.03
ND
OSO
G12
9732
71
a004
0B08
a004
0B08
69.1
0.04
96
0.00
3(2
5)9L
.05
spb
-9.0
3_L
05(r
gpr3
235a
)u
mc8
19.
0382
0R
um
c81
145
SN69
.6cs
u19
39.
0312
70R
csu
193
797
5a0
014C
14,
a002
5K08
,a0
060B
09,
a005
7H24
,a0
095I
20a0
014C
1470
.6F
N
std
6a(d
ba)
9.03
1200
Rp
AS8
797
6SN
70.6
gl15
9.03
1150
RH
S110
0.43
376
4a0
073J
07,
a007
5D13
,a0
084N
16,
a000
9B14
a007
5D13
70.6
0.06
36
0.00
2(4
8)9L
.06
spb
-9.0
3_L
06(g
l15)
gl15
9.03
1150
OSO
G04
8837
63
a007
3J07
,a0
075D
13,
a008
4N16
csu
147
(CB
M9.
04)
9.04
800
OSO
G18
6569
4a0
022A
12,
a004
9N08
,a0
054F
07,
a006
8M13
a004
9N08
72.8
0.07
36
0.00
3(2
1)9L
.07
spb
-CB
M9.
04_L
07(c
su14
7)cs
u14
7(C
BM
9.04
)9.
0480
0R
csu
147
YN
csu
183b
(cd
c48)
9.04
850
Rcs
u18
340
13
SN78
.0cs
u43
9.04
600
Rcs
u43
550
4SN
83.1
sus1
9.04
6000
Rp
21.2
YN83
.1cs
u69
4a(u
ce)
9.04
950
OSO
G08
7213
361
a009
3O18
a009
3O18
84.5
0.35
56
0.00
3(1
4)9L
.36
spb
-9.0
4_L
36½c
su69
4a(u
ce)�
csu
694a
(uce
)9.
0495
0R
csu
694
179
6a0
053I
22,
a008
6B07
,a0
076H
16,
a002
3A07
,a0
073A
14,
a009
4G22
um
c95
(CB
M9.
05)
9.05
660
Ru
mc9
518
27
a001
5A13
,a0
041F
23,
a004
3K19
,a0
063J
06,
a006
9D12
,a0
075C
14,
a009
4N21
a006
3J06
86.1
0.37
76
0.00
2(3
4)9L
.38
spb
-CB
M9.
05_L
38(u
mc9
5)
(con
tin
ued
)
Sorghum BAC–FISH Map of Maize 9 1515

TA
BL
E1
(Co
nti
nu
ed)
Lo
cus
Bin
RF
LP
size
(bp
)P
rob
ety
pea
Pro
be
nam
e
Sorg
hu
mF
PC
con
tigs
No
.o
fB
AC
sh
itSe
lect
edso
rgh
um
BA
Csb
FIS
Hp
rob
ese
lect
edcM
c
Mea
n6
SEM
(n)d
FIS
Hlo
cus
(cM
C)e
Cyt
olo
cus
nam
e
csu
392a
9.05
1000
OSO
G01
8453
911
a001
0M15
,a0
012B
01,
a001
6C21
,a0
030A
02,
a003
1D14
,a0
038B
08,
a004
3J23
,a0
044E
15,
a005
9K01
,a0
073M
05,
a008
0L20
a001
0M15
97.0
0.41
36
0.00
5(2
0)9L
.41
spb
-9.0
5_L
41(c
su39
2a)
csu
392a
9.05
1000
OSO
G01
8418
85
a000
4C15
,a0
010J
13,
a002
6E03
,a0
041K
24,
a007
9J11
csu
392a
9.05
1000
Rcs
u39
218
86
a007
6K14
,a0
074B
22,
a006
7J12
,a0
004C
15,
a002
6E03
,a0
072C
14cs
u71
0e(a
px)
9.05
700
OSO
G04
8421
15
a001
9J05
,a0
030K
14,
a004
4G10
,a0
064D
18,
a006
7N15
a001
9J05
101.
10.
456
60.
003
(25)
9L.4
6sp
b-9
.05_
L46
½csu
710e
(ap
x)�
csu
710e
(ap
x)9.
0570
0R
csu
710
188
5a0
047M
11,
a006
6O15
,a0
066B
02,
a005
8C12
,a0
093L
24cs
u21
9(tg
d)
9.05
500
Rcs
u21
918
93
a005
9O14
,a0
071H
18,
a006
7I12
a005
9O14
102.
30.
506
60.
006
(43)
9L.5
1sp
b-9
.05_
L51
½csu
219(
tgd
)�cs
u21
9(tg
d)
9.05
500
OSO
G00
7418
92
a005
9O14
,a0
067I
12cs
u61
a(C
BM
9.06
)9.
0650
0R
csu
6140
36
a001
8G11
,a0
019H
12,
a001
8J02
,a0
041I
20,
a006
3F18
,a0
090O
20a0
018G
1110
4.4
FN
csu
61a
(CB
M9.
06)
9.06
500
OSO
G14
7540
34
a001
8G11
,a0
019H
12,
a001
8J02
,a0
041I
20cs
u59
a9.
0650
0O
SOG
0619
270
3a0
019C
22,
a007
4G20
,a0
084M
22a0
074G
2010
4.4
0.52
36
0.00
2(2
4)9L
.52
spb
-9.0
6_L
52(c
su59
a)cs
u59
a9.
0650
0R
csu
5918
93
a005
9O14
,a0
071H
18,
a006
7I12
a007
1H18
ibp
19.
0611
50R
pO
D3
gYN
104.
4cs
u14
5a(p
ck)
9.06
700
Rcs
u14
519
18
a004
3G12
,a0
041H
16,
a004
6O17
,a0
052M
07,
a006
7L02
,a0
068L
14,
a007
9N13
,a0
093D
20
a009
3D20
105.
40.
534
60.
003
(26)
9L.5
3sp
b-9
.06_
L53
½csu
145a
(pck
)�
csu
145a
(pck
)9.
0670
0O
SOG
0076
191
11a0
043G
12,
a004
1H16
,a0
046O
17,
a005
2M07
,a0
067L
02,
a006
8L14
,a0
079N
13,
a009
3D20
,a0
006K
22,
a001
1D09
,a0
087G
20cs
u14
5a(p
ck)
9.06
700
OSO
G00
7653
810
a003
5K11
,a0
055A
21,
a006
5B16
,a0
069H
02,
a007
1B24
,a0
081E
07,
a008
4G14
,a0
088L
04,
a008
9F23
,a0
095K
18
a005
5A21
0.52
76
0.00
3(1
3)9L
.53
spb
-9.0
6_L
53½c
su14
5a(p
ck)�
db
a49.
0690
0R
pA
S14
YN10
9.8
csu
28a(
rpS2
2)9.
0670
0R
csu
2819
15
a001
0A04
,a0
032K
15,
a007
6F19
,a0
087A
24,
a009
3D21
a009
3D21
109.
80.
537
60.
003
(50)
9L.5
4sp
b-9
.06_
L54
½csu
28a(
rpS2
2)�
asg4
49.
0650
0R
asg4
419
17
a004
7G04
,a0
081A
19,
a003
3A22
,a0
091J
11,
a006
4A12
,a0
038E
07,
a003
2I20
a003
3A22
110.
90.
624
60.
002
(28)
9L.6
2sp
b-9
.06_
L62
(asg
44)
(con
tin
ued
)
1516 F. I. E. Amarillo and H. W. Bass

TA
BL
E1
(Co
nti
nu
ed)
Lo
cus
Bin
RF
LP
size
(bp
)P
rob
ety
pea
Pro
be
nam
e
Sorg
hu
mF
PC
con
tigs
No
.o
fB
AC
sh
itSe
lect
edso
rgh
um
BA
Csb
FIS
Hp
rob
ese
lect
edcM
c
Mea
n6
SEM
(n)d
FIS
Hlo
cus
(cM
C)e
Cyt
olo
cus
nam
e
cdo
1387
(em
p70
)9.
06n
dO
SOG
0100
564
a000
7F13
,a0
012H
21,
a003
6J08
,a0
087E
20a0
036J
0811
3.5
0.71
76
0.00
2(5
0)9L
.72
spb
-9.0
6_L
72½c
do
1387
(em
p70
)�cd
o13
87(e
mp
70)
9.06
nd
OSO
G01
0019
14
a001
6I16
,a0
036F
07,
a003
6L01
,a0
093N
18a0
036F
070.
722
60.
002
(38)
9L.7
2sp
b-9
.06_
L72
½cd
o13
87(e
mp
70)�
csu
1004
9.06
1800
Rcs
u10
0410
485
a002
7H23
,a0
046F
16,
a004
6P22
,a0
054L
18,
a006
7H10
a004
6P22
119.
90.
766
60.
001
(18)
9L.7
7sp
b-9
.06_
L77
(csu
1004
)as
g12
(CB
M9.
07)
9.07
700
Ras
g12
386
3a0
007D
16,
a006
4E21
,a0
094P
12a0
064E
2112
1.2
0.77
96
0.00
3(3
5)9L
.78
spb
-CB
M9.
07_L
78(a
sg12
)R
asg1
219
43
a003
6L10
,a0
074H
17,
a007
6L16
std
2a(d
ba)
9.07
600
Rp
AS9
YN12
2.7
csu
1118
9.07
700
Rcs
u11
1819
71
a007
8D03
a007
8D03
124.
30.
828
60.
003
(25)
9L.8
3sp
b-9
.07_
L83
(csu
1118
)as
g59b
9.07
750
Ras
g59
890
5SN
132.
8cs
u28
5(h
is2B
)9.
0780
0R
csu
285
98
a004
9P09
,a0
078L
14,
a006
4J04
,a0
026P
15,
a002
0P12
,a0
066J
18,
a003
2B18
,a0
062J
05
a002
6P15
147.
40.
939
60.
003
(27)
9L.9
4sp
b-9
.07_
L94
½csu
285(
his
2B)�
csu
54b
(CB
M9.
08)g
9.08
1400
Rcs
u54
203
5a0
021O
07,
a006
1D07
,a0
074A
03,
a008
0B23
,a0
076H
02a0
074A
0315
0.4
9L.9
5sp
b-C
BM
9.08
_L95
(csu
54b
)cs
u80
4a(d
np
)9.
0850
0R
csu
804
203
3a0
021O
17,
a006
1D07
,a0
074A
03a0
061D
0715
0.4
FN
Xtx
a325
Gsb
b18
256/
191b
4(P
.E
.K
lein
,T
AM
U)
sbb
1825
60.
262
60.
009
(9)
9L.2
6sb
b_9
.04-
L26
(Xtx
a325
)X
txp
32G
sbb
1668
5/17
4g5
(P.
E.
Kle
in,
TA
MU
)sb
b16
685
0.53
06
0.00
6(8
)9L
.53
sbb
_9.0
6-L
53(X
txp
32)
CB
M,
core
bin
mar
ker;
TA
MU
,T
exas
A&
MU
niv
ersi
ty.
aP
rob
ety
pe:
R,
RF
LP
;O
,o
verg
op
rob
e;G
,gi
ft(s
ou
rce
isin
dic
ated
).bYN
,YR
Ln
egat
ive
(fai
lure
tod
etec
th
ybri
diz
atio
no
fR
FL
Pp
rob
eo
nB
AC
-gri
dfi
lter
arra
ys);
SN,S
ou
ther
nb
lot
neg
ativ
e(f
ailu
reto
det
ect
hyb
rid
izat
ion
of
RF
LP
pro
be
on
BA
Cva
lid
atio
nSo
uth
ern
blo
t).
cC
enti
mo
rgan
)va
lue
fro
mth
eU
MC
989
lin
kage
map
.d
Nu
mb
ers
rep
rese
nt
the
mea
no
fth
efr
acti
on
ald
ista
nce
of
the
abo
ve-b
ackg
rou
nd
pea
k(s
eem
at
er
ia
ls
an
dm
et
ho
ds)
FIS
Hsi
gnal
so
nth
ech
rom
oso
me
arm
.SE
M,s
tan
dar
der
ror
of
mea
sure
men
tat
95%
con
fid
ence
leve
l;(n
)is
the
nu
mb
ero
fF
ISH
sign
als
use
dto
calc
ula
teth
em
ean
.eF
N,
FIS
Hn
egat
ive,
fail
edto
det
ect
FIS
Hsi
gnal
ssu
itab
lefo
rm
app
ing
on
two
toth
ree
slid
es.
fL
ocu
sp
revi
ou
sly
map
ped
by
Ko
um
ba
ris
and
Ba
ss
(200
3).
gIB
P2
cDN
A(f
rom
pO
D3,
H.
W.
Ba
ss,
un
pu
bli
shed
dat
a).
Sorghum BAC–FISH Map of Maize 9 1517
the Southern blot verification step (n ¼ 7, SN in Table1). From a combination of all sources, we obtained atotal of 41 BACs that were deemed suitable for FISHmapping as detailed in Table 1.
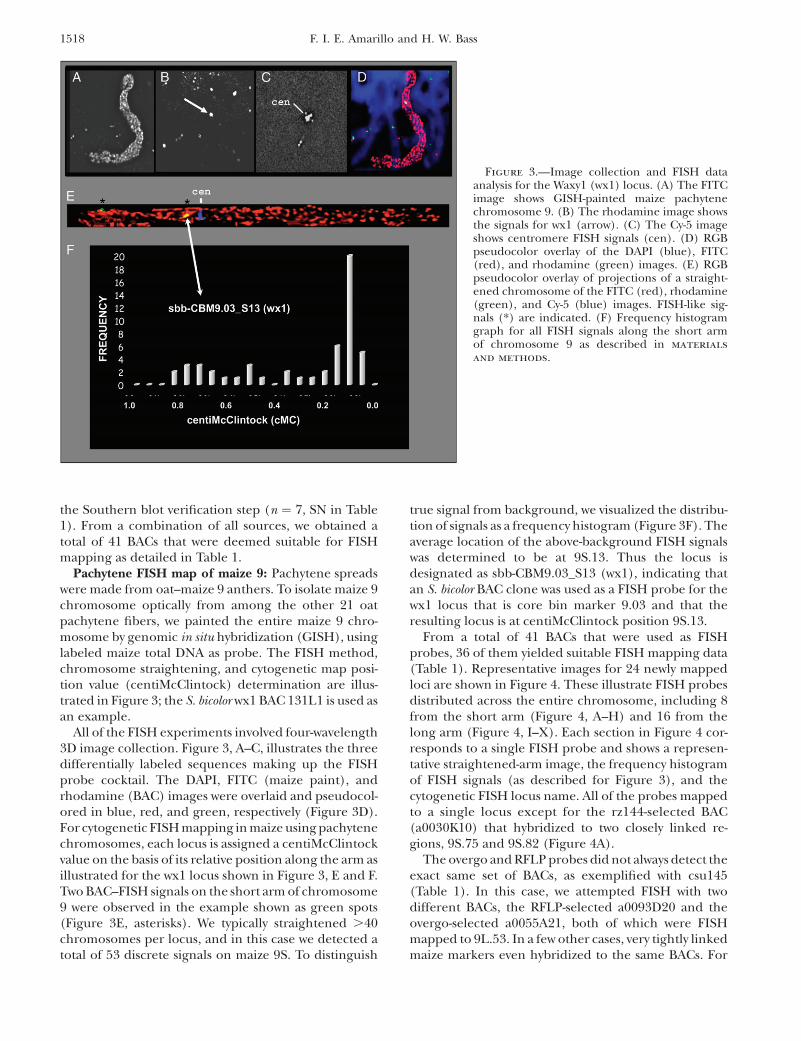
Pachytene FISH map of maize 9: Pachytene spreadswere made from oat–maize 9 anthers. To isolate maize 9chromosome optically from among the other 21 oatpachytene fibers, we painted the entire maize 9 chro-mosome by genomic in situ hybridization (GISH), usinglabeled maize total DNA as probe. The FISH method,chromosome straightening, and cytogenetic map posi-tion value (centiMcClintock) determination are illus-trated in Figure 3; the S. bicolor wx1 BAC 131L1 is used asan example.
All of the FISH experiments involved four-wavelength3D image collection. Figure 3, A–C, illustrates the threedifferentially labeled sequences making up the FISHprobe cocktail. The DAPI, FITC (maize paint), andrhodamine (BAC) images were overlaid and pseudocol-ored in blue, red, and green, respectively (Figure 3D).For cytogenetic FISH mapping in maize using pachytenechromosomes, each locus is assigned a centiMcClintockvalue on the basis of its relative position along the arm asillustrated for the wx1 locus shown in Figure 3, E and F.Two BAC–FISH signals on the short arm of chromosome9 were observed in the example shown as green spots(Figure 3E, asterisks). We typically straightened .40chromosomes per locus, and in this case we detected atotal of 53 discrete signals on maize 9S. To distinguish
true signal from background, we visualized the distribu-tion of signals as a frequency histogram (Figure 3F). Theaverage location of the above-background FISH signalswas determined to be at 9S.13. Thus the locus isdesignated as sbb-CBM9.03_S13 (wx1), indicating thatan S. bicolor BAC clone was used as a FISH probe for thewx1 locus that is core bin marker 9.03 and that theresulting locus is at centiMcClintock position 9S.13.
From a total of 41 BACs that were used as FISHprobes, 36 of them yielded suitable FISH mapping data(Table 1). Representative images for 24 newly mappedloci are shown in Figure 4. These illustrate FISH probesdistributed across the entire chromosome, including 8from the short arm (Figure 4, A–H) and 16 from thelong arm (Figure 4, I–X). Each section in Figure 4 cor-responds to a single FISH probe and shows a represen-tative straightened-arm image, the frequency histogramof FISH signals (as described for Figure 3), and thecytogenetic FISH locus name. All of the probes mappedto a single locus except for the rz144-selected BAC(a0030K10) that hybridized to two closely linked re-gions, 9S.75 and 9S.82 (Figure 4A).
The overgo and RFLP probes did not always detect theexact same set of BACs, as exemplified with csu145(Table 1). In this case, we attempted FISH with twodifferent BACs, the RFLP-selected a0093D20 and theovergo-selected a0055A21, both of which were FISHmapped to 9L.53. In a few other cases, very tightly linkedmaize markers even hybridized to the same BACs. For
Figure 3.—Image collection and FISH dataanalysis for the Waxy1 (wx1) locus. (A) The FITCimage shows GISH-painted maize pachytenechromosome 9. (B) The rhodamine image showsthe signals for wx1 (arrow). (C) The Cy-5 imageshows centromere FISH signals (cen). (D) RGBpseudocolor overlay of the DAPI (blue), FITC(red), and rhodamine (green) images. (E) RGBpseudocolor overlay of projections of a straight-ened chromosome of the FITC (red), rhodamine(green), and Cy-5 (blue) images. FISH-like sig-nals (*) are indicated. (F) Frequency histogramgraph for all FISH signals along the short armof chromosome 9 as described in materials
and methods.
1518 F. I. E. Amarillo and H. W. Bass
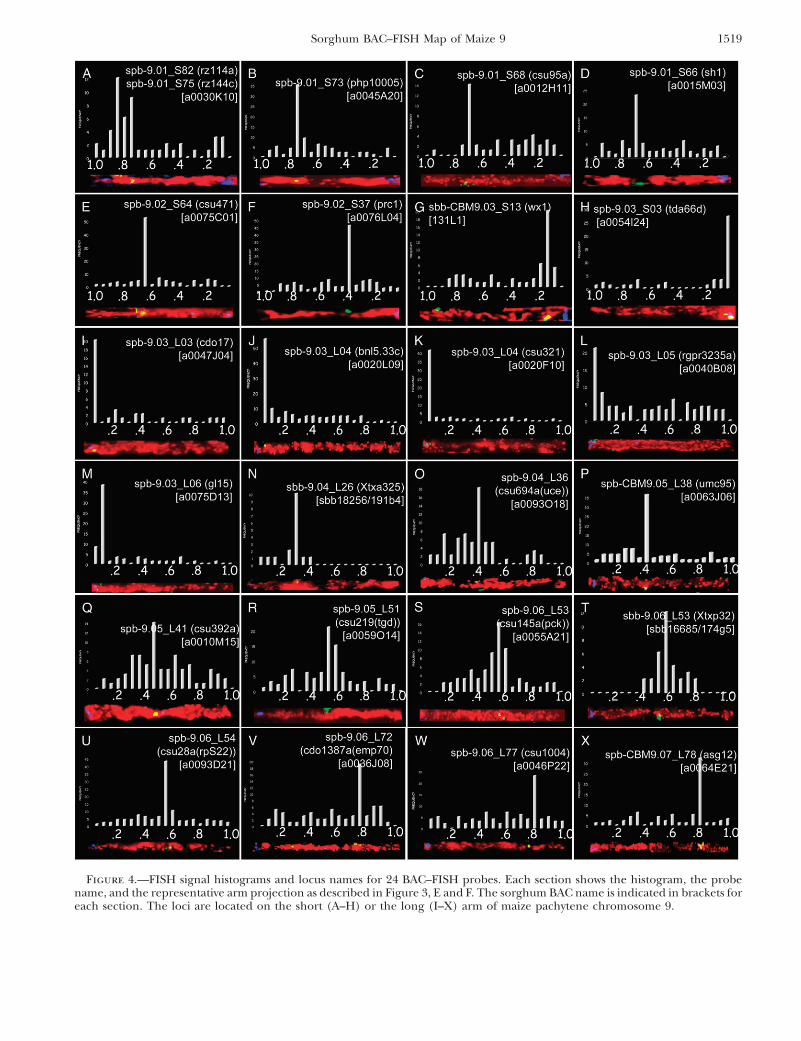
Figure 4.—FISH signal histograms and locus names for 24 BAC–FISH probes. Each section shows the histogram, the probename, and the representative arm projection as described in Figure 3, E and F. The sorghum BAC name is indicated in brackets foreach section. The loci are located on the short (A–H) or the long (I–X) arm of maize pachytene chromosome 9.
Sorghum BAC–FISH Map of Maize 9 1519

instance, the markers csu486a and prc1 independentlydetected eight common BACs in contig 389 (Table 1).However, one extra BAC (a0076L04) was detected onlyby prc1, which was then used as a FISH probe in additionto BAC a0086K22 that represented csu486a. Using theseBACs, we FISH mapped prc1 to 9S.37 while csu486amapped to 9S.39 (Table 1). Three other locus pairs(umc148 and rz144, csu219 and csu59a, and csu804a andcsu54b) showed this same sort of BAC codetection result.The distances separating these locus pairs range from 0to 5 cM, indicating that this spacing may be near the axialresolution limit for FISH mapping in some regions.
Cytological evidence for regions of genome hyper-expansion: Three distinct noncentromeric regions ofthe chromosome showed evidence of hyperexpansionrelative to the overall increase of 3.3-fold for maize vs.sorghum genome size. These regions are delimited bythree pairs of loci, one on 9S and two on 9L. To comparethem, we used the following map distance values formaize chromosome 9: 9S is 67 cM, 100 cMC, and 77 Mbplong and 9L is 84 cM, 100 cMC, and 114 Mbp long(Bennett and Laurie 1995; Davis et al. 1999; Ander-
son et al. 2004).The first of these three hyperexpanded regions is in bin
9.02 on 9S between csu471 and csu486a at 9S.64–9S.39. Inthis segment of the chromosome, the cM/cMC ratio is0.11, 84% lower than the whole-arm average. The secondsuch region is in bin 9.04 on 9L between csu147 andcsu694a(uce) at 9L.07–9L.36. In this segment of thechromosome, the cM/cMC ratio is 0.40, 52% lower thanthe whole-arm average. The third case is in bin 9.06 on 9Lbetween csu28a(rpS22) and cdo1387a(emp70) at 9L.54–9L.72, a segment with a length of 3.7 cM and 18 cMC. ThecM/cMC ratio in this region is 0.21, 76% lower than thewhole-arm average. In other words, these three regions
show sixfold, twofold, and fourfold higher amounts ofchromosomal distance than expected from the whole-armaverage ratios of 0.67 (short) and 0.84 (long) cM/cMC.
In this third region ½csu28a(rpS22) to cdo1387a(emp70)in maize bin 9.06�, the corresponding sorghum markersare found in a single well-defined sorghum contig (no.191). This allows for a comparison of the genome ex-pansion rates for this region relative to the overall ex-pansion rate of maize relative to sorghum. These markersin sorghum are separated by �200 Kbp, whereas theyare separated in the cytogenetic map by 18 cMC. Usingthe estimate of 1.14 Mbp/cMC for 9L, we calculate thatthis region has expanded at a rate 25-fold higher thanthat of the overall maize genome relative to the sorghumgenome. This is one of the three major regions that werefound to exhibit this unexpected pattern of markerdistribution, which we refer to here as regions of ge-nome hyperexpansion.
FISH mapping of CentC within centromeric loci:The positions of centromeres on linkage maps aregenerally not well defined because they typically lackalleles or polymorphisms suitable for standard linkagemapping. For example, the location of the maize 9centromere is an estimate that spans a large amount ofbin 9.03. To map the maize 9 centromere more preciselyrelative to closely linked loci, we mapped the centro-mere-linked markers wx1, tda66d, cdo17, bnl5.33c,csu321, rgpr3235a, gl15, and csu147 as shown in Figure5. Representative FISH images of straightened pachy-tene chromosomes (Figure 5C) are shown and thelocation of these loci on the cytogenetic map is in-dicated (Figure 5B). We mapped wx1 and tda66d in theshort arm, whereas the other markers were in the longarm (Figure 5B). From these data, we refined theestimated location of the centromere to a smaller region
Figure 5.—Refining the linkage map positionof cent9, the maize 9 centromere. Integratedlinkage (A) and cytogenetic (B) maps showingthe new estimated map position (A, hatchedbox) for the maize 9 centromere are shown.Map units for A are described in the Figure 1 leg-end. Map units for B are centiMcClintocks, and9S refers to the short arm and 9L refers to thelong arm. (C) Straightened projections of chro-mosomes showing the representative of each ofthe centromere-linked markers, pseudocoloredas described in Figure 3E.
1520 F. I. E. Amarillo and H. W. Bass

(Figure 5A, hatched box), between tda66d (9S.03) andcdo17 (9L.03) (Figure 5B). This approach allows forassignment of a given locus to either the long arm or theshort arm and provides an indirect method for delimit-ing the location of the centromere on linkage maps,assuming that the CentC repeat cluster faithfully reportsthe position of the functional centromere.
Integrating data from sorghum and maize maps: TheFISH–BAC probes used in this study are unique in theirapplicability to multiple maps in maize and sorghum.The new cytogenetic FISH map is summarized in Figure6 and the way in which it was created provides directlinks between the physical map of sorghum (Figure 6A)and the linkage map of maize (Figure 6B). The results
anchor sorghum BACs to maize pachytene chromo-somes by high-stringency DNA sequence hybridization.We found nearly complete colinearity between maizelinkage and cytogenetic maps, but the distributions andrelative spacing between markers did not always match.One observed partial violation of agreement came fromdata from the sorghum BAC for rz144. In this case,rz144a and rz144c are both located proximal to umc109on the UMC 98 9 linkage map, but the FISH signals werefound on opposite sides of umc109 on the cytogeneticmap. This order of loci from the telomeric end (rz144a-umc109-rz144c) is the same as that of a newer linkagemap of maize, the IBM map. From these overall find-ings, we can conclude that this method is robust and
Figure 6.—Integrated maps ofmaize chromosome 9. (A) Finger-print contig numbers for the Sor-ghum FPC map and theirassociated linkage groups. (B)The maize 9 linkage map is shownas described in Figure 1, exceptthat the cent9 location reflectsthe revised position as describedin Figure 5. The names of the sor-ghum BACs used as a FISH probeare listed after the markers (afterthe slashes). (C) The new cytoge-netic FISH 9 map showing the lo-cation (solid double circles) ofloci along the short (9S) andthe long (9L) arm. The S. bicolorBAC sbb18256 (Xtxa325) at9L.27 is not located on the link-age map and the S. bicolor BACsbb16685 (Xtxp32) was mappedto 9L.53, but is not shown. Thenew cytogenetic loci names aredisplayed at the right of the mapin C and are detailed in Table 1.
Sorghum BAC–FISH Map of Maize 9 1521

suitable for development of a detailed cytogenetic FISHmap of maize.
DISCUSSION
Cytogenetic mapping provides information on thestructure and evolution of genomes (Korenberg et al.1999; Cheung et al. 2001; Trask 2002; Gonzalez et al.2005). In addition, the BAC–FISH approach can becombined with bioinformatics to resolve inconsistenciesamong genome-mapping data or reveal ancestral rela-tionships between closely related species (Ma et al. 2006;reviewed by Rocchi et al. 2006). In maize, the use ofmolecular cytogenetics has great potential for sheddinglight on the well-documented structural diversity of itschromosomes and for contributing to ongoing genome-assembly efforts (Martienssen et al. 2004; Messing andDooner 2006). Furthermore, the development of cyto-genetic resources for maize will facilitate investigationsregarding the origin and evolution of the maize genomeand its relationship to that of its close relatives, such assorghum (Gaut and Doebley 1997; Gaut 2001; Kato
et al. 2004, 2005; Swigonova et al. 2004; Bowers et al.2005; Haberer et al. 2005; Bruggmann et al. 2006; Lamb
and Birchler 2006; Sheridan and Auger 2006).The development of linkage and FPC-type physical
maps of maize has led to a good understanding of thedistribution of genes along the chromosomes (Davis
et al. 1999; Lee et al. 2002; Sharopova et al. 2002) andthe physical distances between genes that reside withinsingle FPC contigs (Nelson et al. 2005; Pampanwar et al.2005; Yim et al. 2007). Even so, the linkage maps arebased on recombination frequencies that vary widely inrelation to physical distances (Anderson et al. 2003,2004; Wang et al. 2006), and the FPC physical maps maynot accurately predict the physical distance between theends of adjacent contigs. Even as the maize genomesequence approaches completion, cytogenetic tools willremain useful for evaluating the variation betweendifferent species, subspecies, and cultivars within thegenus Zea (White and Doebley 1998; Liu et al. 2003;Kato et al. 2004; Buckler et al. 2006; Lamb andBirchler 2006; Lamb et al. 2007).
The pachytene FISH map of maize 9: Here we havedescribed the physical organization of maize chromo-some 9 by creating a new cytogenetic BAC–FISH mapthat integrates maize maps, provides links to sorghummaps, and uncovers several hotspots of maize genomeexpansion that were not anticipated from prior maps orcomparative sequence analysis (Davis et al. 1999). Thestrategy of cross-species mapping using conserved genesequences has proven successful in examining genomestructures and relationships and predicting locations ofgenes and DNA markers in related species (Hulbert
et al. 1990; Fuchs et al. 1996; Gomez et al. 1997; Gale andDevos 1998; Zwick et al. 1998; Jackson et al. 2000;
Draye et al. 2001; Koumbaris and Bass 2003; Devos
2005). In this study, .40 sorghum BACs were used asFISH probes to create 32 new cytogenetic loci, most ofwhich correspond to RFLP loci that are well mappedand widely used in maize linkage analysis. The successrate of this approach establishes it as a valuable andinformative method for developing a detailed, inte-grated cytogenetic FISH map of maize. Starting with themaize 9 linkage map, 52 markers were selected and 9 ofthem failed at the BAC filter screening, 7 of them failedat the Southern blot stage, and 6 of them failed at theFISH stage (Table 1).
The markers were nearly completely colinear betweenthe genetic and cytogenetic maps, but irregularly distrib-uted along the entire length of the chromosome. Thesort of differences between linkage and physical distan-ces along individual chromosomes that we found is welldocumented for maize, sorghum, and other plant species(Gill et al. 1996; Peterson et al. 1999; Kunzel et al. 2000;Sadder and Weber 2002; Kim et al. 2005a; Wang et al.2006). For example, the centromere and other hetero-chromatic regions often exhibit significantly fewer link-age-map units per unit physical distance because theytypically have relatively low rates of meiotic recombina-tion (Sherman and Stack 1995; Peterson et al. 1999;Harper and Cande 2000; Anderson et al. 2003, 2004).
Local variation in marker spacing: To compare thedifferent maps of the maize and sorghum genomes, wecalculated the overall ratio of DNA length in physicalunits (base pairs or centiMcClintocks) to the geneticlength in map units (centimorgans). This overall ratio iscalculated separately for each arm because each armencompasses 100 cMC (Lawrence et al. 2006). TheDNA content for the arms of maize chromosomes inline Seneca 60, the pollen parent for oat–maize 9, wasdetermined by Bennett and Laurie (1995) to be 77Mbp for 9S and 114 Mbp for 9L. The numbers oflinkage-map units from the UMC 98-based ‘‘Genetic2005 9’’ linkage map are 67 cM for 9S and 84 cM for 9L(http://www.maizegdb.org/cgi-bin/displaymaprecord.cgi?id¼940888). From this information, we derive thevalues per centiMcClintock to be 0.77 Mbp/cMC for9S, 1.14 Mbp/cMC for 9L, 0.67 cM/cMC for 9S, and0.84 cM/cMC for 9L.
Large deviations in the cM/cMC ratios were observedwhen two intervals on 9S were compared: the csu95a–sh1region (9S.68–9S.66) in bin 9.01 and the csu228(pfk)–wx1 region (9S.27–9S.13) in bin 9.03. The distance be-tween csu95a and sh1 is 8.7 cM but corresponding toonly 2.0 cMC, whereas the distance between csu228(pfk)and wx1 is 4.0 cM, corresponding to 14.0 cMC. The cM/cMC ratios for these two regions are 4.35 and 0.286,respectively, representing a 6.5-fold increase and a 57%decrease relative to the cM/cMC ratio averaged over thewhole arm of 9S.
In addition to these variations in the frequency of re-combination per cytological distance, additional analysis
1522 F. I. E. Amarillo and H. W. Bass

of marker distribution uncovered striking evidence ofregions where the maize genome appears to exhibit ac-celerated expansion. One of these regions is the segmenton 9L between csu28a(rpS22) and cdo1387a(emp70)in bin 9.06. These markers are only 3.7 cM apart, butseparated by 18 cMC on the basis of our FISH map. Thisregion exhibits a 25-fold higher genome expansion ratethan that of the whole-genome average for maize rel-ative to sorghum. In another region, between csu471and csu486a on 9S in bin 9.02, we examined the physi-cal map covered by maize FPC contigs 371, 372, and373 (http://www.maizesequence.org). The distal marker(csu471) is anchored in maize contig 371, but theproximal marker (csu486a) is not anchored and maybe in contig 372 or 373. Although this segment is only2.7 cM in length, it spans 25 cMC on the basis of ourFISH map. This physical distance is predicted torepresent�19.25 Mbp, suggesting that the gap betweenmaize contigs 371 and 372, or between 372 and 373, maybe unusually large compared to other contig gaps.Findings such as these may be important for guidingpositional cloning or other strategies that rely on chro-mosome walking in this area. They may also revealhotspots for insertions or duplications of mobile orother repetitive sequence elements. It will be of interestto examine the gene content and arrangement of genesin these regions.
In considering possible mechanisms for this hyper-expansion, this region does not appear to correspond toany known heterochromatic knobs or other large blocksof gene-depleted chromatin that could account for thisvariation. Determining whether these regions are com-mon to other lines of maize or unique to the pollenparent line, Seneca 60, will be of interest. Recent analy-sis of the maize genome has also revealed uneven chro-mosome contraction and expansion, but on a slightlysmaller scale (Bruggmann et al. 2006). Bruggmann
et al. (2006) attributed the localized chromosome ex-pansion to the insertion of retrotransposable elements.An alternative explanation is that these expanded areasare peculiar to the oat–maize addition lines and resultfrom chromosome rearrangements or amplificationsthat could have occurred after the oat–maize cross. Thisidea, however, is not consistent with observations fromoat–maize 6 lines in which the maize 6 centromereregion was found to be structurally stable in threeindependent addition lines ( Jin et al. 2004). Compara-tive analysis of these regions in related species mayprovide insight into their origin and significance.
Concordance of cytogenetic mapping data frommaize: The linear order of markers in the cytogeneticFISH map was fully concordant with that of the linkagemap except for rz144 and a very minor switch betweentwo very tightly linked loci (bnl.5.33c and csu321). In theUMC 98/Genetic 2005 map of chromosome 9, the locusorder is umc109, rz144a, rz144c, whereas their order inthe IBM2 2004 neighbors 9 map is rz144a, umc109,
rz144c. The sorghum BAC–FISH probe a0030K10 hy-bridized to two loci, one at 9S.82 and one at 9S.75. Thesetwo loci flank the position determined for the FISHsignal for umc109. The only locus-order inconsistencybetween the cytogenetic FISH map and the UMC 98linkage map also occurred between the two linkagemaps; the FISH data matched the IBM2 map data.
Map discrepancies in maize are not uncommon be-cause of the inherent differences in genomic struc-ture between different lines of maize (Fu and Dooner
2002; Lee et al. 2002; Bruggmann et al. 2006). Discrep-ancies can also result from errors due to small samplesizes or from differences in mapping techniques. Forexample, the Waxy1 locus is particularly variable amongdifferent maps, having been mapped to 9S and 9L inlinkage studies and to different regions on 9S incytogenetic studies. The Waxy1 locus has been localizedto �9S.02–9S.06 by Shen et al. (1987), 9S.06 byAnderson et al. (2004), 9S.46 by Wang et al. (2006),and 9S.13 by us. All these studies were based onpachytene chromosomes, but Anderson et al. (2004)extrapolated the position from inbred KYS recombina-tion nodule distribution, Wang et al. (2006) used directFISH on KYS chromosomes that were uniformly elon-gated by extra pepsin treatment, and the position in ourstudy was from a sorghum BAC–FISH probe hybridizedto Seneca 60 chromosomes carried in an oat-genomebackground. The data, thus, may not be directly com-parable. The sorghum BAC probe for wx1 has beensequenced and found to be syntenic with the maize andrice waxy1 region ( J. Ma and J. L. Bennetzen, personalcommunication). To date, the cytological maps are ingood agreement with each other and the linkage mapsin terms of the linear order of the loci. The mappositions we detected were self-consistent, and therelative positions did not vary with absolute length ofthe pachytene-stage chromosomes themselves. Devel-opment of cytogenetic FISH maps for maize (Sadder
and Weber 2001; Cheng et al. 2002; Koumbaris andBass 2003; Anderson et al. 2004; Sheridan and Auger
2006; Wang et al. 2006) may eventually comprisemultiple maps generated by various techniques fordifferent genotypes.
Centromere mapping: FISH mapping of BAC clonesaround the centromere provided increased resolutionfor extrapolating the position of the maize 9 centro-mere within the linkage maps. We were able to mapeight markers on this region using carefully chosensorghum BAC clones. By coincident staining of theCentC repeats and the BAC–FISH probes on individualfibers, we could make chromosome-arm assignmentaround the centromere. The centromere, as marked bythe CentC cluster, is located between tda66d at 9S.03and cdo17 at 9L.03. This position is close to but not thesame as that determined by Luce et al. (2006), using aCenH3-based method of centromere mapping. Placingcentromeres on the genetic map is an indirect form of
Sorghum BAC–FISH Map of Maize 9 1523

linkage mapping and it is further complicated by thedynamic nature of centromeres and their epigeneticspecification (Nagaki et al. 2004; Lee et al. 2005; Luce
et al. 2006).Mapping loci for markers ,1 kbp in length: One of
the major challenges for cytogenetic mapping is sensi-tivity, with the goal of specifically detecting small segmentsof DNA. RFLP probes have been used in thousands oflinkage studies in maize since they were first developed.20 years ago. Localizing these markers cytogeneticallywould therefore be a valuable extension of maize ge-netics resources. For example, the RFLP probe asg44 is500 bp, and probe csu145 is 700 bp. In the study re-ported here, the advance of Koumbaris and Bass (2003)was employed to map .30 loci with an average size near1 kbp. To date, no robust technology is available forFISH mapping of DNA sequences of this size, but use ofRFLP-selected sorghum BACs as FISH probes allowed usto bypass this limitation while adding a new dimension,direct links to the sorghum genome, to the resultingcytological data.
In summary, we have produced a high-resolutionFISH map of maize pachytene chromosome 9 withBAC probes from sorghum genomic DNA. We foundthat the loci were mostly colinear between the linkageand the cytological maps of maize and that regions ofgenome hyperexpansion could be detected by com-parative analysis of various maps containing sharedmarkers. These findings serve to integrate genetic dataacross different maize maps. They also serve to generatenew links between the maps of the maize and sorghumgenomes. Our results have important implications forunderstanding and exploring the structure and theevolution of the maize genome while developing newreagents for chromosome research in the grasses.
We thank Debbie Figueroa and Shaun Murphy for critical readingand helpful comments on the manuscript. We thank R. J. (Bobbye)Hill for her support and assistance with this project. We thank P. E.Klein (Texas A&M University) and J. L. Bennetzen (University ofGeorgia) for providing some of the S. bicolor BACs used in this study.This work was supported by the National Science Foundation (DBI-0321639).
LITERATURE CITED
Adawy, S. S., R. M. Stupar and J. Jiang, 2004 Fluorescence in situhybridization analysis reveals multiple loci of knob-associatedDNA elements in one-knob and knobless maize lines. J. Histo-chem. Cytochem. 52: 1113–1116.
Ananiev, E. V., R. L. Phillips and H. W. Rines, 1998 Chromosome-specific molecular organization of maize (Zea mays L.) centro-meric regions. Proc. Natl. Acad. Sci. USA 95: 13073–13078.
Anderson, L. K., G. G. Doyle, B. Brigham, J. Carter, K. D. Hooker
et al., 2003 High-resolution crossover maps for each bivalent ofZea mays using recombination nodules. Genetics 165: 849–865.
Anderson, L. K., N. Salameh, H. W. Bass, L. C. Harper, W. Z. Cande
et al., 2004 Integrating genetic linkage maps with pachytenechromosome structure in maize. Genetics 166: 1923–1933.
Bennett, M. D., and D. A. Laurie, 1995 Chromosome size in maizeand sorghum using em serial section reconstructed nuclei. Mayd-ica 40: 199–204.
Bennetzen, J. L., V. L. Chandler and P. Schnable, 2001 NationalScience Foundation-sponsored workshop report. Maize genomesequencing project. Plant Physiol. 127: 1572–1578.
Bowers, J. E., C. Abbey, S. Anderson, C. Chang, X. Draye et al.,2003 A high-density genetic recombination map of sequence-tagged sites for sorghum, as a framework for comparative struc-tural and evolutionary genomics of tropical grains and grasses.Genetics 165: 367–386.
Bowers, J. E., M. A. Arias, R. Asher, J. A. Avise, R. T. Ball et al.,2005 Comparative physical mapping links conservation of mi-crosynteny to chromosome structure and recombination ingrasses. Proc. Natl. Acad. Sci. USA 102: 13206–13211.
Bruggmann, R., A. K. Bharti, H. Gundlach, J. Lai, S. Young et al.,2006 Uneven chromosome contraction and expansion in themaize genome. Genome Res. 16: 1241–1251.
Buckler, E. S., B. S. Gaut and M. D. Mcmullen, 2006 Molecular andfunctional diversity of maize. Curr. Opin. Plant Biol. 9: 172–176.
Burr, B., F. A. Burr, K. H. Thompson, M. C. Albertson and C. W.Stuber, 1988 Gene mapping with recombinant inbreds inmaize. Genetics 118: 519–526.
Carlson, W. R., 1988 The cytogenetics of corn, pp. 259–344 in Cornand Corn Improvement, edited by G. F. Sprague and J. W. Dudley.American Society of Agronomy, Madison, WI.
Causse, M., S. Santoni, C. Damerval, A. Maurice, A. Charcosset
et al., 1996 A composite map of expressed sequences in maize.Genome 39: 418–432.
Chandler, V. L., and V. Brendel, 2002 The Maize Genome Se-quencing Project. Plant Physiol. 130: 1594–1597.
Chen, C. C., C. M. Chen, F. C. Hsu, C. J. Wang, J. T. Yang et al.,2000 The pachytene chromosomes of maize as revealed by fluo-rescence in situ hybridization with repetitive DNA sequences.Theor. Appl. Genet. 101: 30–36.
Cheng, Z., C. R. Buell, R. A. Wing, M. Gu and J. Jiang,2001a Toward a cytological characterization of the rice ge-nome. Genome Res. 11: 2133–2141.
Cheng, Z., G. G. Presting, C. R. Buell, R. A. Wing and J. Jiang,2001b High-resolution pachytene chromosome mapping ofbacterial artificial chromosomes anchored by genetic markersreveals the centromere location and the distribution of geneticrecombination along chromosome 10 of rice. Genetics 157:1749–1757.
Cheng, Z., C. R. Buell, R. A. Wing and J. Jiang, 2002 Resolution offluorescence in-situ hybridization mapping on rice mitotic prom-etaphase chromosomes, meiotic pachytene chromosomes andextended DNA fibers. Chromosome Res. 10: 379–387.
Cheung, V. G., N. Nowak, W. Jang, I. R. Kirsch, S. Zhao et al.,2001 Integration of cytogenetic landmarks into the draft se-quence of the human genome. Nature 409: 953–958.
Coe, E. H., 1994 A-a translocations: breakpoints and stocks., pp. 364–376 in The Maize Handbook, edited by M. Freeling andV. Walbot. Springer-Verlag, New York.
Coe, E., D. Hoisington and M. Neuffer, 1987 Linkage map of corn(maize) (Zea mays L.). Maize Genet. Coop. Newslett. 61: 116–147.
Creighton, H. B., and B. McClintock, 1931 A correlation of cyto-logical and genetical crossing over in Zea mays. Proc. Natl. Acad.Sci. USA 17: 492–497.
Davis, G. L., M. D. Mcmullen, C. Baysdorfer, T. Musket, D. Grant
et al., 1999 A maize map standard with sequenced core markers,grass genome reference points and 932 expressed sequencetagged sites (ESTs) in a 1736-locus map. Genetics 152: 1137–1172.
De Jong, J. H., P. Fransz and P. Zabel, 1999 High resolution FISH inplants - techniques and applications. Trends Plant Sci. 4: 258–263.
Dempsey, E., 1994 Traditional analysis of maize pachytene chromo-somes., pp. 432–441 in The Maize Handbook, edited by M. Freeling
and V. Walbot. Springer-Verlag, New York.Desel, C., C. Jung, D. Cai, M. Kleine and T. Schmidt, 2001 High-
resolution mapping of YACs and the single-copy gene Hs1(pro-1)on Beta vulgaris chromosomes by multi-colour fluorescence insitu hybridization. Plant Mol. Biol. 45: 113–122.
Devos, K. M., 2005 Updating the ‘crop circle’. Curr. Opin. Plant Biol.8: 155–162.
Dong, F., J. Song, S. Naess, J. Helgeson, C. Gebhardt et al.,2000 Development and applications of a set of chromosome-specific cytogenetic DNA markers in potato. Theor. Appl. Genet.101: 1001–1007.
1524 F. I. E. Amarillo and H. W. Bass

Draye, X., Y. R. Lin, X. Y. Qian, J. E. Bowers, G. B. Burow et al.,2001 Toward integration of comparative genetic, physical, diver-sity, and cytomolecular maps for grasses and grains, using the sor-ghum genome as a foundation. Plant Physiol. 125: 1325–1341.
Emerson, R., G. Beadle and A. Fraser, 1935 A summary of linkagestudies in maize. Cornell Univ. Agric. Exp. Stn. Memoir 180: 1–83.
Fransz, P. F., C. Alonso-Blanco, T. B. Liharska, A. J. Peeters, P. Zabel
et al., 1996 High-resolution physical mapping in Arabidopsisthaliana and tomato by fluorescence in situ hybridization to ex-tended DNA fibres. Plant J. 9: 421–430.
Fu, H., and H. K. Dooner, 2002 Intraspecific violation of geneticcolinearity and its implications in maize. Proc. Natl. Acad. Sci.USA 99: 9573–9578.
Fu, Y., T. J. Wen, Y. I. Ronin, H. D. Chen, L. Guo et al., 2006 Geneticdissection of intermated recombinant inbred lines using a newgenetic map of maize. Genetics 174: 1671–1683.
Fuchs, J., A. Houben, A. Brandes and I. Schubert, 1996 Chromo-some ‘painting’ in plants—A feasible technique? Chromosoma104: 315–320.
Gale, M. D., and K. M. Devos, 1998 Comparative genetics in thegrasses. Proc. Natl. Acad. Sci. USA 95: 1971–1974.
Gardiner, J., S. Schroeder, M. L. Polacco, H. Sanchez-Villeda,Z. Fang et al., 2004 Anchoring 9,371 maize expressed sequencetagged unigenes to the bacterial artificial chromosome contigmap by two-dimensional overgo hybridization. Plant Physiol.134: 1317–1326.
Gaut, B. S., 2001 Patterns of chromosomal duplication in maizeand their implications for comparative maps of the grasses. Ge-nome Res. 11: 55–66.
Gaut, B. S., and J. F. Doebley, 1997 DNA sequence evidence for thesegmental allotetraploid origin of maize. Proc. Natl. Acad. Sci.USA 94: 6809–6814.
Gaut, B. S., M. LeThierry D’Ennequin, A. S. Peek and M. C. Sawkins,2000 Maize as a model for the evolution of plant nuclear ge-nomes. Proc. Natl. Acad. Sci. USA 97: 7008–7015.
Gill, K. S., B. S. Gill, T. R. Endo and E. V. Boyko, 1996 Identi-fication and high-density mapping of gene-rich regions in chro-mosome group 5 of wheat. Genetics 143: 1001–1012.
Gomez, M., M. Nurul Islam-Faridi, S.-S. Woo, K. F. Schertz,D. Czeschin et al., 1997 FISH of a maize sh2-selected sorghumBAC to chromosomes of Sorghum bicolor. Genome 40: 475–478.
Gonzalez, J., M. Nefedov, I. Bosdet, F. Casals, O. Calvete et al.,2005 A BAC-based physical map of the Drosophila buzzatii ge-nome. Genome Res. 15: 885–892.
Haberer, G., S. Young, A. K. Bharti, H. Gundlach, C. Raymond
et al., 2005 Structure and architecture of the maize genome.Plant Physiol. 139: 1612–1624.
Hanson, R. E., M. S. Zwick, S. Choi, M. N. Islam-Faridi, T. D.Mcknight et al., 1995 Fluorescent in situ hybridization of a bac-terial artificial chromosome. Genome 38: 646–651.
Harper, L. C., and W. Z. Cande, 2000 Mapping a new frontier;development of integrated cytogenetic maps in plants. Funct.Integr. Genomics 1: 89–98.
Harushima, Y., M. Yano, A. Shomura, M. Sato, T. Shimano et al.,1998 A high-density rice genetic linkage map with 2275markers using a single F2 population. Genetics 148: 479–494.
Hass-Jacobus, B. L., M. Futrell-Griggs, B. Abernathy, R. Wester-
man, J. L. Goicoechea et al., 2006 Integration of hybridization-based markers (overgos) into physical maps for comparative andevolutionary explorations in the genus Oryza and in Sorghum.BMC Genomics 7: 199.
Helentjaris, T., D. F. Weber and S. Wright, 1986 Use of monoso-mics to map cloned DNA fragments in maize. Proc. Natl. Acad.Sci. USA 83: 6035–6039.
Howell, E. C., G. C. Barker, G. H. Jones, M. J. Kearsey, G. J. King
et al., 2002 Integration of the cytogenetic and genetic linkagemaps of Brassica oleracea. Genetics 161: 1225–1234.
Hulbert, S. H., T. E. Richter, J. D. Axtell and J. L. Bennetzen,1990 Genetic mapping and characterization of sorghum andrelated crops by means of maize DNA probes. Proc. Natl. Acad.Sci. USA 87: 4251–4255.
Islam-Faridi, M. N., K. L. Childs, P. E. Klein, G. Hodnett, M. A.Menz et al., 2002 A molecular cytogenetic map of sorghumchromosome 1: fluorescence in situ hybridization analysis withmapped bacterial artificial chromosomes. Genetics 161: 345–353.
Jackson, S. A., Z. Cheng, M. L. Wang, H. M. Goodman and J. Jiang,2000 Comparative fluorescence in situ hybridization mappingof a 431-kb Arabidopsis thaliana bacterial artificial chromosomecontig reveals the role of chromosomal duplications in the ex-pansion of the Brassica rapa genome. Genetics 156: 833–838.
Jiang, J., B. S. Gill, G. L. Wang, P. C. Ronald and D. C. Ward,1995 Metaphase and interphase fluorescence in situ hybridiza-tion mapping of the rice genome with bacterial artificial chromo-somes. Proc. Natl. Acad. Sci. USA 92: 4487–4491.
Jin, W., J. R. Melo, K. Nagaki, P. B. Talbert, S. Henikoff et al.,2004 Maize centromeres: organization and functional adapta-tion in the genetic background of oat. Plant Cell 16: 571–581.
Kato, A., J. C. Lamb and J. A. Birchler, 2004 Chromosome paint-ing using repetitive DNA sequences as probes for somatic chro-mosome identification in maize. Proc. Natl. Acad. Sci. USA 101:13554–13559.
Kato, A., J. M. Vega, F. Han, J. C. Lamb and J. A. Birchler,2005 Advances in plant chromosome identification and cytoge-netic techniques. Curr. Opin. Plant Biol. 8: 148–154.
Kim, J. S., M. N. Islam-Faridi, P. E. Klein, D. M. Stelly, H. J. Price
et al., 2005a Comprehensive molecular cytogenetic analysis ofsorghum genome architecture: distribution of euchromatin, het-erochromatin, genes and recombination in comparison to rice.Genetics 171: 1963–1976.
Kim, J. S., P. E. Klein, R. R. Klein, H. J. Price, J. E. Mullet et al.,2005b Molecular cytogenetic maps of sorghum linkage groups2 and 8. Genetics 169: 955–965.
Korenberg, J. R., X. N. Chen, Z. Sun, Z. Y. Shi, S. Ma et al.,1999 Human genome anatomy: BACs integrating the geneticand cytogenetic maps for bridging genome and biomedicine.Genome Res. 9: 994–1001.
Koumbaris, G. L., and H. W. Bass, 2003 A new single-locus cytoge-netic mapping system for maize (Zea mays L.): overcoming FISHdetection limits with marker-selected sorghum (S. propinquumL.) BAC clones. Plant J. 35: 647–659.
Kulikova, O., G. Gualtieri, R. Geurts, D. J. Kim, D. Cook et al.,2001 Integration of the FISH pachytene and genetic maps ofMedicago truncatula. Plant J. 27: 49–58.
Kumar, A., and J. L. Bennetzen, 1999 Plant retrotransposons. Annu.Rev. Genet. 33: 479–532.
Kunzel, G., L. Korzun and A. Meister, 2000 Cytologically inte-grated physical restriction fragment length polymorphism mapsfor the barley genome based on translocation breakpoints. Genetics154: 397–412.
Kynast, R. G., O. Riera-Lizarazu, M. I. Vales, R. J. Okagaki, S. B.Maquieira et al., 2001 A complete set of maize individual chromo-some additions to the oat genome. Plant Physiol. 125: 1216–1227.
Lamb, J. C., and J. A. Birchler, 2006 Retroelement genome paint-ing: cytological visualization of retroelement expansions in thegenera Zea and Tripsacum. Genetics 173: 1007–1021.
Lamb, J. C., T. Danilova, M. J. Bauer, J. M. Meyer, J. J. Holland
et al., 2007 Single-gene detection and karyotyping usingsmall-target fluorescence in situ hybridization on maize somaticchromosomes. Genetics 175: 1047–1058.
Lawrence, C. J., T. E. Seigfried, H. W. Bass and L. K. Anderson,2006 Predicting chromosomal locations of genetically mappedloci in maize using the Morgan2McClintock Translator. Genetics172: 2007–2009.
Lee, H. R., W. Zhang, T. Langdon, W. Jin, H. Yan et al.,2005 Chromatin immunoprecipitation cloning reveals rapidevolutionary patterns of centromeric DNA in Oryza species. Proc.Natl. Acad. Sci. USA 102: 11793–11798.
Lee, M., N. Sharopova, W. D. Beavis, D. Grant, M. Katt et al.,2002 Expanding the genetic map of maize with the intermatedB73 x Mo17 (IBM) population. Plant Mol. Biol. 48: 453–461.
Lin, Y.-R., L. Zhu, S. Ren, J. Yang, K. F. Schertz et al., 1999 A Sorghumpropinquum BAC library, suitable for cloning genes associatedwith loss-of-function mutations during crop domestication. Mol.Breed. 5: 511–520.
Liu, K., M. Goodman, S. Muse, J. S. Smith, E. Buckler et al.,2003 Genetic structure and diversity among maize inbred linesas inferred from DNA microsatellites. Genetics 165: 2117–2128.
Liu, R., C. Vitte, J. Ma, A. A. Mahama, T. Dhliwayo et al., 2007 AGeneTrek analysis of the maize genome. Proc. Natl. Acad. Sci.USA 104: 11844–11849.
Sorghum BAC–FISH Map of Maize 9 1525

Luce, A. C., A. Sharma, O. S. Mollere, T. K. Wolfgruber, K. Nagaki
et al., 2006 Precise centromere mapping using a combination ofrepeat junction markers and chromatin immunoprecipitation-polymerase chain reaction. Genetics 174: 1057–1061.
Lysak,M.A.,P.F.Fransz,H.B.AliandI.Schubert,2001 Chromosomepainting in Arabidopsis thaliana. Plant J. 28: 689–697.
Ma, J., L. Zhang, B. B. Suh, B. J. Raney, R. C. Burhans et al.,2006 Reconstructing contiguous regions of an ancestral ge-nome. Genome Res. 16: 1557–1565.
Martienssen, R. A., P. D. Rabinowicz, A. O’Shaughnessy and W. R.Mccombie, 2004 Sequencing the maize genome. Curr. Opin.Plant Biol. 7: 102–107.
McClintock, B., 1941 The stability of broken ends of chromo-somes in Zea mays. Genetics 26: 234–282.
McClintock, B., 1978 Mechanisms that rapidly reorganize the ge-nome. Stadler Genet. Symp. 10: 25–48.
Messing, J., and H. K. Dooner, 2006 Organization and variability ofthe maize genome. Curr. Opin. Plant Biol. 9: 157–163.
Messing, J., A. K. Bharti, W. M. Karlowski, H. Gundlach, H. R.Kim et al., 2004 Sequence composition and genome organiza-tion of maize. Proc. Natl. Acad. Sci. USA 101: 14349–14354.
Meyers, B. C., S. V. Tingey and M. Morgante, 2001 Abundance,distribution, and transcriptional activity of repetitive elementsin the maize genome. Genome Res. 11: 1660–1676.
Nagaki, K., Z. Cheng, S. Ouyang, P. B. Talbert, M. Kim et al.,2004 Sequencing of a rice centromere uncovers active genes.Nat. Genet. 36: 138–145.
Nelson, W. M., A. K. Bharti, E. Butler, F. Wei, G. Fuks et al.,2005 Whole-genome validation of high-information-contentfingerprinting. Plant Physiol. 139: 27–38.
Ohmido, N., Y. Akiyama and K. Fukui, 1998 Physical mapping ofunique nucleotide sequences on identified rice chromosomes.Plant Mol. Biol. 38: 1043–1052.
Pampanwar, V., F. Engler, J. Hatfield, S. Blundy, G. Gupta et al.,2005 FPC Web tools for rice, maize, and distribution. PlantPhysiol. 138: 116–126.
Paterson, A. H., M. Freeling and T. Sasaki, 2005 Grains of knowl-edge: genomics of model cereals. Genome Res. 15: 1643–1650.
Pedersen, C., and I. Linde-Laursen, 1994 Chromosomal locationsof four minor rDNA loci and a marker microsatellite sequence inbarley. Chromosome Res. 2: 65–71.
Peterson, D. G., N. L. Lapitan and S. M. Stack, 1999 Localizationof single- and low-copy sequences on tomato synaptonemal com-plex spreads using fluorescence in situ hybridization (FISH). Ge-netics 152: 427–439.
Rhoades, M. M., 1950 Meiosis in maize. J. Hered. 61: 59–67.Rhoades, M. M., and B. McClintock, 1935 The cytogenetics of
maize. Bot. Rev. 1: 292–325.Rocchi, M., N. Archidiacono and R. Stanyon, 2006 Ancestral ge-
nomes reconstruction: an integrated, multi-disciplinary ap-proach is needed. Genome Res. 16: 1441–1444.
Sadder, M., and G. Weber, 2001 Karyotype of maize (Zea mays L)mitotic metaphase chromosomes as revealed by flourescencein situ hybridization (FISH) with cytogenetic DNA markers. PlantMol. Biol. 19: 117–123.
Sadder, M. T., and G. Weber, 2002 Comparison between geneticand physical maps in Zea mays L. of molecular markers linkedto resistance against Diatraea spp. Theor. Appl. Genet. 104:908–915.
Sadder, M. T., N. Ponelies, U. Born and G. Weber, 2000 Physicallocalization of single-copy sequences on pachytene chromo-somes in maize (Zea mays L.) by chromosome in situ suppressionhybridization. Genome 43: 1081–1083.
Senior, M., and M. Heun, 1993 Mapping maize microsatellites andpolymerase chain reaction confirmation of the targeted repeatsusing a CT primer. Genome 36: 884–889.
Sharopova, N., M. D. Mcmullen, L. Schultz, S. Schroeder,H. Sanchez-Villeda et al., 2002 Development and mappingof SSR markers for maize. Plant Mol. Biol. 48: 463–481.
Shen, D.-L., Z.-F. Wang and M. Wu, 1987 Gene mapping on maizepachytene chromosomes by in situ hybridization. Chromosoma95: 311–314.
Sheridan, W. F., and D. L. Auger, 2006 Construction and uses ofnew compound B-A-A maize chromosome translocations. Genet-ics 174: 1755–1765.
Sherman, J. D., and S. M. Stack, 1995 Two-dimensional spreads ofsynaptonemal complexes from solanaceous plants. VI. High-resolution recombination nodule map for tomato (Lycopersiconesculentum). Genetics 141: 683–708.
Song, B. K., K. Nadarajah, M. N. Romanov and W. Ratnam,2005 Cross-species bacterial artificial chromosome (BAC) li-brary screening via overgo-based hybridization and BAC-contigmapping of a yield enhancement quantitative trait locus(QTL) yld1.1 in the Malaysian wild rice Oryza rufipogon. CellMol. Biol. Lett. 10: 425–437.
Song, J., F. Dong and J. Jiang, 2000 Construction of a bacterial ar-tificial chromosome (BAC) library for potato molecular cytoge-netics research. Genome 43: 199–204.
Swigonova, Z., J. Lai, J. Ma, W. Ramakrishna, V. Llaca et al.,2004 Close split of sorghum and maize genome progenitors.Genome Res. 14: 1916–1923.
Taramino, G., and S. Tingey, 1996 Simple sequence repeats forgermplasm analysis and mapping in maize. Genome 39: 277–287.
Trask, B. J., 2002 Human cytogenetics: 46 chromosomes, 46 yearsand counting. Nat. Rev. Genet. 3: 769–778.
Walling, J. G., R. Shoemaker, N. Young, J. Mudge and S. Jackson,2006 Chromosome-level homeology in paleopolyploid soybean(Glycine max) revealed through integration of genetic and chro-mosome maps. Genetics 172: 1893–1900.
Wang, C. J., L. Harper and W. Z. Cande, 2006 High-resolution sin-gle-copy gene fluorescence in situ hybridization and its use in theconstruction of a cytogenetic map of maize chromosome 9. PlantCell 18: 529–544.
White, S., and J. Doebley, 1998 Of genes and genomes and the or-igin of maize. Trends Genet. 14: 327–332.
Woo, S. S., J. Jiang, B. S. Gill, A. H. Paterson and R. A. Wing,1994 Construction and characterization of a bacterial artificialchromosome library of Sorghum bicolor. Nucleic Acids Res. 22:4922–4931.
Yim, Y. S., P. Moak, H. Sanchez-Villeda, T. A. Musket, P. Close et al.,2007 A BAC pooling strategy combined with PCR-based screen-ings in a large, highly repetitive genome enables integration ofthe maize genetic and physical maps. BMC Genomics 8: 47.
Yuan, Y., P. J. Sanmiguel and J. L. Bennetzen, 2003 High-Cot se-quence analysis of the maize genome. Plant J. 34: 249–255.
Zhong, X. B., H. J. De Jong and P. Zabel, 1996a Preparation of to-mato meiotic pachytene and mitotic metaphase chromosomessuitable for fluorescence in situ hybridization (FISH). Chromo-some Res. 4: 24–28.
Zhong, X. B., P. F. Fransz, J. Wennekes-Van Eden, P. Zabel, A. Van
Kammen et al., 1996b High-resolution mapping on pachytenechromosomes and extended DNA fibres by fluorescence in-situhybridisation. Plant Mol. Biol. Rep. 14: 232–242.
Zhong, X. B., J. Bodeau, P. F. Fransz, V. M. Williamson, A. Van Kam-
men et al., 1999 FISH to meiotic pachytene chromosomes of to-mato locates the root-knot nematode resistance gene Mi-1 andthe acid phosphatase gene Aps-1 near the junction of euchroma-tin and pericentromeric heterochromatin of chromosome arms6S and 6L, respectively. Theor. Appl. Genet. 98: 365–370.
Zwick, M. S., M. N. Islam-Faridi, D. G. J. Czeschin, R. A. Wing, G. E.Hart et al., 1998 Physical mapping of the liguleless linkagegroup in Sorghum bicolor using rice RFLP-selected sorghumBACs. Genetics 148: 1983–1992.
Communicating editor: J. A. Birchler
1526 F. I. E. Amarillo and H. W. Bass