a topographic view of supercooled liquids and glass formation · three-dimen sional space to a...
TRANSCRIPT

A Topographic View of Supercooled Liquids and Glass FormationAuthor(s): Frank H. StillingerSource: Science, New Series, Vol. 267, No. 5206 (Mar. 31, 1995), pp. 1935-1939Published by: American Association for the Advancement of ScienceStable URL: http://www.jstor.org/stable/2886441Accessed: 31/03/2010 22:44
Your use of the JSTOR archive indicates your acceptance of JSTOR's Terms and Conditions of Use, available athttp://www.jstor.org/page/info/about/policies/terms.jsp. JSTOR's Terms and Conditions of Use provides, in part, that unlessyou have obtained prior permission, you may not download an entire issue of a journal or multiple copies of articles, and youmay use content in the JSTOR archive only for your personal, non-commercial use.
Please contact the publisher regarding any further use of this work. Publisher contact information may be obtained athttp://www.jstor.org/action/showPublisher?publisherCode=aaas.
Each copy of any part of a JSTOR transmission must contain the same copyright notice that appears on the screen or printedpage of such transmission.
JSTOR is a not-for-profit service that helps scholars, researchers, and students discover, use, and build upon a wide range ofcontent in a trusted digital archive. We use information technology and tools to increase productivity and facilitate new formsof scholarship. For more information about JSTOR, please contact [email protected].
American Association for the Advancement of Science is collaborating with JSTOR to digitize, preserve andextend access to Science.
http://www.jstor.org

FRONTIERS IN MATERIALS SCIENCE: ARTICLES
Hall and P. G. Wolynes, J. Chem. Phys. 86, 2943 (1987).
110. H. Frauenfelder, S. G. Sligar, P. C. Wolynes, Sci- ence 254, 1598 (1991).
111. W. Doster, A. Bachleitner, R. Dunau, M. Hiebi, E. LOscher, Biophys. J. 50, 213 (1986).
112. V. I. Goldanskii, Yu. F. Krupyanskii, V. N. Fleurov, Dok. Akad. Nauk SSSR 272, 978 (1983).
113. F. Parak, J. Heidemeier, G. U. Nienhaus, Hyperfine Interactions 40, 147 (1988).
114. W. Doster, S. Cusack, W. Petry, Nature 337, 754 (1989).
115. B. F. Rasmussen, A. M. Stock, D. Ringe, G. A. Petsko, ibid. 357, 423 (1992).
116. K. Kuczera, J. Smith, M. Karplus, Proc. Natl. Acad. Sci. U.S.A. 87,1601 (1990).
1 1 7a.1. V. Sochava, G. I. Tseretoli, 0. I. Smirnova, Biofiz- ika, 36 (1991).
1 1 7b.l. V. Sochava and 0. I. Smirnova, Food Hydrocol- loids 6, 513 (1993).
118. G. Sartor, A. Hallbrucker, K. Hofer, E. Mayer, J. Phys. Chem. 96, 5133 (1992); G. Sartor, E. Mayer, G. P. Johari, Biophys. J. 66, 249 (1994).
119. J. L. Green, J. Fan, C. A. Angell, J. Phys. Chem. 98, 13780 (1994).
120. K. E. Prehoda and J. L. Markley, in High Pressure Effects in Molecular Biophysics and Enzymology, J. L. Markley, C. A. Royer, D. Northrop, Eds. (Ox- ford Univ. Press, New York, in press), any refer- ences cited therein, and J. L. Markley, private communication. Note the important reassess- ment of packing efficiencies of folded and unfold- ed states which is made in this study. While the unfolding transition may, like the melting of a small crystal, be a transition between two global minima for the individual molecules, the phenomenon ob- served in a protein solution is the consequence of
this event for very many such molecules, and this has the character of a high positive entropy change, small (net) negative volume change, chemical conversion process.
121. V. N. Morozov and T. Ya Morozova, J. Biomol. Struct. Dyn. 11, 459 (1993).
122. R. C. Hoseney, K. Zeleznak, C. S. Lai, Cereal Chem. 63, 285 (1986).
123. A. Zipp and W. Kauzmann, Biochemistry 12, 4217 (1973).
124. A. Petry et al., Phys. B. Condens. Mater. 83, 175 (1991).
125. B. Frick and D. Richter, Phys. Rev. B 47, 14795 (1993).
126. B. Frick, D. Richter, W. Petry, U. Buchenau, Z Phys. B70, 73 (1988).
127. A. Chahid, A. Alegria, J. Colmenero, Macromole- cules 27, 3282 (1994).
128. B. Frick and D. Richter, Science 267, 1939 (1995). 129. U. Buchenau and R. Zorn, Europhys. Lett. 18, 523
(1992). 130. J. Shao and C. A. Angell, unpublished results. 131. L. V. Woodcock, Chem. Phys. Lett. 10, 257 (1971). 132. A. Rahman, R. H. Fowler, A. H. Narten, J. Chem.
Phys. 57, 3010 (1972). 133. J. Kieffer and C. A. Angell, J. Non-Cryst. Solids
106, 336 (1988), and other references cited therein. 134. C. Boussard, G. Fontaneau, J. Lucas, J. Non-
Cryst. Solids, in press. 135. R. J. Roe, J. Chem. Phys. 100, 1612 (1994). 136. A. J. Martin and W. Brenig, Phys. Status Solidi 64,
163 (1974). 137. E. Duval et al., Phys. Rev. Lett. 56, 2052 (1986); A.
Boukeneteretal., ibid. 57, 2391 (1986); E. Duval et al., J. Phys. Condens. Mater. 2,10227 (1990).
138. V. N. Novikov and A. P. Sokolov, Solid State Com- mun. 77, 243 (1991); A. P. Sokolov, A. Kislink, M.
Soltwisch, D. Quitmann, Phys. Rev. Lett. 69, 1540 (1992).
139. L. Borjesson, A. K. Hassan, J. Swenson, L. M. Torell, Phys. Rev. Lett. 70, 4027 (1993).
140. A. K. Hassan, L. B13rjesson, L. M. Torell, J. Non- Cryst. Solids 172-174, 154 (1994).
141. J. Colmenero, A. Arbe, A. Alegria, Phys. Rev. Lett. 71, 2603 (1993).
142. K.-L. Ngai, J. Chem. Phys. 98, 7588 (1993). 143. , in Diffusion in Amorphous Solids, H. Jain
and D. Gupta, Eds. (The Minerals, Metals, and Ma- terials Society, Warrendale, PA, 1994), p. 17.
144. M. H. Cohen and D. Turnbull, J. Chem. Phys. 34, 120 (1960).
144. P. Harrowell, private communication. 145. T. Atake and C. A. Angell, J. Phys. Chem. 83, 3218
(1979). 146. S. Cusack and W. Doster, Biophys. J. 58, 243
(1 990). 147. C. Herbst et al., J. Non-Cryst. Solids 172-174, 265
(1994). 148. L. Haar, J. Gallagher, G. Kell, G.S. National Bureau
of Standards-National Research Council Steam Tables (McGraw-Hill, New York, 1985).
149. P. W. Anderson, in III-Condensed Matter, R. Bal- lian, R. Maynard, G. Toulouse, Eds. (North-Holland,; Amsterdam, 1979), pp. 161-261.
150. A. L. Greer, Science 267, 1947 (1995). 151. I would like to acknowledge the support of the
NSF-DMR under Solid State Chemistry grant DMR9108028-002, and the help of many col- leagues through stimulating discussions of this subject area. In particular, I am grateful to U. Buchenau, H. Frauenfelder, T. Grande, W. Kauz- mann, W. Kob, P. Madden, J. Markley, P. McMillan, P. Poole, H. Sillescu, F. Sciortino, and G. Wolf.
A Topographic View of Supercooled Liquids and
Glass Formation Frank H. Stillinger
Various static and dynamic phenomena displayed by glass-forming liquids, particularly those near the so-called "fragile" limit, emerge as manifestations of the multidimensional complex topography of the collective potential energy function. These include non- Arrhenius viscosity and relaxation times, bifurcation between the a- and 1-relaxation processes, and a breakdown of the Stokes-Einstein relation for self-diffusion. This mul- tidimensional viewpoint also produces an extension of the venerable Lindemann melting criterion and provides a critical evaluation of the popular "ideal glass state" concept.
Methods for preparing amorphous solids include a wide range of techniques. One of the most prominent, both historically and in current practice, involves cooling a vis- cous liquid below its thermodynamic freez- ing point, through a metastable super- cooled regime, and finally below a "glass transition" temperature Tg. A qualitative understanding, at the molecular level, has long been available for materials produced by this latter preparative sequence; how- ever, many key aspects of a detailed quan- titative description are still missing. For-
The author is at AT&T Bell Laboratories, Murray Hill, NJ 07974, USA.
tunately, focused and complimentary ef- forts in experiment, numerical simulation, and analytical theory currently are filling the gaps.
The present article sets forth a descrip- tive viewpoint that is particularly useful for discussing liquids and the glasses that can be formed from them, although in principle it applies to all condensed phases. Concep- tual precursors to this viewpoint can be found throughout the scientific literature (1), but most notably in the work of Gold- stein (2). The objective here is to classify and unify at least some of the many static and kinetic phenomena associated with the glass transition.
Interaction Potentials
Condensed phases, whether liquid, glassy, or crystalline, owe their existence and mea- surable properties to the interactions be- tween the constituent particles: atoms, ions, or molecules. These interactions are com- prised in a potential energy function
..(r . ... rN) that depends on the spatial location ri for each of those particles. The potential energy includes (as circumstances require) contributions from electrostatic multipoles and polarization effects, cova- lency and hydrogen bonding, short-range electron-cloud-overlap repulsions and long- er range dispersion attractions, and in- tramolecular force fields. Obviously, the chemical characteristics of any substance of interest would substantially influence the details of (D. Time evolution of the multi- particle system is controlled by the interac- tions, and for most applications of concern here the classical Newtonian equations of motion (incorporating forces specified by (D) provide an adequate description of the particle dynamics.
In order to understand basic phenome- na related to supercooling and. glass for- mation, it is useful to adopt a "topograph- ic" view of (D. By analogy to topographic maps of the Earth's features, we can imag- ine a multidimensional topographic map showing the "elevation" (D at any "loca- tion" R (r1 ... rN) in the configuration space of the N particle system. This simple change in perspective from conventional
SCIENCE * VOL. 267 * 31 MARCH 1995 1935

three-dimen sional space to a space of much higher dimension [3N for structureless par- ticles, and even more for particles that are asymmetric or nonrigid or both (3)] intrin- sically creates no new information, but it facilitates the description and understanding of collective phenomena that operate in condensed phases, particularly in liquids and glasses.
An obvious set of topographic questions to ask concems the extrema of the 1D surface, such as maxima ("mountain tops"), minima ("valley bottoms"), and saddle points ("mountain passes"). The minima corre- spond to mechanically stable arrangements of the N particles in space, with vanishing force and torque on every particle; any small displacement from such an arrangement gives rise to restoring forces to the undis- placed arrangement. The lowest lying mini- ma are those whose neighborhoods would be selected for occupation by the system if it were cooled to absolute zero slowly enough to maintain thermal equilibrium; for a pure substance, this would correspond to a virtu- ally perfect crystal. Higher lying minima cor- respond to amorphous particle packings and are sampled by the stable liquid phase above the melting temperature Tm (4)
Figure 1 shows a highly schematic illus- tration of the multidimensional '4)- scape." Such a simplified representation can be misleading, but it serves to stress several key points. First, the minima have a substantial variation in depth and are arranged in a complex pattern throughout configuration space. Second, each mini- mum is enclosed in its own "basin of attraction," most simply defined as the set of all configurations in its "valley," that is, all locations that strict downhill motion would connect to that minimum. Third, contiguous basins share a boundary con- taining at least one saddle point, or tran- sition state. Fourth, equivalent minima can be attained by permutations of iden- tical particles. This last point implies, for a pure substance, that every minimum be- longs to a group of N! equivalent minima distributed regularly throughout the mul- tidimensional configuration space.
An important issue concerning the (D-scape topography that remains largely unresolved concerns the number of minima fl(N), and in particular how fast it rises with N. Rather general arguments (bol- stered by exact calculations for some special theoretical models) yield a simple generic form for the large-N limit in a single-com- ponent system (4, 5):
Q(N) - N! exp(aN) (1)
where a > 0 depends significantly on the chemical nature of the substance consid- ered. The permutational factor N! has al- ready been explained; the challenge is to
predict a reliably from known molecular structures and interactions.
Melting and Freezing Criteria
The topographic view of the (D-scape advo- cated above leads to a clean separation be- tween the inherent structural aspects of the substance under consideration (that is, the classification of potential energy local mini- ma), and the "vibrational" aspects that con- cem motions within and among the basins defined by those inherent structures. Such a separation leads naturally to a fresh exami- nation of an old but very useful idea, namely, the Lindemann melting criterion for crystal- line solids, first formulated in 1910 (6).
The Lindemann criterion concerns the dimensionless ratio, f(T), of the root- mean-square (rms) vibrational displace- ment of particles from their nominal lattice positions, to the nearest-neighbor spacing a. It asserts that when temperature rise causes f(T) to reach a characteristic instability value, melting occurs. X-ray and neutron diffraction experiments provide measure- ments of i(T) (through the Debye-Waller factor) for a wide variety of real substances, and computer simulations can be used to calculate f(T) for model systems. These results show that f(Tm) varies a bit with crystal structure: It is approximately 0.13 for face-centered-cubic crystals and 0.18 for body-centered-cubic crystals (7). In any event, it is substantially constant across sub- stances in a given crystal class and provides a good account of the pressure dependence of Tm for a given substance.
Vibrational motions contributing to f(Tm) have a significant anharmonic char- acter. But aside from a very small concentra- tion of thermally created point defects in the crystal, these vibrations are confined to the basins surrounding the N! absolute minima. At any temperature T, then, the Lindemann ratio for the crystal can be expressed:
f(T) = <(AR)2>112/(Na) (2)
where AR is the intrabasin vibrational dis- placement from the absolute minimum in the multidimensional configuration space, and the brackets denote a thermal average confined to that basin at temperature T.
Although it is not obvious in the usual way of presenting the Lindemann melting criterion, Eq. 2 has a straightforward exten- sion to the liquid phase. One simply recog- nizes that the thermal average and the dis- placements refer to inherent structures of the amorphous packing and their associated 4)-scape basins that predominate after melt- ing. The mean nearest-neighbor distance a for the liquid phase (obtained from the mea- sured radial distribution function) typically is close to that of the unmelted crystal.
No laboratory experiment has yet been
Transition states Basin (saddle points)
0)
e~~~~~~~~~~ Amorphous
inherent 0 Q. structures
Crystal permutations
Particle coordinates
Fig. 1. Schematic diagram of the potential energy hypersurface in the multidimensional configura- tion space for a many-particle system.
Supercooled E i liquid liquid
. //
E
~Crystal
0 Tm
Temperature
Fig. 2. Root-mean-square particle displacement divided by mean neighbor separation, versus tem-
perature, for crystal and liquid phases. The value of this ratio for the crystal at the melting point, f(Tm), is specified by the Lindemann melting criterion.
devised to measure f(T) for liquids. Never- theless, computer simulations for models of real substances can be designed to supply the needed information. Numerically, these simulations are required to generate a rep- resentative collection of system configura- tions for the temperature of interest and to evaluate the rms particle displacements that return each configuration to its correspond- ing inherent structure. Although only a small number of simulations of this kind have thus far been carried out (8), the main features of this extension are clear, and are summarized qualitatively in Fig. 2. The crystal and liquid f(T) curves are distinct; both monotonically increase. with T, with the curve for the liquid located well above that for the crystal. At the melting-freezing point, F'iq is approximately three times that for the crystal; equivalently, the rms parti- cle displacement is approximately one-half that of the nearest-neighbor spacing.
In its conventional form, the Lindemann criterion advances an asymmetric, one-
1936 SCIENCE * VOL. 267 * 31 MARCH 1995
FRONTIERS IN MATERIALS SCIENCE: ARTICLES
0
0.
0 fT
Tg"1 To-1
Inverse temperature
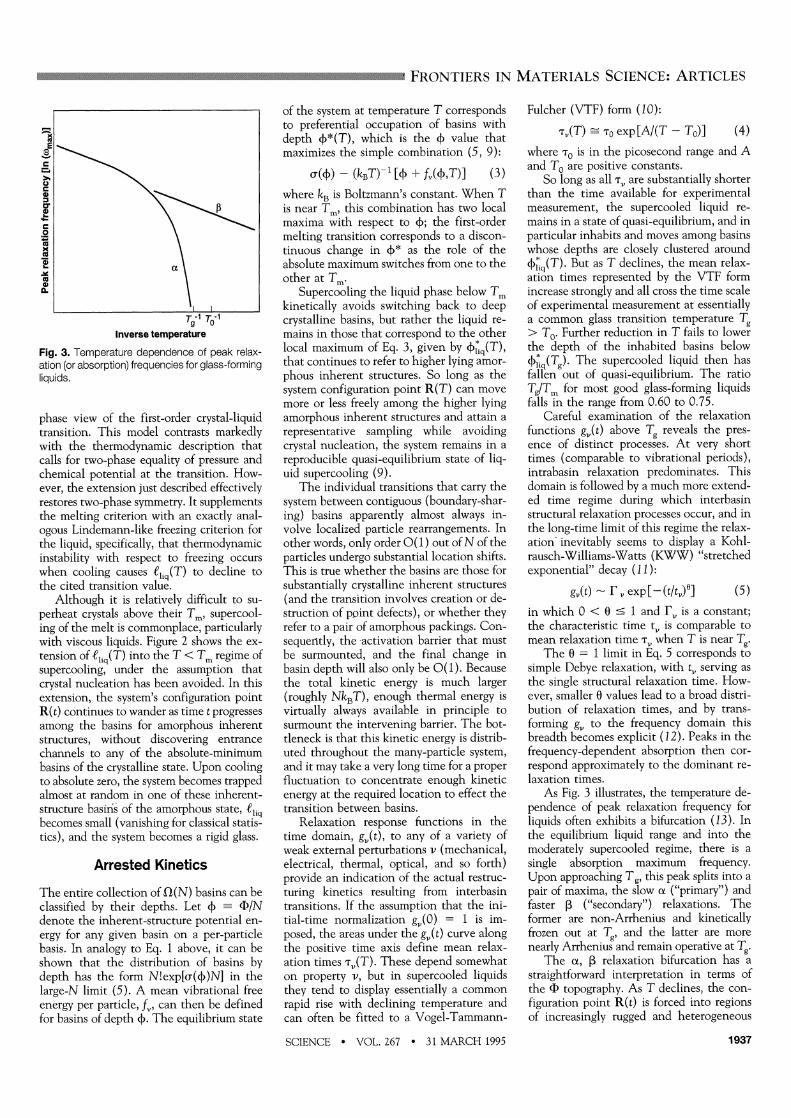
Fig. 3. Temperature dependence of peak relax- ation (or absorption) frequencies for glass-forming liquids.
phase view of the first-order crystal-liquid transition. This model contrasts markedly with the thermodynamic description that calls for two-phase equality of pressure and chemical potential at the transition. How- ever, the extension just described effectively restores two-phase symmetry. It supplements the melting criterion with an exactly anal- ogous Lindemann-like freezing criterion for the liquid, specifically, that thermodynamic instability with respect to freezing occurs when cooling causes fliq(T) to decline to the cited transition value.
Although it is relatively difficult to su- perheat crystals above their Tm, supercool- ing of the melt is commonplace, particularly with viscous liquids. Figure 2 shows the ex- tension of fliq(T) into the T < Tm regime of supercooling, under the assumption that crystal nucleation has been avoided. In this extension, the system's configuration point R(t) continues to wander as time t progresses among the basins for amorphous inherent structures, without discovering entrance channels to any of the absolute-minimum basins of the crystalline state. Upon cooling to absolute zero, the system becomes trapped almost at random in one of these inherent- structure basiris of the amorphous state, fl,q becomes small (vanishing for classical statis- tics), and the system becomes a rigid glass.
Arrested Kinetics
The entire collection of fl(N) basins can be classified by their depths. Let - /N denote the inherent-structure potential en- ergy for any given basin on a per-particle basis. In analogy to Eq. 1 above, it can be shown that the distribution of basins by depth has the form N!exp[u(?)N] in the large-N limit (5). A mean vibrational free energy per particle, fv can then be defined for basins of depth ?. The equilibrium state
of the system at temperature T corresponds to preferential occupation of basins with depth +*(T), which is the + value that maximizes the simple combination (5, 9):
u(0) - (kBT)-1 [+ fj(+,T)] (3)
where kB is Boltzmann's constant. When T is near Tm, this combination has two local maxima with respect to +; the first-order melting transition corresponds to a discon- tinuous change in +8 as the role of the absolute maximum switches from one to the other at TM.
Supercooling the liquid phase below Tm kinetically avoids switching back to deep crystalline basins, but rather the liquid re- mains in those that correspond to the other local maximum of Eq. 3, given by fNiq(T), that continues to refer to higher lying amor- phous inherent structures. So long as the system configuration point R(T) can move more or less freely among the higher lying amorphous inherent structures and attain a representative sampling while avoiding crystal nucleation, the system remains in a reproducible quasi-equilibrium state of liq- uid supercooling (9).
The individual transitions that carry the system between contiguous (boundary-shar- ing) basins apparently almost always in- volve localized particle rearrangements. In other words, only order 0(1) out of N of the particles undergo substantial location shifts. This is true whether the basins are those for substantially crystalline inherent structures (and the transition involves creation or de- struction of point defects), or whether they refer to a pair of amorphous packings. Con- sequerntly, the -activation barrier that must be surmounted, and the final change in basin depth will also only be 0(1). Because the total kinetic energy is much larger (roughly NkBT), enough thermal energy is virtually always available in principle to surmount the intervening barrier. The bot- tleneck is that this kinetic energy is distrib- uted throughout the many-particle system, and it may take a very long time for a proper fluctuation to concentrate enough kinetic energy at the required location to effect the transition between basins.
Relaxation response functions in the time domain, gj(t), to any of a variety of weak external perturbations v (mechanical, electrical, thermal, optical, and so forth) provide an indication of the actual restruc- turing kinetics resulting from interbasin transitions. If the assumption that the ini- tial-time normalization gv(O) = 1 is im- posed, the areas under the gv(t) curve along the positive time axis define mean relax- ation times Tv(T). These depend somewhat on property v, but in supercooled liquids they tend to display essentially a common rapid rise with declining temperature and can often be fitted to a Vogel-Tammann-
Fulcher (VTF) form (10):
T,(T) -To exp [A/(T - To)] (4)
where To is in the picosecond range and A and To are positive constants.
So long as all TV are substantially shorter than the time available for experimental measurement, the supercooled liquid re- mains in a state of quasi-equilibrium, and in particular inhabits and moves among basins whose depths are closely clustered around (1q(T). But as T declines, the mean relax- ation times represented by the VTF form increase strongly and all cross the time scale of experimental measurement at essentially a common glass transition temperature Tg > To, Further reduction in T fails to lower the depth of the inhabited basins below (jIiq(Tg). The supercooled liquid then has fallen out of quasi-equilibrium. The ratio Tg/Tm for most good glass-forming liquids falls in the range from 0.60 to 0.75.
Careful examination of the relaxation functions gv(t) above Tg reveals the pres- ence of distinct processes. At very short times (comparable to vibrational periods), intrabasin relaxation predominates. This domain is followed by a much more extend- ed time regime during which interbasin structural relaxation processes occur, and in the long-time limit of this regime the relax- ation~ inevitably seems to display a Kohl- rausch-Williams-Watts (KWW) "stretched exponential" decay (11):
g,(t) - Fr exp [-(t/t)0] (5)
in which 0 < 0 ' 1 and FV is a constant; the characteristic time tv is comparable to mean relaxation time TV when T is near Tg.
The 0 = 1 limit in Eq. 5 corresponds to simple Debye relaxation, with tv serving as the single structural relaxation time. How- ever, smaller 0 values lead to a broad distri- bution of relaxation times, and by trans- forming gv to the frequency domain this breadth becomes explicit (12). Peaks in the frequency-dependent absorption then cor- respond approximately to the dominant re- laxation times.
As Fig. 3 illustrates, the temperature de- pendence of peak relaxation frequency for liquids often exhibits a bifurcation (13). In the equilibrium liquid range and into the moderately supercooled regime, there is a single absorption maximum frequency. Upon approaching Tg, this peak splits into a pair of maxima, the slow cx ("primary") and faster f ("secondary") relaxations. The former are non-Arrhenius and kinetically frozen out at Tg, and the latter are more nearly Arrhenius and remain operative at Tg.
The a, L relaxation bifurcation has a straightforward interpretation in terms of the F) topography. As T declines, the con- figuration point R(t) is forced into regions of increasingly rugged and heterogeneous
SCIENCE * VOL. 267 * 31 MARCH 1995 1937

topography in order to seek out the ever deeper basins that are identified by 4*q(T). The lower the temperature, the rarer and more widely separated these basins must be. However, the elementary transition pro- cesses that connect contiguous basins con- tinue to require only local rearrangements of small numbers of particles. Evidently, the basins are geometrically organized to create a two-scale length and potential energy pat- tern; Fig. 4 illustrates this feature.
The 1 processes are identified with the elementary relaxations between neighbor- ing basins, whereas the ot processes entail escape from one deep basin within a large- scale "crater" or "metabasin" and eventual- ly into another (14). Because the latter requires a lengthy directed sequence of ele-- mentary transitions, it will acquire a net elevation change (activation energy) many times that of the former. Also, the vast intervening stretch of higher lying basins produces a large activation entropy.
Viscosity and Self-Diffusion
The relaxational response of a fluid to shear stress is often described by a specific in- stance of Eq. 4, the Maxwell relaxation time TM(T), defined by the ratio of the shear viscosity q(T) to the elastic modulus G, which is nearly temperature independent. Consequently, the VTF form in Eq. 4 is also a useful representation of shear viscosity [in- deed, this was its original application (10)]:
Mq(T) - No exp[B/(T - To)] (6) with virtually the same divergence temper- ature To that obtains for other types of relaxation. Experimentally, Tg's often corre- spond to q in the range from 1011 to 1013 poise for nonpolymeric liquids.
The VTF representation for viscosity generates a useful classification of glass- forming liquids between "strong" and "frag- ile" extremes (15), depending on the value of the ratio TO/Tm (or alternatively TO/T). The strong limit has TO/Tm- 0, and q(t) displays Arrhenius temperature behavior; real material examples that appear to be close to this limit are the oxide glasses SiO2 and GeO2. The fragile limit displays dra- matic non-Arrhenius q(T), and is illustrat- ed by orthoterphenyl, and the ionic mate- rial KO.6ca0.4(NO3)1.4'
The variation in behavior between the strong and fragile extremes can be traced back to topographic differences in the 1D-scapes for the respective materials. The extreme limit of strong glass formers presents a uniformly rough (single energy scale) to- pography, in which only the 13 transitions of Fig. 4 have relevance. Little or no coherent organization of the individual basins into large and deep craters, associated with the low-temperature a~ transitions, appears to be
Particle coordinates-,
Fig. 4. Two-scale potential energy topography characteristic of regions of configuration space explored by fragile glass formers near Tg. The el- ementary interbasin transitions are associated with P relaxations, and large distance intercrater transitions are associated with ot relaxations.
present. It is no surprise then that the ot, bifurcation is weak or absent in the strong cases. In contrast, the most fragile glass formers indeed exhibit significant (D-scape cratering and distinctive ot, bifurcation. The relatively large effective singularity temperature To for fragile materials reflects the larger, and wider net barriers that they must surmount, as T declines toward To, for the system configuration to pass from the interior of one inhabited crater to another of comparable or greater depth.
The self-diffusion constant D measures the rate of increase with time, because of Brownian motion, of the mean square dis- placement of a tagged particle in the medi- um. The Stokes-Einstein relation connects D to -q and to an effective hydrodynamic radius b for the particle:
D(T) = kBT/[6Trb(T)] (7)
(the constant 6,u. assumes a "sticking" boundary condition at the particle surface). This relation has been remarkably success- ful at correlating independent measure- ments of D(T) and si(T) for many liquids as both vary over many orders of magnitude in the stable and supercooled liquid regimes. However, some recent experiments on frag- ile glass formers near Ta show a striking breakdown of Eq. 7; in these cases D(T) becomes two orders of magnitude or more larger than the measured (T) would indi- cate (16). Paradoxically, this dramatic ef- fect occurs while the corresponding rota- tional diffusion rate is still linked towr (T) or only weakly decoupled (17).
Once again, the (D-scape cratering char- acteristic for fragile glass formers offers an explanation. When the temperature is low and the system configuration point emerges from one deep crater to search for another, it has been emphasized that a long sequence of elementary interbasin transitions will be
in In motio of th m s is-
plancemn wofl aptggdpeartialcale sthecmedi-
Dxtoqatind tonin anon efcive hydirodynamic rdomiusbno thatencmassmn particle:,
boundrariy coniditionga theartil surfaince).
Leq
0 TK T 0 TKTg~ ~ TM Temperature
Fig. 5. Typical heat capacity curves for fragile glass formers in crystal (C), supercooled liquid (LsC), equilibrium liquid (Leq), and glass (G) phases; TK is the Kauzmann temperature.
pared to the surroundings. Because such domains are expected to be large on the molecular scale near T and to have long lifetimes, translational diffusion receives a disproportionate enhancement compared to rotational diffusion, and a detailed analysis (18)-shows that the latter continues to ad- here more closely than the former to the temperature dependence of -q(T).
Ideal Glass State?
Figure 5 illustrates schematically variation with temperature of the heat capacity (Cp, constant pressure) typically observed for fragile glass formers. Notable features are: (i) Cp rises discontinuously when the crystal melts at Tm; (ii) supercooling the liquid down toward Tg increases the discrepancy between Cp (liquid) and Cp (crystal); and (iii) further cooling produces a nearly dis- continuous drop in Cp (liquid) so that Cp (glass) is very close to that of Cp (crystal) at the same low temperature. In view of the basin-trapping interpretation of the glass transition, it can be concluded that the in- trabasin vibrational properties are Iargely the same for all basins, whether correspond- ing to crystalline or to amorphous inherent structures. Furthermore, most of the en- hancement of Cp (liquid) over Cp (crystal) above Tg stems from the temperature varia- tion of 4q,, the depth of the basins predom- inately inhabited by the supercooled liquid.
The latent heat of melting causes the liquid at Tm to possess a substantially higher entropy than the crystal. However, the C discrepancy illustrated in Fig. 5 means that the liquid loses entropy faster than the crys- tal as both are cooled below Tm* The strong- ly supercooled liquid at Tgstill has the higher
1938 SCIENCE * VOL. 267 * 31 MARCH 1995

FRONTIERS IN MATERIALS SCIENCE: ARTICLES
entropy, although the difference has been substantially reduced. Smooth extrapolation of Cp (liquid) below Tg and of the corre- sponding entropy indicate the existence of a positive "Kauzmann temperature" TK at which the crystal and the extrapolated liquid attain equal entropies (19). Considering that vibrational entropies are nearly the same for the two phases, and that the inherent struc- tural entropy of the ordered crystal vanishes, the fully relaxed glass at TK (the extrapolat- ed liquid) must also have vanishing inherent structural entropy. This realization, coupled with the empirical observation that TK-
To, the mean relaxation-time divergence temperature, has generated the concept of an "ideal glass state" that could be experimen- tally attained if only sufficiently slow cooling rates were available (20).
If indeed it exists, the ideal glass state must correspond to the inherent structure with the lowest potential energy (deepest "crater") that is devoid of substantial re- gions with local crystalline order. Unfortu- nately, the details of this noncrystallinity constraint are unclear but may be crucial: Qualifying inherent structures may depend on the maximum size and degree of perfec- tion permitted crystalline inclusions in oth- erwise amorphous structures. This ambiq- uity, or non-uniqueness of choice criterion, would seem to undermine the concept of a substantially unique ideal glass state.
It has also been argued (9) that the seemingly innocuous extrapolations that identify a positive Kauzmann temperature TK (and by implication To) are flawed. Localized particle rearrangements (associat- ed with I relaxations) are always possible, even in a hypothetical ideal glass structure, and raise the potential energy only by 0(1). These structural excitations in the strict sense prevent attaining the ideal glass state at positive temperature, in conflict with the usual view (20).
In spite of these formal reservations, the ideal glass state concept remains valuable. Careful and systematic experiments on the most fragile glass formers should help to remove some of the obscuring uncertainties.
Conclusions
By focusing attention on the topographic characteristics of (D in the multidimension- al configuration space, a comprehensive de- scription becomes available for static and kinetic phenomena exhibited by super- cooled liquids and their glass transitions. In particular, this viewpoint rationalizes the characteristic properties of fragile glass formers, including non-Arrhenius viscosity, primary-secondary relaxation bifurcation, and the enhancement of self-diffusion rates over the Stokes-Einstein prediction. This multidimensional topographic representa-
tion has the further benefit of uncovering and promoting several basic research topics that need sustained experimental and the- oretical-simulational attention. Examples of the latter are the material-specific enumer- ation of inherent structures (FD minima), the exploitation of the Lindemann-like freezing criterion for liquids and its relation to the glass transition, and the critical eval- uation of the ideal-glass-state concept.
REFERENCES AND NOTES
1. J. D. Bernal, Nature 183, 141 (1959); H. Eyring eta/., Proc. Natl. Acad. Sci. U.S.A. 44, 683 (1958); M. R. Hoare, Adv. Chem. Phys. 40, 49 (1979).
2. M. Goldstein, J. Chem. Phys. 51, 3728 (1969); ibid. 67, 2246 (1977).
3. For constant-pressure circumstances, system vol- ume becomes an additional coordinate and (D in- cludes a pressure-volume contribution PV.
4. F. H. Stillinger and T. A. Weber, Science 225, 983 (1984).
5. , Phys. Rev. A 25, 978 (1982).
6. F. A. Lindemann, Z. Phys. 11, 609 (1910). 7. H. Lowen, Phys. Rep. 237, 249 (1994). 8. R. A. LaViolette and F. H. Stillinger, J. Chem. Phys.
83, 4079 (1985). 9. F. H. Stillinger, ibid. 88, 7818 (1988).
10. G. W. Scherer, J. Am. Ceram. Soc. 75,1060 (1992). 11. K. L. Ngai, Comments Solid State Phys. 9, 127 and
141 (1979); R. Bohmer, K. L. Ngai, C. A. Angell, D. J. Plazek, J. Chem. Phys. 99, 4201 (1993).
12. E. W. Montroll and J. T. Bendler, J. Stat. Phys. 34, 129 (1984).
13. G. P. Johari and M. Goldstein, J. Chem. Phys. 53, 2372 (1970).
14. F. H. Stillinger, Phys. Rev. B 41, 2409 (1990). 15. C. A. Angell, in Relaxations in Complex Systems, K.
Ngai and G. B. Wright, Eds. (National Technical In- formation Service, U.S. Department of Commerce, Springfield, VA, 1985), p. 1.
16. F. Fujara, B. Geil, H. Sillescu, G. Fleischer, Z. Phys. B 88, 195 (1992); M. T. Cicerone and M. D. Ediger, J. Phys. Chem. 97,10489 (1993); R. Kind et al., Phys. Rev. B 45, 7697 (1992).
17. M. T. Cicerone, F. R. Blackburn, M. D. Ediger, J. Chem. Phys. 102, 471 (1995).
18. F. H. Stillinger and J. A. Hodgdon, Phys. Rev. E 50, 2064 (1994).
19. W. Kauzmann, Chem. Rev. 43, 219 (1948). 20. J. Jackle, Rep. Prog. Phys. 49,171 (1986).
The Microscopic Basis of the Glass Transition in Polymers
from Neutron Scattering Studies B. Frick* and D. Richter
Recent neutron scattering experiments on the microscopic dynamics of polymers below and above the glass transition temperature T1 are reviewed. The results presented cover different dynamic processes appearing in glasses: local motions, vibrations, and different relaxation processes such as (- and f-relaxation. For the a-relaxation, which occurs above Tg, it is possible to extend the time-temperature superposition principle, which is valid for polymers on a macroscopic scale, to the microscopic time scale. However, this principle is not applicable for temperatures approaching Tg. Below Tg, an inelastic exci- tation at a frequency of some hundred gigahertz (on the order of several wave numbers), the "boson peak," survives from a quasi-elastic overdamped scattering law at high temperatures. The connection between this boson peak and the fast dynamic process appearing near Tg is discussed.
Polymers have a very wide range of appli- cability. and can be 'used in the solid, rub- bery, or molten states. Solid polymers are used whenever elastic strength is required, and melts are used whenever viscous prop- erties are desired. The intermediate range of viscoelasticity has particularly interesting properties and covers an especially wide temperature range for polymers because of their chain structure. Ideally, an under- standing of the microscopic dynamics would be a prerequisite for optimized appli- cation. The limiting cases of the elastic
B. Frick is in the Institut Laue-Langevin, BP1 56, F-38042 Grenoble Cedex 9, France. D. Richter is in the Institut fur Festkorperforschung, Forschungsanlage Julich, D-52425 Julich, Germany.
*To whom correspondence should be addressed.
solid and the viscous liquid are better un- derstood than the viscoelastic regime, al- though a large amount of experimental data exists for the viscoelastic state (1). Polymers are generally amorphous solids, that is, they are microscopically disordered without translational symmetry and crystallization is rare. The microscopic disorder remains es- sentially unchanged as the polymer trans- forms from the glassy solid state to the melt or liquid state (Fig. IA).
The key to understanding the property changes is the change of the microscopic dynamics, and any structural changes are therefore a consequence of it. Microscopi- cally, elastic solids are characterized by their atoms or molecules being bound within a potential defined by the surrounding atoms.
SCIENCE * VOL. 267 * 31 MARCH 1995 1939