a time-driven activity cost approach for the reduction of ... · pdf fileassociation for...
TRANSCRIPT
Association for Information SystemsAIS Electronic Library (AISeL)
AMCIS 2012 Proceedings Proceedings
A Time-Driven Activity Cost Approach for theReduction of Cost of IT Services: A Case Study inthe Internet Service IndustryAdenle AdeotiUniversity of Liverpool, Liverpool, United Kingdom., [email protected]
Raul ValverdeFaculty of Decision Sciences and MIS, Concordia, Montreal, QC, Canada., [email protected]
Follow this and additional works at: http://aisel.aisnet.org/amcis2012
This material is brought to you by the Americas Conference on Information Systems (AMCIS) at AIS Electronic Library (AISeL). It has been acceptedfor inclusion in AMCIS 2012 Proceedings by an authorized administrator of AIS Electronic Library (AISeL). For more information, please [email protected].
Recommended CitationAdenle Adeoti and Raul Valverde, "A Time-Driven Activity Cost Approach for the Reduction of Cost of IT Services: A Case Study inthe Internet Service Industry" ( July 29, 2012). AMCIS 2012 Proceedings. Paper 4.http://aisel.aisnet.org/amcis2012/proceedings/AccountingInformationSystems/4
Adenle et. Al A TDABC Cost Reduction Approach
Proceedings of the Eighteenth Americas Conference on Information Systems, Seattle, Washington, August 9-12, 2012. 1
A Time-Driven Activity Cost Approach for the Reduction of Cost of IT Services: A Case Study in the Internet Service
Industry Adenle A. Adeoti
School of Information Technology University of Liverpool
Raul Valverde John Molson School of Business
Concordia University [email protected]
ABSTRACT
This study aims to show that application of Time-Driven Activity Based Costing (TDABC) to the management of cost of Information Technology (IT) Services operations and how it can be used to achieve significant cost reduction. To achieve this; a case study organization was used and the scope of activities was limited to Technical Services department Operations units. Interviews were conducted with the unit managers and their operations staff. These units are the Network Operations Centre, Data Centre, Service Desk and Field Services units. These units provide support to existing services and satisfy requests that involve modification of these services. From the interview, a list of services were developed and linked to activities and time to execute each was provided by the operational staff. Time equations were developed from the activity groups that supported each type of service. Capacity cost rates were derived per unit by obtaining a ratio of the monthly cost of running each unit and the practical time resource capacity of each unit. A TDABC model was then simulated with Microsoft Excel; which incorporated the activities, the time to deliver each and the capacity cost rate to derive the cost of delivering a service. Data for six months of service request, incident and change orders were obtained to simulate a test scenario. The result of the test showed that two variations (out of six) of that incident type cost more than 75% of the overall cost of that incident type, though they constitute about 30% of the incident type. This study showed that TDABC is an effective tool in identification of costly processes which may then allow IT operations managers and supervisors to take critical decisions about cost control, charge-back or costing of services.
Keywords (Required)
TDABC, Cost Reduction, Internet Services, Cost Accounting, Time Driven Systems
INTRODUCTION
This study will be looking at some of the activity cost factors in provision of Internet services (using an Internet Services Provider (ISP) as a case study). Activity Based Costing (ABC) is a costing technique where employee activities are linked to resource consumed and then to cost objects like services (or products) and customers so that the cost of delivery can be identified or attributed per customer or service. ABC is a business performance measurement framework that is used in conjunction with other business processes to determine cost of services or products (Kellen and Wolf, 2003). The traditional ABC method was found to be difficult to implement and maintain due to the need to obtain information by interview (which is usually subjective), model a large number of activities and link them to cost objects. TDABC was introduced to simplify the process by using time to derive the capacity cost rate in such a manner as to obtain estimates of the cost per unit time; which is derived by dividing the total cost of supplied capacity (over an accounting period) by the practical (effective) capacity of the resources used within the period.
The study will focus on the determination of cost due to each service type and the efforts to support such services. Other cost elements like bandwidth, storage and CPU utilization can easily be determined for each customer or service type, but our focus for this study will be on the services staff activity contributions to services only. This is because we want to show that the overhead due to staff activities can be accounted for by using the TDABC method of cost accounting.
TDABC will be used to determine the cost of activities that the support staff carries out to deliver services to customers. This allows calculation of cost for each service type or project; and with historic data of customer support activities (use of the helpdesk, service requests and administrative support) the cost of servicing each customer over a period of time can be determined. The ability to do this will allow the business to make decisions about service options and customers’ profitability. It will also help to show if there are redundancies within some service units that can be redistributed to improve
Adenle et. Al A TDABC Cost Reduction Approach
Proceedings of the Eighteenth Americas Conference on Information Systems, Seattle, Washington, August 9-12, 2012. 2
efficiency or reduce cost of outsourcing. This study’s main objective will be to show that TDABC can be used to fill the costing void that is common with most service organizations (especially IT services organizations) that find it difficult to justify spending and produce budget figures.
TDABC FOR COST MANAGEMENT
Cost management before Activity Based Costing (ABC) has not been efficient at allocation of overhead and indirect costs to different cost objects (customers, products or processes) because of the usual practice of accountants averaging out the overhead costs. Turney (2008) discussed how ABC can be used to forecast transaction level of activities so that resource requirements can also be forecasted to meet new business targets. ABC has been able to bring the idea of cost allocation based on the required resource to produce or support a cost object; this is usually referred to as Activity-Based Management (ABM). ABM is based on the fact that costs or spending come from activities performed to deliver products or services (Kren, 2008).
TDABC simplifies the process of creating an activity-based costing model; this has made it easy to create models that do not need very high levels of details and accuracy and still is able to have a reasonable working model. The system can tolerate errors in the measurement of resource consumption because the errors do not compound as it is translated to the cost drivers (Cokins, 2001). The ABC model can be started at a high level of abstraction of the activities and then drilled down as the needs require (Kaplan and Anderson, 2007), the study done by Bamber and Hughes (2001) also showed that this approach was adopted by the implementation team. Starting with too much details tend to create a large complex model that will affect the acceptability by users of the system (or decision makers) and will increase the cost of maintenance.
Kaplan and Anderson (2007) recommended that organizations can use TDABC for cost management by performing what-if analysis and Activity-Based Budgeting (ABB). What-if analysis is done using historical data to forecast performance or cost of services or products based on demand or company sales projections. When this analysis is done using the techniques of ABC (somewhat in reverse) to determine (or budget) for the resource requirements, it can be referred to as Activity-Based Budgeting. These processes allow companies to adjust the supply of resources to the demands of cost objects. Companies will be able to do this by using a current TDABC model of their operational costs to forecast resource requirements to meet future requirements after considerations on how to optimize their processes and adjust the product pricing, product and customer mix to increase profitability. Kaplan and Anderson (2007) highlighted the following six steps sequence to perform what-if analysis and activity-based budgeting:
1) Build a TDABC model based on most recent experience
2) Calculate product, service and customer profitability
3) Make managerial decisions on process improvements, pricing, product and customer mix, product design, and customer relationships.
4) Forecast next period’s process capabilities and the volume and mix of sales and production on the basis of the decisions taken to improve profitability.
5) Calculate the next period’s demand for resource capacities to meet the sales and production forecasts.
6) Authorize spending (increase or decrease from current period’s level) to supply the desired resource capacities in future periods.
The points made above shows that the value added by TDABC to budgeting and cost factors management is the ability to provide detailed information about the consumption of resources. This enables managers to accurately (or better than when traditional accounting techniques were used) forecast resource requirements to meet business targets like sales volume, pricing and improving customer engagement.
TDABC uses time as a measure of resource consumption by activities that have been triggered by cost objects to produce outputs. These activities may vary based on the service or product request, the type of customer, location of delivery and several other factors. The time to complete any activity and its variations is treated as an additive factor, therefore representing them as additive linear equation is sufficient (Kaplan and Anderson, 2007).
Time equations in TDABC are a representative of the services offering of a department or unit. They can be used to predict resource requirements to meet future business requirements or carry out what-if analysis required for budgeting purposes. If service delivery and product manufacturing has been broken down into activities and sub-activities (that accounts for
Adenle et. Al A TDABC Cost Reduction Approach
Proceedings of the Eighteenth Americas Conference on Information Systems, Seattle, Washington, August 9-12, 2012. 3
variations in the services or products due to factors like customizations, volume demand, or destination of delivery), then time equations can be written for them directly. The base activity is the regarded as the activity to produce the standard service or product and time variations are added to this based on the variations introduced by custom orders and delivery types. Kaplan and Anderson (2003) stated time equation in the a generalized formula as shown below;
Tβ = β0 + β1X1 + … + βn Xn
Where:
Tβ – the time needed to perform activity β,
β0 – standard time for performing the basic activity, e.g. 15 minutes,
βi – the estimated time for the incremental activity i, (i =1,…,n), e.g. β1 = 3 minutes,
Xi – the quantity of incremental activity i, (i =1,…,n), e.g. number of line items.
The above equation is of the form y = a + bx; where y is the dependent variable and x is the independent variable; a and b are the intercept and slope respectively. Therefore the time equation can be viewed as a form of linear Regression equation. On our case, there can be more than one independent variable in a time equation. To simplify calculations, all independent variable should be fixed except the one being compared to the dependent variable (the time to perform the activity in equation).
Time equations are the first requirement in creation of the TDABC model; the time obtained per cost objects (based on activities requirements to satisfy the demand of the cost object) is applied to the cost rate for the department or unit that provides the service or product to obtain the cost. The second requirement is the capacity cost rate, discussed in the next sub-section
Capacity cost rate is the ratio of the departmental or unit cost (numerator) to the practical capacity (denominator) of the department or unit; this cost rate is used to derive the cost of orders, products and customers. The departmental cost consists of the total employee compensation, occupancy, technology and corporate support. The practical capacity is the available resource that can be applied to performing an activity after deductions due to inherent constraints have been done (Kaplan and Anderson, 2007).
The departmental cost consist of several cost elements like salaries of employees (with other benefits like medical insurance, pension and taxes), indirect labor costs that supervises or performs support functions (like human resources and administration), equipment and technology, occupancy (or rent) and other indirect costs from support departments like finance, human resources and administration. All these cost elements can be estimated with some level of accuracy by getting historical information from the accounts department for the period in review. There are components that cannot be estimated easily but if the factors that contribute to these cost elements are carefully considered, good estimates can be obtained. For instance, the number of employees in a department can be the determining cost factor for finance and administrative support cost.
The practical capacity is the capacity that can be effectively used out of the total capacity that can be put to work. This capacity can be estimated arbitrarily by choosing an estimated fraction (say 0.8 or 0.85) or theoretically by deducting known resource fraction that is typically not put to use (Kaplan and Anderson, 2007). In the case of TDABC, time is the primary resource, so what will be deducted are times for break, training and meetings.
To develop time equations and assign resource consumption to each cost objects; a list of operational activities needs to be developed that will capture all activities done to provide the services or products (cost objects like customer orders). To develop this list, the services that a department offers should be listed and then broken down into sub-services and then to activities and any variations of these activities. The time determined to carry out these activities has some tolerance and the model will not be too affected (Cokins, 2001); however, the time can be verified by directly measuring the time it takes to perform an activity a few times and an average can be determined.
CASE STUDY
The case study organization is an IT services organization that provides Internet and connectivity based services to its customers. These services include the followings (at a high level);
Adenle et. Al A TDABC Cost Reduction Approach
Proceedings of the Eighteenth Americas Conference on Information Systems, Seattle, Washington, August 9-12, 2012. 4
• Internet Protocol (IP) Connectivity Services
• Hosted Services
• Support Services.
All these services are provided by the Technical Services Department which is divided into four units or groups. These groups provide several IT services to meet the requirements of the business services. The groups are as follows;
• Network Operations Centre (NOC)
• Data Centre (DC)
• Service Desk (SD)
• Field Services (FS)
There are other groups that provide other kinds of service that support the organization’s business growth and handover to the groups listed above (which I will like to refer to as primary service groups); these groups source from the primary groups as required to perform services that cannot be attributed to any particular business service or customer (such as network design, security evaluation, product development and testing). Two of such groups are the Project and Security groups; they are constituted when required. At the interview stage, these temporary or occasional activities have been captured by asking questions around the activities that the members of the permanent groups perform (even though these are not directly linked to any IT services the group performs for a customer.
To satisfy customer requests or resolve service issues, the Technical Services department has put in place processes that define workflows for satisfaction of these requests.
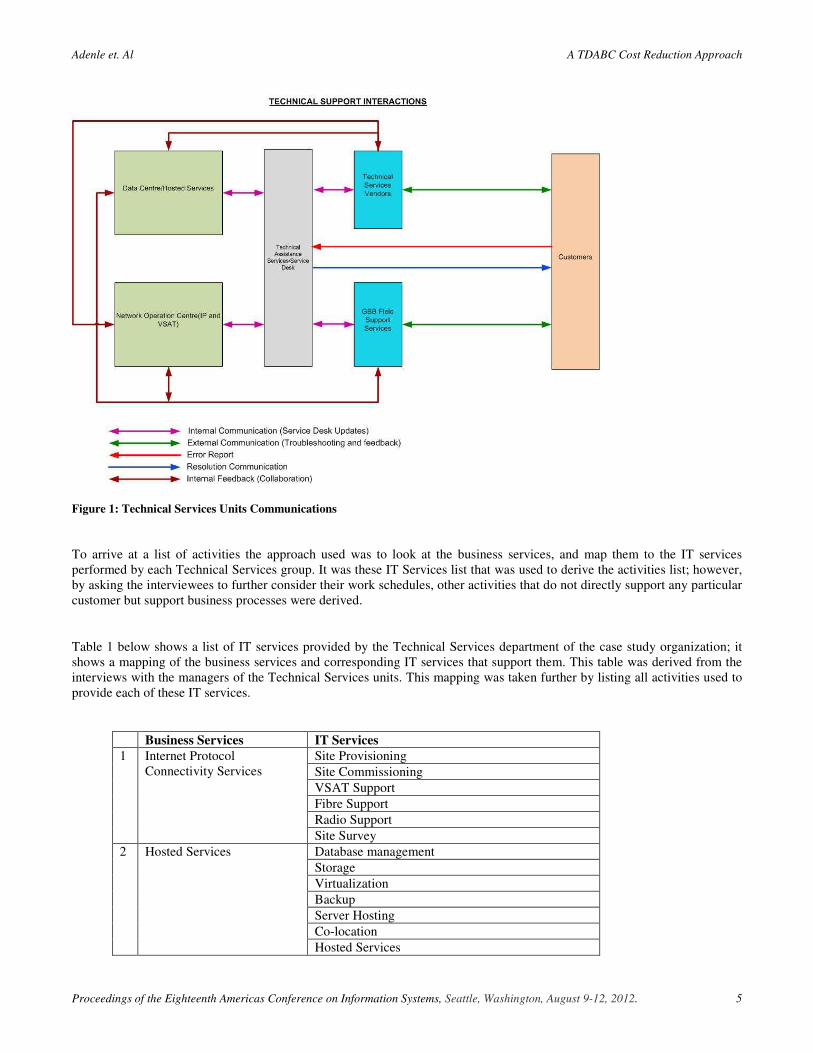
Figure 1 below shows a schematic of information flow within the units to satisfy customer service requests and support as obtained from the initial interview with the Technical Services department unit managers. This shows that the Service Desk unit is the central unit for customer interactions with the Technical Services department. Most of the incidents are resolved at the Helpdesk (a sub-unit of Service Desk) and those requiring specialist attention are channeled to the appropriate unit. For requests, information requests are handled by the Helpdesk and service change or additions are escalated to the appropriate Technical Services unit.
Adenle et. Al A TDABC Cost Reduction Approach
Proceedings of the Eighteenth Americas Conference on Information Systems, Seattle, Washington, August 9-12, 2012. 5
Figure 1: Technical Services Units Communications
To arrive at a list of activities the approach used was to look at the business services, and map them to the IT services performed by each Technical Services group. It was these IT Services list that was used to derive the activities list; however, by asking the interviewees to further consider their work schedules, other activities that do not directly support any particular customer but support business processes were derived.
Table 1 below shows a list of IT services provided by the Technical Services department of the case study organization; it shows a mapping of the business services and corresponding IT services that support them. This table was derived from the interviews with the managers of the Technical Services units. This mapping was taken further by listing all activities used to provide each of these IT services.
Business Services IT Services 1 Internet Protocol
Connectivity Services Site Provisioning
Site Commissioning
VSAT Support
Fibre Support
Radio Support
Site Survey
2 Hosted Services Database management
Storage
Virtualization
Backup
Server Hosting
Co-location
Hosted Services
Adenle et. Al A TDABC Cost Reduction Approach
Proceedings of the Eighteenth Americas Conference on Information Systems, Seattle, Washington, August 9-12, 2012. 6
3 Support Services Level 2 Support
Level 3 Support
Hub Infrastructure Management
Satellite Space Segment Management
Capacity Management
Monitoring and Reporting
Maintenance and Support
Helpdesk Services
Incident Management
Change Management
Process and Service review
LAN Support
Third party Support Management
Power Systems Support
4 Other Services Research and Development
NOC Operations
POC Support
Setup Studio
Access Management
Power and Cooling
Enterprise Applications (on-premise)
Third Party Support Management
Table 1: Mapping of Business to IT Services
Time equations are representations of the variations in activity times due to difference in the characteristics of the same activity, similar activities or closely related activities (that go together). The time measures used in this study are in minutes for uniformity. To determine the time intervals, service engineers or operations staff and their managers provided the time estimates for each activity type. Where there are discrepancies between time estimates, the manager determines which time estimate to use or a few instances of the activities were observed. The approach that is adopted for this project is to develop a time equation for each IT service as shown in the IT Services column of Table 1 above.
As an example to show how time equations were calculated, we will consider the first service in the NOC services, Site Provisioning. This service is Site Provisioning which is provided to prepare for the addition of a new customer on the network to satisfy the business service of Internet Protocol (IP) Connectivity Service. The service requires information about the medium of connection and the customer’s proposed bandwidth. Other required variation for setting up can be the need to configure a Public IP address, setup some routing or Network Address Translation (NAT) configuration on the access network routers. All these information comes from the customer service requirements and designed solution (a business service unit called “Solutions Design” unit provides the solutions document).
Site Provisioning service consists of the following activities
• Planning – To determine the resource requirement that will be used on the back-end infrastructure to satisfy the customer’s service type.
• Planning with IP request – Where public IP addresses will be required to meet the customer’s business needs
• Configuration and bandwidth allocation – This activity is where the IP parameters and requested bandwidth are configured on the core routers and the bandwidth manager.
• Configuration and bandwidth allocation with routing – This is a variation of the above activity with a need to set up special routing rules.
• Configuration and bandwidth allocation with Network Address Translation (NAT) – NAT is a variation of routing but some customer requires both routing and NAT setup to achieve their business needs.
Adenle et. Al A TDABC Cost Reduction Approach
Proceedings of the Eighteenth Americas Conference on Information Systems, Seattle, Washington, August 9-12, 2012. 7
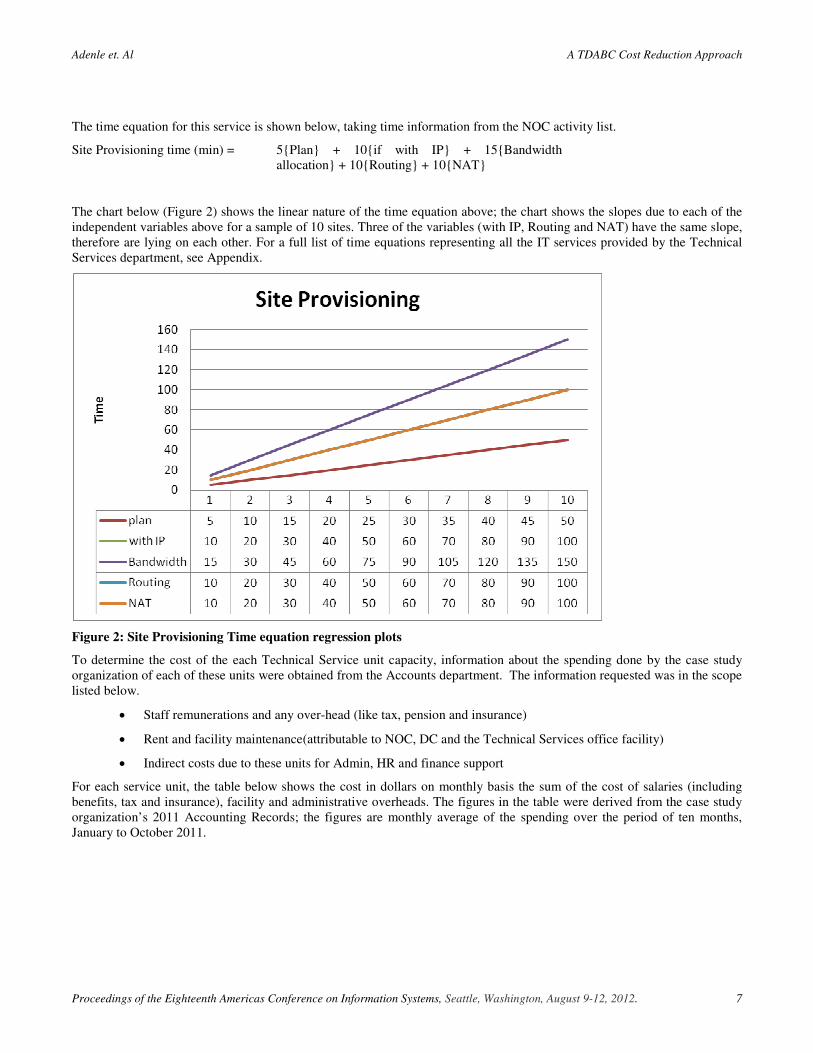
The time equation for this service is shown below, taking time information from the NOC activity list.
Site Provisioning time (min) = 5{Plan} + 10{if with IP} + 15{Bandwidth allocation} + 10{Routing} + 10{NAT}
The chart below (Figure 2) shows the linear nature of the time equation above; the chart shows the slopes due to each of the independent variables above for a sample of 10 sites. Three of the variables (with IP, Routing and NAT) have the same slope, therefore are lying on each other. For a full list of time equations representing all the IT services provided by the Technical Services department, see Appendix.
Figure 2: Site Provisioning Time equation regression plots
To determine the cost of the each Technical Service unit capacity, information about the spending done by the case study organization of each of these units were obtained from the Accounts department. The information requested was in the scope listed below.
• Staff remunerations and any over-head (like tax, pension and insurance)
• Rent and facility maintenance(attributable to NOC, DC and the Technical Services office facility)
• Indirect costs due to these units for Admin, HR and finance support
For each service unit, the table below shows the cost in dollars on monthly basis the sum of the cost of salaries (including benefits, tax and insurance), facility and administrative overheads. The figures in the table were derived from the case study organization’s 2011 Accounting Records; the figures are monthly average of the spending over the period of ten months, January to October 2011.
Adenle et. Al A TDABC Cost Reduction Approach
Proceedings of the Eighteenth Americas Conference on Information Systems, Seattle, Washington, August 9-12, 2012. 8
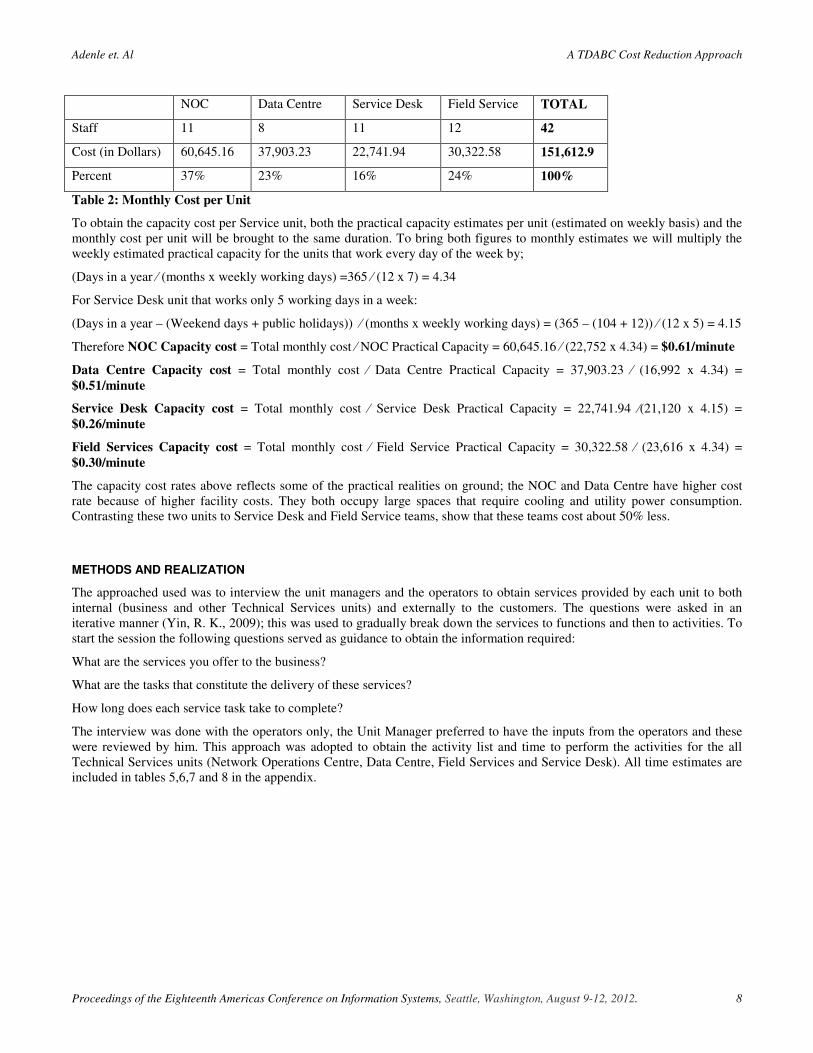
NOC Data Centre Service Desk Field Service TOTAL
Staff 11 8 11 12 42
Cost (in Dollars) 60,645.16 37,903.23 22,741.94 30,322.58 151,612.9
Percent 37% 23% 16% 24% 100%
Table 2: Monthly Cost per Unit
To obtain the capacity cost per Service unit, both the practical capacity estimates per unit (estimated on weekly basis) and the monthly cost per unit will be brought to the same duration. To bring both figures to monthly estimates we will multiply the weekly estimated practical capacity for the units that work every day of the week by;
(Days in a year ⁄ (months x weekly working days) =365 ⁄ (12 x 7) = 4.34
For Service Desk unit that works only 5 working days in a week:
(Days in a year – (Weekend days + public holidays)) ⁄ (months x weekly working days) = (365 – (104 + 12)) ⁄ (12 x 5) = 4.15
Therefore NOC Capacity cost = Total monthly cost ⁄ NOC Practical Capacity = 60,645.16 ⁄ (22,752 x 4.34) = $0.61/minute
Data Centre Capacity cost = Total monthly cost ⁄ Data Centre Practical Capacity = 37,903.23 ⁄ (16,992 x 4.34) = $0.51/minute
Service Desk Capacity cost = Total monthly cost ⁄ Service Desk Practical Capacity = 22,741.94 ⁄(21,120 x 4.15) = $0.26/minute
Field Services Capacity cost = Total monthly cost ⁄ Field Service Practical Capacity = 30,322.58 ⁄ (23,616 x 4.34) = $0.30/minute
The capacity cost rates above reflects some of the practical realities on ground; the NOC and Data Centre have higher cost rate because of higher facility costs. They both occupy large spaces that require cooling and utility power consumption. Contrasting these two units to Service Desk and Field Service teams, show that these teams cost about 50% less.
METHODS AND REALIZATION
The approached used was to interview the unit managers and the operators to obtain services provided by each unit to both internal (business and other Technical Services units) and externally to the customers. The questions were asked in an iterative manner (Yin, R. K., 2009); this was used to gradually break down the services to functions and then to activities. To start the session the following questions served as guidance to obtain the information required:
What are the services you offer to the business?
What are the tasks that constitute the delivery of these services?
How long does each service task take to complete?
The interview was done with the operators only, the Unit Manager preferred to have the inputs from the operators and these were reviewed by him. This approach was adopted to obtain the activity list and time to perform the activities for the all Technical Services units (Network Operations Centre, Data Centre, Field Services and Service Desk). All time estimates are included in tables 5,6,7 and 8 in the appendix.
Adenle et. Al A TDABC Cost Reduction Approach
Proceedings of the Eighteenth Americas Conference on Information Systems, Seattle, Washington, August 9-12, 2012. 9
The TDABC model will be created to evaluate the costs of each service type and this will be used to obtain information about the cost of servicing sample customers of each service type in the case study organization. This kind of information will be useful for guiding decisions about process optimization, where non-value adding activities can be eliminated to save time and reduce cost.
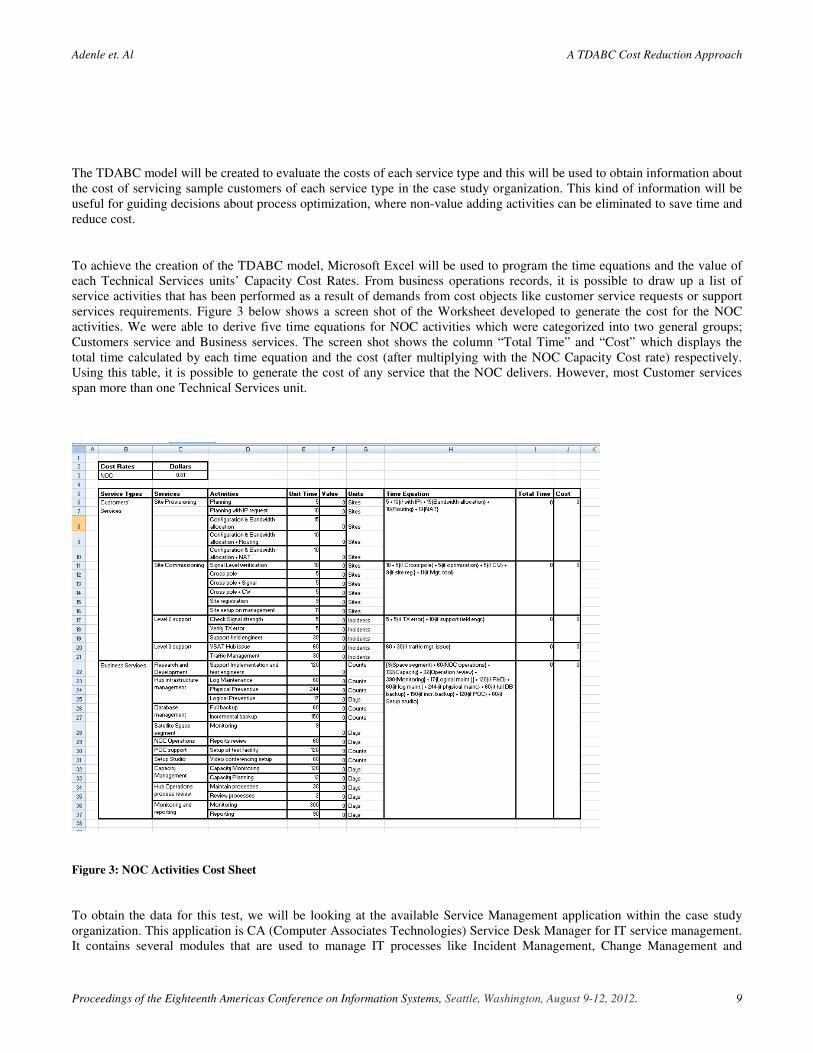
To achieve the creation of the TDABC model, Microsoft Excel will be used to program the time equations and the value of each Technical Services units’ Capacity Cost Rates. From business operations records, it is possible to draw up a list of service activities that has been performed as a result of demands from cost objects like customer service requests or support services requirements. Figure 3 below shows a screen shot of the Worksheet developed to generate the cost for the NOC activities. We were able to derive five time equations for NOC activities which were categorized into two general groups; Customers service and Business services. The screen shot shows the column “Total Time” and “Cost” which displays the total time calculated by each time equation and the cost (after multiplying with the NOC Capacity Cost rate) respectively. Using this table, it is possible to generate the cost of any service that the NOC delivers. However, most Customer services span more than one Technical Services unit.
Figure 3: NOC Activities Cost Sheet
To obtain the data for this test, we will be looking at the available Service Management application within the case study organization. This application is CA (Computer Associates Technologies) Service Desk Manager for IT service management. It contains several modules that are used to manage IT processes like Incident Management, Change Management and
Adenle et. Al A TDABC Cost Reduction Approach
Proceedings of the Eighteenth Americas Conference on Information Systems, Seattle, Washington, August 9-12, 2012. 10
Request Management. The application keeps a record of all incidents, requests and changes which are what translates to activities in each of the Services units we have been discussing. All service requests, incidents and change requests are logged into the system for tracking and accountability.
The CA Service Desk application allows the export of data to Microsoft Excel where it can be formatted to obtain information about categories and volume of incident or request based on customers. This information can now be used to derive the cost of each service type or cost of servicing a customer over a period of time. The data used in this study is for a 6 months period (27 June to 27 December 2011), this is because we have to use a period where the staff strength and operating procedure has not significantly changed. Changes in these two factors will significantly affect the practical capacity of each team and therefore the capacity cost rate will be affected as well.
The exported data will be sorted by several group characteristics to be able to derive useful information.
1. By Service Groups – to obtain cost information on the activities by each Technical Services unit. This will also let us identify the capacity utilization of each service group to determine the if there is redundancy in any unit
2. By Incident/Request/Change type – to obtain cost information about the Support processes. This can show which class of services are more expensive to fulfil. This information is important for process improvement efforts to cut down cost or decide on third party outsourcing.
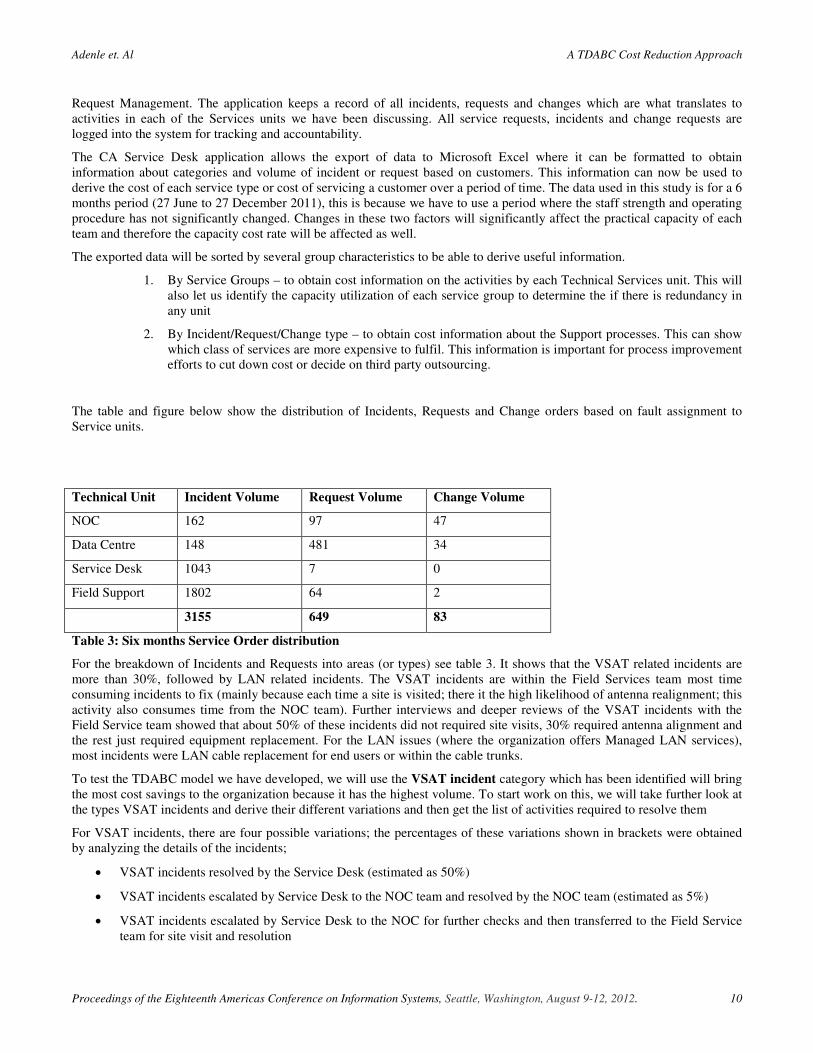
The table and figure below show the distribution of Incidents, Requests and Change orders based on fault assignment to Service units.
Technical Unit Incident Volume Request Volume Change Volume
NOC 162 97 47
Data Centre 148 481 34
Service Desk 1043 7 0
Field Support 1802 64 2
3155 649 83
Table 3: Six months Service Order distribution
For the breakdown of Incidents and Requests into areas (or types) see table 3. It shows that the VSAT related incidents are more than 30%, followed by LAN related incidents. The VSAT incidents are within the Field Services team most time consuming incidents to fix (mainly because each time a site is visited; there it the high likelihood of antenna realignment; this activity also consumes time from the NOC team). Further interviews and deeper reviews of the VSAT incidents with the Field Service team showed that about 50% of these incidents did not required site visits, 30% required antenna alignment and the rest just required equipment replacement. For the LAN issues (where the organization offers Managed LAN services), most incidents were LAN cable replacement for end users or within the cable trunks.
To test the TDABC model we have developed, we will use the VSAT incident category which has been identified will bring the most cost savings to the organization because it has the highest volume. To start work on this, we will take further look at the types VSAT incidents and derive their different variations and then get the list of activities required to resolve them
For VSAT incidents, there are four possible variations; the percentages of these variations shown in brackets were obtained by analyzing the details of the incidents;
• VSAT incidents resolved by the Service Desk (estimated as 50%)
• VSAT incidents escalated by Service Desk to the NOC team and resolved by the NOC team (estimated as 5%)
• VSAT incidents escalated by Service Desk to the NOC for further checks and then transferred to the Field Service team for site visit and resolution
Adenle et. Al A TDABC Cost Reduction Approach
Proceedings of the Eighteenth Americas Conference on Information Systems, Seattle, Washington, August 9-12, 2012. 11
o Resolution was done without NOC support (like part replacement; estimated at 7%)
o Resolution was done requiring NOC Support (estimated at 13%)
• VSAT incidents escalated by Service Desk to the Field Service team for visit and resolution
o Resolution was done without NOC support (like part replacement; estimated as 8%)
o Resolution was done requiring NOC Support (estimated as 17%)
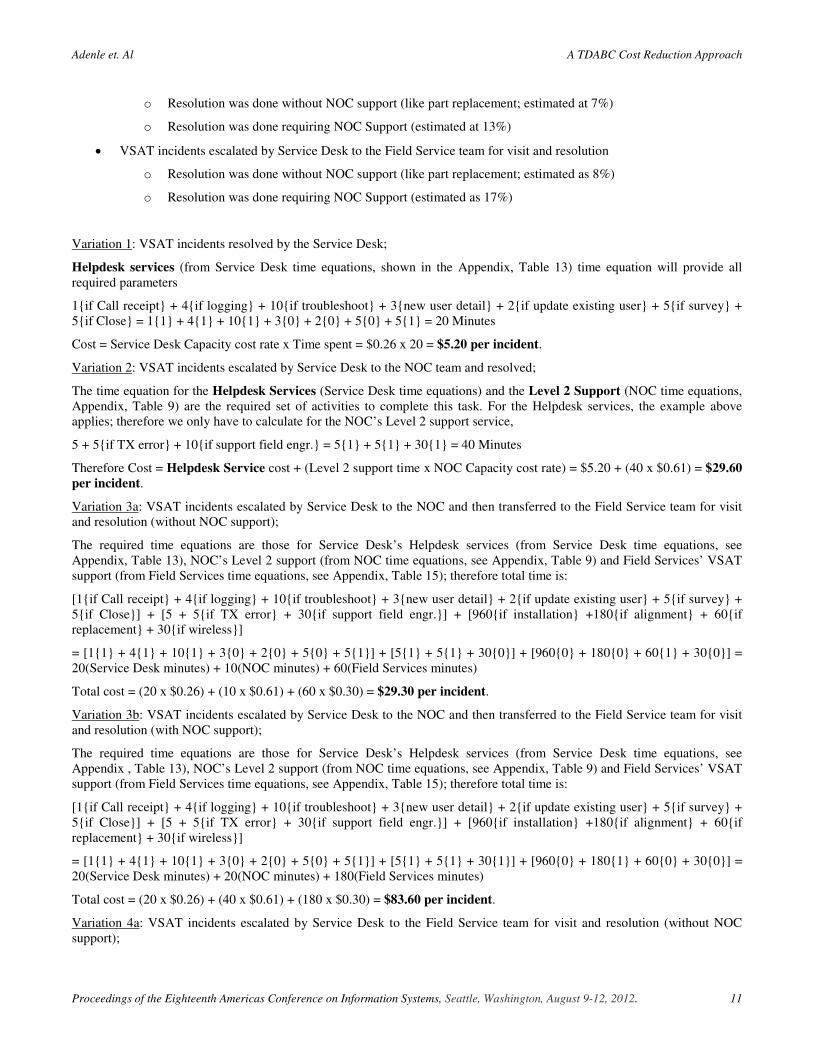
Variation 1: VSAT incidents resolved by the Service Desk;
Helpdesk services (from Service Desk time equations, shown in the Appendix, Table 13) time equation will provide all required parameters
1{if Call receipt} + 4{if logging} + 10{if troubleshoot} + 3{new user detail} + 2{if update existing user} + 5{if survey} + 5{if Close} = 1{1} + 4{1} + 10{1} + 3{0} + 2{0} + 5{0} + 5{1} = 20 Minutes
Cost = Service Desk Capacity cost rate x Time spent = $0.26 x 20 = $5.20 per incident.
Variation 2: VSAT incidents escalated by Service Desk to the NOC team and resolved;
The time equation for the Helpdesk Services (Service Desk time equations) and the Level 2 Support (NOC time equations, Appendix, Table 9) are the required set of activities to complete this task. For the Helpdesk services, the example above applies; therefore we only have to calculate for the NOC’s Level 2 support service,
5 + 5{if TX error} + 10{if support field engr.} = 5{1} + 5{1} + 30{1} = 40 Minutes
Therefore Cost = Helpdesk Service cost + (Level 2 support time x NOC Capacity cost rate) = $5.20 + (40 x $0.61) = $29.60 per incident.
Variation 3a: VSAT incidents escalated by Service Desk to the NOC and then transferred to the Field Service team for visit and resolution (without NOC support);
The required time equations are those for Service Desk’s Helpdesk services (from Service Desk time equations, see Appendix, Table 13), NOC’s Level 2 support (from NOC time equations, see Appendix, Table 9) and Field Services’ VSAT support (from Field Services time equations, see Appendix, Table 15); therefore total time is:
[1{if Call receipt} + 4{if logging} + 10{if troubleshoot} + 3{new user detail} + 2{if update existing user} + 5{if survey} + 5{if Close}] + [5 + 5{if TX error} + 30{if support field engr.}] + [960{if installation} +180{if alignment} + 60{if replacement} + 30{if wireless}]
= [1{1} + 4{1} + 10{1} + 3{0} + 2{0} + 5{0} + 5{1}] + [5{1} + 5{1} + 30{0}] + [960{0} + 180{0} + 60{1} + 30{0}] = 20(Service Desk minutes) + 10(NOC minutes) + 60(Field Services minutes)
Total cost = (20 x $0.26) + (10 x $0.61) + (60 x $0.30) = $29.30 per incident.
Variation 3b: VSAT incidents escalated by Service Desk to the NOC and then transferred to the Field Service team for visit and resolution (with NOC support);
The required time equations are those for Service Desk’s Helpdesk services (from Service Desk time equations, see Appendix , Table 13), NOC’s Level 2 support (from NOC time equations, see Appendix, Table 9) and Field Services’ VSAT support (from Field Services time equations, see Appendix, Table 15); therefore total time is:
[1{if Call receipt} + 4{if logging} + 10{if troubleshoot} + 3{new user detail} + 2{if update existing user} + 5{if survey} + 5{if Close}] + [5 + 5{if TX error} + 30{if support field engr.}] + [960{if installation} +180{if alignment} + 60{if replacement} + 30{if wireless}]
= [1{1} + 4{1} + 10{1} + 3{0} + 2{0} + 5{0} + 5{1}] + [5{1} + 5{1} + 30{1}] + [960{0} + 180{1} + 60{0} + 30{0}] = 20(Service Desk minutes) + 20(NOC minutes) + 180(Field Services minutes)
Total cost = (20 x $0.26) + (40 x $0.61) + (180 x $0.30) = $83.60 per incident.
Variation 4a: VSAT incidents escalated by Service Desk to the Field Service team for visit and resolution (without NOC support);

Adenle et. Al A TDABC Cost Reduction Approach
Proceedings of the Eighteenth Americas Conference on Information Systems, Seattle, Washington, August 9-12, 2012. 12
The required time equations are those for Service Desk’s Helpdesk services (from Service Desk time equations, see Appendix, Table 15) and Field Services’ VSAT support (from Field Services time equations, see Appendix, Table 15); therefore total time is:
[1{if Call receipt} + 4{if logging} + 10{if troubleshoot} + 3{new user detail} + 2{if update existing user} + 5{if survey} + 5{if Close}] + [960{if installation} +180{if alignment} + 60{if replacement} + 30{if wireless}]
= [1{1} + 4{1} + 10{1} + 3{0} + 2{0} + 5{0} + 5{1}] + [960{0} + 180{0} + 60{1} + 30{0}] = 20(Service Desk minutes) + 60(Field Service minutes)
Total cost = (20 x $0.26) + (60 x $0.30) = $23.20 per incident.
Variation 4b: VSAT incidents escalated by Service Desk to the Field Service team for visit and resolution (with NOC support);
The required time equations are those for Service Desk’s Helpdesk services (from Service Desk time equations, see Appendix, Table 13), NOC’s Level 2 support (from NOC time equations, see Appendix, Table 9) and Field Services’ VSAT support (from Field Services time equations, see Appendix, Table 15); therefore total time is:
[1{if Call receipt} + 4{if logging} + 10{if troubleshoot} + 3{new user detail} + 2{if update existing user} + 5{if survey} + 5{if Close}] + [5 + 5{if TX error} + 30{if support field engr.}] + [960{if installation} +180{if alignment} + 60{if replacement} + 30{if wireless}]
[1{1} + 4{1} + 10{1} + 3{0} + 2{0} + 5{0} + 5{1}] + [5{0} + 5{0} + 30{1}] + [960{0} + 180{1} + 60{0} + 30{0}] = 20(Service Desk minutes) + 30(NOC minutes) + 180(Field Services minutes)
Total cost = (20 x $0.26) + (30 x $0.61) + (180 x $0.30) = $77.50 per incident.
Using information obtained about the VSAT incidents, we derived the table below:
Unit Cost ($) Incident Volume Total Cost ($)
1 Variation 1 5.20 574 2,984.80
2 Variation 2 29.60 56 1,657.60
3 Variation 3a 29.30 81 2,373.30
4 Variation 3b 83.60 150 12,540.00
5 Variation 4a 23.20 92 2.134.40
6 Variation 4b 77.50 196 15,190.00
TOTAL 1,149 36,880.10
Table 4: Support cost for VSAT incidents over 6 months
It can be seen that Variation 3b and 4b groups of incidents have the highest cost (more than 75% of overall cost) even though they constitute just 30% of all incidents and 60% of all incidents not resolved by the Helpdesk (Service Desk Level 1 support). To reduce cost on VSAT incident support, there is need to review the process of Field Service support that involves working with the NOC.
This same technique can be applied to any of the Incident, Request or Change orders within the IT service units that are under consideration.
CONCLUSIONS
The results obtained show that the TDABC model is able to show cost in a structural manner, such that useful information can be obtained to help technical operations managers and supervisors to focus on costly processes, customers or products. The aim of such a focus could be to reduce cost of operations, correctly apply charge back to the business (or customer) and to justify budget requests.
Adenle et. Al A TDABC Cost Reduction Approach
Proceedings of the Eighteenth Americas Conference on Information Systems, Seattle, Washington, August 9-12, 2012. 13
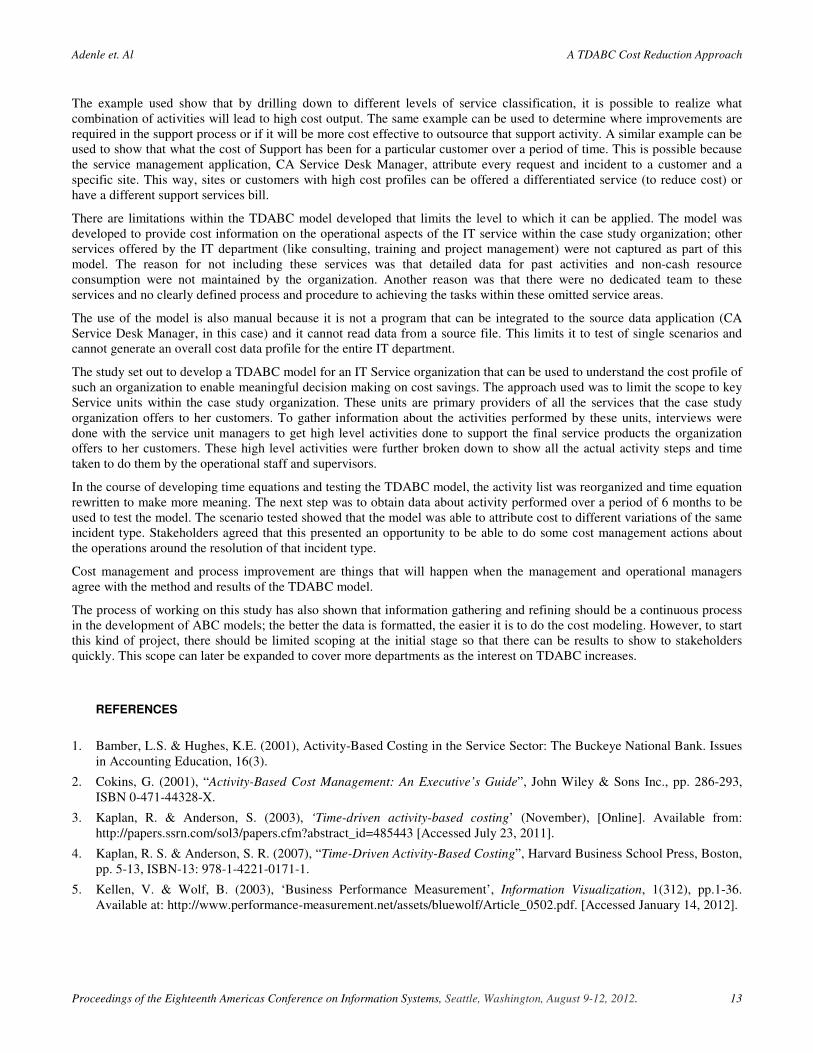
The example used show that by drilling down to different levels of service classification, it is possible to realize what combination of activities will lead to high cost output. The same example can be used to determine where improvements are required in the support process or if it will be more cost effective to outsource that support activity. A similar example can be used to show that what the cost of Support has been for a particular customer over a period of time. This is possible because the service management application, CA Service Desk Manager, attribute every request and incident to a customer and a specific site. This way, sites or customers with high cost profiles can be offered a differentiated service (to reduce cost) or have a different support services bill.
There are limitations within the TDABC model developed that limits the level to which it can be applied. The model was developed to provide cost information on the operational aspects of the IT service within the case study organization; other services offered by the IT department (like consulting, training and project management) were not captured as part of this model. The reason for not including these services was that detailed data for past activities and non-cash resource consumption were not maintained by the organization. Another reason was that there were no dedicated team to these services and no clearly defined process and procedure to achieving the tasks within these omitted service areas.
The use of the model is also manual because it is not a program that can be integrated to the source data application (CA Service Desk Manager, in this case) and it cannot read data from a source file. This limits it to test of single scenarios and cannot generate an overall cost data profile for the entire IT department.
The study set out to develop a TDABC model for an IT Service organization that can be used to understand the cost profile of such an organization to enable meaningful decision making on cost savings. The approach used was to limit the scope to key Service units within the case study organization. These units are primary providers of all the services that the case study organization offers to her customers. To gather information about the activities performed by these units, interviews were done with the service unit managers to get high level activities done to support the final service products the organization offers to her customers. These high level activities were further broken down to show all the actual activity steps and time taken to do them by the operational staff and supervisors.
In the course of developing time equations and testing the TDABC model, the activity list was reorganized and time equation rewritten to make more meaning. The next step was to obtain data about activity performed over a period of 6 months to be used to test the model. The scenario tested showed that the model was able to attribute cost to different variations of the same incident type. Stakeholders agreed that this presented an opportunity to be able to do some cost management actions about the operations around the resolution of that incident type.
Cost management and process improvement are things that will happen when the management and operational managers agree with the method and results of the TDABC model.
The process of working on this study has also shown that information gathering and refining should be a continuous process in the development of ABC models; the better the data is formatted, the easier it is to do the cost modeling. However, to start this kind of project, there should be limited scoping at the initial stage so that there can be results to show to stakeholders quickly. This scope can later be expanded to cover more departments as the interest on TDABC increases.
REFERENCES
1. Bamber, L.S. & Hughes, K.E. (2001), Activity-Based Costing in the Service Sector: The Buckeye National Bank. Issues in Accounting Education, 16(3).
2. Cokins, G. (2001), “Activity-Based Cost Management: An Executive’s Guide”, John Wiley & Sons Inc., pp. 286-293, ISBN 0-471-44328-X.
3. Kaplan, R. & Anderson, S. (2003), ‘Time-driven activity-based costing’ (November), [Online]. Available from: http://papers.ssrn.com/sol3/papers.cfm?abstract_id=485443 [Accessed July 23, 2011].
4. Kaplan, R. S. & Anderson, S. R. (2007), “Time-Driven Activity-Based Costing”, Harvard Business School Press, Boston, pp. 5-13, ISBN-13: 978-1-4221-0171-1.
5. Kellen, V. & Wolf, B. (2003), ‘Business Performance Measurement’, Information Visualization, 1(312), pp.1-36. Available at: http://www.performance-measurement.net/assets/bluewolf/Article_0502.pdf. [Accessed January 14, 2012].

Adenle et. Al A TDABC Cost Reduction Approach
Proceedings of the Eighteenth Americas Conference on Information Systems, Seattle, Washington, August 9-12, 2012. 14
6. Kren, L. (2008), ‘Using Activity-Based management for cost control’, Journal of Performance Management, 21(2), pp.18–28. Available at: http://scholar.google.com/scholar?hl=en&btnG=Search&q=intitle:Using+Activity-Based+Management+for+Cost+Control#0 [Accessed November 27, 2011].
7. Turney, P.B.B. (2008), Activity-Based Costing An Emerging Foundation for Performance Management, Cost Technology. Available at: http://www.sas.com/resources/whitepaper/wp_5073.pdf [Accessed June 7, 2011].
8. Yin, Robert K. (2009), Case Study Research: Design and Methods, Fourth Edition, Sage Publications
APPENDIX TIME EQUATIONS
Service Activities Manager time
Operator time
Agreed time (Min)
1 Site Provisioning Planning 5 5 5
Planning with IP request 10 10 10
Configuration & Bandwidth allocation
15 15 15
Configuration & Bandwidth allocation + Routing
10 10 10
Configuration & Bandwidth allocation + NAT
10 10 10
2 Site Commissioning Signal Level verification 5 10 10
Cross pole 5 5 5
Cross pole + Signal optimization
5 5 5
Cross pole + CW 5 5 5
Site registration 5 9 9
Site setup on management tools
7 11 11
3 Level 2 support Check Signal strength 5 5 5
Verify TX error 5 5 5
Support field engineer 30 30 30
4 Level 3 support VSAT Hub issue 60 60 60
Traffic Management 30 30 30
5 Research and Development
Support Implementation and test engineers
120 120 120
6 Hub infrastructure management
Log Maintenance 60 60 60
Physical Preventive maintenance
244 244 244
Logical Preventive maintenance
180/wk 120/wk 17/day
7 Database Full backup - 60 60

Adenle et. Al A TDABC Cost Reduction Approach
Proceedings of the Eighteenth Americas Conference on Information Systems, Seattle, Washington, August 9-12, 2012. 15
management Incremental backup - 150 150
8 Satellite Space segment management
Monitoring 60/wk 60/wk 9/day
9 NOC Operations Reports review 60/day 60/day 60/day
10 POC support Setup of test facility 60 120 120
11 Setup Studio Video conferencing setup 30 60 60
12 Capacity Management
Capacity Monitoring 120/day 120/day 120/day
Capacity Planning 60/wk 60/wk 12/day
13 Hub Operations process review
Maintain processes 30/day 30/day 30/day
Review processes 60/month 60/month 2/day
14 Monitoring and reporting
Monitoring 300/day 300/day 300/day
Reporting 90/day 90/day 90/day
Table 5: NOC Services and Activities
Service Activities Manager time
Operator time
Agreed time (Min)
1 Storage Plan and implement Windows storage
15 15
Planning Enterprise 20 20
Planning (Unix) 5 5
Scripting (1 time for enterprise)
30 30
2 Virtualization Plan and implement Virtual server
15 15
Planning (Enterprise) 20 20
Planning (Unix) 5 5
Scripting (1 time for enterprise)
30 30
Provision virtual networks 10 10
Install OS 10 10
3 Backup Install backup agents (server)
30 30
Install Backup agent (client)
15 15
Connect to backup Management LAN
20 20
Plan and configure backup policy
15 15
4 Server Hosting Installation in rack 90 90
Plan and configure IP 5 5
Adenle et. Al A TDABC Cost Reduction Approach
Proceedings of the Eighteenth Americas Conference on Information Systems, Seattle, Washington, August 9-12, 2012. 16
Plan and configure IP (Public)
5 5
5 Access Management Access control Management
5 5
6 Power and Cooling Maintenance 50/month 2.5/day
Service request 20/month 1/day
7 Co-location Plan location 10 10
Monitor installation 30 30
8 Hosted Services Create mail server 120 120
Create portal 90 90
Web hosting account 5 5
Unified Communication server
120 120
Create mail users 15/100 users
0.15/user
Create portal users 10/user 10/user
9 Enterprise Applications (on-premise)
Planning 480 480
Implementation 480 480
10 Maintenance and Support
Incident support 5 5
DB maintenance 10/day 10/day
Restore 60 60
Report 30/day 30/day
Monitoring 20/hour 160/day
Maintenance – Hosted servers
120/year 0.5/day
Capacity planning 60/month 2/day
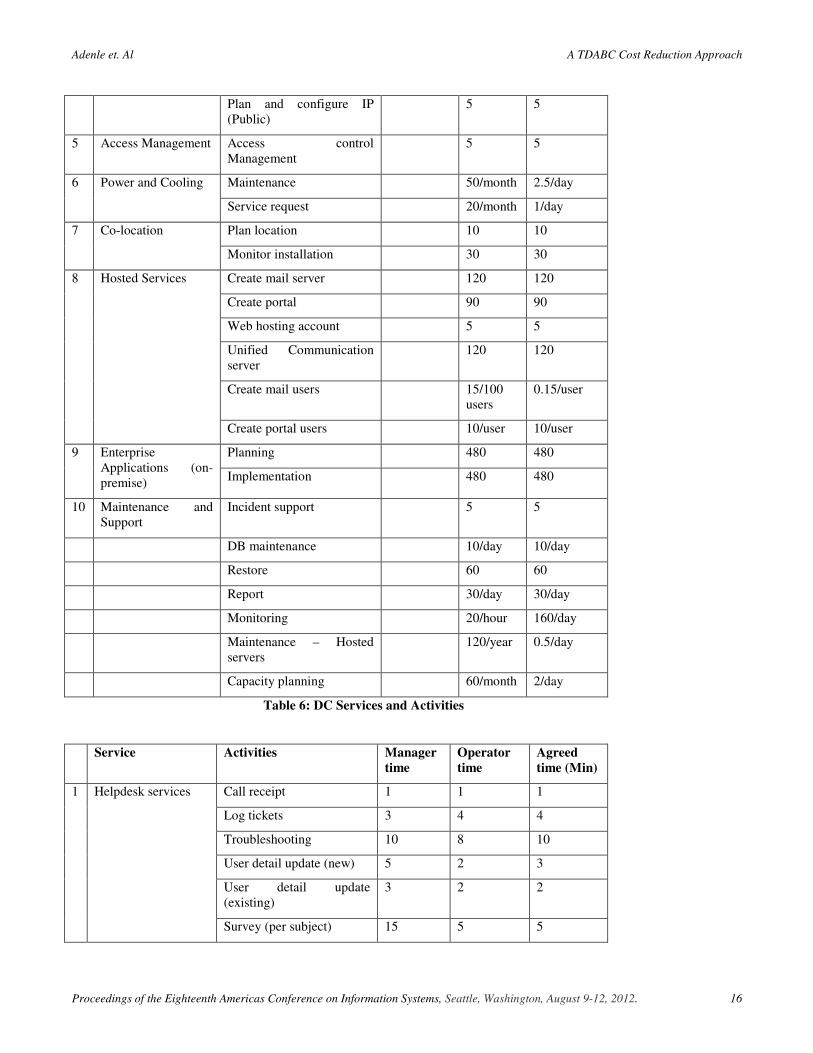
Table 6: DC Services and Activities
Service Activities Manager time
Operator time
Agreed time (Min)
1 Helpdesk services Call receipt 1 1 1
Log tickets 3 4 4
Troubleshooting 10 8 10
User detail update (new) 5 2 3
User detail update (existing)
3 2 2
Survey (per subject) 15 5 5
Adenle et. Al A TDABC Cost Reduction Approach
Proceedings of the Eighteenth Americas Conference on Information Systems, Seattle, Washington, August 9-12, 2012. 17
IVR Setup 10 10 10
Reports (per day) 60/day 50/day 50/day
2 Incident Management
Daily Incident review 120 200 200
Escalation 20 25 25
Incident Closure 5 5 5
Reports (per day) 30/day 15/day 15/day
3 Change Management Review Change document 7 12 10
Process Change approval 4 4 4
Review Change reports 5 6 6
Close change ticket 3 2 2
4 Process and Service review meetings
Process and Service review meetings
120/week 120/week 24/day
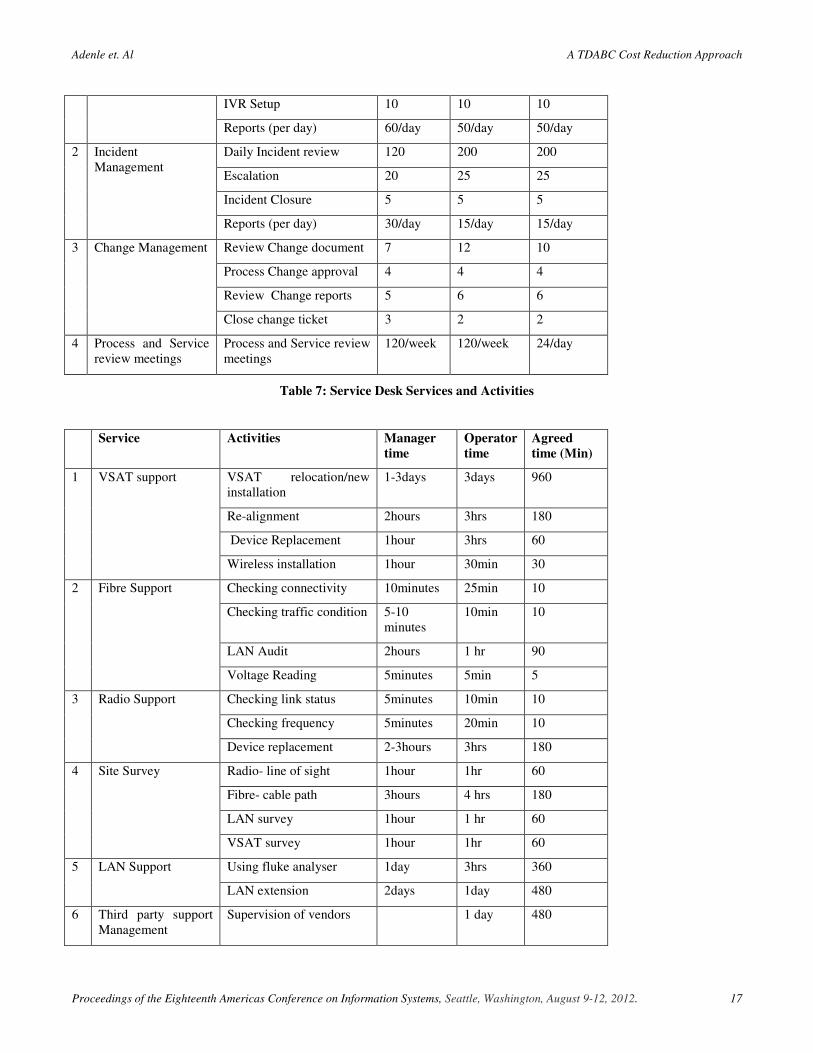
Table 7: Service Desk Services and Activities
Service Activities Manager time
Operator time
Agreed time (Min)
1 VSAT support VSAT relocation/new installation
1-3days 3days 960
Re-alignment 2hours 3hrs 180
Device Replacement 1hour 3hrs 60
Wireless installation 1hour 30min 30
2 Fibre Support Checking connectivity 10minutes 25min 10
Checking traffic condition 5-10 minutes
10min 10
LAN Audit 2hours 1 hr 90
Voltage Reading 5minutes 5min 5
3 Radio Support Checking link status 5minutes 10min 10
Checking frequency 5minutes 20min 10
Device replacement 2-3hours 3hrs 180
4 Site Survey Radio- line of sight 1hour 1hr 60
Fibre- cable path 3hours 4 hrs 180
LAN survey 1hour 1 hr 60
VSAT survey 1hour 1hr 60
5 LAN Support Using fluke analyser 1day 3hrs 360
LAN extension 2days 1day 480
6 Third party support Management
Supervision of vendors 1 day 480
Adenle et. Al A TDABC Cost Reduction Approach
Proceedings of the Eighteenth Americas Conference on Information Systems, Seattle, Washington, August 9-12, 2012. 18
7 Power Systems support
Power extension 1day 480
Earth Protection 2days 1day 480
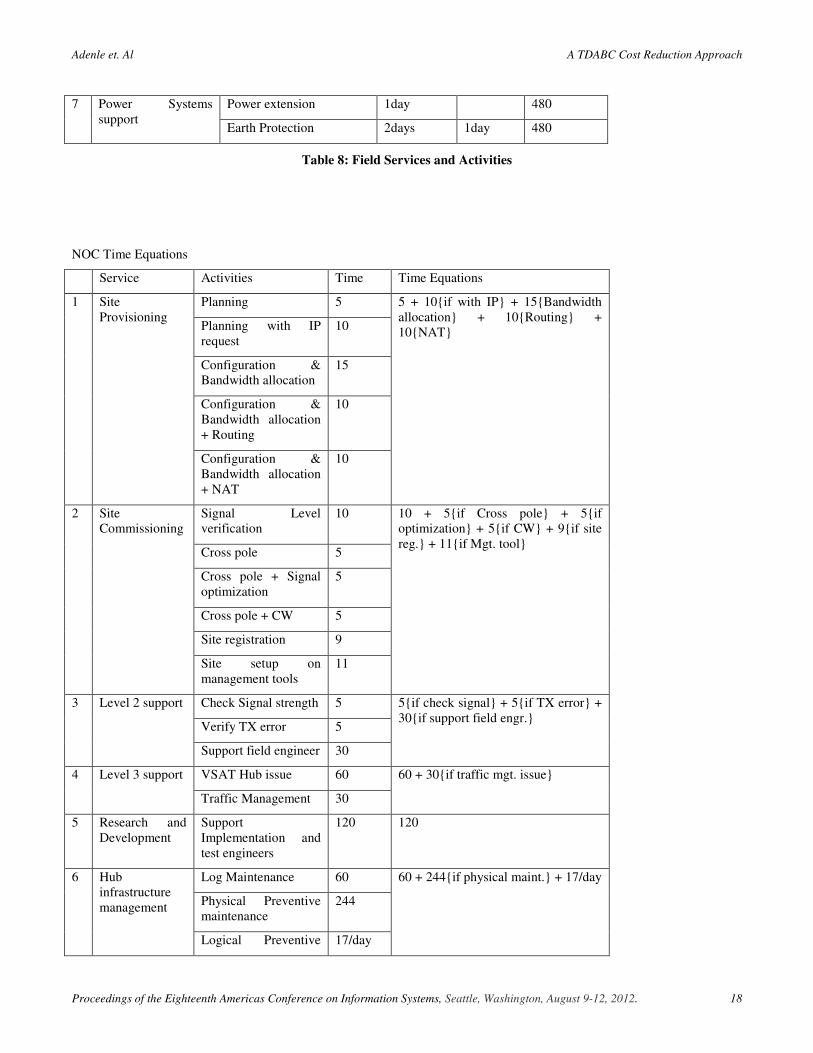
Table 8: Field Services and Activities
NOC Time Equations
Service Activities Time Time Equations
1 Site Provisioning
Planning 5 5 + 10{if with IP} + 15{Bandwidth allocation} + 10{Routing} + 10{NAT}
Planning with IP request
10
Configuration & Bandwidth allocation
15
Configuration & Bandwidth allocation + Routing
10
Configuration & Bandwidth allocation + NAT
10
2 Site Commissioning
Signal Level verification
10 10 + 5{if Cross pole} + 5{if optimization} + 5{if CW} + 9{if site reg.} + 11{if Mgt. tool}
Cross pole 5
Cross pole + Signal optimization
5
Cross pole + CW 5
Site registration 9
Site setup on management tools
11
3 Level 2 support Check Signal strength 5 5{if check signal} + 5{if TX error} + 30{if support field engr.}
Verify TX error 5
Support field engineer 30
4 Level 3 support VSAT Hub issue 60 60 + 30{if traffic mgt. issue}
Traffic Management 30
5 Research and Development
Support Implementation and test engineers
120 120
6 Hub infrastructure management
Log Maintenance 60 60 + 244{if physical maint.} + 17/day
Physical Preventive maintenance
244
Logical Preventive 17/day
Adenle et. Al A TDABC Cost Reduction Approach
Proceedings of the Eighteenth Americas Conference on Information Systems, Seattle, Washington, August 9-12, 2012. 19
maintenance
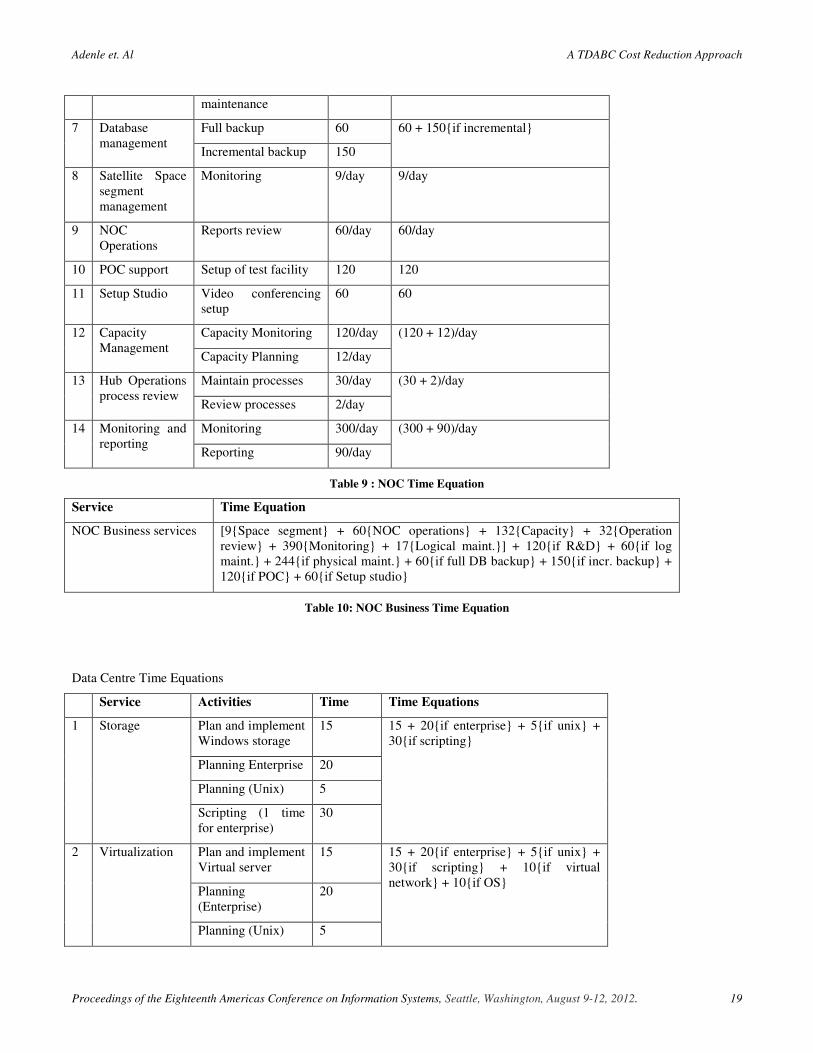
7 Database management
Full backup 60 60 + 150{if incremental}
Incremental backup 150
8 Satellite Space segment management
Monitoring 9/day 9/day
9 NOC Operations
Reports review 60/day 60/day
10 POC support Setup of test facility 120 120
11 Setup Studio Video conferencing setup
60 60
12 Capacity Management
Capacity Monitoring 120/day (120 + 12)/day
Capacity Planning 12/day
13 Hub Operations process review
Maintain processes 30/day (30 + 2)/day
Review processes 2/day
14 Monitoring and reporting
Monitoring 300/day (300 + 90)/day
Reporting 90/day
Table 9 : NOC Time Equation
Service Time Equation
NOC Business services [9{Space segment} + 60{NOC operations} + 132{Capacity} + 32{Operation review} + 390{Monitoring} + 17{Logical maint.}] + 120{if R&D} + 60{if log maint.} + 244{if physical maint.} + 60{if full DB backup} + 150{if incr. backup} + 120{if POC} + 60{if Setup studio}
Table 10: NOC Business Time Equation
Data Centre Time Equations
Service Activities Time Time Equations
1 Storage Plan and implement Windows storage
15 15 + 20{if enterprise} + 5{if unix} + 30{if scripting}
Planning Enterprise 20
Planning (Unix) 5
Scripting (1 time for enterprise)
30
2 Virtualization Plan and implement Virtual server
15 15 + 20{if enterprise} + 5{if unix} + 30{if scripting} + 10{if virtual network} + 10{if OS}
Planning (Enterprise)
20
Planning (Unix) 5

Adenle et. Al A TDABC Cost Reduction Approach
Proceedings of the Eighteenth Americas Conference on Information Systems, Seattle, Washington, August 9-12, 2012. 20
Scripting (1 time for enterprise)
30
Provision virtual networks
10
Install OS 10
3 Backup Install backup agents (server)
30 30{backup agent-if server} + 15{backup agent- if client} + 20{if connect mgt. LAN} + 15{if backup policy}
Install Backup agent (client)
15
Connect to backup Management LAN
20
Plan and configure backup policy
15
4 Server Hosting Installation in rack 90 90 + 5{if Private IP} + 5{if Public}
Plan and configure IP
5
Plan and configure IP (Public)
5
5 Hosted Services
Create mail server 120 120 + 90{if portal} + 5{if Web hosting} + 20{if unified comm. server} + 0.15{per mail user} + 10{per portal user}
Create portal 90
Web hosting account
5
Unified Communication server
120
Create mail users 0.15/user
Create portal users 10/user
6 Enterprise Applications (on-premise)
Planning 480 480 + 480{if implementing}
Implementation 480
7 Access Management
Access control Management
5 5{if access control}
8 Power and Cooling
Maintenance 2.5/day (2.5{if maint.} + 1{if service request})/day
Service request 1/day
9 Co-location Plan location 10 10 + 30{if supervision}
Monitor installation 30
10 Maintenance and Support
Incident support 5 5 + 60{if DB restore} + (10{DB maint.} + 30{Report} + 160{monitoring} + 0.5{hosted server maint.} + 2{Cap. Planning})/day
DB maintenance 10/day
Restore 60
Report 30/day
Monitoring 160/day
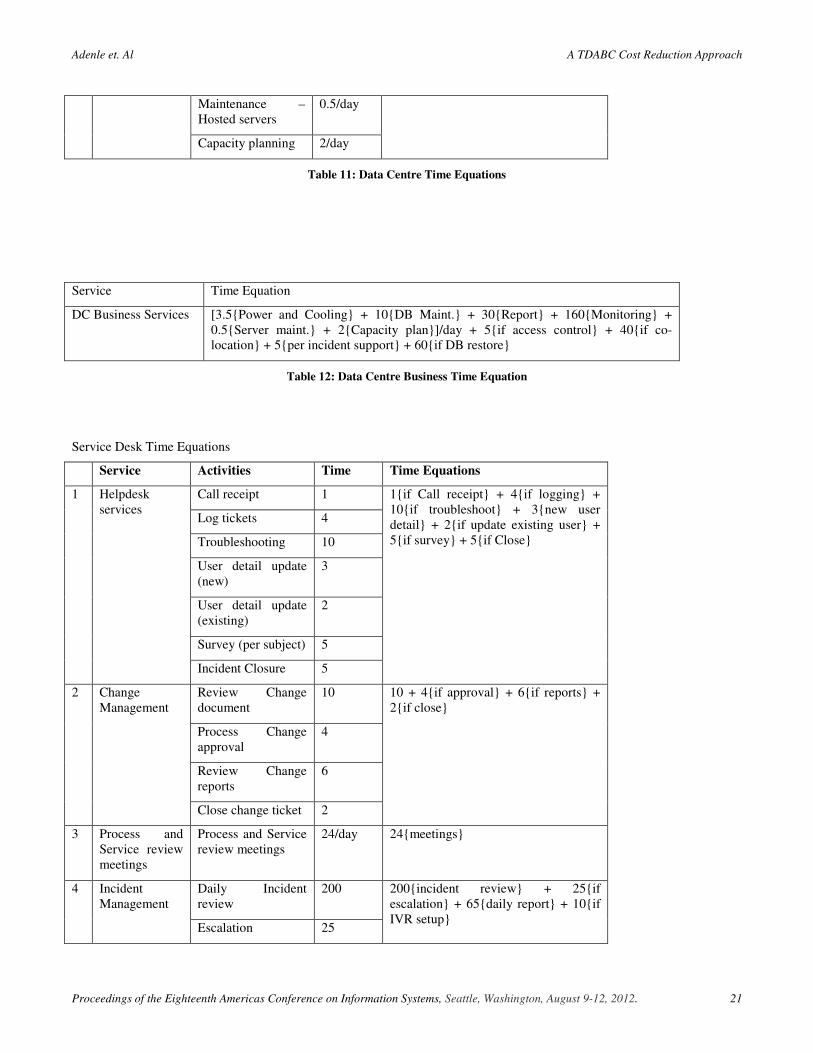
Adenle et. Al A TDABC Cost Reduction Approach
Proceedings of the Eighteenth Americas Conference on Information Systems, Seattle, Washington, August 9-12, 2012. 21
Maintenance – Hosted servers
0.5/day
Capacity planning 2/day
Table 11: Data Centre Time Equations
Service Time Equation
DC Business Services [3.5{Power and Cooling} + 10{DB Maint.} + 30{Report} + 160{Monitoring} + 0.5{Server maint.} + 2{Capacity plan}]/day + 5{if access control} + 40{if co-location} + 5{per incident support} + 60{if DB restore}
Table 12: Data Centre Business Time Equation
Service Desk Time Equations
Service Activities Time Time Equations
1 Helpdesk services
Call receipt 1 1{if Call receipt} + 4{if logging} + 10{if troubleshoot} + 3{new user detail} + 2{if update existing user} + 5{if survey} + 5{if Close}
Log tickets 4
Troubleshooting 10
User detail update (new)
3
User detail update (existing)
2
Survey (per subject) 5
Incident Closure 5
2 Change Management
Review Change document
10 10 + 4{if approval} + 6{if reports} + 2{if close}
Process Change approval
4
Review Change reports
6
Close change ticket 2
3 Process and Service review meetings
Process and Service review meetings
24/day 24{meetings}
4 Incident Management
Daily Incident review
200 200{incident review} + 25{if escalation} + 65{daily report} + 10{if IVR setup}
Escalation 25
Adenle et. Al A TDABC Cost Reduction Approach
Proceedings of the Eighteenth Americas Conference on Information Systems, Seattle, Washington, August 9-12, 2012. 22
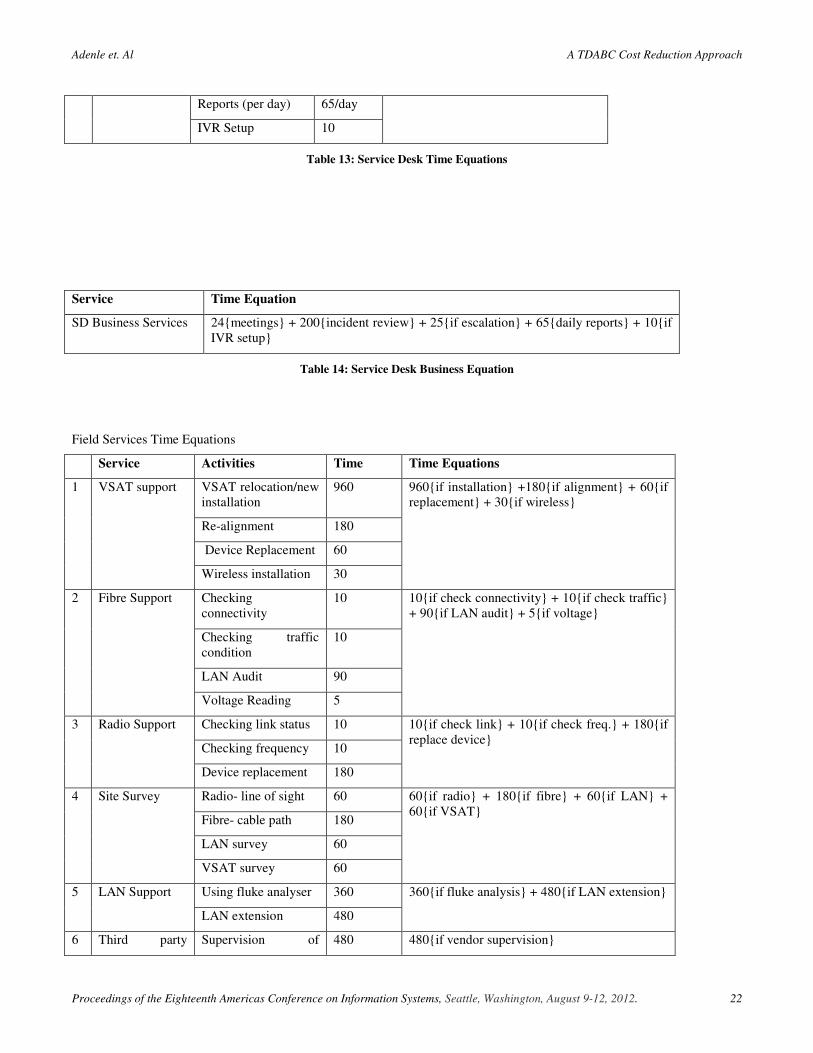
Reports (per day) 65/day
IVR Setup 10
Table 13: Service Desk Time Equations
Service Time Equation
SD Business Services 24{meetings} + 200{incident review} + 25{if escalation} + 65{daily reports} + 10{if IVR setup}
Table 14: Service Desk Business Equation
Field Services Time Equations
Service Activities Time Time Equations
1 VSAT support VSAT relocation/new installation
960 960{if installation} +180{if alignment} + 60{if replacement} + 30{if wireless}
Re-alignment 180
Device Replacement 60
Wireless installation 30
2 Fibre Support Checking connectivity
10 10{if check connectivity} + 10{if check traffic} + 90{if LAN audit} + 5{if voltage}
Checking traffic condition
10
LAN Audit 90
Voltage Reading 5
3 Radio Support Checking link status 10 10{if check link} + 10{if check freq.} + 180{if replace device}
Checking frequency 10
Device replacement 180
4 Site Survey Radio- line of sight 60 60{if radio} + 180{if fibre} + 60{if LAN} + 60{if VSAT}
Fibre- cable path 180
LAN survey 60
VSAT survey 60
5 LAN Support Using fluke analyser 360 360{if fluke analysis} + 480{if LAN extension}
LAN extension 480
6 Third party Supervision of 480 480{if vendor supervision}
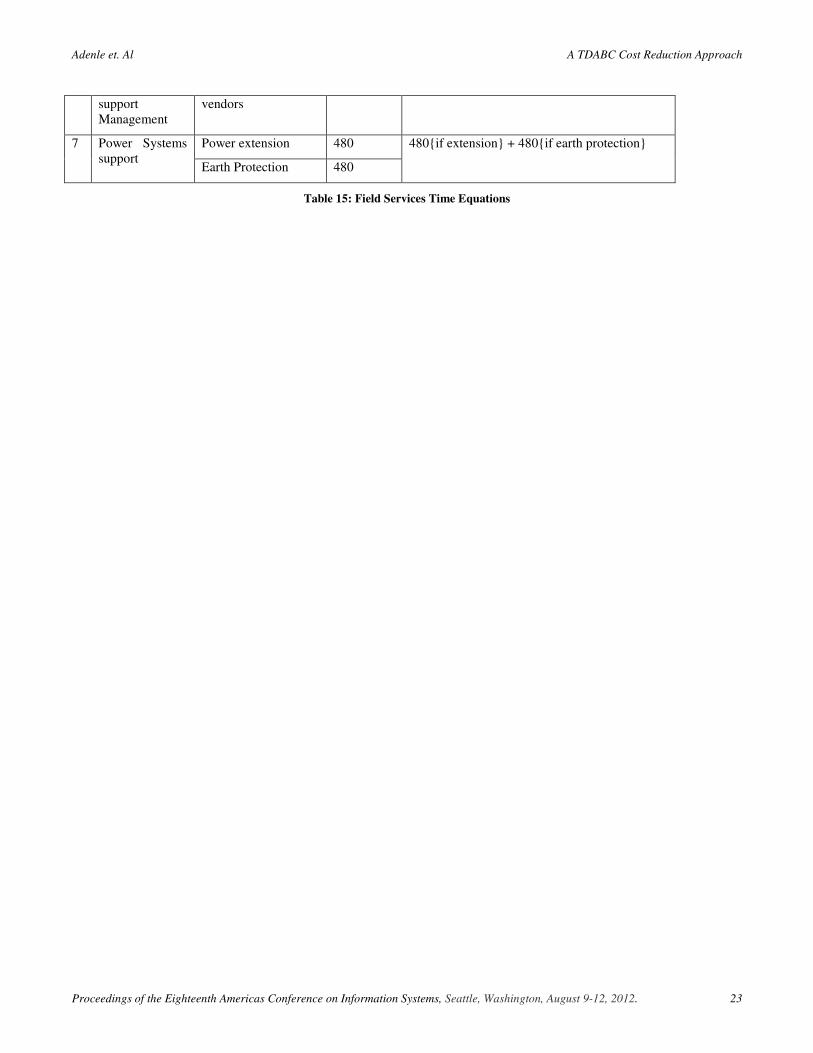
Adenle et. Al A TDABC Cost Reduction Approach
Proceedings of the Eighteenth Americas Conference on Information Systems, Seattle, Washington, August 9-12, 2012. 23
support Management
vendors
7 Power Systems support
Power extension 480 480{if extension} + 480{if earth protection}
Earth Protection 480
Table 15: Field Services Time Equations

Adenle et. Al A TDABC Cost Reduction Approach
Proceedings of the Eighteenth Americas Conference on Information Systems, Seattle, Washington, August 9-12, 2012. 24