a third of a percent - the equality trust third of a... · adverse impacts on uk plc a third of a...
TRANSCRIPT

(the pay of UK low-paid workers, compared to that of their CEOs1)
The gulf between employees’ pay and chief executives’ pay and the
adverse impacts on UK plc
A third of a
percent

� OneSociety
Important disclaimer:
All estimates of pay levels and pay ratios and should be treated with caution. Differences in the way that different companies calculate and report executive pay, and the very scant reporting of low and median pay, makes it is impossible to give definitive figures for companies’ pay levels or ratios. To calculate executive pay, we worked with specialist researchers, but those researchers had to make assumptions about some elements of pay. For example, some payments which were awarded during one financial year will have a different value by the time they are received (e.g. shares); other payments may not be received if company performance does not meet certain targets. Where possible, we have looked at the value of payments awarded (rather than received) during the financial year, which means that those payments may be lower (or higher) than our estimated values once they are received . We have made our assumptions clear in this report and associated materials. Whilst every effort has been made to ensure the information contained in this report is correct, there remains the chance of human error, and therefore One Society cannot guarantee complete accuracy.
In a very few cases, the individual whose pay has been included in calculations is not the company CEO (or equivalent), but the highest-paid director.
Current difficulties in estimating pay levels serve as a strong argument for regulation to ensure more clear and comparable pay reporting .
About One Society
One Society’s work is based on a wealth of research which shows that large divides in income at the top and bottom of society – beyond ‘proportional rewards’ – are damaging to our economy and society, not just those at the bottom but right the way up. We work to promote policy and practice which reduce excessive income inequality. One Society works in partnership with The Equality Trust.
We argue that there is more than enough room for the monetary recognition of ‘due desert’ 2, and the requirements of competitive markets (e.g. in pay scales), while still reducing the UK’s overall rate of income inequality.
One Society 32-36 Loman Street, London SE1 0EH
020 7922 7928
www.onesociety.org.uk
Twitter: @One_Society
September 2011

OneSociety �
Executive Summary .............................................................................................................................................................4
Introduction ...........................................................................................................................................................................6
Data analysis .........................................................................................................................................................................7
• Companies which disclosed remuneration information for their lowest-paid direct UK employee
• Companies for which estimated low pay data is available from third party sources
• FTSE 100 Companies: CEO remuneration compared to national rates of low and median remuneration
• FTSE 100 Companies: CEO remuneration compared to company performance and size
• FTSE 100 companies: Which sectors pay their CEOs the most?
• The public services industry
• The high street
• The banks
CEO pay and pay inequality in the UK – Key trends ...............................................................................................29
• The contribution of top pay to overall UK income inequality
• The hidden pay gap: factors which tend to underestimate the scale of low pay in the UK
• What has caused the increasing inequality at the top of the pay scale?
The adverse impacts of high pay ratios in the UK ..................................................................................................30
• Damaging company performance
• Damaging the wider economy
• Damaging public perceptions of business
• The social consequences of excessive income inequality and their economic costs
Public attitudes to the pay gap .....................................................................................................................................33
Industry and expert attitudes to high pay .................................................................................................................33
Recommendations .............................................................................................................................................................34
Notes ........................................................................................................................................................................................37
Contents:

� OneSociety
Executive Summary:
Data analysis results
262:1 average top-to-bottom pay ratio in companies which disclosed dataOf the FTSE 100 companies which disclosed data on their lowest rates of pay 3 in response to our request, estimated top-to-bottom pay ratios varied from 48:1 (Capital Shopping Centres) to 656:1 (Marks and Spencer). The average estimated top-to-bottom pay ratio for this group was 262:1.
An additional comparison of estimated CEO pay and low pay data from collective bargaining records for a sample of 14 FTSE 100 companies produces a ratio of 309:1 4. This higher ratio is partly explained by the inclusion of some part-time staff and the fact that the data from collective bargaining records do not include pensions and other benefits. Adjusting for these differences would tend to reduce the ratio towards the 262:1 figure quoted above.
Ratios of CEO pay to UK employees’ payAverage estimated FTSE 100 CEO total remuneration was £4.7 million (408 times National Minimum Wage and 219 times 2010 UK median earnings).
Highest estimated FTSE 100 CEO total remuneration was for Reckitt Benckiser’s Bart Becht (£14.4 million: 1262 times National Minimum Wage and 679 times 2010 UK median earnings).
Rises in executive pay outstripped rises in company performanceFor FTSE 100 CEOs, there is no statistically significant relationship between pay and company performance over the same period. Across the FTSE 100, rises in estimated executive pay outstripped rises in company value 5.
We found little to suggest that increased executive remuneration produced increased company performance. In one FTSE 100 company (Carnival), estimated executive pay outstripped company performance by more than 380 percentage points over the same period, whilst in two others (Hargreaves Lansdown and ARM Holdings), company performance outstripped estimated executive pay by over 125 percentage points.
CEO pay as a proportion of company size: large variationsThere was wide variation in the level of estimated CEO pay as a proportion of company value 6, from 0.003% (BP) to 0.425% (Burberry).
Executive pay in the public service industry – much higher than public sector payCompanies with large public sector contracts typically paid their executives much more than the highest-paid public sector employee. For example Serco, which receives over 90% of its business from the public sector, paid Christopher Hyman an estimated £3,149,950 in 2010. This is 6 times more than the highest-paid UK public servant and 11 times more than the highest-paid UK local authority CEO (approximately 50% of Serco’s public sector business is outside the UK).
In contrast to the suggestion that no-one in a public sector organisation should earn more than 20 times more than their lowest-paid colleague 7, none of the ‘public service industry’ organisations we examined paid their CEO less than 59 times UK median earnings (estimate).
BanksEstimated average total CEO pay in FTSE 100 banks was £6.4 million; 565 times National Minimum Wage and 304 times 2010 UK median earnings. Standard Chartered had the highest estimated CEO pay (£8.5 million). Estimated CEO pay in (part-taxpayer owned) RBS and Lloyds was £5.9 and £5.8 million respectively.
The high street Estimated top-to-bottom pay ratios in high street companies which disclosed low pay data are relatively high (an average of 523:1, compared to an average of 306:1 for all companies who disclosed) and range from 349:1 (Kingfisher) to 656:1 (Marks and Spencer). Estimated average total CEO pay in the high street retailers which we examined (which included FTSE 250 companies) was £3.1 million.

OneSociety �
Private-sector pay ratios: What’s the problem?
The estimated gap between FTSE 100 CEO pay and employee’s pay more than doubled in the 10 years to 2009. The UK now has one of the highest pay gaps in the developed world.
Private sector pay and the public interest: the costs to taxpayers and the economy Pay levels in the private sector have impacts which go beyond the company itself. Excessive incentives at the top can produce perverse behaviours. Excessively low pay externalises costs to the taxpayer (e.g. through the benefits system) estimated in the billions of pounds and is likely to reduce the ability of the economy to recover. Excessive gaps between incomes are associated with costly health and social problems as well as with higher levels of debt and economic volatility.
Market failureThere is widespread evidence that the current practices by which executive remuneration is decided in the UK are not working in the best interests of companies and may be suppressing company performance by damaging motivation of both executives and the wider workforce. There is also evidence that the institutional investors who manage the savings of many of the UK population have not as a group been effective in managing this issue.
Pay ratios – as well as just pay levels – are importantPay ratios are not just a media-friendly way of measuring the growth of executive pay. Executives can find themselves incentivised to suppress employees’ pay below levels that are in the best long-term interest of the company, so adopting pay ratios as a metric would provide a useful counterbalance. Excessive pay dispersion is also associated with suppressed company performance when the workforce as a whole is taken into consideration (as well as the economic costs of pay inequality outlined above).
Recommendations
Excessive pay ratios and levels of executive pay that have grown beyond financial justification are complex matters that do not have a single solution. However, our proposals include:
Mandatory reporting of top-to-bottom (as well as top-to-median) pay ratios, and an expectation that policies on low-paid staff and contractors will be published.
Widening the composition of remuneration committees to include employees (who are more likely to have a longer-term perspective and to require proper justifications for high executive pay). Also widening the agenda of committees (to discourage the idea that executive pay and performance is the only lever in company performance), and reviewing the role of remuneration consultants.
Measures to encourage investor assertiveness, by making investors and companies more transparent and remuneration votes binding.
Use of public sector purchasing power to reduce the costs of contractors’ pay gaps and low-pay practices that are met by the taxpayer.

� OneSociety
Introduction
Executive pay is an issue that has aroused widespread attention. There are regular studies which show the correlations between executive pay and company performance 8 and/or average employees’ pay 9. There are also a number of studies which have examined the drivers of rising executive pay 10, the adverse impacts of rising pay ratios 11 and public attitudes to pay at the top and bottom of the income scale 12.
Executive pay is also receiving attention in Westminster and Whitehall. The Government is considering the recommendations of the ‘Hutton Review of Fair Pay in the Public Sector’ 13 (which also made recommendations about private sector pay), and is also considering reform of how companies report executive pay. High pay ratios have been recently attacked by senior parliamentarians including Ed Miliband and Vince Cable.
The purpose of this report is to focus attention on the full extent of top-to-bottom pay ratios in the UK, (as well as the top-to-median pay ratio which Hutton and others want to see reported), to allow us to address the full extent of pay inequality in the UK. However we do also discuss the factors which mean that the real extremes of inequality remain hard to assess.
Working with research partners the Labour Research Department, we have compared:
The total estimated remuneration of FTSE CEOs with UK median pay and the level of adult-rate National Minimum Wage which applied on the last working day of each company’s reporting year.
CEO estimated remuneration with the lowest known pay in some individual companies, using either disclosures made by the companies themselves or data from collective bargaining records.
CEO estimated pay with the value of the individual company and the performance of that company, measured by market capitalisation and the year-on-year change in market capitalisation respectively.
There are some sectors to which we have paid extra attention, due to the public interest involved. These are the public services industry (notable private-sector providers of public services), prominent high-street retailers and banks. The public services industry is included partly because public-sector pay has been the subject of widespread recent scrutiny in Westminster, Whitehall and Fleet Street.
We are grateful to the Ecumenical Council for Corporate Responsibility, with whom we wrote to companies to ask for data on low pay, and to the companies who responded to our request. We are indebted to the many organisations whose work we have cited, especially the High Pay Commission, Resolution Foundation and IPPR, whose work is extensively quoted. Thanks are also due to the numerous individuals who offered advice and assistance in the preparation of this report.
Gaps and ambiguities in the dataThe estimates of pay levels given in this report vary from the levels given in research produced by other organisations. In part, this is because there are different criteria for defining which companies to examine. For example, the constituents of the FTSE change regularly, and company reports become available at different times. It also reflects the difficulty that researchers have in defining criteria by which items are included or excluded. It has also been necessary to use assumptions to produce estimates of the value of some items such as employers’ contributions to defined benefit pension schemes, payments which depend on future performance and awards in shares which will have a different value when vested.
As has been made clear throughout the data analysis section of this report, there are considerable gaps in the data available and there are issues of comparability in some of the data which is available. We have attempted to be as transparent as possible about the assumptions made in our calculations, but due to differences in how data has been reported or disclosed and to differences in company pay practice, there will inevitably be cases where one cannot compare like with like.
In some cases, difficulty in comparison is due to the natural effects of diverse approaches, but in others there are improvements which could be made to companies’ reporting. Sometimes this is a matter of information in which there is a demonstrable public (and/or investor) interest but which is not currently reported, such as pay ratios and low pay, but in other cases it is about simplifying reporting. Items which could be simplified include total executive remuneration and the value of employers’ pension contributions 14.

OneSociety �
Data Analysis
Companies which disclosed remuneration information for their lowest-paid direct UK employee
We are grateful to the following companies for disclosing information on the remuneration of their lowest-paid direct employee in the UK, and for their patience with our requests for clarification.
The data shows that estimated top-to-bottom pay ratios range from 1:48 to 1:656. The average ratio for this group is 1:262 (i.e. the low-paid workers in this group received an estimated 0.38% of their CEO’s pay). This is much higher than typical estimates of top-to-average ratios (e.g. the High Pay Commission’s 1:145 figure for 2009 pay). It is likely that there are significantly higher ratios elsewhere in the FTSE 100, in companies which did not disclose data.
The wide disparities in ratios reflect the differences in workforce structure between sectors. Mandatory reporting of ratios would create a much larger dataset, allowing investors and others to compare ratios between comparable companies.
Company Name Year End
Total annualised remuneration of lowest-paid direct UK employee (estimate)
Total annual remuneration of CEO (estimate)
Pay Multiple
Lowest remu-neration as percentage of CEO remuneration
Anglo-American Cynthia Carroll 31/12/10 £29,500 £5,277,249 179 0.56
British Land Chris Grigg 31/03/11 £24,912 £2,645,924 106 0.94
Capital Shopping Centres David Fischel 31/12/10 £15,373 £732,365 48 2.10
Johnson Matthey Neil Carson 31/03/11 £14,110 £2,963,987 210 0.48
Kingfisher Ian Cheshire 31/01/11 £12,026 £4,192,274 349 0.29
Land Securities Francis Salway 31/03/11 £13,127 £2,687,952 205 0.49
Marks and Spencer Marc Bolland 31/03/11 £13,396 £8,781,996 656 0.15
Old Mutual Julian Roberts 31/12/10 £26,255 £6,395,214 244 0.41
RSA Andy Haste 31/12/10 £18,626 £6,499,875 349 0.29
Tesco Sir Terry Leahy 28/02/11 £12,073 £6,830,883 566 0.18
All the companies shown were FTSE 100 companies as at 1st July 2011.
We also received information from Randgold Resources plc. Because that company has a negligible number of employees in the UK, their data has not been included in the above table. As a matter of interest, their figures are as follows: Total estimated remuneration of lowest-paid direct UK employee: £77,595.70. Total estimated remuneration of CEO: £3,880,983.00. Ratio: 1:50. (Lowest remuneration as percentage of CEO remuneration: 2%).
Prudential plc did not provide sufficient details to allow comparable calculations. However, they did disclose that “Prudential was a London Living Wage employer during our last reported financial year” and that “in 2011 we felt that it was important to supplement these arrangements with a broader commitment to pay a living wage”.
Other companies also submitted information insufficient to allow comparable calculations.
Continued…

� OneSociety
Payments not included in calculations
British Land After 18 months, “this individual is also eligible to participate in the Share Incentive Plan which include free shares worth 10% of salary up to a maximum of £3000 and up to £3000 of matching shares [I.e. given by the company]”. British Land “introduced the London Living Wage as a minimum for all employees last year”
Johnson Matthey The day after the company’s accounting year ended, lowest-rate pay increased from £6.01 to £6.19 phKingfisher “The payment of other benefits for the lowest paid employee would depend on the length of service of each particular individual and
their eligibility for such benefits”. “Non Management Grade Employees can join the Kingfisher Pension Scheme Money Purchase Section (defined contribution) after completing 12 months Company service – on joining the Employee’s Core Contribution is 3% (minimum) with a matching Employer contribution (conditional).” “After 5 years company service the matching contribution can increase to 5%.’ Employees are also entitled to a 20% discount on products after 3 month’s service.”
Land Securities Land Securities also offer a defined contribution pension scheme with a minimum employee contribution of 2%, which generates a 4% company contribution, rising to a maximum 10.5% if employee contribution reaches 6.5%. Employees are also entitled to life assurance (3x salary, 4x salary if in the pension scheme)
Marks and Spencer Marks and Spencer also offer a defined contribution pension scheme with a minimum employee contribution of 3%, which generates a 6% company contribution, rising to a maximum 12% if employee contribution reaches 6%
RSA All RSA’s UK employees also receive a performance bonus (which “varies depending on personal performance so a single percentage cannot be specified”). All employees receive a minimum 7.5% core contribution to defined contribution pension schemes, which has been included in the figure shown in the table above.
Tesco An 11% employer’s contribution to a pension scheme is also offered, conditional upon a contribution from employees.
Notes on this data:• All figures should be regarded as estimates.
• For notes on the total annual remuneration of CEOs, see ‘FTSE 100 Companies: CEO remuneration compared to national rates of low and median remuneration’.
• Some items disclosed by companies were not included in the calculations which produced the table at the head of this section. These items have been shown under “Payments not included in calculations”. Exclusions include: i) payments for which employees are not eligible in their first year of employment ii) employer contributions to pension schemes which are conditional upon employee contributions iii) bonuses dependent upon individual performance, for which a minimum was not given. We have shown pay rates which apply after probationary periods where the period is less than one year.
• While every effort has been made to ensure comparability, the heterogeneous nature of company pay policies means that the raw figures are not always comparable. In addition, some companies’ responses referred to specific individuals whereas others were based on pay bands and policies (the former will tend to produce higher figures than the latter, because individuals may receive more than the theoretical minimum rates used in calculations of the latter, e.g payments to pension schemes and bonuses). To aid understanding, we have included additional information and notes on our assumptions where necessary.
• In some cases, amounts have been adjusted to remove the distortions caused by part-time pay, so they may not reflect actual figures received by individuals. In cases where this has not been possible, (e.g. where amounts were disclosed as a flat amount) we have identified this in the notes (see below).
• Where necessary for calculations of days worked, the number of bank holidays was taken to be that which applied in England.
• Notes on data included or excluded is shown in spreadsheets which will be made available on our website.
• For low pay data, all companies listed were approached directly. Letters bearing the logos of One Society and the Ecumenical Council for Corporate Responsibility were sent on 15th June 2011 to the companies’ CEO and HR Director, using commercially available contact data. The letters were followed up by telephone calls from 21st June. Clarification queries were made by telephone and/or email.

OneSociety �
Companies for which estimated low pay data is available from third party sources
Company Name Year end
Annualised basic pay of lowest-paid UK direct employee (estimate)
Total remuneration of CEO (estimate) Pay Multiple
Lowest pay as percentage of CEO remuneration
Babcock International*
Peter Rogers 31/03/11 £12,081 £2,335,997 193 0.52
BAE Systems Ian King 31/12/10 £16,252 £5,724,014 352 0.28
Balfour Beatty* Ian Tyler 31/12/10 £12,475 £1,951,470 156 0.64
Barclays John Varley 31/12/10 £12,410 £3,560,000 287 0.35
BG Sir Frank Chapman 31/12/10 £13,831 £9,661,402 699 0.14
BT Ian Livingston 31/03/11 £12,049 £6,209,180 515 0.19
Capita Group Paul Pindar 31/12/10 £14,250 £2,110,585 148 0.68
G4S Nick Buckles 31/12/10 £14,602 £2,954,839 202 0.49
Home Retail Group*
Terry Duddy 28/02/11 £12,561 £4,761,997 379 0.26
Imperial Tobacco Robert Dyrbus 30/09/10 £19,213 £3,283,787 171 0.59
J Sainsbury Justin King 31/03/11 £12,918 £4,679,903 362 0.28
Rolls Royce Group Sir John Rose 30/09/10 £14,737 £2,862,404 194 0.51
RSA Insurance Group
Andy Haste 31/12/10 £10,440 £6,499,875 623 0.16
Severn Trent Tony Wray 31/03/11 £12,500 £1,233,129 99 1.01
Tesco Sir Terry Leahy 28/02/11 £11,673 £6,830,883 585 0.17
United Utilities Philip Green 31/03/11 £16,927 £2,573,557 152 0.66
Wm Morrison Supermarkets
Dalton Philips 31/01/11 £11,864 £4,120,664 347 0.29
This data is from collective bargaining agreements and was collated by researchers at the Labour Research Department, an independent research organisation specialising in workforce issues.
For the FTSE 100 companies in the dataset shown (i.e. disregarding 3 companies from the FTSE 250), the average ratio of estimated CEO pay to lowest basic pay is 309:1.
As is the case for companies which disclosed pay data, there are wide disparities in estimated top-to-bottom pay ratios shown below, from 1:99 (Severn Trent) to 1:699 (BG). Again, there are likely to be higher ratios in other FTSE companies.
It is important to note that this data does not show like-for like comparisons: see the notes below.
Companies marked with an asterisk were FTSE 250 companies as at 1st July 2011.
Other relevant dataRSA insurance group: We understand that the estimate provided from collective bargaining agreements is for part time employees and therefore the lowest pay as a percentage of CEO remuneration listed above is likely to be much higher.
Serco: The lowest pay for Serco employees which was visible to our research partners in the period from 1st January 2010 was £35506.76 (for Passenger Service Agents on Docklands Light Railway). This is highly unlikely to represent the lowest basic pay in the company, as other data appears to show that for the period from 1st April 2009 electricians in the ‘Serco Integrated Services’ bargaining unit were subject to a pay deal with a minimum rate equivalent to £10357.88pa.
Important notes• This data is not a like-for-like comparison: ‘CEO total remuneration’ includes pension payments, bonuses
etc, whereas low pay data (basic pay) does not. While it would be possible to use the basic pay of CEOs as a comparator, this would be more misleading than using total remuneration, because basic pay makes up a much smaller proportion of total remuneration of CEOs than it does for other employees, and there are numerous cases (not necessarily in companies listed here) in which low-paid employees receive no remuneration other than basic pay.
• (On the other hand, other factors associated with data sourcing will tend to under-represent the scale of the pay gap: It is possible that there were employees in all or some of the companies shown whose pay was lower than that

10 OneSociety
shown, but for whom data was not visible to our research partners. It is also the case that employees whose pay is decided by collective bargaining is higher than for employees whose pay is not decided by such agreements (i.e. for companies not shown here)).
• Where data was originally shown as hourly rates, the figures have been multiplied by the number of hours stated as the standard working week in the relevant agreement. However, we cannot guarantee that the rates shown in the figures above relate to full-time staff (i.e. the ratio may be misleadingly large in some cases). Minor distortions are possible due to rounding and conversion from weekly or hourly rates into annual rates.
• All figures should be regarded as estimates. We cannot guarantee the accuracy of data from third-party sources.
• In all cases, the stated pay rate is the basic pay for the relevant grade – if the grade had a minimum and a maximum, the minimum figure is used. It cannot be guaranteed that the pay rate applied to any individuals in practice.
All of the caveats mentioned above serve as arguments for universal and comparable reporting of key employee pay data. High pay ratios and sub-living wage pay create costs which are met by the wider public (explored later in this report) but lack of data means that the information necessary to identify and respond to important trends is not available.

OneSociety 11
FTSE 100 Companies: CEO remuneration compared to national rates of low and median remuneration
These figures compare total CEO remuneration with both National Minimum Wage (the adult rate which applied on the last working day of the company’s accounting year for which CEO pay is given) and UK median earnings (2010 ASHE data). All figures should be treated with caution and regarded as estimates (see notes below).
Based on our estimates, the highest-paid CEO was Reckitt Benckiser’s Bart Becht: awarded £14.4 million in the year to the end of December 2010. This was 1262 times the National Minimum Wage and 679 times UK median earnings.
The average estimated total awards made to FTSE 100 CEOs was 408 times the National Minimum Wage and 219 times UK median earnings.
Company NameCEO remuner-ation (estimate)
Company year end
CEO remu-neration as multiple of National Minimum Wage
National Minimum Wage as percentage of CEO remu-neration
CEO remu-neration as multiple of UK median earnings
UK median earnings as percentage of CEO remu-neration
Reckitt Benckiser Bart Becht £14,402,000 31/12/10 1,262 0.08 679 0.15
Burberry Angela Ahrendts £13,142,498 31/03/11 1,152 0.09 619 0.16
Vodafone Vittorio Colao £12,851,499 31/03/11 1,126 0.09 606 0.17
Smith & Nephew David Illingworth £10,460,758 31/12/10 917 0.11 493 0.20
BHP Billiton Marius Kloppers £10,161,721 30/06/10 911 0.11 479 0.21
Reed Elsevier Erik Engstrom £9,746,103 31/12/10 854 0.12 459 0.22
BG † Sir Frank Chapman £9,661,402 31/12/10 847 0.12 455 0.22
Xstrata Mick Davis £9,155,545 31/12/10 802 0.12 431 0.23
Shire Angus Russell £9,002,396 31/12/10 789 0.13 424 0.24
British American Tobacco
Paul Adams £8,974,836 31/12/10 787 0.13 423 0.24
Marks and Spencer* Marc Bolland £8,781,996 31/03/11 770 0.13 414 0.24
Standard Chartered Mike Rees £8,505,991 31/12/10 746 0.13 401 0.25
HSBC Holdings Michael Geoghegan £8,475,484 31/12/10 743 0.13 399 0.25
GlaxoSmithKline Andrew Witty £8,347,365 31/12/10 732 0.14 393 0.25
Diageo † Paul Walsh £7,914,582 30/06/10 709 0.14 373 0.27
WPP Sir Martin Sorrell £7,798,777 31/12/10 684 0.15 368 0.27
ICAP Michael Spencer £7,637,619 31/03/11 669 0.15 360 0.28
AstraZeneca † David Brennan £7,415,125 31/12/10 650 0.15 349 0.29
Experian Don Robert £7,393,951 31/03/11 648 0.15 348 0.29
Pearson Dame Marjorie Scardino
£7,160,273 31/12/10 628 0.16 337 0.30
British Sky Broadcasting Jeremy Darroch £7,062,661 30/06/10 633 0.16 333 0.30
Tesco*† Sir Terry Leahy £6,830,883 28/02/11 599 0.17 322 0.31
RSA Insurance Group*† Andy Haste £6,499,875 31/12/10 570 0.18 306 0.33
Old Mutual* Julian Roberts £6,395,214 31/12/10 561 0.18 301 0.33
Prudential Clark Manning £6,246,766 31/12/10 548 0.18 294 0.34
BT † Ian Livingston £6,209,180 31/03/11 544 0.18 293 0.34
SABMiller Graham Mackay £5,873,952 31/03/11 515 0.19 277 0.36
Royal Bank of Scotland Stephen Hester £5,850,432 31/12/10 513 0.20 276 0.36
Lloyds Banking Group Eric Daniels £5,831,250 31/12/10 511 0.20 275 0.36
Rio Tinto Tom Albanese £5,749,209 31/12/10 504 0.20 271 0.37
BAE Systems † Ian King £5,724,014 31/12/10 502 0.20 270 0.37
Eurasian Natural Resources
Felix Vulis £5,428,660 31/12/10 476 0.21 256 0.39
Anglo American* Cynthia Carroll £5,277,249 31/12/10 463 0.22 249 0.40
Schroders Michael Dobson £5,153,559 31/12/10 452 0.22 243 0.41
TUI Travel Peter Long £5,060,992 30/09/10 454 0.22 238 0.42
Continued…

1� OneSociety
Company NameCEO remuner-ation (estimate)
Company year end
CEO remu-neration as multiple of National Minimum Wage
National Minimum Wage as percentage of CEO remu-neration
CEO remu-neration as multiple of UK median earnings
UK median earnings as percentage of CEO remu-neration
J Sainsbury † Justin King £4,679,903 31/03/11 410 0.24 221 0.45
National Grid Steve Holliday £4,588,399 31/03/11 402 0.25 216 0.46
Carnival plc Micky Arison £4,507,643 30/11/10 395 0.25 212 0.47
Aviva Andrew Moss £4,328,022 31/12/10 379 0.26 204 0.49
Kingfisher* Ian Cheshire £4,192,274 31/01/11 367 0.27 198 0.51
Wm Morrison Supermarkets †
Dalton Philips £4,120,664 31/01/11 361 0.28 194 0.51
Cairn Energy Sir Bill Gammell £4,106,813 31/12/10 360 0.28 194 0.52
Compass Richard Cousins £4,100,801 30/09/10 367 0.27 193 0.52
Royal Dutch Shell Peter Voser £4,084,251 31/12/10 358 0.28 192 0.52
Unilever Paul Polman £4,050,410 31/12/10 355 0.28 191 0.52
AMEC Samir Brikho £3,932,993 31/12/10 345 0.29 185 0.54
ITV Adam Crozier £3,923,997 31/12/10 344 0.29 185 0.54
Investec Stephen Koseff £3,895,325 31/03/11 341 0.29 184 0.54
Randgold Resources* Mark Bristow £3,880,983 31/12/10 340 0.29 183 0.55
BP Dr Tony Hayward £3,842,267 31/12/10 337 0.30 181 0.55
IMI Martin Lamb £3,833,140 31/12/10 336 0.30 181 0.55
Next Lord Wolfson of Aspley Guise
£3,802,400 31/01/11 333 0.30 179 0.56
Barclays † John Varley £3,560,000 31/12/10 312 0.32 168 0.60
Aggreko Rupert Soames £3,476,810 31/12/10 305 0.33 164 0.61
Sage Group Paul Walker £3,404,670 30/09/10 305 0.33 160 0.62
Rexam Graham Chipchase £3,398,479 31/12/10 298 0.34 160 0.62
Associated British Foods George Weston £3,395,998 30/09/10 304 0.33 160 0.62
Man Group Peter Clarke £3,349,290 31/03/11 294 0.34 158 0.63
Intertek Wolfhart Hauser £3,307,467 31/12/10 290 0.34 156 0.64
Imperial Tobacco † Robert Dyrbus £3,283,787 30/09/10 294 0.34 155 0.65
InterContinental Hotels Group
Andrew Coslett £3,264,298 31/12/10 286 0.35 154 0.65
Serco † Christopher Hyman £3,149,950 31/12/10 276 0.36 148 0.67
International Power Philip Cox £3,144,456 31/12/10 276 0.36 148 0.67
Tullow Oil Aidan Heavey £3,123,086 31/12/10 274 0.37 147 0.68
Legal and General † Tim Breedon £3,100,000 31/12/10 272 0.37 146 0.68
Standard Life † David Nish £3,014,326 31/12/10 264 0.38 142 0.70
Johnson Matthey* Neil Carson £2,963,987 31/03/11 260 0.38 140 0.72
G4S † Nick Buckles £2,954,839 31/12/10 259 0.39 139 0.72
Scottish and Southern Energy †
Ian Marchant £2,937,167 31/03/11 257 0.39 138 0.72
Wolseley Ian Meakins £2,912,139 31/07/10 261 0.38 137 0.73
Rolls-Royce Group † Sir John Rose £2,862,404 31/12/10 251 0.40 135 0.74
Vedanta Resources Anil Agarwal £2,789,525 31/03/11 244 0.41 131 0.76
Centrica Sam Laidlaw £2,777,900 31/12/10 243 0.41 131 0.76
3i Group Michael Queen £2,768,251 31/03/11 243 0.41 130 0.77
Land Securities* Francis Salway £2,687,952 31/03/11 236 0.42 127 0.79
British Land* Chris Grigg £2,645,924 31/03/11 232 0.43 125 0.80
United Utilities † Philip Green £2,573,557 31/03/11 226 0.44 121 0.82
Petrofac Ayman Asfari £2,524,296 31/12/10 221 0.45 119 0.84
Smiths Group Philip Bowman £2,460,376 31/07/10 220 0.45 116 0.86
GKN Sir Kevin Smith £2,431,913 31/12/10 213 0.47 115 0.87
Continued…

OneSociety 1�
Company NameCEO remuner-ation (estimate)
Company year end
CEO remu-neration as multiple of National Minimum Wage
National Minimum Wage as percentage of CEO remu-neration
CEO remu-neration as multiple of UK median earnings
UK median earnings as percentage of CEO remu-neration
Lonmin Ian Farmer £2,245,655 30/09/10 201 0.50 106 0.94
Antofagasta Jean-Paul Luksic £2,153,945 31/12/10 189 0.53 102 0.99
Capita Group † Paul Pindar £2,110,585 31/12/10 185 0.54 99 1.01
Inmarsat Andrew Sukawaty £2,076,806 31/12/10 182 0.55 98 1.02
Hammerson David Atkins £2,013,865 31/12/10 177 0.57 95 1.05
Weir Group Keith Cochrane £1,930,421 31/12/10 169 0.59 91 1.10
Kazakhmys David Munro £1,837,000 31/12/10 161 0.62 87 1.16
ARM Holdings Warren East £1,454,441 31/12/10 127 0.78 69 1.46
Resolution Trevor Matthews £1,295,635 31/12/10 114 0.88 61 1.64
Fresnillo Jaime Lomelin £1,236,094 31/12/10 108 0.92 58 1.72
Severn Trent † Tony Wray £1,233,129 31/03/11 108 0.93 58 1.72
Admiral Group Kevin Chidwick £1,099,712 31/12/10 96 1.04 52 1.93
John Wood Group Allister G Langlands £1,068,000 31/12/10 94 1.07 50 1.99
Essar Energy Naresh Nayyar £797,230 31/12/10 70 1.43 38 2.66
Capital Shopping Centres Group*
David Fischel £732,365 31/12/10 64 1.56 35 2.90
Autonomy Corporation Dr Michael Lynch £528,534 31/12/10 46 2.16 25 4.02
Hargreaves Lansdown Peter Hargreaves £405,917 30/06/10 36 2.75 19 5.23
Whitbread Alan Parker n/a 28/02/11 n/a n/a n/a n/a
Average based on totals £4,685,941 408 0.25 219 0.46
* Companies have disclosed their low pay data.
† Low pay data has been found from 3rd party sources.
Important Notes: • All data are estimates and should be treated with caution. Differences in the way that different companies
calculate and report executive pay, and the very scant reporting of low and median pay, means that it is impossible to give definitive figures for companies’ pay levels or ratios. To calculate executive pay, we worked with specialist researchers, but those researchers had to make assumptions about some elements of pay. For example, some payments which were awarded during one financial year will have a different value by the time they are received (e.g. shares); other payments may not be received if company performance does not meet certain targets. Where possible, we have looked at the value of payments awarded (rather than received) during the financial year, which means that those payments may be lower (or higher) than our estimated values once they are received. We have made our assumptions clear in this report and associated materials. Current difficulties in estimating pay levels serve as a strong argument for regulation to ensure more clear and comparable pay reporting .
The full tables of data will be made available on our website shortly after this report is published. In general, the payments included in the calculations which produced the CEO pay data are as follows:
• Basic pay.
• Annual bonus (including any deferred element).
• Pension supplements made as cash payments.
• Golden handshakes (if CEO leaves in latest financial year).
• Other benefits including relocation payments, housing allowances and any other payment listed in main pay section (generally given in annual report as ‘other benefits’, sometimes with footnote).
• Pension contributions: These may be variously presented in the company’s remuneration report as the company contribution to defined contribution pension schemes; or an equivalent cash payment in lieu; or the transfer value (less director’s contributions) of the increase in accrued pension. Where none of these figures is provided, but pension contributions are being made, this has been indicated with a note, but the value has not been shown.
• Long-term share-based incentives: Where published in the remuneration report, information is given on shares provided to company directors under long term incentive plans (LTIPs). The total value of the shares allocated

1� OneSociety
in respect of that year has been shown, not the figure for the value of shares, which the director has received unconditionally during the year following the end of the vesting period. The value was based on the number of shares multiplied by the market price given in the remuneration report. It should be noted that this is an imprecise way of establishing the value of this benefit, as the director may not be awarded the shares released, either because the company’s performance has not met the targets set in the LTIP, or because the director has left the company. In addition the value of the shares may be very different when they are finally released to the director – normally after three years.
• Where share options are awarded, the data includes options awarded in respect of that year, not past options exercised during the year. The value of the option was calculated by subtracting the exercise price from the price of the shares at the time the option was awarded and multiplying the result by the number of shares awarded. As with shares allocated under LTIPs, this calculation may produce a result which does not reflect the actual value of the option when it is exercised.
• The value of dividends on shareholdings has not been included.
• Any conversion from $ or € to £ was calculated using the average rates for the calendar years in question given by the Office for National Statistics website.
• Information is provided for two years on highest paid directors (i.e. to calculate year-on-year changes in remuneration) where individuals have been in post for both of those years, or at least part of the earlier year. If individuals have only been in post for one year, information is provided for that year only. Adjustments have not made any for part years.
• Our data has slightly fewer than 100 companies shown, due to one company not having London listed status until recently, and others having more than one type of shares in the FTSE 100.
Notes on UK employee’s pay calculations: • National minimum wage is as at the adult rate (i.e for employees aged 21 and above) that applied on the last
working day of the company’s accounting year (the year for which total CEO remuneration is given). We have converted hourly rates into yearly rates using an assumed 37 hour week (based on ASHE data for median working hours in 2010).
• UK median earnings are as shown in ASHE data for 2010.

OneSociety 1�
FTSE 100 Companies: CEO remuneration compared to company performance and size
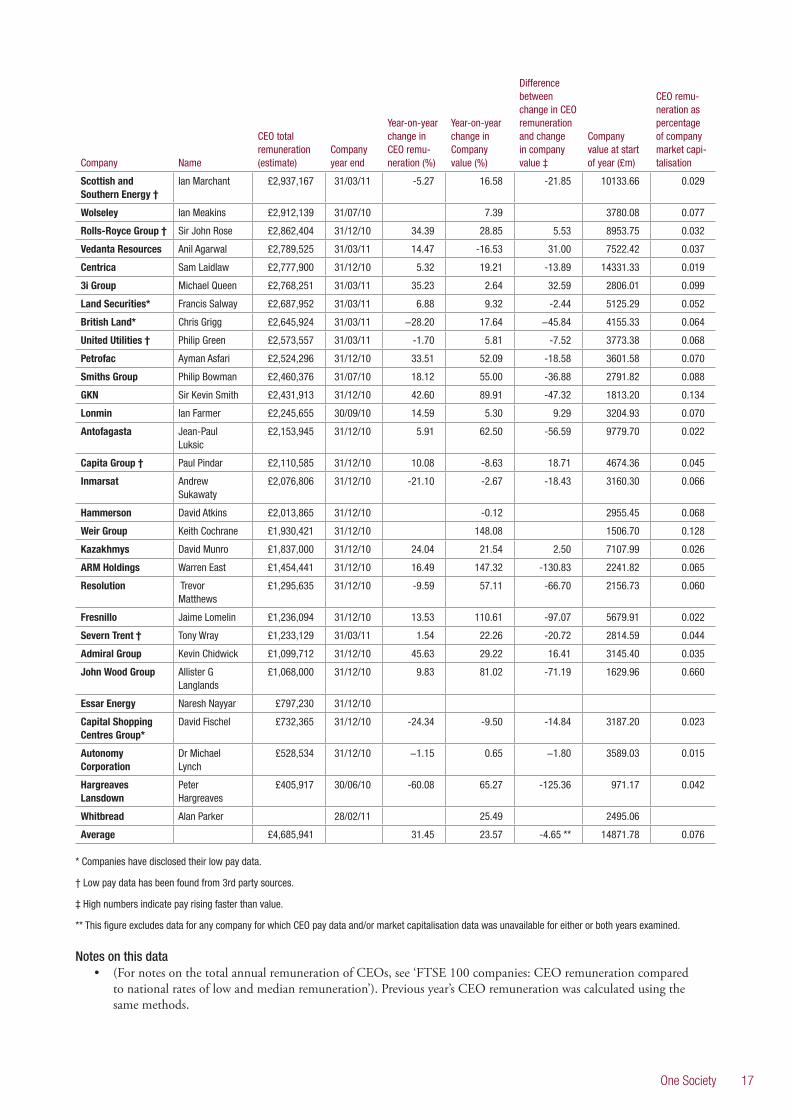
The data below compare estimated CEO remuneration with company performance (measured by year-on year changes in the value of the company) and with the value of the company at the beginning of the company’s reporting year.
We find that there were large year-on-year rises in average estimated executive remuneration. We also find very wide variations in the relationship between executive pay and company performance, as well as in the relationship between executive pay and company value (with the estimated total remuneration of one CEO equalling 0.425% of company value).
We also find no correlation between changes in company value and changes in CEO pay.
Overall, rises in CEO pay have outstripped rises in company value.
This suggests that high executive pay and incentives are not particularly effective in improving company performance in the short term (and other evidence, cited in this report, suggests that they have not been particularly effective in the longer term either).
Company Name
CEO total remuneration (estimate)
Company year end
Year-on-year change in CEO remu-neration (%)
Year-on-year change in Company value (%)
Difference between change in CEO remuneration and change in company value ‡
Company value at start of year (£m)
CEO remu-neration as percentage of company market capi-talisation
Reckitt Benckiser Bart Becht £14,402,000 31/12/10 -0.81 7.48 -8.29 23772.52 0.061
Burberry Angela Ahrendts £13,142,498 31/03/11 152.08 64.31 87.77 3090.89 0.425
Vodafone Vittorio Colao £12,851,499 31/03/11 26.58 14.02 12.56 79996.44 0.016
Smith & Nephew David Illingworth £10,460,758 31/12/10 3.33 5.79 -2.46 5676.71 0.184
BHP Billiton Marius Kloppers £10,161,721 30/06/10 0.06 28.63 -28.57 30103.58 0.034
Reed Elsevier Erik Engstrom £9,746,103 31/12/10 177.28 5.87 171.41 6201.28 0.157
BG † Sir Frank Chapman
£9,661,402 31/12/10 -4.22 8.27 -12.49 40328.43 0.024
Xstrata Mick Davis £9,155,545 31/12/10 33.08 34.02 -0.95 32744.42 0.028
Shire Angus Russell £9,002,396 31/12/10 54.50 27.52 26.98 6768.04 0.133
British American Tobacco
Paul Adams £8,974,836 31/12/10 106.28 22.17 84.11 40260.20 0.022
Marks and Spencer* Marc Bolland £8,781,996 31/03/11 -9.02 5871.56 0.150
Standard Chartered Mike Rees £8,505,991 31/12/10 −13.00 27.09 −40.08 31667.25 0.027
HSBC Holdings Michael Geoghegan
£8,475,484 31/12/10 49.35 -7.06 56.41 123361.52 0.007
GlaxoSmithKline Andrew Witty £8,347,365 31/12/10 -14.07 -6.03 -8.05 69147.52 0.012
Diageo † Paul Walsh £7,914,582 30/06/10 45.76 21.63 24.13 21950.61 0.036
WPP Sir Martin Sorrell £7,798,777 31/12/10 64.40 29.53 34.87 7670.55 0.102
ICAP Michael Spencer £7,637,619 31/03/11 88.73 43.43 45.29 2443.86 0.313
AstraZeneca † David Brennan £7,415,125 31/12/10 20.80 -0.47 21.27 42202.62 0.018
Experian Don Robert £7,393,951 31/03/11 16.62 18.72 -2.11 6616.66 0.112
Pearson Dame Marjorie Scardino
£7,160,273 31/12/10 35.84 13.13 22.71 7168.21 0.100
British Sky Broadcasting
Jeremy Darroch £7,062,661 30/06/10 39.40 53.96 -14.56 7975.43 0.089
Tesco*† Sir Terry Leahy £6,830,883 28/02/11 3.43 -2.70 6.13 33033.89 0.021
RSA Insurance Group*†
Andy Haste £6,499,875 31/12/10 20.18 6.27 13.91 4063.73 0.160
Old Mutual* Julian Roberts £6,395,214 31/12/10 183.26 15.03 168.24 5807.68 0.110
Prudential Clark Manning £6,246,766 31/12/10 -11.29 4.38 -15.67 16151.78 0.039
BT † Ian Livingston £6,209,180 31/03/11 25.03 49.80 -24.77 9581.22 0.065
SABMiller Graham Mackay £5,873,952 31/03/11 -12.90 14.26 -27.16 30322.24 0.019
Royal Bank of Scotland
Stephen Hester £5,850,432 31/12/10 70.92 37.97 32.95 16553.06 0.035
Continued…

1� OneSociety
Company Name
CEO total remuneration (estimate)
Company year end
Year-on-year change in CEO remu-neration (%)
Year-on-year change in Company value (%)
Difference between change in CEO remuneration and change in company value ‡
Company value at start of year (£m)
CEO remu-neration as percentage of company market capi-talisation
Lloyds Banking Group
Eric Daniels £5,831,250 31/12/10 82.74 38.35 44.39 32326.95 0.018
Rio Tinto Tom Albanese £5,749,209 31/12/10 77.63 32.35 45.28 51774.60 0.011
BAE Systems † Ian King £5,724,014 31/12/10 1.91 -11.29 13.20 12676.35 0.045
Eurasian Natural Resources
Felix Vulis £5,428,660 31/12/10 153.91 14.54 139.38 11782.91 0.046
Anglo American* Cynthia Carroll £5,277,249 31/12/10 32.31 23.92 8.39 35690.14 0.015
Schroders Michael Dobson £5,153,559 31/12/10 9.34 38.77 -29.44 3654.73 0.141
TUI Travel Peter Long £5,060,992 30/09/10 -23.43 -15.79 -7.64 2846.46 0.178
J Sainsbury † Justin King £4,679,903 31/03/11 −11.34 3.37 −14.72 6051.72 0.077
National Grid Steve Holliday £4,588,399 31/03/11 3.23 30.97 -27.74 15701.76 0.029
Carnival plc Micky Arison £4,507,643 30/11/10 412.52 28.73 383.79 4329.05 0.104
Aviva Andrew Moss £4,328,022 31/12/10 12.38 1.16 11.22 10898.29 0.040
Kingfisher* Ian Cheshire £4,192,274 31/01/11 0.54 18.70 −18.16 4972.83 0.084
Wm Morrison Supermarkets †
Dalton Philips £4,120,664 31/01/11 -6.88 7602.55 0.054
Cairn Energy Sir Bill Gammell £4,106,813 31/12/10 -28.49 26.40 -54.88 4643.44 0.088
Compass Richard Cousins £4,100,801 30/09/10 16.19 40.16 -23.97 7113.81 0.058
Royal Dutch Shell Peter Voser £4,084,251 31/12/10 15.29 115977.44 0.004
Unilever Paul Polman £4,050,410 31/12/10 -8.92 -1.55 -7.36 25616.22 0.016
AMEC Samir Brikho £3,932,993 31/12/10 12.92 45.20 -32.28 2625.69 0.150
ITV Adam Crozier £3,923,997 31/12/10 33.81 2035.96 0.193
Investec Stephen Koseff £3,895,325 31/03/11 46.44 1.52 44.92 2527.62 0.154
Randgold Resources*
Mark Bristow £3,880,983 31/12/10 -11.67 5.69 -17.36 5489.52 0.071
BP Dr Tony Hayward £3,842,267 31/12/10 -58.19 -22.41 -35.78 113056.04 0.003
IMI Martin Lamb £3,833,140 31/12/10 63.45 82.26 -18.80 1659.58 0.231
Next Lord Wolfson of Aspley Guise
£3,802,400 31/01/11 23.17 -4.21 27.39 3773.67 0.101
Barclays † John Varley £3,560,000 31/12/10 217.01 0.19 216.82 31441.89 0.011
Aggreko Rupert Soames £3,476,810 31/12/10 37.25 61.10 -23.85 2518.32 0.138
Sage Group Paul Walker £3,404,670 30/09/10 16.72 18.38 -1.66 3054.28 0.111
Rexam Graham Chipchase
£3,398,479 31/12/10 252.34 14.49 237.85 2543.68 0.134
Associated British Foods
George Weston £3,395,998 30/09/10 43.35 23.85 19.50 6708.24 0.051
Man Group Peter Clarke £3,349,290 31/03/11 −45.60 11.60 −57.20 4132.94 0.081
Intertek Wolfhart Hauser £3,307,467 31/12/10 30.27 42.89 -12.62 1971.53 0.168
Imperial Tobacco † Robert Dyrbus £3,283,787 30/09/10 30.57 4.92 25.65 18381.72 0.018
InterContinental Hotels Group
Andrew Coslett £3,264,298 31/12/10 10.07 39.19 -29.13 2555.14 0.128
Serco † Christopher Hyman
£3,149,950 31/12/10 9.71 4.81 4.90 2591.59 0.122
International Power Philip Cox £3,144,456 31/12/10 -3.11 42.89 -12.62 1971.53 0.168
Tullow Oil Aidan Heavey £3,123,086 31/12/10 2.61 6.86 -4.24 10440.79 0.030
Legal and General † Tim Breedon £3,100,000 31/12/10 7.49 20.04 -12.55
Standard Life † David Nish £3,014,326 31/12/10 1.88 4791.12 0.063
Johnson Matthey* Neil Carson £2,963,987 31/03/11 18.32 6.53 11.79 3748.24 0.079
G4S † Nick Buckles £2,954,839 31/12/10 -7.81 -2.30 -5.51 3669.75 0.081
Continued…
OneSociety 1�
Company Name
CEO total remuneration (estimate)
Company year end
Year-on-year change in CEO remu-neration (%)
Year-on-year change in Company value (%)
Difference between change in CEO remuneration and change in company value ‡
Company value at start of year (£m)
CEO remu-neration as percentage of company market capi-talisation
Scottish and Southern Energy †
Ian Marchant £2,937,167 31/03/11 -5.27 16.58 -21.85 10133.66 0.029
Wolseley Ian Meakins £2,912,139 31/07/10 7.39 3780.08 0.077
Rolls-Royce Group † Sir John Rose £2,862,404 31/12/10 34.39 28.85 5.53 8953.75 0.032
Vedanta Resources Anil Agarwal £2,789,525 31/03/11 14.47 -16.53 31.00 7522.42 0.037
Centrica Sam Laidlaw £2,777,900 31/12/10 5.32 19.21 -13.89 14331.33 0.019
3i Group Michael Queen £2,768,251 31/03/11 35.23 2.64 32.59 2806.01 0.099
Land Securities* Francis Salway £2,687,952 31/03/11 6.88 9.32 -2.44 5125.29 0.052
British Land* Chris Grigg £2,645,924 31/03/11 −28.20 17.64 −45.84 4155.33 0.064
United Utilities † Philip Green £2,573,557 31/03/11 -1.70 5.81 -7.52 3773.38 0.068
Petrofac Ayman Asfari £2,524,296 31/12/10 33.51 52.09 -18.58 3601.58 0.070
Smiths Group Philip Bowman £2,460,376 31/07/10 18.12 55.00 -36.88 2791.82 0.088
GKN Sir Kevin Smith £2,431,913 31/12/10 42.60 89.91 -47.32 1813.20 0.134
Lonmin Ian Farmer £2,245,655 30/09/10 14.59 5.30 9.29 3204.93 0.070
Antofagasta Jean-Paul Luksic
£2,153,945 31/12/10 5.91 62.50 -56.59 9779.70 0.022
Capita Group † Paul Pindar £2,110,585 31/12/10 10.08 -8.63 18.71 4674.36 0.045
Inmarsat Andrew Sukawaty
£2,076,806 31/12/10 -21.10 -2.67 -18.43 3160.30 0.066
Hammerson David Atkins £2,013,865 31/12/10 -0.12 2955.45 0.068
Weir Group Keith Cochrane £1,930,421 31/12/10 148.08 1506.70 0.128
Kazakhmys David Munro £1,837,000 31/12/10 24.04 21.54 2.50 7107.99 0.026
ARM Holdings Warren East £1,454,441 31/12/10 16.49 147.32 -130.83 2241.82 0.065
Resolution Trevor Matthews
£1,295,635 31/12/10 -9.59 57.11 -66.70 2156.73 0.060
Fresnillo Jaime Lomelin £1,236,094 31/12/10 13.53 110.61 -97.07 5679.91 0.022
Severn Trent † Tony Wray £1,233,129 31/03/11 1.54 22.26 -20.72 2814.59 0.044
Admiral Group Kevin Chidwick £1,099,712 31/12/10 45.63 29.22 16.41 3145.40 0.035
John Wood Group Allister G Langlands
£1,068,000 31/12/10 9.83 81.02 -71.19 1629.96 0.660
Essar Energy Naresh Nayyar £797,230 31/12/10
Capital Shopping Centres Group*
David Fischel £732,365 31/12/10 -24.34 -9.50 -14.84 3187.20 0.023
Autonomy Corporation
Dr Michael Lynch
£528,534 31/12/10 −1.15 0.65 −1.80 3589.03 0.015
Hargreaves Lansdown
Peter Hargreaves
£405,917 30/06/10 -60.08 65.27 -125.36 971.17 0.042
Whitbread Alan Parker 28/02/11 25.49 2495.06
Average £4,685,941 31.45 23.57 -4.65 ** 14871.78 0.076
* Companies have disclosed their low pay data.
† Low pay data has been found from 3rd party sources.
‡ High numbers indicate pay rising faster than value.
** This figure excludes data for any company for which CEO pay data and/or market capitalisation data was unavailable for either or both years examined.
Notes on this data• (For notes on the total annual remuneration of CEOs, see ‘FTSE 100 companies: CEO remuneration compared
to national rates of low and median remuneration’). Previous year’s CEO remuneration was calculated using the same methods.

1� OneSociety
• Where no data is shown for a company under ‘Year-on-year change in CEO remuneration’ this is usually because the individual was not in post for all or part of the two years under consideration. Previous year’s CEO remuneration was calculated using same methods as for latest year.
• ‘Company value’ refers to market capitalisation. This was calculated using the data for the month end immediately prior to the beginning of the company’s reporting year and the month end immediately prior to the end of the company’s reporting year (using London Stock Exchange records). Market capitalisation is shown in London Stock Exchange value only – i.e. any market capitalisation associated with listings on other markets have not been shown.
• ‘Change in company value’ is the difference between market capitalisation on the last working day of the month immediately preceding the beginning of the company’s reporting year compared to market capitalisation one year later.
• The ‘difference between change in CEO remuneration and change in company value’ was calculated by subtracting the percentage change in market capitalisation from the percentage change in CEO pay. Positive figures indicate that pay increased more than company value, negative figures indicate that company value increased more than CEO pay.
• Some data is missing for some companies, mainly in cases where individuals were not in post for the full two years under consideration.

OneSociety 1�
FTSE 100 Companies: Which sectors pay their CEOs the most?
The table shows wide variation in different sectors’ estimated average CEO remuneration, from £8.3 million (pharmaceuticals and biotech) to £2.0 million (software and computer services).
The data also show wide variation in the relationship between estimated CEO remuneration and company performance.
Estimated pay outstrips performance most markedly in the General Industrials sector, while performance most outstripped pay in the oil equipment and services sector.
Sector
Average CEO remuneration (estimate)
CEO remuneration as multiple of National Minimum Wage
National Minimum Wage as percentage of CEO remu-neration
CEO remuneration as multiple of UK Median earnings
UK Median earnings as percentage of CEO remuneration
Difference between change in CEO pay vs change in market cap ‡
Pharmaceuticals & Biotechnology
£8,254,962 724 0.14 389 0.26 13.40
Media £7,941,954 700 0.14 374 0.27 53.61
Mobile Telecommunications
£7,464,152 654 0.15 352 0.28 -2.94
Beverages £6,894,267 611 0.16 325 0.31 -1.51
Banks £6,444,631 565 0.18 304 0.33 62.10
Tobacco £6,129,311 543 0.18 289 0.35 54.88
Oil Equipment & Services
£5,279,228 463 0.22 249 0.40 -40.68
Gas, Water & Multiutilities
£5,224,612 458 0.22 246 0.41 -22.91
Oil & Gas Producers £5,183,392 454 0.22 244 0.41 -26.85
Food & Drug Retailers
£4,897,435 429 0.23 231 0.43 -4.29
Mining £4,537,781 399 0.25 214 0.47 3.21
Aerospace & Defense
£4,293,209 376 0.27 202 0.49 9.37
Life Insurance £4,273,127 375 0.27 201 0.50 16.91
Travel & Leisure £4,167,923 369 0.27 196 0.51 80.76
General Retailers £3,997,337 350 0.29 188 0.53 4.61
Nonlife Insurance £3,799,793 333 0.30 179 0.56 15.16
Financial Services £3,770,350 340 0.29 178 0.56 -14.86
Food Producers £3,723,204 330 0.30 175 0.57 6.07
Support Services £3,705,098 325 0.31 175 0.57 -3.41
General Industrials £2,929,427 260 0.39 138 0.72 100.48
Real Estate Investment Trusts
£2,022,080 177 0.56 95 1.05 -21.04
Software & Computer Services
£1,966,602 174 0.57 93 1.08 -1.73
FTSE average £4,685,941
‡ High numbers indicate pay rises outstripped by rising market cap.
Continued…

�0 OneSociety
Sectors containing only one FTSE 100 company
SectorAverage CEO remu-neration (estimate)
CEO remuneration as multiple of National Minimum Wage
National Minimum Wage as per-centage of CEO remuneration
CEO remuneration as multiple of UK Median earnings
UK Median earnings as percentage of CEO remuneration
Difference between change in CEO pay vs change in market cap‡
Automobiles & Parts £2,431,913 213 0.47 115 0.87 -47.32
Chemicals £2,963,987 260 0.38 140 0.72 11.79
Electricity £2,937,167 257 0.39 138 0.72 -21.85
Fixed Line Telecommunications
£6,209,180 544 0.18 293 0.34 -24.77
Health Care Equipment & Services
£10,460,758 917 0.11 493 0.20 -2.46
Household Goods & Home Construction
£14,402,000 1262 0.08 679 0.15 -8.29
Industrial Engineering £3,833,140 336 0.30 181 0.55 -18.80
Personal Goods £13,142,498 1152 0.09 619 0.16 87.77
Technology Hardware & Equipment
£1,454,441 127 0.78 69 1.46 -130.83
FTSE average £4,685,941
‡ High numbers indicate pay rises outstripped by rising market cap.
Notes on this data:• All data should be regarded as estimates. For notes on the total annual remuneration of CEOs, see ‘FTSE 100
Companies: CEO remuneration compared to national rates of low and median remuneration’.
• Sector classifications are those used by the London Stock Exchange.
• Sectors which included only one FTSE 100 company have been separated out.
• National minimum wage is calculated at the adult rate (i.e for employees aged 21 and above) that applied on the last working day of the company’s accounting year (the year for which total CEO remuneration is given) we have converted hourly rates into yearly rates using an assumed 37 hour week (based on ASHE data for median working hours in 2010).
• UK median earnings are as shown in ASHE data for 2010.

OneSociety �1
The Public Services Industry
The Public Services Industry was defined by Dr. DeAnne Julius as “All private and third sector enterprises that provide services to the public on behalf of government or to the government itself. The enterprises covered by this definition of PSI depend in whole or in part on revenues contracted through government and in turn derived from taxation” 15.
The following data refer to a selection of companies within the FTSE 100 and the FTSE 250 with notable public contracts (examples of which are shown later in this section). There is wide variance in the proportion of company revenues which come from public-sector sources.
None of these companies disclosed usable data on the pay of their lowest-paid UK employees in response to our request.
These companies typically paid their executives much more than the highest-paid public sector employee. For example Serco, which receives over 90% of its business from the public sector, paid Christopher Hyman an estimated £3,149,950 in 2010. This is 6 times more than the highest-paid UK public servant, 11 times more than the highest-paid UK local authority CEO and 276 times the contemporary rate of adult National Minimum Wage (approximately 50% of Serco’s public sector business is outside the UK).
Pay for CEOs in this group grew by an estimated 6.49% year on-year.
In contrast to the suggestion that no-one in a public sector organisation should earn more than 20 times more than their lowest-paid colleague 16, none of the ‘public service industry’ organisations we examined paid their CEO less than 59 times UK median earnings (estimate).
In the subsection below, ‘Public service industry companies for which low pay data is available’, we have estimates of top-to-bottom pay ratios for certain public service industry companies (total CEO pay compared to basic low pay).
Company ^ NameCompany year end
CEO total remuneration (estimate)
CEO remu-neration as multiple of National Minimum Wage
CEO remu-neration as multiple of UK median earnings
National Minimum Wage as percentage of CEO remuner-ation
UK median earnings as percentage of CEO remuner-ation
CEO remu-neration as multiple of highest-paid public-sector employee
CEO remu-neration as multiple of highest -paid local authority CEO
Difference between change in CEO pay vs change in market cap‡
Babcock International Group*
Peter Rogers 31/03/11 £2,335,997 205 110 0.49 0.91 4 8 -43.05
Balfour Beatty*
Ian Tyler 31/12/10 £1,951,470 171 92 0.58 1.09 4 7 -17.59
Bovis Homes Group*
David Ritchie
31/12/10 £1,255,907 110 59 0.91 1.69 2 4 11.17
BT Group Ian Liv-ingston
31/03/11 £6,209,180 544 293 0.18 0.34 12 21 -24.77
Capita Group Paul Pindar 31/12/10 £2,110,585 185 99 0.54 1.01 4 7 18.71
Carillion* John McDonough
31/12/10 £2,023,309 177 95 0.56 1.05 4 7 -33.33
Compass Group
Richard Cousins
30/09/10 £4,100,801 367 193 0.27 0.52 8 14 -23.97
G4S Nick Buckles 31/12/10 £2,954,839 259 139 0.39 0.72 6 10 -5.51
MITIE Group*
Ruby McGregor-Smith
31/03/11 £2,222,999 195 105 0.51 0.95 4 7 19.36
Rentokil Initial*
Alan Brown 31/12/10 £2,539,000 223 120 0.45 0.84 5 8 -12.27
Serco Group Christopher Hyman
31/12/10 £3,149,950 276 148 0.36 0.67 6 11 4.90
Shanks Group*
Tom Drury 31/03/11 £1,259,254 110 59 0.91 1.69 2 4 37.36
^ Brief company profiles for the companies listed are shown at the end of this section.
* Companies with an asterisk were FTSE 250 companies as at the beginning of July 2011.
‡ High numbers indicate pay rises outstripped by rising market cap.

�� OneSociety
Notes on this data:• All data should be regarded as estimates.
• For notes on the total annual remuneration of CEOs, see ‘FTSE 100 Companies: CEO remuneration compared to national rates of low and median remuneration’.
• National minimum wage is as at the adult rate (i.e for employees aged 21 and above) that applied on the last working day of the company’s accounting year (the year for which total CEO remuneration is given) we have converted hourly rates into yearly rates using an assumed 37 hour week (based on ASHE data for median working hours in 2010).
• UK median earnings are as shown in ASHE data for 2010.
• Figures for the pay of public sector employees are calculated using the data shown in the subsection below (How CEO pay in the public service industry compares to the pay of public-sector employees).
How CEO pay in the public service industry compares to the pay of public-sector employees.
Name and role Total remuneration* Year endingTony Fountain; Chief Executive, Nuclear Decommissioning Authority. (Highest-paid public servant).
Between £522,460.00 and £527,459.00 31 March 2010
Sir David Nicholson: Chief Executive, NHS. Between £275,000.00 and £279,999.00 31 March 2010Sir Gus O’Donnell; Cabinet Secretary and Head of the Home Civil Service.
Between £235,000 and £239,999.00 31 March 2010
Paul Martin; Chief Executive, London Borough of Wandsworth. Highest paid local authority CEO).
£299,925 2010(?)
* Data on remuneration of Mr Tony Fountain, Sir David Nicholson and Sir Gus O’Donnell is from Cabinet Office figures (‘Senior Officials ‘high earners’ salaries’ 17). We understand from the Cabinet Office Press office that these figures include base pay, taxable benefits and bonuses. Data on the remuneration of Mr Paul Martin is from Incomes Data Services 18.
Public service industry companies for which low pay data is available
Notes: • This data is not a like-for-like comparison: ‘CEO total remuneration’ includes pension payments, bonuses
etc, whereas low pay data (basic pay) does not. While it would be possible to use the basic pay of CEOs as a comparator, this would be more misleading than using total remuneration, because basic pay makes up a much smaller proportion of total remuneration of CEOs than it does for other employees, and there are numerous cases (not necessarily in companies listed here) in which low-paid employees receive no remuneration other than basic pay.
• (On the other hand, other factors associated with data sourcing will tend to under-represent the scale of the pay gap: It is possible that there were employees in all or some of the companies shown whose pay was lower than that shown, but for whom data was not visible to our research partners. It is also the case that employees whose pay is decided by collective bargaining is higher than for employees whose pay is not decided by such agreements (i.e. for companies not shown here)).
• Where data was originally shown as hourly rates, the figures have been multiplied by the number of hours stated as the standard working week in the relevant agreement. However, we cannot guarantee that the rates shown in the figures above relate to full-time staff (i.e. the ratio may be misleadingly large in some cases). Minor distortions are possible due to rounding and conversion from weekly or hourly rates into annual rates.
• All figures should be regarded as estimates. We cannot guarantee the accuracy of data from third-party sources.
• In all cases, the stated pay rate is the basic pay for the relevant grade – if the grade had a minimum and a maximum, the minimum figure is used. It cannot be guaranteed that the pay rate applied to any individuals in practice.
• The data does not necessarily apply to staff directly involved in public sector contracts.
• The gaps in available data constitute a strong argument for mandatory and comparable reporting of data: pay rates in the public service industry are a clear matter of public interest due to the potential taxpayer costs of subsidising low pay, as well as the best value considerations of top pay and of pay dispersion.

OneSociety ��
Babcock InternationalFor the period from 7th April 2010 staff in the ‘Babcock Rail’ bargaining unit were subject to a pay deal which included annual minimum pay equivalent to £12081.16. This was equivalent to 0.52% of the total estimated remuneration of Babcock’s chief executive during the same year.
Balfour Beatty:For the period from 1st April 2010 Balfour Beatty staff working at the DWP were subject to a pay deal which included an annual minimum pay equivalent to £12474.80. This was equivalent to 0.64% of the total estimated remuneration of Balfour Beatty’s chief executive during the same year.
BT:For the period from 1st January 2011 staff in the ‘BT (New GRID grades)’ bargaining unit were subject to a pay deal which included an annual minimum pay equivalent to £12048.92 This was equivalent to 0.19% of the total estimated remuneration of BT’s chief executive during the same year.
Capita:For the period from 1st April 2010 staff in the ‘Capita Life and Pensions’ bargaining group were subject to a pay deal which included an annual minimum pay equivalent to £14250.08 This was equivalent to 0.68% of the total estimated remuneration of Capita’s chief executive during the same year.
Carillion:Data for the year ending December 2010 was not visible. For the period from 1st April 2009 the ‘Trackman Basic’ grade in The ‘Carillion Rail’ bargaining unit was subject to a pay deal which included an annual minimum pay equivalent to £12082.72 pa. This was equivalent to 0.57% of the total estimated remuneration of Carillon’s chief executive during the same year.
G4SFor the period from 1st May 2010 staff in the ‘G4S Cash Solutions (UK) Ltd (Operational Staff)’ bargaining unit (covering cashiers etc) were subject to a pay deal which included an annual minimum pay equivalent to £14601.60: this was equivalent to 0.49% of the total estimated remuneration of G4S’s chief executive during the same year.
Serco: The lowest pay rate for Serco employees which was visible to our research partners in the period from 1st January 2010 was £35506.76 (for Passenger Service Agents on Docklands Light Railway). This is highly unlikely to represent the lowest basic pay in the company. Other data shows that for the period from 1st April 2009 electricians in the Serco Integrated Services bargaining unit were subject to a pay deal with a minimum rate of £10357.88pa: this was equivalent to 0.36% of the total estimated remuneration of Serco’s chief executive during the same year.
Brief company profiles
Babcock International GroupThe UK’s leading engineering support services organisation, it works in defence, energy, telecommunications, transport and education. According to its website “Key activities include base porting, refitting, refuelling and decommissioning submarines; maintaining and refitting warships; building the next generation aircraft carriers; maintaining naval bases; and providing equipment support and training […] A major support provider to all three Armed Forces delivering leading-edge training and asset support [...] delivers a broad range of training and support services [...] including government departments, police authorities, fire and rescue authorities, local authorities and international companies” 19.
Balfour BeattyAccording to Balfour Beatty’s website they are a leading global infrastructure business. This includes investment, project design, financing and management, engineering and construction, and facilities management services. They work in defence, health, education, roads, rail, airports, water, power and commercial buildings 20.
Bovis Homes GroupAccording to Bovis Homes 2010 annual report “The Group’s business involves the design, build and sales of new homes for both private and public sector customers” 21.
BT GroupAccording to BT’s annual report “We are a leading communications services provider, selling products and services to consumers, small and medium sized enterprises and the public sector” 22. Bloomberg’s company profile states “The BT Global Services segment provides managed networked IT services to national and local government organizations” 23.

�� OneSociety
CapitaAccording to Capita’s website, they are the UK’s leading outsourcing company, providing insurance, government software, property and infrastructure consultancy, financial services, absence management, businesses travel and conferences, health provision, HR, IT services, local government training and consultancy, benefits and council tax administration 24.
Compass GroupAccording to Compass Group’s website “The range of services we provide includes: Cleaning, Building Operations & Maintenance, Business & Office Services, Logistics & Transport, Outdoor, Project Management, Security. [...] We provide everything from free-flow restaurants to formal dining, grab and go deli and café outlets to hospitality services and vending [...] a range of support services such as cleaning, reception services and building maintenance” 25.
Carillion According to Bloomberg’s company overview Carillion are, “A support services company.... involves in public private partnership projects in various sectors, including defense, health, education, transport, and secure and other government accommodation, as well as provides a range of asset-based services for central and local government... involves in provision of construction services comprising management and operation of building and infrastructure consisting of schools, hospitals, military accommodation facilities, prisons, roads, and railways” 26.
G4SAccording to the G4S website “We work in partnership with governments, businesses and other organisations to provide integrated solutions to security challenges [...]G4S plays an important role in society by helping to ensure that governments are able to meet the expectations of their citizens, employees and legislative bodies”. Services include guarding airports, operating custody facilities (including prisons), electronic security systems, land-mine clearance, ordnance management and training services 27. It is also helping to run the government’s ‘welfare to work’ scheme 28.
MITIE GroupAccording to Ruby McGregor-Smith, Mitie’s CEO “We have been appointed to several large public sector frameworks and have a strong pipeline of opportunities in local government, social housing, justice and health” 29. “Amongst MITIE’s list of public sector contracts are a new immigration centre contract with the Home Office, a cleaning and waste contract with the Scottish Government, and others with the National Assembly for Wales and various local councils” 30.
Rentokil InitialAccording to Rentokil’s website, “We provide a fully integrated facilities management to government and commercial sector organisations of all sizes across all business sectors. We have comprehensive service capabilities in the fields of catering, cleaning, security, buildings M&E and statutory compliance” 31.
SERCO GroupAccording to the company’s website, “Serco’s principal customer base is the public sector, representing over 90% of our business”. Serco has extensive public sector contracts in the UK and elsewhere, including “Docklands Light Railway […] IT & BPO outsourcing, local government, home affairs, defence, science, nuclear, health, education, welfare to work” 32
(approximately 50% of Serco’s public sector business is outside the UK).
Shanks GroupShanks is a waste and resource management company. According to its website “Shanks has worked with local authorities for many years, developing new solutions for tackling waste” 33.

OneSociety ��
The high street
The companies shown below were constituents of the FTSE 100 or FTSE 250 as at 1st July 2011, in the ‘general retailers’ or ‘food and drug retailers’ sectors.
‘General retailers’ have an estimated average CEO remuneration of £4.0 million, ‘food and drug retailers’ £4.9 million. The FTSE 100 average is £4.7 million.
Estimated top-to-bottom pay ratios in high street companies which disclosed low pay data are relatively high (an average of 523:1, compared to an average of 262:1 for all companies who disclosed) and range from 349:1 (Kingfisher) to 656:1 (Marks and Spencer).
Company Name
CEO total remuneration (estimate)
Company year end
CEO remu-neration as multiple of National Minimum Wage
National Minimum Wage as percentage of CEO remu-neration
CEO remu-neration as multiple of UK median earnings
UK median earnings as percentage of CEO remu-neration
Difference between change in CEO pay vs change in market cap ‡
Marks & Spencer Group
Marc Bolland £8,781,996 31/03/11 770 0.13 414 0.24 n/a
Tesco Sir Terry Leahy £6,830,883 28/02/11 599 0.17 322 0.31 6.13
Home Retail Group (own Argos & Homebase)*
Terry Duddy £4,761,997 28/02/11 417 0.24 224 0.45 95.30
JD Sports Fashion*
Peter Cowgill £4,679,903 31/01/11 410 0.24 221 0.45 -28.70
Kingfisher (own B&Q)
Ian Cheshire £4,192,274 31/01/11 367 0.27 198 0.51 -18.16
Wm. Morrison Supermarkets
Dalton Philips £4,120,664 31/01/11 361 0.28 194 0.51 n/a
Next Group Lord Wolfson of Aspley Guise
£3,802,400 31/01/11 333 0.30 179 0.56 27.39
WH Smith* Kate Swann £2,558,998 31/08/10 229 0.44 121 0.83 62.16
J. Sainsbury Justin King £1,943,000 31/03/11 170 0.59 92 1.09 -14.72
Sports Direct International*
Dave Forsey £1,793,000 30/04/10 161 0.62 84 1.18 41.29
Dixons Retail* John Browett £1,558,152 30/04/11 137 0.73 73 1.36 45.06
Debenhams* Rob Tem-pleman
£1,477,607 31/08/10 132 0.76 70 1.44 45.98
Mothercare* Ben Gordon £1,279,997 31/03/11 112 0.89 60 1.66 85.64
Halfords Group * David Wild £1,248,868 31/03/11 109 0.91 59 1.70 -17.57
Greggs* Kennedy McMeikan
£1,169,696 31/12/10 103 0.98 55 1.81 75.24
Carpetright* Lord Harris £522,000 31/03/11 46 2.19 25 4.07 -29.17
* Companies with an asterisk were FTSE 250 companies as at the beginning of July 2011.
‡ High numbers indicate pay rises outstripped by rising market cap.
Notes on this data: • All data should be regarded as estimates.
• For notes on the total annual remuneration of CEOs, see ‘FTSE 100 Companies: CEO remuneration compared to national rates of low and median remuneration’.
• National minimum wage is as at the adult rate (i.e for employees aged 21 and above) that applied on the last working day of the company’s accounting year (the year for which total CEO remuneration is given) we have converted hourly rates into yearly rates using an assumed 37 hour week (based on ASHE data for median working hours in 2010).
• UK median earnings are as shown in ASHE data for 2010.

�� OneSociety
High street companies which disclosed low pay dataAs shown in the section on ‘Companies which disclosed remuneration information for their lowest-paid direct UK employee’, three high street names disclosed low-pay data which could be used to calculate ratios. These companies were:
• Kingfisher had total estimated lowest pay of £12,026 (0.29% of estimated total CEO remuneration)
• Marks and Spencer had total estimated lowest pay of £13,396 (0.15% of estimated total CEO remuneration)
• Tesco had total estimated lowest pay of £12,073 (0.18% of estimated total CEO remuneration)
These figures should be regarded as estimates. Some payments disclosed by the above companies were not included in our calculations: these are shown in the section on ‘Companies which disclosed remuneration information for their lowest-paid direct UK employee’. Please also refer to that section for notes on the data.
High street companies for which low pay data is available from third party sourcesAs shown in the section on ‘Companies for which estimated low pay data is available from third party sources’, data on low pay was available for four high street names. These companies were:
• Home Retail Group had estimated minimum basic pay of £12,561 (0.26% of estimated total CEO remuneration).
• J Sainsbury had estimated minimum basic pay of £12,918 (0.28% of estimated total CEO remuneration).
• Tesco had estimated minimum basic pay of £11,673 (0.17% of estimated total CEO remuneration). This is very slightly higher than the lowest basic pay rates disclosed to us by Tesco, probably due to differences in estimation methods.
• Wm Morrison Supermarkets had estimated minimum basic pay of £11,864 (0.26% of estimated total CEO remuneration).
Notes• This data is not a like-for-like comparison: ‘CEO total remuneration’ includes pension payments, bonuses
etc, whereas low pay data (basic pay) does not. While it would be possible to use the basic pay of CEOs as a comparator, this would be more misleading than using total remuneration, because basic pay makes up a much smaller proportion of total remuneration of CEOs than it does for other employees, and there are numerous cases (not necessarily in companies listed here) in which low-paid employees receive no remuneration other than basic pay.
• (On the other hand, other factors associated with data sourcing will tend to under-represent the scale of the pay gap: It is possible that there were employees in all or some of the companies shown whose pay was lower than that shown, but for whom data was not visible to our research partners. It is also the case that employees whose pay is decided by collective bargaining is higher than for employees whose pay is not decided by such agreements (i.e. for companies not shown here)).
• All figures should be regarded as estimates. We cannot guarantee the accuracy of data from third-party sources. See section on ‘FTSE 100 Companies: CEO remuneration compared to national rates of low and median remuneration’ for notes on the CEO pay levels.
• Where data was originally shown as hourly rates, the figures have been multiplied by the number of hours stated as the standard working week in the relevant agreement. However, we cannot guarantee that the rates shown in the figures above relate to full-time staff (i.e. the ratio may be misleadingly large in some cases). Minor distortions are possible due to rounding and conversion from weekly or hourly rates into annual rates.
• In all cases, the stated pay rate is the basic pay for the relevant grade – if the grade had a minimum and a maximum, the minimum figure is used. It cannot be guaranteed that the pay rate applied to any individuals in practice.
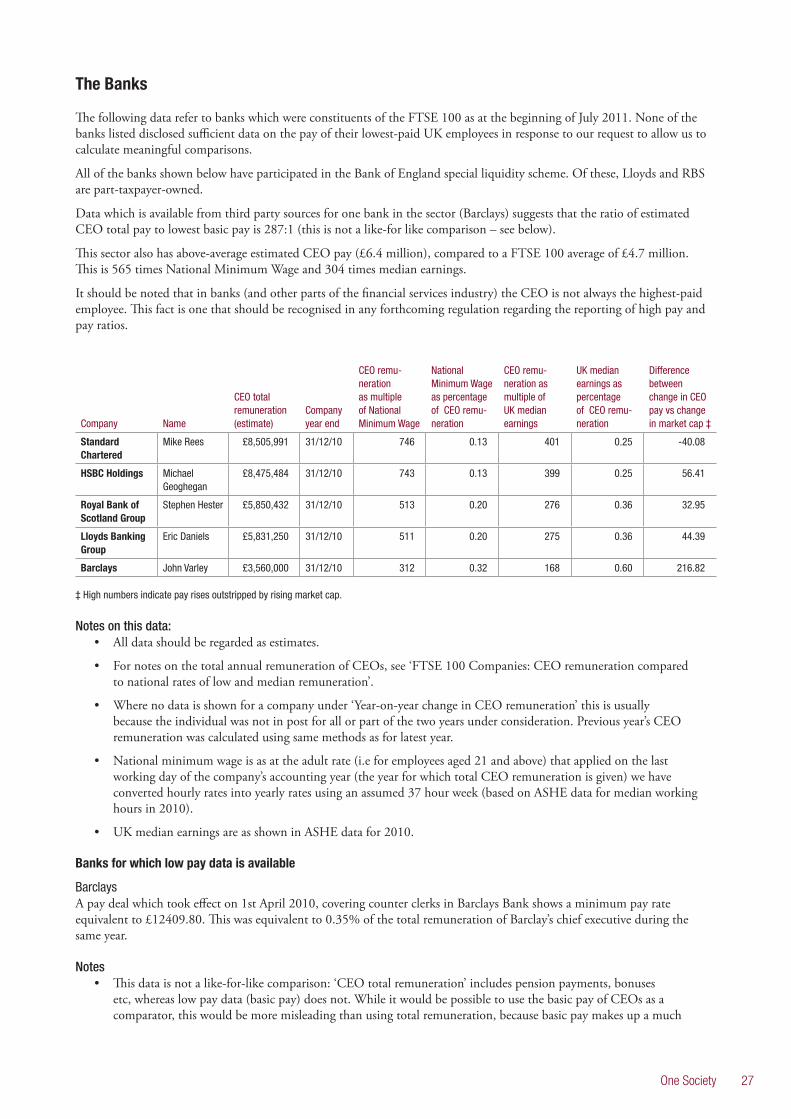
OneSociety ��
The Banks
The following data refer to banks which were constituents of the FTSE 100 as at the beginning of July 2011. None of the banks listed disclosed sufficient data on the pay of their lowest-paid UK employees in response to our request to allow us to calculate meaningful comparisons.
All of the banks shown below have participated in the Bank of England special liquidity scheme. Of these, Lloyds and RBS are part-taxpayer-owned.
Data which is available from third party sources for one bank in the sector (Barclays) suggests that the ratio of estimated CEO total pay to lowest basic pay is 287:1 (this is not a like-for like comparison – see below).
This sector also has above-average estimated CEO pay (£6.4 million), compared to a FTSE 100 average of £4.7 million. This is 565 times National Minimum Wage and 304 times median earnings.
It should be noted that in banks (and other parts of the financial services industry) the CEO is not always the highest-paid employee. This fact is one that should be recognised in any forthcoming regulation regarding the reporting of high pay and pay ratios.
Company Name
CEO total remuneration (estimate)
Company year end
CEO remu-neration as multiple of National Minimum Wage
National Minimum Wage as percentage of CEO remu-neration
CEO remu-neration as multiple of UK median earnings
UK median earnings as percentage of CEO remu-neration
Difference between change in CEO pay vs change in market cap ‡
Standard Chartered
Mike Rees £8,505,991 31/12/10 746 0.13 401 0.25 -40.08
HSBC Holdings Michael Geoghegan
£8,475,484 31/12/10 743 0.13 399 0.25 56.41
Royal Bank of Scotland Group
Stephen Hester £5,850,432 31/12/10 513 0.20 276 0.36 32.95
Lloyds Banking Group
Eric Daniels £5,831,250 31/12/10 511 0.20 275 0.36 44.39
Barclays John Varley £3,560,000 31/12/10 312 0.32 168 0.60 216.82
‡ High numbers indicate pay rises outstripped by rising market cap.
Notes on this data:• All data should be regarded as estimates.
• For notes on the total annual remuneration of CEOs, see ‘FTSE 100 Companies: CEO remuneration compared to national rates of low and median remuneration’.
• Where no data is shown for a company under ‘Year-on-year change in CEO remuneration’ this is usually because the individual was not in post for all or part of the two years under consideration. Previous year’s CEO remuneration was calculated using same methods as for latest year.
• National minimum wage is as at the adult rate (i.e for employees aged 21 and above) that applied on the last working day of the company’s accounting year (the year for which total CEO remuneration is given) we have converted hourly rates into yearly rates using an assumed 37 hour week (based on ASHE data for median working hours in 2010).
• UK median earnings are as shown in ASHE data for 2010.
Banks for which low pay data is available
BarclaysA pay deal which took effect on 1st April 2010, covering counter clerks in Barclays Bank shows a minimum pay rate equivalent to £12409.80. This was equivalent to 0.35% of the total remuneration of Barclay’s chief executive during the same year.
Notes• This data is not a like-for-like comparison: ‘CEO total remuneration’ includes pension payments, bonuses
etc, whereas low pay data (basic pay) does not. While it would be possible to use the basic pay of CEOs as a comparator, this would be more misleading than using total remuneration, because basic pay makes up a much

�� OneSociety
smaller proportion of total remuneration of CEOs than it does for other employees, and there are numerous cases (not necessarily in companies listed here) in which low-paid employees receive no remuneration other than basic pay.
• (On the other hand, other factors associated with data sourcing will tend to under-represent the scale of the pay gap: It is possible that there were employees in all or some of the companies shown whose pay was lower than that shown, but for whom data was not visible to our research partners. It is also the case that employees whose pay is decided by collective bargaining is higher than for employees whose pay is not decided by such agreements (i.e. for companies not shown here)).
• All figures should be regarded as estimates. We cannot guarantee the accuracy of data from third-party sources. See section on “FTSE 100 Companies: CEO remuneration compared to national rates of low and median remuneration” for notes on the CEO pay levels.
• In all cases, the stated pay rate is the basic pay for the relevant grade – if the grade had a minimum and a maximum, the minimum figure is used. It cannot be guaranteed that the pay rate applied to any individuals in practice.
• Where data was originally shown as hourly rates, the figures have been multiplied by the number of hours stated as the standard working week in the relevant agreement. However, we cannot guarantee that the rates shown in the figures above relate to full-time staff (i.e. the ratio may be misleadingly large in some cases). Minor distortions are possible due to rounding and conversion from weekly or hourly rates into annual rates.

OneSociety ��
CEO pay and pay inequality in the UK – key trends
The data analysis section of this report outlines the snapshot results and year-on-year trends from an analysis of our data. This section of the report looks at longer-term trends and context.
The contribution of top pay to overall UK income inequalityAnalysis carried out by a number of organisations has shown that the gap between top pay and average pay has grown at a rapid rate in recent decades: Analysis by the High Pay Commission has shown that in the ten years to 2009, the average total remuneration of FTSE 100 chief executives rose from 69 times average pay to 145 times average pay 34. However, it should be noted that this top-to-average ratio does not reflect the full extent of inequality, as a top-to-bottom ratio would.
The High Pay Commission also point out that “if this trend continues in ten years they [CEOs] will be paid 214 times the median wage” 35. There are some signs that this trend will continue, a survey of senior reward professionals released by PwC in August 2011 found that 79% expected executive pay to rise in 2012 36.
Top earners are a key driver of pay inequality in the UK. Resolution Foundation research has found that over the last 40 years, while pay differences between the 10th percentile and the median have increased, this effect has been dwarfed by the rising inequality between top earners and median earners 37. The contribution of top earners to overall income inequality may be even larger than is usually thought. Recent Equality Trust research has found that “inequality measures drawn from standard household surveys underestimate income inequality by as much as 10 percentage points, due to the under–representation of the top 1% of incomes ” 38.
Other factors which tend to exacerbate the effect of the pay gap include the impact of inflation, which has “has hit people on low-to-middle incomes disproportionately” 39 and “the growing share of value that goes to profits rather than workers” 40. With the latter being of significance because the high-paid receive a larger proportion of profits than the low-paid.
The hidden pay gap: factors which tend to underestimate the scale of low pay in the UKWe have attempted to make clear in this report where our comparisons may over-estimate or underestimate pay gaps for individual companies. However, there are a number of other factors which mean that the UK’s underlying pay gaps are larger than they may seem (these factors do not necessarily apply to specific companies included in this report). These include:
Low-paid workers who are on the premises but not on the payroll. It is common practice for companies to outsource work such as cleaning to other companies. Studies of low pay and poor conditions in subcontracting companies and other employers have been carried out by the TUC and others 41.
The use of unpaid internships by some companies.
The employment of individuals aged under 21. This document compares CEO pay with National Minimum Wage at the adult rate which applied on the last working day of the company’s reporting year, but some employees in the UK are paid at rates that are significantly lower (the current NMW for those over 21 is £5.93 per hour, compared to £4.92 for those aged 18-20 and £3.64 for those aged 16-17).
The use of apprenticeships, for which the current minimum pay is £2.50 per hour.
Some low-paid workers being classed as self-employed and therefore not receiving holiday pay, sick pay etc.
What has caused the increasing inequality at the top of the pay scale?The High Pay Commission (among others) has carried out a thorough study of this question and found, in brief, that the ‘dramatic growth in top pay’ has been caused by: i) attempts to link pay to performance ii) company structures which do not effectively control top earnings iii) perceptions of fierce competition for executive ‘talent’ and iv) a rise in individualism 42.
We do not intend to revisit the work of the High Pay Commission, but this report will outline some of the adverse impacts associated with those drivers of high pay as well as suggesting some means to manage them.
�0 OneSociety
The adverse impacts of high pay ratios in the UK
Damaging company performance
Are companies paying over the odds for executive ‘talent’?The assertion that current levels of high pay are necessary to recruit and retain people with the required qualities is called into question by a number of sources. David Bolchover, whose ‘Pay Check; Are top earners really worth it?’ 43 argues that the idea of the superstar CEO is a myth and that companies should focus more on nurturing upcoming talent as well as just seeking to outbid others for ‘top talent’. A recent statistical study by Obermatt found that “only 14 FTSE 100 groups in the study pay what Obermatt says is within 20 per cent either way of what their chief executives deserved” 44.
Some of the specific justifications for rising executive pay have been convincingly debunked. For example, the High Pay Commission have shown that the argument that high pay is necessary to avoid top performers being poached by foreign competitors is flawed. They show that UK executive pay is already higher than the rest of Europe, is approaching levels in the US 45 and “in the last five years only one FTSE 100 company has had its CEO poached by a rival, and that rival was also British” 46.
More worryingly, “There is evidence that excess compensation of directors and CEOs is associated with firm underperformance. In a study in the US, Brick, Palmon and Wald (2005) demonstrated that high director and CEO pay is positively correlated with poor governance, which is in turn related to poorer company performance” 47.
There is growing evidence that executive pay is an example of market failure. As Howard Reed has pointed out: “in the US, the huge increases in CEO pay of recent decades can only be explained partially, at best, by increased productivity – the rest is explained by ‘a managerial power hypothesis that drives executive pay well above the market solution’. To a lesser extent, the same is almost certainly true in the UK” 48.
The growing emphasis on performance-related pay may damage performancePerformance related pay is a growing element of executive remuneration. This has attracted criticism because performance related pay fuels pay inflation and is almost always additional to base pay. Other criticisms have centred on the incompatibility of incentive payments to chief executives who do not remain in post over long-term timescales. Short term incentives may incentivise short-termism, longer-term incentives risk rewarding executives for the performance of their successors.
Furthermore, such incentives may be counterproductive. A study which analysed 51 studies of financial incentives found that “financial incentives may indeed reduce intrinsic motivation and diminish ethical or other reasons for complying with workplace social norms such as fairness. As a consequence, the provision of incentives can result in a negative impact on overall performance” 49.
Interestingly, incentives may be more useful at the lower end of the pay scale than the top, because “tasks that involve only effort are likely to benefit from increased incentives, while for tasks that include a cognitive component, there seems to be a level of incentive beyond which further increases can have detrimental effects on performance” 50.
There is some evidence that the proportion of executive pay made up by performance related pay may begin to decline: survey results released by PwC in August 2011 suggest that most firms now intend to “increase base salaries only” and that “30% of firms are planning to introduce so-called clawback” 51 [reclaiming some elements of executive pay]. The PwC research looks at short-term trends among a sample of companies, and therefore should be treated with care, but its findings in subsequent years will be worth tracking.
The productivity of the workforce as a whole is reduced by high pay ratiosThe final report of the ‘Hutton Review of Fair Pay in the Public Sector’ refers to “A wide range of academic studies, covering large and small businesses across different sectors in North America and Europe, [which] suggest there is a strong correlation between narrower pay dispersion within an organisation and improved organisation performance, in particular where the input of many employees is important to performance. According to this research, wide gaps between top and bottom pay within an organisation harm performance. This is not to say that organisations with high pay differentials between the top and the rest will be poorly performing, rather that there will be gains to morale and productivity in organisations where everyone is seen to be paid according to their contribution” 52.
Also cited by the Hutton Review (interim report) are the results of research by Towers Watson, showing that engagement

OneSociety �1
among people who feel that their manager makes fair decisions on pay is much higher than those who feel that decisions are not fair (77% and 45% respectively). This is supplemented by numerous examples of data which suggest that employee engagement is strongly correlated with performance, for example: “Hay Group research concludes that engaged employees generate 43 per cent more revenue than unengaged employees” 53.
Other evidence shows that people with low relative status in the workplace (associated with low relative pay) are more likely even than people without jobs at all to suffer declining mental health and its consequences in terms of low engagement, low productivity & absenteeism. For example, a recent academic study on the effect of employment on mental health found that “those in the poorest quality jobs showed greater decline in mental health than those who were unemployed” 54.
In terms of physical health, researchers have found “a strong and highly significant association between health outcomes, in particular cardiovascular health, and fairness of pay” the same study cited “a large and growing body of evidence [which] suggests that fairness perceptions play an important role in labor relations, affecting work morale, effort provision and market efficiency” 55.
These findings suggest that the reporting and management of company pay ratios, as well as just top pay, would have benefits for those in companies and their shareholders who wish to improve whole-company performance.
Damaging the wider economy
There are those who argue that high pay ratios are necessary for a prosperous economy . However, the evidence does not support this assertion. As Howard Reed found: “there is a conventional economic view that inequality [of income] is a price a country has to pay to achieve economic success. But a comparison of the performance of equal and unequal countries does not back this up. Indeed, there is evidence that some redistribution enhances economic performance” 56. Although Reed’s concern is with overall income inequality ( and not just pay inequality), his analysis is also applicable to pay inequality. This section examines some of the means by which the pay gap may have adverse impacts upon the performance of the UK economy as a whole.
Encouraging economic volatility. There is widespread concern about the role in the financial crisis of high pay, bonuses and the tendency of these to incentivise volatile and short-termist behaviour. There are also an increasing number of economists asking whether income inequality contributed to the crisis 57. Beyond the current crisis, we note that “Several cross-country empirical studies find a positive relationship between the degree of economic inequality and the volatility in economic performance” 58.
At the other end of the pay scale, high pay ratios can lead lower-income individuals to resort to unsustainable debt in order to ‘keep up’, which on a macro scale can contribute to financial crises as the sub-prime crisis in the US demonstrated. As the economists Michael Kumhof and Romain Rancière have said, “rising inequality in a climate of rising consumption can lead poorer households to increase their leverage, thereby making a crisis more likely” 59.
The stagnation of low-to-middle incomes, which have been increasingly left behind by rising top-half incomes, not only make crises more likely but also make economic recovery more difficult, as a recent survey by Ipsos MORI and the Resolution Foundation suggests 60.
Costs of low pay externalised to taxpayers and the wider economyAccording to the Institute for Fiscal Studies, below-living-wage pay costs the taxpayer around £6 billion a year in benefits and foregone revenue 61. The proportion of low incomes which are supported by the taxpayer has increased over recent years, as Resolution Foundation research shows: “In 1977, the tax-benefit system ‘topped up’ [low to middle earners’] share of national income by one percentage point; by 2008-09 the system was lifting their share almost four times as much” 62.
To this should be added the contribution of low pay to poverty-related health costs. According to the Marmot Review “additional NHS healthcare costs associated with inequality are well in excess of £5.5 billion per year” 63. Further evidence of the impact of high pay ratios on mental health is cited above.
This means that there are cases where taxpayers are effectively subsiding the over-the-odds element of executive pay in some companies where incentive payments are partly earned by suppressing labour costs to increase short-term profitability. This provides another argument why companies should be required to report pay ratios; to discourage executives from increasing their own remuneration at the expense of others.
Low pay (especially where jobs are insecure 64) also contributes to social breakdown, not only by keeping people in poverty, but by causing many parents to work such long hours that family life is damaged. Low pay also discourages the children of the the low-paid from seeing work as a route to prosperity.

�� OneSociety
Damaging public perceptions of business
Executive pay which is perceived to be both unjustifiably high and unjustified by performance, especially at a time of stagnating low and median pay, is likely to promote negative perceptions of executives and of the businesses which employ them. In a more general sense, the growing perception that some people get what they have not earned, while others earn more than they get, will tend to foster a cynical attitude to society.
The social consequences of excessive income inequality and their economic costs
High rates of pay inequality have contributed to the UK having one of the highest rates of income inequality in the developed world, according to the UN 65 and the OECD 66.
High rates of income inequality (as distinct from poverty) are associated with a range of health and social problems, many of which have economic consequences. A summary of this phenomenon is contained in Wilkinson & Pickett’s ‘The Spirit Level’ 67, which shows correlations between income inequality and social incohesion, poor mental and physical health, poor educational attainment, teenage births, violence and social immobility. ‘The Spirit Level’ authors point out that similar conclusions are found in “around 200 papers in peer-reviewed academic journals testing the relationship between inequality and health in many different settings, more than 50 papers on violence and inequality and quite a few on inequality in relation to trust and social capital” 68.
Excessive income inequality and low social mobility The UK has one of the lowest rates of social mobility in the developed world 69. This is a tragedy for those ‘trapped at the bottom’, but also for the wider economy and society, which will not benefit from the contribution of those who never get to become the innovators, teachers, entrepreneurs or surgeons that they could have been.
There is strong evidence 70 that the most effective way to increase social mobility is to reduce income inequality. For example, a study by the Institute for Fiscal Studies for the Department of Business, Innovation & Skills found that “countries with higher income inequality tend to have lower social mobility […] it is likely to be very hard to increase social mobility without tackling income inequality” 71. A number of studies contain evidence that income inequality is likely to be a cause of social immobility, not just associated with it.

OneSociety ��
Public attitudes to the pay gap
A large majority of the public support the idea that the pay gap should be reduced. Polling conducted in 2011 by YouGov for the IPPR found “78 per cent of adults agreed that the government should take action to reduce the gap between high and low earners in the UK […] of those who thought the government should take steps to reduce the pay gap, 82 per cent thought they should do so in both the public and private sector” 72.
In addition to the public support for lowering the overall ratio, there is also a consensus that high pay should be lower. Another YouGov poll, carried out in November 2010, surveyed 2000 people and found that “when asked how much a FTSE chief executive should be paid, 64 per cent said less than £500,000, and just 5 per cent said their remuneration should be between £1m and £4m. A mere 1 per cent said their pay should be anywhere near where it actually is – above £4m” 73. There is also strong support for specific policies to tackle excessive top pay. According to the Joseph Rowntree Foundation “80% of poll respondents agreed that bonuses should ‘reward long-term success rather than short-term performance’; 70% thought that ordinary employees should be represented on the remuneration committees that decide how much executives get paid (with only 6% disagreeing); while a small majority (56%) were even in favour of making executives of failed companies ‘pay back their bonuses from the last two years’ (with 20% disagreeing)” 74.
At the other end of the pay scale, IPPR research in 2011 found that there is “undeniable support for proper wage floors at the bottom of the labour market [which] makes this fertile ground for policy intervention [...] this is a relatively uncontroversial area as far as the public is concerned” 75.
Although more a matter for encouragment than regulation, it is notable that the IPPR also found strong public support for bonuses which are at least partly are shared by the workforce 76.
It should be noted that attitudes vary depending on the source of income which people are asked to consider (entrepreneurs’ rewards are thought more legitimate than those of managers, for example) and depending on the solutions offered (e.g. fairer pay gets more support than redistributive taxes, although there have recently been demonstrations of majority support for the retention of the 50p top tax rate).
Industry & expert attitudes to high pay
There is widespread recognition that levels of executive pay constitute a market failure. For example the Department of Business, Innovation and Skills’ ‘Long-Term Focus for Corporate Britain’ consultation found “The majority of respondents” (who were mainly companies, investors, their representitives, lawyers and accountants) “support the idea that executive pay has risen to unacceptable levels in some or all cases and that this often has no correlation to an increase in talent or success” 77.
There is specific criticism of the role of performance-related pay. For example, Cliff Weight, a director at pay consultants MM&K, said in 2010 that “Many performance related pay schemes appear designed to satisfy the chief executive and in fact offer little incentive for anything above just adequate performance” 78.

�� OneSociety
Recommendations
As this report has shown, top pay has grown out of all proportion with employee pay, performance, the concept of proportional reward and the requirements of recruitment and retention.
The UK’s high pay gap is a problem that has arisen as a result of a large number of factors. These factors are both structural and cultural, and no single group has the power to comprehensively tackle the issue by acting alone. This complexity suggests that responses must take into account the roles of all relevant influencers and should include companies, regulators, investors and advisors.
Policy makers
The pay gap is an issue in which there is strong and legitimate public interest, as it has adverse effects on the wider economy, contains elements of market failure, creates externalised costs which are met by the taxpayer and has costly social impacts.
As we noted in the introduction, policy makers are already engaging with issues of executive pay, and prominent figures in Westminster are debating pay ratios and low pay. While it is not the role of this report to make detailed and technical policy proposals (some of these can be found in our ‘Policies for the Good Company’ paper 79), we do have broad suggestions for initiatives which would help to address problems in UK pay dispersion.
We are not alone in recommending that companies should report on their pay ratios 80, but we strongly agree with Vince Cable that “transparency only gets us so far”. Publication of ratios is necessary, but certainly not sufficient.
Policies should be adopted that give greater influence to those who have a stake in the long-term future of the company as a whole and that encourage those who have already influence to be assertive.
Pay-ratio reportingMandatory pay-ratio reporting should be introduced for UK listed companies and encouraged for other large employers. This is necessary not just to provide an understandable measure of changes in top pay, but also because i) excessive pay gaps (as opposed to just high pay or low pay alone) are financially and economically damaging and ii) executive pay structures can provide incentives to suppress employee’s pay below levels which make sustainable business sense – i.e. there are pressures to unhelpfully exaggerate pay ratios, which pay ratio reporting can help to counteract.
Mandatory reporting of top-to-median ratios has already been recommended by Will Hutton’s ‘Fair Pay’ review 81, but also requiring the reporting of top-to-bottom ratios will allow the full extent of the pay gap to be examined.
Concerns have been raised that ratios may be misleading because sectors with a large proportion of unskilled workers would naturally have higher ratios than those where starting salaries are high 82. This concern would be easily overcome if companies were classified by sector as investment advisors PIRC have said, “On a whole range of issues that are analysed investors know they need to take account of factors such as industry sector, company size etc. Why would they do any different in respect of pay dispersion?” 83.
There are legitimate concerns that pay ratio reporting (either top-to-bottom or top-to-median) could encourage executives to outsource low-paid roles in order to narrow the appearance of the ratio. However, it is likely that cost-motivated outsourcing has already taken place, and that cost is a stronger motivation than ‘massaging the ratio’ anyway. However, it would help to reduce this risk if Government encouraged companies to report on their policies regarding low pay of staff and on-site contractors.
Simplifying reportingRegulations for the reporting of pay need to promote simplified and more standardised reporting, so that investors and others can compare like with like. There should also be clear guidelines on which elements of pay (e.g. salary, pension contributions, incentives, bonuses, other benefits etc) should be reported and how their value should be estimated (e.g. calculating the value of deferred rewards in equities), so that reporting is comparable.
The composition and role of remuneration committeesRemuneration committees are too often made up of people who recommend levels of remuneration which seem normal to them and abnormal to virtually everyone else. Too often remuneration committees include people whose pay may be

OneSociety ��
benchmarked against each other, which provides an incentive to inflate pay awards 84. For this reason, we recommend that listed companies be required to include a minimum number of employee representatives on their remuneration committees. This should certainly more than one as lone advocates of alternative viewpoints are too easily discounted. This is already the practice in Germany. There is already established practice for recruiting member-nominated trustees of occupational pension schemes, which could be easily adapted. We agree with Will Hutton that “employees have an incentive to monitor executive pay and performance since they have so much staked on the success of the organisation – arguably even more than shareholders” 85.
The focus of discussion in remuneration committees tends to be heavily focused on the pay and performance of executives, rather than that of the wider workforce. When combined with the limited diversity of remuneration committee personnel this tends to make it less likely that the interests of the company as a whole will be properly promoted. Remuneration committees should therefore be encouraged to consider pay dispersion metrics in their deliberations and to consider awarding bonuses on an organisational or team basis, particularly where this is additional to base pay 86.
Remuneration consultantsThere is widespread recognition that remuneration consultants tend to encourage unhelpful inflation of top pay. As one investment consultant put it “The incentive to structure overgenerous schemes is obvious: that way you get hired again and also win mandates from other executives who would like to be similarly rewarded” 87. For this reason, we recommend that Government should review the role of remuneration consultants, in order to ensure that their selction and recommendations reflect the best interests of the company and are open to proper accountabilility. There are specific recommendations on this area in our paper ‘Policies for the Good Company’ 88.
Promoting shareholder assertivenessThere are limits to the power of investors to influence company behaviour due to dispersion of shareholdings, agency problems and other factors. However this power is not insignificant and investors should therefore be encouraged and facilitated in their engagements with companies to ensure that the long-term interests of companies are promoted. Although at present levels of investor engagement are low 89.
Part of the solution will lie in ensuring that companies’ reporting is made more clear and comparable (see above). We note that in the past “greater disclosure and shareholder votes have encouraged engagement between shareholders and boards” 90. It would also help if Shareholder votes on remuneration were binding, rather than advisory as is the case at present .
It will help to incentivise asset managers to engage with companies about pay, (and other financially-relevant issues) if they in turn are required to practice greater disclosure with regard to their voting record, use of market analysts and policy on remuneration. This would help those asset owners on whose behalf the managers operate to see how their assets are being managed.
Again, we have more detailed policy proposals on these matters in our ‘Policies for the Good Company’ paper 91.
Public procurement and holdingsThe Government should be commended for its engagement with the issue of public sector pay ratios, but the growing proportion of public services delivered by private providers mean that these efforts will become increasingly irrelevant unless Government uses its influence to ensure that its major contractors move towards fairer pay models. This is an area in which there is particular public interest, not only to prevent taxpayers paying over the odds for executive pay but also to prevent the excessive externalised costs of high pay ratios (including social security costs associated with low pay) being met by taxpayers.
It is already a recommendation of the Hutton Review of Fair Pay in the Public Sector that “the government, including local government, should use their influence as a major procurer with all major private sector contractors and suppliers to see that they observe the Fair Pay Code” 92. We support this proposal. There are additional policies which could be adopted by Government to ensure that its influence promotes best practice. These include:
i) Requiring public agencies to publish assessments of the cost to taxpayers of below-living-wage employment related to major outsourced contracts.
ii) Requiring public sector pension funds to publish a policy on remuneration, and to vote on remuneration reports at investee company AGMs.
Low payWe have written above about how low pay externalises costs and contributes to widening inequality, which incurs further costs. For this reason, Government should explore means of encouraging and incentivising employers to pay the Living Wage to staff and on-site contractors.

�� OneSociety
Companies and their investors
While we await the Government’s full reaction to Will Hutton’s ‘Fair Pay’ review recommendations and the outcomes of the Department for Business, Innovation and Skills consultations looking at executive pay and pay reporting, it is difficult to give a comprehensive answer to the question of how companies and their investors should address pay issues. In effect, we are waiting for policy makers to define the ‘new standard practice’, around which companies and their investors may seek to define the ‘new best practice’.
However, there are steps which can be taken pre-emptively. These include:
CompaniesReporting on the ratios of top-to-bottom and top-to-median pay (total remuneration) and on any policies relating to on-site contractors e.g. requiring Living Wage to be paid, avoiding false self-employment etc. We are aware that, in the past, more reporting has sometimes led to a ratcheting up of pay as executives find it easier to see, and aspire to, the pay of others. As top pay is already known we think that ratio reporting will not be harmful in this way and is likely to help, by focusing attention on the wider company.
Performance related pay and bonuses should be used sparingly. The scale of performance-related payments to FTSE 100 CEOs in recent years suggests that these payments are not confined to executives whose performance has been exceptional. There is evidence cited in this report that such payments are not helpful to sustainable company performance. Extending bonuses to the wider workforce may be an effective way of improving whole-company performance and PR.
Exploring whether elements of the ‘Fair Pay Code’ contained in the final report of Hutton’s ‘Fair Pay’review can usefully be adopted 93.
Publishing a policy on pay ratios and fair pay.
InvestorsAlthough investors do not have the capacity to engage with each company about its pay practices, there are elements of basic good practice which they could adopt as expectations and make these expectations known to investee companies. These elements could include, for example, reporting on pay ratios and policies.
There are already some models on which investors have collaborated to agree good practice and promote it to investees. On environmental and social issues which constitute financial risks and opportunities examples range from large initiatives such as the Carbon Disclosure Project 94 and Pharma Futures 95 to one-off joint statements sent by informal groups of investors to investees.

OneSociety ��
Notes
1 This statistic refers to the average estimated top-to-bottom pay ratio in the companies which disclosed low pay data in response to our request. Full details are shown in the Data Analysis section of this report.
2 This concept is most strongly associated with Will Hutton’s ‘Them and Us: Changing Britain – Why We Need a Fair Society’, 2010, Little Brown.
3 We received usable data for 25 companies. Of these: 11 disclosed usable data in response to our request (one of which was excluded from calculations due to negligible numbers of UK employees); We received third-party data for 17 companies (of which 3 were FTSE 250 companies used in our sector analyses). Two companies appeared in both data sets.
4 This sample gives a ratio of 309:1, but is not a true like-for-like comparison (low pay figures were basic pay only, and some staff included may not have been full-time, whereas CEO pay figures were total remuneration estimates). Any additional payments received by low-paid workers would make relatively small differences to the true overall ratio, because basic pay makes up the majority of this groups’ overall pay, but would tend to reduce the ratio towards that which applied to the other dataset (262:1)). Please see the body of the report for a full explanation of how ratios were calculated.
5 Measured in year-on-year changes in companies’ market capitalisation.
6 Measured in market capitalisation at the start of the company’s reporting year.
7 On 8 April 2010, in Guardian piece, David Cameron promised to commission a review “to consider how to introduce a pay multiple so that no public sector worker can earn over 20 times more than the lowest paid person in their organisation”. http://www.guardian.co.uk/commentisfree/2010/apr/08/david-cameron-conservatives-radicals This promise led to the establishment of the Hutton Review of Fair Pay in the Public Sector.
8 For example, see coverage of Obermatt’s comparisons of CEO pay and company performance in Financial Times, ‘Blue chips wrestle with pay formula’, 7 August 2011. http://www.ft.com/cms/s/0/589df092-bec2-11e0-a36b-00144feabdc0.html#axzz1Ui4Mw9RE
9 For example, Manifest/MM&K ‘Manifest/MM&K Total Remuneration Survey 2011’. http://www.manifest.co.uk/shop/remuneration/total-remuneration-survey/
10 For example, High Pay Commission, ‘More For Less: what happened to pay at the top and does it matter?’, 2011. http://highpaycommission.co.uk/wp-content/uploads/2011/05/HPC_interim_report2011.pdf
11 A Simms & D Boyle, ‘The Ratio: Common sense controls for executive pay and revitalising UK business’, 2011, NEF http://www.neweconomics.org/publications/the-ratio
12 K Lawton & T Lanning: ‘Getting what we deserve? Attitudes to pay, reward and desert’ 2011 IPPR. https://www.ippr.org.uk/publicationsandreports/publication.asp?id=820
13 W Hutton, ‘Hutton review of Fair Pay in the Public Sector’, Final Report, 2011. http://cdn.hm-treasury.gov.uk/hutton_fairpay_review.pdf
14 This is a particular issue in assessing the benefits accrued in defined benefit pension schemes. This is an issue too complex to outline here, but which is dealt with more comprehensively in ‘PensionsWatch 2010, A TUC report on directors’ pensions in the UK’s top companies’. www.tuc.org.uk/extras/pensionswatch2010.pdf
15 D Julius ‘Understanding the Public Services Industry: How big, how good, where next?’ 2008, BERR, p5 www.bis.gov.uk/files/file46965.pdf )
16 On 8 April 2010, in Guardian piece, David Cameron promised to commission a review “to consider how to introduce a pay multiple so that no public sector worker can earn over 20 times more than the lowest paid person in their organisation”. http://www.guardian.co.uk/commentisfree/2010/apr/08/david-cameron-conservatives-radicals This promise led to the establishment of the Hutton Review of Fair Pay in the Public Sector.
�� OneSociety
17 http://www.cabinetoffice.gov.uk/resource-library/senior-civil-servants-high-earners-salaries
18 Mattison Public Relations / Incomes Data Services, ‘Local Authority chief executives average earnings reach £147,934’ (Press release), 2011.
19 Babcock International’s website, accessed 26 August 2011 http://www.babcock.co.uk/pages/about-us/default.aspx
20 Balfour Beatty website, accessed 26 August 2011 http://www.balfourbeatty.com/index.asp?pageid=71
21 Bovis Homes 2010 Annual Report, accessed 26 August 2011 http://www.edocumentview.co.uk/bovishomes2011/2011/48169/632094b421b94e10982b46cc4f028031/R%26A_2010.pdf
22 BT’s wesbite, accessed 26 August 2011 http://www.btplc.com/Sharesandperformance/Annualreportandreview/pdf/BTGroupAnnualReport2011.pdf
23 Bloomberg’s website, accessed 26 August 2011 http://investing.businessweek.com/research/stocks/private/snapshot.asp?privcapId=171577
24 Capita’s website, accessed 26 August 2011 http://www.capita.co.uk/investors/Documents/FactsandStats2010.pdf
25 Compass Group’s website, accessed 26 August 2011http://www.compass-group.com/What-we-do.htm
26 Bloomberg website, accessed 26 August 2011 http://investing.businessweek.com/research/stocks/private/snapshot.asp?privcapId=2421029
27 G4S website, accessed 26 August 2011 http://www.g4s.com/en/What%20we%20do/
28 ‘Government’s welfare to work scheme launched’ 10/6/11, BBC news website, accessed 26 August 2011 http://www.bbc.co.uk/news/uk-13723477
29 ‘MITIE profits rise on increased demand for energy efficiency’ 24/05/11 Telegraph website, accessed 26 August 2011 http://www.telegraph.co.uk/finance/newsbysector/supportservices/8531788/Mitie-profits-rise-on-increased-demand-for-energy-efficiency.html
30 Motley Fool ‘Outsourcing expert MITIE delivers strong growth in profits and dividend’ .23/5/11 , accessed 26 August 2011 http://www.fool.co.uk/news/investing/company-comment/2011/05/23/mities-still-looking-cheap.aspx
31 Rentokil website, accessed 26 August 2011http://www.rentokil-initial.com/what-we-do/facilities-services/index.html
32 Serco website, accessed 16 August 2011 http://www.serco.com/about/ataglance/index.asp
33 Shanks’ website, accessed 26 August 2011 http://www.shanks.co.uk/corporate-services/local-authority
34 High Pay Commission, More For Less, 2011, p28. As above.
35 High Pay Commission, More For Less, 2011, p15. As above.
36 PwC, ‘Executive pay set to increase unless turbulent markets take their toll, says PwC’ (press release), 30 August 2011, (http://www.ukmediacentre.pwc.com/News-Releases/Executive-pay-set-to-increase-unless-turbulent-markets-take-their-toll-says-PwC-10ee.aspx)
37 J Plunkett, ‘Growth Without Gain? The faltering living standards of people on low-to-middle incomes’, 2011, Resolution Foundation, p28 (Figure 12).
38 The Equality Trust, ‘Income inequality: Trends and Measures’, 2011.
(http://www.equalitytrust.org.uk/resources/publications)
39 Plunkett, ‘Growth Without Gain?’, 2011, p10. As above.

OneSociety ��
40 M Whittaker & L Savage ‘Missing Out: Why ordinary workers are experiencing growth without gain’ 2011, Resolution Foundation, p3.
41 See TUC, Hard Work, Hidden Lives; ‘The Short Report of the Commission on Vulnerable Employment’ 2008. (www.fairpaynetwork.org/uploadedPDF/CoVE_report.pdf )
42 High Pay Commission, ‘More For Less’, 2011, p9-10. As above.
43 D Bolchover, ‘Pay check; are top earners really worth it?’, 2010, Coptic Press.
44 Financial Times, ‘Blue chips wrestle with pay formula’, 7 August 2011. (http://www.ft.com/cms/s/0/589df092-bec2-11e0-a36b-00144feabdc0.html#axzz1Ui4Mw9RE)
45 High Pay Commission, More For Less, 2011, p30. As above.
46 High Pay Commission, More For Less, 2011, p56. As above.
47 High Pay Commission, More For Less, 2011, p39. As above
48 H Reed, ‘Fairness and Prosperity’, 2011, TUC, p8 (http://www.tuc.org.uk/economy/tuc-19800-f0.cfm) Reed refers studies by I Dew-Becker and R Gordon.
49 LSE, ‘When performance-related pay backfires’ (Press Release), June 2009 [accessed 31/04/11]. (http://www2.lse.ac.uk/newsAndMedia/news/archives/2009/06/performancepay.aspx)
50 Ariely, Gneezy, Loewenstein and Mazar: ‘Large Stakes and Big Mistakes’; Research Center for Behavioral Economics and Decision Making, 2005, p16-17. (http://www.bos.frb.org/economic/wp/wp2005/wp0511.pdf )
51 PwC, Press Release, 30 August 2011. As above.
52 Hutton, Hutton review, Final Report, 2011, p74. As above.
53 W Hutton, ‘Hutton review of Fair Pay in the Public Sector’, Interim Report, 2010, p 26. http://www.hm-treasury.gov.uk/d/hutton_interim_report.pdf
54 Butterworth, Leach, Stazdins, Olesen, Rodgers & Broom, ‘The psychosocial quality of work determines whether employment has benefits for mental health: results from a longitudinal national household panel survey’. Occupational and Environmental Medicine, 2011. http://oem.bmj.com/content/early/2011/02/26/oem.2010.059030.abstract
55 A Falk, I Menrath, P Verde & J Siegrist ‘Cardiovascular Consequences of Unfair Pay’ 2011, Forschungsinstitut zur Zukunft der Arbeit, p1-2. http://ftp.iza.org/dp5720.pdf
56 Reed, Fairness and Prosperity, 2011, p4. As above.
57 For a short discussion of some of these questions, The Economist (blog) ‘How inequality fuelled the crisis’ 26 August 2010. http://www.economist.com/blogs/freeexchange/2010/08/income_inequality
58 Reed, Fairness and Prosperity, 2011, p14. As above.
59 M Kumhof & R Rancière, Inequality, leverage and crises 4 February 2011,VOX. http://www.voxeu.org/index.php?q=node/6075
60 Resolution Foundation, ‘Poor Household Finances Risk Choking Off Recovery’ (Press Release), 24 August 2011. (http://www.resolutionfoundation.org/
61 Brewer and Phillips, ‘IFS analysis on the ‘living wage’ ’, 2010, Institute for Fiscal Studies. http://www.ifs.org.uk/publications/5244
62 Plunkett, ‘Growth Without Gain?’, 2011, p10. As above.

�0 OneSociety
63 The Marmot Review ‘Fair Society Healthy Lives’, Full report, 2010, p18. http://www.marmotreview.org/AssetLibrary/pdfs/Reports/FairSocietyHealthyLives.pdf
64 We refer here to the ‘low-pay, no-pay cycle’, in which people become trapped in a cycle of low-paid short-term jobs and unemployment. This phenomenon is examined in T Shildrick et al, ‘The low-pay, no-pay cycle: Understanding recurrent poverty’, 2010, JRF http://www.jrf.org.uk/publications/understanding-recurrent-poverty
65 UN Development Program. ‘Human Development Reports’, 2003-6. http://hdr.undp.org/en/reports/
66 OECD, ‘Society at a Glance’, 2011. http://www.oecd.org/document/24/0,3746,en_2649_37419_2671576_1_1_1_37419,00.html
67 R Wilkinson & K Pickett, ‘The Spirit Level’, 2010 (Second Edition), Penguin.
68 Wilkinson & Pickett, ‘The Spirit Level’, 2010, p279. As above.
69 J Blanden ‘How Much Can We Learn From International Comparisons of Intergenerational Mobility?’, 2009, Centre for the Economics of Education. http://cee.lse.ac.uk/cee%20dps/ceedp111.pdf
70 Examples: D Andrews & A Leigh, ‘More Inequality, less social mobility’, Applied Economics Letters, 2009, Number 16, p1489. http://people.anu.edu.au/andrew.leigh/pdf/InequalityMobility.pdf OECD: ‘Growing Unequal? Income Distribution and Poverty in OECD Countries’, 2008 http://www.oecd.org/document/53/0,3746,en_2649_201185_41460917_1_1_1_1,00.html) Blanden, Gregg & Macmillan, ‘Intergenerational Persistence in Income and Social Class: The Impact of Increased Inequality’, 2008, CMPO http://www.bristol.ac.uk/cmpo/publications/papers/2008/wp195.pdf Wilkinson & Pickett, The Spirit Level, 2010, p289. As above.
71 Crawford, Johnson, Machin & Vignoles, Social Mobility, a Literature Review, 2011, Department for Business Innovation and Skills, p.1. http://www.bis.gov.uk/assets/biscore/economics-and-statistics/docs/s/11-750-social-mobility-literature-review.pdf
72 Lawton & Lanning, Getting what we deserve?, 2011 p23. As above.
73 Financial Times, (Nicholas Timmins), Top Executives paid ‘far too much’, 9 November 2010. http://www.ft.com/cms/s/0/a4bc14f0-ec08-11df-b50f-00144feab49a,s01=1.html#axzz1K9YF6eIf
74 Bamfield & Horton, “Understanding Attitudes to Tackling Economic Inequality”, 2009, Joseph Rowntree Foundation. http://www.jrf.org.uk/publications/attitudes-economic-inequality
75 Lawton & Lanning, ‘Getting what we deserve?’, 2011 p6. As above.
76 Lawton & Lanning, ‘Getting what we deserve?’, 2011 p5. As above.“it resonated as an example of a fair system of reward – importantly, it was seen to justify the higher pay of senior managers as well as providing a fairer reward for the majority of the workforce [...] 51 per cent of the public think performance should be assessed and rewarded on a group basis rather than an individual basis. Only a quarter of respondents thought bonuses should be paid based on individual performance.”
77 Department for Business Innovation and Skills: ‘A Long-Term Focus for Corporate Britain; Summary of Responses’ 2011, p20. http://www.bis.gov.uk/assets/biscore/business-law/docs/s/11-797-summary-responses-long-term-focus-corporate-britain.pdf
78 The Guardian ‘Executive pay rises while shareholder earnings fall, says MM&K survey’; 5 July 2010. http://www.guardian.co.uk/business/2010/jul/05/executive-pay-rises-shares-fall
79 Available on our website.

OneSociety �1
80 For example, this is a recommendation of : Hutton, ‘Hutton review’, Final Report, 2011, As above. and of Simms & Boyle, The Ratio, 2011, As above.
81 Hutton, ‘Hutton review’, Final Report, 2011, p78. As above.
82 It has been reported that “Mr Cable has also talked to Will Hutton [...] about his recommendation for mandatory publication of the ratio of company chief executives’ pay to those of median earners in their business – a measure due shortly to be introduced in the US. But the business secretary appears to have doubts about such a move. He told the FT that Goldman Sachs, the investment bank, with a lot of high earners, could perform well by that measure, whereas “very good companies” such as Rolls-Royce, the aerospace group, might not”. Financial Times, ‘Cable plans to move on high pay’ 27 July 2011. http://www.ft.com/cms/s/0/aa60f4c0-b84a-11e0-8d23-00144feabdc0.html#axzz1W8JT7lmz
83 PIRC, ‘Pay ratios aren’t that difficult’. http://www.pirc.co.uk/news/pay-ratios-aren%E2%80%99t-difficult
84 For example, Paul Pindar, CEO of Capita plc, was, until last year, the senior independent non-executive director and member of the remuneration committee at Debenhams plc. A fellow independent non-executive director and remuneration committee member at Debenhams was Martina King. Martina King is also a non-executive director at Capita plc, and chairs the remuneration committee which is responsible for setting Paul Pindar’s level of pay.
85 Hutton, ‘Hutton review’, Final Report, 2011, p68. As above.
86 Hutton, ‘Hutton review’, Final Report, 2011, p72. As above.This is because:• Staff with lower pay levels are likely to find that the actions of more senior staff affect their performance• Psychological impacts on motivation of pay that is perceived to be unfairly low mean that ‘fining’ the low paid for
under-performance is likely to create a vicious cycle. • Reducing the pay of the already low-paid is likely to result in adverse impacts on the mental, physical and social
wellbeing of the individual and their families. As Hutton says, “workers should receive some minimum level of reward for their contribution, especially if that minimum is the precondition for dignified participation in a market economy.”
87 The Times, (Patrick Hosking) ‘Put paid to paid consultants’, 9 January 2010. (http://www.timesonline.co.uk/tol/comment/columnists/article6981589.ece (Paywall)
88 Available on our website.
89 Typically, votes cast against remuneration policies are in the low single percentages. See The Scotsman, ‘Shareholders’ anger grows but bosses’ pay deals are safe – for now’, 15 July 2010. http://thescotsman.scotsman.com/market-reports/Terry-Murden-Shareholders39-anger-grows.6420476.jp?articlepage=1
90 High Pay Commission, ‘More For Less’, 2011, p50. As above.
91 Available on our website
92 Hutton, ‘Hutton review’, Final Report, 2011, p78. As above.
93 Hutton, ‘Hutton review’, Final Report, 2011, p85-92. As above.
94 CDP ‘Investor CDP’ www.cdproject.net/en-US/Programmes/Pages/CDP-Investors.aspx
95 See website http://pharmafutures.org/

�� OneSociety