a thin layer chromatography laboratory experiment of medical importance
TRANSCRIPT

Laboratory Exercises
A Thin Layer Chromatography Laboratory Experiment of MedicalImportance
Received for publication, July 15, 2005, and in revised form, October 6, 2005
Loretta Sharma‡, Ankur Desai§, and Ajit Sharma§¶
From the ‡Science Division, Davenport University, Midland, Michigan 48642 and the §Department of Chemistry,Central Michigan University, Mt. Pleasant, Michigan 48859
A thin layer chromatography experiment of medical importance is described. The experiment involvesextraction of lipids from simulated amniotic fluid samples followed by separation, detection, and scanningof the lecithin and sphingomyelin bands on TLC plates. The lecithin-to-sphingomyelin ratio is calculated.The clinical significance of this number is discussed. Since this is a procedure that is often performed inmedical laboratories, most of the supplies and materials for the experiment are commercially available inkit form.
Keywords: Lecithin, sphingomyelin, TLC, clinical chemistry.
Our institution is involved in the training of clinical labo-ratory scientists. One of the courses that students musttake is Clinical Chemistry. This senior level course has alaboratory component that teaches a number of analyticaltechniques that are commonly used in medical laborato-ries. An experiment that has been successfully used forteaching chromatography is the determination of the leci-thin-to-sphingomyelin (L/S)1 ratio in samples of amnioticfluid. Although the experiment has been designed for theclinical chemistry laboratory, its simplicity and real-life ap-plications may make it suitable for other advanced courseswhere chromatography is taught, such as analytical chem-istry and biochemistry.
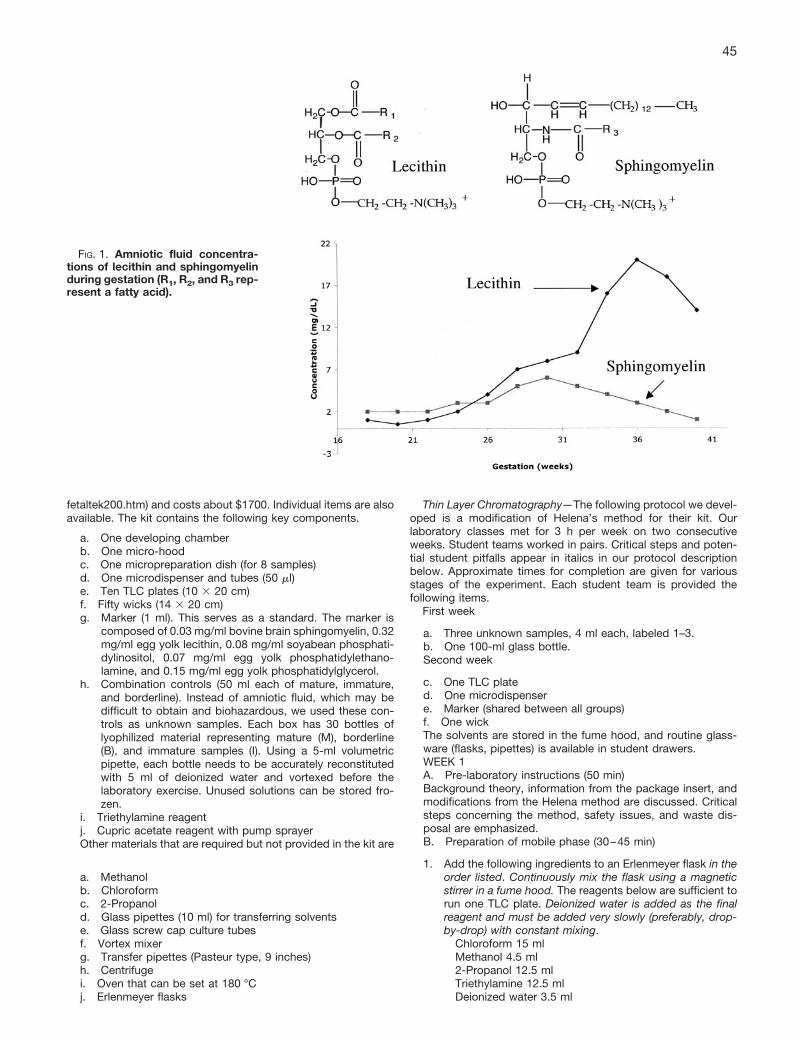
Lecithin and sphingomyelin are two of the many lipidsfound in human lungs. These lipids, together with proteinsand carbohydrates, form the surfactants of the lung. Theamount and nature of lung surfactant are major factors inthe ability of the fetus to survive after delivery. Surfactantreduces surface tension and is essential to the properfunctioning of the mature lung. In early pregnancy, lecithinand sphingomyelin make up about 20 and 50%, respec-tively, of total fetal surfactant lipids. As shown in Fig. 1,although the concentration of sphingomyelin remains fairlyconstant throughout gestation, the proportion of lecithincontinues to rise for the first 8 months [1, 2]. In the maturelung, lecithin comprises about 70% of the total surfactantlipids. An L/S ratio of 2 or more indicates that the fetallungs are producing sufficient lecithin, that the fetal lungsare mature, and that the baby is likely to be able to breathe
independently after birth. In this case, the baby may besafely delivered. A ratio of 1.5 or less indicates that thelungs are immature, that the lungs are not producingenough surfactant (particularly lecithin), and that laborshould be suppressed. Respiratory distress syndromemay result if the baby is delivered before the lungs havetime to fully mature. Respiratory distress syndrome is oneof the most common causes of deaths in newborns. AnL/S ratio between 1.5 and 1.9 indicates a borderline case.The L/S ratio is therefore an important clinical test, whichthe physician uses to make critical medical decisions thatmay affect the lives of both mother and baby [1, 2].
Although there are many lecithin-based fetal lung maturitytests (e.g. fluorescence polarization assay, HPLC, foam sta-bility index), this experiment is still a popular method inhospital laboratories due to its simplicity as well as theadvantages associated with not requiring any expensiveinstrumentation to purchase and maintain. It involves sepa-ration of various lipids from an amniotic fluid sample by TLC.We have used the Fetal Tek 200 kit from Helena Laborato-ries. This is an excellent one-dimensional TLC procedure fordetermining the L/S ratio and is a kit that many medicallaboratories commonly use [3, 4]. The sample is extractedwith a mixture of chloroform and methanol and appliedacross the channel of a TLC plate. The mobile phase is amixture of chloroform, methanol, 2-propanol, triethylamine,and water. The lecithin and sphingomyelin bands are wellseparated from the other phospholipids and neutral lipids.Plates are visualized by charring with phosphoric acid con-taining a cupric acetate catalyst. Scanning the lecithin andsphingomyelin bands on the TLC plates allows the calcula-tion of the lecithin-to-sphingomyelin ratio.
EXPERIMENTAL PROCEDURES
Supplies—The Fetal Tek 200 kit is available from Helena Lab-oratories (catalog number 8022; www.helena.com/catalog/
¶ To whom correspondence should be addressed: Dept. ofChemistry, Dow 345, Central Michigan University, Mt. Pleasant,MI 48859. Tel.: 989-774-3303; Fax: 989-774-3883; E-mail:[email protected].
1 The abbreviations used are: L/S, lecithin-to-sphingomyelin;M, mature; B, borderline; I, immature.
© 2006 by The International Union of Biochemistry and Molecular Biology BIOCHEMISTRY AND MOLECULAR BIOLOGY EDUCATIONPrinted in U.S.A. Vol. 34, No. 1, pp. 44–48, 2006
This paper is available on line at http://www.bambed.org44
fetaltek200.htm) and costs about $1700. Individual items are alsoavailable. The kit contains the following key components.
a. One developing chamberb. One micro-hoodc. One micropreparation dish (for 8 samples)d. One microdispenser and tubes (50 �l)e. Ten TLC plates (10 � 20 cm)f. Fifty wicks (14 � 20 cm)g. Marker (1 ml). This serves as a standard. The marker is
composed of 0.03 mg/ml bovine brain sphingomyelin, 0.32mg/ml egg yolk lecithin, 0.08 mg/ml soyabean phosphati-dylinositol, 0.07 mg/ml egg yolk phosphatidylethano-lamine, and 0.15 mg/ml egg yolk phosphatidylglycerol.
h. Combination controls (50 ml each of mature, immature,and borderline). Instead of amniotic fluid, which may bedifficult to obtain and biohazardous, we used these con-trols as unknown samples. Each box has 30 bottles oflyophilized material representing mature (M), borderline(B), and immature samples (I). Using a 5-ml volumetricpipette, each bottle needs to be accurately reconstitutedwith 5 ml of deionized water and vortexed before thelaboratory exercise. Unused solutions can be stored fro-zen.
i. Triethylamine reagentj. Cupric acetate reagent with pump sprayerOther materials that are required but not provided in the kit are
a. Methanolb. Chloroformc. 2-Propanold. Glass pipettes (10 ml) for transferring solventse. Glass screw cap culture tubesf. Vortex mixerg. Transfer pipettes (Pasteur type, 9 inches)h. Centrifugei. Oven that can be set at 180 °Cj. Erlenmeyer flasks
Thin Layer Chromatography—The following protocol we devel-oped is a modification of Helena’s method for their kit. Ourlaboratory classes met for 3 h per week on two consecutiveweeks. Student teams worked in pairs. Critical steps and poten-tial student pitfalls appear in italics in our protocol descriptionbelow. Approximate times for completion are given for variousstages of the experiment. Each student team is provided thefollowing items.
First week
a. Three unknown samples, 4 ml each, labeled 1–3.b. One 100-ml glass bottle.Second week
c. One TLC plated. One microdispensere. Marker (shared between all groups)f. One wickThe solvents are stored in the fume hood, and routine glass-ware (flasks, pipettes) is available in student drawers.WEEK 1A. Pre-laboratory instructions (50 min)Background theory, information from the package insert, andmodifications from the Helena method are discussed. Criticalsteps concerning the method, safety issues, and waste dis-posal are emphasized.B. Preparation of mobile phase (30–45 min)
1. Add the following ingredients to an Erlenmeyer flask in theorder listed. Continuously mix the flask using a magneticstirrer in a fume hood. The reagents below are sufficient torun one TLC plate. Deionized water is added as the finalreagent and must be added very slowly (preferably, drop-by-drop) with constant mixing.
Chloroform 15 mlMethanol 4.5 ml2-Propanol 12.5 mlTriethylamine 12.5 mlDeionized water 3.5 ml
FIG. 1. Amniotic fluid concentra-tions of lecithin and sphingomyelinduring gestation (R1, R2, and R3 rep-resent a fatty acid).
45

2. Once the mobile phase is prepared, it can be stored in aclosed glass bottle until the next laboratory period (in ourcase, 1 week later). A well prepared mixture is clear andcolorless.
C. Lipid extraction (30–45 min)
1. Label three glass screw-cap centrifuge tubes as “1,” “2,”and “3.”
2. Add 2 ml of unknown sample [1–3] into each labeledcentrifuge tube.
3. Add 2 ml of methanol into each of the three tubes. Mixeach tube by vortexing 10–15 s.
4. Add 2 ml of chloroform into each of the three tubes. Mixeach tube by vortexing 15–20 s.
5. Centrifuge the tubes at 3000 rpm (about 1500 � g) for atleast 10 min or until three distinct phases can be seen. Thetop layer is methanol. The thin (button-like) middle phase isa protein-rich layer, whereas the bottom layer is chloro-form. Portions of the middle button layer may be observedstuck to the sides of the tube, especially if a fixed-anglecentrifuge is used instead of a swinging bucket centrifuge.This does not interfere with the results.
6. Remove centrifuge tube 1 from the centrifuge and carefullytilt the tube at a 45° angle. Using a long Pasteur pipette,remove as much of the lowermost chloroform layer aspossible, taking care not to aspirate any of the methanol orprotein layer. Place this fraction in a small vial labeled “1E”(“E” representing the extract). Repeat this procedure withtubes 2 and 3, placing the chloroform layer into vialslabeled “2E” and “3E,” respectively.
7. Store the open vials (1E, 2E, and 3E) in a draft-free area forthe next laboratory period (a week later). By then, all thesolvent (chloroform) will have evaporated. Avoid leavingthe vials in drafty areas to prevent loss of the dried lipids.
D. Cleanup (10 min)
1. Discard the contents of the centrifuge tubes in the appro-priate waste containers (halogenated waste).
2. Wash centrifuge tubes and other glassware.WEEK 2E. Sample application (60 min)
1. Preheat oven to 180 °C.2. Place the wick into the developing chamber.3. Pour the mobile phase onto the wick in the developing
chamber. Cap the chamber.4. Swirl to saturate the wick and chamber. Allow to stand.
Proceed to the next step.5. Obtain a TLC plate. Hold the plate at all times during the
laboratory exercise from its edge, avoiding contact withthe adsorbent surface in particular. Using a pencil, verylightly draw a line �1⁄3 inch from the top of the preadsor-bent layer. The slight indentation made by the line will aidin proper sample application. Team members should initialthe very top of their plate to avoid mixing up their plateswith those of other students. Each team should constructa separate key on a piece of paper, identifying the sub-stance to be introduced into each numbered channel (lane)on the TLC plate, including channels for marker, 1E, 2E,and 3E.
6. Using the microdispenser, apply 40 �l of the Fetal-Tek 200marker as a streak across the indentation in the appropri-ate channel.
7. To the 1E vial containing evaporated sample obtained inweek 1, add 40 �l of chloroform; immediately cap the vial(or the solvent will evaporate) and swirl 10–20 s to com-pletely dissolve the extracted lipids. Do not transport theopen vial containing dried sample to avoid potential lossesof sample due to drafts. Repeat this procedure with the 2Eand 3E samples.
8. Apply the entire amount of reconstituted 1E sample across
one channel of the TLC plate, in accordance with the TLCkey.
9. Repeat step 8 for the 2E and 3E samples.10. Air-dry the plate (requires �15 min; alternatively, a hair
dryer may be used to hasten the process).11. Place the plate in the developing chamber with the pread-
sorbent layer at the bottom and the silica gel layer facingthe wick and then leave undisturbed during mobile phasemigration.
F. Sample separation, detection, and scanning (120 min)
1. Allow the separation to occur until the solvent front isabout a centimeter from the top of the plate (about 70 min).
2. Carefully remove the plate and dry it in the oven (180 °C),adsorbent face upward, for 3 min. CAUTION: Use appro-priate hand protection against the high temperature.
3. Cover one wall of a fume hood with tissue paper and placethe plate against the wall with the adsorbent face exposedfor spraying. Spray the surface of the plate uniformly withcupric acetate staining reagent, just until the entire plateadsorbent surface is wet.
4. Place the plate in the oven (180 °C), adsorbent face up-ward. CAUTION: Use appropriate hand protectionagainst the high temperature. Allow the bands to charuntil they show a blackish color (7–10 min). The lecithinand sphingomyelin bands should be clearly visible with arelatively clear background. If the lecithin and sphingomy-elin bands are still faint after 10 min, allow more time in theoven. However, students should closely monitor theirplates to make sure that the background does not becometoo dark to discern the bands. Remove the plate (CAU-TION: Use protective hand gear since the plate is veryhot) and let it cool on a heat-resistant bench (this takesabout 5 min). A photocopy of the plate is now made, eitherby the student or by the instructor.
5. Scan the lecithin and sphingomyelin bands, using a den-sitometer (such as CliniScan by Helena) or a digital scan-ner/software program (such as UN-SCAN-IT, Silk Scien-tific, Orem, UT, about $450), to determine the amount oflecithin and sphingomyelin in the samples. Divide the lec-ithin area (amount) by the sphingomyelin area to obtain theL/S ratio. Scanning should be done within 4 h as the bandsfade with time.
G. Cleanup (5 min)
1. Discard the used mobile phase into the appropriate wastecontainer (halogenated waste).
2. Discard the plate in the waste container for glass.
RESULTS AND DISCUSSION
Thin layer chromatography is one of the oldest, mostflexible, and most versatile separation techniques [5, 6].For example, synthetic chemists may use it to monitorreactions and biochemists may use TLC to separate andidentify biomolecules, whereas forensic analysts may useit to separate and identify drugs of abuse in body fluids.Hands-on experience with this important analytical tool istherefore essential for training undergraduates in chemis-try and biology. Students enjoy performing laboratory ex-periments for which they understand the practical impor-tance. The procedure we have described is one where astudent learns not only the proper performance of TLC butalso other skills such as sample extraction and the use ofa densitometer or computerized scanning software. A listof all the experiments completed by students in the labo-ratory is given in Table I.
The TLC plates available from Helena are packaged with
46 BAMBED, Vol. 34, No. 1, pp. 44–48, 2006

a detailed four-page insert that provides for the exercise asummary, principle, materials (reagents) list, step-by-stepprocedure with diagrams, expected results, sources oferror, and a bibliography of the L/S method. Copies of thisinsert are given to the students and discussed duringpre-laboratory lecture. Students hand in reports with per-tinent observations (such as the clarity of the mobilephase, appearance of the extraction layers, and descrip-tion of any precipitate formation during lipid extraction), aphotocopy of their plates (with all the lanes and the L andS bands labeled), L/S scans, calculations for the L/S ratios,and identities of their unknown samples (mature, imma-ture, or borderline) based on their calculated L/S ratios.
The unknown samples and standard (marker) and mostof the supplies for the above procedure are available in kitform from Helena Laboratories. Although real amnioticsamples collected from local hospitals may be utilized, wefound that this poses potential safety and confidentialityissues. In addition, the only procedural difference betweensimulated and real amniotic fluid samples is an additionalcentrifugation step in the case of the latter. Therefore theuse of real samples does not provide any significant learn-ing experience. Each group (pair) of students uses oneTLC plate, 4 ml each of M, B, and I unknown samples, and40 �l of marker. The total cost of consumables is thereforeabout $49 per student. The cost of other consumables(organic solvents, wicks, stain) will increase this priceslightly. If each student was given one sample (M, I, or B)and used only one channel on the TLC plate (i.e. eightstudents, or four teams, share one TLC plate, whereas theninth channel is used for the marker), then the cost ofthese consumables will be approximately $15 per student.If the costs need to be reduced further, we suggest thefollowing. Since the TLC plate is one of the more expensiveitems, other types and sources of plates may be consid-ered. For example, Sheikh et al. [1] used LK-5 silica gelnormal phase plates (Whatman Inc., Clifton, NJ). The costof the marker and unknown samples (M, I, and B) fromHelena may also be reduced if the instructor preparesthese materials from purified lipids (available from AvantiPolar Lipids, Inc. www.avantilipids.com) [1]. The stainingreagent can be made as 3% (w/v) cupric acetate in 8%(v/v) phosphoric acid. Instead of using Helena’s micro-hood and micropreparation dish, we simply air-dry (or usea hair dryer) our samples (step C7) and the TLC plate (stepE10). Although we use the Fetal-Tek 200 developing
chamber, any glass container with an organic solvent-resistant lid may be used to run the plates. In addition, asimilar size filter paper can be used as the wick.
An important modification to the original protocol fromHelena involves step C6. Instead of removing only 1.0 ml ofthe bottom chloroform layer containing the extracted lipids,students remove as much of this layer as possible withoutaffecting the other layers. This modification yields a largersample size that leads to darker bands on the TLC plate.
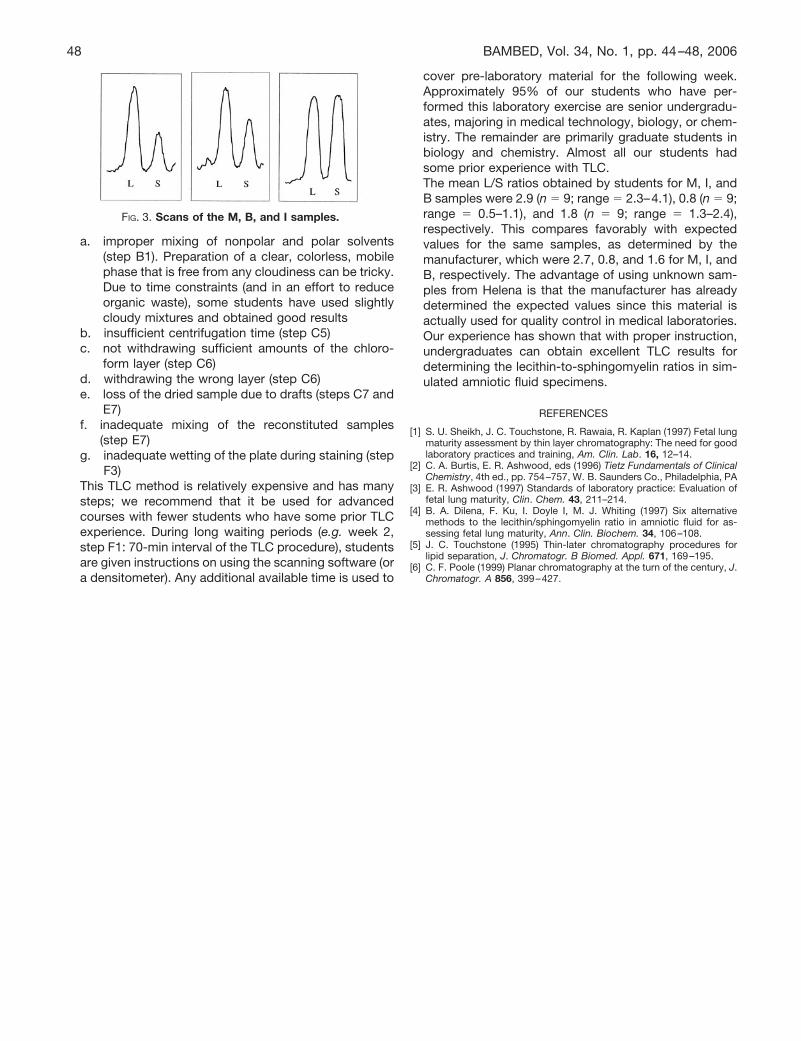
An example of a well developed plate produced by astudent group is shown in Fig. 2. The lecithin and sphin-gomyelin bands are dark and well separated. The back-ground is clear. Of incidental interest, the marker (lane 3)also shows the phosphatidylinositol (PI) and phosphatidylglycerol (PG) bands. The marker also contains phosphati-dylethanolamine (PE), which is sometimes seen. When thelecithin and sphingomyelin bands are present, they arealways sufficiently resolved such that densitometry scansreveal two clearly distinct peaks. As shown in Fig. 2 (lanes1 and 2), the mature samples show much darker lecithinbands in comparison with the sphingomyelin bands. Thisdifference is less marked in the borderline samples (lanes4 and 5) and absent in the immature samples (lanes 7 and8). Scans of the lecithin and sphingomyelin bands areshown in Fig. 3. The L/S ratios for the scans shown were2.8, 1.8, and 0.9 for the mature, borderline, and immaturesamples, respectively. The plate (or its photocopy) wasscanned with a digital scanner. The image was then ana-lyzed with digitizing software (UN-SCAN-IT). A more ex-pensive alternative for image analysis is the use of a scan-ning densitometer (such as CliniScan from Helena).
Although the TLC technique for determining the L/S ratiohas been optimized, it is not foolproof. Lack of attention tokey steps can result in poorly developed plates. The leci-thin and sphingomyelin bands in the final plate may beeither not visible or only faintly visible. In addition, thebands may appear “spotty.” The primary reasons for poorquality of plates include
TABLE IList of experiments in the Clinical Chemistry laboratory
1. Gravimetric pipette calibration
2. Concepts in clinical analysis: Calibration, calibrationverification, reportable range using a pH meter
3. Serum protein, calcium, and chloride assays withnon-enzymatic reagents
4. Serum glucose and cholesterol assays with enzymaticreagents
5. Enzyme assays: Measuring LDH activity in serum6. Urinalysis7. Electrophoresis: Serum protein electrophoresis8. Chromatography: Determining the L/S ratio9. Immunoassays: Quantitative analysis of immunoglobulin A
10. Automated analysis: Ektachem DT60 and TDx11. Phlebotomy12. Quality control in the clinical laboratory
FIG. 2. A developed Fetal-Tek 200 Plate. Lanes 1 and 2 rep-resent mature samples, lane 3 is the marker, lanes 4 and 5 are theborderline samples, and lanes 7 and 8 are the immature samples,whereas lanes 6 and 9 are empty. PG, phosphatidyl glycerol; PE,phosphatidylethanolamine; PI, phosphatidylinositol.
47
a. improper mixing of nonpolar and polar solvents(step B1). Preparation of a clear, colorless, mobilephase that is free from any cloudiness can be tricky.Due to time constraints (and in an effort to reduceorganic waste), some students have used slightlycloudy mixtures and obtained good results
b. insufficient centrifugation time (step C5)c. not withdrawing sufficient amounts of the chloro-
form layer (step C6)d. withdrawing the wrong layer (step C6)e. loss of the dried sample due to drafts (steps C7 and
E7)f. inadequate mixing of the reconstituted samples
(step E7)g. inadequate wetting of the plate during staining (step
F3)This TLC method is relatively expensive and has manysteps; we recommend that it be used for advancedcourses with fewer students who have some prior TLCexperience. During long waiting periods (e.g. week 2,step F1: 70-min interval of the TLC procedure), studentsare given instructions on using the scanning software (ora densitometer). Any additional available time is used to
cover pre-laboratory material for the following week.Approximately 95% of our students who have per-formed this laboratory exercise are senior undergradu-ates, majoring in medical technology, biology, or chem-istry. The remainder are primarily graduate students inbiology and chemistry. Almost all our students hadsome prior experience with TLC.The mean L/S ratios obtained by students for M, I, andB samples were 2.9 (n � 9; range � 2.3–4.1), 0.8 (n � 9;range � 0.5–1.1), and 1.8 (n � 9; range � 1.3–2.4),respectively. This compares favorably with expectedvalues for the same samples, as determined by themanufacturer, which were 2.7, 0.8, and 1.6 for M, I, andB, respectively. The advantage of using unknown sam-ples from Helena is that the manufacturer has alreadydetermined the expected values since this material isactually used for quality control in medical laboratories.Our experience has shown that with proper instruction,undergraduates can obtain excellent TLC results fordetermining the lecithin-to-sphingomyelin ratios in sim-ulated amniotic fluid specimens.
REFERENCES
[1] S. U. Sheikh, J. C. Touchstone, R. Rawaia, R. Kaplan (1997) Fetal lungmaturity assessment by thin layer chromatography: The need for goodlaboratory practices and training, Am. Clin. Lab. 16, 12–14.
[2] C. A. Burtis, E. R. Ashwood, eds (1996) Tietz Fundamentals of ClinicalChemistry, 4th ed., pp. 754–757, W. B. Saunders Co., Philadelphia, PA
[3] E. R. Ashwood (1997) Standards of laboratory practice: Evaluation offetal lung maturity, Clin. Chem. 43, 211–214.
[4] B. A. Dilena, F. Ku, I. Doyle I, M. J. Whiting (1997) Six alternativemethods to the lecithin/sphingomyelin ratio in amniotic fluid for as-sessing fetal lung maturity, Ann. Clin. Biochem. 34, 106–108.
[5] J. C. Touchstone (1995) Thin-later chromatography procedures forlipid separation, J. Chromatogr. B Biomed. Appl. 671, 169–195.
[6] C. F. Poole (1999) Planar chromatography at the turn of the century, J.Chromatogr. A 856, 399–427.
FIG. 3. Scans of the M, B, and I samples.
48 BAMBED, Vol. 34, No. 1, pp. 44–48, 2006