a the impact of interest rate capping on the kenyan ... · the government’s commitment to a free...
TRANSCRIPT

C E N T R A L B A N K O F K E N Y AThe Impact of Interest Rate Capping on the Kenyan Economy - March 2018
1

C E N T R A L B A N K O F K E N Y AThe Impact of Interest Rate Capping on the Kenyan Economy - March 2018
2
AbstractThe interest capping law became operational on September 14, 2016. It was implemented following concerns raised
by the public regarding the high cost of credit in Kenya, which was viewed as a hindrance to credit access by a large
segment of the population. Implementation of the law, was therefore, expected to lower the cost of credit and increase
access to credit. The objective of this study is to investigate the impact of the interest rate capping law in Kenya.
Although the period since the law became operational may not be sufficiently long for the full effects on the economy
to manifest, we nonetheless investigate based on the emerging evidence, whether the intentions of the interest rate
capping law have been achieved. To unravel the evidence, we first review the literature on the outcomes of interest
rate controls. International experience shows that in most cases, caps have produced undesirable outcomes, such as
reduced intermediation and transparency, reduced bank competition and increased risk to financial stability.
Using bank level data covering the period before and after the interest rate capping law, coupled with selected
macroeconomic indicators, our analysis shows that interest rate caps have started to yield negative effects which
include the following: First and foremost, the capping of interest rates has infringed on the independence of the central
bank and complicated the conduct of monetary policy. It is found that under the interest rate capping environment,
monetary policy produces perverse outcomes. Secondly, there is evidence of reduced financial intermediation by
commercial banks, as exemplified by the significant increase in the average loan size arising from declining loans
accounts, mainly driven by the large banks, thus shunning the smaller borrowers. Thirdly, banks have shifted lending
to Government and the large corporates. Whereas demand for credit immediately increased following the capping of
lending rates, credit to the private sector has continued to decline. Fourthly, while the structure of revenue of the banks
has started to shift away from interest income, some banks have exploited the existing approval limits to increase fees
on loans in a bid to offset loss in interest income. Fifth, although the banking sector remains resilient, small banks have
experienced significant decline in profitability in recent months, which may complicate their viability. Sixth, rationing
out Micro, Small and Medium Enterprises (MSMEs) from the credit market by the commercial banks is estimated to
have lowered growth in 2017 by 0.4 percentage points. However on the other side, banks have started adjusting their
business models towards enhancing efficiency. We note that these outcomes which have emerged in the last one year
may present a partial picture, as a much clearer picture is envisaged to emerge in the medium to long term.

C E N T R A L B A N K O F K E N Y AThe Impact of Interest Rate Capping on the Kenyan Economy - March 2018
3
Table of ContentsA. Introduction ...................................................................................................................................4
Historical Developments on Controls in Kenya ........................................................................................................ 5
Controls in the Banking Sector ................................................................................................................................... 5
Controls in the Foreign Exchange Market ................................................................................................................. 7
Interest Rates and Cost of Credit in Kenya ............................................................................................................... 8
Interest Rate Capping and Central Bank Independence ....................................................................................... 11
B. Overview of Available Evidence on Impact of Interest Rate Controls ..................................................12
Evidence on interest rate caps - International experience ................................................................................... 12
Preliminary evidence on impact of interest rate caps- Surveys on Kenya ......................................................... 13
C. Expected Outcomes .......................................................................................................................15
D. Empirical Strategy ........................................................................................................................16
E. The Evidence .................................................................................................................................16
Impact on demand for credit .................................................................................................................................... 16
Impact on financial intermediation ......................................................................................................................... 17
Impact on competition in the banking industry .................................................................................................... 20
Impact on Transparency in the Banking Industry ................................................................................................. 20
Risks to Financial Stability ........................................................................................................................................ 22
Migration to Alternative Borrowing Avenues ......................................................................................................... 28
Impact on the Conduct of Monetary Policy ............................................................................................................ 28
Impact on Economic Performance ........................................................................................................................... 29
F. Conclusion ....................................................................................................................................31
REFERENCES ....................................................................................................................................32

C E N T R A L B A N K O F K E N Y AThe Impact of Interest Rate Capping on the Kenyan Economy - March 2018
4
A. Introduction1. Kenya embraces a free market economy despite the interest rate capping law. Kenya’s financial sector
policy environment has evolved from a period of direct
controls in the 1970s to full liberalization in the 1990s,
thereby paving way for market-determined interest
rates. The Government’s commitment to a free market
economy is enshrined in the Sessional paper No.1 of
1986 on Economic Management for Renewed Growth.
The sessional paper outlined the direction the country
desired to follow in the wake of sub-optimal economic
outcomes arising from various forms of controls that were
in place at the time. These controls were introduced at
independence in line with the Government policy agenda
which embraced a mixed economy as outlined in the
Sessional Paper No. 10 of 1965 on African Socialism and
its application to planning in Kenya.
2. The amended law capping interest rates in Kenya came into force in September 2016, setting limits on lending and deposit rates. In August 2016,
the President of Kenya signed the Banking (Amendment)
Bill 2015. The Banking (Amendment) Act, 2016 came
into effect on September 14, 2016. It sets the maximum
lending rate at no more than four per cent above the
Central Bank base rate; and the minimum interest rate
granted on a deposit held in interest earning account to
at least seventy per cent of the same rate. For purposes
of the amended Banking Act (Section 33B) and in line
with the Central Bank of Kenya (CBK) Act (Section 36(4)),
the CBK set the Central Bank Rate (CBR) as the base rate.
3. However, interest rate capping law undermines the independence of the Central Bank and impacts on the conduct of monetary policy. The independence
of the Central Bank of Kenya as anchored in Article 231
of the Constitution stipulates that the Bank shall not be
under the direction or control of any person or authority
in the exercise of its powers or in the performance of
its functions. In the execution of its core mandate of
formulating and implementing monetary policy directed
at achieving and maintaining stability in the general level
of prices, the Central Bank uses the Central Bank Rate
(CBR) to achieve monetary policy objectives. In addition,
the interest rate capping regime has resulted in perverse
monetary policy outcomes in which accommodative
monetary policy stance has resulted in deceleration in
growth of credit to the private sector.
4. Evidence of the impact of interest rate capping have started to emerge. Emerging evidence show that
commercial banks have adjusted their business models
resulting in declining financial intermediation, directed
their lending in favour of large corporate borrowers and
Government thereby shunning small and risky borrowers,
and reduced transparency. Although the banking sector
remains resilient the evidence point towards reduced
competition and decline in profitability notably for
Tier III banks. The impact on economic growth has also
begun to show, though this may take longer time to fully
materialize.
5. The objective of this study is to assess the emerging impact of interest rate capping in Kenya. The rest of the paper is organized as follows; Part 1.1
discusses historical developments on controls in Kenya;
Part 1.2 discusses interest rates and cost of credit in Kenya
while part 1.3 highlights interest rate capping and central
bank independence. Part 2.0 provides an overview of
evidence of impact on impact of interest rate controls;
Part 3 outlines the expected outcome; Part 4 provides the
empirical strategy while Part 5 discusses the evidence of
impact of caps and Part 6 concludes.

C E N T R A L B A N K O F K E N Y AThe Impact of Interest Rate Capping on the Kenyan Economy - March 2018
5
Historical Developments on Controls in Kenya
6. Following independence in 1963, Kenya embraced policies which had a market orientation of mixed economy. The publication of the Sessional Paper
No. 10 of 1965 on African Socialism and its application
to planning in Kenya, outlined the government intention
to implement policies to foster African socialism, growth
and development. Among the raft of policies outlined in
the Sessional Paper was the control of resources to ensure
that property is used in the mutual interests of society
and its members. At the time it was felt that in order to
control effectively, sufficiently and not excessively many
types and degrees of controls were required ranging
from none, through influence, guidance and control of a
few variables such as prices and quantities, to absolute
control represented by state ownership and operations.
7. The controls were exercised in virtually all sectors of the economy. Price, wage, rent and output
controls, import duties, income taxes and subsidies
were used selectively and in combinations to direct the
uses of private property, limit profits, and influence the
distribution of gains. In this section we discuss selected
controls which were implemented in the banking and
the foreign exchange market with a view to helping us
conceptualize what the consequences of the current
interest rate capping will be in the medium to the long-
term.
Controls in the Banking Sector
8. Kenya’s experience with interest rate caps dates back to post-independence period. After attaining
independence in 1963, the Government pursued a
regime of interest rate capping and quantitative credit
controls with the aim of encouraging investment and
spurring economic growth and development. Interest
rate controls entailed fixing minimum saving rates for all
deposit taking institutions and maximum lending rates
for all commercial banks, NBFIs and building societies.
As a result the spread between the lending and savings
rate were stable.
9. The government policy of maintaining low interest rates (financial repression) resulted in negative real interest, especially in periods affected by shocks. Following the inflationary pressures associated
with the economic shocks that hit the country in the
early 1970s, interest rates on both deposits and loans
were raised for the first time since independence in June
19631. Nonetheless, the real interest rates remained
negative until the mid-1980s. Low and largely negative
real rate affected savings mobilization leading to low
savings levels2. Control of deposit rates resulted in the
suppression of mobilization of financial savings and
amount of loanable funds. As a result, loans advanced
1 1974–1978 Development Plan.2 This is the central pillar of the so called Macknnon and Shaw
Hypothesis on financial repression. Data on savings rate was obtained from Mwega, F.M, Ngola, S.M and Mwangi, N. (1990). Real Interest rates and Mobilization of Private Savings in Africa: A Case Study of Kenya. AERC Research Paper No. 2.
Figure 1: Interest rates and spreads
Source: CBK

C E N T R A L B A N K O F K E N Y AThe Impact of Interest Rate Capping on the Kenyan Economy - March 2018
6
by banks were biased towards short
term credit to parastatals and major
firms. Moreover, the measures under
the interest rate control policy regime
were not sufficient to deal with or
offset the adverse effects of external
shocks.
10. Controls in the banking sector resulted in growth of credit to the public sector. The Government had firm control over the allocation of credit to various sectors. Sectors which were perceived to be important were allocated a larger share of credit. However, these sectors were not necessarily profitable to repay the loans.
• In the allocation of credit, the government took a substantial and rising share of loanable funds to finance the budget deficit and fund parastatals. The share of government net domestic credit rose from an average of 18 percent in 1970-74, to an average of approximately 45 percent in 1990-93.
11. Consequently, Bank failures were witnessed during this period largely on account of poor lending policies, undercapitalization and poor management3. Following
increased leading to government
by the banks to finance the bloated
public sector, including financing
the loss making state corporations,
3A list of the failed banks and reasons for failure is shown in Appendix II.
Figure 3: Share of credit of the banking sector to Government (%)
Figure 2: Savings and real deposit rates
-‐15
-‐13
-‐11
-‐9
-‐7
-‐5
-‐3
-‐1
1
3
5
10
12
14
16
18
20
22
24
26
28
1966
1968
1969
1970
1971
1972
1973
1974
1975
1976
1977
1978
1979
1980
1981
1982
1983
1984
1985
Real Dep
osit Ra
te (%
)
Savings R
ate (%
)
private savings rate real deposit rate
18.0
32.1
37.9
44.6 45.0
0.0
5.0
10.0
15.0
20.0
25.0
30.0
35.0
40.0
45.0
50.0
1970-‐74 1975-‐79 1980-‐84 1985-‐89 1990-‐93
Source: CBK
Source: CBK

C E N T R A L B A N K O F K E N Y AThe Impact of Interest Rate Capping on the Kenyan Economy - March 2018
7
the banks started to experience challenges resulting in
bank failures. The reasons advanced for the widespread
bank failures include: non-performing loans; unsecured
insider lending; mismanagement; ineffective Board;
undercapitalization and poor lending policy.
Controls in the Foreign Exchange Market
12. The Exchange Control Act CAP 113 and its subsidiary legislation, rules and regulations anchored activity in the foreign exchange market. The Act
provided that all foreign exchange transactions (such as
sale, purchase, borrowing or lending of foreign currency
as well as maintenance of foreign balances, payment
to non-residents, export of any financial instrument or
bill of exchange and transfer of securities between non-
residents and residents) were prohibited unless directly
permitted by the Central Bank of Kenya or directly
through the authorized dealers.
13. Forex controls resulted in rationing of the foreign exchange. The government resorted to
rationing of foreign exchange with priority being given
to importers of essential goods while tight restrictions
were imposed on the non-essential imports. However,
bureaucratic procedures made it difficult to access forex
to import essential goods. On the other hand, a parallel/
black market for foreign exchange emerged to address
the growing foreign exchange needs for non-essential
imports.
14. The parallel market had a high forex premium4. The exchange rate in the parallel market fluctuated
according to the forces of demand and supply for the
US dollar and other desired currencies. For instance,
during the international oil crisis in 1973, and prolonged
4Data was obtained from a study by Kidane A. (1994). Indices of Effective Exchange Rates: A comparative study of Ethiopia, Kenya and the Sudan, AERC Research Paper No. 29.
drought in 1981-84, which resulted in increased cost of importation of fuel and food, the parallel market premium was above 40 percent of the official exchange rate. The parallel market exchange rate was considered as proxy
for a floating exchange rate.
15. The fixed official exchange rates against all the major currencies was not reflective of the true value of the Kenyan currency5. Following the high inflation in the country relative to the rest of the world during the mid-1970s and 1980s, the real exchange rate became overvalued. The magnitude of misalignment was moderate in the 1970s, averaging 13.6 percent, rising to
approx. 28.6 percent in the 1980s.
5The misalignment is calculated as percent deviation of parallel real effective exchange rate from the official real effective exchange rate. Data extracted from Kidane A. (1994). Indices of Effective Exchange Rates: A comparative study of Ethiopia, Kenya and the Sudan, AERC Research Paper No. 29.
Figure 5: RER and RER mislignment: 1970-88
Figure 4: Exchange rate Ksh/US$ and parallel market premium (%)
Source: CBK
Source: CBK

C E N T R A L B A N K O F K E N Y AThe Impact of Interest Rate Capping on the Kenyan Economy - March 2018
8
16. Overvalued exchange rate impacted on exports competitiveness. Following fixed exchange rate
regime the overvalued exchange rate undermined
exports performance. The exports to GDP ratio stood
at approximately 28 percent in 1970-74, rising to
approximately 32 percent in 1975-79. However, the
various controls in the economy at the time, including
overvalued real exchange rate, resulted in a decline
in exports performance to 17 percent in 1980-84, and
remained at almost the same level for the remainder of
the 1980s to early 1990s.
28
32
17
13.6 13
-‐35.0
-‐30.0
-‐25.0
-‐20.0
-‐15.0
-‐10.0
-‐5.0
0.0
0
5
10
15
20
25
30
35
1970-‐74 1975-‐79 1980-‐84 1985-‐89 1990-‐92
RER Misalignm
ent
Expo
rt/G
DP (%
)
Figure 6: Export/GDP and RER misalignment
RER misalignment Export/GDP
Figure 6: Export/GDP and RER misalignment
Figure 7: Per capita GNP (Ksh) and Real GNP growth (%)
8.4
5.7
3.4
-‐0.3
-‐1.0
0.0
1.0
2.0
3.0
4.0
5.0
6.0
7.0
8.0
9.0
0.0
500.0
1000.0
1500.0
2000.0
2500.0
3000.0
3500.0
1966-‐69 1970-‐74 1975-‐79 1980-‐85
Real GNP Growth (%
)
Per C
apita
GNP (KSh)
Per capita GNP Real GNP growth
17. The many controls imposed on various sector resulted in significant contraction of the economy. At the inception of the controls, the real GNP growth
average 8.4 percent in 1966-69. Thereafter it declined
to 5.7 percent in 1970-74. Despite the coffee boom of
1976-77, the average growth during 1975-79 declined
to 3.4 percent. In 1980-84, the economy had contracted
by 0.3 percent. During this time the per capita real GNP
stagnated.
Interest Rates and Cost of Credit in Kenya
18. A market based interest rates determination was instituted in early 1990s following liberalization of the economy. In 1990 banking institutions were
allowed to reflect all lending related charges and fees on
the cost of credit thereby resulting in higher effective rates
on loans relative to the stipulated ceilings. Eventually, the
interest rates were liberalized in July 1991. However, the
interest rate spreads remained high.
Figure 8: Evolution of Interest Rate Spreads in Kenya
0.0
2.0
4.0
6.0
8.0
10.0
12.0
14.0
16.0
18.0
Jul-‐91
Oct-‐92
Jan-‐94
Apr-‐95
Jul-‐96
Oct-‐97
Jan-‐99
Apr-‐00
Jul-‐01
Oct-‐02
Jan-‐04
Apr-‐05
Jul-‐06
Oct-‐07
Jan-‐09
Apr-‐10
Jul-‐11
Oct-‐12
Jan-‐14
Apr-‐15
Jul-‐16
Oct-‐17
Source: CBK
Source: CBK
Source: CBK

C E N T R A L B A N K O F K E N Y AThe Impact of Interest Rate Capping on the Kenyan Economy - March 2018
9
19. High cost of credit triggered debate on interest rate capping. Following concerns with the high cost of
credit and interest rate spreads, the interest rate capping
debate began in 2001, when a bill was introduced in
Parliament proposing to peg commercial banks interest
rates to the 91-day Treasury bill rate as CBK did not have a
base rate at the time. The second attempt in 2013, called
for rates to be capped consistent with the Central Bank
Rate - both attempts failed largely on the strength of
the arguments for free market interest rate structure. In
addition, the banks were given a chance to self-regulate in
terms of designing measures towards lower cost of credit.
20. The Government initiated measures in a bid to lower the cost of credit and prevent capping of interest rates. These initiatives include the following:
• The Credit Information Sharing. Credit Reference
Bureaus (CRBs) were established to enhance
credit information sharing mechanism and aid
lenders in undertaking credit decisions based on
credit history of borrowers.
• The Kenya Bankers Reference Rate (KBRR). The
National Treasury constituted a Committee
in January 2014 to explore ways of enhancing
private sector credit and mortgage finance
supply in Kenya. To enhance transparency in
pricing of credit, the Committee recommended
introduction of a transparent credit pricing
framework known as the Kenya Banks’ Reference
Rate (KBRR). However, in practice, KBRR was less
effective, owing to various challenges including
the modalities of its computation and the limited
flexibility of its review. Moreover, whereas the
KBRR framework was duly implemented, it did
not satisfactorily address the public concern
regarding the high cost of credit.
• Establishment of currency centres to help lower
transaction costs associated with transporting
cash over long distances across the country.
21. Despite numerous efforts by the Government, the Banking Sector continued to maintain high cost of credit with noticeable differences across bank tiers. The interest rate spreads remained high, with variations
across bank tiers and loan type. Whereas large banks (Tier
1) consistently maintained higher interest rate spreads,
on average the small banks (Tiers 3) had the lowest and
stable spreads, with medium-sized banks (Tier 2) falling
in-between. In terms of borrowers, corporate clients
enjoyed lower lending rates compared to personal and
business categories, with the later attracting the highest
rates. The variation in lending rates largely reflects
variations in pricing of actual or perceived risks for
different categories of borrowers, while variation across
banks reflects the different funding constraints that
characterize the bank tiers.
Figure 9: Interest Rate Spreads by Bank Tier
Source: CBK

C E N T R A L B A N K O F K E N Y AThe Impact of Interest Rate Capping on the Kenyan Economy - March 2018
10
22. Compared to its peers, Kenya’s banks maintained high interest rate spreads. Calls for capping
interest rates were mainly anchored on the high spreads
between lending rates and deposit rates compared to
other developing peer economies, and the resulting
high profitability in the sector. Although Kenya’s average
Table 1: Interest Rate Spreads across Countries and Regions 2000 2004 2008 2009 2011 2012 2013 2014 2015 2016Angola 6.4 6.7 6.0 8.1 12.4 13.1 12.7 12.9 13.6 10.2Botswana 6.1 5.9 7.9 6.3 5.9 7.4 7.1 6.5 5.4 5.2Algeria 2.5 4.4 6.3 6.3 6.3 6.3 6.3 6.3 6.3 6.3Egypt. Arab Rep. 3.8 5.7 5.7 5.5 4.3 4.4 4.6 4.8 4.7 5.7Kenya 14.2 10.1 9.5 9.7 10.8 12.0 10.8 9.9 9.2 9.5Mauritius 11.2 12.9 1.4 0.8 1.8 2.4 1.7 1.7 2.4 3.3Namibia 7.9 5.0 5.4 4.9 4.4 4.4 4.3 4.5 4.6 4.2Nigeria 9.6 5.5 3.5 5.1 10.3 8.4 8.8 7.2 7.7 9.4South Africa 5.3 4.7 3.5 3.2 3.3 3.3 3.3 3.3 3.3 3.3World 7.4 6.0 5.7 5.7 5.8 5.4 5.8 5.5 5.3 5.5East Asia and Pacific 5.0 5.4 4.6 5.0 5.0 5.0 5.0 4.9 5.0 4.8
Sub-Saharan Africa 13.6 12.9 6.7 6.7 8.0 7.1 7.1 7.2 6.8 6.1
interest rate spread that stood at 14.2 percent in 2000 had
declined to 9.9 percent by 2014, it was still high compared
to Kenya’s comparators such as Mauritius, Namibia and
South Africa which had much lower interest rate spreads.
23. As a result of high interest spreads Kenya’s banking sector remained highly profitable compared to peers thus provoking debate on interest rate capping in the country. The profitability ratios in the
banking sector had remained high compared to other
countries in the African region. For example in 2016, the
return on assets (ROA) and return on equity (ROE) in
Kenya stood at 3.1 percent and 24.5 percent, respectively
– which is much higher compared to other countries in
the region.
Source: World Bank

C E N T R A L B A N K O F K E N Y AThe Impact of Interest Rate Capping on the Kenyan Economy - March 2018
11
Table 2: Bank’s Return on Assets and Return on Equity in Selected CountriesYEAR 2012 2013 2014 2015 2016Panel A: Return on Assets (ROA)Mauritius 1.4 1.3 1.4 1.2 1.4Nigeria 2.4 2.3 2.5 2.5 1.3South Africa 1.3 1.5 1.5 1.5 1.7Malaysia 1.6 1.5 1.5 1.2 1.4UK 0.2 0.2 0.3 0.3 0.3Czech Republic 1.4 1.2 1.2 1.1 1.3Australia 1.2 1.4 1.2 1.4 0.8Singapore 1.4 1.2 1.1 1.2 1.1Brazil 1.4 1.4 1.4 1.5 1.1Kenya 4.6 3.6 3.4 3.1 3.1Panel B: Return on Equity (ROE)Mauritius 18.1 15.3 15.2 12.1 13.6Nigeria 18.9 18.9 21.2 19.7 10.3South Africa 17.7 18.6 18.8 20.7 22.2Malaysia 17.3 15.8 15.0 12.3 12.3UK 3.2 3.8 5.6 4.4 3.8Czech Republic 20.4 16.2 16.5 14.2 16.6Australia 23.0 27.0 23.0 23.8 22.0Singapore 16.4 15.3 13.2 13.6 11.3Brazil 13.1 13.1 13.2 15.4 11.3Kenya 29.8 28.9 26.6 25.2 24.5Source: IMF FSIs data
24. The debate about the high cost of credit culminated into the Banking (Amendment) Act 2016, aimed at lowering the cost of credit. The
Central Bank has continued to implement the new law.
However, concerns were raised regarding the negative
consequences of the amended law. The impact of this
law may be witnessed in the short term, and the medium-
and long term.
Interest Rate Capping and Central Bank Independence
25. Interest Rate Capping undermines the independence of the Central Bank which is entrenched in the Constitution of Kenya. Article 231 of the
Constitution establishes the Central Bank of Kenya and
stipulates that the Bank shall not be under the direction
or control of any person or authority in the exercise of
its powers or in the performance of its functions. The
constitutional function of CBK under Article 231 (3) is to
formulate monetary policy, promote price stability, issue
currency and perform other functions conferred upon it
by an Act of Parliament.
26. Under the Central Bank of Kenya Act, the principal object of the Central Bank is to formulate and implement monetary policy directed to achieving and maintaining stability in the general level of prices. The CBR is one of the tools that the CBK uses to signal
the direction of monetary policy with the aim of curbing
inflation or achieving other Central Bank objectives.
There is therefore a risk that if the CBR is directly linked
to the borrowing rates for banks, this will inevitably
influence decisions made by the Monetary Policy
Committee in its deliberations around the CBR. Linking

C E N T R A L B A N K O F K E N Y AThe Impact of Interest Rate Capping on the Kenyan Economy - March 2018
12
the CBR to the borrowing rates for banks and directing
the CBK to publish a “base rate” in this regard, impairs
decision making and usurps the Bank’s autonomy in the
delivery of its constitutional mandate of formulating and
implementing monetary policy.
27. While the intention of enacting the Banking (Amendment) Act, 2016 may be noble, it contains several ambiguities, vague and imprecise provisions which have been challenged in court. The ambiguity
and equivocal nature of the Amendment Act lends it
to various contradictory interpretations thus depriving
consumers of their constitutional right to have the
information necessary for them to gain the full benefit
of the new law.
B. Overview of Available Evidence on Impact of Interest Rate Controls
Evidence on interest rate caps - International experience
28. Globally, capping of interest rates has been declining over time6. Several countries have adopted some form of interest rate capping, including some advanced economies such as France, Germany and the USA. Nonetheless, caps on interest rates has declined over the years with more countries adopting liberal financial policies. However, the financial crisis of 2008 re-opened the debate on interest rate controls as a tool for consumer protection—El Salvador (2012), Kyrgyz Republic (2013) and Zambia (2013) introduced fresh
interest caps after the financial crisis.
6 The World Bank Working paper of 2014 by Maimbo and Gallegos (2014) on interest rate caps is one of the most widely cited papers as it provides a comprehensive review and general global landscape on interest rate caps. Overall, 76 countries around the world impose some form of interest rate caps on loans, most of which are in Sub Saharan Africa (SSA), and in Latin America and the Caribbean (LAC)
29. Arguments for use of interest rate ceilings are varied. These include use of caps to support a specific
industry or sector, protect consumers from usury and
exploitation, protect borrowers from predatory lending
and excessive interest rates, form of subsidy to specific
groups, decrease the risk-taking behavior of credit
providers, among others.
30. International experience shows that interest rate caps generally have negative effects which tend to worsen with time. Countries with interest rate capping
law have reported the following effects:
• A withdrawal of banks from the poor or specific segments of the society, such as the
small borrowers due to higher loan management
costs - evident in WEAMU countries, Bolivia,
Columbia, the Dominican Republic, Ecuador,
Haiti, Nicaragua, Peru, Poland and Zambia
• An increase in average loan size, pointing to
lower access by small borrowers and larger loans
to more established firms - evident in Bolivia,
Ecuador, South Africa and Zambia.
• Reduced transparency - an increase in the
total cost of loans through additional fees and
commissions - witnessed in Armenia, Nicaragua.
South Africa, and Zambia
• Decreased diversity of products for low-income
households- witnessed in France and Germany
• Reduced banking competition – witnessed in Italy.
• An increase in illegal lending – evident in Japan
and the United States.

C E N T R A L B A N K O F K E N Y AThe Impact of Interest Rate Capping on the Kenyan Economy - March 2018
13
Preliminary evidence on impact of interest rate caps- Surveys on Kenya
31. The results of the surveys are sketchy since they have been conducted using limited samples and hence should be treated cautiously. The results
of the following surveys are summarized below: Kenya
Private Sector Alliance (KEPSA) survey, the CBK Credit
Officer surveys and surveys by the Monetary Policy
Committee (MPC) Secretariat. The last two are in-house
surveys conducted on a regular basis by Bank Supervision
Department and the MPC Secretariat, respectively. Credit
Officer Surveys are based on banks’ expectations.
32. Kenya Private Sector Alliance Survey revealed the following:
• Respondents from the banking industry (83
percent) reported reduced lending since the
capping of interest rates. However, some
respondents from tier 1 reported an increase in
lending, while others in tier 2 and 3 reported that
they were not affected by the law.
• The Survey report attributed the recent slowdown
in private sector credit growth to the capping
of interest rates and increased investment by
banks in government securities. No evidence was
provided in the report of crowding out of lending
to the private sector by government borrowing.
• Non-bank respondents who had accessed
loans from banks after introduction of capping
of interest rates reported that the law had a
favorable effect on their businesses due to lower
interest rates.
• The Survey showed that most of the respondents
from the banking sector (78 percent) would like
the capping of interest rates to be stopped, as
they support more liberal and market driven
policies. Reasons provided by banks are reduced
lending to SMEs due to higher risk rating, focus by
lenders on collateralized lending thereby locking
out SMEs and individual borrowers, and that the
cost of finance remained the same with a reduced
repayment duration. • However, the Survey showed that most of the
non-bank respondents (73 percent) would like
the capping of interest rates to continue due
to affordable cost of finance, lower cost of loan
repayments which encourage SMEs borrowing,
banks had failed to exercise self-regulation and
make loans affordable, and that capping of rates
would inspire innovation and competition in the
banking sector. • The Survey report concluded that the introduction
of interest rate capping had not necessarily
translated to easy access to credit by borrowers
since some of the borrowers deemed to be risky
had been locked out.
• The Report provided several recommendations to
make credit affordable and accessible in the long
term. First, continuous engagement between the
banking sector, non-bank businesses, and the CBK
was necessary to explore additional measures
to promote competition and innovation in the
banking sector. Second, increased transparency
and reduction in loan processing fees and charges
by banks could help reduce the cost of borrowing.
Lastly, government incentives such as rebates and
guarantees for SME lending may be necessary to
promote credit growth to the sector.

C E N T R A L B A N K O F K E N Y AThe Impact of Interest Rate Capping on the Kenyan Economy - March 2018
14
33. CBK Credit Officer Surveys revealed the following:• The Credit Officer Survey is conducted quarterly
by the Central Bank of Kenya to establish lending
behaviour across sectors and potential drivers
of credit risk in the banking sector. The Survey
requires senior credit officers of banks to indicate
their banks perception or actual position in the
immediate past quarter and the subsequent
quarter in terms of demand for credit, credit
standards, interest rates, asset quality and credit
recovery efforts.
• Banks have tightened credit standards for loan approvals: The third quarter of 2016 saw
the most severe tightening of credit standards,
with 7 out of the 11 sectors being affected;
namely Energy, Trade, Transport, Personal/
Household, Manufacturing, Financial Services
and Agriculture. The tightening was mainly
attributed to implementation of interest rate
capping. In addition, banks also cited the
reduction of the CBR7, cost of funds and balance
sheet constraints as additional factors that fuelled
increased tightening of credit standards. In the
fourth quarter of 2016 and the first quarter of
2017, credit standards were tightened in the
Personal/Household, Real Estate, and Building
and Construction economic sectors. This was
mainly attributed to increased political risk due
to the general elections, expectations regarding
pace of general economic activity, and delayed
government payments which increased the risk
of default. Banks’ lower capital position also
contributed to the tighter standards.
7 The MPC lowered CBR by 50 basis points from 10.5 to 10 percent in September 2017 to anchor inflation expectations.
• Banks reported increased demand for credit in some sectors though the actual credit granted was expected to fall: Sectors that generally
recorded increased demand for credit following
the capping of the lending rates in September
2016 were Trade, Personal/Households, Transport
and Communication, Building and Construction,
Energy and Water and Real Estate. However, a
notable decline in demand for credit in the first
quarter of 2017 was reported across sectors in line
with the tightening of credit standards, though
this was mainly attributed to the political risk
in the run up to general elections—40 percent
of banks expected a decline in credit demand.
Overall the actual credit granted was generally
expected to fall.
Figure 10: Key Findings of Credit Officer Surveys
34. MPC Surveys revealed the following:
• The September 2016 Survey showed that banks
expected credit supply to decline in the remainder
of 2016 due to the capping of interest rates. Banks
indicated that they had slowed down lending
to assess the possible impact of the law and its
implementation, in addition to reviewing of credit
profiles, leading to realignment of their way of
doing business in the wake of lower margins. The
Source: CBK
C E N T R A L B A N K O F K E N Y AThe Impact of Interest Rate Capping on the Kenyan Economy - March 2018
15
law had left little room for factoring risk premium,
and had therefore reduced their appetite for risk.
• The November 2016 Survey showed that
commercial banks expected credit growth to
decline due to uncertainties following capping
of interest rates, including dealing with pressure
to differentiate between low/ medium risk
customers from high risk customers; need for
reforms to manage existing portfolios and focus
on cleaning their balance sheet, which would
require banks to change their business models.
• The January 2017 Survey showed that private
sector credit growth was expected to remain
low due to lower risk appetite by banks, tighter
credit processing after capping interest rates,
and expected lower business investments by the
private sector in an election year. As a result of
interest rate capping, banks are:
‒Experiencing increased cost of funding and
compressed net interest income, driving the need
for diversification to other affordable sources of
income
‒Focusing more on non-funded income and
optimizing on financial technology to reduce
costs
‒Focusing mostly on secured lending and
‒Selectively lending to sectors perceived as
low risk
C. Expected Outcomes
35. The amendment of the Banking Act was mainly motivated by the understanding that capping of interest rates would lower the cost of borrowing and increase access to bank credit by the populace. This is in support of the notion by Stiglitz (1994) who
argues in favor of certain forms of financial repression,
indicating that repression can have several positive
effects such as: improving the average quality of the
pool of loan applicants by lowering interest rates;
increasing firm equity by lowering the price of capital;
and accelerating the rate of growth if credit is targeted
towards profitable sectors such as exporters or sectors
with high technological spillovers.
36. However, based on international experience and local reviews preceding the amendment of the law, the interest rate caps are expected to result in the following:
• Increased demand for loans: Following
reduction in interest rates, demand for bank
loans is expected to increase. This is mainly the
case for those segments of the population which
could not afford the high rates of interest prior
to interest rate capping law, as well as top up by
existing loanees. Loan applications by the small
borrowers was thus expected to increase.
• Reduced access to financial services: Interest
rate capping results in banks changing their
lending behavior, viewing loans to small
borrowers such as SMEs and individuals riskier
and expensive to manage. Thus, they tend to offer
less credit to these borrowers, preferring lending
to government and large private borrowers.
• Reduced transparency: Interest rate caps, by
restricting the ability of banks to make interest
income, encourage banks to introduce or increase
non-interest charges, such as fees, to compensate
for lost income. As a result, it becomes difficult
for customers to internalize the total cost of
borrowing and also to make informed decisions
on borrowing.

C E N T R A L B A N K O F K E N Y AThe Impact of Interest Rate Capping on the Kenyan Economy - March 2018
16
• Elevated risks to financial stability: the interest
rate capping law is expected to impact the
viability of the small banks compared to medium
and large size banks. This may undermine the
overall financial sector stability.
• Reduced competition in the banking industry: Following interest rate capping banks are
expected to re-engineer their business models
thus creating non-competitive tendencies in
the industry- as a result there will be a tendency
of concentration of business in a few banks. In
addition, there will be a tendency for small banks
to merge to survive resulting in furthering non-
competitive practices.
• Shifting to expensive loans: The riskier borrowers
rationed out resort to borrowing from alternative
sources not regulated by the caps, which charge
much higher rates.
• Impairment of monetary policy transmission: the Central Bank is charged with the mandate of
conducting monetary policy aimed at ensuring
price stability. To achieve this objective the CBK
uses a number of tools, including the CBR. In
the interest rate capping environment, use of
CBR will result in perverse outcomes. During the
phase of monetary policy loosening to stimulate
credit expansion to support growth, the interest
rate cap will also adjust downward. As a result,
those individuals with credit risk above the
capped rate will be shunned by banks thereby
leading to contraction in growth of credit to the
private sector.
• Impact on economic growth: interest rate
capping law is expected to impact access to credit
by the SMEs. Considering that SMEs account for
a large share of enterprises, rationing out the
SMEs by the banks will adversely impact their
contribution to GDP and also compromise the
overall real GDP growth prospects.
D. Empirical Strategy 37. The study uses data available at the CBK including
(i) Bank level data- to assess the behavior of commercial
banks and banking sector outcomes and (ii) real GDP and
credit to private sector- to assess the impact on economic
growth. It employs in-depth exploratory analysis while
drawing from experiences of other countries and
available studies on interest rate capping.
E. The Evidence38. In this section we present the emerging evidence on the impact of interest rate capping law under the following broad areas: demand for credit, financial
intermediation, and transparency by commercial banks,
and migration to expensive loans, financial stability;
impact on monetary policy transmission and; impact on
economic growth.
Impact on demand for credit
39. Following the interest rate capping law the demand for loans witnessed temporary increase. The
reduction of interest rate to 14 percent following interest
rate capping, resulted in increased demand number of
loan applications. In the first three months of interest rate
capping the number of loan applications increased by
20 percent. However, between December 2016 and April
2017, the growth of loan applications decelerated to 2.3
percent. The growth in loan applications was expected
following reduction in interest rates from the market
levels to the capped level- thus those potential borrowers
who could not have thought of seeking loans because of
high interest rates opted to apply.

C E N T R A L B A N K O F K E N Y AThe Impact of Interest Rate Capping on the Kenyan Economy - March 2018
17
Impact on financial intermediation
i. Impact on lending to the private sector
40. Following interest rate capping a number of borrowers have been shunned by banks. Since
the commencement of the interest rate capping law
in September 2016, the number of loan accounts has
continued to decline resulting in rising average loan
size. The average loan size has increased by 36.7 percent
between October 2016 and June 2017. The rising value
of loan size vis-à-vis reduced number of loan accounts
reflects lower access to small borrowers and larger loans
to more established firms after the imposition of the
caps. This evidence is consistent with the experiences
of Ecuador, Bolivia, South Africa and Zambia, following
implementation of interest rate capping in those
countries.
41. Despite general growth in the average loan sizes, there are sectoral differences. During October
2016 to June 2017, the overall loan size grew by 36.7
percent, however, this growth vary by sector. The most
rapid increase was witnessed in the tourism and hotels
sector which recorded a growth of 76.3 percent- the rapid
increase in loan size in this sector is consistent with the
large number of SMEs in the sector, which may have been
denied loans during this period. The personal household
loans, on the other hand, reported declining average loan
size during the period since they are payroll based and
are less risk and have lower administrative costs.
Figure 11: Demand for Loans
0
500
1000
1500
2000
2500
3000
3500
0
20
40
60
80
100
120
140
160
180
200
Jul-‐16
Aug-‐16
Sep-‐16
Oct-‐16
Nov-‐16
Dec-‐16
Jan-‐17
Feb-‐17
Mar-‐17
Apr-‐17
May-‐17
Jun-‐17
No. of Loan ApplicaFons (Millions)
Value of Loan ApplicaFons (KSh Billion)
Figure 11: Demand for Loans
Value of Loan ApplicaFons No. of Loan ApplicaFons
Figure 12: Evolution of No. of Loan Accounts & Average Loan Size
-‐
1,000
2,000
3,000
4,000
5,000
6,000
-‐
100
200
300
400
500
600
Sep-‐1
6
Oct-‐16
Nov-‐16
Dec-‐16
Jan-‐17
Feb-‐1
7
Mar-‐17
Apr-‐17
May-‐17
Jun-‐17
KSh.
'000
'
Average Loan Size (LHS) No. of Accounts (RHS)
-‐40.0 -‐20.0 0.0 20.0 40.0 60.0 80.0
Tourism,restaurant and Hotels
Building and construc;on
Energy and water
Financial Services
Manufacturing
Agriculture
Trade
Transport and Communica;on
Real Estate
Mining and Quarrying
Personal/Household
76.3
63.3
58.6
57.9
55.8
51.7
44.3
34.2
21.2
12.9
-‐24.0
Figure 13: Growth of average loan size by sector (%): October 2016- June 2017
Source: CBK
Source: CBK
Source: CBK

C E N T R A L B A N K O F K E N Y AThe Impact of Interest Rate Capping on the Kenyan Economy - March 2018
18
42. The growth of average loan size vary by bank tier. While the average overall loan size grew by 36.4
percent between September 2016 and June 2017, there
are wide variations across bank categories. The large
banks were the main drivers with a growth of 42.4 percent
followed by small banks at 21.3 percent over the same
period. The medium bank’s average loan size grew by
2.0 percent. The rapid increase in average loan size by
the large banks reflects the reluctance of large banks to
lend to sections of the population which are perceived
to be riskier.
Table 3: Average Loan Size by Bank TierSep-16 Dec-16 Jan-17 Feb-17 Mar-17 Apr-17 May-17 Jun-17
Large peer group 278 299 368 375 376 376 382 396
Medium peer group 1,731 1,796 1,685 1,690 1,730 1,769 1,708 1,765
Small peer group 1,665 1,738 2,025 2,099 1,735 2,078 2,058 2,020
All Banks 402 433 522 530 519 534 535 548
43. The large banks have hastened the reduced intermediation process. The number of loan accounts
has declined by 26.1 percent between October 2016 and
June 2017, but there are noticeable differences across
bank categories. While the loan accounts in the large
banks has declined by 27.7 percent and that of medium
banks by 11.1 percent, the small banks sustained a
modest growth of 4.9 percent. Apparently, the large
banks are leading in supporting the rationing out of small
borrowers. Similar evidence was reported in WAEMU
countries, Columbia, Poland, Dominican Republic,
Ecuador, Haiti, Nicaragua, Peru and Zambia.
Table 4: Monthly Changes in Number of Loan Accounts by Bank TierOct-16 Nov-16 Dec-16 Jan-17 Feb-17 Mar-17 Apr-17 May-17 Jun-17 Cumulative Oct-2016 to
June-2017
Tier 1 -3.3 -7.4 4.2 -18.4 -2.0 0.2 0.2 -1.5 0.1 -27.8
Tier 2 -6.6 7.7 -1.3 -4.2 -1.4 0.0 -1.3 -1.0 -3.0 -11.1
Tier 3 1.4 -0.4 -4.9 11.5 -3.8 -12.2 11.2 1.1 1.0 4.9
All Banks -3.4 -6.3 3.6 -16.8 -2.0 -0.1 0.4 -1.4 -0.1 -26.1
44. Uptake of mobile loans has continued to increase. The number and value of mobile loan approvals
have been rising from 4 million in March 2015 to about 9
million in June 2016. Thereafter, the number of approvals
remained almost constant with only a temporary dip
in September 2016. The value of loan approvals also
assumed the same trend, rising from Ksh 7 billion in
March 2015 to between Ksh 33 billion and Ksh 34 billion
from June 2016 to March 2017. The of number mobile
loans approved dropped temporarily in September 2016
following the implementation of the interest capping
law, because some banks temporarily suspended mobile
loans at that period following the uncertainty as to
whether the law applied to mobile loans.
Source: CBK
Source: CBK

C E N T R A L B A N K O F K E N Y AThe Impact of Interest Rate Capping on the Kenyan Economy - March 2018
19
0.0
5.0
10.0
15.0
20.0
25.0
30.0
35.0
40.0
0.0 1.0 2.0 3.0 4.0 5.0 6.0 7.0 8.0 9.0 10.0
Mar-‐15
May-‐15
Jul-‐15
Sep-‐15
Nov-‐15
Jan-‐16
Mar-‐16
May-‐16
Jul-‐16
Sep-‐16
Nov-‐16
Jan-‐17
Mar-‐17
Value of New Loans (KSh Billion)
Number of New Loans (Millions)
Figure 14: EvoluMon of Mobile Loan Approvals
Number of New Mobile Loans Approved
Value of New Mobile Loans Approved
ii. Impact on lending to government by banks
45. Investment in Government securities has increased: since the inception of the interest capping law,
the commercial banks, as part of re-engineered investment
strategy, have enhanced lending to the government. The
share of commercial banks in government securities has
continued to increase. In December 2015, the share of
banks holding of government securities stood at 45.1
percent, at the inception of the interest rate capping law
the share increased to 50.5 percent.
Figure 14: Evolution of Mobile Loan Approvals
Table 5: Composition of Government Domestic Debt by HolderMar-16 Jun-16 Sep-16 Dec-16 Jan-17 Feb-17 Mar-17 Apr-17 May-17 Jun-17
Banks 55.7 56.3 55.0 52.5 51.6 51.0 54.1 55.1 56.2 56.2Insurance Companies 8.2 7.5 7.4 7.3 7.5 7.5 7.1 7.0 6.9 6.6Parastatals 4.7 4.7 5.5 5.6 5.7 5.8 6.5 6.5 6.6 6.4Pension Funds 25.5 25.9 26.6 28.0 28.6 29.0 28.2 27.5 27.9 28.1Other investors 5.9 5.7 5.6 6.5 6.7 6.7 4.0 3.9 2.4 2.7Total 100.0 100.0 100.0 100.0 100.0 100.0 100.0 100.0 100.0 100.0
46. Most banks reported increased deposits which were channeled to government securities market instead of enhancing lending to the private sector. In
2016/17 there is evidence of up to 18 banks transferring
funds from private sector credit to Government Securities
especially in 2016/2017. This partly highlights a change
in investment strategy by banks following the enactment
of interest rate capping law. The Credit Officers’ survey of
June 2017 also confirms this development.
Table 6: Changes in investments in government securities by banksFY 2014/15 FY 2015/16 FY 2016/17
Increasing Decreasing Increasing Decreasing Increasing Decreasing
Panel A: DepositsTier 1 6 1 7 0 7 0Tier 2 13 0 6 7 7 6Tier 3 17 4 5 16 12 9All Banks 36 5 18 23 26 15Panel B: Credit to the Private SectorTier 1 6 1 6 1 6 1Tier 2 12 1 12 1 6 7Tier 3 17 4 17 4 11 10All Banks 35 6 35 6 23 18Panel C: Investments in Government SecuritiesTier 1 5 2 7 1Tier 2 8 5 10 3Tier 3 7 14 9 12All Banks 20 21 26 16
Source: CBK
Source: CBK
Source: CBK

C E N T R A L B A N K O F K E N Y AThe Impact of Interest Rate Capping on the Kenyan Economy - March 2018
20
540
560
580
600
620
640
660
680
700
Jun-‐16
Jul-‐16
Aug-‐1
6
Sep-‐1
6
Oct-‐16
Nov-‐16
Dec-‐1
6
Jan-‐17
Feb-‐1
7
Mar-‐17
Apr-‐1
7
May-‐17
Jun-‐17
HHI (Weighted) HHI (Loans) HHI (Deposits)
Figure 15: Evolution of the Banking Sector Herfindahl-Hirschman Index (HHI) of market concentration
Impact on competition in the banking industry
47. The banking sector remains competitive despite interest rate capping: The level of competition8
of the banking sector measures: share of deposits and
loans, and the weighted market share, show that the
banking sector still remains largely competitive, though
the indicators suggest a mild decline in competition in
the post-cap period. In the first half of 2016, the market
concentration indicators were declining- implying
increased competition in the industry. However, since
the last quarter of 2016, these indicators started rising,
marginally though- implying mild evidence of reduced
completion in the industry. This may be on account of the
reaction of banks to re-engineer their business models
and also loss of deposits by small banks which impacted
their capacity to lend thus driving potential borrowers to
larger banks.
8 The Herfindahl-Hirschman Index (HHI) of market concentration ranges between 0-10,000. A value of less than 1250 indicates a competitive market.
Impact on Transparency in the Banking Industry
48. Following the interest rate capping law, some banks have exploited existing approval limits to increase non-interest charges on loans. Capping
the interest rates has resulted in banks exploiting the
space in the approved limits to shore up their incomes.
We analyzed Offer Letters issued by a Tier 1 bank and
established that this particular bank had introduced
additional requirements in late 2016. Notably, the
appraisal fees for SME loans was increased to 3 percent
of the value of loan from 2.5 percent before the interest
rate caps while loan insurance was introduced. The
most drastic measures were witnessed in the mortgage
loan facilities where appraisal fees was increased from
1 percent on loan value for first time borrowers and 0.5
percent for repeat borrowers to a standard fees of 2.5
percent. In addition, a call deposit was introduced.
Source: CBK

C E N T R A L B A N K O F K E N Y AThe Impact of Interest Rate Capping on the Kenyan Economy - March 2018
21
Table 7: Snapshot of Terms and Conditions Before and After Caps (A case of Tier 1 Bank)Before Interest Rate Caps After Interest Rate Caps
Retail loan facilities
SME loans 2.5% appraisal fee 3% appraisal fee
overdrafts No loan insurance Credit Life Assurance Policy(CLAP) introducedLocal Purchase Order
Asset Based Financing(ABF) 1% for all non-school borrowers
2.5% for purchase of new vehicles
0.5% for first time school borrowers
3% for purchase of used vehicles
0% for repeat school borrowers 2.5% for all school borrowers
High net worth customer facilities Discounts on loan pricing No discounts, all loans priced at CBR+4%
Facilities secured by Customer’s own funds Fixed Deposit Receipts (FDR)
No appraisal fee 0.5% appraisal fee introduced
Mortgage loan facilities
Appraisal fees 1% for new borrowers 2.5% for all borrowers
0.5% for any repeat borrowers
Call deposits No call deposits Introduced for all facilities except for mortgage scheme facilities
Stage inspection fees for construction facilities
Not charged Introduced
49. As a result, the banks have enhanced the share of their income from fees and commissions in recent months. Following interest rate caps, the income of the
commercial banks have shifted their revenue sources in
favour of non-interest income. The share on non-interest
income stood at 12.4 percent in September but it has
increased gradually to 15.2 percent in June 2017. The
shift to non-interest income is witnessed across all the
categories of commercial banks.
• The large banks, which had a stable share of fees
and commissions in December 2015- September
2016, witnessed gradual increase to stand at 17.6
percent in June 2017.
• The medium sized banks recorded a share of
10.7 percent in June 2017 from 8.6 percent in
September 2016.
• Among the small banks, the share of fees and
commissions increased from 8.0 percent in
September 2016 to 11.1 percent in June 2017.
Source: CBK

C E N T R A L B A N K O F K E N Y AThe Impact of Interest Rate Capping on the Kenyan Economy - March 2018
22
Table 8: Evolution of Structure of Banking Sector Income by TierJun-15 Sep-15 Dec-15 Mar-16 Jun-16 Sep-16 Dec-16 Mar-17 Jun-17
Panel A:All BanksInterest on Loans 60.6 63.4 62.5 62.1 61.1 61.2 55.7 56.0 54.8
Securities Income 16.1 13.9 15.0 17.9 19.0 18.4 21.7 20.9 21.7Fees and Commisions 13.9 14.5 13.1 12.5 12.6 12.4 14.5 15.5 15.2Other Income 9.3 8.1 9.5 7.4 7.3 8.0 8.0 7.9 8.3
Panel B: Tier 1Interest on Loans 60.1 61.9 62.2 60.9 59.3 59.9 54 54.5 52.7Securities Income 15.3 12.7 13.7 16.7 18.5 16.9 21.1 19.6 21.8Fees and Commisions 17.1 18.7 15.6 15.1 15.6 15.4 17.4 18.3 17.6Other Income 7.5 6.7 8.5 7.3 6.7 7.9 7.6 7.7 7.9Panel C: Tier 2Interest on Loans 60.5 64.5 61.0 62.7 62.8 61.5 57.9 57.1 53.5Securities Income 16.8 15.2 16.9 20.3 20.4 20.9 24.1 24.3 24.8Fees and Commisions 9.8 9.5 9.7 8.9 7.7 8.6 10.0 10.3 10.7Other Income 12.9 10.8 12.4 8.0 9.1 9.0 8.0 8.4 11.0Panel D: Tier 3Interest on Loans 64.8 68.9 70.4 69.0 68.6 69.4 61.0 64.2 64.1Securities Income 19.1 17.0 16.4 17.5 18.1 18.7 18.0 18.2 17.9Fees and Commisions 10.1 8.2 7.6 7.3 8.0 8.0 9.4 10.1 11.1Other Income 9.1 5.9 5.6 6.3 5.3 3.9 11.6 7.6 6.8
Risks to Financial Stability
i. Impact on capital of banks
50. Banking sector remains resilient despite interest rates caps. Banks remain adequately capitalized
with core and total capital to risk weighted assets
averaging 15.8 percent and 18.4 percent above the
regulatory requirements of 10.5 percent and 14.5 percent,
respectively. However, capital had declined since August
2015 signaling either efficiency or overall erosion. The
industry, however, remains stable in the post – interest
rates caps period.
Figure 16: Growth of Capital of the Banking Sector
Source: CBK
Source: CBK

C E N T R A L B A N K O F K E N Y AThe Impact of Interest Rate Capping on the Kenyan Economy - March 2018
23
51. Small banks have witnessed significant declines in capital following interest rates caps. Although small
banks are not systemic, their vulnerability to shocks given
low capital base can trigger industry-wide fears. Tier III
(small size) banks recorded the largest capital erosion
after interest capping. This may be attributed to reduced
earnings that impacted on capacity to build-up capital.
Tier I banks (large size) have maintained high capital
build-up levels. Tier II (medium size) banks appear to
have been affected by instability in late 2015 and ‘new
normal’ requirements.
52. Small and medium size banks significantly scaled down accumulation of reserves. Small and
medium size banks depleted their reserves or did not
have enough profits to shore up their capital base after
the caps were introduced.
Figure 17: Evolution of Total Banking Sector Capital by Tier (%)
Figure 18: Evolution of Annual Growth Rates in Reserves Build-up by Tier
ii. Impact on Profitability
53. Deterioration in profitability of small banks accelerated in the post-caps period. Tier III banks
were the most affected in terms of profit before tax and
the decline in profits seem to accelerate every quarter.
This erodes the banks’ ability to build capital buffers
through retained earnings, hence vulnerable to shocks.
Tier II banks have been on recovery path in post-caps
period, perhaps due to the ongoing bank mergers and
acquisitions.Source: CBK
Source: CBK

C E N T R A L B A N K O F K E N Y AThe Impact of Interest Rate Capping on the Kenyan Economy - March 2018
24
Table 9: Industry earnings measured by profits before taxJun-15 Sep-15 Dec-15 Mar-16 Jun-16 Sep-16 Dec-16 Mar-17 Jun-17
Tier 1 -0.1 1.7 -0.2 21.5 33.7 37.9 32.2 -10.0 -11.6
Tier 2 26.2 23.3 9.9 -32.1 -48 -45.4 -43.7 -4.6 0.3
Tier 3 2.0 10.2 -8.4 -14.8 -4.9 -10.8 -23.7 -54.0 -74.4
All Banks 8.3 9.3 2.9 2.9 2.1 4.6 2.7 -10.7 -11.7
54. ROE and ROA of the banking sector have continued to decline since late 2016. The return on
equity (ROE) touched the lowest level of 19.8 percent
in February 2017 with return on assets (ROA) reaching
the lowest level of 2.3 percent in January 2017. Decline
in earnings over time may pose risks to financial
stability through increased balance sheet risks. Also
reduces buildup of capital buffers to absorb any shocks.
Profitability was the most affected by this interest rates
capping law, although the decline started earlier in 2016.
55. The profitability of the small banks has deteriorated in recent months. Tier III banks recorded
the lowest ROA and ROE, highlighting the challenges they
faced in remaining profitable amid interest rates caps.
This explains their high depletion of reserves and capital
adequacy ratios. Persistent decline in profitability poses
risks to financial stability in the event of large size shocks
given the thin buffers.
Table 10: Earnings by Bank TiersJun-15 Sep-15 Dec-15 Mar-16 Jun-16 Sep-16 Dec-16 Mar-17 Jun-17
Panel A: Return on AssetsTier 1 4.0 3.9 3.7 4.5 4.6 4.4 3.9 3.7 3.3Tier 2 2.7 2.8 2.7 2.0 1.6 1.6 2.1 1.7 2.0Tier 3 1.6 1.5 1.4 1.6 1.5 1.3 1.0 0.8 0.4All Banks 3.3 3.3 3.1 3.4 3.2 3.1 3.1 2.8 2.7Panel B: Return on EquityTier 1 32.7 31.3 28.9 36.2 36.8 35.5 30.4 28.1 27.2Tier 2 25.7 25.5 23.4 17.8 15.8 16.1 17.8 15.6 19.1Tier 3 13.4 12.7 10.4 11.1 9.5 8.3 6.1 5.1 2.4All Banks 28.3 27.4 25.2 27.7 27.2 26.5 24.5 22.1 22.8
Table 19: Evolution of Banking Sector ROA & ROE
0.02
0.022
0.024
0.026
0.028
0.03
0.032
0.034
0.036
0.038
0.04
0.18
0.2
0.22
0.24
0.26
0.28
0.3
0.32
4215
6 42
186
4221
7 42
248
4227
8 42
309
4233
9 42
370
4240
1 42
430
4246
1 42
491
4252
2 42
552
4258
3 42
614
4264
4 42
675
4270
5 42
736
4276
7 42
795
4282
6 42
856
4288
7
ROA
ROE
Return on Shareholders Funds Return on Assets
Source: CBK
Source: CBK
Source: CBK

C E N T R A L B A N K O F K E N Y AThe Impact of Interest Rate Capping on the Kenyan Economy - March 2018
25
iii. Impact on liquidity of banks
56. Overall, the banking industry has remained liquid. The industry liquidity ratio averaged above 35
percent against a prudential minimum requirement of
20 percent throughout the period of this assessment,
implying minimal liquidity risks even after interest rates
caps. This high liquidity may be explained by increased
holding of government securities by 40 banks, which rose
by 40.4 percent between June 2015 and June 2017. The
increase however decelerated in the year to June 2017
at 17.2 percent compared to 19.6 percent in the year
to June 2016. Government securities are not only safe
assets for banks, but they are also considered as liquid
instruments in the computation of the liquidity ratio.
Therefore banks can easily access additional liquidity
in the event of potential risks using these securities as
collateral if un-encumbered, unlike other assets.
Table 11: Banking Sector Liquidity RatiosJun-15 Sep-15 Dec-15 Mar-16 Jun-16 Sep-16 Dec-16 Mar-17 Jun-17
Tier 1 37.6 35.7 38.9 38.1 40.9 41.3 41.9 43.8 47.9
Tier 2 39.9 39.3 38.0 45.4 41.1 43.7 38.3 40.5 45.3
Tier 3 39.5 38.1 33.5 36.3 33.3 36.4 35.5 35.4 37.6
All Banks 38.7 37.4 38.1 40.3 40.4 41.7 40.4 42.2 46.3
iv. Impact on Deposits Mobilization by Banks
57. The structure of deposits has shifted in favour of demand deposits as a result of interests capping law which has implications on long term funding of assets. There was a marked decline in time deposits
(interest earning accounts) vis-à-vis an increase in
demand deposits (non-interest earning accounts). In
addition, the foreign exchange denominated deposits,
which were on the decline in the period before the interest
rate caps, started to increase. The shift in deposits in
favour of demand deposits followed immediately after
the interest rate capping law was implemented.
Figure 20: Evolution of Bank Deposits by Type
Source: CBK
Source: CBK

C E N T R A L B A N K O F K E N Y AThe Impact of Interest Rate Capping on the Kenyan Economy - March 2018
26
58. The declining deposits was more pronounced amongst Tier II and Tier III banks. While only 5 banks
recorded declines in deposits in the FY 2014/2016, a
total of 23 Tier II and Tier III banks lost deposits in FY
2015/2016, with a further 15 banks still losing deposits
in FY 2016/2017. In terms of banks deposit base, while
59. There was recovery in total deposits in the first half of 2017. However, this was not accompanied
by commensurate impact on private sector credit (PSC),
partly because a large proportion of total deposits is
demand deposits, usually considered unstable to support
effective lending. Banks increased the share of demand
deposits to total deposits from an average of 46.4 percent
over the period September 2015 to July 2016 compared
to an average of 53.7 percent over the period August 2016
to June 2017. This limits the banks’ ability to expand
lending, hence slowdown in credit to the private sector
in the period under review.
the deposits increased by Ksh 433 billion or 20.2 percent
in 2014/15, they increased by only Ksh 198 billion or 7.68
percent in 2015/16 and the growth in deposits declined
to merely 7.4 percent in 2016/2017. As already indicated
Tier II and Tier II banks were the worst affected by the
decline in deposits especially in 2015/2016.
Table 12: Evolution of Bank DepositsKsh. & Percentage Changes FY 2014/2015 FY 2015/2016 FY 2016/2017
Ksh. Billion Percent Ksh. Billion Percent Ksh. Billion Percent
Tier 1 229.8 19.8 213.6 15.4 177.3 11.1
Tier 2 176.2 22.6 9.0 0.9 38.3 4.0
Tier 3 27.4 12.8 -24.1 -10.0 -9.7 -4.5
All Banks 433.4 20.2 198.5 7.7 206.0 7.4No. of Banks Increasing Decreasing Increasing Decreasing Increasing DecreasingTier 1 6 1 7 0 7 0
Tier 2 13 0 6 7 7 6
Tier 3 17 5 5 16 12 9
All Banks 36 6 18 23 26 15
v. Impact on Funding Structure of Banks
60. Interest rate capping has altered the funding structure of small and medium banks. While Tier II
banks sourced their funding from non-resident banks
prior to caps, they have switched to other non-residents
in post-caps period Tier III banks also experienced
significant decline in funding from ‘Others’ in post-caps
period.
Source: CBK

C E N T R A L B A N K O F K E N Y AThe Impact of Interest Rate Capping on the Kenyan Economy - March 2018
27
-‐30
-‐10
10
30
50
70
90
110
130
Jun-‐15
Aug-‐15
Oct-‐15
Dec-‐15
Feb-‐16
Apr-‐16
Jun-‐16
Aug-‐16
Oct-‐16
Dec-‐16
Feb-‐17
Apr-‐17
Jun-‐17
KSh Billion
s
Central Bank Non-‐resident Banks Other Non-‐residents Others
vi. Impact on Credit Risk
61. Credit risks have become more elevated in post-caps period especially for medium banks. The
banking industry continues to face credit risks. The ratio
Panel A: Tier II banks Borrowed Funds Panel B: Tier III banks Borrowed Funds
Figure 21: Commercial Banks Funding Outside Deposits
of net NPLs to total capital among Tier II banks worsened
to 69 percent in June 2017 compared to 19 percent in
June 2016.
Table 13: Banking Sector Net NPLs/Total Capital Jun-15 Sep-15 Dec-15 Mar-16 Jun-16 Sep-16 Dec-16 Mar-17 Jun-17
Tier 1 10.63 10.66 10.66 13.09 13.76 18.59 13.12 13.58 13.0
Tier 2 10.03 9.81 13.96 27.89 18.96 65.75 65.74 68.07 69.06
Tier 3 16.42 10.58 15.01 13.89 10.54 33.19 12.07 13.79 14.16
All Banks 10.82 10.3 12.34 18.19 25.91 35.7 27.33 28.03 26.77
62. The asset quality of banks deteriorated in post caps period largely attributed to tier banks. The ratio of gross NPLs to gross loan increased from 10
percent in June 2016 to 23 percent in June 2017 signaling
deteriorating asset quality for Tier II banks. Similar trend
has been observed for Tier III banks and the overall
industry.
Table 14: Banking Sector Gross NPLs/Gross Loans Jun-15 Sep-15 Dec-15 Mar-16 Jun-16 Sep-16 Dec-16 Mar-17 Jun-17
Tier 1 4.9 4.8 5.1 6.1 6.5 6.4 6.6 7.3 7.0
Tier 2 5.2 4.9 6 11 9.8 18.6 22.7 19.8 23.1
Tier 3 12.8 11.1 12.2 12.1 11.8 14.9 12.7 15.1 15.6
All Banks 5.7 5.4 6.1 8.3 10.6 11.4 11.8 12.3 12.3
Source: CBK
Source: CBK
Source: CBK
Source: CBK

C E N T R A L B A N K O F K E N Y AThe Impact of Interest Rate Capping on the Kenyan Economy - March 2018
28
Migration to Alternative Borrowing Avenues
63. Evidence of migration of borrowers to expensive sources of financing is weak. The interest rate capping
is expected to constrain access to credit by riskier
borrowers who will eventually migrate to expensive
sources of financing. While we do not have evidence
about the upsurge in the number of predatory lenders,
we argue that those borrowers who are rationed out
by the commercial banks will seek loans from those
institutions which are not subject to interest capping law
- Micro financial institutions, SACCOS and non-regulated
lenders. We, however, note that the growth in loans by
MFBs declined significantly since late 2016 while that
of SACCOs has declined marginally. This suggests that
customers being rationed out by the commercial banks
are not being accommodated by the institutions.
-‐10.00
-‐5.00
0.00
5.00
10.00
15.00
20.00
25.00
Jan-‐16
Mar-‐16
May-‐16
Jul-‐16
Sep-‐16
Nov-‐16
Jan-‐17
Mar-‐17
May-‐17
MFBs SACCOs
Figure 22: Growth in Credit from MFBs and SACCOs
Impact on the Conduct of Monetary Policy
64. Available evidence suggests that under a normal environment monetary policy is effective. A
change in the central bank rate will affect other rates
and consequently impact on the growth of credit to the
private sector. Analysis based on data for the period up
to September 2016, show the following;
• A 1 percentage change in CBR results in a 0.4
percentage change in credit to the private sector
in the opposite direction. Therefore, following the
monetary policy stance which was implemented
up to mid-last year, the credit to private sector
was expected to decline at a slow pace than
witnessed during the period.
Figure 23: Evolution of credit to private sector
Source: CBK
Source: CBK

C E N T R A L B A N K O F K E N Y AThe Impact of Interest Rate Capping on the Kenyan Economy - March 2018
29
65. The interest rate caps has delivered perverse outcomes of monetary policy. When the interest rate
capping was implemented the CBR rate was at 10.5
percent. With the binding deposit and lending rates,
the lending rate was capped at 14.5 percent while the
rate of growth of credit to the private sector was at
approx. 8 percent per annum. On September 20, 2016,
the MPC, in its regular meetings, noted that inflation
was expected to decline but had concerns with the
slowdown in credit to the private sector. Consequently,
it decided to reduce the CBR by 50 basis points to 10.0
percent with the anticipation of reversing the declining
trend. However, credit to the private sector continued to
decline leading one to conclude that the monetary policy
action produced counterintuitive results… a loosening on
monetary policy yielding unexpected decline in credit to
the private sector.
66. Going forward, under the interest rate capping regime, there is no guarantee the central bank will be able to achieve its intended objectives. The Central
Bank is charged with the mandate of conducting monetary
policy aimed at ensuring price stability. To achieve this
objective the CBK uses a number of tools, including the
CBR. In the interest rate capping environment, use of
CBR will result in perverse outcomes. During the phase of
monetary policy loosening to stimulate credit expansion
to support growth, the interest rate cap will also adjust
downward. As a result, those individuals with credit risk
above the capped rate will be shunned by banks thereby
leading to contraction in growth of credit to the private
sector. On the other hand, during the tightening phase
of monetary policy, the banks will be able to have a
relatively wider space to price risk and therefore increase
credit to the private sector contrary to the intention of the
monetary policy stance.
Impact on Economic Performance
67. Interest rate capping law has further decelerated credit to the private sector thus impacting economic growth prospects: Our analysis shows that different
sectors of the economy respond at different speeds and
magnitudes to changes in credit: some respond with a
lag of 1 quarter while others respond with a lag of up to
4 quarters. In addition, the magnitude of response varies
with the sector. Analysis show that a 10 percent change
in sectoral credit results in between 0.11 – 0.17 percent
changes in sectoral growth in the respective sectors. In
view of these findings:
• The real GDP growth in 2016 contracted by 0.22
percentage points on account of the slowdown
in credit to the economy.
• In 2017, from a baseline projection for real GDP
growth of 5.7 percent, the slowdown in credit to
the private sector could contract output by about
0.4 percentage points.
• The analysis is, however, preliminary given that
one year may too short for full impact on economic
growth performance to fully materialize.
Table 15: Responses of Sectoral GDP to Sec-toral Credit
Sector
Lags (Number of Periods it takes for the Impact to materialize - in Quarters)
Elasticity
Agriculture 2 0.017Construction 4 0.015Finance and Insurance 1 0.016Manufacturing 1 0.014Mining and Quarrying 5 0.011Real Estate 2 0.015Other 2 0.015
Source: CBK

C E N T R A L B A N K O F K E N Y AThe Impact of Interest Rate Capping on the Kenyan Economy - March 2018
30
5.8 5.6
6.1
5.5 5.3
6.2
5.7
6.1
4.7
5.9 5.7
5.9 5.8
5.6
6.1
5.5 5.3
6.2
5.7
6.1
4.7
5.3 5.1
5.3
4
4.5
5
5.5
6
6.5
2015Q1
2015Q2
2015Q3
2015Q4
2016Q1
2016Q2
2016Q3
2016Q4
2017Q1
2017Q2
2017Q3
2017Q4
GDP Growth (SME Baseline) GDP Growth (SME PSC Scenario)
68. The MSMEs make a significant contribution to the economy but they are concentrated in the services sector. According to the KNBS MSME 2016
Survey, MSMEs account for approximately 28.4 percent of
GDP- most of the SMEs are registered and captured in the
national accounts. Most of the MSMEs are concentrated
in three main sectors- Wholesale and Retail (60 percent);
Manufacturing (11.6 percent); and Accommodation and
Food Services sector (9 percent). The rest of the sectors
of the economy account for approximately 19.5 percent
of MSMEs.
Figure 24: Distribution of MSMEs by sector and Lisensing Status
69. The MSMEs have low uptake of bank loans: The
MSMEs Survey of 2016, shows that more than half of the
MSMEs do not seek bank loans. The majority rely on
family/own funds for working capital.
Figure 25: Reasons for not taking up bank loans by MSMEs
70. Commercial banks have continued to drift away from MSMEs loans: The small and medium entreprises
have borne the greatest impact of the interest rate
capping law. According to the Finaccess Survey, the share
of MSME lending by commercial banks was high in Kenya,
at 23.4 percent in 2015 compared to other countries.
However, a survey conducted by KBA in late 2016, shows
that the average MSMEs loans has declined to 17 percent,
with the small banks providing 39 percent of the lending
to the MSMEs.
Table 16: Share of SME Loans in Total Loans by Tier
Share of SME Loans to Total Loans
Average Interest Rate
Tier 1 11 19Tier 2 21 17Tier 3 39 17
Average* 17 18
* Weighted by market share of each bank
71. Withdrawal of credit to this segment has implications on economic growth prospects: The
real GDP growth in 2017, contributed by the MSMEs will
decline by 1.42 percent points. As a result, overall real GDP
growth is expected to decline by 0.40 percentage points.
Figure 26: Impact of rationing out MSMEs on Growth
Source: KNBS
Source: KNBS Source:CBK
Source: KBA

C E N T R A L B A N K O F K E N Y AThe Impact of Interest Rate Capping on the Kenyan Economy - March 2018
31
F. Conclusion72. The objective of this study is to investigate
the impact of the interest rate capping on the Kenya
economy. The law capping interest rates became
operational on September 14, 2016. It was implemented
following concerns raised by the public regarding the
high cost of credit in Kenya which may have impacted
on access to loans by a large segment of the population.
Implementation of the law, therefore, was expected to
lower the cost of credit and increase access to credit.
The law has been in operation for a year, although this is
not sufficiently long for the full effects on the economy
to manifest, nonetheless we investigate whether the
intentions of the interest rate capping law have been
achieved.
73. To unravel the evidence, we first review literature
on from around the world on the outcomes of the
interest rate controls. we note that in most cases caps
have produced undesirable outcomes such as reduced
intermediation with banks becoming less transparent,
reduced banking competition and increased risk to
financial stability. In addition, impact on the conduct of
monetary policy and growth have been witnessed.
74. In this study we use bank level data covering a
period before and after the interest rate capping period,
obtained from the Central Bank of Kenya. In addition we
use selected macroeconomic variables obtained from
the Kenya national Bureau of Statistics. Based on the
analysis we find that interest rate caps have started to
yield negative effects on the Kenyan economy as follows:
• The interest rate caps infringes on the
independence of the central bank and complicates
the conduct of monetary policy. It is found that
under the interest rate capping environment,
monetary policy produces perverse outcomes.
• Reduced intermediation by commercial banks
- there has been significant increase in average
loan sizes arising from declining loans accounts,
mainly driven by the large banks, thus shunning
the smaller borrowers.
• The banks have shifted lending to Government
and the large corporates.
• Whereas demand for credit increased following
the capping of lending rates, credit to the private
sector has continued to decline.
• The structure of revenue of the banks has started
to shift away from interest income. In addition,
some banks have exploited the existing approval
limits to increase fees on loans in a bid to offset
loss in interest income.
• The banking sector remains resilient. However,
small banks have experienced significant decline
in profitability in recent months, which may
complicate their viability.
• Exclusion of MSMEs by the commercial banks will
lower growth by 0.4 basis points in 2017 mainly
on account of the reduced access to credit by
the MSMEs.
75. We note that these effects have emerged in the
last one year, however, they may become magnified in
the medium to long term as was the case during the
post-independence period.

C E N T R A L B A N K O F K E N Y AThe Impact of Interest Rate Capping on the Kenyan Economy - March 2018
32
REFERENCESKidane A. (1994). Indices of Effective Exchange Rates: A
comparative study of Ethiopia, Kenya and the Sudan, AERC
Research Paper No. 29.
Maimbo, S. M. and C. A. H. Gallegos (2014). “Interest
Rate Caps around the World: Still Popular, but a Blunt
Instrument,” World Bank Policy Research Working paper
7070.
Mwega, F.M, Ngola, S.M and Mwangi, N. (1990). Real
Interest rates and Mobilization of Private Savings in Africa:
A Case Study of Kenya. AERC Research Paper No. 2.
Government of Kenya (1986). Sessional paper No.1 of
1986 on Economic Management for Renewed Growth,
Government Printers, Nairobi.
Government of Kenya (1965). Sessional Paper No. 10 of
1965 on African Socialism and its application to planning
in Kenya, Government Printers, Nairobi.
McKinnon, Ronald I., (1973). Money and Capital in
Economic Development, Washington: The Brookings
Institution.
Shaw, Edward, (1973). Financial Deepening in Economic
Development, New York: Oxford University Press.
Stiglitz, J., (1994). Economic Growth Revisited, Industrial
and Corporate Change, 3(1):65-110.

C E N T R A L B A N K O F K E N Y AThe Impact of Interest Rate Capping on the Kenyan Economy - March 2018
33
FAILED BANKS AND NON- BANK FINANCIAL INSTITUTIONS IN KENYANAME OF INSTITUTION DATE CLOSED/RESTRUCTURED REASONS FOR FAILURE
Rural Urban Credit &Finance LtdOfficial Receivership1 Dec-84
Non- performing loans Insider loans(Unsecured)Non- performing loans Insider loans(Unsecured)Non- performing loans Insider loans(Unsecured)Mismanagement
Ineffective Board
Liquidation by DPF
Liquidation by DPFDiners Finance LtdLiquidation by DPFAllied Credit LtdLiquidation by DPFUnited Trustee Finance Lltd
Liquidation by DPFMiddle Africa Finance Corp LtdLiquidation by DPFTrade Bank LtdLiquidation by DPFTrade Finance Co. Ltd
Voluntary LiquidationPost Bank Credit LtdLiquidation by DPF
Non- performing loans MismanagementPoor credit facilitiesAsset/ Liabilities mismatchCredit concentrationAsset/ Liabilities mismatch
Non- performing loans Insider dealings(unsecured)Non- performing loans Non- performing loans Ineffective BoardInsider loans(Unsecured)
Insider loans(Unsecured)Non- performing loans Under capitalisation
Non- performing loans Non- performing loans Under capitalisationInsider loans(Unsecured)MismanagementViolation of Banking Act
Licence revokedUnited Bank Ltd Successfully restructured.
Under capitalisationViolation of Banking ActLicence revokedViolation of Banking Act
Under Consolidated Bank
MismanagementUnder capitalisationDomino effects/Trade bankUnder capitalisationInsider loans(Unsecured)Insider loans(Unsecured)
Non- performing loans Non- performing loans Under capitalisationMalpracrices in Forex Non- performing loans Non- performing loans
Licence revokedMalpractice in Clearing House Credit Concentration
Malpracticse by directorsKenya Finance Bank Ltd Non- performing loans
Liquidation by DPF Insider loans(Unsecured)Meridien Biao (K) Ltd Forex exposure
Restructured:Now Chase BankThabiti Finance Co. Ltd Under capitalisation
MismanagementReliance Bank Ltd Run on deposits
Liquidation by DPF Malpracticse by directorsAri Banking Corp Ltd Non- performing loans
Liquidation by DPF MismanagementHeritage Bank Ltd Non- performing loans
MismanagementPrudential Bank Ltd Non- performing loans
Re-opened on 20.1.2000 Non- performing loans Trust Bank Ltd Run on deposits
Liquidation by DPF Cheque kitingBullion Bank Ltd Run on cert. of deposits
Mismanagement
Re-opened on 17.4.2000 MismanagementFortune Finace Ltd Run on deposits
Liquidation by DPF MismanagementCity Finance Bank Ltd Run on deposits
5 Dec-89
6 Dec-89
7 Dec-89
2 Aug-86
3 Aug-86
4 Jan-87
Under Consolidated BankEstate Finance Co of (K) LtdUnder Consolidated BankHome savings and motgage Co. LtdUnder Consolidated Bank
Continental Bank of Kenya LtdOfficial ReceivershipContinental credit & Finance Ltd Official ReceivershipCapital Finance Ltd
Business Finance Co.Ltd
11 Dec-89
12 Apr-93
13 Apr-93
8 Dec-89
9 Dec-89
10 Dec-89
Under Consolidated BankNairobi Finance Corp LtdLiquidation by DPFInternational Finance Co.LtdLiquidation by DPF
Under Consolidated BankUnion Bank of Kenya LtdUnder Consolidated BankJimba Credit Corp LtdUnder Consolidated BankKenya Savings &Mortgage Ltd
Nation Wide Finance Co. Ltd
17 Aug-93
18 Aug-93
19 Aug-93
14 Apr-93
15 May-93
16 Jun-93Inter Africa Credit Finance LtdLiquidation by DPFCentral Finance (K) Ltd
Exchange Bank Ltd
23 Aug-93
24 Oct-93
25 Oct-93
20 Aug-93
21 Aug-93
22 Aug-93
Liquidation by DPF
Pan-Africa Credit & Finance LtdLiquidation by DPFPan-Africa Bank Ltd
29 Jul-96
30 Sep-96
31 Dec-97
26 Aug-94
27 Dec-94
28 Apr-96
Liquidation by DPF
Liquidation by DPF
35 Nov-98
36 Nov-98
37 Sep-99
32 Sep-98
33 Sep-98
34 Sep-98
Liquidation by DPF
Re-opened on 9.8.1999
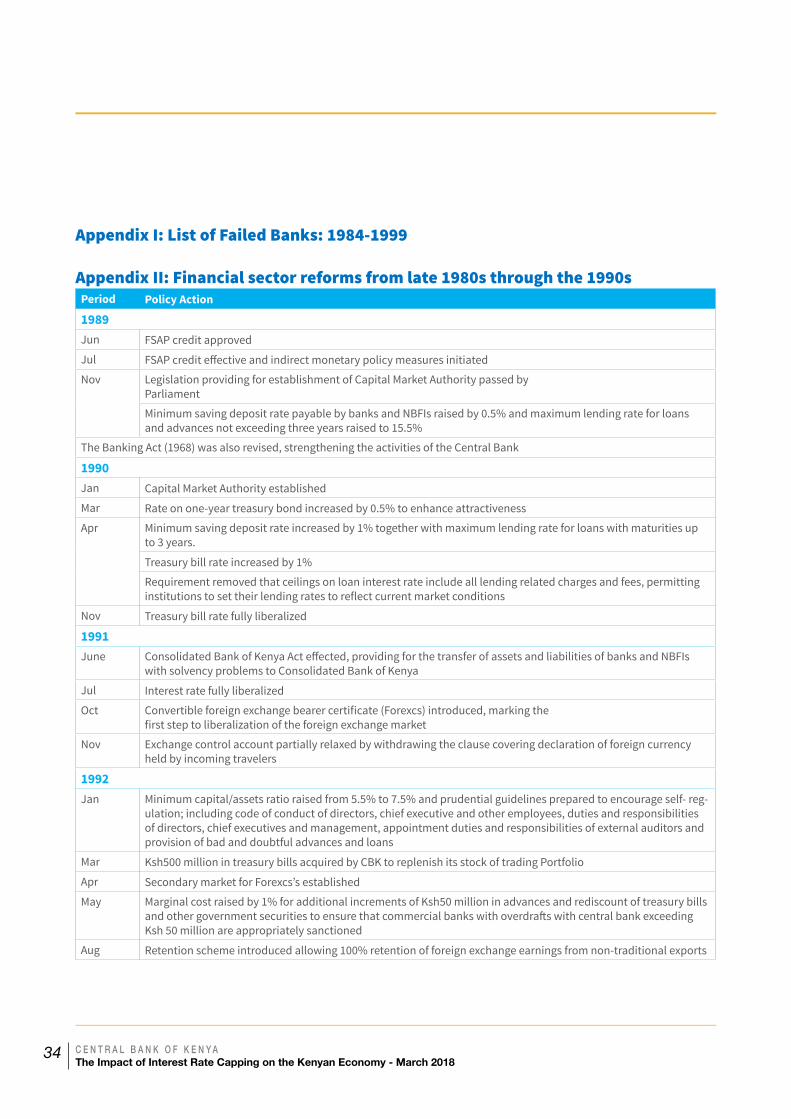
C E N T R A L B A N K O F K E N Y AThe Impact of Interest Rate Capping on the Kenyan Economy - March 2018
34
Appendix I: List of Failed Banks: 1984-1999
Appendix II: Financial sector reforms from late 1980s through the 1990sPeriod Policy Action
1989Jun FSAP credit approved
Jul FSAP credit effective and indirect monetary policy measures initiated
Nov Legislation providing for establishment of Capital Market Authority passed byParliament
Minimum saving deposit rate payable by banks and NBFIs raised by 0.5% and maximum lending rate for loans and advances not exceeding three years raised to 15.5%
The Banking Act (1968) was also revised, strengthening the activities of the Central Bank
1990Jan Capital Market Authority established
Mar Rate on one-year treasury bond increased by 0.5% to enhance attractiveness
Apr Minimum saving deposit rate increased by 1% together with maximum lending rate for loans with maturities up to 3 years.
Treasury bill rate increased by 1%
Requirement removed that ceilings on loan interest rate include all lending related charges and fees, permitting institutions to set their lending rates to reflect current market conditions
Nov Treasury bill rate fully liberalized
1991June Consolidated Bank of Kenya Act effected, providing for the transfer of assets and liabilities of banks and NBFIs
with solvency problems to Consolidated Bank of Kenya
Jul Interest rate fully liberalized
Oct Convertible foreign exchange bearer certificate (Forexcs) introduced, marking thefirst step to liberalization of the foreign exchange market
Nov Exchange control account partially relaxed by withdrawing the clause covering declaration of foreign currency held by incoming travelers
1992Jan Minimum capital/assets ratio raised from 5.5% to 7.5% and prudential guidelines prepared to encourage self- reg-
ulation; including code of conduct of directors, chief executive and other employees, duties and responsibilities of directors, chief executives and management, appointment duties and responsibilities of external auditors and provision of bad and doubtful advances and loans
Mar Ksh500 million in treasury bills acquired by CBK to replenish its stock of trading Portfolio
Apr Secondary market for Forexcs’s established
May Marginal cost raised by 1% for additional increments of Ksh50 million in advances and rediscount of treasury bills and other government securities to ensure that commercial banks with overdrafts with central bank exceeding Ksh 50 million are appropriately sanctioned
Aug Retention scheme introduced allowing 100% retention of foreign exchange earnings from non-traditional exports

C E N T R A L B A N K O F K E N Y AThe Impact of Interest Rate Capping on the Kenyan Economy - March 2018
35
Period Policy ActionOct Commercial banks allowed to borrow foreign exchange currency to finance tea and coffee purchases in auctions
Banks allowed to send dollar accounts for coffee and tea buyers and sellers
New penalties announced for commercial banks failing to observe the mandatorycash and liquidity ratios
Nov Retention scheme extended to cover traditional exports of goods at 50%
1993Feb Retention scheme extended to service sector at 50%
Foreign exchange allocation by central bank abolished
Mar Foreign exchange certificate made redeemable at market exchange rate
Devaluation of 25% of official shilling exchange rate
Retention account suspended
Apr Margin on central bank advances and discounts to banks increased
Cash ratio increased from 6% to 8%
Devaluation by 33% of official shilling exchange rate
May Maturity life for securities to be eligible for rediscounting reduced to 45 days or less
New penalty for banks failing to observe the mandatory cash ratio announced
Re-introduction of retention scheme – 50% of all foreign exchange
Further liberalization of foreign exchange system allowing commercial banks to effect foreign payments for their private clients without referring to the Central Bank of Kenya
Import licensing system abolished short-list of prohibited and restricted imports
Revolution of restriction on importation of assembled commercial vehicles
Maximum import tariff reduced from 60% to 50% and tariff rate bands from 9 to 7
Jun Introduction of one-way foreign exchange auction system
Cash ratio raised from 8% to 10%
Aug Paper eligible for rediscounting restricted by lowering maturitiesa) Treasury bill (half way).b) Treasury bonds (45 days or less).
Securities accepted as eligible as collateral for overnight loans
A two tier foreign auction system introduced
Nairobi clearing house new arrangements effected to eliminate automatic provisionof central bank credit to banks
Registration of foreign exchange certificate holders with banks in order to buy themback at negotiated or market price
Sep Registration of foreign exchange certificate by banks with Central Bank
Oct Shilling exchange rate allowed to float freely
Cash ratio raised from 10% to 12% with balance above the minimum requirement to earn interest at 35% per annum

C E N T R A L B A N K O F K E N Y AThe Impact of Interest Rate Capping on the Kenyan Economy - March 2018
36
Period Policy ActionNov Central bank started daily foreign exchange transactions with commercial banks
Commercial banks allowed to continue purchasing foreign exchange for oil and petroleum products from the market and central bank.
Central bank continued entering into forward contracts for purchase of oil and related products out at market rates
Credit guidelines abolished
Cash ratio raised from 12% to 14% with excess balances paid 35% interest per Annum
Restriction removed on remittance of profits, dividends and expatriate earnings
Residents allowed to borrow abroad up to US$1 millionDuring the year central bank operated with a tight monetary policy with high money supply.Treasury bill diversified to accommodate investors’ diverse liquidity preference. The 30-, 60- and 180-day bills were introduced adding to the 90-day bill that existed in the market.
1994Feb Cash ratio increased from 14% to 16% with interest paid on bank balances with bank in excess of 10% reduced
from 25% to 20%
Foreign exchange retention raised to 100%
Residents allowed to open foreign currency accounts with banks in Kenya
Restriction on local borrowing by foreign controlled companies removed
Foreigners allowed to pay hotel bills and air tickets in either foreign or Kenya currency
Mar Liquidity ratio for commercial banks and non-bank financial institutions to be maintained at 5 and 10 percentage points, respectively, above the current commercial bank cash ratio requirement
Cash ratio raised from 16% to 20% and interest payment on commercial bank deposits at the bank withdrawn
Apr Open market operations sale of Treasury bills to be at least 0.5 percent below the weekly average tender rate
Commercial banks to borrow from the bank for a maximum of 4 consecutive days and no more than 10 days in any one month
Jun Kenya accepted obligations of Articles of Agreement of the International Monetary Fund
Foreign currency account holders encouraged to retain some of their funds overseas under the care of commercial banks
Commercial banks required to back the funds retained overseas 100% by foreign assets
Restated determination of the exchange rate by market force
Cash ratio lowered 20% - 18%
Dec Announced requirement for NBFIs to open account with central bank for purposes of maintaining cash ratio
1995Jan Authorization and licensing of foreign exchange bureaus announced
Foreign investors allowed to participate in stock exchange market under guided policy on ownership
Reaffirmation that the regulatory body of the stock exchange would be Capital Market Authority
Mar Commercial banks to observe foreign exchange exposure limit of 20% of the paid up capital plus unimpaired reserves
Apr Newly converted NBFIs to observe half the mandatory 18% of the cash ratio

C E N T R A L B A N K O F K E N Y AThe Impact of Interest Rate Capping on the Kenyan Economy - March 2018
37
Period Policy ActionJun A bill minimum 5 days introduced. Firms listed by NSE allowed to issue commercial paper and treasury bill of 5
days maturity
Jul Balance of the newly converted banks to be 0.135 of the institutions’ total deposits from 31.5.95.
NBFIs subjected to the mandatory cash ratio requirement; requirement initially set at 1.8% of eligible deposits and raised progressively to 18% by December 1995
Tightened conditions for overnight loans and rediscounting at central bank by commercial bank
Treasury bills held at 50% of life to maturity for overnight loans or 75% for rediscount were eligible. Also bills to have two clear working days to maturity. Banks’ lending in the inter-bank market not allowed to borrow over-night from central bank
Commercial banks to submit weekly foreign currency exposure return every. Monday; off balance sheet items excluded from computation of foreign currency the stability of the financial system
Investment compensation fund established to protect investors against losses arising from equity trading
Foreign capital regulations revised to enable foreigners to own up to 40% of local company listed in NSE and equi-ty participation by a single investor increased from 2.5% to 5.0%
Liquidity ratio fixed at 25% for both banks and NBFIs and 20% for mortgages finance companies
Aug Minimum investment in treasury bills under OMO lowered to Ksh 100,000 form 1000,000
Procedure for renewal of licenses by banks and NBFIs modified 1st year licenses of branches to be computed and charged on a pro-rated basis; thereafter full licenses fees to be paid for the head office and all branches simulta-neously
Sep Commercial banks allowed to exclude deposits of financial institutions from cash ratio
Commercial banks to submit monthly breakdown of government and parastatal deposits in addition to monthly statistic returns
Oct Central bank launches a redesigned treasury bill that conforms to the magnetic ink character recognition (MICR) cheque clearing system. The new instrument serves as a bill and a cheque
Banking Act Amended (27th October)
Dec Central bank starts paying 5% interest on all cash balances held by commercial banks and NBFIs at Central Bank to facilitate a reduction in banking lending rates
NBFIs required to invest in treasury bills a minimum of 50% of their liquid asset Withdrawn
Repeal of Exchange Control Act
Cash ratio raised to 18%
1996
Jan Central bank display OMO rates on the Reuter screen, to encourage independent decision on quotation for pur-chase of the treasury bills
May Measures taken to improve effectiveness of secondary trading in financial instrument
Treasury bills for 30, 90, and 180 days replaced by 28, 91 and 182 days; while 60 and 270 days were discontinued
Cash ratio requirement relaxed to allow fluctuations up to minimum 15% but an average 18% for 14 days
5% interest that commercial banks received on the cash balances with the central bank discontinued
The minimum paid up capital was raised during the year.
Source: CBK & KIPPRA

C E N T R A L B A N K O F K E N Y AThe Impact of Interest Rate Capping on the Kenyan Economy - March 2018
38Haile Selassie Avenue P. O. Box 60000 - 00200 Nairobi Tel: 20 - 2860000/2861000/ 2863000 Fax: 20 - 340192
www.centralbank.go.ke | www.facebook.com/CentralBankKenya | @CbkKenya