a taxometric analysis of the latent structure of …
TRANSCRIPT

The Pennsylvania State University
The Graduate School
Department of Psychology
A TAXOMETRIC ANALYSIS OF THE LATENT STRUCTURE OF THE
REPRESSOR PERSONALITY CONSTRUCT
A Thesis in
Psychology
by
Christine Molnar
Submitted in Partial Fulfillment
of the Requirements
for the Degree of
Doctor of Philosophy
August 2003

We approve the thesis of Christine Molnar
Date of Signature
____________________________________ _______________ Michelle G. Newman Associate Professor of Psychology Thesis Advisor Chair of Committee ____________________________________ _______________ Thomas D. Borkovec Distinguished Professor of Psychology ____________________________________ _______________ Lynn T. Kozlowski Professor of Biobehavioral Health ____________________________________ _______________ Aaron L. Pincus Associate Professor of Psychology ____________________________________ _______________ Kevin R. Murphy Professor of Psychology Head of the Department of Psychology
iii
Abstract
A taxometric analysis of the latent structure of the repressor construct was conducted
using original indices derived from both the Marlowe-Crowne Social Desirability Scale
(MCSDS: Crowne & Marlowe, 1964) and the trait version of the State-Trait Anxiety
Inventory (STAI: Spielberger, Gorsuch, Lushene, Vagg, & Jacobs, 1983). Both Mean
Above Minus Below A Cut (MAMBAC: Meehl & Yonce, 1994) and Maximum Slope
(MAXSLOPE: Grove & Meehl, 1992) analyses were conducted with data from 1040
undergraduates who completed a battery of self-report questionnaires that included the
MCSDS, STAI, and the NEO-Five Factor Inventory (NEO-FFI) (Costa & McCrae,
1992). Results were interpreted using simulated data that matched parameters of the
collected data. Findings with traditional indices of the repressor construct did not support
the hypothesis that the repressor construct is taxonic, and rather provided some evidence
in support of a dimensional latent structure. Findings indicated that both the stability and
agreeableness personality scales of the NEO-FFI, as well as traditional indices, capture
core features of the repressor construct. Repressors reported above average levels of both
stability and agreeableness, but normal levels of extraversion, openness, and
conscientiousness. Findings from the NEO-FFI suggest that repressors may have
difficulties asserting needs in relationships and that the denial of negative emotions may
be more central to the repressor construct than the claiming of positive emotions.
Implications of findings from the current study for choices about research design,
analysis, and interpretation of studies about the repressor construct are discussed.
iv
Table of Contents
List of Tables vii
List of Figures xi
Acknowledgements xvi
The repressor construct 1
Identifying repressors 3
Construct validity of the repressor construct 4
Physiological indices 5
Behavioral indices 6
Early relationships and the presentation of a positive
self to others 8
Information processing indices 10
Eysenck�s unified theory of anxiety 15
Self-concept of the repressor and the five factor model of personality 16
Neuroticism 16
Extraversion 17
Openness 17
Agreeableness 18
Conscientiousness 18
Big five personality 19
Measures of personality in addition to the big five 21
Diagnostic and statistical manual of mental disorders,
fourth edition Axis II personality disorder traits 21

v
Self-descriptions 21
Self-restraint 23
Worry 23
Interpersonal functioning 23
Coping 25
Emotionality 26
Attributional style 26
Physical health 27
Limitations of strategies used to examine the nature of
the repressor construct 30
Taxometric analysis and its contributions to theory about
psychological constructs 32
Overall summary 35
Goals 37
Hypotheses 38
Latent structure using original indices of the repressor construct 38
Latent structure using five factor model indices of the
repressor construct 38
Five factor model personality domains and the repressor construct 39
Method 41
Participants 41
Procedure 41
Self-report measures 41

vi
Marlowe-Crowne Social-Desirability Scale 41
State -Trait Anxiety Inventory 42
NEO Five-Factor Inventory 43
Data analyses and results 45
Missing data 45
Software used for analyses 45
Descriptive statistics and psychometric properties 45
Grouping 46
Analyses of variance 46
Defensiveness and trait anxiety ANOVAs 46
Big five personality MANOVA 47
Taxometric analyses 47
Selection of indicator variables 48
Simulation of comparator data sets to facilitate
interpretation of taxometric analysis output 52
Consistency tests 53
Mathematical procedures 54
MAMBAC analyses 55 MAXCOV analyses 57
Discussion 62
References 171

vii
List of Tables
Table 1 Original classification system used to identify repressors 73
Table 2 Weinberger Adjustment Inventory (WAI) classification
system used to identify repressors 74
Table 3 Descriptive and psychometric data for the STAI, MCSDS,
And the NEO-FFI personality domain subscale measures 75
Table 4 Corrected item-total correlation (CITC) and standardized
validity (SV) values for STAI items 76
Table 5 Corrected item-total correlation (CITC) and standardized
validity (SV) values for MCSDS items 77
Table 6 Corrected item-total correlation (CITC) and standardized
validity (SV) values for NEO-FFI stability (S) items 78
Table 7 Corrected item-total correlation (CITC) and standardized
validity (SV) values for NEO-FFI extraversion items 79
Table 8 Corrected item-total correlation (CITC) and standardized
validity (SV) values for NEO-FFI openness items 80
Table 9 Corrected item-total correlation (CITC) and standardized
validity (SV) values for NEO-FFI agreeableness items 81
Table 10 Corrected item-total correlation (CITC) and standardized
validity (SV) values for NEO-FFI conscientiousness items 82
Table 11 Mean (SD) Spielberger Trait Anxiety Inventory (STAI) Scores 83
Table 12 Mean (SD) Marlowe Crowne Social Desirability Scale scores 84
Table 13 Frequency (percentage) of each sex by group 85

viii Table 14 Mean (SD) NEO-Five Factor Inventory neuroticism scores 86
Table 15 Mean (SD) NEO-Five Factor Inventory extraversion scores 87
Table 16 Mean (SD) NEO-Five Factor Inventory openness scores 88
Table 17 Mean (SD) NEO-Five Factor Inventory agreeableness scores 89
Table 18 Mean (SD) NEO-Five Factor Inventory conscientiousness scores 90
Table 19 Standardized validity estimates of composite indicators 91
Table 20 Nuisance covariance estimates between composite indicators
in the repressor and non-repressor group 92
Table 21 Nuisance covariance estimates between composite indicators
in the combined group 93
Table 22 Judgments of latent structure for mean above minus below
A cut (MAMBAC) analyses 94
Table 23 Base rate estimates derived from MAMBAC analyses with
research, simulated dimensional and taxonic data 95
Table 24 Decisions regarding latent structure for MAXCOV analyses 96
Table 25 Base rate estimates derived from MAXCOV analyses with
research, simulated dimensional and taxonic data 97
Table 26 Standardized validity estimates of composite indicators in
separate male and female samples 98
Table 27 Nuisance covariance estimates between composite indicators
in the male repressor and non-repressor group 99
Table 28 Nuisance covariance estimates between composite indicators
in the female repressor and non-repressor group 100
ix Table 29 Nuisance covariance estimates between composite indicators
in the entire male and entire female group 101
Table 30 Judgments of latent structure for mean above minus below
a cut (MAMBAC) analyses with the male sample 102
Table 31 Base rate estimates derived from MAMBAC analyses with
research, simulated dimensional and taxonic data: male sample 103
Table 32 Decisions regarding latent structure for MAXCOV analyses
within the male sample 104
Table 33 Base rate estimates derived from MAXCOV analyses with
research, simulated dimensional and taxonic data: male sample 105
Table 34 Judgments of latent structure for mean above minus below
A cut (MAMBAC) analyses with the female sample 106
Table 35 Base rate estimates derived from MAMBAC analyses with
research, simulated dimensional and taxonic data: female sample 107
Table 36 Decisions regarding latent structure for MAXCOV analyses
within the female sample 108
Table 37 Base rate estimates derived from MAXCOV analyses with
research, simulated dimensional and taxonic data: female sample 109
Table 38 Number of NEO-FFI items that measure each possible facet
of the NEO-PI-R neuroticism scale 110
Table 39 Number of NEO-FFI items that measure each possible facet
of the NEO-PI-R extraversion scale 111

x Table 40 Number of NEO-FFI items that measure each possible facet
of the NEO-PI-R openness scale 112
Table 41 Number of NEO-FFI items that measure each possible facet
of the NEO-PI-R agreeableness scale 113
Table 42 Number of NEO-FFI items that measure each possible facet
of the NEO-PI-R conscientiousness scale 114

xi
List of Figures
Figure 1 NEO-FFI personality scores 116
Figure 2 Research data output derived from mean above minus below a
cut (MAMBAC) analyses conducted with defensiveness (Def)
and trait stability (Stv) composite indicators 118
Figure 3 Simulated dimensional data output derived from mean above
minus below a cut (MAMBAC) analyses conducted with
defensiveness (Def) and trait stability (Stv) composite indicators 120
Figure 4 Simulated taxonic data output derived from mean above minus
below a cut (MAMBAC) analyses conducted with defensiveness
(Def) and trait stability (Stv) composite indicators 122
Figure 5 Research data output derived from mean above minus below a
cut (MAMBAC) analyses conducted with impression management
(IM) and self-deceptive enhancement (SDE) composite indicators 124
Figure 6 Simulated dimensional data output derived from mean above
minus below a cut (MAMBAC) analyses conducted with
impression management (IM) and self-deceptive enhancement
(SDE) composite indicators 126
Figure 7 Simulated taxonic data output derived from mean above minus
below a cut (MAMBAC) analyses conducted with impression
management (IM) and self-deceptive enhancement (SDE)
composite indicators 128

xii Figure 8 Research data output derived from mean above minus below a
cut (MAMBAC) analyses conducted with agreeableness (Av)
and self-deceptive enhancement (SDE) composite indicators 130
Figure 9 Simulated dimensional data output derived from mean above
minus below a cut (MAMBAC) analyses conducted with
agreeableness (Av) and self-deceptive enhancement (SDE)
composite indicators 132
Figure 10 Simulated taxonic data output derived from mean above minus
below a cut (MAMBAC) analyses conducted with agreeableness
(Av) and self-deceptive enhancement (SDE) composite indicators 134
Figure 11 Research data output derived from mean above minus below a cut
(MAMBAC) analyses conducted with trait stability (Stv) and
impression management (IM) composite indicators 136
Figure 12 Simulated dimensional data output derived from mean above
minus below a cut (MAMBAC) analyses conducted with trait
stability (Stv) and impression management (IM) composite
indicators 138
Figure 13 Simulated taxonic data output derived from mean above minus
below a cut (MAMBAC) analyses conducted with trait stability
(Stv) and impression management (IM) composite indicators 140
Figure 14 Research data output derived from mean above minus below a
cut (MAMBAC) analyses conducted with trait stability (Sv) and
impression management (IM) composite indicators 142

xiii
Figure 15 Simulated dimensional data output derived from mean above
minus below a cut (MAMBAC) analyses conducted with trait
stability (Sv) and impression management (IM) composite
indicators 144
Figure 16 Simulated taxonic data output derived from mean above minus
below a cut (MAMBAC) analyses conducted with trait stability
(Sv) and impression management (IM) composite indicators 146
Figure 17 Research data output derived from mean above minus below a cut
(MAMBAC) analyses conducted with agreeableness (Av) and
impression management (IM) composite indicators 148
Figure 18 Simulated dimensional data output derived from mean above
minus below a cut (MAMBAC) analyses conducted with
agreeableness (Av) and impression management (IM) composite
indicators 150
Figure 19 Simulated taxonic data output derived from mean above minus
below a cut (MAMBAC) analyses conducted with agreeableness
(Av) and impression management (IM) composite indicators 152
Figure 20 Research data output derived from mean above minus below a cut
(MAMBAC) analyses conducted with trait stability (St) and
agreeableness (Av) composite indicators 154
Figure 21 Simulated dimensional data output derived from mean above
minus below a cut (MAMBAC) analyses conducted with trait
xiv
stability (St) and agreeableness (Av) composite indicators 156
Figure 22 Simulated taxonic data output derived from mean above minus
below a cut (MAMBAC) analyses conducted with trait stability
(St) and agreeableness (Av) composite indicators 158
Figure 23 Research data output derived from mean above minus below
a cut (MAMBAC) analyses conducted with trait stability (Sv)
and agreeableness (Av) composite indicators 160
Figure 24 Simulated dimensional data output derived from mean above
minus below a cut (MAMBAC) analyses conducted with trait
stability (Sv) and agreeableness (Av) composite indicators 162
Figure 25 Simulated taxonic data output derived from mean above
minus below a cut (MAMBAC) analyses conducted with
trait stability (Sv) and agreeableness (Av) composite indicators 164
Figure 26 Research data output derived from maximum covariance
(MAXCOV) analyses conducted with trait stability (Stv),
impression management (IM), and self-deceptive enhancement
(SDE) composite indicators 166
Figure 27 Simulated dimensional data Research data output derived from
maximum covariance (MAXCOV) analyses conducted with trait
stability (Stv), impression management (IM), and self-deceptive
enhancement (SDE) composite indicators 168
xv Figure 28 Simulated taxonic data output derived from maximum covariance
(MAXCOV) analyses conducted with trait stability (Stv),
impression management (IM), and self-deceptive enhancement
(SDE) composite indicators 170

xvi
Acknowledgements
Without the help of several people I would not have completed this
dissertation. Michelle Newman, thank you for meeting with me weekly
while I was at Penn State, and always being available via all means of
communication to help me to distill my interests into a manageable
dissertation project. I have been fortunate to have your guidance in many
ways, especially with improving my scientific writing. Not only my
writing, but also my analytic skills have improved immensely thanks to
your help. I appreciate your patience with me and will always be grateful
for all of the support you provided me throughout my graduate career.
Thank you to every member of my committee for encouraging me
to ditch the jargon and to write in a manner comprehensible to most
people. The courses I have taken with each of you have helped me to grow
into a more refined scientist and practitioner and I have been fortunate to
have the opportunity to learn from each of you.
Thank you to Ayelet and John Ruscio for all you have done to
make taxometric analysis accessible to and do-able by the masses. Thank
you also for your friendship. John, without your programs I would
probably not have attempted taxometric analysis procedures.
Many have provided me with emotional support and confidence
throughout graduate school and I would like to thank each of you. Without
each of you my obsessive-compulsive tendencies would have made it
much more difficult to complete this dissertation. Thank you for

xvii
reminding me of that still foreign, but always welcome, concept of GOOD
ENOUGH! I would especially like to thank Krista Mahoney, Michele
Kasoff, Tracey Rizzuto, Peter Molnar, Sr., Peter Molnar, Jr., Charlene
Molnar, Evelyn Zurybida, Evie Behar, Mark Ruiz, Bill Holahan, Sarah
Jayne, Tracy Dennis, Liz Pinel, Jon Winsten, Sascha Goluboff, Merrie
Filler, Brigette Erwin, Barbara Lawson, Sue Roethke, Linda Kastenhuber,
Michael Kozak, Laura Julian, Joe Coyle, Suki Montgomery, Sandy
Newes, Kristen Penza, and Andrea Zuellig. Many of you have not only
provided me with emotional support but also agreed to be blind raters for
me (SG, LP, MBK, TR, AZ). Special thanks also to the following people
who agreed to be blind raters: Brain Wottowa, Jim Ratcliffe, Jejo Koola,
Scott Mackin, and Ashley Leinbach.

1
The Repressor Construct
The repressor construct captures the characteristic tendency of some individuals
to disown the conscious experience of anxiety and other socially undesirable aspects of
the self (Weinberger, 1990). Individuals who disown negative emotions and other
negative self-attributes are said to repress the unwanted material (A. Freud, 1966; S.
Freud, 1957); are called repressors (Weinberger); and compose twenty percent of the
general population (Myers, 2000). Repressors resemble extremely anxious individuals on
indices of anxiety that do not require self-awareness (Weinberger). In particular, although
repressors report a low level of anxiety, they exhibit signs of anxiety comparable to that
shown by highly anxious people on behavioral, physiological, and information processing
indices of anxiety. Despite repressors� similarity to those who are highly anxious,
repressors are often mistakenly classified as members of the low anxious group when
information from self-report anxiety measures alone is used to group experimental
participants. This inclusion of repressors contributes to the formation of a low anxious
group that lacks validity because it is not solely composed of truly low anxious
individuals. Such inclusion may account for the oft-reported lack of differences between
the high and low anxious (Brown, Tomarken, Orth, Loosen, Kalin, & Davidson, 1996).
Further, it provides one potential explanation for the often-found discordance, or lack of
relationship, between self-report and non-self-report indices of anxiety (Miller & Kozak,
1995; Rachman & Hodgson, 1973). Unfortunately, most anxiety researchers do not factor
the repressor construct into their research designs, data analyses, and interpretations.
Rather, they mistakenly assign repressors to low anxious groups. This inattention to the
repressor construct has probably precluded an accurate understanding of anxiety.
2
One potential reason for the failure of researchers to account for repressors is the
history of difficulties associated with measuring the repressor construct and its correlates.
This history includes Freud�s (1957) impossible-to-falsify hypotheses about people such
as repressors who avoid awareness of negative emotions and findings that the repressor
construct, as it was originally measured by the repression-sensitization self-report scale
(1961), lacked discriminant validity from the construct of trait anxiety (Golin, Herron,
Lakota, & Reineck, 1964; Sullivan & Roberts, 1969).
Freud�s arguments were tautological: If someone denied avoidance of anxiety he
asserted this denial was itself evidence of avoidance. Fortunately, theorists refined the
concept of emotion so that its presence or absence could be inferred by the presence or
absence of three types of indices. Specifically, Lang (1978) introduced the idea that
emotion could be inferred through physiological, behavioral, and cognitive response
indices. This multi-method approach to assessment of emotion has been refined and
extended by other investigators (Eysenck, 1997; Kozak & Miller, 1993; Foa & Kozak,
1986) so that it has become possible to step outside of Freud�s tautological reasoning
loop and to ultimately identify repressors based upon discrepancies between their reports
of low levels of negative emotion and responses in other domains that belie those reports
(Gudjonsson, 1981; Weinberger, Schwartz, & Davidson, 1979).
Even with advances in the conceptualization and measurement of emotion,
however, investigators who did not have the means to measure behavioral or
physiological indices could not include the repressor construct in their research designs.
This was partly because the most commonly used self-report measure to identify
repressors did not discriminate them from truly low anxious (LA) individuals. In fact,
3 Byrne�s (1961) repression-sensitization scale correlated r = -.91 with a measure of trait
anxiety (Weinberger, 1990). Therefore, it was impossible to isolate repressors from the
LA using Byrne�s scale alone. Consequently, anxiety investigators without access to
multiple measurement resources continued to include repressors in low anxiety
comparison groups.
This problem was resolved, however, when Weinberger, Schwartz, and Davidson
(1979) observed that the Marlowe-Crowne Social Desirability Scale (MCSDS) could be
combined with a measure of trait anxiety to identify repressors. The MCSDS is a self-
report measure of defensiveness that can validly classify individuals as repressors.
Defensiveness is defined as the characteristic tendency to automatically process
information in a way that leads to a very positive perception of the self and the
maintenance of self-esteem (Crowne & Marlowe, 1964; Weinberger, 1990). The
MCSDS correlates around r = -. 20 with trait anxiety measures (Derakshan & Eysenck,
1997d) and therefore has discriminant validity from them. As well, it is not a face valid
measure of the tendency to experience negative or positive emotions as measures of trait
anxiety are. Thus, it is not clear to the respondent that it can be combined with a measure
of trait anxiety to identify individuals that avoid the experience of anxiety.
Identifying Repressors
Weinberger et al.�s (1979) classification system defined repressors as those who
reported an extremely high level of defensiveness on the MCSDS along with a low level
of trait anxiety. Although both repressors and the low anxious (LA) reported low levels
of anxiety, Weinberger found that repressors could be distinguished from the truly low
anxious by their extremely high levels of defensiveness (See Table 1). Weinberger et

4 al.�s classification system also resulted in identification of two other groups of
individuals, the defensive high anxious (DHA) and the traditionally high anxious (HA).
Both of these groups acknowledged the experience of high levels of anxiety, but only the
DHA reported extremely high levels of defensiveness. Thus, both repressors and the
DHA share a characteristic tendency to view information in a biased fashion that results
in the preservation of self-esteem and an idealized self-concept.
Efforts have been made to refine the repressor classification system, however,
none have provided incremental validity to the original system, which continues to be
used by the majority of investigators (Derakshan & Eysenck, 1997b; Furnham & Traynar,
1999; Turvey & Salovey, 1993). An alternative classification of the repressor construct
that defines repressors as individuals below the median on a distress factor and in the
upper third of the distribution on a restraint factor is depicted in Table 2 because some of
the studies described below rely on this six group classification system.
Construct Validity of the Repressor Construct
Several investigations have provided support for the validity of Weinberger et al�s
(1979) conceptualization of the repressor construct (Weinberger, 1990). Initial research
showed that whereas repressors reported low levels of anxiety they showed greater
behavioral and physiological correlates of anxiety during stressful phrase association
tasks when compared to HA and LA groups (Weinberger et al., 1979). Behaviorally,
repressors exhibited more verbal disturbance and slower responses. Physiologically,
repressors showed greater muscle tension in the frontalis muscles (an index of negative
affectivity: Cacioppo, Tassinary, & Fridland, 1990) than the HA and LA groups, and
trends for greater levels of heart rate and electrodermal activity than the LA group. After

5 the association tasks, self-report ratings of state anxiety decreased for the repressor group,
increased for the HA group, and remained the same for the LA group. Thus repressors
tendency to underreport anxiety was responsive to, and exacerbated by, a stressful
situation. The failure of Weinberger et al.�s (1979) study to include a DHA group left
open an important alternative explanation for findings. Specifically, defensiveness alone,
rather than a discrete repressor personality type, could have accounted for the findings
that repressors were more reactive to a stressful task than the low defensive HA and LA
groups. Nonetheless, several additional reports from independent laboratories have
provided evidence that repressors differ not only from the HA and LA, but also the DHA
group on indices of anxiety (see Furnham & Traynar, 1999, for a review).
Physiological indices. Examination of physiological research has also shown that
repressors can be discriminated from non-repressors and are more physiologically
reactive on measures of cardiovascular activity (Asendorpf & Scherer, 1983; Newton &
Contrada, 1992; Weinberger & Davidson, 1994), vascular activity (Asendorpf & Scherer,
1983), skin conductance (Barger, Kircher, & Croyle, 1997; Benjamins, Schuurs, &
Hoogstraten, 1994; Brosschot & Jansen, 1998; Gudjonsson, 1981; Sparks, Pellechia, &
Irvine, 1999), electromyographic activity (Weinberger et al., 1979),
electroencephalograph activity (Davidson, 1983), stress hormone levels (Brown,
Tomarken, Orth, Loosen, Kalin, & Davidson, 1996), blood lipid levels (Niaura, Herbert,
McMahon, & Sommerville, 1992) and immune function (Jamner, Schwartz, & Leigh,
1988). Notably, manipulations that involved putting repressors in social evaluative
contexts and instructing them to self-disclose information about their personalities
resulted in robust physiological activity. Repressors showed greater heart rate increases
6 during a public social evaluative condition where they were instructed to deliver a self-
disclosing speech about the most undesirable aspect of their personality than when they
delivered the same speech during a private condition (Newton & Contrada, 1992). Heart
rate increase during the public condition was also significantly greater than that
evidenced by non-repressor groups. Nevertheless, repressors reported much less distress
than was evident on physiological indices of their emotional response in the public
condition. Similar results were reported by Weinberger and Davidson (1994): Repressors
showed significantly more physiological reactivity than non-repressors when asked to
disclose information about their personality, but did not interpret it as reflecting anxiety
when this reactivity was pointed out to them. These results suggest that self-disclosure of
socially undesirable self-attributes such as the experience of anxiety may be threatening
to repressors.
Behavioral indices. Behavioral indices can be used to discriminate repressors
from non-repressors. For example, repressors� facial expressions were rated by judges as
indicating high anxiety despite reports of low anxiety (Asendorpf & Scherer, 1983).
Specifically, judges rated them as showing anxiety comparable to that exhibited by the
HA group and significantly more than that seen in the LA group. Ratings of facial anxiety
in the DHA group did not differ from any comparison group. Another study also
indicated that observational ratings of behavioral anxiety in repressors were comparable
to that seen in the HA and significantly greater than in the LA group (Fox, O�Boyle,
Barry, & McCreary, 1989). Additional findings showed that repressors were willing to
expose themselves to higher levels of shock than non-repressors (Jamner & Schwartz,
1986, cited in Jamner & Leigh, 1999) and that repressors had a poor behavioral outcome

7 following a multidisciplinary treatment for chronic pain (Burns, 2000). Repressors also
showed a behavioral delay, compared to non-repressors, in rating the valence of
ambiguous sentences that could have either a threatening or a non-threatening meaning
(Hock, Krohne, & Kaiser, 1996).
Behavioral anxiety in repressors has also been found in studies evaluating time
spent reading negative information about the self. Repressors who received primarily
negative feedback about their personality (a measure of self-concept: Costa & McCrae,
1992) spent significantly less time reading this feedback in a private condition than in a
public condition where they thought another person would have the information about
them (Baumeister & Cairns, 1992). In fact, repressors reported worrying about how that
person would view them. These results suggest that repressors are distressed when they
think others have access to negative information about them, but that they avoid
processing negative information about the self if others are not also exposed to it.
In addition to the direct assessment of behavioral anxiety, studies have also
examined indirect indices. For example, psychotherapy is a situation marked by sharing
of negative information about the self . Individuals high in defensiveness, a hallmark of
the repressor construct, show a high likelihood of terminating therapy prematurely
(Strickland & Crowne, 1963). Such premature termination suggests that the self-concept
of highly defensive individuals is threatened by the work of therapy that involves honest
self-evaluation, disclosure, and acceptance of many facets of the self not typically
acknowledged outside of the therapy context. Such self-acceptance must include
incorporation, into the self-concept, of less desirable parts associated with sexual and
aggressive impulses and of negative emotions in general (Freud, 1957; Jourard, 1971,

8 Newman, Castonguay, Borkovec, & Molnar, in press; Perls, 1969; Perls, Hefferline, &
Goodman, 1951; Rogers, 1951,1961). This would be expected to be especially difficult in
the context of an intimate therapeutic relationship.
Early relationships and the presentation of a positive self to others. One theory of
the etiology of repression is that these individuals were exposed to emotionally
unavailable caregivers in childhood. Evidence for this theory includes findings that
repressors tend to report both idealized attachment histories and avoidant attachment
features when given the opportunity to also endorse some items that reflect secure
attachment on the same measure (Vetere & Myers, 2000). As well, behaviorally specific
examples of repressors� interactions with caregivers have been rated by judges as
characterized by the lack of an emotionally available caregiver (Myers & Brewin, 1994).
Lack of an emotionally available caregiver to validate and affirm the self�s experience
and to teach emotion regulation strategies presents children with major challenges in
developing a positive view of the self and adaptive emotion management strategies (see
Bowlby, 1988; Cassiday, 1999, for reviews). Additionally, children whose caregivers
neglect them emotionally must learn to behave and self-present in ways that will maintain
attachment with and acceptance by caregivers. Without attachment to caregivers, through
socially desirable and positive behaviors, children will perceive a threat to self-survival.
Thus, such children develop a habit of focusing on the caregiver�s desires and behaving
in ways acceptable to the caregiver because such behavior helps to maintain attachment
and to eliminate the anxiety of an anticipated absent caregiver. Children who find that
displays of negative emotions such as anxiety and fear lead to unavailable caregivers may
become disconnected from the needs of the self because they learn to focus on others�

9 needs instead. Such children will lack awareness of emotional experience and the need
status that emotions signal. For example, fear signals threat to the self and thus a need to
think, feel, and behave in self-protective ways, thus if it is rigidly avoided by someone
without emotion management strategies then that person will lack exposure to
information relevant to self-protection (Greenberg & Paivio, 1997). Moreover, to
experience negative emotions such as fear without emotion management strategies is
perceived by children as threatening to the cohesiveness of the self. Thus, it is plausible
that repressors repeatedly practice positive self-presentation in order to manage the
anxiety associated with an absent caregiver. This conceivably results in the very positive
self-concept found in adult repressors. Repeated suppression of awareness of undesirable
aspects of the self is practiced repeatedly and so well that it becomes an automatic
process of which the repressor lacks awareness. Indeed, evidence suggests that
repressors� reports about the self do not change in situations where they think others will
know if they are being deceptive (Millham & Kellogg, 1980). Finally, individuals high in
defensiveness are rated by others as often engaging in extremely self-neglecting
behaviors (Crowne & Marlowe, 1964). Such self-neglect is consistent with theories that
posit that individuals treat the self with the same neglect behaviors received from early
caregivers (Benjamin, 1996). Together, theories about the formation of attachment with
important others and the development of emotion regulation abilities provide a plausible
motivation for repressor�s tendencies to avoid awareness of negative attributes and to
claim possession of extremely positive ones.
Evidence reviewed to this point suggests that repressors have reported levels of
anxiety comparable to that reported by the LA, but exhibited more anxiety than this

10 group on measures of physiology and behavior. Further, repressors levels of
physiological and behavioral anxiety have been comparable to, or greater than levels
found in HA individuals and DHA individuals do not tend to differ from the repressor or
the LA group on such indices (see Derakshan & Eysenck, 1997ab; Eysenck, 1997;
Weinberger, 1990; Furnham & Traynar, for reviews). Taken together, this indicates that
repressors are unique kinds of anxious individuals who should be discriminated from the
truly LA and who differ from HA individuals. Much less is known about the DHA
group, however, they typically show levels of anxiety in between that found in repressors
and the HA.
Information processing indices. Measures of information processing serve as
useful indices of anxiety when they do not require awareness of distress. On these
measures, repressors exhibit biased processing marked by avoidance of the perception of
social threat to self, avoidance of negative emotions evoked by threat to self, and
attention toward information consistent with an overly positive self-concept / personality.
These cognitive biases have been found on measures of attention (e.g., Calvo & Eysenck,
2000), encoding (e.g., Hansen, Hansen, & Shantz, 1992), and retrieval (e.g., Davis,
1990).
To manipulate attention, investigators have used dichotic listening tasks
(Bonnano, Davis, Singer, & Schwartz, 1991; Calvo & Eysenck, 2000; Poppell & Farmer,
2000) and visual scanning tasks (Fox, 1993,1994; Myers & McKenna, 1996) and showed
that repressors direct attention away from information that is threatening to the self. For
example, repressors read rapidly displayed threat words more quickly than HA and LA
groups, suggesting that they were initially primed to perceive such words (Calvo &

11 Eysenck). However, when the threat words were presented with a greater time delay,
repressors did not differ from the LA group, and both the repressor and LA groups read
more slowly than the HA group. These results suggest that repressors showed early and
more automatic vigilance to, and then later avoidance of, threat information. In contrast,
the HA group showed a later vigilance to threat (Calvo & Eysenck). Interestingly, the LA
group read delayed ambiguous words more rapidly than both the repressor and HA
groups who did not differ from each other, suggesting that LA were primed to expect
non-threatening outcomes and that repressors perceived the ambiguous words as
threatening as did the HA group.
Evidence for encoding differences show that when repressors attend to threat
information, it is encoded differently than in non-repressors and in a way that decreases
how much of it is retrieved. These results have been found in an autobiographical
memory task (Hansen & Hansen, 1988) and a task that required visual encoding of
emotional stimuli (Hansen et al., 1992). For example, compared with non-repressors,
repressors described memories with fewer emotion descriptors and as less multi-
dimensional. Although repressors encoded dominant facial emotions of happiness, anger,
sadness, and fear similarly to non-repressors, they encoded fewer of the visually
presented non-dominant emotions. This effect of less encoding for non-dominant
emotions was especially strong when the non-dominant emotion was fear and almost
nonexistent when the non-dominant emotion was happiness. This suggests a discrete and
less complex encoding process that could lead to an associative network that lacks rich
retrieval cues for negative emotional states in the self. Thus, negative material would be
more difficult for repressors to access during retrieval tasks.

12
In fact, retrieval differences for negative material between repressors and non-
repressors have been found in studies of autobiographical memory. For example,
repressors, compared to non-repressors, retrieved fewer memories of times when they felt
negative emotions. Additionally, repressors were significantly older than comparison
groups at the time these negative events occurred (Davis, 1990; Myers & Brewin, 1995).
Interestingly, when the retrieved event evoked positive emotions, group differences were
not found for recall and age at the time of the recalled event. Even when researchers
provided repressors with retrieval cues that included descriptions of events typically
associated with different emotions, repressors continued to retrieve fewer negative
personal memories (Newman & Hedberg, 1999). Further, Davis (1987) found that
repressors recalled fewer negative memories only for the self and not for others. Her
results thus ruled out the possibility that repressors merely lacked labels for negative
emotions because they used such labels to describe others� negative experiences. In
another experiment, repressors recalled less personal negative feedback than positive
feedback in a condition where feedback was primarily negative (Baumeister & Cairns,
1992). In comparison, when repressors received primarily positive feedback about the
self (i.e., information that evoked a positive emotional state), they were less able to recall
positive information than the negative feedback embossed within it. These results
suggested the possibility that in comparison to information that evoked a negative
emotional state, repressors more readily attended to, encoded, and retrieved information
that evoked a positive emotional state within the self. In another study, repressors
increased their recall of negative emotional material when asked to repeatedly engage in
efforts to recall such information (Davis, 1990). This increase in recall associated with
13 repeated attempts is referred to as hyperamnesia (Payne, 1987; Scrivner & Safer, 1988)
and has also been found in highly anxious individuals who acknowledged motivation to
avoid recall of memories in which the self was threatened (Foa, Molnar, & Cashman,
1995).
Repressors� selective recall may be due to retrieval inhibition (Myers, Brewin, &
Power, 1998), a process that involves active efforts to avoid retrieval of information. In
one experiment, a directed forgetting task along with the list method of stimuli
presentation was used. This method strengthens the inference that retrieval inhibition,
rather than lack of encoding, is measured. It was found that repressors forgot more of the
negative to-be-forgotten words than did non-repressors, even when encoding was
increased via the list method of stimulus presentation. No group differences were found
when the stimuli to be forgotten were positive, thus further suggesting that retrieval
inhibition of negative material had occurred: Such inhibition of retrieval is viewed by
cognitive researchers as motivated forgetting (Myers et al.). Also consistent with the
finding that repressors attempt to inhibit retrieval of threatening information are findings
from a separate experiment in which repressors were instructed to listen to an audio taped
recording of a story in which critical, positive, or indifferent parental behaviors were
described (Myers & Brewin, 1995). They were further instructed to imagine that the story
was their own personal experience. Repressors recalled fewer of the critical parental
behaviors than non-repressors, while they did not differ in recall of positive behaviors.
These results were especially interesting in light of the already-described findings that
judges rated behaviorally specific examples of repressors� memories as marked by lack of
caregiver emotional availability (Myers & Brewin, 1994). Thus, it is especially

14 interesting that repressors recalled less negative material about the unavailable caregiver
of another when the material was encoded as if it was the self�s personal experience.
In summary, results from investigations of information processing suggest that,
compared to non-repressors, repressors attend early to negative emotional material and
then avoid attention to it later (Calvo & Eysenck, 2000). This later avoidance may rely on
a process whereby repressors encode information less complexly in associative networks
so that it is not easily retrievable (Hansen & Hansen, 1988). As well, repressor�s
avoidance may rely on retrieval inhibition that is motivated by a desire to protect the self
(Myers et al., 1998). Interestingly, repressors can recall negative emotional material when
it is presented within the context of primarily positive information about the self
(Baumeister & Cairns, 1992) and when asked to engage in repeated retrieval efforts
(Davis, 1990). Especially noteworthy is the general finding that less information that has
a negative valence and threatens the self is attended to, encoded, and retrieved than is
information with a positive valence (Davis, 1987; 1990; Hansen & Hansen, 1988;
Hansen, Hansen, & Schantz, 1992). Eysenck�s observation that repressors engage in
systematic distortions when processing information has resulted in the unified theory of
anxiety. This theory accounts for both the discordance found between self-report indices
of anxiety and indices of anxiety that do not rely on self-awareness (Eysenck, 1997) and
for the information processing mechanisms used by repressors to maintain an overly
positive self-concept.

15 Eysenck�s Unified Theory of Anxiety
Eysenck holds that repressors, in contrast to the HA, reliably avoid attending to
and interpreting both internal and external information that can be used to surmise
anxiety within the self. The specific internal sources of information include both
cognition (i.e., information attained via attention, encoding, and retrieval processes) and
physiology. The external information includes both environmental stimuli and behavioral
responses. Four types of cognitive biases have been identified in HA and repressor
individuals. Whereas HA exhibit (1) selective attentional bias; �the tendency to attend
selectively to potentially threatening information or stimuli, repressors show (2) opposite
attentional bias; �the tendency to avoid attending to potentially threatening information or
stimuli.� Additionally, HA exhibit (3) interpretive bias; �the tendency to interpret
ambiguous information or stimuli in a threatening fashion,� and �repressors show (4)
opposite interpretive bias; �the tendency to interpret ambiguous information or stimuli in
a non-threatening fashion.� Eysenck�s theory has outlined how repressors attention and
interpretive biases can account for their reports of low anxiety despite evidence to the
contrary. Although it is not explicitly stated in his theory, the object perceived as
threatened by both the high anxious and repressors is the self, however each group copes
differently with it. Interestingly, the creators of the MCSDS viewed it as a measure of
�defensiveness and protection of self-esteem� (Crowne & Marlowe, 1964, p. 206) and the
manual for one of the most popular measures of trait anxiety (Spielberger, Gorsuch,
Lushene, Vagg, & Jacobs, 1983) asserts that anxiety is in response to either social or
physical threat to the self. The instruments used to identify repressors thus collectively
measure a motivation to view the self positively in the service of self-protection.

16 Self-Concept of The Repressor and the Five Factor Model of Personality
Consistent with the assumption that repressors are motivated to protect the self by
presenting with extremely desirable traits are findings from self-report studies. These
findings (see Weinberger & Schwartz, 1990, for a review) suggest that repressors�
information processing biases are also applied to processing of internal or external
information about their personality. Personality has been defined as the characteristic
styles of thinking, feeling, and behaving in which an individual engages (McCrae &
Costa, 1990) and is largely tantamount to one�s self-concept (McCrae & Costa). Before
presentation of findings about how repressors view their self-concept, it is important to
review the theory known as the five-factor model (FFM) of personality or the big five
(Costa & McCrae, 1992; Digman, 1990; Goldberg, 1990; McCrae & Costa, 1990, 1997;
Wiggins & Trapnell, 1997). The FFM derives its name from repeated findings across
independent groups of investigators that five personality domains consistently emerge in
factor analyses of responses from a range of inventories that measure styles of thinking,
feeling, and behaving (Costa & McCrae, 1992; Watson, 2000). These five personality
domains include neuroticism, extraversion, openness, agreeableness, and
conscientiousness.
Neuroticism. Individuals who score high on Neuroticism (N) are characterized by
the pervasive experience of negative emotions such as fear, sadness, embarrassment,
anger, guilt, and disgust. They often have difficulty controlling their impulses and
coping with stress. In comparison to those high in N, those low in N are calm, relaxed,
and even-tempered. They are stable people who cope well with, and do not become
overwhelmed by, negative emotions that can be associated with stress. Those low in N
17 can keep their impulses in check and are less prone to the vicissitudes of chronic negative
emotions (Costa & McCrae, 1992). Neuroticism is composed of six traits that include
anxiety, angry hostility, depression, self-consciousness, impulsiveness, and vulnerability.
Extraversion. Individuals who score high on Extraversion (E) are sociable,
assertive, active, energetic, talkative, and optimistic and tend to experience positive
emotions such as joy, happiness, love, and excitement. In comparison, those low in E are
reserved; seek out fewer interactions with others and less excitement and stimulation.
Additionally, they do not experience the intensity of positive affect or the high energy
levels of those high in extraversion. The tendency to experience distress also includes a
low well-being dimension related to sociability (Costa & McCrae, 1992). Extraversion is
composed of six traits that include warmth, gregariousness, assertiveness, activity,
excitement-seeking, and positive emotions.
Openness. Individuals who score high on Openness (O) are characterized by their
active imagination and curiosity about both internal and external events. They attend to
inner feelings and thus experience both positive and negative emotions intensely. They
are characterized by their aesthetic sensitivity, preference for variety, intellectual
curiosity, independence of judgment, and willingness to adapt less traditional values. In
comparison, those low in O are described as more conservative in their views and
conventional in their behaviors. They have a preference for what is familiar. In specific
environments extremely high and low levels of overall openness could be considered
socially desirable, however in general such extremes are viewed as undesirable (Costa &
McCrae, 1992). Openness is composed of six traits that include fantasy, aesthetics,
feelings, actions, ideas, and values.
18
Agreeableness. Individuals who are high on Agreeableness (A) are characterized
by their ingenuousness, willingness to help others and expectations that others will be just
as helpful, sympathy and concern for others in need, willingness to defer to others to
decrease interpersonal conflict, and modesty. In comparison to those high in A, those low
in A are described as cynical and critical of others, skeptical, antagonistic, willing to
manipulate interpersonal scenarios to obtain desired outcomes, self-focused, willing to
fight for their beliefs, arrogant, hard-headed, and realists (Costa & McCrae, 1992).
Agreeableness is composed of six traits that include trust, straightforwardness, altruism,
compliance, modesty, and tender-mindedness.
Conscientiousness. Individuals who score high on Conscientiousness (C) are
characterized by their self-control including their ability to control their impulses. This
control of impulses contributes to their ability to complete tasks in an orderly fashion,
their reliability, their morality, and to their description by others as organized and
disciplined (Costa & McCrae, 1992). Their discipline contributes to their tendency to be
high achievers and, at extreme levels of C, workaholics. In comparison to those high in
C, those low in C are described as less disciplined and less organized, less exacting in
their work, more spontaneous and hedonistic. Conscientiousness is composed of six traits
that include competence, order, dutifulness, achievement striving, self-discipline, and
deliberation.
The FFM of personality is related to the degree to which a person generally
experiences both positive and negative emotion, referred to as positive and negative trait
emotionality, respectively (Watson, 2000). Negative emotionality is the �glue� that holds
together all of the traits that compose neuroticism whereas positive emotionality is the

19 �glue� that holds together the higher order traits of E (Watson). Trait emotionality is also
related to A and C, even after controlling for variance from the other three personality
domains (Watson). However, trait emotionality is not related to the openness personality
domain (Watson). Thus, four of the big five personality domains are linked to an
individual�s tendency to experience both positive and negative emotions.
Big five personality. Two laboratories have examined how repressors responded
on measures of the FFM (Pincus & Boekman, 1993; Ramanaiah, Byravan, & ThuHien,
1996). In the first investigation, repressors, and the other two WAI (see Table 2) low
distress groups, reported significantly less neuroticism than all three of the high distress
groups (Pincus & Boekman). A similar pattern of results was found for extraversion such
that all low distress groups reported significantly more E than all high distress groups. No
group differences were detected for openness. Of the five personality domains,
agreeableness (A) distinguished repressors best from all of the other groups. Repressors
reported significantly more A than all WAI-comparison groups. Both the repressor and
self-assured groups reported significantly more conscientiousness than all three high
distress groups, the latter of which did not differ from each other. Repressors also scored
1.5 standard deviations higher on agreeableness than a normative comparison group.
Repressors were in the average range on the N, E, O, and C personality domains.
The only other investigators to measure repressor�s responses on a measure of the
big five did not find that repressors differed from any of the WAI comparison groups
(Ramanaiah et al., 1996). Unexpectedly, repressors actually reported the lowest mean
level of agreeableness as indicated by an examination of means. Also unexpectedly, the
undersocialized group scored significantly higher on agreeableness than the

20 oversocialized group. These findings were inconsistent with those reported by Pincus and
Boekman (1993). Another surprising finding was revealed upon inspection of
conscientiousness means. Specifically, the highest conscientiousness mean was found in
the undersocialized group and the lowest in the oversocialized group. These results are
extremely surprising in light of reports that some restraint is necessary for
conscientiousness (i.e., impulse control) and that high levels of distress make self-
restraint difficult (Weinberger & Schwartz, 1990). The undersocialized group, by
definition, has the lowest, and the oversocialized group, the highest levels of restraint and
distress, respectively (Weinberger & Schwartz). Thus, the undersocialized group would
have been expected to have a lower conscientiousness score than the oversocialized
group. No overall group differences were found for the openness domain. Overall,
findings from this study suggest the possibility of data processing errors.
Another personality trait measure, the Eysenck Personality Questionnaire (EPQ-
R: Eysenck, Eysenck, and Barrett, 1995), was administered to repressors who reported
significantly lower levels of neuroticism than the DHA and the HA (Furnham and
Traynar, 1999). Repressors and the DHA had significantly higher Lie scores than the LA
and HA. The Lie scale is a measure of defensiveness that correlates highly with the
MCSDS (Gudjonsson, 1981). Psychoticism, a trait that reflects low levels of both
agreeableness and conscientiousness (McCrae & Costa, 1985), was also measured. The
HA reported a significantly higher level of psychoticism than the DHA only. No group
differences were found for the extraversion scale or on variables related to extraversion:
behavioral activation including drive, fun, and reward. On behavioral inhibition, the two
high anxious groups were significantly higher than the LA group.

21 Measures of Personality in Addition to The Big Five
Diagnostic and Statistical Manual of Mental Disorders, Fourth Edition (DSM-IV:
American Psychiatric Association, 1994) Axis II personality disorder traits. Personality
disorders listed in the DSM-IV have parallels to the big five model of personality (Costa
& Widiger, 2002) and can contribute to an understanding of the self-concept of the
repressor. Repressors have reported significantly more features of compulsive personality
than the WAI reactive group described in Table 2 (Weinberger & Schwartz, 1990). This
suggests they will score high on the conscientiousness facets of competence, order,
dutifulness, and achievement striving and low on openness to values (Costa & Widiger,
2002). In the same study, repressors reported a significantly lower level of borderline,
hysterical, and avoidant personality features than the oversocialized and reactive groups.
This suggests that, in comparison to the two latter groups, repressors will report a low
level of neuroticism and a high level of agreeableness (Costa & Widiger). Both the
oversocialized and reactive groups reported significantly higher dependent features than
the self-assured, but not the repressor, group. Repressors were not distinguishable from
other groups in terms of narcissism, sociopathic, or dependent personality features and
often did not differ from the self-assured group on personality variables (Weinberger &
Schwartz).
Self-descriptions. An informal assessment of self-concept in Weinberger et al.�s
seminal 1979 study required participants to describe, in a few words, �the most
outstanding or important characteristics� of their personality. Repressors gave self-
descriptions that reflected, �preoccupation with mastering negative emotion� and rigid
self-restraint. Repressors self-descriptions were markedly different from those of the LA,

22 who gave self-descriptions marked by a flexible approach to life, openness to experience
in general, extraversion and associated positive emotionality. Repressors were also
markedly different from the HA, who tended to provide self-descriptions that reflected a
vulnerable view of self and a tendency toward inhibition in relationships. Weinberger and
his colleagues provided no description of the DHA group, but this group has been
described by Myers (2000) as uncomfortable disclosing information, embarrassed and
worried.
Repressors also describe the self more positively and less negatively generally
than do non-repressors (Kreitler & Kreitler, 1990; Myers & Brewin, 1996; Weinberger &
Schwartz, 1990). Repressors reported significantly more positive self-references than did
both the DHA and the HA (Krietler & Krietler). In a later experiment participants rated
the degree to which negative and positive descriptors were true of both self and others
(Myers & Brewin): Repressors were compared to a combined group of non-repressors
from which sub-threshold repressors had been omitted. All participants showed a bias
whereby positive words were rated as more, and negative words as less, true of the self
with no group differences for either the degree of discrepancy between self and other
ratings for positive words or how much each group rated positive words as true of the
self. Repressors, however, reported a significant discrepancy between self and other
ratings for negative words and reported significantly fewer negative words were true of
the self than of others. Finally, repressors, as well as the other two WAI low distress
groups, described the self with significantly greater self-esteem than did all three high
distress groups (Weinberger and Schwartz). Repressors have also described the self as
less likely to experience negative events than each of Weinberger et al.�s original (1979)

23 comparison groups and than a non-extreme comparison group composed of participants
who reported average levels of trait anxiety and defensiveness (Myers & Brewin, 1996).
Moreover, repressors reported a belief that significantly more positive events would
happen to them than the non-extreme comparison group.
Self-restraint. Repressors have reported a significantly higher level of self-
control of emotions, significantly less sexual activity and delinquency, and therefore
more control over sexual and aggressive impulses, than all comparison WAI-classified
groups but the oversocialized (Weinberger and Schwartz, 1990). Repressors also reported
significantly less alcohol use than the two other low distress groups and significantly less
aggression than the reactive group (Weinberger & Schwartz). In another study, repressors
reported significantly more attentional control than all comparison groups classified using
Weinberger et al.�s (1979) original system (Krietler & Krietler, 1990). They also reported
significantly less negative daydreaming than the DHA and the HA and more control over
unpleasant and unwanted thoughts and images than non-repressors (Myers, 1998). In
addition, repressors reported using significantly more distraction and less punishment to
control unwanted cognition than all of Weinberger�s original comparison groups.
Worry. Repressors reported using significantly less worry to control thoughts than
the reactive, the group that reported significantly more worry than all comparison groups.
An independent research group reported similar findings (Eysenck & VanBerkum,
1992). Finally, Weinberger and Schwartz found that the self-assured, but not repressors,
reported significantly less obsessive worrying than the oversocialized.
Interpersonal functioning. In a separately reported investigation that used the
same participants as Pincus & Boekman (1993), Pincus and Boekman (1995) described

24 repressors responses on a measure of the superordinate interpersonal dimensions of
dominance (status) and nurturance (love or affiliation). These dimensions, in
combination, map onto the Big Five domains of E and A. Specifically, groups high in
both dominance and nurturance are expected to be high in E. Groups high in nurturance,
but low in dominance, should be high in agreeableness. Moreover, groups extremely low
in dominance and high in nurturance and therefore agreeableness are expected to have
difficulties with assertive behaviors (Pincus & Boekman, 1995). Repressors reported
significantly higher nurturance scores than the undersocialized and reactive group, but
did not differ from groups on dominance with one exception. All groups including
repressors reported lower dominance than the undersocialized group.
Assertiveness in relationships was more directly measured in two separate studies.
Repressors reported significantly more assertive behaviors and less aggressive / hostile
and aggressive / manipulative behaviors than the HA and significantly less passive
behavior than the DHA in one study (Furnham and Traynar, 1999). In the other study,
repressors did not differ from the five WAI comparison groups on a measure of
assertiveness (Weinberger and Schwartz, 1990). Finally, on a measure called rationality /
emotional defensiveness designed to measure the tendency to avoid negative emotions in
interpersonal conflicts and to use logic and reason to cope with conflicts and life in
general, repressors reported significantly higher levels of rationality / emotional
defensiveness than non-repressors (Ritz & Dahme, 1996). In that avoidance of assertive
behaviors is a means of not evoking negative emotions related to assertion of needs in
relationships, this indirectly suggests that repressors have assertiveness difficulties.

25
Coping. Repressors have reported more total coping resources than all of
Weinberger et al. (1979) original comparison groups (Myers and Vetere, 2000). Specific
coping resources measured included physical (e.g., jogging), cognitive (e.g., looking for
the positive side of people and situations), emotional (e.g., ability to cry when sad), social
(e.g., enjoying being with people), and spiritual / philosophical (e.g., praying). On
specific coping scales repressors reported significantly more cognitive and emotional
coping resources than the HA and DHA; significantly more spiritual / philosophical
coping resources than both the LA and HA; and significantly more social and physical
coping than both the LA and the DHA. Finally, repressors reported significantly more of
all types of coping than a combined non-repressor group that was composed of
individuals from the entire screening pool from which the extreme comparison groups
were derived.
Repressors have also reported significantly more problem-focused coping (i.e.,
active coping, planning, seeking instrumental support), positive reinterpretation and
growth, and acceptance than the DHA and HA groups and significantly less emotion-
focused coping (i.e., seeking emotional support, suppression of competing activities,
restraint, focus on and venting of emotions, denial, and behavioral disengagement) than
the HA group (Myers and Derakshan, 2000). Furnham and Traynar (1999) reported
similar results. Repressors did not differ from the LA in either of these studies (Furnham
& Traynar; Myers & Derakshan).
The tendency to attend toward or away from information to cope with stressful
situations is known as monitoring and blunting, respectively, (Miller, 1996). Repressors
reported significantly less monitoring than the HA group, and no group differences were

26 detected on the blunting scale (Fuller and Conner, 1990). Proportion of Monitors and
Blunters, as operationalized by Miller�s (1996) cut-off scores, was also calculated in this
study and found to differ across groups. Repressors composed 65% of the Blunter and
35% of the Monitor group. In contrast, the HA composed only 17% of the Blunter and
83% of the Monitor group. The LA composed 54% of the Blunter and 46% of the
Monitor group. Proportion of both repressors and LA did not differ significantly in either
the Blunter or the Monitor group. In a more recent investigation that included a DHA
group, repressors reported significantly less monitoring than the DHA and HA groups,
and showed a trend to monitor less than the LA (Myers and Derakshan, 2000). Consistent
with Fuller and Conner�s (1990) findings, no group differences were found for blunting.
Emotionality. Repressors have reported significantly more overall positive and
less overall negative emotions than the DHA (Krietler & Krietler, 1990). In particular,
repressors reported significantly more joy, contentment and vigor, and less fatigue and
depression than the DHA group. Jealousy was the only specific negative emotion that
repressors reported significantly less of than all traditional (Weinberger et al., 1979)
comparison groups. All groups reported significantly less negative emotions overall than
the HA group. Particular negative emotions that repressors reported significantly less of
than the HA included depression, anxiety, fatigue, and fear. No group differences were
found for alexithymia, a lack of words for feeling states (Krietler & Krietler, 1990). In a
separate study, repressors did report a significantly higher level of alexithymia than the
WAI reactive group.
Attributional style. Myers (1996) measured attributional style, also called locus of
control, in a repressor and a combined non-repressor group. Attributional style refers to

27 the explanations that people devise to account for outcomes. Depressive individuals tend
to attribute negative outcomes to internal characteristics of the self (verses external) that
are both stable (verses unstable) and present across situations (i.e., global verses specific).
Repressors exhibited an opposite attributional pattern from depressive individuals.
Specifically, repressors reported the belief that significantly more negative events were
due to a combination of external, unstable, and specific factors than did a comparison
group of non-repressors composed of Weinberger et al.�s (1979) original comparison
groups. Two separate research groups did not report group differences in attributional
style when comparisons were made between repressors and each of Weinberger et al.�s
(1979) original groups separately (Furnham and Traynar, 1999; Kreitler & Krietler,
1990).
Physical Health. One source of information indicative of threat to the self, for
which repressors would be expected to exhibit the opposite attention and interpretive
biases proposed by Eysenck (1997), is information about negative physical health. Such
biased information processing would be expected to result in optimistic reports about
physical health-related variables. Indeed, repressors reported fewer negative physical
symptoms and a more positive physical health status than a combined non-repressor
group (Myers & Vetere, 1997) despite lack of published evidence of superior health. In a
separate study, repressors reported significantly fewer health problems than the DHA in
the following areas: digestion, breathing, skin problems, and lassitude (Krietler &
Krietler, 1990). Repressors also reported significantly fewer health problems than the
HA in the following areas: circulation, digestion, temperature changes, mouth, eyes,
muscular tension, pain, being sick, sleep problems, and total somatic complaints.

28 Repressors did not differ from the LA on any reported health problems (Krietler &
Krietler).
Repressors have also reported a significantly greater belief in their ability to
control important health outcomes than all of Weinberger et al.�s original comparison
groups (Krietler & Krietler, 1990). In yet another study, repressors reported greater
beliefs in their ability to control conditions such as skin and lung cancer and heart attacks
than did non-repressors (Myers & Reynolds, 2000). Repressors� beliefs in control over
health outcome are suggestive of an idealized self-view that extends to physical health.
Repressors� health beliefs are alarming because they are combined with a bias against
noticing potentially negative physical symptoms and a tendency to not experience the
distress that often motivates seeking of preventive health care (Watson & Pennebaker,
1989). This combination of factors may allow for the progression of disease states to a
point where intervention is more challenging. Consistent with this possibility were
findings from two studies: repressors diagnosed with coronary heart disease or cancer had
a greater mortality rate than did non-repressors (Frasure-Smith et al., 2002; Jensen, 1987,
respectively). Also consistent were findings that repressors engaged less than non-
repressors in the proactive behaviors necessary to cope with stressful medical conditions
such as asthma (Lehrer, 1999; Steiner, Higgs, Fritz, Laszlo, & Harvey, 1988) and
cardiovascular problems (Denolett, 1992).
The tendency to notice and respond with fear toward physical symptoms that are
characteristic of increased sympathetic and decreased parasympathetic activity is called
anxiety sensitivity (Taylor, 1995). Those low in anxiety sensitivity tend not to be vigilant
toward such physiological information and also tend not to interpret it negatively if it is

29 noticed. It would be expected that those lowest in anxiety sensitivity would report the
lowest level of physical symptoms and therefore report the fewest health problems. When
anxiety sensitivity groups were formed using tercile splits, repressors composed 27% of
the lowest, 17% of the middle, and none of the high anxiety sensitivity group (Wehrun
and Cox, 1999). Consistent with these findings that many repressors were biased against
noticing signs of anxiety were findings from an experiment in which anxiety was evoked
and repressors were informed of their physiological reactivity and asked to explain it
(Weinberger & Davidson, 1994). Repressors attributed physiological reactivity in
response to an anxiety provocation to external and non-emotional causes such as caffeine
intake.
Taken together, findings about repressors� self-reported personality-related
characteristics suggest that the information processing biases described by Eysenck
(1997) influence how repressors� present the self on self-report measures. Repressors
appear to selectively attend toward, encode, and retrieve information that allows for the
maintenance of an extremely positive self-concept (e.g., Myers & Brewin, 1994; 1995).
Notably, A emerged as a hallmark of the repressor construct that discriminated repressors
from non-repressors as well as scores on N or neuroticism-related variables did (Pincus &
Boekman, 1993). Reports of high levels of A can be viewed as either acknowledgment
that one strives to maintain relatedness with others or, conversely, as the denial of
interpersonal manipulation behaviors aimed at achieving one�s goals. Not surprisingly,
the denial of negative emotion or, conversely, the report of high levels of stability
remained central to the repressor construct. Personality research suggests that
conscientiousness, or the tendency to show self-restraint (Weinberger & Schwartz, 1990),
30 also captures an important component of the repressor construct. Although repressors
reported more extraversion-related characteristics than did non-repressors, this
personality characteristic did not strongly distinguish them (Pincus & Boekman, 1993).
Finally, openness did not distinguish repressors from non-repressors (Pincus &
Boekman). This is not surprising in light of findings that the openness personality domain
is not associated with emotionality (Watson, 2000).
Limitations of Strategies Used to Examine the Nature of the Repressor Construct
To date, analytic strategies used to infer the nature of the repressor construct have
been inadequate. To determine the nature of a construct is to determine not only the
characteristics of a construct, but also its latent structure. To do so is to determine
whether it is taxonic (i.e., a discrete type), dimensional, or a combination of both.
Without such information researchers cannot confidently make inferences about a
construct. One strategy researchers have used to study repressors has been to conduct
two-way ANOVAs with trait anxiety and defensiveness or with distress and restraint as
the two factors, depending on which classification system is used to identify repressors
(see Tables 1-2). The two-way ANOVA approach misses important interactions that may
be attributable to a subset of groups that score similarly on one of the two factors
(Tabachnick & Fidell, 2001). For example, repressors, self-assured, and undersocialized
WAI groups all score below the median on the distress factor (see Table 2). Consider an
investigator who uses the WAI six-group model of the repressor construct and finds no
interaction between distress and restraint and assumes that no support for the discreteness
of the repressor construct has been obtained. This assumption is not justified because the
two-way ANOVA approach is insensitive to detecting several group differences because

31 it assigns variance to main effects of independent factors even when variance is due to a
particular group cell. In other words, ANOVAs carry an assumption of linearity for each
factor and often interaction effects are not sensitive to nonlinear patterns among groups
which score similarly on a particular factor. An alternative analytic strategy that allows
for detection of group differences is to assign participants to discrete groups and to
conduct a one-way ANOVA with only one independent factor of group. Weinberger and
Schwartz have directly compared the one- and two- way ANOVA approaches using
either distress and restraint as the factors in a two-way ANOVA, or WAI group as the
factor in a one-way ANOVA. They found the former approach was insensitive to
particular nonlinear group differences detectable when a one-way ANOVA with group as
the independent variable with six levels (i.e., WAI groups) was used. The two-way
ANOVA analytic strategy did not detect differences between repressors and either the
self-assured or the oversocialized groups because it attributed cell variance to a main
effect of restraint on which all three groups scored high. Although use of the one-way
ANOVA is superior to the two-way ANOVA to make inferences about the repressor
construct if it is in fact taxonic, the fact remains that any ANOVA assumes a categorical
latent structure without providing empirical support for this assumption. Only one
analytic strategy can evaluate hypotheses about the latent structure of a construct:
taxometric analysis (Waller & Meehl, 1998). Although other analytic strategies have
been developed to search for the existence of types, these approaches cannot provide
empirical evidence regarding a construct�s latent structure (Meehl, 1995). Only
taxometric analysis allows for an empirical determination of the true nature of the

32 repressor construct and will therefore assist researchers in developing an accurate
understanding of the nature of both it and anxiety.
Taxometric Analysis and its Contributions to Theory About Psychological Constructs
Paul Meehl (1962, 1990) and his colleagues (Meehl & Grove, 1993; Meehl &
Yonce, 1994; 1996; Waller & Meehl, 1998) developed taxometric analyses to examine
the hypothesis that a discrete type of person called the schizotype existed (Meehl, 1990).
To determine the latent structure of the schizotype personality construct, Meehl and
others applied the mathematical procedures of taxometric analysis to self-report indices
referred to as indicator variables of the unique styles of thinking, feeling, and behaving
that best-captured the core of the schizotype construct and then empirically determined its
latent structure (Golden & Meehl, 1979; Lenzenweger; Lenzenweger & Korfine; Tyrka,
Haslam, & Cannon, 1995). Taxometric analysis procedures can also be applied to
variables that capture the repressor construct to determine it�s latent structure. Such
knowledge will contribute to selection of the most appropriate research design, analytic,
and data interpretation strategies (Ruscio & Ruscio, in press) for investigating the
repressor construct.
Results from taxometric analyses have presented great challenges for theorists
who have presumed that many psychological constructs are taxonic. The presumption of
taxonicity is most obvious in the pages of the American Psychiatric Association�s (APA)
fourth edition of the Diagnostic and Statistical Manual of Mental Disorders (DSM-IV:
1994) in which hundreds of discrete diagnostic entities have been delineated despite a
lack of empirical evidence for the discreteness of the majority of these entities. Consider
the finding that the general construct of depression is dimensional (Ruscio & Ruscio,

33 2000). Moreover, hypomanic temperament / disposition has emerged as dimensional
(Meyer & Keller, in press) calling into question the taxonicity of at least one type of
bipolar disorder that is diagnosed using the DSM-IV (APA, 1994) via the presence of a
hypomanic period that was presumed to be discrete and to cycle with discrete non-hypo-
manic periods. Consider also the preliminary findings that many DSM-IV anxiety
disorders are not discrete entities, but rather are dimensional in nature. Specifically,
PTSD and GAD have emerged as dimensional in both clinical and nonclinical samples
(Ruscio, Borkovec, & Ruscio, 2001; Ruscio, Ruscio, & Keane, 2001). Moreover,
although anxiety sensitivity is not an anxiety disorder, it is the hallmark of panic disorder
and is dimensional (Taylor, Rabian & Fedoroff, 1999). Taxometric analyses of eating
disorder diagnoses in the DSM-IV have revealed the need to modify diagnostic criteria as
well (Gleaves et al., 2000; Gleaves et al., 2002; Williamson et al., 2002). Additionally, a
personality disorder presumed to be discrete, borderline personality disorder, has
emerged as dimensional. Interestingly, only a few of the presumably discrete diagnostic
categories described in the DSM have emerged as taxonic. These have included
schizotpye (Lezenweger, 1999) and antisocial personality disorder (Harris, Rice, &
Quinsey, 1994; Skilling, Quinsey, & Craig, 2001), dementia (Golden, 1982), dissociation
(Waller, Putnam & Carlson, 1996; Waller & Meehl, 1997; Waller & Ross, 1997), and a
subtype of depression (Ambrosini, Bennett, Cleland, & Haslam, in press; Haslam, Kim,
Cleland, Steer, & Beck, in press).
Other psychological constructs that have emerged as dimensional that were
presumed to be taxonic include attachment style (Fraley & Waller, 1998) and Jungian
personality types (Arnau, Green, Rosen, Gleaves, & Melancon, in press). In addition,

34 sexual orientation (Gangestad et al., 2000) is taxonic, but gender identity (Gangestad et
al, 2000) is dimensional. Taxometric analysis has also been applied to the emotions of
envy and jealousy and both have emerged as taxonic (Haslam & Bornstein, 1996), thus
providing some support for discrete emotions theory (Keltner & Ekman, 2000).
Finally, taxometric analysis has also been used to improve efficiency of
measurement for dissociation (Waller et al., 1996; Waller & Meehl, 1997; Waller &
Ross, 1997). Specifically, efficient indicators were drawn from a popular self-report
measure of dissociation thereby shortening the assessment time needed to identify
individuals with pathological dissociation. As well, the construct of pathological
dissociation was further refined through the finding of taxonicity only with items
designed to assess pathological dissociation and not with the dimensional and non-
pathological dissociation factors of absorption and imaginative involvement.
In sum, findings from taxometric analyses are forcing theorists to rethink
conceptions of mental disorders and other psychological constructs and leading
investigators to refine theory (Haslam & Kim, in press). Of course all of these findings
are in need of replication with different samples and indicators. Moreover, many of these
findings are difficult to interpret without the provision of specific data that is rarely
presented in publications (Ruscio, Ruscio, & Meron, in press). Nevertheless, the findings
of taxometric analyses are challenging researchers to rethink the nature of several
constructs.

35
Overall Summary
A review of research related to the validity of the repressor construct suggests that
repressors are a unique type of anxious individual who should be separated from truly
low anxious groups if an accurate understanding of the nature of anxiety is to be
achieved. This is because repressors possess distinct information processing biases for
both internal and external information sources. These biases result in reports about their
functioning that are inconsistent with evidence from non-self-report indices (Weinberger,
1990). Even though repressors report inaccurately about their functioning, they
nevertheless present themselves in a distinct way on personality-related variables that
actually lead them to differ even from those who are truly not distressed on some key
self-report variables (e.g., Pincus & Boekman, 1993,1995). Repressors� distinct response
patterns suggest that they view the self in an idealized fashion marked by extreme levels
of positive emotions, few negative emotions, an invulnerability to distressing emotions
and the impulse control problems that can be associated with them, a high level of self-
restraint, and a tendency to engage in behaviors that will lead to others viewing them
positively and therefore to maintenance of relationships with others. Notably, on a
measure of the Big Five that measures characteristic styles of thinking, feeling, and
behaving, repressors were most distinguishable from non-repressors on the agreeableness
personality domain (Pincus & Boekman, 1993). Such high levels of agreeableness reflect
high levels of pro-social behaviors that will lead to acceptance by others.
Despite their reports of low distress, repressors actually appear to be similar to
HA persons in some ways. For example, they experience social threat as reflected on
indices of negative emotion that do not require awareness (Baumeister & Cairns, 1992).

36 In fact, repressors expect self-threat and process evidence of it even more rapidly than do
the traditionally HA (Calvo & Eysenck, 2000). Some evidence suggests that repressors
lacked emotionally available caregivers during their childhoods (Myers & Brewin, 1994;
1995). Therefore, it is possible that repressors have a developmental history similar to
that of the traditionally high anxious who acknowledge challenges in managing
distressing emotions. Consistent with this possibility are findings that features of the
same avoidant attachment style that has been found in anxious individuals (Bowlby,
1988) have been found in repressors (Vetere & Myers, 2002). Repressors� information
processing biases probably provide a mechanism through which they manage the
experience of distressing emotions. To the degree that the avoidance of negative
emotions seen in anxious populations is similar to that seen in repressors, the repressor
group again emerges as an important group for anxiety researchers to understand.
Despite findings of the validity of the repressor construct, the majority of anxiety
researchers choose not to remove repressors from low anxious comparison groups and
therefore develop inaccurate results. Thus, it is extremely important that anxiety
researchers better understand the nature of the repressor construct. An essential first step
to understanding the nature of the construct is an analysis of its latent or true structure
(Waller & Meehl, 1998). In particular, it is unknown if the construct is dimensional or if
it represents a discrete type of person (i.e., a taxon) that should be removed from LA
comparison groups. If the former is true, then analytic strategies that assume a
dimensional construct are appropriate for researchers interested in studying both the
repressor construct and anxiety in general. If the latter is true, then analytic strategies that
assume the presence of a discrete repressor and subsequent removal of this type from LA
37 group is warranted. Although the majority of researchers� designs reflect an assumption
that the repressor construct is a type or taxon, no empirical evidence about the latent
structure of the construct is available to date to support this assumption. In fact,
application of taxometric analysis to several presumably taxonic constructs has revealed
that assumptions about psychological constructs have often been incorrect (Haslam &
Kim, in press). Thus, it is important to apply taxometric analysis procedures to indices of
the repressor construct to determine its true nature (Ruscio & Ruscio, in press).
Goals
Taxometric analysis procedures will be used to evaluate the latent structure of the
repressor construct using traditional measures of it. In particular, taxometric analysis will
be applied to indices of trait anxiety and defensiveness to examine the latent structure as
put forth by Weinberger et al�s original (1979) model. Use of this model will allow for
application of results about latent structure to the largest possible number of studies
conducted to date that focused on the repressor construct. This is because the majority of
researchers use the original repressor classification system. Additionally, theory about the
repressor construct will be broadened by examining the construct in terms of the FFM of
personality and then using those personality variables that best-discriminate repressors
from nonrepressors to conduct a second set of confirmatory taxometric analyses.
Regardless of latent structure findings, results from the current study will inform
investigators about the most appropriate and powerful research designs, data analysis and
interpretation strategies (Ruscio & Ruscio, in press) to use to study the repressor
construct. Finally, the results of this study will provide a bridge between the repressor
literature and a large literature about the FFM of personality that can also serve to
38 broaden investigator�s understanding of both the repressor construct and anxiety in
general.
Hypotheses
Latent structure using Weinberger et al. indices of the repressor construct. It is
hypothesized that the latent structure of the repressor construct will be taxonic when
composite indicators are derived from the traditional model that relies on the combination
of trait anxiety and defensiveness. This hypothesis is based on findings that repressors
identified using the combination of low scores on trait anxiety and high scores on
defensiveness exhibit discrete patterns of thinking (see Eysenck, 1997; Hansen et al.,
1992, for reviews), feeling (see Derakshan & Eysenck, 1997ab; Kreitler & Kreitler, 1990
and Mendolia, 1999, for reviews), and behaving (see Furnham & Traynar, 1999, for a
review) and thus personality compared to non-repressor groups. As well, multiple
investigations have revealed discrete patterns of physiological responding between
repressors and non-repressors (see Derakshan & Eysenck, 1997a; Furnham & Traynar,
1999; Weinberger, 1990, for reviews). Moreover, many investigations have included the
DHA group to rule out the possibility that the dimension of defensiveness alone can
account for the patterns of discrete styles of responding that consistently differentiate
repressor from non-repressor groups (e.g., Kreitler & Kreitler, 1990; Pincus & Boekman,
1993;1995).
Latent structure using five factor model indices of the repressor construct. It is
hypothesized that the repressor construct will also emerge as taxonic when composite
indicator variables from the FFM are used. This hypothesis is derived from findings that
extreme levels of all but the openness Big Five personality domain capture the core

39 features of the repressor construct. These core features include the tendency to experience
both positive and negative emotions (Watson, 2000; Weinberger, 1990), self-restraint and
a focus on maintaining acceptance by others and map onto extraversion, neuroticism,
conscientiousness, and agreeableness, respectively (Costa & McCrae; Watson;
Weinberger & Schwartz, 1990). These results are also expected because repressors
exhibit biases in information processing (Eysenck, 1997) that will presumably result in
reports marked by a denial of negative and a claiming of positive characteristics.
Moreover, these reports also are discrete and distinguish repressors from nonrepressors
(Pincus & Boekman, 1993; Kreitler & Krietler, 1990; Weinberger & Schwartz).
Therefore, repressor�s information processing biases are expected to result in taxonic
structural findings.
Five factor model (FFM) personality domains and the repressor construct. On
FFM personality domains repressors information processing biases (Eysenck, 1997) are
expected to result in significantly lower levels of neuroticism than non-repressors
because repressors tend not to report the negative emotions and vulnerability that are at
the core of the neuroticism personality domain (Costa & McCrae, 1992). These same
biases lead repressors to report an overly positive self-concept and are expected to
therefore result in significantly higher levels of extraversion than are found in non-
repressors. This is expected because the high levels of positive emotionality reported by
repressors are at the core of the extraversion domain (Watson, 2000). Agreeableness
distinguished repressors from non-repressors even better than N (Pincus & Boekman,
1993). Moreover, it captures the focus on behaving in ways that promote acceptance by
and connection with others and is this central to the repressor construct (Costa &

40 McCrae; Weinberger & Schwartz, 1990). For these reasons, repressors are expected to
report significantly more agreeableness than non-repressors. The self-restraint of
impulses central to the repressor construct is central to the conscientiousness domain
(Costa & McCrae). Therefore, repressors are expected to report significantly more
conscientiousness than non-repressors. Repressors and non-repressors are not expected to
differ on openness because trait emotionality is not related to openness (Watson),
extremes in openness are not socially desirable (Costa & McCrae), and openness did not
distinguish repressors from non-repressors (Pincus & Boekman).
41
Method
Participants
One thousand and forty undergraduate introductory psychology students from a
large Northeastern university participated. Sixty-seven percent of the population, mean
age 18, was composed of women. Data regarding ethnic origin was not collected.
Procedure
A series of questionnaires completed in group-testing sessions that lasted two
hours were used. Participants received extra credit for participation.
Self-Report Measures
Marlowe-Crowne Social-Desirability Scale (MCSDS: Crowne & Marlowe, 1964).
The MCSDS is a 33 item self-report scale that was originally designed to measure
socially desirable responding independently of psychopathology. Research has indicated
that the MCSDS actually measures defensive responding, or the tendency to avoid
processing of information threatening to self-esteem (Furnham, Petrides, & Spencer-
Bowdage, 2002; Graziano & Tobin, 2002; McCrae & Costa, 1983; Pauls & Stemmler, in
press). The MCSDS includes both positively- and negatively-keyed items, the latter of
which are reverse scored. In its original format it contained true and false response
options, but its format in the current study required the respondent to indicate the degree
to which each item was applicable to them on a five point scale that ranged from 1
(definitely false) to 5 (definitely true). Thus, scores could range from 5 to 165. Higher
scores indicate greater levels of defensive responding. Factor analysis has revealed two
factors of the MCSDS: the self-deception factor that is also considered defensiveness
and the other-deception factor that is seen as motivated by conscious efforts to obtain

42 approval from others and the contingent self-esteem that can follow such approval
(Paulhus, 1984). These factors have also been called self deceptive enhancement (SDE)
and impression management (IM), respectively (Paulhus & Reid, 1989). Evidence for the
reliability of the MCSDS has been found with college students as indicated by an internal
consistency alpha coefficient of .88. Additionally, the MCSDS has test-retest reliability
of .88 over a one-month time interval with college students. Evidence for discriminant
validity of the scale from that of trait anxiety scales is reflected in an inverse relationship
between it and popular measures of trait anxiety: Values from -.22 to -.32 have been
reported (Derakshan & Eysenck, 1997d; Egloff & Hock, 1997; Ritz & Dahme, 1996).
State-Trait Anxiety Inventory (STAI: Spielberger, Gorsuch, Lushene, Vagg, &
Jacobs, 1983). The trait version of the STAI (STAI-T, Form Y-2) is a 20 item self-report
scale designed to measure primarily the cognitive components of trait anxiety with a
combination of positively- and negatively-keyed items, the latter of which are reverse
scored. Individuals indicate the frequency with which they generally feel each item on a
scale that ranges from 1 (almost never) to 4 (almost always). The STAI-T scale
descriptors used in the present study were slightly modified to range from 1 (not at all) to
5 (all the time). Scores could range from 20 to 100, with higher numbers indicating
higher levels of trait anxiety. The STAI-T is a reliable and valid measure. Test-retest
reliability of the STAI-T ranged from .73 over a period of 104 days to .86 over a period
of 20 days in college students. Internal consistency has also been found as evidenced by a
median alpha coefficient of .90 in several samples including college students. Evidence
also supports the validity of the STAI-T with college students as indicated by a positive
correlation of .80 with the Manifest Anxiety Scale (Taylor, 1953). The STAI-T correlates

43 between -.22 and -.32 with the MCDSD (Derakshan & Eysenck, 1997; Egloff & Hock,
1997; Ritz & Dahme, 1996) and remains relatively stable despite exposure to situations
that arouse stress in individuals.
NEO Five-Factor Inventory Form S (NEO-FFI: Costa & McCrae, 1992). The
NEO-FFI is a self-report inventory designed to measure the FFM of personality. It is
considered a measure of self-concept and was designed for assessment of the big five
personality domains. It includes a scale for Neuroticism (N); Extraversion (E); Openness
to experience (O); Agreeableness (A) and Conscientiousness (C). It contains 60 items,
many of which are negatively keyed and later reverse-scored, that are rated on a scale that
ranges from (0) strongly disagree to (4) strongly agree. Each scale is composed of 12
items and thus ranges from 0 to 48 with high values representing greater levels of the
domain assessed. The NEO-FFI is a shortened version of the Revised NEO Personality
Inventory (NEO-PI-R: Costa & McCrae, 1992) and was designed to allow for more rapid
completion by large numbers of participants.
The NEO-FFI is a valid and reliable measure of the FFM that has been validated
in both normal and clinical populations (Costa & McCrae, 1992). Each of the five
domains measured via the NEO-FFI is highly correlated with the domains as measured
by the longer NEO-PI-R for which extensive validity and reliability data also have been
reported (Costa & McCrae, 1992). Correlations between the NEO-FFI domains and the
NEO-PI-R domains were .92, .90, .91, .77, and .87 for N, E, O, A, and C respectively.
Additionally, evidence of significant correlations between self and other ratings on the
NEO-FFI have been found and range from .44 (conscientiousness) to .65 (openness) for
spouse ratings and .33 (conscientiousness) to .48 (openness) for single peer ratings.

44 Internal consistency of each domain measured by the NEO-FFI has also been
demonstrated to be acceptable via calculation of coefficient alpha. Specifically, for N, E,
O, A, and C the coefficient alpha was .86, .77, .73, .68, and .81 respectively. Retest
reliability of the NEO-FFI has been demonstrated over a three-month period in a group of
college students. Coefficients were .79, .79, .80, .75, and .83 for N, E, O, A, and C
respectively.

45
Data Analyses and Results
Missing data
Missing data were rare and occurred for 0.34% of NEO-FFI items, 1.1% of
MCSDS, and 5.7% of STAI items. Eight percent of the sample did not report information
about their sex. Missing data is not tolerated by taxometric analysis software, so each
missing data point was replaced with the item series mean as described in George &
Mallery (2001) preceding taxometric analyses.
Software used for analyses
All results described below, with the exception of taxometric analysis results,
were obtained using the Statistical Package for the Social Sciences (SPSS: Version 10)
and were computed based upon the data set that resulted from replacement of missing
data with the exception of analysis of variance results. Taxometric analyses were
conducted using software written by Ruscio (2002).
Descriptive statistics and psychometric properties
Internal consistency, corrected item-total correlations, skew, and kurtosis
estimates for each of the MCSDS, STAI, and for the personality scales of the NEO-FFI
were determined. Internal consistency values of .70 are considered acceptable, above .80
good, and above .90 excellent (George & Mallery). As revealed in Table 3, the STAI has
an excellent level of internal consistency; the MCSDS, N, and C scales have good
internal consistency; and the E, O, and A scales have acceptable internal consistency.
These reliability estimates are comparable to normative estimates of the NEO-PI-R
(Costa & McCrae, 1992) for all but the openness scale. Due to scale modifications of the
MCSDS and the STAI, the psychometric properties of these scales were not compared to
46 normative estimates. Table 3 also indicates that estimates of the skew and kurtosis for
each scale�s distribution was acceptable and that data are distributed symmetrically
around the mean without extreme values that could have strong influences on mean
values. Thus, means can be interpreted as being representative of the sample as a whole.
Finally, another index of reliability, corrected item-total correlations are listed for each
scale in Tables 4-10.
Grouping. Prior to taxometric analysis, repressors were grouped according to
Weinberger et al.�s classification system (Table 1). Repressors scored above the upper
quartile of 110 on defensiveness and below the median of 51 on trait anxiety. The non-
repressor group, referred to as the complement (Waller & Meehl, 1997), was composed of
all remaining participants. Mean scores for each group on the STAI and MCSDS are
reported in Tables 11 � 12, respectively. Consistent with previous investigations (Myers,
2000), one fifth of the entire sample was classified as belonging to the repressor group
(Table 13). Chi square analysis was conducted for participants that reported information
about their sex (1, N = 845) = 4.39, p = .04) and indicated that females were more likely
than males to be classified as repressors.
Analyses of Variance (ANOVA)
Defensiveness and trait anxiety ANOVAs. Two separate two-way ANOVAS with
group (repressor, non-repressor) and sex (male, female) as the independent variables and
each of total STAI and MCSDS scores as the trait anxiety and defensiveness dependent
variable respectively, were conducted. For trait anxiety, the expected main effect of
group was found, F (1, 841) = 220.87, p < .001 with repressors scoring lower than non-
repressors. A main effect of gender was also found, F (1, 841) = 9.73, p < .002, with
47 women showing higher trait anxiety than men (Table 11), however gender did not
interact with group, F (1, 841) = .670, p = .41). For defensiveness, the expected main
effect of group, F (1, 841) = 564.82, p < .001 with repressors scoring higher than non-
repressors (Table 12) was found with no main effect of gender, F (1, 841) = .001, p =.97
and no group by gender interaction, F (1, 841) = 3.03, p = .08.
Big five personality MANOVA. A multivariate analysis of variance (MANOVA)
with group (repressor, non-repressor) and gender (male, female) as the independent
variables and personality domain subscale total scores (N, E, O, A, C) as the dependent
variables was conducted.
This revealed an overall main effect of both group, F (6, 791) = 43.43, p < .001
and gender, F (6, 791) = 8.02, p < .02, but no interaction of gender with group, F (6,791)
= .16, p = .99. As was predicted, repressors scored significantly lower than non-
repressors on N, F (1, 796) = 146.31, p < .001) and significantly higher than non-
repressors on E, F (1, 796) = 48.45, p < .001; A, F (1, 796) = 111.30, p < .001 and C, F
(1, 796) = 85.68, p < .001. Also as predicted, repressors did not differ from non-
repressors on O, F (1, 796) = .62, p = .43. Women scored significantly higher than men
on N, E, A and C: Fs (1, 796) = 17.61, 5.07, 10.31, and 5.48, respectively with all ps <
.02. Women did not differ from men on O, F (1, 796 = .01, p = .92. Group scores for
each of the N, E, O, A, and C personality domains for each sex are summarized in Tables
14 � 18, respectively. A visual depiction of these results appears in Figure 1.
Taxometric Analyses
The STAI trait anxiety and the NEO-FFI N scales were re-scored so that high
values reflected high levels of trait stability on each. Trait stability measured by the STAI

48 will be referred to as St and that measured by the NEO-FFI as S. This was necessary so
that the panels from taxometric analyses would be interpretable. Specifically, graphic
output that reflected taxonic structure would be reflected in a peak to the right on the
abscissa where scores reflected high levels of both defensiveness and trait stability.
Selection of indicator variables. A first step in conducting taxometric analysis
involves selection of indicator variables that measure core features of the construct of
interest. Indicator selection is guided by a combination of theoretical and empirical
considerations, the second of which maximizes interpretability of graphic output (Meehl,
1992; Ruscio & Ruscio, 2001). Both approaches were used in the current study to screen
for and select indicators. Theoretical considerations guided preliminary selection of
scales administered. These scales included measures of trait emotionality and
defensiveness (Weinberger & Schwartz, 1990). The first empirical approach to screening
indicators for adequacy for taxometric analysis involved review of ANOVA results.
Those dependent variables that best-discriminated repressors from non-repressors
classified according to Weinberger at al. (1979) were selected. This resulted in the
decision to eliminate openness from further consideration as an indicator. Second, items
with the highest corrected item-total correlations (CITC) on the MCDS, STAI, and the
NEO-FFI S, E, A, and C scales were determined and those with the highest values were
combined to form the following defensiveness, trait stability, NEO-FFI stability,
extraversion, agreeableness, and conscientiousness composite indicators with the highest
CITC values (Defc, Stc, Sc, Ec, Ac, Cc). This approach has been used by previous
researchers (e.g., Ruscio & Ruscio, 2002) who have proposed that those items with the
highest item-total correlations, when combined, should be a good measure of the

49 construct intended to be measured by a given scale. Item-total correlations for items on
all scales are presented in Tables 4 � 10. For each of the Defc and Stc composites, the ten
items with the highest corrected item-total correlation values were combined. For each of
the NEO-FFI Sc, Ec, Ac, and Cc composites, the six items with the highest corrected
item-total correlation values were combined.
Standardized validity, or the separation between the hypothesized taxon and
complement groups, was computed for composite indicators formed using CITC
information (Table 19) using the formula recommended by Meehl and Yonce (1996, p.
1146). Monte Carlo studies have led to the recommendation that around 1.25 standard
deviations separate taxon from complement members in a sample of 300 with a taxon
base rate of at least 10 percent (Ruscio & Ruscio). To determine if composite items
formed through using CITC values were superior in validity to composites formed
through combining all original items on each scale, standardized validity estimates were
also computed for composites of the MCSDS, STAI, S, E, A, and C scales formed
through combining all items of each original scale. These were named Def, St, S, E, A,
and C, respectively, and appear in Table 19. Validity estimates of original scales were
superior, or similar to, estimates of composites formed using the traditional approach of
selecting only items with the highest CITC values. Moreover, only two (S, A) of the four
NEO-FFI personality composites formed using all original scale items yielded a
separation between repressors and non-repressors that was close to 1.25 standard
deviations. In light of this finding, an additional approach to forming potential composite
indicators was used.
50
Standardized validity estimates were calculated for every item on each scale and
those with the highest values were combined into composite indicators. Standardized
validity estimates for every scale item are presented in Tables 4-10. For each of the
MCSDS and STAI scales, the ten items with the highest standardized validity values
were combined to form defensiveness (Defv) and trait stability (Stv) composite
indicators, respectively. For each of the S, E, A, and C subscales of the NEO-FFI, the six
items with the highest standardized validity values were combined to form the following
composite indicators of each personality domain (Sv, Ev, Av, Cv). Standardized validity
estimates of composites formed using items with the highest validity estimates are
presented in Table 19. This approach to formation of composite indicators yielded the
most robust composites for taxometric analysis for all but the MCSDS, for which the
composite formed by combining all original scale items was superior. Nevertheless, only
the following composites resulted in close to 1.25 standard deviation units of separation
between hypothesized taxon from non-taxon members: the Defv composite formed with
all original MCSDS scale items, the Stv composite formed using the most valid items of
the STAI, and the NEO-FFI Sv and Av composites formed using the most valid items of
the NEO-FFI stability and agreeableness personality subscales.
Based upon theory and factor analysis findings that that the MCSDS is really a
mix of items that reflect the relatively independent constructs of self-deceptive
enhancement (SDE) and impression management (IM) (Paulhus & Reid, 1984), the
decision was made to form, and estimate validity for, two final composite indicators that
reflected these constructs. Items from the MCSDS were combined to form a SDE and IM

51 composite using guidelines from Paulhus and Reid (1989). These new composites also
yielded acceptable validity estimates (Table 19).
Once potential indicators are selected it is necessary to insure that they are
sufficiently independent within the proposed taxon and complement groups before
submitting them to taxometric analysis. The degree of relatedness between indicators is
measured by what is referred to as nuisance covariance. Monte Carlo studies have shown
that taxometric analysis procedures are robust enough to detect latent structure accurately
for variables related less than around r = .31 within each of the hypothesized taxon and
complement group. Low levels of relatedness between indicators of a construct are
expected within members of the taxon group because a true taxonic construct should have
only one true score on a theoretically relevant indicator variable. It is this lack of
variability in scores of taxon members that translates into graphic output that reflects
taxonicity when one of the indicator variables is ordered on the abscissa and a set of
mathematical procedures is performed on what is called the output indicator, the results
of which are plotted on the ordinate. If a perfect measure (i.e., a collection of independent
indicator variables) of a taxonic personality construct could be developed then there
would be a discontinuity (i.e., a break) in the score distribution of participant responses
on that measure and graphic output would be easily interpretable (through the appearance
of a peak) as reflecting taxonicity. A greater degree of relationship is expected, and
acceptable, within the combined group of hypothesized taxon and complement members
because more variability in scores should exist in such a mixed group.
Nuisance covariance values were calculated for selected composite indicators to
confirm they were robust enough to detect taxonicity if it was present. Within group
52 estimates of nuisance covariance were close to those suggested by results of Monte Carlo
studies for most composites (see Table 20). Moreover, for most composite indicators the
relationship within the entire sample (Table 21) exceeded that within the proposed taxon
and complement group, as is expected in the case of hypothesized taxonicity. Levels of
nuisance covariance did exceed .30 within either the taxon or complement group for
some combinations of variables and these combinations of indicators were thus not used
together in any taxometric analysis procedures. The strong relationships between
composites measuring similar constructs on different measures (e.g., stability on both the
STAI and NEO-FFI) was expected and these composites were also not used as separate
indicators within any taxometric analysis procedure. Importantly, within the proposed
taxon and complement groups the relationship between the SDE and IM factors of the
MCSDS was within acceptable limits for use as separate indicators within taxometric
analysis procedures (Table 20).
Simulation of comparator data sets to facilitate interpretation of taxometric
analysis output. Psychometric properties of data such as skew and kurtosis at times mask
important construct variability and can give the appearance of taxonicity when it is not
present (Ruscio, Ruscio, & Meron, in press). Despite this, most taxometric analysis
investigators do not report basic descriptive statistics and it is therefore often impossible
to know if findings of taxonicity are due to non-construct-related variability in the
psychometric properties of indicators. Recently a solution has been devised for the
difficulties in output interpretation that are often faced by researchers. This solution
involves simulating data structures of known latent structure with parameters that are
matched to those of the collected data set that is referred to as the research data.
53 Taxometric analysis procedures are conducted with the simulated data of known structure
to determine if interpretable results will emerge and to provide comparator graphic
output. To date, the majority of published taxometric analysis studies have not included
simulated data to facilitate interpretation of output from research data (see Gangstead &
Snyder, 1985 and Ruscio, Ruscio, & Keane, 2002 for exceptions) and have not provided
data with which the robustness of indicators to detect latent structure could be evaluated.
The current study, however, used data simulation procedures to examine robustness of
indices and to provide a comparator for interpretations about latent structure of research
data. The graphic output of taxometric analyses conducted with the simulated data was
used as a comparator that facilitated interpretation of output from the research data. Four
raters who were blind to experimental hypotheses provided judgments about the degree to
which research data matched simulated data and these judgments were used as judgments
about the latent structure reflected in each research data output panel.
Consistency tests. When findings converge across multiple taxometric analysis
procedures, consistency tests are passed. It is essential that taxometric analysts obtain
consistent results using multiple approaches to data analysis if they are to have
confidence in findings because null hypothesis testing is not used. Sources of consistency
include converging findings across procedures with different mathematical foundations,
and across different approaches to measurement of indices (Campbell and Fiske, 1959;
Meehl, 1992; Popper, 1959). In the current study, consistency tests included the use of
two taxometric analysis procedures with different mathematical foundations and
collection of data using both traditional indices of the repressor construct (i.e., the
MCSDS and the STAI) and alternative indices of it (i.e., SDE, IM, NEO-FFI S and A

54 scales). If the results obtained using different mathematical procedures and separate
indices converge on the same finding about a construct�s structure, this is said to be a
strong test of the consistency of the findings (Meehl).
Another source of consistency test involves the estimation of base rates of the
hypothesized taxon using graphic output. Taxonicity is inferred if base rates across
analysis procedures converge with one exception: When data are dimensional, base rates
cohere around 50% due to the procedure used to estimate base rates. If base rates vary
widely across different taxometric analysis procedures, this is also suggestive of
dimensional rather than taxonic latent structure.
Mathematical Procedures
Taxometric mathematical procedures are based on the principals of Coherent Cut
Kinetics (Waller & Meehl, 1998). The term coherent refers to the consistent findings
across multiple domains of inquiry that are necessary to infer a construct�s latent
structure. The term cut refers to a commonality across all procedures of taxometric
analysis that involves ordering scores on an indicator variable that is plotted on the
abscissa and then systematically making cuts along the abscissa and examining scores on
at least one other indicator that is plotted on the ordinate as a function of the ordered
abscissa scores. The term kinetics refers to the systematic movement of a cut on the
ordered abscissa. Within each window delineated by a cut, mathematical operations are
performed on the output indicator(s) and plotted on the ordinate. The analytic procedures
with diverse mathematical foundations described next go by the acronyms of MAMBAC
and MAXCOV (Waller & Meehl, 1998).

55
MAMBAC analyses. The letters of the MAMBAC acronym are taken from the first
letters of each word in the phrase Mean Above Minus Below A Cut. The MAMBAC
procedure requires two indicators (Meehl & Yonce, 1994). The first indicator called the
input is standardized, sorted, and placed along the abscissa. The second indicator, the
output, is also standardized and is then used to generate points along the ordinate that are
plotted beginning above the twenty-fifth case on the abscissa. The value plotted is the
score that results when the mean score below the cut is subtracted from the mean score
above the cut. This procedure continues along consecutive cuts on the abscissa until the
point 25 cases from the last case at which point the final difference between the means is
calculated and plotted above the final cut point. The choice regarding how many cases to
begin and end from the first and the last case, respectively, is an arbitrary one as is the
number of cuts to use. If data is taxonic then a characteristic peak occurs in the graphic
output. This peak corresponds to the score on the input variable that is associated with a
maximal difference score on the output variable between taxon and complement
members. Said another way, the highest point of the peak reflects the point where the
mean above the input indicator cut is the mean score of primarily taxon members and the
mean below the cut is the mean score of primarily complement members. The decision
as to which is the input and which the output indicator is also arbitrary. In fact, as a test
of consistency each indicator is used as both an input and an output to generate two
graphs that are interpreted as either providing some evidence for taxonicity or for
dimensionality. Evidence for dimensionality is inferred if the graph appears either flat or
dish-like with both ends sloping up. Graphic output is used to compute the base rate of
the taxon. Assuming that taxon members score higher than complement members on the
56 input variable, a peak to the far right suggests a small base rate, whereas a peak in the
middle of the input variable range suggests that the taxon and complement groups are of
an equal size.
For the current study, MAMBAC was conducted with all combinations of final
composite indicators that yielded nuisance covariance estimates below r = .31.
Composite indicators were submitted as both input and output indicator. This resulted in
16 panels of research data that are presented in the following figures (composite
indicators in parentheses served as both input and output): 2 (Def, Stv), 5 (SDE, IM), 8
(SDE, Av), 11 (IM, Stv), 14 (IM, Sv), 17 (IM, Av), 20 (Stv,Av), and 23 (Sv,Av).
Following each research data panel is simulated dimensional (Figures 3, 6, 9, 12, 15, 18,
21, 24) and then taxonic data (Figures 4, 7, 10, 13, 16, 19, 22, 25) for each set of research
data composites, respectively. Raters (n = 4) who were blind to experimental hypotheses
were instructed to select the data simulation panel (i.e., dimensional or taxonic) that most
resembled the research data. Raters were given the following instructions:
Each attached figure page is labeled with a particular figure number at the top left. Each figure
page is followed by two pages, labeled A and B, in the top left. The number of the figure to which it
corresponds precedes each of A and B. For each figure, please decide which graph in the same location on
the corresponding page labeled with a letter (A or B) that it most resembles. Please only compare graphs in
the same location across the figure and letter-labeled pages. For example, for Figure 1 begin with the graph
on the left side of the page and determine which graph on the left side of page 1A or 1B it most-resembles.
Record either A or B on the response sheet next to the appropriate figure number and make the same
judgment for the graph on the right side of the figure page. Thus, the next decision is regarding the graph
on the right side of the page labeled figure 1: Does it most resemble the graph on the right side of page 1A
or 1B? If you are completely uncertain then just respond with DK for don�t know. Thank you.

57
Judgments about latent structure of research data are presented in Table 22. Ten
out of the 16 MAMBAC judgments were unanimous, whereas for three judgments only
three of the four raters agreed, and for three judgments a split between judgment choices
occurred. Thus, agreement was reached for 55 out of a possible 64 panels yielding a
value of .86 for inter-rater agreement. When a criterion of the majority of judgments is
used to determine latent structure then for seven sets of indicators the judgment was
dimensional, for six it was taxonic, and for three no majority consensus was obtained. It
never occurred that the same latent structure judgment was made for a set of indicators in
both the input and output role. Interestingly, whenever SDE was in the role of input it
resulted in a taxonic structure judgment whereas when IM served as input it resulted in
mixed judgments about structure. Base rate estimates for both research and simulated
data are presented in Table 23 and, despite the expected repressor base rate of around
20%, these cohere around .50 as would be expected in the case of dimensional latent
structure. Moreover, research data base rates more closely resemble simulated base rates
for dimensional data. Taken together, judgments about latent structure in combination
with base rate estimates are mixed with regard to latent structure. Even when only the
most valid combinations of indicators are considered along with base rate estimates,
conclusive inferences about latent structure cannot be made because discrepancies exist
between structural judgments associated with panels and those with base rate estimates.
MAXCOV analyses. The MAXCOV acronym is derived from the first letters of
each word in the term MAXimum COVariance. The MAXCOV procedure requires three
relatively independent indicators (Meehl & Yonce, 1996). All indicators are standardized

58 and then the input indicator is sorted and placed along the abscissa on which intervals of
an arbitrary width are demarcated. The other two indicators become the output indicators
and the covariance between these two output variables is computed within each
successive interval and plotted along the ordinate above the input indicator intervals.
Again, the decision as to which is the input and which the output indicator is arbitrary. In
fact, each indicator (e.g., a,b,c) is used as both input and output to generate a total of
three graphs (a as a function of the covariance between b and c within the respective
intervals of a, etc.) that are interpreted as either providing some evidence for taxonicity or
dimensionality. Evidence for taxonicity is inferred if the graph contains a peak. In cases
of low base rate the graph may build to a peak that is found to the right of the abscissa if
higher numbers reflect greater odds of being a taxon member. Evidence for
dimensionality is inferred if the graph appears flat. If the construct is taxonic, then the
location of the peak corresponds to the score on the input indicator where equal numbers
of taxon and complement members can be found within the sample. It is here that
covariance between output indicators is maximal because the greatest level of variation is
found in an equal mixture of groups. Thus, the peak of the curve is located near the
optimal cut score on the indicator variable that can be used to separate taxon from
complement members. Covariation is least at points along the input variable that
correspond to scores of pure taxon and complement members because within each of
these groups individuals vary little from each other. This lack of variability in scores
within each group yields low covariance scores and results in a downward shift in the
curve relative to the maximum of the curve found where groups are mixed. As in

59 MAMBAC, characteristics of the graph output are used to compute the base rate of the
taxon.
Selection of composite indicators for use with the MAXCOV procedure was
constrained by two things: (a) the recommendation that nuisance covariance be less than
around r = .31 between indicators within the proposed taxon or complement group and
(b) the validity of indicators. Review of Tables 19 and 20 resulted in the decision to
conduct only one MAXCOV analysis using the SDE, IM, and Stv composites as both
input and output in all possible combinations. Although nuisance covariance estimates
suggested the potential suitability of C as a composite along with SDE and IM the
validity of C was not acceptable and would have resulted in difficult-to-interpret output.
The MAXCOV with SDE, IM, and Stv was judged by the majority of raters to reflect
dimensional latent structure when Stv and IM were input indicators, but the panel with
SDE as the input indicator resulted in mixed judgments with only two out of the four
raters saying it appeared more like the simulated taxonic data. Decisions regarding latent
structure, and base rates are presented in Tables 24 and 25, respectively. Base rate
estimates were difficult to interpret because they were either exceptionally low or high
for all research panels. Taken together, results of MAXCOV also did not provide support
for confident inferences about the latent structure of the repressor construct.
Some reports suggest that phenomena associated with the repressor construct
differ by sex (e.g., Brown et al.; Ritz & Dahme). Thus, it was decided to repeat all
taxometric analyses described above using the same indicators within each sex
separately. Validity estimates of the same composite indicators used with the combined
sample were thus computed for the male and female sample (Table 26) and remained

60 acceptable. Nuisance covariance estimates of composite indicators for male repressors
and non-repressors are found in Table 27, those for female repressors and non-repressors
are found in Table 28, and those for the combined (repressors + non-repressors) male and
combined female samples are found in Table 29. Nuisance covariance estimates within
taxon and complement samples were less optimal and often had unacceptable levels of
nuisance covariance ( r > .30). Specifically, within the male repressor group r exceeded
.30 for the following indicator sets: Def, Stv; Def, Sv; SDE, Stv; SDE, Sv; Stv, Av; Sv,
Av and within the male non-repressor group for the following sets: SDE, IM; and SDE,
Sv. Unacceptable levels of nuisance covariance were found within the female repressor
group for the SDE and Sv indicator set and within the female non-repressor group for the
following sets: SDE, IM; SDE, Sv; Sv, Def; Av, Stv; and Av,Sv. It was decided to
proceed with taxometric analyses, despite these limitations, so that comparison graphs
generated within each separate sex could be created. Decisions regarding latent structure
for the male sample derived from MAMBAC analyses, and associated base rates, are
found in Tables 30 and 31, respectively. Decisions regarding latent structure for the male
sample derived from MAXCOV analyses, and associated base rates, are found in Tables
32 and 33, respectively. Decisions regarding latent structure for the female sample
derived from MAMBAC analyses, and associated base rates, are found in Tables 34 and
35, respectively. Decisions regarding latent structure for the female sample derived from
MAXCOV analyses, and associated base rates, are found in Tables 36 and 37,
respectively. To conserve space, figures are not presented for taxometric analyses
conducted with separate male and female samples, but are available upon request from
the author. Interestingly, the majority of research data panels were rated as reflecting a

61 taxonic structure within the male sample whereas within the female sample the majority
of panels were rated as reflecting a dimensional structure. Again, however, base rate
estimates for each of males and females derived from MAMBAC analyses were more
consistent with dimensional latent structure than taxonic. Base rate estimates derived
from MAXCOV analyses were, again, exceptionally low for the most part and not
consistent with the expected repressor base rate of around twenty percent. Thus, decisions
about latent structure within separate male and female samples are difficult to make with
confidence when judgments about latent structure are considered along with base rate
estimates and do not entirely parallel judgments made for the entire sample.

62
Discussion
The primary aim of the present study was to empirically evaluate the latent
structure of the repressor construct. In order to do two taxometric analysis procedures,
MAMBAC and MAXCOV, were conducted with data collected from a large
undergraduate sample. Traditional and theoretically relevant but novel indices of the
repressor construct were used. Traditional indices included both the MCSDS and the
STAI scale and novel indices included the stability and agreeableness subscales of the
NEO-FFI as well as SDE and IM factors derived from the MCSDS. Estimates of base
rates derived using MAMBAC procedures were consistently supportive of a dimensional
latent structure. Judgments about latent structure of MAMBAC output made by blind
raters, however, were not as clearly supportive of a dimensional structure. In fact,
judgments were split between taxonic and dimensional, often for the same set of
indicators. For example, when the NEO-FFI agreeableness composite served as input
along with the NEO-FFI stability composite as the output, a unanimous judgment of
taxonic latent structure emerged. On the contrary, when the NEO-FFI stability composite
served as input along with the agreeableness composite as the output a unanimous
judgment of dimensional latent structure emerged. In order to have confidence in findings
about latent structure it is important that judgments about structure derived from base rate
estimates and judgments of graphic output cohere. Moreover, it is also necessary that
judgments of graphic output cohere when a given set of indicators serves in both the
input and output role. Because of unacceptable levels of nuisance covariance between
many potential sets of indicators, MAXCOV was not conducted with traditional indices
of the repressor construct. It was only conducted with the novel SDE and IM indicators in
63 combination with the trait stability composite derived from the STAI. Latent structure
judgments were again mixed. Moreover, base rate estimates derived from both research
and simulated data were difficult to interpret and ranged from very low to very high and
were not consistent with an expected 20% base rate for a repressor taxon. Taken together,
these findings do not provide support for a confident inference about the latent structure
of the repressor construct. It is possible, however, that latent structure findings from
MAMBAC and MAXCOV analyses conducted with combinations of the most valid
indicators (i.e., Def, SDE, IM, Stv) may be given more weight than the rest of the
indicators. If this is done then the balance is tipped in favor of a dimensional latent
structure, however such an inference is in need more support from independent
replications.
Taxometric analyses were repeated for separate male and female samples,
however, these were of limited utility because nuisance covariance estimates between
sets of indicators was at an unacceptable level for many indicator sets. Interestingly,
taxonic latent structure was more often found for MAMBAC analyses conducted with the
male sample whereas a dimensional latent structure was found more often for the female
sample. Base rate estimates for both samples, however, cohered around 50%, a finding
consistent with a dimensional latent structure. Base rate estimates derived for simulated
taxonic data also cohered around 50%, however, suggesting the possibility that indicators
were not optimal for use with separate male and female samples.
A finding of a dimensional latent structure, if replicated, is contrary to the
assumption of taxonicity reflected in the majority of research conducted about individuals
who repress unwanted information. To date research has involved classification of people

64 as repressors only if they scored below the median on an index of trait anxiety and in the
upper quartile on an index of defensiveness. Classification of individuals as repressors
based upon a classification system that includes only those who report extreme levels of
defensiveness implies that a type of person who reports information about the self in a
positively biased fashion exists and that this person is different in nature than all others.
The current study provides preliminary evidence to suggest that this assumption might be
incorrect. Indeed, base rate estimates from the current study suggest the possibility that
all individuals possess some degree of reporting bias whereby they deny negative
attributes and claim to possess positive ones. Some may argue that the use of the term
repressor is a short cut, used to describe those who repress, that is devoid of assumptions
about latent structure. This short cut, however, seems to perpetuate the assumption of
taxonicity and may preclude an accurate understanding of the nature of anxiety. Use of
the repressor classification system results in neglect of a large portion of variance in
defensiveness that is related to the anxiety and repressor constructs and consequently
precludes an accurate understanding of both, as well as of emotional processing in
general. Because research about anxiety and defensiveness is relevant to the development
of effective psychotherapy for a range of disorders (Newman et al., in press; Safran &
Greenberg, 1991) it is important to let knowledge of the repressor construct guide
research design.
Several implications will follow if researchers continue to report evidence in
support of a dimensional latent structure of the repressor construct. Specific implications
are related to research design, analysis, and interpretation. First, investigators must
sample the entire range of both trait anxiety and defensiveness in order to develop an

65 accurate understanding of the repressor construct and the many domains of research
impacted by it. As well, investigators� strategies for studying the etiology of people who
repress can be guided by the knowledge that multiple factors, rather than a discrete
event, create such people. This is because findings of dimensionality suggest that the
etiology of people who repress is not a discrete event, as a taxonic finding would suggest,
but rather multi-determined as are all dimensional constructs (Meehl, 1992). Investigators
must also choose analytic strategies that assume dimensional latent structure in order to
understand people who repress. Third, researchers who wish to make inferences about
people who repress must base these generalizations only on data that capture the entire
range of scores on indices of the construct and that use analytic strategies that assume a
dimensional latent structure. Thus, if dimensional latent structure findings are replicated
with more certainty then inferences based on the majority of research conducted to date
about repressors will be seen to have serious restrictions. This is because most
researchers classify as repressors only those who report extreme levels of defensiveness.
Thus, relationships between moderate levels of defensiveness and dependent variables in
people who repress are missed.
A major strength of the current study was the inclusion of a recently developed
data simulation procedure (Ruscio et al., 2002) to facilitate interpretation of graphic
output. This procedure simulated data that matched the parameters of the research data
and provided superior comparator graphs to those provided by Monte Carlo studies that
are usually not well matched to research data. Moreover, use of simulated data made it
possible to determine how powerful indices were for making inferences about latent
structure. In many cases, research data panels were difficult to match up to simulated data

66 panels. Without the use of simulated data the risk of drawing inaccurate conclusions
about latent structure would have been great. The mixed latent structure findings that
emerged from the current study provide some data about the best indicators of the
repressor construct for use with taxometric analyses. Specifically, the traditional indices
as well as the SDE and IM indices derived from the traditional MCSDS index served as
useful indices of the repressor construct. Although the NEO-FFI S and A indices were
not as robust as the traditional indices for purposes of taxometric analyses, useful
information about the repressor construct was provided through inclusion of the NEO-
FFI in the current study.
Another strength of the current study was the use of blind raters with high inter-
rater agreement. These raters ensured that experimenter bias played no role in the
ultimate findings. Such is not the case with any study published to date using taxometric
procedures.
Findings from the current study revealed that in comparison to NEO-FFI
normative data, repressors reported below average N and above average A. The low and
high levels of N and A, respectively, reported by those who characteristically repress
have parallels to two hallmarks of the repressor construct: the denial of most negative
emotions and the tendency to behave in ways that maintain relatedness with and
acceptance by others. The finding that those who characteristically repress scored low on
N was not surprising because trait anxiety is a facet of N and was used to assign
individuals to the repressor group (Costa & McCrae, 1992). The finding that A captured
what is central to the R construct even better than did E and C was somewhat surprising:
Most previously reported evidence supports hypotheses that all are key elements of the

67 construct. Nevertheless, although extraversion captures the tendency to report an overly
positive self-concept and experience, which is characteristic of those who typically
repress (Costa & McCrae, 1992; Watson, 2000), it did not capture the repressor construct
as powerfully as did scores on the N and A domains. Similarly, although C captures the
tendency to engage in acts of self-restraint (Costa & McCrae) typical of those who
repress, it also was not as central to the repressor construct as were the N and A domains.
In fact, scores on E and C of those classified as repressors fell within the normal range of
a normative comparison group of college students (Costa & McCrae) thus suggesting the
that N and A capture what is most central to the repressor construct. Openness was not
related to the repressor construct and this was expected because of its lack of relationship
with trait emotionality (Watson, 2000). Estimates of the degree to which composite
indicators of the NEO-FFI discriminated taxon from complement members were also
consistent with the finding that N and A were superior to E and C in classifying
repressors. As has already been mentioned, however, N and A were not as robust as were
traditional indices for purposes of taxometric analyses.
One limitation of the current study involves the use of the shorter NEO-FFI rather
than the longer NEO-PI-R to measure personality. Whereas the 240-item NEO-PI-R has
eight items to measure each of the six facets of each personality domain, the NEO-FFI
does not. In fact, not all facets of each personality domain are represented on the NEO-
FFI. This is important to keep in mind when interpreting results from the current study.
The most surprising finding of the current study was that A captured the repressor
construct even better than C. Inspection of the items of each personality scale revealed
that items that measure self-restraint are not comprehensively represented on the NEO-
68 FFI. Items that arguably measure self-restraint can be found on the following facet scales
of the NEO-PI-R: impulsiveness (N), assertiveness (E), compliance (A), competence (C),
dutifulness (C), achievement striving (C), self-discipline (C), and deliberation (C). As is
seen in Tables 38 through 42, these facet scales are distributed across more than one
personality domain and not all are equally represented even on the C scale of the NEO-
FFI that was expected to index self-restraint. Thus, future researchers who use the NEO-
PI-R may find that the A and C personality domains are both central to the repressor
construct. Indeed, future research will further elucidate the nature of the repressor
construct if it includes measurement of the NEO-PI-R impulsiveness and assertiveness
items found on its N and E scales, respectively. Future research could also usefully look
at the relationship between specific facets of each FFM personality domain, including
openness, and the act of repression. It will be interesting to see if individuals who
characteristically repress respond in the affirmative to questions asking if they are open to
feelings, a facet of openness that review of Table 40 reveals was not adequately
represented on the NEO-FFI. Although to some it may be socially desirable to be open to
feelings, if repression is related to learning not to be open to the experience of negative
feelings it is possible that individuals who are prone to repression will deny such
openness. It will also be useful to determine what particular facets of the remaining
personality domains are related to repression.
Positive emotions were represented adequately on the E scale, so the use of the
NEO-FFI rather than the NEO-PI-R cannot explain easily why extraversion, with its
positive emotion core, was not central to the repressor construct. One possible
explanation for this is that the denial of negative emotions is more central to the repressor

69 construct than is the claiming of overly positive emotions. This possibility receives some
support from the finding that the repressor group scored below average on the N scale
that included items keyed primarily in a direction to measure the presence of negative
emotions. Thus, a low N (or high stability score) is consistent with the denial of negative
emotions. More support is found in the fact that all of the E items were worded to reflect
a focus on the presence of positive emotions. This suggests that the denial of negative
emotions is more central to the repressor construct than is the claiming of positive
emotions. Findings that repressors denied not only anxiety, but also several other
negative emotions (e.g., depression and anger) are also notable because those who repress
are often investigated with respect to primarily their denial of anxiety rather than their
denial of other negative emotions (e.g., Eysenck, 1997). Many researchers have, however
noted that repressors deny more than anxiety (e.g., Weinberger, 1990) and findings from
the current study provide further support of this hypothesis.
Some things can be inferred about the typical styles of thinking, feeling, and
behaving of those who repress based upon findings about individuals who are high in
agreeableness (Graziano & Eisenberg, 1997; Graziano & Tobin, 2002). Notably, high
scores on the A domain are associated with difficulties in asserting needs in relationships
(Pincus & Boekman, 1995). Thus, findings of high A from the current study suggest that
repressors will have difficulties with assertive behaviors in relationships. Such difficulties
are consistent with the suggestion that a central motivation of the repressor is to maintain
relatedness with and acceptance by others (Crowne & Marlowe, 1964; Myers & Brewin,
1994; Weinberger, 1990; 1992). This is an important area to further explore and was also
anticipated by others (Blatt, 1990; Bonanno & Singer, 1990) who have framed the
70 repressor construct within Bakan�s (1966) theory that all individuals struggle to achieve a
balance between the motivation to connect with and be accepted by others that is known
as communion and the motivation to overlook other�s needs in the interest of getting the
self�s needs met that is known as agency. These basic communion and agency
motivations have also been called �getting ahead� and �getting along� (Hogan, 1983) and
are reflected on the axes of the interpersonal circumplex onto which both A and E have
been projected (Trapnell and Wiggins, 1990). It appears as if those who characteristically
repress choose communion over agency. Thus, many potentially fruitful areas of inquiry
remain to be integrated with the repressor and general personality literature in order to
better-understand the repressor construct and its impact on relationships.
It will be important for independent researchers to replicate findings from the
current study using a full range of indices of the repressor construct. The MCSDS most
often used to classify individuals as repressors is actually a mixture of items that tap SDE
and IM (Paulhus & John, 1998). Future research should use non-self-report indices of the
repressor construct such as information processing, physiological, and behavioral
measures including observable behaviors rated by others. A limitation of the present
study was the use of self-report responses alone. Nevertheless, theoretically relevant, self-
report indices of the repressor construct were used that allowed for application of
findings about the FFM to the repressor construct thus creating a bridge over which
investigators can pass to extend theory about both the repressor construct and personality
in general.
Finally, little is known about the DHA group that shares a high level of
defensiveness with repressors. To date no information about this group�s latent structure
71 is known and such information will be important not only in understanding the DHA
group itself, but also in refining our understanding of the repressor construct. Despite
difficulties in recruitment of the DHA group, it will be essential that efforts be made to
understand it because it shares a high level of defensiveness with the repressor group and
is thus critical to an accurate understanding of the relative importance of both
defensiveness and trait anxiety to repression. If future researchers report data consistent
with a dimensional latent structure, it will be important for future researchers to
determine the amount of variance in dependent variables accounted for by the full range
of possible defensiveness scores. Due to research design limitations associated with the
customary restricted sampling of this construct, as well as to the tendency of investigators
to completely omit the DHA from analyses, insufficient knowledge exists to even
develop indices of the DHA that can be submitted to taxometric analysis procedures at
this point. Thus, a taxometric analysis of the DHA construct is not warranted at this time.
Findings that the DHA group occasionally emerges as distinct from Weinberger�s
original comparator groups suggest the possibility of taxonicity, however, results are
mixed. Many researchers report that the DHA group�s responses fall between those of the
repressor and HA group and rather suggest the possibility of dimensional latent structure.
Until researchers consistently sample the entire range of scores on defensiveness,
insufficient information will exist with which to develop both hypotheses about the latent
structure of the DHA group and indices of it to submit to taxometric analysis.
The importance of making inferences about a construct based upon sampling
strategies that do not presume latent structure are underscored by findings of the current
study that suggest the hypothesis of taxonicity may be inaccurate: This hypothesis was
72 based heavily upon studies that presumed the repressor construct was taxonic and
consequently sampled only extremes on measures of defensiveness and sometimes
extremes of trait anxiety. Such a research strategy resulted in inferences biased in favor
of taxonicity. Thus, researchers are strongly cautioned to empirically evaluate the latent
structure of their constructs. Without such evaluation they will be continually presented
with the challenges in inference that result from inaccurate assumptions about latent
structure.

73 Table 1
Original classification system used to identify repressors
_______________________________________________________________________
Defensiveness High Low
______________________________________________________________________
Trait Anxiety
High Defensive high Repressor
anxious
(DHA) (R)
Low High anxious Low anxious
(HA) (LA)
_______________________________________________________________________
Note. The original classification system is used to classify individuals according to scores
on a measure of defensiveness and trait anxiety. These were the Marlowe-Crowne Social
Desirability Scale (Crowne & Marlowe, 1964) and the Spielberger Anxiety Inventory
(Spielberger, Gorsuch, Lushene, Vagg, & Jacobs, 1983), respectively. High and low
defensiveness refer to the upper and lower quartile, respectively. High and low trait
anxiety refer to above and below the trait anxiety median, respectively (Weinberger,
Schwartz, & Davidson, 1979).

74 Table 2
Weinberger Adjustment Inventory (WAI) classification system used to identify
repressors
_______________________________________________________________________
Restraint
High Moderate Low
_______________________________________________________________________
Distress
High Oversocialized Sensitized Reactive
Low Repressive Self-Assured Undersocialized
_______________________________________________________________________
Note. The WAI (Weinberger & Schwartz, 1990) classification system is used to classify
individuals according to distress and restraint scores. High, moderate, and low restraint
levels refer to the upper, middle, and lower tercile of restraint, respectively. High and low
distress refer to the above and below the median split, respectively (Weinberger,
Schwartz, & Davidson, 1979).

75 Table 3
Descriptive and psychometric data for the STAI, MCSDS, and the NEO-FFI personality
domain subscale measures
_______________________________________________________________________
Measure Alpha Skew Kurtosis
_______________________________________________________________________
STAI 0.92 0.38 -0.07
MCSDS 0.83 0.14 -0.04
N 0.87 0.14 -0.44
E 0.79 -0.23 -0.08
O 0.73 0.10 -0.38
A 0.77 -0.38 0.18
C 0.86 -0.22 -0.15
Note. Marlowe-Crowne Social Desirability (MCSDS: Crowne & Marlowe, 1964)
measures defensiveness. Spielberger Trait Anxiety Inventory (STAI: Spielberger,
Gorsuch, Lushene, Vagg, & Jacobs, 1983) measures trait anxiety. Neuroticism (N),
extraversion (E), openness (O), agreeableness (A), and conscientiousness (C) are
personality domain subscales from the NEO- Five Factor Inventory (NEO-FFI: Costa &
McCrae, 1992). N = 1040.

76 Table 4
Corrected item-total correlation (CITC) and standardized validity (SV) values for STAI
items
_______________________________________________________________________
Item CITC SV Item CITC SV _______________________________________________________________________
STAI13 0.68 0.82 STAI20 0.61 0.93
STAI3 0.68 0.92 STAI2 0.61 0.77
STAI4 0.66 1.00 STAI1 0.58 0.82
STAI16 0.66 0.97 STAI11 0.56 0.75
STAI12 0.65 0.81 STAI19 0.55 0.96
STAI10 0.65 0.88 STAI18 0.54 0.82
STAI15 0.65 0.83 STAI17 0.51 0.78
STAI5 0.64 0.82 STAI9 0.51 0.65
STAI7 0.63 0.82 STAI6 0.50 0.75
STAI8 0.62 0.92 STAI14 0.42 0.56
_______________________________________________________________________
Note. Spielberger Trait Anxiety Inventory (STAI: Spielberger, Gorsuch, Lushene, Vagg,
& Jacobs, 1983) was scored in a direction that reflected trait stability (st). N = 1040.
CITC = corrected item-total correlation; SV = standardized validity computed using
Meehl and Yonce (1996, p. 1146).

77 Table 5
Corrected item-total correlation (CITC) and standardized validity (SV) values for
MCSDS items
_______________________________________________________________________
Item CITC SV Item CITC SV Item CITC SV
_______________________________________________________________________
MC15 0.54 1.10 MC10 0.36 0.84 MC3 0.29 0.74
MC6 0.51 1.14 MC22 0.37 0.64 MC20 0.28 0.52
MC19 0.51 1.12 MC17 0.35 0.70 MC11 0.28 0.44
MC28 0.45 1.02 MC33 0.35 0.70 MC2 0.28 0.48
MC30 0.45 0.83 MC13 0.33 0.66 MC8 0.27 0.56
MC12 0.44 0.92 MC26 0.32 0.67 MC24 0.26 0.56
MC21 0.43 0.82 MC5 0.32 0.80 MC1 0.21 0.49
MC23 0.42 1.11 MC4 0.33 0.60 MC27 0.21 0.41
MC31 0.38 0.78 MC14 0.33 0.82 MC32 0.20 0.47
MC29 0.37 0.76 MC9 0.31 0.63 MC18 0.12 0.32
MC16 0.36 0.67 MC25 0.30 0.71 MC7 0.07 0.30
_____________________________________________________________________
Note. The Marlowe-Crowne Social Desirability (MCSDS: Crowne & Marlowe, 1964)
was used to measure measures defensiveness. N = 1040. CITC = corrected item-total
correlation; SV = standardized validity computed using Meehl and Yonce (1996, p.
1146).
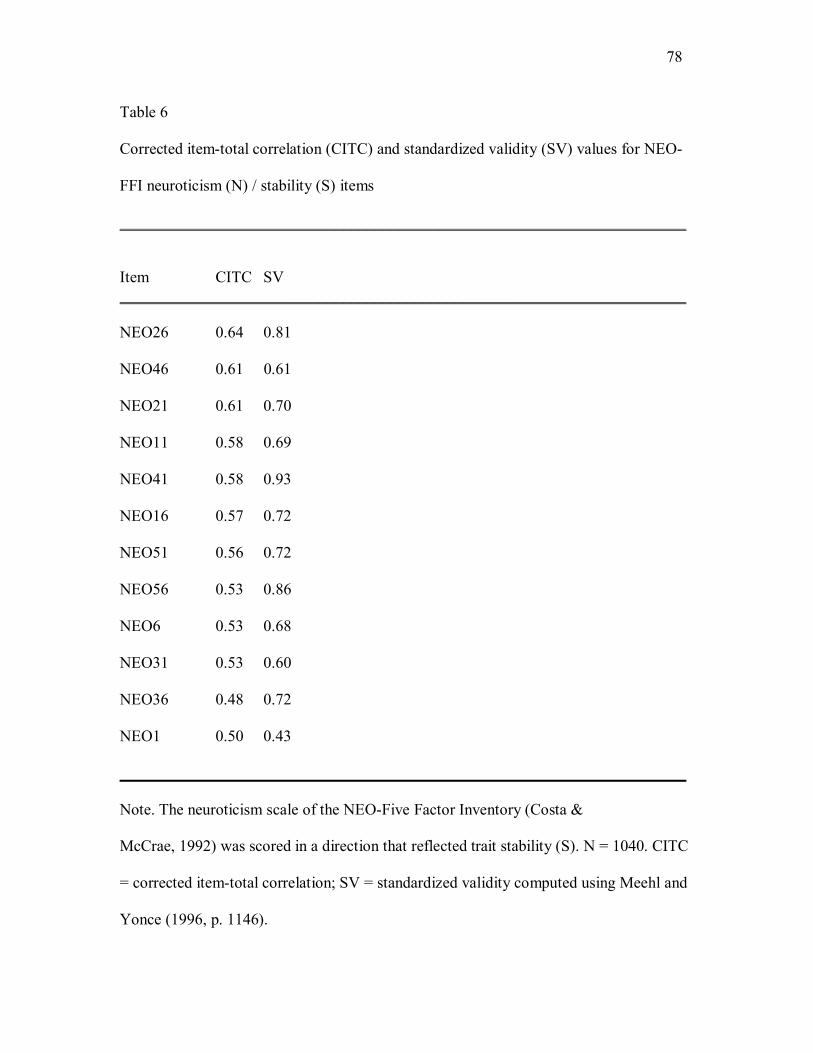
78 Table 6
Corrected item-total correlation (CITC) and standardized validity (SV) values for NEO-
FFI neuroticism (N) / stability (S) items
_______________________________________________________________________
Item CITC SV _______________________________________________________________________
NEO26 0.64 0.81
NEO46 0.61 0.61
NEO21 0.61 0.70
NEO11 0.58 0.69
NEO41 0.58 0.93
NEO16 0.57 0.72
NEO51 0.56 0.72
NEO56 0.53 0.86
NEO6 0.53 0.68
NEO31 0.53 0.60
NEO36 0.48 0.72
NEO1 0.50 0.43
_______________________________________________________________________
Note. The neuroticism scale of the NEO-Five Factor Inventory (Costa &
McCrae, 1992) was scored in a direction that reflected trait stability (S). N = 1040. CITC
= corrected item-total correlation; SV = standardized validity computed using Meehl and
Yonce (1996, p. 1146).

79 Table 7
Corrected item-total correlation (CITC) and standardized validity (SV) values for NEO-
FFI extraversion items
_______________________________________________________________________
Item CITC SV _______________________________________________________________________
NEO37 0.67 0.69
NEO17 0.51 0.42
NEO42 0.51 0.70
NEO52 0.49 0.49
NEO2 0.47 0.18
NEO32 0.47 0.29
NEO22 0.46 0.10
NEO7 0.40 0.40
NEO57 0.37 0.48
NEO47 0.34 0.16
NEO27 0.32 0.30
NEO12 0.25 0.39
_______________________________________________________________________
Note. The extraversion (E) scale of the NEO-Five Factor Inventory (Costa & McCrae,
1992) was used to measure E. N = 1040. CITC = corrected item-total correlation; SV =
standardized validity computed using Meehl and Yonce (1996, p. 1146).

80 Table 8
Corrected item-total correlation (CITC) and standardized validity (SV) values for NEO-
FFI openness items
_______________________________________________________________________
Item CITC SV _______________________________________________________________________
NEO43 0.59 0.21
NEO13 0.57 0.05
NEO58 0.56 0.16
NEO48 0.53 0.14
NEO23 0.52 0.22
NEO53 0.42 0.22
NEO33 0.32 0.06
NEO18 0.30 0.17
NEO28 0.24 0.06
NEO38 0.13 -0.21
NEO3 0.15 -0.36
NEO8 0.05 -0.16
_______________________________________________________________________
Note. The openness (O) scale of the NEO-Five Factor Inventory (Costa & McCrae, 1992)
was used to measure O. N = 1040. CITC = corrected item-total correlation; SV =
standardized validity computed using Meehl and Yonce (1996, p. 1146).

81 Table 9
Corrected item-total correlation (CITC) and standardized validity (SV) values for NEO-
FFI agreeableness items
_______________________________________________________________________
Item CITC SV _______________________________________________________________________
NEO14 0.51 0.61
NEO39 0.50 0.65
NEO49 0.48 0.59
NEO24 0.47 0.70
NEO59 0.46 0.75
NEO4 0.39 0.50
NEO54 0.38 0.41
NEO44 0.38 0.25
NEO9 0.37 0.67
NEO29 0.36 0.54
NEO19 0.30 0.15
NEO34 0.30 0.59
_______________________________________________________________________
Note. The agreeableness (A) scale of the NEO-Five Factor Inventory (Costa &
McCrae, 1992) was used to measure A. N = 1040. CITC = corrected item-total
correlation; SV = standardized validity computed using Meehl and Yonce (1996, p.
1146).

82 Table 10
Corrected item-total correlation (CITC) and standardized validity (SV) values for NEO-
FFI conscientiousness items
_______________________________________________________________________
Item CITC SV _______________________________________________________________________
NEO50 0.66 0.61
NEO35 0.65 0.53
NEO55 0.63 0.58
NEO25 0.62 0.47
NEO10 0.62 0.58
NEO60 0.59 0.53
NEO20 0.55 0.44
NEO30 0.52 0.64
NEO5 0.49 0.45
NEO45 0.48 0.69
NEO40 0.48 0.60
NEO15 0.28 0.10
_______________________________________________________________________
Note. The conscientiousness (C) scale of the NEO-Five Factor Inventory (Costa &
McCrae, 1992) was used to measure C. N = 1040. CITC = corrected item-total
correlation; SV = standardized validity computed using Meehl and Yonce (1996, p.
1146).
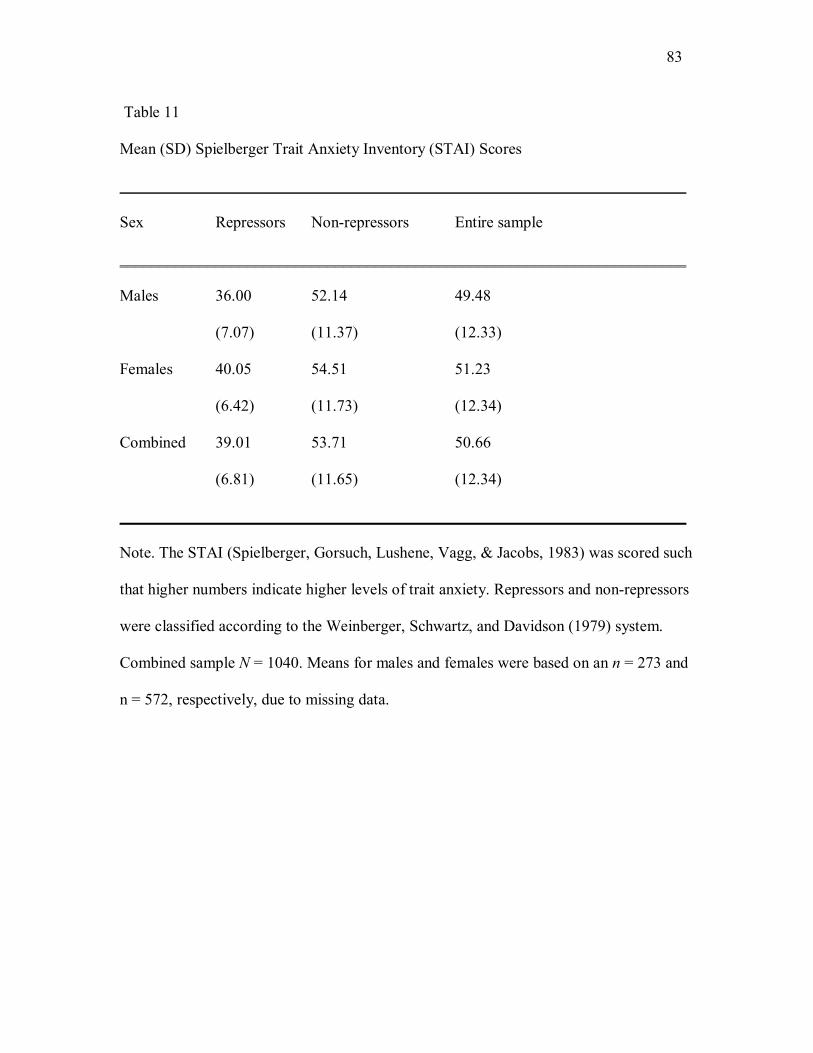
83 Table 11
Mean (SD) Spielberger Trait Anxiety Inventory (STAI) Scores
_______________________________________________________________________
Sex Repressors Non-repressors Entire sample
_______________________________________________________________________
Males 36.00 52.14 49.48
(7.07) (11.37) (12.33)
Females 40.05 54.51 51.23
(6.42) (11.73) (12.34)
Combined 39.01 53.71 50.66
(6.81) (11.65) (12.34)
_______________________________________________________________________
Note. The STAI (Spielberger, Gorsuch, Lushene, Vagg, & Jacobs, 1983) was scored such
that higher numbers indicate higher levels of trait anxiety. Repressors and non-repressors
were classified according to the Weinberger, Schwartz, and Davidson (1979) system.
Combined sample N = 1040. Means for males and females were based on an n = 273 and
n = 572, respectively, due to missing data.

84 Table 12
Mean (SD) Marlowe Crowne Social Desirability Scale (MCSDS) scores
_______________________________________________________________________
Sex Repressors Non-repressors Entire sample
_______________________________________________________________________
Males 121.64 95.37 99.70
(7.74) (10.92) (14.30)
Females 119.88 97.20 102.36
(7.94) (11.64) (14.47)
Combined 120.34 96.58 101.50
(7.90) (11.43) (14.46)
_______________________________________________________________________
Note. The MCSDS (Crowne & Marlowe, 1964) was used to measure defensiveness.
Higher numbers reflect higher levels of defensiveness. Repressors and non-repressors
were classified according to the Weinberger, Schwartz, and Davidson (1979) system.
Combined sample N = 1040. Means for males and females were based on an n = 273 and
n = 572, respectively, due to missing data about sex.

85 Table 13
Frequency (percentage) of each sex by group _______________________________________________________________________
Sex Repressors Non-repressors Entire sample
_______________________________________________________________________
Males 45 228 273
(26) (34)
Females 130 442 572
(74) (66)
_______________________________________________________________________
Combined 175 670 845
(21) (79)
_______________________________________________________________________
Note. Repressors and non-repressors were classified according to the Weinberger,
Schwartz, and Davidson (1979) system.

86 Table 14
Mean (SD) NEO-Five Factor Inventory (NEO-FFI) neuroticism scores
_______________________________________________________________________
Sex Repressors Non-repressors Entire sample
_______________________________________________________________________
Males 12.67 21.22 19.80
(5.13) (7.85) (8.11)
Females 15.50 24.90 22.75
(5.84) (7.92) (8.47)
Combined 14.77 23.65 21.80
(5.79) (8.08) (8.46)
_______________________________________________________________________
Note. The neuroticism (N) scale of the NEO-FFI (Costa & McCrae, 1992) was used to
measure trait N. Higher numbers reflect higher levels of trait N. Repressors and non-
repressors were classified according to the Weinberger, Schwartz, and Davidson (1979)
system. Combined sample N = 1040. Means for males and females were based on an n =
273 and n = 572, respectively, due to missing data about sex.

87 Table 15
Mean (SD) NEO-Five Factor Inventory (NEO-FFI) extraversion scores
_______________________________________________________________________
Sex Repressors Non-repressors Entire sample
_______________________________________________________________________ Males 33.36 29.06 29.76
(5.51) (6.04) (6.16)
Females 34.65 30.16 31.20
(5.68) (6.44) (6.55)
Combined 34.31 29.78 30.74
(5.65) (6.33) (6.46)
_______________________________________________________________________
Note. The extraversion scale of the NEO-FFI (Costa & McCrae, 1992) was used to
measure E. Higher numbers reflect higher levels of E. Repressors and non-repressors
were classified according to the Weinberger, Schwartz, and Davidson (1979) system.
Combined sample N = 1040. Means for males and females were based on an n = 273 and
n = 572, respectively, due to missing data about sex.

88 Table 16
Mean (SD) NEO-Five Factor Inventory (NEO-FFI) openness scores _______________________________________________________________________
Sex Repressors Non-repressors Entire sample
_______________________________________________________________________ Males 28.74 28.24 28.32
(6.87) (6.86) (6.85)
Females 28.83 28.24 28.37
(5.62) (6.40) (6.23)
Combined 28.81 29.24 28.36
(5.94) (6.56) (6.43)
_______________________________________________________________________
Note. The openness scale of the NEO-FFI (Costa & McCrae, 1992) was used to measure
openness. Higher numbers reflect higher levels of O. Repressors and non-repressors were
classified according to the Weinberger, Schwartz, and Davidson (1979) system.
Combined sample N = 1040. Means for males and females were based on an n = 273 and
n = 572, respectively, due to missing data about sex.

89 Table 17
Mean (SD) NEO-Five Factor Inventory (NEO-FFI) agreeableness scores
_______________________________________________________________________
Sex Repressors Non-repressors Entire sample
_______________________________________________________________________
Males 35.35 29.49 30.50
(4.87) (5.90) (6.17)
Females 37.38 31.20 32.62
(4.36) (6.38) (6.52)
Combined 36.95 30.62 31.94
(4.54) (6.27) (6.48)
_______________________________________________________________________
Note. The agreeableness (A) scale of the NEO-FFI (Costa & McCrae, 1992) was used to
measure A. Higher numbers reflect higher levels of A. Repressors and non-repressors
were classified according to the Weinberger, Schwartz, and Davidson (1979) system.
Combined sample N = 1040. Means for males and females were based on an n = 273 and
n = 572, respectively, due to missing data about sex.

90 Table 18
Mean (SD) NEO-Five Factor Inventory (NEO-FFI) conscientiousness scores
____________________________________________________________________
Sex Repressors Non-repressors Entire sample
_______________________________________________________________________
Males 35.14 28.67 29.72
(5.72) (6.93) (7.15)
Females 36.46 30.28 31.70
(6.23) (7.20) (7.46)
Combined 36.13 29.73 31.06
(6.12) (7.14) (4.41)
_______________________________________________________________________
Note. The conscientiousness (C) scale of the NEO-FFI (Costa & McCrae, 1992) was used
to measure C. Higher numbers reflect higher levels of C. Repressors and non-repressors
were classified according to the Weinberger, Schwartz, and Davidson (1979) system.
Combined sample N = 1040. Means for males and females were based on an n = 273 and
n = 572, respectively, due to missing data about sex.

91 Table 19
Standardized validity estimates of composite indicators
____________________________________________________________________
Scale All items Highest CITC items Highest SV items
____________________________________________________________________
MCSDS 2.20 1.95 1.98
SDE 2.00
IM 1.65
STAI 1.38 1.30 1.39
S 1.15 1.07 1.20
E 0.71 0.70 0.84
A 1.03 1.02 1.11
C 0.84 0.74 0.91 _____________________________________________________________________
Note. Marlowe-Crowne Social Desirability (MCSDS: Crowne & Marlowe, 1964) measures defensiveness.
Spielberger Trait Anxiety Inventory (STAI: Spielberger, Gorsuch, Lushene, Vagg, & Jacobs, 1983)
measures trait anxiety. Stability (S), extraversion (E), openness (O), agreeableness (A), and
conscientiousness (C) are personality domain subscales from the NEO- Five Factor Inventory (NEO-FFI:
Costa & McCrae, 1992). N = 1040. CITC = corrected item total correlations. SV = standardized validity
items computed according to Meehl & Yonce (1996, p. 1146).

92 Table 20
Nuisance covariance estimates between composite indicators in the repressor (above diagonal) and non-repressor (below diagonal) group ____________________________________________________________________
Def SDE IM Stv Sv Ev Av Cv
Def - 0.80 0.68 0.29 0.34 0.31 0.37 0.23
SDE 0.87 - 0.15 0.32 0.41 0.17 0.20 0.10
IM 0.80 0.42 - 0.08 0.05 0.29 0.30 0.28
Stv 0.23 0.33 0.05 - 0.54 0.35 0.28 0.10
Sv 0.31 0.44 0.06 0.71 - 0.40 0.23 0.12
Ev 0.16 0.15 0.13 0.43 0.39 - 0.42 0.16
Av 0.50 0.40 0.42 0.31 0.29 0.30 - 0.13
C v 0.34 0.29 0.30 0.31 0.34 0.24 0.24 -
____________________________________________________________________
Note. Defensiveness (Def) composite was formed via combination of all Marlowe-Crowne Social
Desirability Scale (MCSDS: Crowne & Marlowe, 1964) items. Self-deceptive enhancement (SDE) and
impression management (IM) composites were formed via combination of the items that composed the
MCSDS SDE and IM factors, respectively (Paulhus & Reid, 1989). The trait stability (Stv) composite was
formed via combination of the most valid items (Meehl & Yonce, 1996, P. 1146) of the Spielberger Trait
Anxiety Inventory (STAI: Spielberger et al., 1983). Separate stability (Sv), extraversion (Ev),
agreeableness (Av) and conscientiousness (Cv) composites were formed via combination of the most valid
items on each of these NEO-Five Factor Inventory (NEO-FFI: Costa & McCrae, 1992) subscales. N =
1040.

93 Table 21
Nuisance covariance estimates between composite indicators in the combined (repressor + non-repressor) group ____________________________________________________________________
Def SDE IM Stv Sv Ev Av Cv
Def -
SDE 0.91 -
IM 0.85 0.58 -
Stv 0.46 0.51 0.28 -
Sv 0.48 0.56 0.26 0.75 -
Ev 0.32 0.30 0.28 0.50 0.46 -
Av 0.60 0.51 0.53 0.43 0.40 0.39 -
C v 0.45 0.39 0.41 0.39 0.40 0.30 0.32 -
____________________________________________________________________
Note. Defensiveness (Def) composite was formed via combination of all Marlowe-Crowne Social
Desirability Scale (MCSDS: Crowne & Marlowe, 1964) items. Self-deceptive enhancement (SDE) and
impression management (IM) composites were formed via combination of the items that composed the
SDE and IM factors, respectively, of the MCSDS (Paulhus & Reid, 1989). The trait stability (Stv)
composite was formed via combination of the most valid (Meehl & Yonce, 1996, P. 1146) items of the
Spielberger Trait Anxiety Inventory (STAI: Spielberger et al., 1983). Separate stability (Sv), extraversion
(Ev), agreeableness (Av) and conscientiousness (Cv) composites were formed via combination of the most
valid items on each of these NEO-Five Factor Inventory (NEO-FFI: Costa & McCrae, 1992) subscales. N =
1040.

94 Table 22
Judgments of latent structure for mean-above-minus-below-a-cut (MAMBAC) analyses
_______________________________________________________________________
Input Output Latent Structure (frequency of judgment)
_______________________________________________________________________
Def Stv D (4/4) Stv Def D (3/4); T (1/4) SDE IM T (4/4) IM SDE D (2/4); T (2/4) SDE Av T (4/4) Av SDE D (4/4) IM Stv D (2/4); DK (2/4) Stv IM T (4/4) IM Sv D (3/4); DK (1/4) Sv IM T (4/4) IM Av D (3/4); T (1/4) Av IM T (4/4) Stv Av T (2/4); DK (2/4) Av Stv D (4/4) Sv Av D (4/4) Av Sv T (4/4) _______________________________________________________________________
Note. Defensiveness (Def) composite was formed via combination of all Marlowe-Crowne Social
Desirability Scale (MCSDS: Crowne & Marlowe, 1964) items. Self-deceptive enhancement (SDE) and
impression management (IM) composites were formed via combination of the items that composed the
SDE and IM factors, respectively, of the MCSDS (Paulhus & Reid, 1989). The trait stability (Stv)
composite was formed via combination of the most valid (Meehl & Yonce, 1996, P. 1146) items of the
Spielberger Trait Anxiety Inventory (STAI: Spielberger et al., 1983). Separate stability (Sv), extraversion
(Ev), agreeableness (Av) and conscientiousness (Cv) composites were formed via combination of the most
valid items on each of these NEO-Five Factor Inventory (NEO-FFI: Costa & McCrae, 1992) subscales. N =
1040. Latent structure judgments by four blind raters: D = dimensional; T = taxonic; DK = don�t know.

95 Table 23
Base rate estimates derived from MAMBAC analyses with research data, simulated dimensional, and
simulated taxonic data
_______________________________________________________________________
Simulated Input Output Research Data Dimensional Taxonic _______________________________________________________________________
Def Stv 0.45 0.50 0.31 Stv Def 0.44 0.48 0.35 SDE IM 0.43 0.54 0.40 IM SDE 0.45 0.52 0.43 SDE Av 0.50 0.49 0.48 Av SDE 0.49 0.46 0.49 IM Stv 0.48 0.58 0.28 Stv IM 0.34 0.46 0.26 IM Sv 0.48 0.58 0.28 Sv IM 0.38 0.66 0.32 IM Av 0.53 0.54 0.48 Av IM 0.48 0.54 0.46 Stv Av 0.54 0.50 0.44 Av Stv 0.52 0.49 0.46 Sv Av 0.58 0.51 0.44 Av Sv 0.49 0.47 0.49 __________________________________________________________________________________________________________
Note. Defensiveness (Def) composite was formed via combination of all Marlowe-Crowne Social
Desirability Scale (MCSDS: Crowne & Marlowe, 1964) items. Self-deceptive enhancement (SDE) and
impression management (IM) composites were formed via combination of the items that composed the
SDE and IM factors, respectively, of the MCSDS (Paulhus & Reid, 1989). The trait stability (Stv)
composite was formed via combination of the most valid (Meehl & Yonce, 1996, P. 1146) items of the
Spielberger Trait Anxiety Inventory (STAI: Spielberger et al., 1983). Separate stability (Sv), extraversion
(Ev), agreeableness (Av) and conscientiousness (Cv) composites were formed via combination of the most
valid items on each of these NEO-Five Factor Inventory (NEO-FFI: Costa & McCrae, 1992) subscales. N =
1040.

96
Table 24
Decisions regarding latent structure for MAXCOV analyses
_______________________________________________________________________
Input Output Latent structure
_______________________________________________________________________
Stv IM, SDE D (4/4)
IM Stv, SDE D (4/4)
SDE Stv, IM T (2/4); D (1/4); DK (1/4)
_______________________________________________________________________
Note. The trait stability (Stv) composite was formed via combination of the most valid
(Meehl & Yonce, 1996, P. 1146) items of the Spielberger Trait Anxiety Inventory (STAI:
Spielberger et al., 1983). Self-deceptive enhancement (SDE) and impression management
(IM) composites were formed via combination of the items that composed the SDE and
IM factors (Paulhus & Reid, 1989), respectively, of the Marlowe-Crowne Social
Desirability Scale (MCSDS: Crowne & Marlowe, 1964). N = 1040. Latent structure
judgments: D = dimensional; T = taxonic; DK = don�t know.

97 Table 25
Base rate estimates derived from MAXCOV analyses with research data, simulated
dimensional, and simulated taxonic data
_______________________________________________________________________
Simulated Input Output Research Data Dimensional Taxonic _______________________________________________________________________
Stv IM, SDE 0.08 0.92 0.08
IM Stv, SDE 0.08 0.08 0.08
SDE Stv, IM 0.92 0.08 0.08
_______________________________________________________________________
Note. The trait stability (Stv) composite was formed via combination of the most valid
(Meehl & Yonce, 1996, P. 1146) items of the Spielberger Trait Anxiety Inventory (STAI:
Spielberger et al., 1983). Self-deceptive enhancement (SDE) and impression management
(IM) composites were formed via combination of the items that composed the SDE and
IM factors (Paulhus & Reid, 1989), respectively, of the Marlowe-Crowne Social
Desirability Scale (MCSDS: Crowne & Marlowe, 1964). N = 1040.
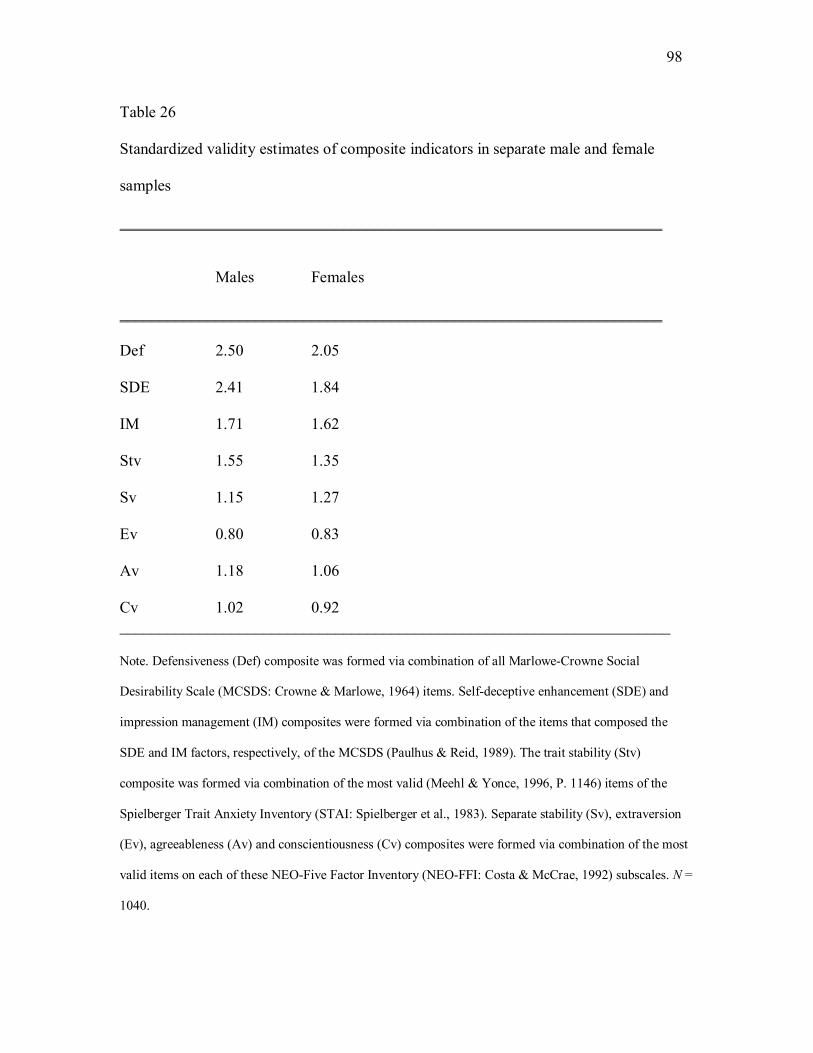
98 Table 26
Standardized validity estimates of composite indicators in separate male and female
samples
____________________________________________________________________
Males Females
____________________________________________________________________
Def 2.50 2.05
SDE 2.41 1.84
IM 1.71 1.62
Stv 1.55 1.35
Sv 1.15 1.27
Ev 0.80 0.83
Av 1.18 1.06
Cv 1.02 0.92 _____________________________________________________________________ Note. Defensiveness (Def) composite was formed via combination of all Marlowe-Crowne Social
Desirability Scale (MCSDS: Crowne & Marlowe, 1964) items. Self-deceptive enhancement (SDE) and
impression management (IM) composites were formed via combination of the items that composed the
SDE and IM factors, respectively, of the MCSDS (Paulhus & Reid, 1989). The trait stability (Stv)
composite was formed via combination of the most valid (Meehl & Yonce, 1996, P. 1146) items of the
Spielberger Trait Anxiety Inventory (STAI: Spielberger et al., 1983). Separate stability (Sv), extraversion
(Ev), agreeableness (Av) and conscientiousness (Cv) composites were formed via combination of the most
valid items on each of these NEO-Five Factor Inventory (NEO-FFI: Costa & McCrae, 1992) subscales. N =
1040.
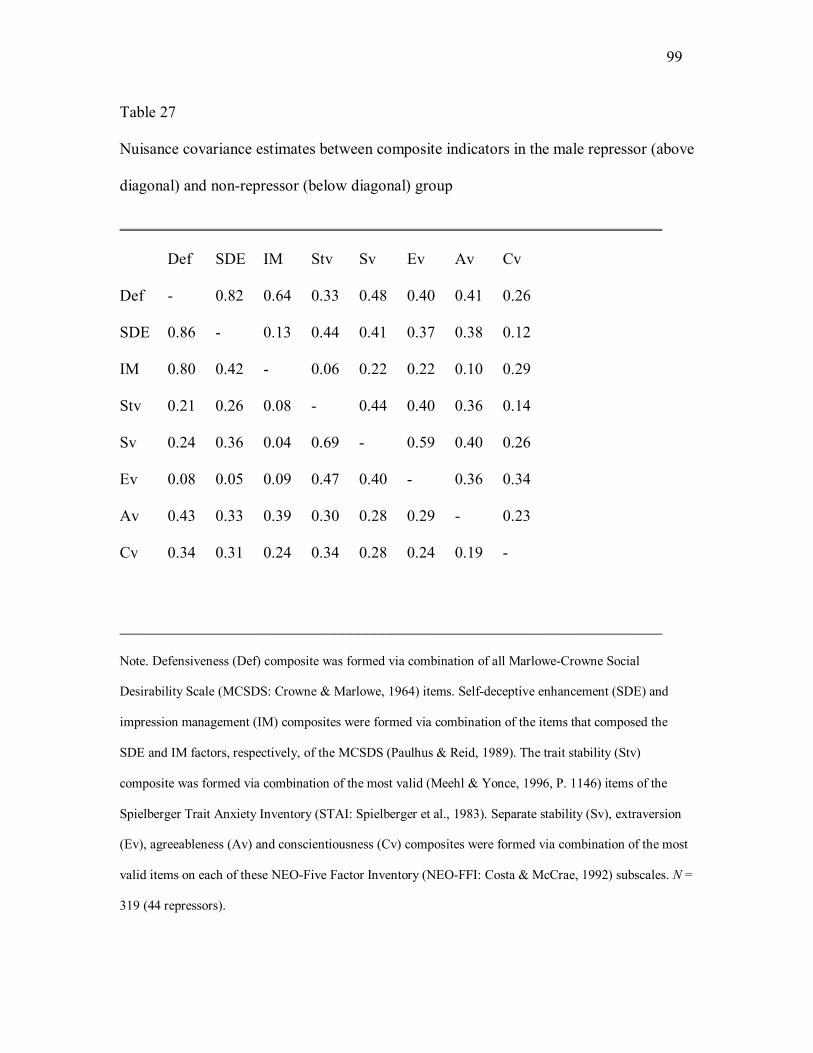
99 Table 27
Nuisance covariance estimates between composite indicators in the male repressor (above diagonal) and non-repressor (below diagonal) group
____________________________________________________________________
Def SDE IM Stv Sv Ev Av Cv
Def - 0.82 0.64 0.33 0.48 0.40 0.41 0.26
SDE 0.86 - 0.13 0.44 0.41 0.37 0.38 0.12
IM 0.80 0.42 - 0.06 0.22 0.22 0.10 0.29
Stv 0.21 0.26 0.08 - 0.44 0.40 0.36 0.14
Sv 0.24 0.36 0.04 0.69 - 0.59 0.40 0.26
Ev 0.08 0.05 0.09 0.47 0.40 - 0.36 0.34
Av 0.43 0.33 0.39 0.30 0.28 0.29 - 0.23
Cv 0.34 0.31 0.24 0.34 0.28 0.24 0.19 -
____________________________________________________________________ Note. Defensiveness (Def) composite was formed via combination of all Marlowe-Crowne Social
Desirability Scale (MCSDS: Crowne & Marlowe, 1964) items. Self-deceptive enhancement (SDE) and
impression management (IM) composites were formed via combination of the items that composed the
SDE and IM factors, respectively, of the MCSDS (Paulhus & Reid, 1989). The trait stability (Stv)
composite was formed via combination of the most valid (Meehl & Yonce, 1996, P. 1146) items of the
Spielberger Trait Anxiety Inventory (STAI: Spielberger et al., 1983). Separate stability (Sv), extraversion
(Ev), agreeableness (Av) and conscientiousness (Cv) composites were formed via combination of the most
valid items on each of these NEO-Five Factor Inventory (NEO-FFI: Costa & McCrae, 1992) subscales. N =
319 (44 repressors).

100 Table 28 Nuisance covariance estimates between composite indicators in the female repressor (above diagonal) and non-repressor (below diagonal) group ____________________________________________________________________
Def SDE IM Stv Sv Ev Av Cv
Def - 0.80 0.72 0.19 0.29 0.32 0.34 0.23
SDE 0.88 - 0.21 0.20 0.41 0.17 0.17 0.14
IM 0.81 0.46 - 0.10 0.00 0.30 0.31 0.24
Stv 0.23 0.32 0.06 - 0.56 0.36 0.26 0.10
Sv 0.35 0.46 0.12 0.70 - 0.38 0.21 0.07
Ev 0.17 0.18 0.13 0.41 0.41 - 0.46 0.12
Av 0.55 0.45 0.45 0.33 0.35 0.29 - 0.07
Cv 0.34 0.28 0.33 0.32 0.39 0.24 0.26 - ____________________________________________________________________ Note. Defensiveness (Def) composite was formed via combination of all Marlowe-
Crowne Social Desirability Scale (MCSDS: Crowne & Marlowe, 1964) items. Self-
deceptive enhancement (SDE) and impression management (IM) composites were
formed via combination of the items that composed the SDE and IM factors, respectively,
of the MCSDS (Paulhus & Reid, 1989). The trait stability (Stv) composite was formed
via combination of the most valid (Meehl & Yonce, 1996, P. 1146) items of the
Spielberger Trait Anxiety Inventory (STAI: Spielberger et al., 1983). Separate stability
(Sv), extraversion (Ev), agreeableness (Av) and conscientiousness (Cv) composites were
formed via combination of the most valid items on each of these NEO-Five Factor
Inventory (NEO-FFI: Costa & McCrae, 1992) subscales. N = 636 (118 repressors).

101 Table 29
Nuisance covariance estimates between composite indicators in the entire (repressors + nonrepressors) male (above diagonal) and entire female (below diagonal) group ____________________________________________________________________
Def SDE IM Stv Sv Ev Av Cv
Def - 0.92 0.84 0.45 0.42 0.25 0.55 0.46
SDE 0.92 - 0.59 0.49 0.50 0.23 0.48 0.43
IM 0.86 0.61 - 0.30 0.24 0.22 0.48 0.37
Stv 0.44 0.50 0.30 - 0.72 0.52 0.43 0.43
Sv 0.52 0.59 0.32 0.75 - 0.47 0.38 0.37
Ev 0.33 0.32 0.29 0.48 0.48 - 0.36 0.32
Av 0.62 0.54 0.54 0.44 0.45 0.39 - 0.29
Cv 0.45 0.39 0.44 0.40 0.45 0.30 0.34 -
____________________________________________________________________ Note. Defensiveness (Def) composite was formed via combination of all Marlowe-Crowne Social
Desirability Scale (MCSDS: Crowne & Marlowe, 1964) items. Self-deceptive enhancement (SDE) and
impression management (IM) composites were formed via combination of the items that composed the
SDE and IM factors, respectively, of the MCSDS (Paulhus & Reid, 1989). The trait stability (Stv)
composite was formed via combination of the most valid (Meehl & Yonce, 1996, P. 1146) items of the
Spielberger Trait Anxiety Inventory (STAI: Spielberger et al., 1983). Separate stability (Sv), extraversion
(Ev), agreeableness (Av) and conscientiousness (Cv) composites were formed via combination of the most
valid items on each of these NEO-Five Factor Inventory (NEO-FFI: Costa & McCrae, 1992) subscales. N =
955 (162 repressors).

102 Table 30
Judgments of latent structure for mean above minus below-a-cut (MAMBAC) analyses with the male
sample
______________________________________________________________________________________
Input Output Latent Structure
______________________________________________________________________________________
Def Stv T Stv Def D SDE IM T IM SDE D SDE Av T Av SDE T IM Stv T Stv IM T IM Sv T Sv IM T IM Av D Av IM T Stv Av D Av Stv T Sv Av D Av Sv DK ____________________________________________________________________________________________________________
Note. Defensiveness (Def) composite was formed via combination of all Marlowe-Crowne Social
Desirability Scale (MCSDS: Crowne & Marlowe, 1964) items. Self-deceptive enhancement (SDE) and
impression management (IM) composites were formed via combination of the items that composed the
SDE and IM factors, respectively, of the MCSDS (Paulhus & Reid, 1989). The trait stability (Stv)
composite was formed via combination of the most valid (Meehl & Yonce, 1996, P. 1146) items of the
Spielberger Trait Anxiety Inventory (STAI: Spielberger et al., 1983). Separate stability (Sv), extraversion
(Ev), agreeableness (Av) and conscientiousness (Cv) composites were formed via combination of the most
valid items on each of these NEO-Five Factor Inventory (NEO-FFI: Costa & McCrae, 1992) subscales. N =
319. Latent structure judgments: D = dimensional; T = taxonic; DK = don�t know.

103 Table 31
Base rate estimates derived from MAMBAC analyses with research data, simulated dimensional, and
simulated taxonic data: male sample
______________________________________________________________________________________
Simulated Input Output Research Data Dimensional Taxonic ______________________________________________________________________________________
Def Stv 0.31 0.48 0.21 Stv Def 0.36 0.29 0.37 SDE IM 0.45 0.51 0.41 IM SDE 0.42 0.44 0.35 SDE Av 0.46 0.54 0.37 Av SDE 0.39 0.58 0.41 IM Stv 0.35 0.59 0.24 Stv IM 0.33 0.51 0.24 IM Sv 0.25 0.75 0.24 Sv IM 0.29 0.65 0.36 IM Av 0.51 0.49 0.38 Av IM 0.41 0.53 0.42 Stv Av 0.38 0.38 0.44 Av Stv 0.45 0.50 0.45 Sv Av 0.46 0.42 0.43 Av Sv 0.43 0.58 0.54 ____________________________________________________________________________________________________________
Note. Defensiveness (Def) composite was formed via combination of all Marlowe-Crowne Social
Desirability Scale (MCSDS: Crowne & Marlowe, 1964) items. Self-deceptive enhancement (SDE) and
impression management (IM) composites were formed via combination of the items that composed the
SDE and IM factors, respectively, of the MCSDS (Paulhus & Reid, 1989). The trait stability (Stv)
composite was formed via combination of the most valid (Meehl & Yonce, 1996, P. 1146) items of the
Spielberger Trait Anxiety Inventory (STAI: Spielberger et al., 1983). Separate stability (Sv), extraversion
(Ev), agreeableness (Av) and conscientiousness (Cv) composites were formed via combination of the most
valid items on each of these NEO-Five Factor Inventory (NEO-FFI: Costa & McCrae, 1992) subscales. N =
319.

104 Table 32
Decisions regarding latent structure for MAXCOV analyses within the male sample
_______________________________________________________________________
Input Output Latent structure
_______________________________________________________________________
Stv IM, SDE DK
IM Stv, SDE T
SDE Stv, IM DK
_______________________________________________________________________
Note. The trait stability (Stv) composite was formed via combination of the most valid
(Meehl & Yonce, 1996, P. 1146) items of the Spielberger Trait Anxiety Inventory (STAI:
Spielberger et al., 1983). Self-deceptive enhancement (SDE) and impression management
(IM) composites were formed via combination of the items that composed the SDE and
IM factors (Paulhus & Reid, 1989), respectively, of the Marlowe-Crowne Social
Desirability Scale (MCSDS: Crowne & Marlowe, 1964). N = 319. Latent structure
judgments: D = dimensional; T = taxonic; DK = don�t know.

105 Table 33
Base rate estimates derived from MAXCOV analyses with research data, simulated
dimensional, and simulated taxonic data: male sample
_______________________________________________________________________
Simulated Input Output Research Data Dimensional Taxonic _______________________________________________________________________
Stv IM, SDE 0.08 0.41 0.08
IM Stv, SDE 0.08 0.08 0.08
SDE Stv, IM 0.08 0.92 0.08
_______________________________________________________________________
Note. The trait stability (Stv) composite was formed via combination of the most valid
(Meehl & Yonce, 1996, P. 1146) items of the Spielberger Trait Anxiety Inventory (STAI:
Spielberger et al., 1983). Self-deceptive enhancement (SDE) and impression management
(IM) composites were formed via combination of the items that composed the SDE and
IM factors (Paulhus & Reid, 1989), respectively, of the Marlowe-Crowne Social
Desirability Scale (MCSDS: Crowne & Marlowe, 1964). N = 319.

106 Table 34
Judgments of latent structure for mean above minus below-a-cut (MAMBAC) analyses with the female
sample
______________________________________________________________________________________
Input Output Latent Structure
______________________________________________________________________________________
Def Stv D Stv Def D SDE IM T IM SDE D SDE Av D Av SDE DK IM Stv D Stv IM T IM Sv DK Sv IM T IM Av D Av IM D Stv Av D Av Stv D Sv Av DK Av Sv DK ____________________________________________________________________________________________________________
Note. Defensiveness (Def) composite was formed via combination of all Marlowe-Crowne Social
Desirability Scale (MCSDS: Crowne & Marlowe, 1964) items. Self-deceptive enhancement (SDE) and
impression management (IM) composites were formed via combination of the items that composed the
SDE and IM factors, respectively, of the MCSDS (Paulhus & Reid, 1989). The trait stability (Stv)
composite was formed via combination of the most valid (Meehl & Yonce, 1996, P. 1146) items of the
Spielberger Trait Anxiety Inventory (STAI: Spielberger et al., 1983). Separate stability (Sv), extraversion
(Ev), agreeableness (Av) and conscientiousness (Cv) composites were formed via combination of the most
valid items on each of these NEO-Five Factor Inventory (NEO-FFI: Costa & McCrae, 1992) subscales. N =
636. Latent structure judgments: D = dimensional; T = taxonic; DK = don�t know.

107 Table 35
Base rate estimates derived from MAMBAC analyses with research data, simulated dimensional, and
simulated taxonic data: female sample
______________________________________________________________________________________
Simulated Input Output Research Data Dimensional Taxonic ______________________________________________________________________________________
Def Stv 0.54 0.52 0.38 Stv Def 0.50 0.52 0.33 SDE IM 0.44 0.52 0.44 IM SDE 0.49 0.52 0.45 SDE Av 0.54 0.54 0.56 Av SDE 0.56 0.52 0.50 IM Stv 0.54 0.46 0.33 Stv IM 0.43 0.47 0.29 IM Sv 0.56 0.60 0.31 Sv IM 0.48 0.52 0.39 IM Av 0.55 0.55 0.47 Av IM 0.53 0.48 0.46 Stv Av 0.60 0.51 0.46 Av Stv 0.54 0.51 0.49 Sv Av 0.60 0.47 0.44 Av Sv 0.50 0.47 0.44 ____________________________________________________________________________________________________________
Note. Defensiveness (Def) composite was formed via combination of all Marlowe-Crowne Social
Desirability Scale (MCSDS: Crowne & Marlowe, 1964) items. Self-deceptive enhancement (SDE) and
impression management (IM) composites were formed via combination of the items that composed the
SDE and IM factors, respectively, of the MCSDS (Paulhus & Reid, 1989). The trait stability (Stv)
composite was formed via combination of the most valid (Meehl & Yonce, 1996, P. 1146) items of the
Spielberger Trait Anxiety Inventory (STAI: Spielberger et al., 1983). Separate stability (Sv), extraversion
(Ev), agreeableness (Av) and conscientiousness (Cv) composites were formed via combination of the most
valid items on each of these NEO-Five Factor Inventory (NEO-FFI: Costa & McCrae, 1992) subscales. N =
636.

108 Table 36
Decisions regarding latent structure for MAXCOV analyses within the female sample
_______________________________________________________________________
Input Output Latent structure
_______________________________________________________________________
Stv IM, SDE D
IM Stv, SDE T
SDE Stv, IM D
_______________________________________________________________________
Note. The trait stability (Stv) composite was formed via combination of the most valid
(Meehl & Yonce, 1996, P. 1146) items of the Spielberger Trait Anxiety Inventory (STAI:
Spielberger et al., 1983). Self-deceptive enhancement (SDE) and impression management
(IM) composites were formed via combination of the items that composed the SDE and
IM factors (Paulhus & Reid, 1989), respectively, of the Marlowe-Crowne Social
Desirability Scale (MCSDS: Crowne & Marlowe, 1964). N = 636. Latent structure
judgments: D = dimensional; T = taxonic; DK = don�t know.
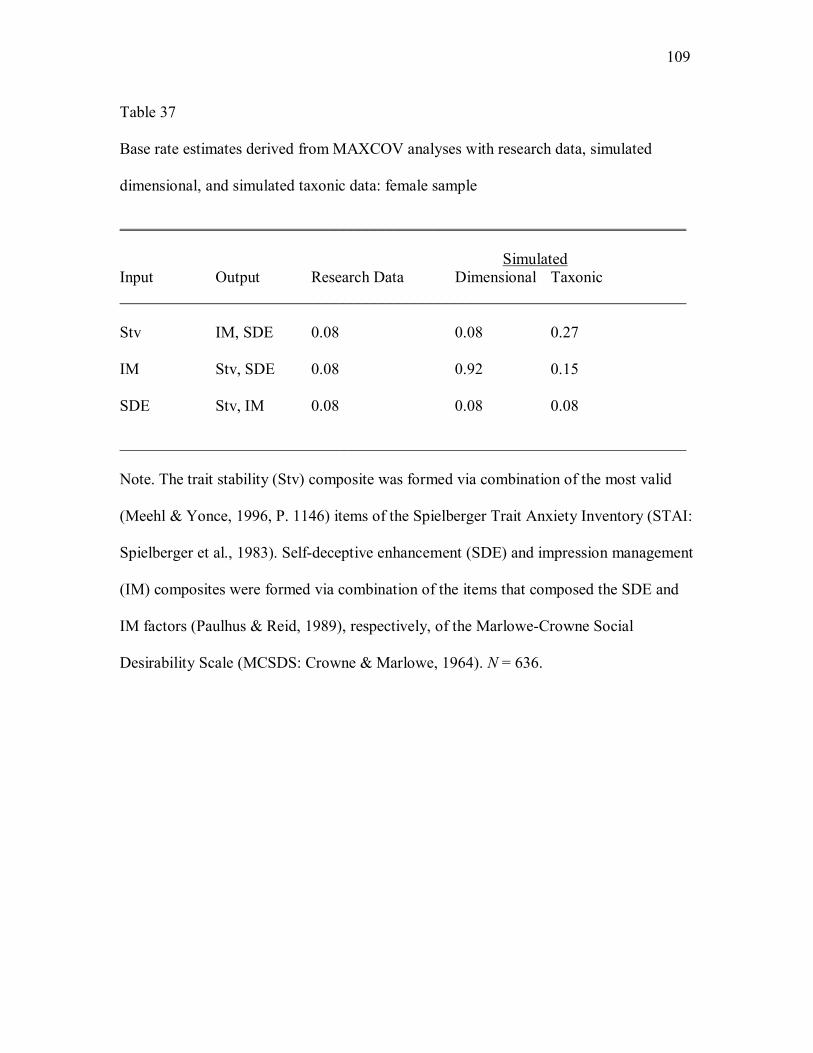
109 Table 37
Base rate estimates derived from MAXCOV analyses with research data, simulated
dimensional, and simulated taxonic data: female sample
_______________________________________________________________________
Simulated Input Output Research Data Dimensional Taxonic _______________________________________________________________________
Stv IM, SDE 0.08 0.08 0.27
IM Stv, SDE 0.08 0.92 0.15
SDE Stv, IM 0.08 0.08 0.08
_______________________________________________________________________
Note. The trait stability (Stv) composite was formed via combination of the most valid
(Meehl & Yonce, 1996, P. 1146) items of the Spielberger Trait Anxiety Inventory (STAI:
Spielberger et al., 1983). Self-deceptive enhancement (SDE) and impression management
(IM) composites were formed via combination of the items that composed the SDE and
IM factors (Paulhus & Reid, 1989), respectively, of the Marlowe-Crowne Social
Desirability Scale (MCSDS: Crowne & Marlowe, 1964). N = 636.

110
Table 38
Number of NEO-FFI items that measure each possible facet of the NEO-PI-R
neuroticism scale
_______________________________________________________________________
Anxiety 3
Angry hostility 1
Depression 4
Self-consciousness 2
Impulsiveness 0
Vulnerability 2
_______________________________________________________________________
Note. The neuroticism (N) scale of the NEO-Five Factor Inventory (NEO-FFI: Costa &
McCrae, 1992) was used to measure N and is a shortened version of the Revised NEO
Personality Inventory (NEO-PI-R: Costa & McCrae, 1992) N scale.
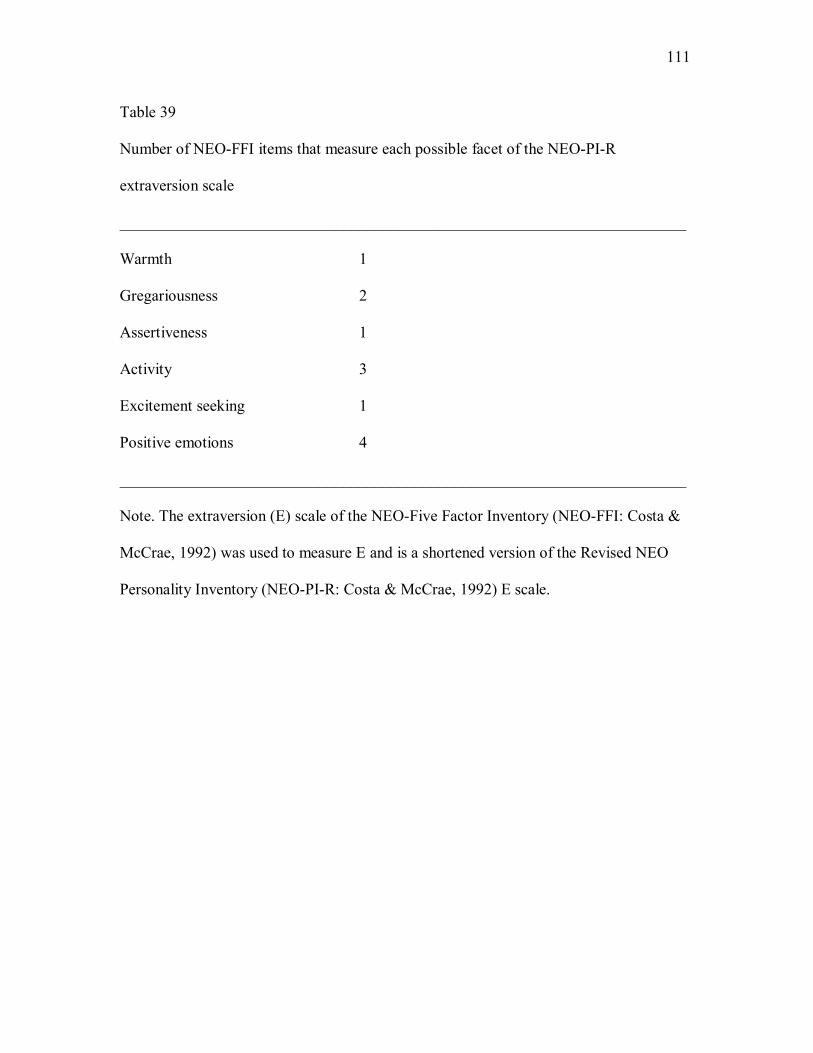
111 Table 39
Number of NEO-FFI items that measure each possible facet of the NEO-PI-R
extraversion scale
_______________________________________________________________________
Warmth 1
Gregariousness 2
Assertiveness 1
Activity 3
Excitement seeking 1
Positive emotions 4
_______________________________________________________________________
Note. The extraversion (E) scale of the NEO-Five Factor Inventory (NEO-FFI: Costa &
McCrae, 1992) was used to measure E and is a shortened version of the Revised NEO
Personality Inventory (NEO-PI-R: Costa & McCrae, 1992) E scale.

112 Table 40
Number of NEO-FFI items that measure each possible facet of the NEO-PI-R openness
scale
_______________________________________________________________________
Fantasy 1
Aesthetics 3
Feelings 1
Actions 2
Ideas 3
Values 2
_______________________________________________________________________
Note. The openness (O) scale of the NEO-Five Factor Inventory (NEO-FFI: Costa &
McCrae, 1992) was used to measure O and is a shortened version of the Revised NEO
Personality Inventory (NEO-PI-R: Costa & McCrae, 1992) O scale.

113 Table 41
Number of NEO-FFI items that measure each possible facet of the NEO-PI-R
agreeableness scale
_______________________________________________________________________
Trust 2
Straightforwardness 1
Altruism 5
Compliance 3
Modesty 0
Tender-mindedness 1
_______________________________________________________________________
Note. The agreeableness (A) scale of the NEO-Five Factor Inventory (NEO-FFI: Costa &
McCrae, 1992) was used to measure A and is a shortened version of the Revised NEO
Personality Inventory (NEO-PI-R: Costa & McCrae, 1992) A scale.

114 Table 42
Number of NEO-FFI items that measure each possible facet of the NEO-PI-R
conscientiousness scale
_______________________________________________________________________
Competence 0
Order 3
Dutifulness 3
Achievement striving 3
Self-discipline 3
Deliberation 0
_______________________________________________________________________
Note. The conscientiousness (C) scale of the NEO-Five Factor Inventory (NEO-FFI:
Costa & McCrae, 1992) was used to measure C and is a shortened version of the Revised
NEO Personality Inventory (NEO-PI-R: Costa & McCrae, 1992) C scale.
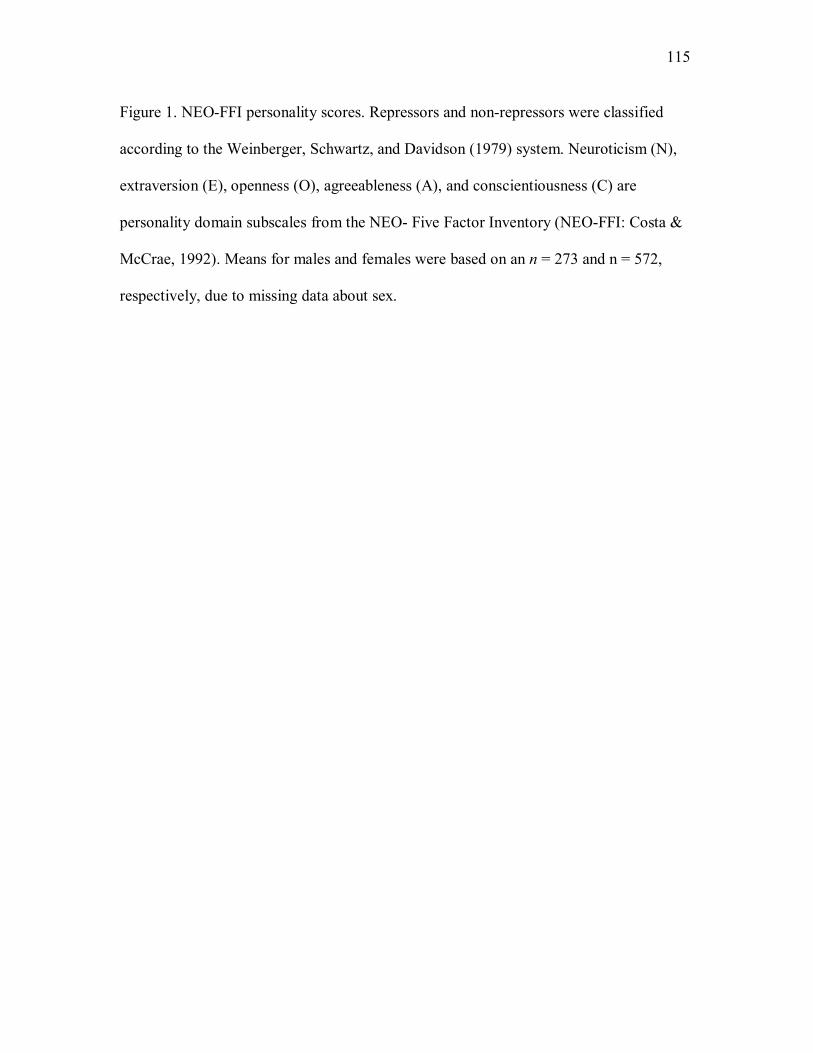
115 Figure 1. NEO-FFI personality scores. Repressors and non-repressors were classified
according to the Weinberger, Schwartz, and Davidson (1979) system. Neuroticism (N),
extraversion (E), openness (O), agreeableness (A), and conscientiousness (C) are
personality domain subscales from the NEO- Five Factor Inventory (NEO-FFI: Costa &
McCrae, 1992). Means for males and females were based on an n = 273 and n = 572,
respectively, due to missing data about sex.

116 Figure 1
0
5
10
15
20
25
30
35
40
N E O A CPersonality Domain
Non-repressor Males Non-repressor Females Repressor Males Repressor Females

117 Figure 2. Research data output derived from mean above minus below a cut (MAMBAC)
analyses conducted with defensiveness (Def) and trait stability (Stv) composite indicators
of the repressor construct. Each composite indicator (Ind) served as both the input
(plotted on abscissa) and output (plotted on ordinate) Ind. On the abscissa cases were
ordered according to standardized scores ranging from lowest to highest and 50 cuts were
made beginning and ending 25 cases from the extremes. On the ordinate the difference
between mean scores of individuals falling above and below each cut was plotted. The
Def composite (Ind 1) was formed via combination of all Marlowe-Crowne Social
Desirability Scale (MCSDS: Crowne & Marlowe, 1964) items. The Stv (Ind 2) composite
was formed via combination of the most valid items (Meehl &Yonce, 1996, p. 1146) of
the Spielberger Trait Anxiety Inventory (STAI: Spielberger et al., 1983). N = 1040.

118 Figure 2
50 Cuts Along Ind 1
Mea
n D
iff, I
nd 2
0 200 400 600 800 1000
0.7
0.9
1.1
50 Cuts Along Ind 2M
ean
Diff
, Ind
10 200 400 600 800 1000
0.7
0.9
1.1
1.3
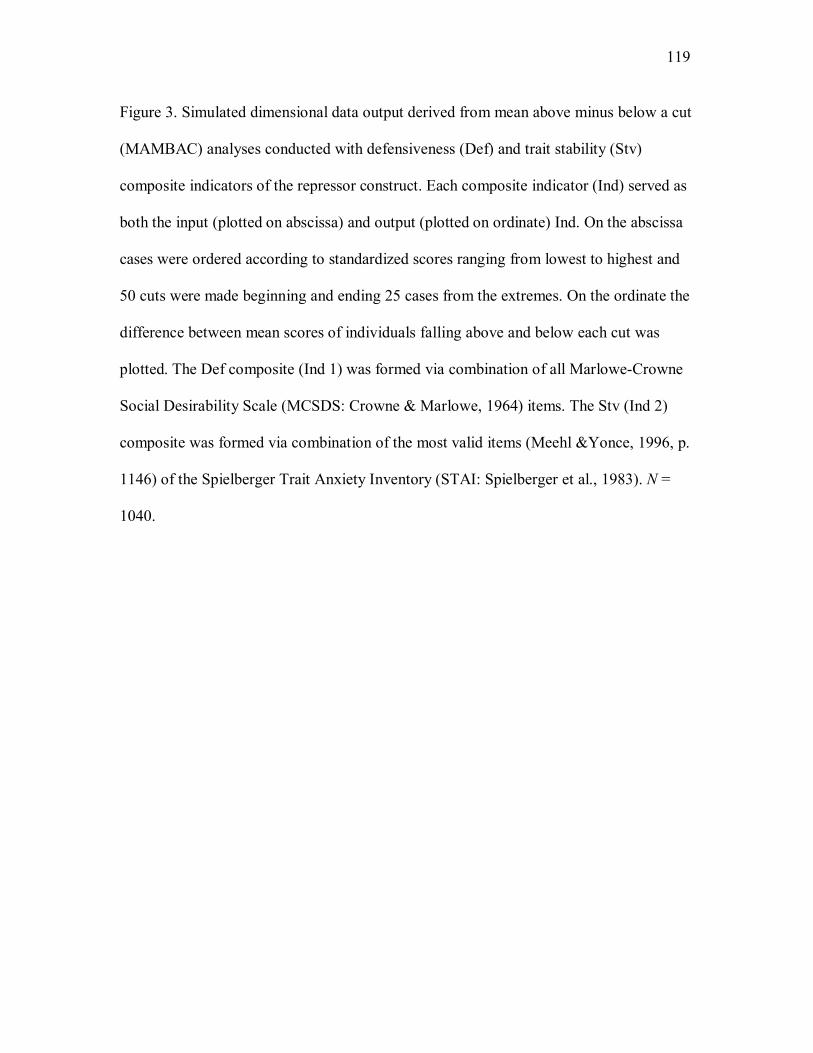
119 Figure 3. Simulated dimensional data output derived from mean above minus below a cut
(MAMBAC) analyses conducted with defensiveness (Def) and trait stability (Stv)
composite indicators of the repressor construct. Each composite indicator (Ind) served as
both the input (plotted on abscissa) and output (plotted on ordinate) Ind. On the abscissa
cases were ordered according to standardized scores ranging from lowest to highest and
50 cuts were made beginning and ending 25 cases from the extremes. On the ordinate the
difference between mean scores of individuals falling above and below each cut was
plotted. The Def composite (Ind 1) was formed via combination of all Marlowe-Crowne
Social Desirability Scale (MCSDS: Crowne & Marlowe, 1964) items. The Stv (Ind 2)
composite was formed via combination of the most valid items (Meehl &Yonce, 1996, p.
1146) of the Spielberger Trait Anxiety Inventory (STAI: Spielberger et al., 1983). N =
1040.

120 Figure 3
50 Cuts Along Ind 1
Mea
n D
iff, I
nd 2
0 200 400 600 800 1000
0.7
0.9
1.1
50 Cuts Along Ind 2
Mea
n D
iff, I
nd 1
0 200 400 600 800 1000
0.7
0.9
1.1

121 Figure 4. Simulated taxonic data output derived from mean above minus below a cut
(MAMBAC) analyses conducted with defensiveness (Def) and trait stability (Stv)
composite indicators of the repressor construct. Each composite indicator (Ind) served as
both the input (plotted on abscissa) and output (plotted on ordinate) Ind. On the abscissa
cases were ordered according to standardized scores ranging from lowest to highest and
50 cuts were made beginning and ending 25 cases from the extremes. On the ordinate the
difference between mean scores of individuals falling above and below each cut was
plotted. The Def composite (Ind 1) was formed via combination of all Marlowe-Crowne
Social Desirability Scale (MCSDS: Crowne & Marlowe, 1964) items. The Stv (Ind 2)
composite was formed via combination of the most valid items (Meehl &Yonce, 1996, p.
1146) of the Spielberger Trait Anxiety Inventory (STAI: Spielberger et al., 1983). N =
1040.

122 Figure 4
50 Cuts Along Ind 1
Mea
n D
iff, I
nd 2
0 200 400 600 800 1000
0.6
0.8
1.0
1.2
50 Cuts Along Ind 2
Mea
n D
iff, I
nd 1
0 200 400 600 800 1000
0.6
0.8
1.0
1.2
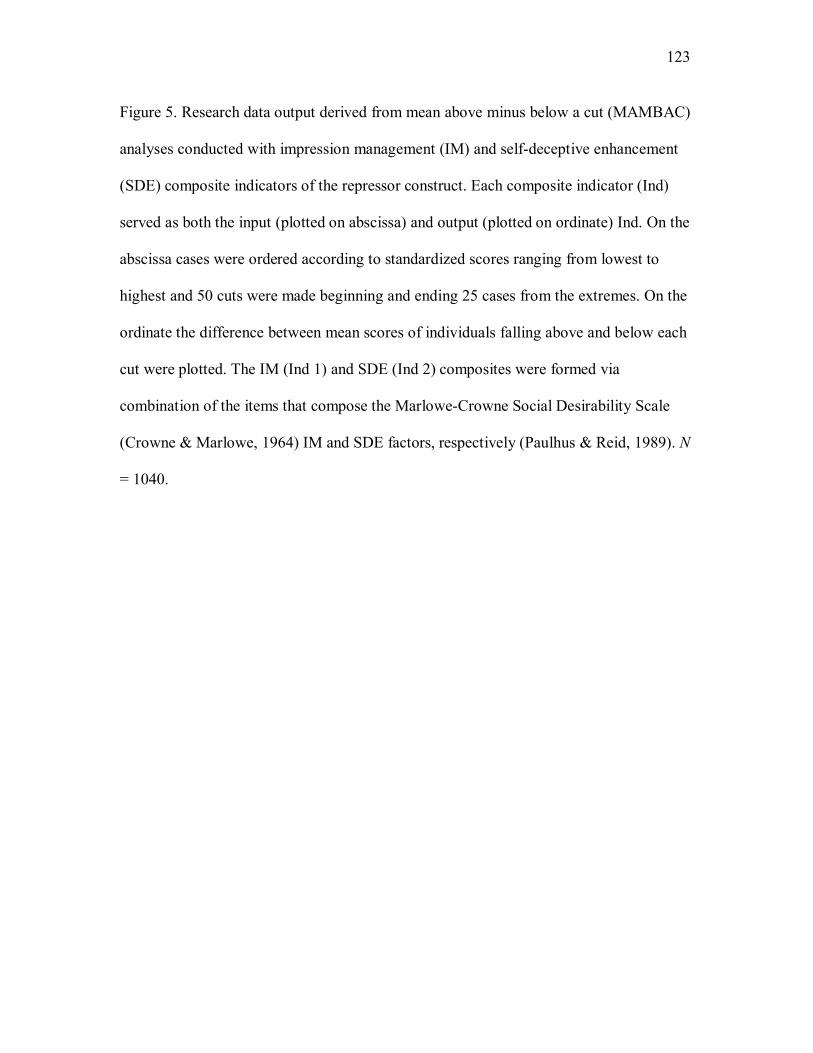
123 Figure 5. Research data output derived from mean above minus below a cut (MAMBAC)
analyses conducted with impression management (IM) and self-deceptive enhancement
(SDE) composite indicators of the repressor construct. Each composite indicator (Ind)
served as both the input (plotted on abscissa) and output (plotted on ordinate) Ind. On the
abscissa cases were ordered according to standardized scores ranging from lowest to
highest and 50 cuts were made beginning and ending 25 cases from the extremes. On the
ordinate the difference between mean scores of individuals falling above and below each
cut were plotted. The IM (Ind 1) and SDE (Ind 2) composites were formed via
combination of the items that compose the Marlowe-Crowne Social Desirability Scale
(Crowne & Marlowe, 1964) IM and SDE factors, respectively (Paulhus & Reid, 1989). N
= 1040.

124 Figure 5
50 Cuts Along Ind 1
Mea
n D
iff, I
nd 2
0 200 400 600 800 1000
1.0
1.2
1.4
1.6
50 Cuts Along Ind 2
Mea
n D
iff, I
nd 1
0 200 400 600 800 1000
0.9
1.1
1.3
1.5

125 Figure 6. Simulated dimensional data output derived from mean above minus below a cut
(MAMBAC) analyses conducted with impression management (IM) and self-deceptive
enhancement (SDE) composite indicators of the repressor construct. Each composite
indicator (Ind) served as both the input (plotted on abscissa) and output (plotted on
ordinate) Ind. On the abscissa cases were ordered according to standardized scores
ranging from lowest to highest and 50 cuts were made beginning and ending 25 cases
from the extremes. On the ordinate the difference between mean scores of individuals
falling above and below each cut were plotted. The IM (Ind 1) and SDE (Ind 2)
composites were formed via combination of the items that compose the Marlowe-Crowne
Social Desirability Scale (Crowne & Marlowe, 1964) IM and SDE factors, respectively
(Paulhus & Reid, 1989). N = 1040.

126 Figure 6
50 Cuts Along Ind 1
Mea
n D
iff, I
nd 2
0 200 400 600 800 1000
1.0
1.2
1.4
1.6
50 Cuts Along Ind 2
Mea
n D
iff, I
nd 1
0 200 400 600 800 1000
1.0
1.2
1.4
1.6

127 Figure 7. Simulated taxonic data output derived from mean above minus below a cut
(MAMBAC) analyses conducted with impression management (IM) and self-deceptive
enhancement (SDE) composite indicators of the repressor construct. Each composite
indicator (Ind) served as both the input (plotted on abscissa) and output (plotted on
ordinate) Ind. On the abscissa cases were ordered according to standardized scores
ranging from lowest to highest and 50 cuts were made beginning and ending 25 cases
from the extremes. On the ordinate the difference between mean scores of individuals
falling above and below each cut was plotted. The IM (Ind 1) and SDE (Ind 2)
composites were formed via combination of the items that compose the Marlowe-Crowne
Social Desirability Scale (Crowne & Marlowe, 1964) IM and SDE factors, respectively
(Paulhus & Reid, 1989). N = 1040.

128 Figure 7
50 Cuts Along Ind 1
Mea
n D
iff, I
nd 2
0 200 400 600 800 1000
0.9
1.1
1.3
50 Cuts Along Ind 2
Mea
n D
iff, I
nd 1
0 200 400 600 800 1000
0.8
1.0
1.2
1.4

129 Figure 8. Research data output derived from mean above minus below a cut (MAMBAC)
analyses conducted with agreeableness (Av) and self-deceptive enhancement (SDE)
composite indicators of the repressor construct. Each composite indicator (Ind) served as
both the input (plotted on abscissa) and output (plotted on ordinate) Ind. On the abscissa
cases were ordered according to standardized scores ranging from lowest to highest and
50 cuts were made beginning and ending 25 cases from the extremes. On the ordinate the
difference between mean scores of individuals falling above and below each cut was
plotted. The Av (Ind 1) composite was formed via combination of the most valid items
(Meehl & Yonce, 1996, p. 1146) on the agreeableness subscale of the NEO-Five Factor
Inventory (NEO-FFI: Costa & McCrae, 1992). The SDE (Ind 2) composite was formed
via combination of the items that compose the Marlowe-Crowne Social Desirability Scale
(Crowne & Marlowe, 1964) SDE factor (Paulhus & Reid, 1989). N = 1040.
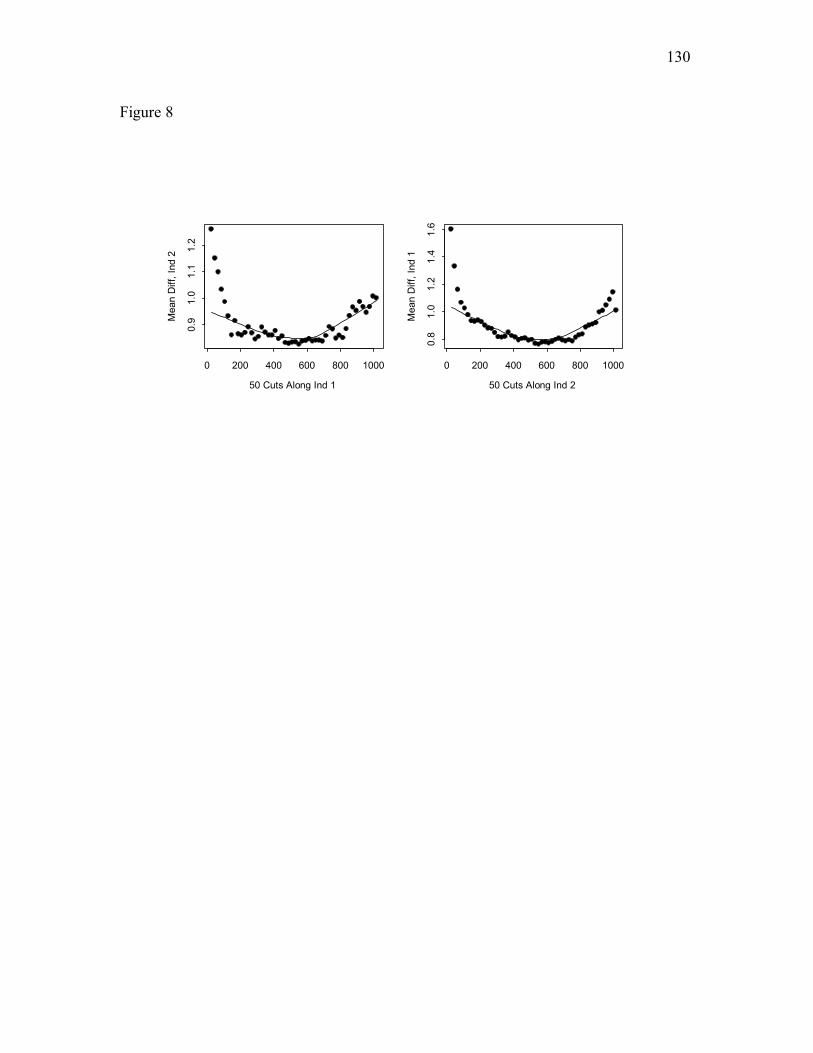
130 Figure 8
50 Cuts Along Ind 1
Mea
n D
iff, I
nd 2
0 200 400 600 800 1000
0.9
1.0
1.1
1.2
50 Cuts Along Ind 2
Mea
n D
iff, I
nd 1
0 200 400 600 800 1000
0.8
1.0
1.2
1.4
1.6
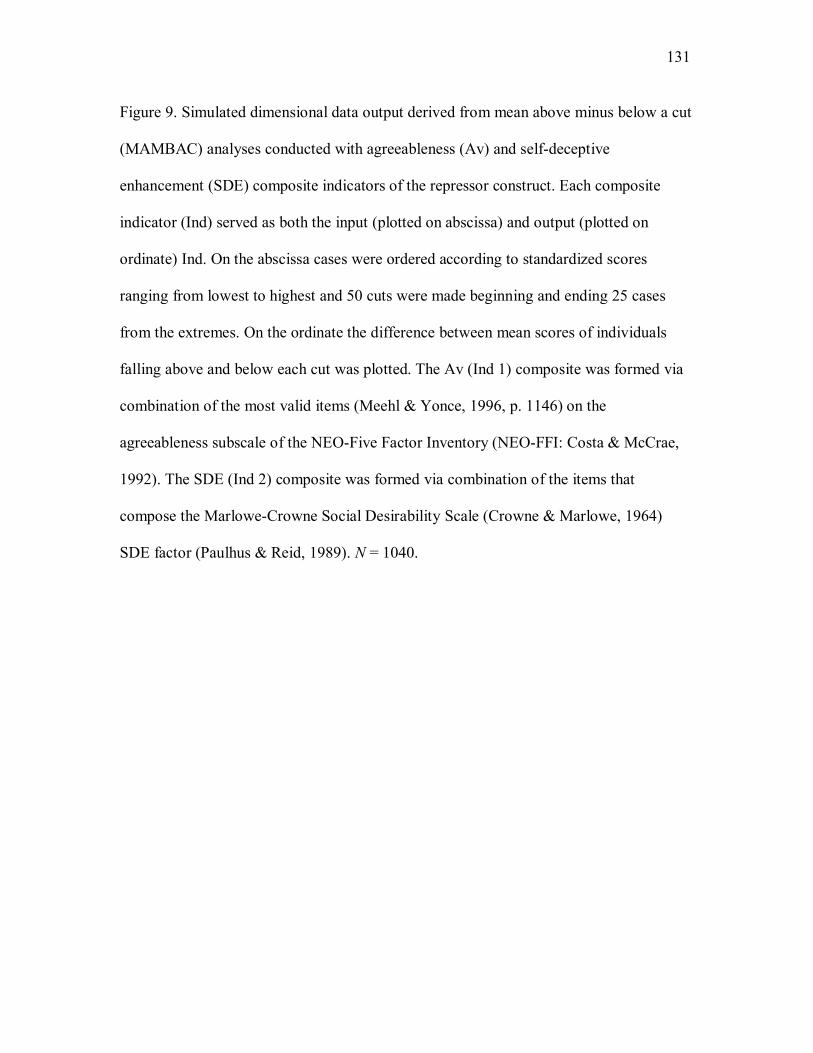
131 Figure 9. Simulated dimensional data output derived from mean above minus below a cut
(MAMBAC) analyses conducted with agreeableness (Av) and self-deceptive
enhancement (SDE) composite indicators of the repressor construct. Each composite
indicator (Ind) served as both the input (plotted on abscissa) and output (plotted on
ordinate) Ind. On the abscissa cases were ordered according to standardized scores
ranging from lowest to highest and 50 cuts were made beginning and ending 25 cases
from the extremes. On the ordinate the difference between mean scores of individuals
falling above and below each cut was plotted. The Av (Ind 1) composite was formed via
combination of the most valid items (Meehl & Yonce, 1996, p. 1146) on the
agreeableness subscale of the NEO-Five Factor Inventory (NEO-FFI: Costa & McCrae,
1992). The SDE (Ind 2) composite was formed via combination of the items that
compose the Marlowe-Crowne Social Desirability Scale (Crowne & Marlowe, 1964)
SDE factor (Paulhus & Reid, 1989). N = 1040.

132 Figure 9
50 Cuts Along Ind 1
Mea
n D
iff, I
nd 2
0 200 400 600 800 1000
0.8
1.0
1.2
1.4
50 Cuts Along Ind 2
Mea
n D
iff, I
nd 1
0 200 400 600 800 1000
0.8
0.9
1.0
1.1
1.2

133 Figure 10. Simulated taxonic data output derived from mean above minus below a cut
(MAMBAC) analyses conducted with agreeableness (Av) and self-deceptive
enhancement (SDE) composite indicators of the repressor construct. Each composite
indicator (Ind) served as both the input (plotted on abscissa) and output (plotted on
ordinate) Ind. On the abscissa cases were ordered according to standardized scores
ranging from lowest to highest and 50 cuts were made beginning and ending 25 cases
from the extremes. On the ordinate the difference between mean scores of individuals
falling above and below each cut was plotted. The Av (Ind 1) composite was formed via
combination of the most valid items (Meehl & Yonce, 1996, p. 1146) on the
agreeableness subscale of the NEO-Five Factor Inventory (NEO-FFI: Costa & McCrae,
1992). The SDE (Ind 2) composite was formed via combination of the items that
compose the Marlowe-Crowne Social Desirability Scale (Crowne & Marlowe, 1964)
SDE factor (Paulhus & Reid, 1989). N = 1040.

134 Figure 10
50 Cuts Along Ind 1
Mea
n D
iff, I
nd 2
0 200 400 600 800 1000
0.85
0.95
1.05
1.15
50 Cuts Along Ind 2
Mea
n D
iff, I
nd 1
0 200 400 600 800 1000
0.8
1.0
1.2
1.4

135 Figure 11. Research data output derived from mean above minus below a cut
(MAMBAC) analyses conducted with trait stability (Stv) and impression management
(IM) composite indicators of the repressor construct. Each composite indicator (Ind)
served as both the input (plotted on abscissa) and output (plotted on ordinate) Ind. On the
abscissa cases were ordered according to standardized scores ranging from lowest to
highest and 50 cuts were made beginning and ending 25 cases from the extremes. On the
ordinate the difference between mean scores of individuals falling above and below each
cut was plotted. The stv (Ind 2) composite was formed via combination of the most valid
items (Meehl &Yonce, 1996, p. 1146) of the Spielberger Trait Anxiety Inventory (STAI:
Spielberger et al., 1983). The IM (Ind 2) composite was formed via combination of the
items that compose the Marlowe-Crowne Social Desirability Scale (Crowne & Marlowe,
1964) IM factor (Paulhus & Reid, 1989). N = 1040.

136 Figure 11
50 Cuts Along Ind 1
Mea
n D
iff, I
nd 2
0 200 400 600 800 1000
0.0
0.2
0.4
0.6
0.8
50 Cuts Along Ind 2
Mea
n D
iff, I
nd 1
0 200 400 600 800 1000
0.4
0.6
0.8

137 Figure 12. Simulated dimensional data output derived from mean above minus below a
cut (MAMBAC) analyses conducted with trait stability (Stv) and impression management
(IM) composite indicators of the repressor construct. Each composite indicator (Ind)
served as both the input (plotted on abscissa) and output (plotted on ordinate) Ind. On the
abscissa cases were ordered according to standardized scores ranging from lowest to
highest and 50 cuts were made beginning and ending 25 cases from the extremes. On the
ordinate the difference between mean scores of individuals falling above and below each
cut was plotted. The stv (Ind 2) composite was formed via combination of the most valid
items (Meehl &Yonce, 1996, p. 1146) of the Spielberger Trait Anxiety Inventory (STAI:
Spielberger et al., 1983). The IM (Ind 2) composite was formed via combination of the
items that compose the Marlowe-Crowne Social Desirability Scale (Crowne & Marlowe,
1964) IM factor (Paulhus & Reid, 1989). N = 1040.
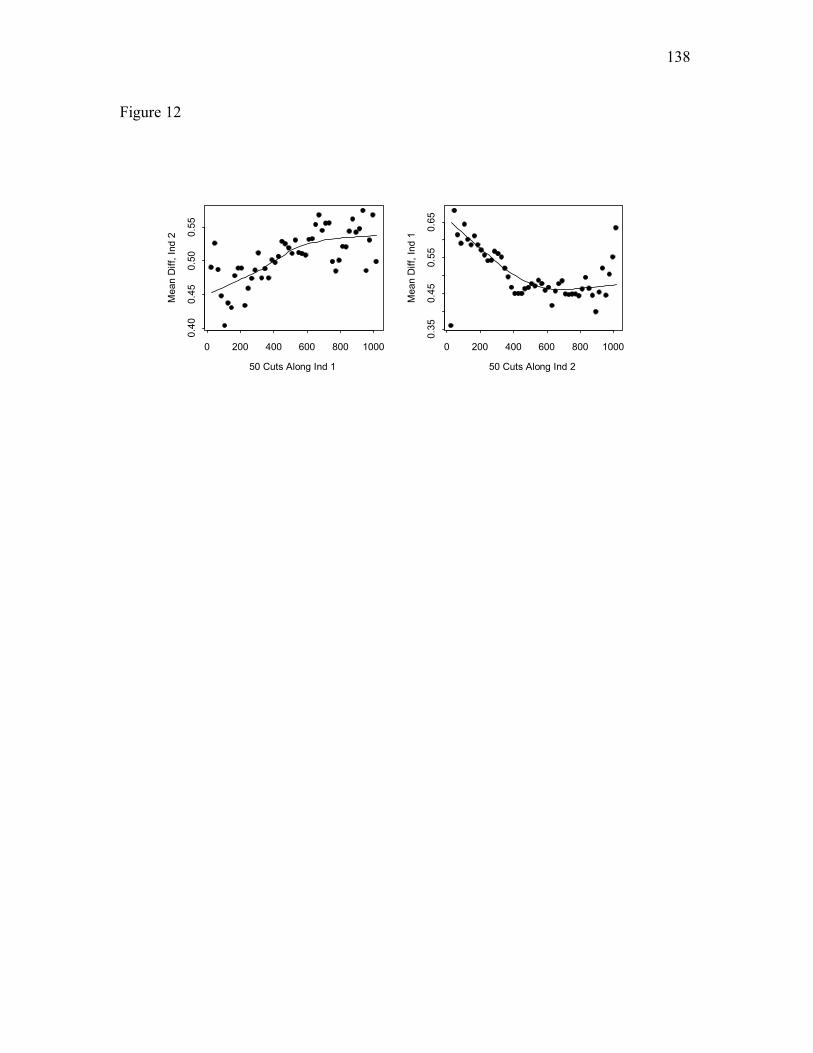
138 Figure 12
50 Cuts Along Ind 1
Mea
n D
iff, I
nd 2
0 200 400 600 800 1000
0.40
0.45
0.50
0.55
50 Cuts Along Ind 2
Mea
n D
iff, I
nd 1
0 200 400 600 800 1000
0.35
0.45
0.55
0.65

139 Figure 13. Simulated taxonic data output derived from mean above minus below a cut
(MAMBAC) analyses conducted with trait stability (Stv) and impression management
(IM) composite indicators of the repressor construct. Each composite indicator (Ind)
served as both the input (plotted on abscissa) and output (plotted on ordinate) Ind. On the
abscissa cases were ordered according to standardized scores ranging from lowest to
highest and 50 cuts were made beginning and ending 25 cases from the extremes. On the
ordinate the difference between mean scores of individuals falling above and below each
cut was plotted. The stv (Ind 2) composite was formed via combination of the most valid
items (Meehl &Yonce, 1996, p. 1146) of the Spielberger Trait Anxiety Inventory (STAI:
Spielberger et al., 1983). The IM (Ind 2) composite was formed via combination of the
items that compose the Marlowe-Crowne Social Desirability Scale (Crowne & Marlowe,
1964) IM factor (Paulhus & Reid, 1989). N = 1040.

140 Figure 13
50 Cuts Along Ind 1
Mea
n D
iff, I
nd 2
0 200 400 600 800 1000
0.2
0.6
1.0
50 Cuts Along Ind 2
Mea
n D
iff, I
nd 1
0 200 400 600 800 1000
0.3
0.5
0.7
0.9

141 Figure 14. Research data output derived from mean above minus below a cut
(MAMBAC) analyses conducted with trait stability (Sv) and impression management
(IM) composite indicators of the repressor construct. Each composite indicator (Ind)
served as both the input (plotted on abscissa) and output (plotted on ordinate) Ind. On the
abscissa cases were ordered according to standardized scores ranging from lowest to
highest and 50 cuts were made beginning and ending 25 cases from the extremes. On the
ordinate the difference between mean scores of individuals falling above and below each
cut was plotted. The Sv (Ind 1) composite was formed via combination of the most valid
items (Meehl &Yonce, 1996, p. 1146) of the NEO-Five Factor Inventory (Costa &
McCrae, 1992) trait stability subscale. The IM (Ind 2) composite was formed via
combination of the items that compose the Marlowe-Crowne Social Desirability Scale
(Crowne & Marlowe, 1964) IM factor (Paulhus & Reid, 1989). N = 1040.

142 Figure 14
50 Cuts Along Ind 1
Mea
n D
iff, I
nd 2
0 200 400 600 800 1000
0.2
0.4
0.6
50 Cuts Along Ind 2
Mea
n D
iff, I
nd 1
0 200 400 600 800 10000.
40.
60.
8

143 Figure 15. Simulated dimensional data output derived from mean above minus below a
cut (MAMBAC) analyses conducted with trait stability (Sv) and impression management
(IM) composite indicators of the repressor construct. Each composite indicator (Ind)
served as both the input (plotted on abscissa) and output (plotted on ordinate) Ind. On the
abscissa cases were ordered according to standardized scores ranging from lowest to
highest and 50 cuts were made beginning and ending 25 cases from the extremes. On the
ordinate the difference between mean scores of individuals falling above and below each
cut was plotted. The Sv (Ind 1) composite was formed via combination of the most valid
items (Meehl &Yonce, 1996, p. 1146) of the NEO-Five Factor Inventory (Costa &
McCrae, 1992) trait stability subscale. The IM (Ind 2) composite was formed via
combination of the items that compose the Marlowe-Crowne Social Desirability Scale
(Crowne & Marlowe, 1964) IM factor (Paulhus & Reid, 1989). N = 1040.

144 Figure 15
50 Cuts Along Ind 1
Mea
n D
iff, I
nd 2
0 200 400 600 800 1000
0.3
0.4
0.5
0.6
0.7
50 Cuts Along Ind 2
Mea
n D
iff, I
nd 1
0 200 400 600 800 1000
0.4
0.5
0.6
0.7

145 Figure 16. Simulated taxonic data output derived from mean above minus below a cut
(MAMBAC) analyses conducted with trait stability (Sv) and impression management
(IM) composite indicators of the repressor construct. Each composite indicator (Ind)
served as both the input (plotted on abscissa) and output (plotted on ordinate) Ind. On the
abscissa cases were ordered according to standardized scores ranging from lowest to
highest and 50 cuts were made beginning and ending 25 cases from the extremes. On the
ordinate the difference between mean scores of individuals falling above and below each
cut was plotted. The Sv (Ind 1) composite was formed via combination of the most valid
items (Meehl &Yonce, 1996, p. 1146) of the NEO-Five Factor Inventory (Costa &
McCrae, 1992) trait stability subscale. The IM (Ind 2) composite was formed via
combination of the items that compose the Marlowe-Crowne Social Desirability Scale
(Crowne & Marlowe, 1964) IM factor (Paulhus & Reid, 1989). N = 1040.

146 Figure 16
50 Cuts Along Ind 1
Mea
n D
iff, I
nd 2
0 200 400 600 800 1000
0.3
0.5
0.7
50 Cuts Along Ind 2
Mea
n D
iff, I
nd 1
0 200 400 600 800 1000
0.3
0.5
0.7
0.9

147 Figure 17. Research data output derived from mean above minus below a cut
(MAMBAC) analyses conducted with agreeableness (Av) and impression management
(IM) composite indicators of the repressor construct. Each composite indicator (Ind)
served as both the input (plotted on abscissa) and output (plotted on ordinate) Ind. On the
abscissa cases were ordered according to standardized scores ranging from lowest to
highest and 50 cuts were made beginning and ending 25 cases from the extremes. On the
ordinate the difference between mean scores of individuals falling above and below each
cut was plotted. The Sv (Ind 1) composite was formed via combination of the most valid
items (Meehl &Yonce, 1996, p. 1146) of the NEO-Five Factor Inventory (Costa &
McCrae, 1992) agreeableness subscale. The IM (Ind 2) composite was formed via
combination of the items that compose the Marlowe-Crowne Social Desirability Scale
(Crowne & Marlowe, 1964) IM factor (Paulhus & Reid, 1989). N = 1040.

148 Figure 17
50 Cuts Along Ind 1
Mea
n D
iff, I
nd 2
0 200 400 600 800 1000
0.8
0.9
1.0
1.1
1.2
50 Cuts Along Ind 2
Mea
n D
iff, I
nd 1
0 200 400 600 800 10000.
81.
01.
2

149 Figure 18. Simulated dimensional data output derived from mean above minus below a
cut (MAMBAC) analyses conducted with agreeableness (Av) and impression
management (IM) composite indicators of the repressor construct. Each composite
indicator (Ind) served as both the input (plotted on abscissa) and output (plotted on
ordinate) Ind. On the abscissa cases were ordered according to standardized scores
ranging from lowest to highest and 50 cuts were made beginning and ending 25 cases
from the extremes. On the ordinate the difference between mean scores of individuals
falling above and below each cut was plotted. The Sv (Ind 1) composite was formed via
combination of the most valid items (Meehl &Yonce, 1996, p. 1146) of the NEO-Five
Factor Inventory (Costa & McCrae, 1992) agreeableness subscale. The IM (Ind 2)
composite was formed via combination of the items that compose the Marlowe-Crowne
Social Desirability Scale (Crowne & Marlowe, 1964) IM factor (Paulhus & Reid, 1989).
N = 1040.

150 Figure 18
50 Cuts Along Ind 1
Mea
n D
iff, I
nd 2
0 200 400 600 800 1000
0.8
1.0
1.2
50 Cuts Along Ind 2
Mea
n D
iff, I
nd 1
0 200 400 600 800 1000
0.8
1.0
1.2
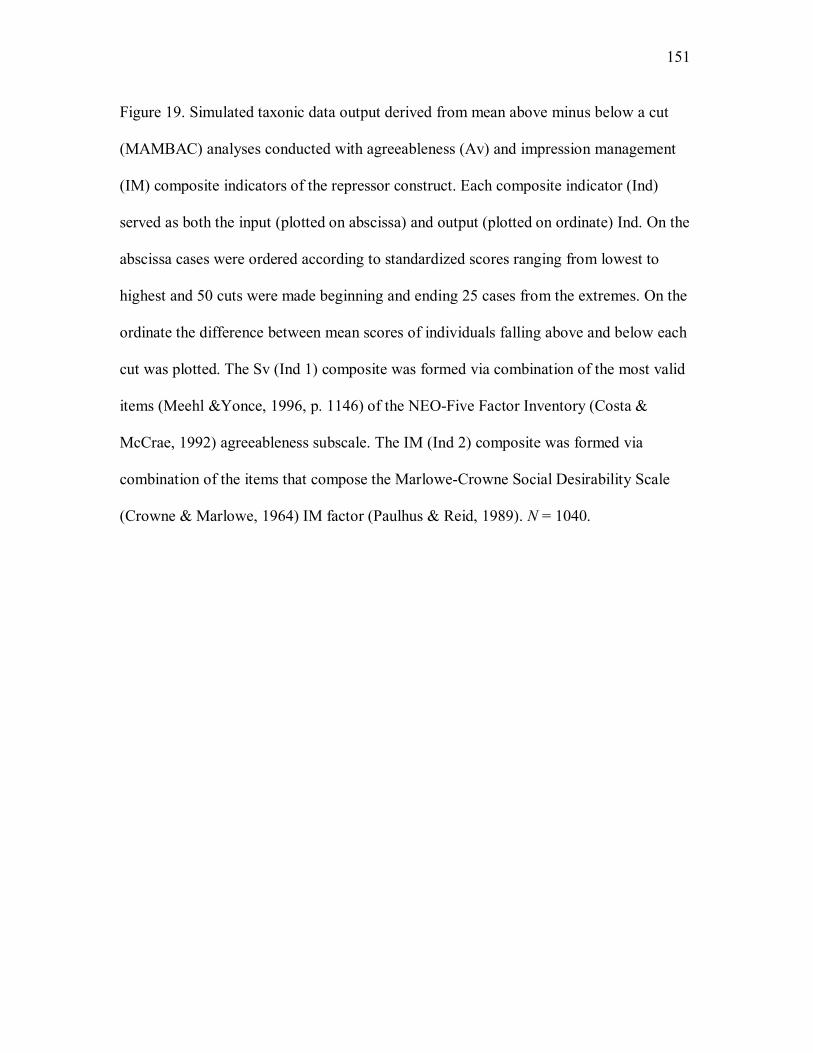
151 Figure 19. Simulated taxonic data output derived from mean above minus below a cut
(MAMBAC) analyses conducted with agreeableness (Av) and impression management
(IM) composite indicators of the repressor construct. Each composite indicator (Ind)
served as both the input (plotted on abscissa) and output (plotted on ordinate) Ind. On the
abscissa cases were ordered according to standardized scores ranging from lowest to
highest and 50 cuts were made beginning and ending 25 cases from the extremes. On the
ordinate the difference between mean scores of individuals falling above and below each
cut was plotted. The Sv (Ind 1) composite was formed via combination of the most valid
items (Meehl &Yonce, 1996, p. 1146) of the NEO-Five Factor Inventory (Costa &
McCrae, 1992) agreeableness subscale. The IM (Ind 2) composite was formed via
combination of the items that compose the Marlowe-Crowne Social Desirability Scale
(Crowne & Marlowe, 1964) IM factor (Paulhus & Reid, 1989). N = 1040.

152 Figure 19
50 Cuts Along Ind 1
Mea
n D
iff, I
nd 2
0 200 400 600 800 1000
0.8
0.9
1.0
1.1
1.2
50 Cuts Along Ind 2
Mea
n D
iff, I
nd 1
0 200 400 600 800 1000
0.8
1.0
1.2

153 Figure 20. Research data output derived from mean above minus below a cut
(MAMBAC) analyses conducted with trait stability (St) and agreeableness (Av)
composite indicators of the repressor construct. Each composite indicator (Ind) served as
both the input (plotted on abscissa) and output (plotted on ordinate) Ind. On the abscissa
cases were ordered according to standardized scores ranging from lowest to highest and
50 cuts were made beginning and ending 25 cases from the extremes. On the ordinate the
difference between mean scores of individuals falling above and below each cut was
plotted. The St (Ind 1) composite was formed via combination of the most valid items
(Meehl &Yonce, 1996, p. 1146) of the Spielberger Trait Anxiety Inventory (STAI:
Spielberger et al., 1983). The Av (Ind 2) composite was formed via combination of the
most valid items of the NEO-Five Factor Inventory (Costa & McCrae, 1992)
agreeableness subscale. N = 1040.

154 Figure 20
50 Cuts Along Ind 1
Mea
n D
iff, I
nd 2
0 200 400 600 800 1000
0.65
0.75
0.85
0.95
50 Cuts Along Ind 2M
ean
Diff
, Ind
10 200 400 600 800 1000
0.70
0.80
0.90

155 Figure 21. Simulated dimensional data output derived from mean above minus below a
cut (MAMBAC) analyses conducted with trait stability (St) and agreeableness (Av)
composite indicators of the repressor construct. Each composite indicator (Ind) served as
both the input (plotted on abscissa) and output (plotted on ordinate) Ind. On the abscissa
cases were ordered according to standardized scores ranging from lowest to highest and
50 cuts were made beginning and ending 25 cases from the extremes. On the ordinate the
difference between mean scores of individuals falling above and below each cut was
plotted. The St (Ind 1) composite was formed via combination of the most valid items
(Meehl &Yonce, 1996, p. 1146) of the Spielberger Trait Anxiety Inventory (STAI:
Spielberger et al., 1983). The Av (Ind 2) composite was formed via combination of the
most valid items of the NEO-Five Factor Inventory (Costa & McCrae, 1992)
agreeableness subscale. N = 1040.

156 Figure 21
50 Cuts Along Ind 1
Mea
n D
iff, I
nd 2
0 200 400 600 800 1000
0.7
0.8
0.9
1.0
1.1
50 Cuts Along Ind 2
Mea
n D
iff, I
nd 1
0 200 400 600 800 1000
0.7
0.9
1.1

157 Figure 22. Simulated taxonic data output derived from mean above minus below a cut
(MAMBAC) analyses conducted with trait stability (St) and agreeableness (Av)
composite indicators of the repressor construct. Each composite indicator (Ind) served as
both the input (plotted on abscissa) and output (plotted on ordinate) Ind. On the abscissa
cases were ordered according to standardized scores ranging from lowest to highest and
50 cuts were made beginning and ending 25 cases from the extremes. On the ordinate the
difference between mean scores of individuals falling above and below each cut was
plotted. The St (Ind 1) composite was formed via combination of the most valid items
(Meehl &Yonce, 1996, p. 1146) of the Spielberger Trait Anxiety Inventory (STAI:
Spielberger et al., 1983). The Av (Ind 2) composite was formed via combination of the
most valid items of the NEO-Five Factor Inventory (Costa & McCrae, 1992)
agreeableness subscale. N = 1040.

158 Figure 22
50 Cuts Along Ind 1
Mea
n D
iff, I
nd 2
0 200 400 600 800 1000
0.6
0.8
1.0
1.2
50 Cuts Along Ind 2
Mea
n D
iff, I
nd 1
0 200 400 600 800 1000
0.6
0.8
1.0
1.2

159 Figure 23. Research data output derived from mean above minus below a cut
(MAMBAC) analyses conducted with trait stability (Sv) and agreeableness (Av)
composite indicators of the repressor construct. Each composite indicator (Ind) served as
both the input (plotted on abscissa) and output (plotted on ordinate) Ind. On the abscissa
cases were ordered according to standardized scores ranging from lowest to highest and
50 cuts were made beginning and ending 25 cases from the extremes. On the ordinate the
difference between mean scores of individuals falling above and below each cut was
plotted. The Sv (Ind 1) and Av (Ind 2) composites were formed via combination of the
most valid items (Meehl &Yonce, 1996, p. 1146) of the NEO-Five Factor Inventory
(Costa & McCrae, 1992) stability and agreeableness subscales, respectively. N = 1040.
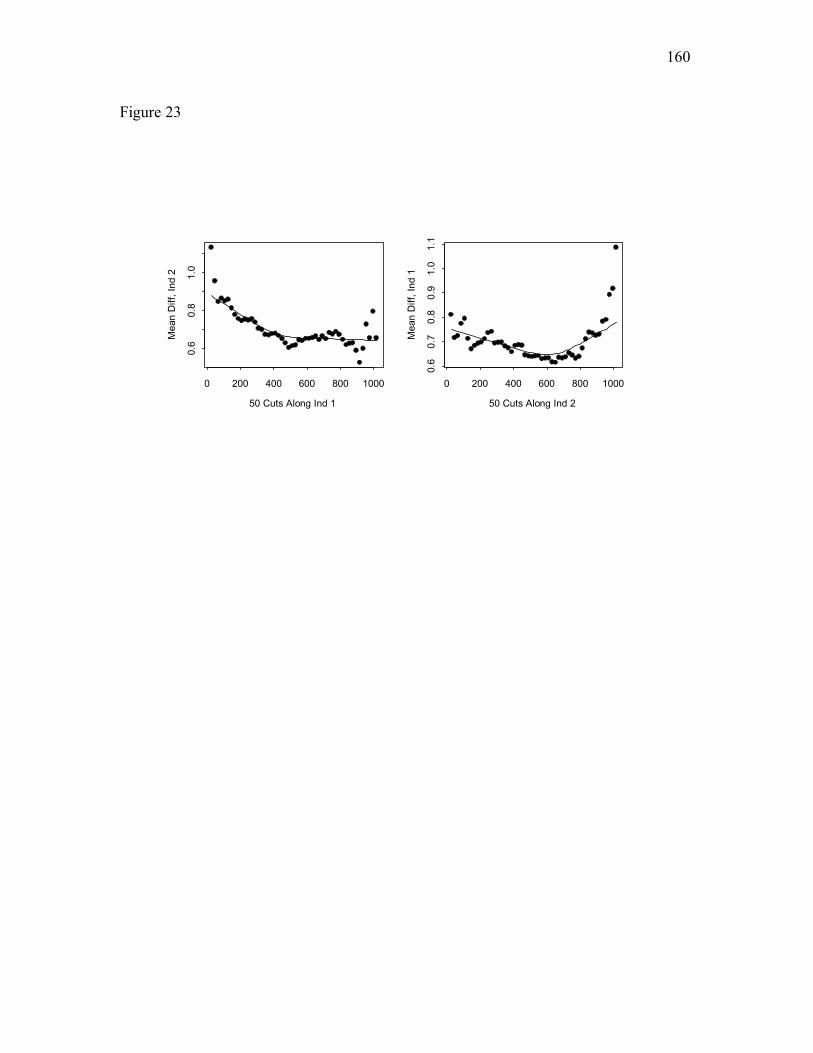
160 Figure 23
50 Cuts Along Ind 1
Mea
n D
iff, I
nd 2
0 200 400 600 800 1000
0.6
0.8
1.0
50 Cuts Along Ind 2M
ean
Diff
, Ind
1
0 200 400 600 800 1000
0.6
0.7
0.8
0.9
1.0
1.1
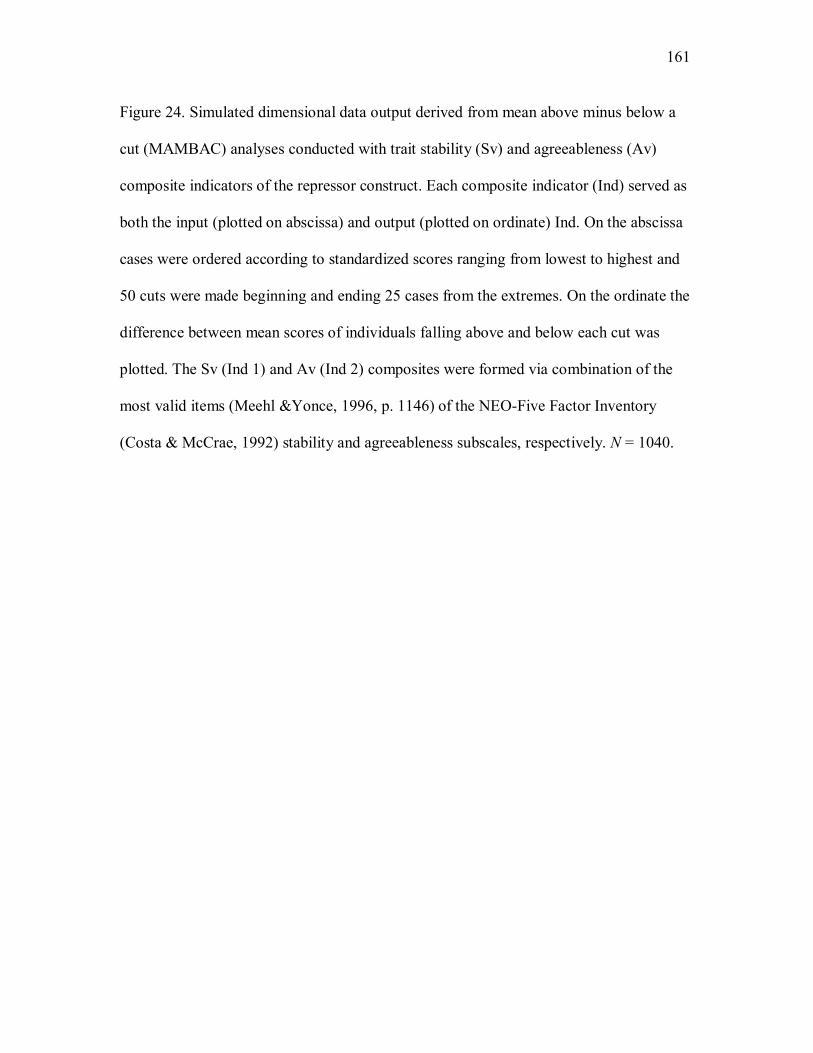
161 Figure 24. Simulated dimensional data output derived from mean above minus below a
cut (MAMBAC) analyses conducted with trait stability (Sv) and agreeableness (Av)
composite indicators of the repressor construct. Each composite indicator (Ind) served as
both the input (plotted on abscissa) and output (plotted on ordinate) Ind. On the abscissa
cases were ordered according to standardized scores ranging from lowest to highest and
50 cuts were made beginning and ending 25 cases from the extremes. On the ordinate the
difference between mean scores of individuals falling above and below each cut was
plotted. The Sv (Ind 1) and Av (Ind 2) composites were formed via combination of the
most valid items (Meehl &Yonce, 1996, p. 1146) of the NEO-Five Factor Inventory
(Costa & McCrae, 1992) stability and agreeableness subscales, respectively. N = 1040.

162 Figure 24
50 Cuts Along Ind 1
Mea
n D
iff, I
nd 2
0 200 400 600 800 1000
0.7
0.8
0.9
1.0
50 Cuts Along Ind 2
Mea
n D
iff, I
nd 1
0 200 400 600 800 1000
0.65
0.70
0.75
0.80
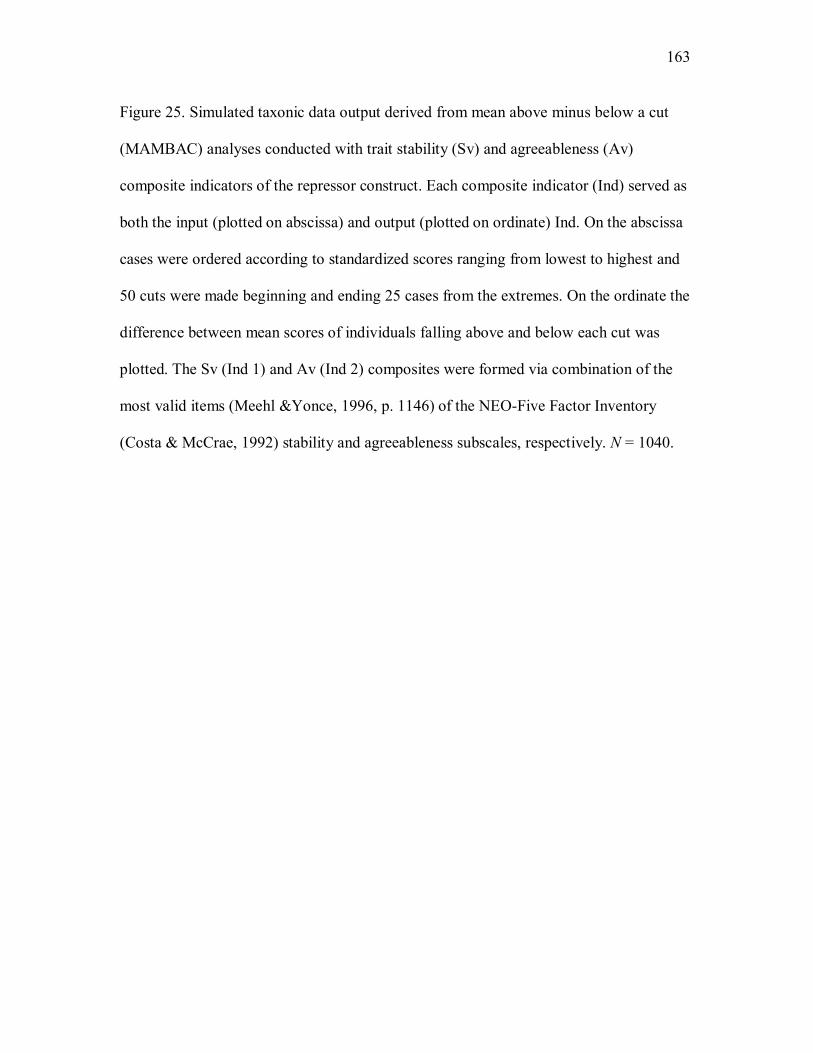
163 Figure 25. Simulated taxonic data output derived from mean above minus below a cut
(MAMBAC) analyses conducted with trait stability (Sv) and agreeableness (Av)
composite indicators of the repressor construct. Each composite indicator (Ind) served as
both the input (plotted on abscissa) and output (plotted on ordinate) Ind. On the abscissa
cases were ordered according to standardized scores ranging from lowest to highest and
50 cuts were made beginning and ending 25 cases from the extremes. On the ordinate the
difference between mean scores of individuals falling above and below each cut was
plotted. The Sv (Ind 1) and Av (Ind 2) composites were formed via combination of the
most valid items (Meehl &Yonce, 1996, p. 1146) of the NEO-Five Factor Inventory
(Costa & McCrae, 1992) stability and agreeableness subscales, respectively. N = 1040.
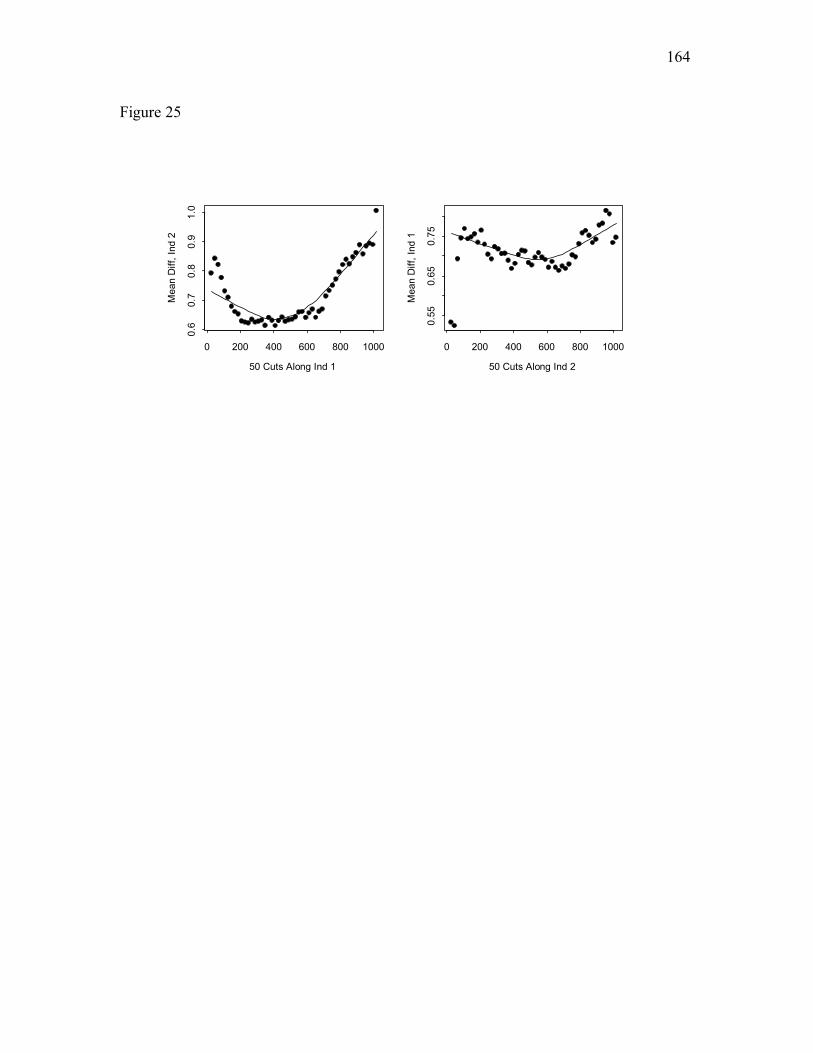
164 Figure 25
50 Cuts Along Ind 1
Mea
n D
iff, I
nd 2
0 200 400 600 800 1000
0.6
0.7
0.8
0.9
1.0
50 Cuts Along Ind 2
Mea
n D
iff, I
nd 1
0 200 400 600 800 1000
0.55
0.65
0.75

165 Figure 26. Research data output derived from maximum covariance (MAXCOV)
analyses conducted with trait stability (Stv), impression management (IM), and self-
deceptive enhancement (SDE) composite indicators of the repressor construct. Each
composite indicator (Ind) served as both the input (plotted on abscissa) and output
(plotted on ordinate) Ind. On the abscissa cases were ordered according to standardized
scores ranging from lowest to highest and 50 cuts were made beginning and ending 25
cases from the extremes. On the ordinate the eigen value, or degree of interindicator
association, within each cut was plotted. The stv (Ind 1) composite was formed via
combination of the most valid items (Meehl &Yonce, 1996, p. 1146) of the Spielberger
Trait Anxiety Inventory (STAI: Spielberger et al., 1983). The IM (Ind 2) and SDE (Ind 3)
composites were formed via combination of the items that compose the Marlowe-Crowne
Social Desirability Scale (Crowne & Marlowe, 1964) IM and SDE factors, respectively
(Paulhus & Reid, 1989). N = 1040.

166 Figure 26
50 Windows, Ind 1
Eig
enva
lue,
Ind
2 an
d 3
-1.5 -0.5 0.0 0.5 1.0 1.5
0.0
0.5
1.0
1.5
2.0
50 Windows, Ind 2
Eig
enva
lue,
Ind
1 an
d 3
-1.5 -0.5 0.0 0.5 1.0 1.5
0.0
0.4
0.8
1.2
50 Windows, Ind 3
Eige
nval
ue, I
nd 1
and
2
-1.5 -0.5 0.0 0.5 1.0 1.5
0.0
0.05
0.10
0.15

167 Figure 27. Simulated dimensional data Research data output derived from maximum
covariance (MAXCOV) analyses conducted with trait stability (Stv), impression
management (IM), and self-deceptive enhancement (SDE) composite indicators of the
repressor construct. Each composite indicator (Ind) served as both the input (plotted on
abscissa) and output (plotted on ordinate) Ind. On the abscissa cases were ordered
according to standardized scores ranging from lowest to highest and 50 cuts were made
beginning and ending 25 cases from the extremes. On the ordinate the eigen value, or
degree of interindicator association, within each cut was plotted. The stv (Ind 1)
composite was formed via combination of the most valid items (Meehl &Yonce, 1996, p.
1146) of the Spielberger Trait Anxiety Inventory (STAI: Spielberger et al., 1983). The
IM (Ind 2) and SDE (Ind 3) composites were formed via combination of the items that
compose the Marlowe-Crowne Social Desirability Scale (Crowne & Marlowe, 1964) IM
and SDE factors, respectively (Paulhus & Reid, 1989). N = 1040.

168 Figure 27
50 Windows, Ind 1
Eig
enva
lue,
Ind
2 an
d 3
-1.5 -0.5 0.0 0.5 1.0 1.5
0.0
0.5
1.0
1.5
2.0
50 Windows, Ind 2
Eige
nval
ue, I
nd 1
and
3
-1.5 -0.5 0.0 0.5 1.0 1.5
0.0
0.5
1.0
1.5
50 Windows, Ind 3
Eige
nval
ue, I
nd 1
and
2
-1.5 -0.5 0.0 0.5 1.0 1.5
0.0
0.04
0.08
0.12

169 Figure 28. Simulated taxonic data output derived from maximum covariance
(MAXCOV) analyses conducted with trait stability (Stv), impression management (IM),
and self-deceptive enhancement (SDE) composite indicators of the repressor construct.
Each composite indicator (Ind) served as both the input (plotted on abscissa) and output
(plotted on ordinate) Ind. On the abscissa cases were ordered according to standardized
scores ranging from lowest to highest and 50 cuts were made beginning and ending 25
cases from the extremes. On the ordinate the eigen value, or degree of interindicator
association, within each cut was plotted. The stv (Ind 2) composite was formed via
combination of the most valid items (Meehl &Yonce, 1996, p. 1146) of the Spielberger
Trait Anxiety Inventory (STAI: Spielberger et al., 1983). The IM (Ind 2) and SDE (Ind 3)
composites were formed via combination of the items that compose the Marlowe-Crowne
Social Desirability Scale (Crowne & Marlowe, 1964) IM and SDE factors, respectively
(Paulhus & Reid, 1989). N = 1040.

170 Figure 28
50 Windows, Ind 1
Eig
enva
lue,
Ind
2 an
d 3
-1.5 -0.5 0.0 0.5 1.0 1.5
0.0
0.4
0.8
50 Windows, Ind 2
Eige
nval
ue, I
nd 1
and
3
-1.5 -0.5 0.0 0.5 1.0 1.5
0.0
0.2
0.4
0.6
0.8
50 Windows, Ind 3
Eige
nval
ue, I
nd 1
and
2
-1.5 -0.5 0.0 0.5 1.0 1.5
0.0
0.05
0.15

171
References
Ambrosini, P., Bennett, D., Cleland, C., & Haslam, N. (in press). Taxonicity of
adolescent melancholia. Journal of Psychiatric research.
Arnau, R.C., Green, B.A., Rosen, D.H., Gleaves, D.H., & Melancon, J.G. (in press). Are
Jungian preferences really categorical? An empirical investigation using
taxometric analysis. Personality and Individual Differences.
Asendorpf, J.B. & Scherer, K.R. (1983). The discrepant repressor: Differentiation
between low anxiety, high anxiety, and repression of anxiety by autonomic-facial-
verbal patterns of behavior. Journal of Personality and Social Psychology, 45,
1334-1346.
American Psychiatric Association (1994). Diagnostic and Statistical Manual of Mental
Disorders, Fourth Edition. Washington, DC: Author.
Barger, S.D., Kircher, J.C., & Croyle, R.T. (1997). The effects of social context and
defensiveness on the physiological responses of repressive copers. Journal of
Personality and Social Psychology, 73, 1118-1128.
Barlow, D.H. (2001). Anxiety and its disorders (2nd ed.). New York: Guilford Press.
Baumeister, R.F. & Cairns, K.J. (1992). Repression and self-presentation: When
audiences interfere with self-deceptive strategies. Journal of Personality and
Social Psychology, 62, 851-862.
Benjamin, L.S. (1996). Interpersonal diagnosis and treatment of personality disorders
(2nd ed.). New York: The Guilford Press.

172 Benjamins, C., Schuurs, A.H.B., & Hoogstraten, J. (1994). Skin conductance,
Marlowe-Crowne defensiveness, and dental anxiety. Perceptual and Motor Skills,
79, 611-622.
Blanchard, J.J., Gangestad, S.W., Brown, S.A., & Horan, W.P. (2000). Hedonic capacity
and schizotypy revisited: A taxometric analysis of social anhedonia. Journal of
Abnormal Psychology, 109, 87-95.
Bonnano, G.A., Davis, P.J., Singer, J., & Schwartz, G. (1991). The repressor personality
and avoidant information processing: A dichotic listening study. Journal of
Research in Personality, 25, 386-401.
Bonnano, G.A. & Singer, J.L. (1990). Repressive personality style: Theoretical and
methodological implications for health and pathology. In J. L. Singer (Ed.),
Repression and dissociation: Implications for personality theory,
psychopathology, and health (pp. 435-470). Chicago: The University of Chicago
Press.
Bowlby, J. (1988). A secure base. New York: Basic Books.
Brosschot, J.F. & Janssen, E. (1998). Continuous monitoring of affective-autonomic
response dissociation in repressors during negative emotional stimulation.
Personality and Individual Differences, 25, 69-84.
Brown, L.L., Tomarken, A.J., Orth, D.N., Loosen, P.T., Kalin, N.H., & Davidson, R.J.
(1996).
Individual differences in repressive-defensiveness predict basal salivary cortisol
levels. Journal of Personality and Social Psychology, 70, 362-371.

173 Burns, J.W. (2000). Repression predicts outcome following multidisciplinary treatment
of chronic pain. Health Psychology, 19, 75-84.
Byrne, D. (1961). The repression-sensitization scale: Rationale, reliability, and validity.
Journal of Personality, 29, 334-349.
Cacioppo, J.T., Tassinary, L.G. & Bernston, G.G. (2000). Handbook of
psychophysiology. Second Edition. United States: Cambridge University Press.
Cacioppo, J.T., Tassinary, L.G., & Fridland, A.J. (1990). The skeletomotor system. In
J.T. Cacioppo & L.G. Tassinary (Eds.), Principles of psychophysiology: Physical,
social, and inferential elements. New York: Cambridge University Press.
Calvo, M.G. & Eysenck, M.W. (2000). Early vigilance and late avoidance of threat
processing: Repressive coping verses low/high anxiety. Cognition and Emotion,
14, 763-787.
Carver, C.S., Scheier, M.F., & Weintraub, J.K. (1989). Assessing coping strategies: A
theoretically based approach. Journal of Personality and Social Psychology, 56,
267-283.
Cassidy, J. (1999). The nature of the child�s ties. In J. Cassidy & P.R. Shaver (Eds.),
Handbook of attachment (pp. 3-20). New York: The Guilford Press.
Cohen, J. (1983). The cost of dichotomization. Applied Psychological Measurement, 7,
249-253.
Costa, P.T. & McCrae, R.R. (1992). NEO PI-R Professional Manual: Revised NEO
Personality Inventory (NEO PI-R) and NEO Five-Factor Inventory (NEO-FFI).
Odessa, FL: Psychological Assessment Resources.

174 Costa, P.T. & Widiger, T.A. (2002). Personality disorders and the five-factor model of
personality. Second Edition. Washington, D.C.: American Psychological
Association.
Crowne, D.P. & Marlowe, D. (1960). A new scale of social desirability independent of
psychopathology. Journal of Consulting Psychology, 24, 349-354.
Crowne, D.P. & Marlowe, D. (1964). The Approval Motive: Studies in evaluative
dependence. Westport, CT: Greenwood Press.
Cutler, S.E., Larsen, R.J., & Bunce, S.C. (1996). Repressive coping style and the
experience and recall of emotion: A naturalistic study of daily affect. Journal of
Personality, 64, 379-405.
Damascio, A.R. (1994). Descartes� Error. New York: Avon Books.
Davidson, R.J. (1983). Affect, repression, and cerebral asymmetry. In L. Tenshok, C.
Van Dyke, & L.S. Zegans (Eds.), Emotions in health and illness (pp. 122-135).
New York: Grune & Stratton.
Davis, P.J. (1987). Repression and the inaccessibility of affective memories. Journal of
Personality and Social Psychology, 53, 585-593.
Davis, P.J. (1990). Repression and the inaccessibility of emotional memories. In J. Singer
(Ed.), Repression and dissociation: Implications for personality theory,
psychopathology, and health (pp. 387-403). Chicago: The University of Chicago
Press.
Denolett, J. (1991). Negative affectivity and repressive coping: Pervasive influence on
self-reported mood health, and coronary-prone behaviour. Psychosomatic
Medicine, 53, 538-556.
175 Derakshan, N. & Eysenck, M.W. (1997a). Interpretive biases for one�s own behavior and
physiology in high-trait-anxious individuals and repressors. Journal of
Personality and Social Psychology, 73, 816-825.
Derakshan, N. & Eysenck, M.W. (1997b). Repression and repressors: Theoretical and
experimental approaches. European Psychologist, 2, 235-246.
Digman, J.M. (1990). Personality structure: Emergence of the five-factor model. Annual
Review of Psychology, 41, 417-440.
Egloff, B. & Hock, M. (1997). A comparison of two approaches to the assessment of
coping styles. Personality and Individual Differences, 23, 913-916.
Erlenmeyer-Kimling, L., Golden, R.R., & Cornblatt, B.A. (1989). A taxometric analysis
of cognititve and neuromotor variables in children at risk for schizophrenia. .
Journal of Abnormal Psychology, 98, 203-208.
Esterling, B.A,.Antoni, M.H., Kumar, M. & Schneiderman, N. (1990). Emotional
repression, stress disclosure responses, and Epstein-Barr Viral Capsid Antigen
Titers. Psychosomatic Medicine, 52, 397-410.
Eysenck, M.W. (1997). Anxiety and cognition: A unified theory. East Sussex: Psychology
Press Limited.
Foa, E.B. & Kozak, M.J. (1986). Emotional processing of fear: Exposure to corrective
information. Psychological Bulletin, 99, 20-35.
Foa, E.B., Molnar, C., & Cashman, L.C. (1995). Change in rape narratives during
exposure therapy for posttraumatic stress disorder. Journal of Traumatic Stress,
8, 675-690.

176 Fox, E. (1993). Allocation of visual attention and anxiety. Cognition and Emotion, 7,
207-215.
Fox, E. (1994). Attentional bias in anxiety: A defective inhibition hypothesis. Cognition
and Emotion, 8, 165-195.
Fox, E., O�Boyle, C., Barry, H., & McCreary, C. (1989). Repressive coping style and
anxiety in stressful dental surgery. British Journal of Medical Psychology, 62,
371-380.
Fraley, R.C. & Waller, N.G. (1998). Adult attachment patterns: A test of the typological
model. In J.A. Simpson & W.S. Rholes (Eds.), Attachment theory and close
relationships (pp. 77-114). New York: Guilford.
Frasure-Smith, N., Lesperance, F., Gravel, G., Masson, A., Juneau, M., Bourassa, M.G.
(2002 ). Long-term survival differences among low-anxious, high-anxious and
repressive copers enrolled in the Montreal heart attack readjustment trial.
Psychosomatic Medicine 64, 571-579.
Freud, A. (1966). The ego and the mechanisms of defense. New York: International
Universities Press.
Freud, S. (1957). Repression. In J. Strachey (ed. And Trans), The standard edition of the
complete psychological works of Sigmund Freud: Vol. 14 (pp. 146-158) London:
Hogarth Press (Original work published in 1915).
Fuller, B.F. & Conner, D.A. (1990). Selection of vigilant and avoidant coping strategies
among repressors, highly anxious, and truly low anxious subjects. Psychological
Reports, 66, 103-110.

177 Furnham, A., Petrides, K.V., & Spencer-Bowdage, S. (2002). The effects of different
types of social desirability on the identification of repressors. Personality and
Individual Differences, 33, 119-130.
Furnham, A. & Traynar, J. (1999). Repression and effective coping styles. European
Journal of Personality, 13, 465-492.
Gangestad, S.W., Baily, J.M., & Martin, N.G. (2000). Taxometric analysis of sexual
orientation and gender identity. Journal of Personality and Social Psychology, 78,
1109-1121.
Gleaves, D.H., Lowe, M.R., Green, B.A., Cororve, M.B., & Williams, T.L. (2000). Do
anorexia and bulima nervosa occur on a continuum? A taxometric analysis.
Behavior Therapy, 31, 195-219.
Gleaves, D.H., Lowe, M.R., Snow, A.C., Green, B.A., & Murphy-Eberenz, K.P. (2002).
Continuity and discontinuity models of bulimia nervosa: A taxometric
ainvestigation. Journal of Abnormal Psychology, 109, 56-68.
Goldberg, L.R. (1990). An alternative �description of personality�: The Big-Five Factor
Structure. Journal of Personality and Social Psychology, 59, 1216-1229.
Golden, R.R. (1982). A taxometric model for the detection of a conjectured latent taxon.
Multivariate Behavioral Research, 17, 389-416.
Golden, R.R., Campbell, M., & Perry, R. (1987). A taxometric analysis method for
diagnosis of tardive diskinesia. Journal of Psychiatric Research, 21, 233-241.
Golden, R.R. & Meehl, P.E. (1979). Detection of the schizoid taxon with MMPI
indicators. Journal of Abnormal Psychology, 88, 217-233.

178 Golin, S., Herron, W., Lakota, R., & Reineck, L. (1964). Factor analytic study of the
manifest anxiety, extraversion and repression-sentitization scales. Journal of
Consulting Psychology, 31, 564-69.
Grayson, D. (1987). Can categorical and dimensional views of psychiatric illness be
distinguished? British Journal of Psychiatry, 151, 355-361.
Graziano, W.G. & Eisenberg, N.H. (1997). Agreeableness: A dimension of personality.
In R. Hogan, J. Johnson, & S. Briggs (Eds.), Handbook of personality psychology
(pp. 795-886). New York: Academic Press.
Greenberg, L.S. & Paivio, S.C. (1997). Working with emotions in psychotherapy. New \
York: Guilford.
Grove, W.M. & Meehl, P.E. (1993). Simple regression-based procedures for taxometric
investigators. Psychological Reports, 73, 707-737.
Gudjonsson, G.H. (1981). Self-reported emotional disturbance and its relation to
electrodermal reactivity, defensiveness, and trait anxiety. Personality and
Individual Differences, 47, 47-52.
Harris, G.T., Rice, M.E., & Quinsey, V.L. (1994). Psychopathy as a taxon: Evidence that
psychopaths are a discrete class. Journal of Consulting and Clinical Psychology,
62, 387-397.
Hansen, R.D., & Hansen, C.H. (1988). Repression of emotionally tagged memories: The
architecture of less complex emotions. Journal of Personality and Social
Psychology, 55, 811-818.

179 Hansen, C.H., Hansen, R.D., & Shantz, D.W. (1992). Repression at encoding: Discrete
appraisals of emotional stimuli. Journal of Personality and Social Psychology,
63, 1026-1035.
Haslam, N. (1997a). Evidence that male sexual orientation is a matter of degree. Journal
of Personality and Social Psychology, 73, 862-870.
Haslam, N. (1997b). On social structures: Differences of degree of kind? Current
Anthropology, 38, 446-447.
Haslam, N. (1999). Taxometric and related methods in relationships research. Personal
Relationships, 6, 519-534.
Haslam, N. (2002). Psychiatric categories as natural kinds: Essentialist thinking about
mental disorders. Social Research, 67, 1031-1058.
Haslam, N. & Beck, A.T. (1994). Subtyping major depression: A taxometric analysis.
Journal of Abnormal Psychology, 103, 686-692.
Haslam, N. & Bornstein, B. (1996). Envy and jealousy as discrete emotions: A
taxometric analysis. Motivation and Emotion, 20, 255-272.
Haslam, N. & Ernst, D. (in press). Essentialist beliefs about mental disorders. Journal of
Social and Clinical Psychology.
Haslam, N. & Kim, H.C. (in press). Categories and continua: A review of taxometric
research. Genetic, Social, and General Psychology Monographs.
Haslam, N., Kim, H., Cleland, C., Steer, R., & Beck, A.T. (2001). Testing the threshold
model of melancholia using BDI indicators. Manuscript submitted for publication
Hock, M., Krohne, H.W., & Kaiser, J. (1996). Coping dispositions and the processing of
ambiguous stimuli. Journal of Personality and Social Psychology, 70, 1052-1066.

180 Hogan, R. (1983). A socioanalytic theory of personality. In M.M. Page (Ed), Nebraska
Symposium on Motivation (pp. 336-355). Lincoln: University of Nebraska Press.
Holmes, D.S. (1990). The evidence for repression: An examination of sixty years of
research. In J. Singer (Ed.), Repression and dissociation: Implications for
personality theory, psychopathology, and health (pp. 33-60). Chicago: The
University of Chicago Press.
Jamner, L.D. & Leigh, H. (1999). Repressive / defensive coping, endogenous opiods and
health: How a life so perfect can make you sick. Personality Research, 85, 17-31.
Jamner, L.D. & Schwartz, G.E. (1986). Self-deception predicts self-report and
endurance of pain. Psychosomatic Medicine, 48, 211-220
Jamner, L.D., Schwartz, G.E., & Leigh, H. (1988). The relationship between repressive
and defensive coping styles and monocyte, eosinophile, and serum glucose levels:
Support for the opiod peptide hypothesis of repression. Psychosomatic Medicine,
50, 567-575.
Jensen, M.R. (1987). Psychobiological factors predicting the course of breast cancer.
Journal of Personality, 55, 317-342.
Jourard, S.M. (1971). Self-disclosure: An experimental analysis of the transparent self.
New York: Wiley-Interscience.
Keltner, D. & Ekman, P. (2000). Facial expression of emotions. In M. Lewis and J.M.
Haviland-Jones (Ed.s), Handbook of emotions, second edition (pp. 236-252). New
York: Guilford.
Korfine, L. & Lenzenweger, M.F. (1995). The taxonicity of schizotypy: A replication.
Journal of Abnormal Psychology, 104, 26-31.
181 Kreitler, S. & Kreitler, H. (1990). Repression and the anxiety-defensiveness factor:
psychological correlates and manifestations. Personality and Individual
Differences, 11, 559-570.
Lang, P.J. (1978). A bio-informational theory of emotional imagery. Psychophysiology,
16, 495-512.
LeDoux, J.E. (2000). Emotion circuits in the brain. Annual Review of Neuroscience, 23,
155-184.
Lehrer, P., Feldman,J., Giardino, N., Song, H., & Schmaling, K. (2002). Psychological
aspects of asthma. Journal of Consulting & Clinical Psychology, 70, 691-711.
Lenzenweger, M.F. (1999). Deeper into the schizotypy taxon: On the robust nature of
maximum covariance analysis, Journal of Abnormal Psychology, 108, 182-187.
Lenzenweger, M.F & Korfine, L. (1992). Confirming the latent structure and base rate of
schizotypy: A taxometric analysis. Journal of Abnormal Psychology, 101, 567-
571.
MacCallum, R.C., Zhang, S., Preacher, K.J., & Rucker, D.D. (2002). On the practice of
dichotomization of quantitative variables. Psychological Methods, 7, 19-40.
McCrae, R.R. & Costa, P.T. (1983). Social desirability scales: More substance than style.
Journal of Consulting and Clinical Psychology, 51, 882-888.
McCrae, R.R. & Costa, P.T. (1990). Personality in adulthood. New York: Guilford Press.
McCrae, R.R. & Costa, P.T. (1997). Personality trait structure as a human universal.
American Psychologist, 52, 509-516.
McCrae, R.R. & John, O.P. (1992). An introduction to the Five Factor Model and its
applications. Journal of Personality, 60, 175-215.

182 Meehl, P.E. (1990). Toward an integrated theory of schizptaxia, schizotypy, and
schizophrenia. Journal of Personality Disorders, 4, 1-99.
Meehl, P.E. (1992). Comorbidity and taxometrics. Clinical Psychology: Science and
Practice, 8, 507-519.
Meehl, P.E. (1992). Factors and taxa, traits and types, differences of degree and
differences in kind. Journal of Personality, 60, 117-174.
Meehl, P.E. (1995). Bootstrap Taxometrics. Solving the classification problem in
psychopathology. American Psychologist, 50, 266-275.
Meehl, P.E. (1999). Clarifications about taxometric method. Applied and Preventive
Psychology, 8, 165-174.
Meehl, P.E. & Yonce, L.J. (1994). Taxometric analysis: I. Detecting taxonicity with two
quantitative indicators using means above and below a sliding cut (MAMBAC
Procedure). Psychological Reports, 74, 1059-1274.
Meehl, P.E. & Yonce, L.J. (1996). Taxometric analysis: II. Detecting taxonicity using
covariance of two quantitative indicators in successive intervals of a third
indicator (MAXCOV Procedure). Psychological Reports, 78, 1091-1227.
Mendolia, M. (1999). Repressors� appraisals of emotional stimuli in threatening and
nonthreatening positive emotional contexts. Journal of Research in Personality,
33, 1-26.
Meyer, T. & Keller, F. (in press). Is there evidence for a latent class called �hypomanic
temperament�? Journal of Affective Disorders.

183 Meyer, T. & Keller, F. (2001). Exploring the latent structure of the Perceptual
Aberration, Magical Ideation and Physical Anhedonia Scales in a German sample
� a partial replication. Journal of Personality Disorders, 15, 521-535.
Miller, T.R. (1991). The psychotherapeutic utility of the five-factor model of personality:
A clinician�s experience. Journal of Personality Assessment, 57, 415-433.
Miller, G.A., and Kozak, M.J. (1993). Three systems assessment and the
construct of emotion. In A. Ohman and N. Birbaumer, (Eds), The structure of
emotion (pp. 31-47). Toronto: Hogrefe and Huber.
Miller, H.R., Streiner, D.L., & Kahgee, S.L. (1982). Use of the Golden-Meehl indicators
in the detection of taxon membership. Journal of Abnormal Psychology, 91, 55-
60.
Millham, J. & Kellogg, R.W. (1980). Need for social approval: Impression management
or self-deception? Journal of Research in Personality, 14, 445-457.
Myers, L.B. (1997). Repressor�s responses to health-related questionnaires. British
Journal of Health Psychology, 2, 245-257.
Myers, L.B. (1998). Repressive coping, trait anxiety and reported avoidance of
negative thoughts. Personality and Individual Differences, 24, 299-303.
Myers, L.B. (2000). Identifying repressors: A methodological issue for health
psychology. Psychology and Health, 15, 205-214.
Myers, L.B. & Brewin, C.R. (1994). Recall of early experience and the repressive coping
style. Journal of Abnormal Psychology, 103, 288-292.
Myers, L.B. & Brewin, C.R. (1995). Repressive coping and the recall of emotional
material. Cognition and Emotion, 9, 637-642.

184 Myers, L.B. & Brewin, C.R. (1996). Illusions of well-being and the repressive coping
style. British Journal of Social Psychology, 35, 443-457.
Myers, L.B., Brewin, C.R., & Power, M.J. (1998). Repressive coping and the directed
forgetting of emotional material. Journal of Abnormal Psychology, 107, 141-148.
Myers, L.B. & Brewin, C.R, & Winter, D.A. (1999). Repressive coping and self-reports
of parenting. British Journal of Clinical Psychology, 38, 73-82.
Myers, L.B.& Derakshan, N. (2000). Monitoring and blunting and an assessment of
different coping styles. Personality and Individual Differeneces, 28, 111-121.
Myers, L.B.& McKenna, F.P. (1996). The colour naming of socially threatening words.
Personality and Individual Differences, 20, 801-803.
Myers, L.B. & Reynolds, D.A. (2000). How optimistic are repressors? The relationship
between repressive coping, controllability, self-esteem, and comparative optimism
for health-related events. Psychology and Health, 15, 677-687.
Myers, L.B. & Vetere, A. (1997). Repressors� responses to health-related questionnaires.
British Journal of Health Psychology, 2, 245-257.
Newman, M.G., Castonguay. L.G., Borkovec, T.B., & Molnar, C. (in press). Integrative
psychotherapy for generalized anxiety disorder. In R. Heimberg (Ed.), The nature
and treatment of Generalized Anxiety Disorder. Guilford Press.
Newman, L.S. & Hedberg, D.A. (1999). Repressive coping and the inaccessibility of
negative autobiographical memories: converging evidence. Personality and
Individual Differences, 27, 45-53.

185 Newton, T.L. & Contrada, R.J. (1992). Repressive coping and verbal-autonomic response
dissociation: The influence of social context. Journal of Personality and Social
Psychology, 62, 159-167.
Niaura, R., Herbert, P.N., McMahon, N., & Sommerville, L. (1992). Repressive coping
and blood lipids in men and women. Psychosomatic Medicine, 54, 698-706.
Nickerson, R.S. (2000). Null hypothesis significance testing: A review of an old and
continuing controversy. Psychological Methods, 5, 241-301.
Nichols, D.S. & Jones, R.E., Jr. (1985). Identifying schizoid-taxon membership with the
Golden-Meehl MMPI items. Journal of Abnormal Psychology, 94, 191-194.
Nordholm, D.A. (1974). A note on the reliability and validity of the Marlowe-Crowne
Scale of social desirability. Journal of Social Psychology, 93, 139-140.
Paulhus, D.L. (1984). Two-component models of socially desirable responding. Journal
of Personality and Social Psychology, 46, 598-609.
Paulhus, D.L. (in press). Socially desirable responding: The evolution of a construct. To
appear in H. Braun, D.E. Wiley, & D.N. Jackson (Eds.), Personality and intellect,
validity and values: Cross-cutting themes. New York: Guilford.
Paulhus, D.L. & John, O.P. (1998). Egoistic and moralistic biases in self-perception: The
interplay of self-deceptive styles with basic traits and motives. Journal of
Personality, 66, 1025-1060.
Paulhus, D.L. & Reid, D.B. (1989). Partitioning the Marlowe Crowne scale into two
components: self-deception and impression management. A technical report
obtained from Delroy Paulhus: University of British Columbia.

186 Pauls, C.A. & Stemmler, G. (in press). Substance and bias in social desirability
responding. Personality and Individual Differences.
Payne, D.G. (1987). Hyperamnesia and reminiscence in recall: A historical and empirical
review. Psychological Bulletin, 101, 5-27.
Perls, F. S. (1969). Gestalt therapy verbatim. Layfayette, CA: Real People Press.
Perls, F.S., Hefferline, R., & Goodman, P. (1951). Gestalt therapy. New York: Dell.
Pincus, A.L. & Boekman, L.F. (1993). Social-emotional adjustment and the five-factor
model of personality. Poster presented at American Psychological Association.
Pincus, A.L. & Boekman, L.F. (1995). Social-emotional adjustment and interpersonal
problems: A circumplex analysis of the Weinberger Adjustment Typology, 2, 65-
80.
Poppell, C.D. & Farmer, R.F. (2000). Construct validity of repression: A dimensional
analysis. Psychological Reports, 87, 304-308.
Rachman, S. & Hodgson, R. (1973). Synchrony and desynchrony in fear and avoidance.
Behaviour Research and Therapy, 12, 311-318.
Ramanaiah, N.V., Byravan, A., & ThuHien, N. (1996). Weinberger adjustment typology
and the five factor model of personality. Psychological Reports, 78, 432-434.
Ritz, T. & Dahme, B. (1996). Repression, self-concealment and rationality/emotional
defensiveness: The correspondence between three questionnaire measures of
defensive coping. Personality and Individual Differences, 20, 95-102.
Rogers, C.R. (1951). Client-centered therapy. Boston: Houghton Mifflin.
Rogers, C.R. (1961). On becoming a person. Boston: Houghton Mifflin.

187 Ruscio, J. (2002). Taxometric programs in the S+ language. [Computer software and
documentation]. Retrieved from
http://www.etown.edu/psychology/faculty/ruscio.htm
Ruscio, A.M., Borkovec, T.D., & Ruscio, J. (2001). A taxometric investigation of the
latent structure of worry. Journal of Abnormal Psychology, 110, 413-422.
Ruscio, A.M., & Ruscio, J. (2002). The latent structure of analogue depression: Should
the BDI be sued to classify groups? Psychological Assessment, 14, 135-145.
Ruscio, A.M., Ruscio, J., & Keane, T.M. (2002). The latent structure of posttraumatic
stress disorder: A taxometric investigation of reactions to extreme stress. Journal
of Abnormal Psychology, 111, 290-301.
Ruscio, J. & Ruscio, A.M. Clarifying boundary issues in psychopathology: The role of
taxometrics in a comprehensive program of structural research. Submitted for
publication.
Ruscio, J. & Ruscio, A.M. (in press). A structure-based approach to psychological
assessment: Matching measurement models to latent structure. Assessment.
Ruscio, J. & Ruscio, A.M. (2001, November). Differentiating categories from
dimensions: Using taxometric analysis to assess the structure of psychological
constructs. Advanced methodology and statistics seminar presented at the
thirty-fifth annual convention of the Association for the Advancement of Behavior
Therapy, Philadelphia, PA.
Ruscio, J. & Ruscio, A.M. Distinguishing types from continua: A nontechnical
introduction to the taxometric method. Manuscript submitted for publication.

188 Ruscio, J. & Ruscio, A.M. (2000). Informing the continuity controversy: A taxometric
analysis of depression. Journal of Abnormal Psychology, 109, 473-487.
Ruscio, J. & Ruscio, A.M., & Meron, M. (2002). Simulating comparison data to establish
the suitability of data and guide interpretation in classification research.
Manuscript submitted for publication.
Safran, J.D. & Greenberg, L.S. (1991). Affective change processes: A synthesis and
critical analysis. In J.D. Safran & L.S. Greenberg (Eds.), Emotion, psychotherapy,
and change. New York, NY: The Guilford Press.
Schacter, D.L. (1987). Implicit memory: History and current status. Journal of
Experimental Psychology: Learning, Memory, and Cognition, 13, 501-518.
Schwebel, D.C. & Suls, J. (1999). Cardiovascular reactivity and neuroticism: Results
from a laboratory and controlled ambulatory stress protocol. Journal of
Personality, 67, 67-92
Scrivner, E. & Safer, M.A. (1988). Eyewitnesses show hyperamnesia for details about a
violent event. Journal of Applied Psychology, 73, 371-377.
Skilling T.A., Quinsey, V.L., & Craig, W.M. (2001). Evidence of a taxon underlying
serious antisocial behavior in boys. Criminal Justice and Behavior, 28, 450-470.
Smith, T.W. & Williams, P.G. (1992). Personality and health; Advantages and limitations
of the Five-Factor Model. Journal of Personality, 60, 395-420.
Soldz, S., Budman, S., Demby, A., & Merry, J. (1993). Representation of personality
disorders in circumplex and five-factor space: Explorations with a clinical sample.
Psychological Assessment, 5, 41-52.

189 Sparks, G.G., Pellechia, M & Irvine, C. (1999). The repressive coping style and fright
reactions to mass media. Communication Research, 26, 176-192.
Spielberger, C.D., Gorsuch, R.L., Lushene, P.R., Vagg, P.R., & Jacobs, G.A. (1983).
Manual for the State-Trait Anxiety Inventory (Form Y). Palo Alto, CA: Consulting
Psychologists Press.
Steiner, H., Higgs, C.M.B., Fritz, G.K., Laszlo, G., & Harvey, J.E. (1988). Defense style
and the perception of asthma. Psychosomatic Medicine, 49, 35-44.
Strickland, B.R. & Crowne, D.P. (1963). Need for approval and the premature
termination of psychotherapy. Journal of Consulting Psychology, 27, 95-101.
Strong, D.R., Greene, R.L., Hoppe, C., Johnston T., & Olesen, N. (1999). Taxometric
analysis of impression management and self-deception on the MMPI-2 in child-
custody litigants. Journal of Personality Assessment, 73, 1-18.
Strong, D.R., Greene, RL., & Schinka, J.A. (2000). Taxometric analysis of the MMPI-2
Infrequency scales [F and F(p)] in clinical settings. Psychological Assessment,
12, 166-173.
Strube, M.J. (1989). Evidence for the type in type A behavior. A taxomettric analysis.
Journal of Personality and Social Psychology, 56, 972-987.
Sullivan, P.F. & Roberts, L.K. (1969). The relationship of manifest anxiety to repression-
sensitization on the MMPI. Journal of Consulting and Clinical Psychology, 33,
763-764.
Tabachnick, B.G. & Fidell, L.S. (2001). Using Multivariate Statistics (Fourth Edition).
Boston: Allyn & Bacon.

190 Taylor, J.A. (1953). A personality scale of manifest anxiety. Journal of Abnormal and
Social Psychology, 48, 285-290.
Taylor, S. (1995). Anxiety sensitivity: Theoretical perspectives and recent findings.
Behavioral Research and Therapy, 33, 243-258.
Taylor, S., Rabian, B., & Fedoroff, I.C. (1999). Anxiety sensitivity: Progress, prospects,
and challenges. In S. Taylor (Ed.), Anxiety sensitivity: Theory, research, and
treatment of the fear of anxiety (pp. 339-353). Mahwah, NJ: Erlbaum.
Tellegen, A. (1985). Structures of mood and personality and their relevance to assessing
anxiety, with an emphasis on self-report. In A.H. Tuma & J.D. Maser (Eds.),
Anxiety and the anxiety disorders (pp. 681-706. Hillsdale, NJ: Erlbaum.
Tomarken, A.J. & Davidson, R.J. (1994). Frontal brain activation in repressors and
nonrepressors. Journal of Abnormal Psychology, 103, 339-349.
Trull, T.J. & Sher, K.J. (1994). Relationship between the Five-Factor Model of
personality and Axis I disorders in a nonclinical sample. Journal of Abormal
Psychology, 103, 350-360.
Turvey, C. & Salovey, P. (1993-94). Measures of repression: Converging on the same
construct? Imagination, cognition, and personality, 13, 279-289.
Tyrka, A., Haslam, N., & Cannon, T.D. (1995). Detection of a longitudinally-stable taxon
of individuals at risk for schizophrenia spectrum disorders. In A. Raine, T. Lencz,
& S.A. Mednick (Eds.) Schizotypal personality disorder (pp. 168-191). New
York: Cambridge University Press.

191 Tyrka, A., Cannon, T.D., Haslam, N., Mednick, S.A., Schulsinger, F., Schulsinger, H., &
Parnas, J. (1995). The latent structure of schizotypy: I. Premorbid indicators of a
taxon of individuals at risk for schizophrenia-spectrum disorders, Journal of
Abnormal Psychology, 104, 173-183.
Vetere, A. & Myers, L.B. (2002). Repressive coping style and adult attachment style: is
there a relationship? Personality and Individual Differences, 32, 799-807.
Waller, N.G. & Meehl, P.E. (1998). Multivariate taxometric procedures: Distinguishing
types from continua. London: SAGE Publications Inc.
Waller, N.G., Putnam, F.W., & Carlson, E.B. (1996). Types of dissociation and
dissociative types: A taxometric analysis of dissociative experiences.
Psychological Methods, 3, 300-321.
Waller, N.G & Ross, C.A. (1997). The prevalence and biometric structure of pathological
dissociation in the general population: Taxometric and behavior genetic findings.
Journal of Abnormal Psychology, 106, 499-510.
Warrenberg, S., Levine, J., Schwartz, G.E., & Fontana, A.F. (1989). Defensive coping
and blood pressure reactivity in medical patients. Journal of Behavioral Medicine,
12, 407-424.
Watson, D. (2000). Mood and temperament (pp. 174-203). New York: Guilford Press.
Watson, D. & Pennebaker, J.W. (1989). Health complaints, stress, and distress: Exploring
the central role of negative affectivity. Psychological Review, 96, 234-254.

192 Weinberger, D.A. (1990). The construct validity of the repressive coping style. In J. L.
Singer (Ed.), Repression and dissociation: Implications for personality theory,
psychopathology, and health (pp. 337-386). Chicago: The University of Chicago
Press.
Weinberger, D.A. & Davidson, M.N. (1994). Styles of inhibiting emotional expression:
Distinguishing repressive coping from impression management. Journal of
Personality, 62, 587-613.
Weinberger, D.A & Schwartz, G.E (1990). Distress and restraint as superordinate
dimensions of self-reported adjustment: A typological perspective. Journal of
Personality, 58, 381-417.
Weinberger, D.A., Schwartz, G.E., & Davidson, R.J. (1979). Low-anxious, high-anxious,
and repressive coping styles: Psychometric patterns and behavioral and
physiological responses to stress. Journal of Abnormal Psychology, 88, 369-380.
Werhun, C.D. & Cox, B.J. (1999). Levels of anxiety sensitivity in relation to repressive
and self-deceptive coping styles. Journal of Anxiety Disorders, 13, 601-609.
Wexler, B.E., Schwartz, G.E., Warrenberg, S., & Jamner, L.D. (1988). Corrugator muscle
response to unconsciously processed negative emotion-evoking stimuli:
Differences between repressors and true low anxious subjects. Department of
Psychiatry, Yale University. Type script.
Wiggins, J.S. & Trapnell, P.D. (1997). Personality structure: The return of the big five. In
R. Hogan, J. Johnson, & S. Briggs (Eds.), Handbook of Personality Psychology
(pp. 737-765). New York: Academic Press.

193 Williamson, D.A., Wombie, L.G., Smeets, M.A., Netemeyer, R.G., Thaw, J., Kutlesic,
V., & Gleaves, D.H. (2002). The latent structure of eating disorder symptoms: A
factor analytic and taxometric investigation. American Journal of Psychiatry, 159,
412-418.
Woodward, S.A., Lensenweger, M.F., Kagan, J., Snidman, N., & Arcus, D. (2000).
Taxonic structure of infant reactivity: Evidence from a taxometric perspective.
Psychological Science, 11, 296-301.

Christine Molnar I. Education 8/95 � 8/03 Pennsylvania State University, University Park, P.A.
Ph.D. Clinical Psychology, Minor in Psychophysiology 8/95 � 11/98 Pennsylvania State University, University Park, P.A.
M.S. Clinical Psychology, Minor in Psychophysiology 1/89 � 5/92 Arcadia University, Beaver College, Glenside, P.A.
B.A. Magna Cum Laude in Psychology
8/87 � 12/89 Pennsylvania State University, Abington & University Park, P.A.
II. Publications Peer Review Journal Articles Foa, E.B., Amir, N., Bogert, K., Molnar, C., & Prezworski, A. (2001). Inflated perception of
responsibility for harm in obsessive-compulsive disorder. Journal of Anxiety Disorders, 15, 259-275.
Foa, E.B., Amir, N., Gershuny, B., Molnar, C., & Kozak, M.J. (1997). Implicit and explicit memory in obsessive-compulsive disorder. Journal of Anxiety Disorders, 11, 119-129.
Foa, E.B., Molnar, C., & Cashman, L.C. (1995). Change in rape narratives during exposure therapy for posttraumatic stress disorder. Journal of Traumatic Stress, 8 (4), 675-690. Alexander, R.C., Breslin, N., Molnar, C., Richter, J., & Mukherjee, S. (1992). Counter clockwise scalp hair whorl in schizophrenia. Biological Psychiatry, 32, 842-845. Book Chapters Newman, M.G., Castonguay. L.G., Borkovec, T.B., & Molnar, C. (in press). Integrative
psychotherapy for generalized anxiety disorder. R. Heimberg (Ed.), The nature and treatment of Generalized Anxiety Disorder. Guilford Press.
Foa, E.B., Rothbaum, B.O., & Molnar, C. (1995). Cognitive-behavioral treatment of PTSD. In M.J. Friedman, D.S. Charney, & A.Y. Deutch (Eds.), Neurobiological and clinical consequences of stress: From normal adaptation to PTSD. New York: Raven Press.