a tale of two divides: regional growth and resilience in ... · itd1+2, itd3, itd5, ite1, ite2,...
TRANSCRIPT

A Tale of Two Divides: Regional Growth and Resilience
in Italy and the UK
Ben Gardiner, Raffaele Lagravinese, Ron Martin, Pete Tyler
This work forms part of a larger project; How Regions React to Recession: Resilience, Hysteresis and Long Run Impacts (ESRC
Grant ES/1035811/1).

1. Motivation for the study
• Study the nature of the North-South regional divide in the United Kingdom and Italy;
• Understanding the dynamics of long-run growth trends (mostly productivity but also some empl);
• Considering growth differentials across regions in each country created by current financial crisis and past recessions (GVA and empl);
• Examine the role played by industrial structure;

North-South Evolutions; Italy and UK compared and contrasted
• Gonzalez (2010); Is the North-South distinction a relevant ‘policy geography’. UK compared and contrasted;
In Italy; • Barca(2001); New Trends and the Policy Shift in the Italian Mezzogiorno; • Malanima (2012); long-term decline; • Bryne, Fazio and Piacentino; general lack of TFP convergence. Contrary to
conventional wisdom, each region seems to follow its own growth path but importance of convergence;
• Ascari and Di Cosmo (2004); determinants of TFP in Italian regions and differences between North and South;
• Dunford and Greco (2007); impact of restructuring (privatisation) on steel companies and regional implications;
In United Kingdom; • Martin and Tyler (1991), Martin (2008), Martin, 2010, Gardiner et al (2013);

90
110
130
150
170
190
210
230
250
270
1970 1975 1980 1985 1990 1995 2000 2005 2010
Out
put L
evel
(197
1=10
0)
Italy
UK
2. Long-run patterns
Early-80s recessionary shock Early 90s recessionary shock Late 00s recessionary shock

90
95
100
105
110
115
120
125
130
135
1970 1975 1980 1985 1990 1995 2000 2005 2010
Empl
oym
ent L
evel
(197
1=10
0)
Italy
UK
2. Long-run patterns
Early-80s recessionary shock Early 90s recessionary shock Late 00s recessionary shock
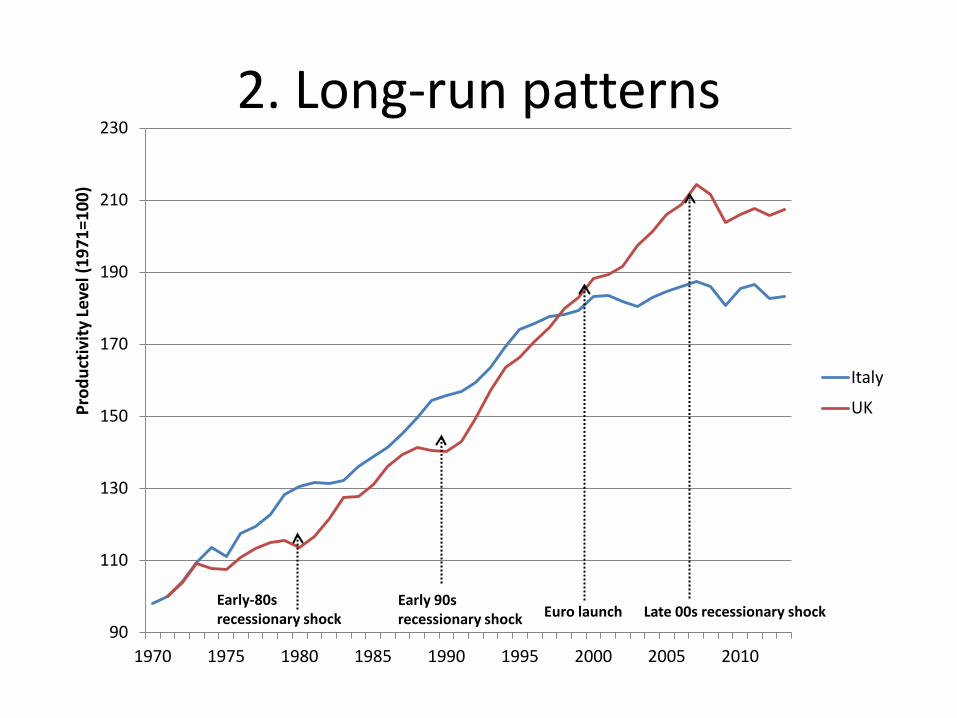
90
110
130
150
170
190
210
230
1970 1975 1980 1985 1990 1995 2000 2005 2010
Prod
uctiv
ity Le
vel (
1971
=100
)
Italy
UK
2. Long-run patterns
Euro launch Early-80s recessionary shock
Early 90s recessionary shock Late 00s recessionary shock

Stereotypical North-South Divides (Italy)
95
100
105
110
115
120
125
130
135
1970 1975 1980 1985 1990 1995 2000 2005 2010
Empl
oym
ent L
evel
(197
0=10
0)
North-South Divides - Italy
North
South

Stereotypical North-South Divides (UK)
90
100
110
120
130
140
1971 1976 1981 1986 1991 1996 2001 2006 2011
Empl
oym
ent L
evel
(197
0=10
0)
North-South Divides - UK
North
South

Stereotypical North-South Divides (Italy)
100
120
140
160
180
200
Prod
uctiv
ity L
evel
(197
0=10
0)
1970
1971
1972
1973
1974
1975
1976
1977
1978
1979
1980
1981
1982
1983
1984
1985
1986
1987
1988
1989
1990
1991
1992
1993
1994
1995
1996
1997
1998
1999
2000
2001
2002
2003
2004
2005
2006
2007
2008
2009
2010
2011
year
north south

Stereotypical North-South Divides (UK)
100
110
120
130
140
150
160
170
180
190
1971 1976 1981 1986 1991 1996 2001 2006 2011
Prod
uctiv
ity Le
vel (
1971
=100
)
North
South

75
80
85
90
95
100
105
110
115
1970 1975 1980 1985 1990 1995 2000 2005 2010
Rela
tive
Prod
uctiv
ity (C
ount
ry =
100
)
Italy - North
Italy - South
UK - North
UK - South
Relative Productivity
UK North-South Productivity Gap Italy North-South
Productivity Gap

Cumulative Deviations in Italy
NUTS1 NUTS2

Cumulative Deviations in UK
NUTS1 NUTS2
Above 9pp2pp to 9pp-0.9pp to 1pp-3pp to -0.9pp-6pp to -3pp-9pp to -6pp-12pp to -9pp-14pp to -12ppbelow -14pp
Above 1pp-1pp to 1pp-7pp to -1pp-9pp to -7ppbelow -9pp

Productivity and Employment Growth Evolutions in UK and Italy
• Evolution of cumulative productivity and employment growth deviations
• Highlighting some extremes and segmenting (NUTS2) regions into the four possible quadrants
• Also noting regions that have shown ability to turn around / shift between quadrants

-25
-20
-15
-10
-5
0
5
10
15
20
25
-30 -20 -10 0 10 20 30
Cum
ulat
ive
Prod
uctiv
ity G
row
th 1
980-
2011
(rel
ativ
e to
nat
iona
l)
Cumulative Employment Growth 1980-2011 (relative to national)
North
South
Cumulative Productivity and Employment by 2011 (Italy)

Cumulative Productivity and Employment by 2011 (UK)

Productivity vs Employment Evolutions (Italy)
-9.0
-8.0
-7.0
-6.0
-5.0
-4.0
-3.0
-2.0
-1.0
0.0
1.0
2.0
0.0 5.0 10.0 15.0 20.0 25.0
Cum
ulat
ive
Prod
uctiv
ity D
iffer
ence
(rel
ativ
e to
na
tiona
l)
Cumulative Employment Difference (relative to national)
ite4 - Lazio
0.0
5.0
10.0
15.0
20.0
25.0
-20.0 -15.0 -10.0 -5.0 0.0
Cum
ulat
ive
Prod
uctiv
ity D
iffer
ence
(rel
ativ
e to
nat
iona
l)
Cumulative Employment Difference (relative to national)
itf2 - Molise
-3.0 -2.0 -1.0 0.0 1.0 2.0 3.0 4.0 5.0 6.0 7.0
-12.0 -10.0 -8.0 -6.0 -4.0 -2.0 0.0 2.0
Cum
ulat
ive
Prod
uctiv
ity D
iffer
ence
(rel
ativ
e to
nat
iona
l)
Cumulative Employment Difference (relative to national)
itg1 - Sicilia
-6.0 -4.0 -2.0 0.0 2.0 4.0 6.0 8.0
10.0 12.0
-10.0 -5.0 0.0 5.0
Cum
ulat
ive
Prod
uctiv
ity D
iffer
ence
(r
elat
ive
to n
atio
nal)
Cumulative Employment Difference (relative to national)
ite3 - Marche

Productivity vs Employment Evolutions (UK)
-2.0
0.0
2.0
4.0
6.0
8.0
10.0
12.0
14.0
-30.0 -25.0 -20.0 -15.0 -10.0 -5.0 0.0
Cum
ulat
ive
Prod
uctiv
ity D
iffer
ence
(r
elat
ive
to n
atio
nal)
Cumulative Employment Difference (relative to national)
ukg3 - West Midlands
-8.0 -6.0 -4.0 -2.0 0.0 2.0 4.0 6.0 8.0
10.0
0.0 10.0 20.0 30.0
Cum
ulat
ive
Prod
uctiv
ity D
iffer
ence
(rel
ativ
e to
nat
iona
l)
Cumulative Employment Difference (relative to national)
ukj1 - Berkshire, Bucks and Oxfordshire
-20.0
-15.0
-10.0
-5.0
0.0
5.0
-40.0 -30.0 -20.0 -10.0 0.0
Cum
ulat
ive
Prod
uctiv
ity D
iffer
ence
(r
elat
ive
to n
atio
nal)
Cumulative Employment Difference (relative to national)
ukd5 - Merseyside
-9.0
-8.0
-7.0
-6.0
-5.0
-4.0
-3.0
-2.0
-1.0
0.0 0.0 5.0 10.0 15.0 20.0 25.0
Cum
ulat
ive
Prod
uctiv
ity D
iffer
ence
(rel
ativ
e to
nat
iona
l)
Cumulative Employment Difference (relative to national)
ukh1 - East Anglia

Summary of Regional Evolutions
Country Quadrant 1 (high prod vs high empl)
Quadrant 2 (low prod vs high empl)
Quadrant 3 (low prod vs low empl)
Quadrant 4 (high prod vs low empl)
Italy itc4 itd1+2, itd3, itd5, ite1, ite2, ite4,
itc1, itc2, itg1
itc3, itd4, ite3, itf1, itf2, itf3, itf4, itf5, ift6, itg2
UK ukd2, uki1, ukj1, ukj2, ukj3 ukm5, ukm6
uke2, ukf2, ukf3, ukg1, ukg2, ukh1, ukh2, ukh3, ukj4 ukk1, ukk2, ukk3, ukk4, ukl2, ukn
ukc1, ukc2, ukd1, ukd3, ukd4, ukd5, uke1, uke3, uke4, ukf1, ukl1, ukm3,
ukg3, uki2, ukm2,
Northern Regions Southern Regions
Turnaround regions? itd5, ite1, ite3, uki1, ukj1, ukj2, ukj3

3. The Role of Industrial Structure Using dynamic shift Share to investigate the role of industrial
structure and regional characteristics on long-term national growth differential More formally:
Each of these three components can be expressed as follows:
Where: g = the growth of the variable X over the pre-defined time period (between t+n and t); gn = the national (percentage) growth of variable X during this period, gin = the national (percentage) growth by industry i of variable X during this period; and gij = the regional (percentage) growth by industry i of variable X during this period.
= = + +
)
)
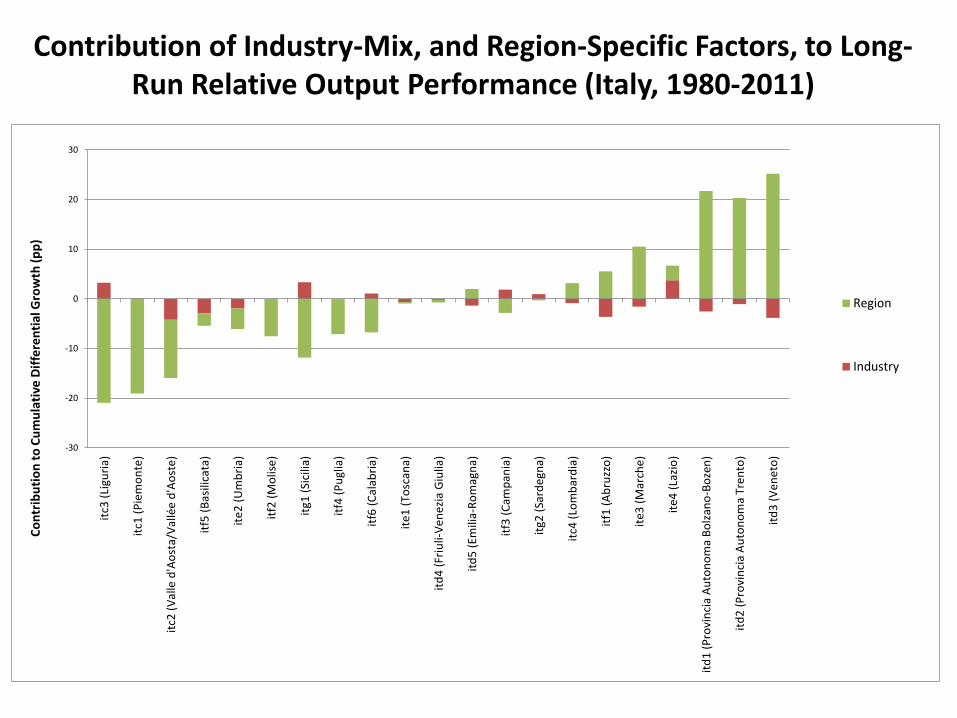
Contribution of Industry-Mix, and Region-Specific Factors, to Long-Run Relative Output Performance (Italy, 1980-2011)
-30
-20
-10
0
10
20
30
itc3
(Lig
uria
)
itc1
(Pie
mon
te)
itc2
(Val
le d
'Aos
ta/V
allé
e d'
Aost
e)
itf5
(Bas
ilica
ta)
ite2
(Um
bria
)
itf2
(Mol
ise)
itg1
(Sic
ilia)
itf4
(Pug
lia)
itf6
(Cal
abria
)
ite1
(Tos
cana
)
itd4
(Friu
li-Ve
nezia
Giu
lia)
itd5
(Em
ilia-
Rom
agna
)
itf3
(Cam
pani
a)
itg2
(Sar
degn
a)
itc4
(Lom
bard
ia)
itf1
(Abr
uzzo
)
ite3
(Mar
che)
ite4
(Laz
io)
itd1
(Pro
vinc
ia A
uton
oma
Bolz
ano-
Boze
n)
itd2
(Pro
vinc
ia A
uton
oma
Tren
to)
itd3
(Ven
eto)
Cont
ribut
ion
to C
umul
ativ
e D
iffer
entia
l Gro
wth
(pp)
Region
Industry

Contribution of Industry-Mix, and Region-Specific Factors, to Long-Run Relative Employment Performance (Italy, 1980-2011)
-40
-30
-20
-10
0
10
20
30
itc3
(Lig
uria
)
itf4
(Pug
lia)
itf2
(Mol
ise)
itf5
(Bas
ilica
ta)
itf3
(Cam
pani
a)
itd4
(Friu
li-Ve
nezia
Giu
lia)
itc1
(Pie
mon
te)
itf6
(Cal
abria
)
ite1
(Tos
cana
)
itf1
(Abr
uzzo
)
itc2
(Val
le d
'Aos
ta/V
allé
e d'
Aost
e)
itg1
(Sic
ilia)
itd5
(Em
ilia-
Rom
agna
)
ite3
(Mar
che)
itc4
(Lom
bard
ia)
itg2
(Sar
degn
a)
ite2
(Um
bria
)
itd1
(Pro
vinc
ia A
uton
oma
Bolza
no-B
ozen
)
itd2
(Pro
vinc
ia A
uton
oma
Tren
to)
itd3
(Ven
eto)
ite4
(Laz
io)
Cont
ribut
ion
to C
umul
ativ
e Di
ffere
ntia
l Gro
wth
(pp)
Region
Industry

Contribution of Industry-Mix, and Region-Specific Factors, to Long-Run Relative Productivity Performance (Italy, 1980-2011)
-25
-20
-15
-10
-5
0
5
10
15
ite4
(Laz
io)
ite2
(Um
bria
)
itc2
(Val
le d
'Aos
ta/V
allé
e d'
Aost
e)
itc1
(Pie
mon
te)
itg2
(Sar
degn
a)
itg1
(Sic
ilia)
itd5
(Em
ilia-
Rom
agna
)
itc4
(Lom
bard
ia)
itd1
(Pro
vinc
ia A
uton
oma
Bolza
no-B
ozen
)
itd2
(Pro
vinc
ia A
uton
oma
Tren
to)
ite1
(Tos
cana
)
itf6
(Cal
abria
)
itd3
(Ven
eto)
itc3
(Lig
uria
)
itf1
(Abr
uzzo
)
ite3
(Mar
che)
itf5
(Bas
ilica
ta)
itd4
(Friu
li-Ve
nezia
Giu
lia)
itf2
(Mol
ise)
itf4
(Pug
lia)
itf3
(Cam
pani
a)
Cont
ribut
ion
to C
umul
ativ
e Di
ffere
ntia
l Gro
wth
(pp)
Region
Industry

Contribution of Industry-Mix, and Region-Specific Factors, to Long-Run Relative Output Performance (UK, 1980-2011)
-60
-40
-20
0
20
40
60
ukd5
(Mer
seys
ide)
ukc1
(Tee
s V
alle
y an
d D
urha
m)
uke3
(Sou
th Y
orks
hire
)
ukl1
(Wes
t W
ales
and
The
Val
leys
)
ukc2
(Nor
thum
berl
and,
Tyn
e an
d W
ear)
uke1
(Eas
t Yo
rksh
ire
and
Nor
ther
n Li
ncol
nshi
re)
ukg3
(Wes
t M
idla
nds)
ukm
3 (S
outh
Wes
tern
Sco
tlan
d)
ukd1
(Cum
bria
)
ukd3
(Gre
ater
Man
ches
ter)
uke4
(Wes
t Yo
rksh
ire)
ukd4
(Lan
cash
ire)
ukf1
(Der
bysh
ire
and
Not
ting
ham
shir
e)
ukg2
(Shr
opsh
ire
and
Staf
ford
shir
e)
ukh2
(Bed
ford
shir
e, H
ertf
ords
hire
)
uke2
(Nor
th Y
orks
hire
)
ukn
(Nor
ther
n Ir
elan
d)
ukm
6 (H
ighl
ands
and
Isla
nds)
ukm
2 (E
aste
rn S
cotl
and)
uki2
(O
uter
Lon
don)
ukh3
(Ess
ex)
ukj4
(Ken
t)
ukl2
(Eas
t W
ales
)
ukd2
(Che
shir
e)
ukf3
(Lin
coln
shir
e)
ukk4
(Dev
on)
ukf2
(Lei
cest
ersh
ire,
Rut
land
and
Nor
than
ts)
ukk1
(Glo
uces
ters
hire
, Wilt
shir
e an
d Br
isto
l/B
ath
area
)
ukk2
(Dor
set
and
Som
erse
t)
ukj3
(Ham
pshi
re a
nd Is
le o
f Wig
ht)
ukg1
(Her
efor
dshi
re, W
orce
ster
shir
e an
d W
arks
)
ukj2
(Sur
rey,
Eas
t an
d W
est
Suss
ex)
ukh1
(Eas
t A
nglia
)
ukk3
(Cor
nwal
l and
Isle
s of
Sci
lly)
uki1
(In
ner
Lond
on)
ukm
5 (N
orth
Eas
tern
Sco
tlan
d)
ukj1
(Ber
kshi
re, B
ucks
and
Oxf
ords
hire
)
Cont
ribu
tion
to
Cum
ulat
ive
Gro
wth
Dif
fere
ntia
l (pp
)
Region
Industry

Contribution of Industry-Mix, and Region-Specific Factors, to Long-Run Relative Employment Performance (UK, 1980-2012)
-40
-30
-20
-10
0
10
20
30
40
50
ukd5
(Mer
seys
ide)
ukg3
(Wes
t Mid
land
s)
ukm
3 (S
outh
Wes
tern
Sco
tland
)
ukc1
(Tee
s Va
lley
and
Dur
ham
)
ukd3
(Gre
ater
Man
ches
ter)
ukc2
(Nor
thum
berl
and,
Tyn
e an
d W
ear)
ukm
6 (H
ighl
ands
and
Isla
nds)
uke3
(Sou
th Y
orks
hire
)
ukd4
(Lan
cash
ire)
ukl1
(Wes
t Wal
es a
nd T
he V
alle
ys)
uki2
(O
uter
Lon
don)
uke1
(Eas
t Yor
kshi
re a
nd N
orth
ern
Linc
olns
hire
)
ukd1
(Cum
bria
)
ukm
2 (E
aste
rn S
cotla
nd)
uke4
(Wes
t Yor
kshi
re)
ukf1
(Der
bysh
ire a
nd N
ottin
gham
shire
)
ukh2
(Bed
ford
shire
, Her
tfor
dshi
re)
uki1
(In
ner L
ondo
n)
ukd2
(Che
shire
)
ukj4
(Ken
t)
ukg2
(Shr
opsh
ire
and
Staf
ford
shir
e)
ukj3
(Ham
pshi
re a
nd Is
le o
f Wig
ht)
ukf2
(Lei
cest
ersh
ire, R
utla
nd a
nd N
orth
ants
)
ukl2
(Eas
t Wal
es)
ukk1
(Glo
uces
ters
hire
, Wilt
shir
e an
d Br
isto
l/Ba
th a
rea)
ukm
5 (N
orth
Eas
tern
Sco
tland
)
ukj2
(Sur
rey,
Eas
t and
Wes
t Sus
sex)
uke2
(Nor
th Y
orks
hire
)
ukn
(Nor
ther
n Ir
elan
d)
ukf3
(Lin
coln
shire
)
ukg1
(Her
efor
dshi
re, W
orce
ster
shire
and
War
ks)
ukk4
(Dev
on)
ukh3
(Ess
ex)
ukk2
(Dor
set a
nd S
omer
set)
ukh1
(Eas
t Ang
lia)
ukj1
(Ber
kshi
re, B
ucks
and
Oxf
ords
hire
)
ukk3
(Cor
nwal
l and
Isle
s of
Sci
lly)
Cont
ribu
tion
to C
umul
ativ
e G
row
th D
iffer
enti
al (p
p)
Region
Industry

Contribution of Industry-Mix, and Region-Specific Factors, to Long-Run Relative Productivity Performance (UK, 1980-2011)
-30
-20
-10
0
10
20
30
40
50
ukn
(Nor
ther
n Ir
elan
d)
uke2
(Nor
th Y
orks
hire
)
ukd5
(Mer
seys
ide)
ukh3
(Ess
ex)
uke3
(Sou
th Y
orks
hire
)
ukk3
(Cor
nwal
l and
Isle
s of
Sci
lly)
ukl1
(Wes
t W
ales
and
The
Val
leys
)
uke1
(Eas
t Yor
kshi
re a
nd N
orth
ern
Linc
olns
hire
)
ukg2
(Shr
opsh
ire
and
Staf
ford
shir
e)
ukk4
(Dev
on)
ukk2
(Dor
set
and
Som
erse
t)
ukf3
(Lin
coln
shir
e)
ukc1
(Tee
s V
alle
y an
d D
urha
m)
uke4
(Wes
t Yor
kshi
re)
ukd1
(Cum
bria
)
ukc2
(Nor
thum
berl
and,
Tyn
e an
d W
ear)
ukl2
(Eas
t W
ales
)
ukh2
(Bed
ford
shir
e, H
ertf
ords
hire
)
ukf1
(Der
bysh
ire
and
Not
ting
ham
shir
e)
ukh1
(Eas
t A
nglia
)
ukk1
(Glo
uces
ters
hire
, Wilt
shir
e an
d Br
isto
l/Ba
th a
rea)
ukd4
(Lan
cash
ire)
ukj4
(Ken
t)
ukd3
(Gre
ater
Man
ches
ter)
ukg1
(Her
efor
dshi
re, W
orce
ster
shir
e an
d W
arks
)
ukm
3 (S
outh
Wes
tern
Sco
tlan
d)
ukd2
(Che
shir
e)
ukf2
(Lei
cest
ersh
ire,
Rut
land
and
Nor
than
ts)
ukj2
(Sur
rey,
Eas
t an
d W
est
Suss
ex)
ukm
2 (E
aste
rn S
cotl
and)
ukj3
(Ham
pshi
re a
nd Is
le o
f Wig
ht)
ukj1
(Ber
kshi
re, B
ucks
and
Oxf
ords
hire
)
uki2
(O
uter
Lon
don)
ukm
6 (H
ighl
ands
and
Isla
nds)
ukg3
(Wes
t M
idla
nds)
ukm
5 (N
orth
Eas
tern
Sco
tlan
d)
uki1
(In
ner
Lond
on)
Cont
ribu
tion
to
Cum
ulat
ive
Gro
wth
Dif
fere
ntia
l (pp
)
Region
Industry

4. Assessing Impact of Regions to Recessionary Shocks (for GVA and Empl)
• Our interpretation is that resilience as a concept captures both resistance to the shock and recovery from it
• Resistance and recovery indices both calculated the same = [(∆Xr/Xr) - (∆X/X)E ] / |∆X/X|E
– where E = national during recession (-ve growth) or recovery
(+ve growth) period – zero => no difference to expected (national) effect – positive => more resistant / stronger recovery than expected – negative => less resistant / lower recovery than expected

Resistance vs Recovery Indices - Italy Output Employment
-0.4
-0.3
-0.2
-0.1
0.0
0.1
0.2
0.3
-3.0 -2.0 -1.0 0.0 1.0 2.0 3.0 4.0
Aver
age
Reco
very
Inde
x
Average Resistance Index
North
South
-0.8
-0.6
-0.4
-0.2
0.0
0.2
0.4
0.6
0.8
1.0
-2.0 -1.5 -1.0 -0.5 0.0 0.5 1.0 1.5 2.0
Ave
rage
Rec
ove
ry In
dex
Average Resistance Index
North
South

Resistance vs Long-Run Growth (Italy) Output Employment
1.0
1.5
2.0
2.5
3.0
-3.0 -2.0 -1.0 0.0 1.0 2.0 3.0 4.0
Long
-run
Gro
wth
(%pa
, 197
0-20
11)
Average Resistance Index
North
South
-0.2
0.0
0.2
0.4
0.6
0.8
1.0
1.2
-2.0 -1.0 0.0 1.0 2.0
Long
-run
Gro
wth
(%pa
, 197
0-20
11)
Average Resistance Index
North
South

Resistance vs Recovery Indices - UK Employment Output
-6.0
-5.0
-4.0
-3.0
-2.0
-1.0
0.0
1.0
2.0
3.0
-1.5 -1.0 -0.5 0.0 0.5 1.0 1.5 2.0
Aver
age
Reco
very
Inde
x
Average Resistance Index
North
South
-1.0
-0.5
0.0
0.5
1.0
1.5
-3.0 -2.0 -1.0 0.0 1.0 2.0 3.0 4.0 5.0 6.0Aver
age
Reco
very
Inde
x
Average Resistance Index
North
South

Resistance vs Long-Run Growth (UK) Output Employment
-1.0
-0.5
0.0
0.5
1.0
1.5
2.0
-1.5 -1.0 -0.5 0.0 0.5 1.0 1.5 2.0Lo
ng-r
un G
row
th (%
pa, 1
980-
2011
)
Average Resistance Index
North
South
1.0
1.5
2.0
2.5
3.0
3.5
4.0
-3.0 -2.0 -1.0 0.0 1.0 2.0 3.0 4.0 5.0 6.0
Long
-run
Gro
wth
(%pa
, 198
0-20
11)
Average Resistance Index
North
South

5. Summary and Conclusions
• Spatial divides in Italy and the UK – wider in the UK (for employment) – clear north-south divergence, but more detail -> more variation
• Recession and resilience – resistance to slowdown and recession is positively associated
with ability to recover (moreso for employment) – more resilient regions tend to enjoy stronger long-run growth – clear north-south spatial patterns emerge
• Role of economic structure vs competitive effects – structure has a role to play but less obvious link to
performance – regional-specific factors are mostly dominant