a tale of two cities - toronto geological … goldie 2012.pdfa tale of two cities raymond goldie...
TRANSCRIPT

A TALE OF TWO CITIES
Raymond Goldie Vice President & Senior Mining Analyst
Salman Partners, Toronto 416-214-2749
Toronto Geological Discussion Group
November 8, 2012

1
The statements and statistics contained herein have been prepared by sources we believe to be reliable, but we cannot represent that they are complete or accurate. Salman Partners Inc., together with its Directors and Officers, may from time to time have a position in the securities mentioned and may as principal or agent, buy and sell such securities.
Disclaimer

2
Source: Canoe.ca

3
Messrs Munk and Regent. Source: Ottawa Citizen

4
Tye Burt. Source: Vancouver Sun

5
Month-to-month changes 1960 - 2012
% change in the level of the TSX’s gold sub-index =
0.4% (t-stat = 1.25)
plus
0.836 x % change in the level of the TSX Composite Index (t-stat = 10.12)
plus
0.085 x % change in the price of gold in Canadian dollars (t-stat = 1.53)

6
Month-to-month changes October 2008 - 2012
% change in the level of the TSX’s gold sub-index =
0.7% (t-stat = 0.56)
plus
0.882 x % change in the level of the TSX Composite Index (t-stat = 2.31)
minus
0.128 x % change in the price of gold in Canadian dollars (t-stat = -0.77)

7
“All 500 S&P companies have the same chairman and his name is Ben Bernanke”
Source: Fidelity Global Strategies Fund, as quoted by London’s Financial Times (September 11, 2012).

8
Month-to-month changes 1960 - 2012
% change in the level of the TSX’s diversified (i.e. non-precious) mining index =
-0.1% (t-stat = -0.66)
plus
1.115 x % change in the level of the TSX Composite Index (t-stat = 24.46)
plus
0.356 x % change in the price of metals* in Canadian dollars (t-stat = 1.53)
*An unweighted average of changes in Al, Cu, Ni & Zn prices, with Al excluded after Alcan was delisted October 2007

9
Month-to-month changes October 2008 - 2012
% change in the level of the TSX’s diversified mining index =
-1.2% (t-stat = 0.91)
plus
0.653 x % change in the level of the TSX Composite Index (t-stat = 1.42)
plus
0.784 x % change in the price of metals* in Canadian dollars (t-stat = 4.24)
*An unweighted average of changes in Cu, Ni & Zn prices

10
Source: blogspot.com
11
Source: CityTV

12
Source: TMX

13
Mixed signals as miners battle tougher times Sydney Morning Herald, October 13, 2012
Boart Longyear… last week dumped its respected chief executive after a surprise profit warning a few weeks earlier. …the canary in the mine is the low level of capital raised by junior explorers, which has remained depressed for several years now, and is forcing them to curtail spending. The majors, too, are harbouring cash.
Thompson Creek to axe 100 jobs at Ohio mine Proactiveinvestors.com, October 3, 2012
Thompson Creek Metals Co. (TSE:TCM) said Wednesday it would halt stripping activity at its Ohio molybdenum mine and slash 100 jobs, as the company seeks to boost its balance sheet and conserve cash.

14
London, September 2012 (photo by Raymond Goldie)

15
Source: interactivebrokers.com
Source: info.goldavenue.com

16
THE LONDON METAL EXCHANGE, LME
Source: Thomson Reuters

17
IMPLIED COPPER PRICE vs MKT. CAP.
$1.25
$1.50
$1.75
$2.00
$2.25
$2.50
$2.75
10 100 1,000 10,000 100,000Market capitalization, Cdn$M (log. scale)
Impl
ied
copp
er p
rice,
US$
/lb
CUV
HMG
ARG
NUS
III
IMN
TRQ
FM
Source: Salman Partners’ estimate of the price of copper in 2013 (assumed to rise every year thereafter at the rate of US CPI inflation) that would be required to make the company’s Net Asset Value equal to its share price.

18
Copper Prices, US$/lb, as implied by LME forward strips
$2.00
$2.50
$3.00
$3.50
$4.00
$4.50
2008 2009 2010 2011 2012 2013 2014 2015 2016 2017 2018 2019 2020 2021
US$3.38/lb in 2021
US$3.46/lbin 2016
Source: LME, interpolation by Salman Partners inc., using exponential least-squares regression analysis

19
IS SUPPLY MANAGEMENT RELEVANT TO THE MINERALS
THAT THIS COMPANY INTENDS TO PRODUCE?

20
Chart courtesy Western Potash Corp. (NB: read “coking” for “cooking”)

21
Bill Doyle. Source: Saskatoon StarPhoenix

22
BHP Billiton’s commodity marketing philosophy:
“to run at full capacity and take the market prices”
Source: M. Kloppers, CEO, BHP Billiton, as quoted by The Globe and Mail.

23
Source: Bloomberg

24
Source: NBC News. We note that the Olympian volley-ball player apparently is not standing on a podium

25
China’s moves to shut inefficient, dirty plants

26
Source: windpowerstockstowatch.blogspot.com
The Rare Earths

27
RARE EARTHS DEAL SASKATOON, SASKATCHEWAN, Jan 31, 2011 (MARKETWIRE via COMTEX) --
Great Western Group Ltd. (TSX VENTURE: GWG) announces that it has signed a Letter of Intent with Electron Energy of Landisville, Pennsylvania to supply samarium metal, gadolinium metal and samarium-cobalt alloys used by EEC to manufacture magnets and magnet systems.

28
Source: Syngenta

29
Source: Raymond Goldie

30
Who We Are/What We Do
Brush Wellman Beryllium Products is the premier integrated global producer of beryllium-based metals & metal matrix composites. We provide high-performance metals & metal-matrix composites for mission-critical commercial, aerospace, medical, research & engineering applications that require the highest levels of performance.

31
SMELTER/REFINERY SURPLUS
32
Copper pipes. Source: etoro.com

33
FORECASTING METHOD #1:
TECHNICAL ANALYSIS
34
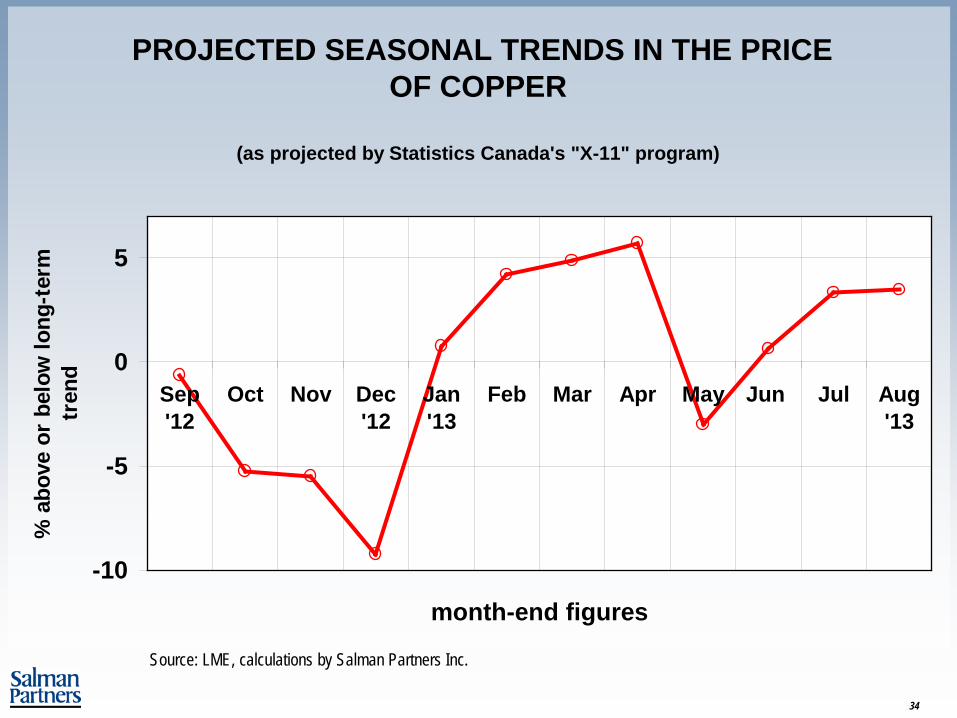
PROJECTED SEASONAL TRENDS IN THE PRICE OF COPPER
(as projected by Statistics Canada's "X-11" program)
-10
-5
0
5
Sep'12
Oct Nov Dec'12
Jan'13
Feb Mar Apr May Jun Jul Aug'13
month-end figures
% a
bove
or
belo
w lo
ng-t
erm
tr
end
Source: LME, calculations by Salman Partners Inc.

35
FORECASTING METHOD #2:
FUNDAMENTAL ANALYSIS

36
Source: ABMS, CRU, ICSG, WBMS, GFMS; adjustments and estimates by Salman Partners Inc. “Pinch-point™” is a trademark registered to Raymond Goldie
"pinch-point" TM chart for
COPPER
$0.30
$0.50
$0.70
$0.90
$1.10
$1.30
$1.50
$1.70
0 10 20 30 40 PRODUCERS' PLUS EXCHANGE
INVENTORIES (DAYS' CONSUMPTION)
CO
PPER
PR
ICE
US$
/LB
MONTH-END FIGURES
JUL '84 TO DEC '88
Based on average consumption in preceding 3
months, seasonally adjusted.

37
“pinch-point”TM is a trademark registered to Raymond Goldie

38
Source: nerve.com

39
"pinch-point" TM chart for
COPPER
$1.00
$2.00
$3.00
$4.00
0 10 20 30 40 50 60 PRODUCERS' PLUS EXCHANGE
INVENTORIES (DAYS' CONSUMPTION)
CO
PP
ER
P
RIC
E U
S$/
LBMONTH-END FIGURES
JUNE 2005 TO JULY 2012
Based on average consumption in preceding 3 months, seasonally adjusted
May 2012 July 2012
Source: ABMS, CRU, ICSG, WBMS, GFMS; adjustments and estimates by Salman Partners Inc. “Pinch-point™” is a trademark registered to Raymond Goldie

40
Source:b-protected.com.au

41
Source: made-in-china.com

42 Published by Teck Resources November 6, 2012

43
"pinch-point" TM chart for
COPPER
$1.00
$2.00
$3.00
$4.00
0 10 20 30 40 50 60 PRODUCERS' PLUS EXCHANGE
INVENTORIES (DAYS' CONSUMPTION)
CO
PP
ER
P
RIC
E U
S$/
LBMONTH-END FIGURES
JUNE 2005 TO JULY 2012
Based on average consumption in preceding 3 months, seasonally adjusted
May 2012 July 2012
Source: ABMS, CRU, ICSG, WBMS, GFMS; adjustments and estimates by Salman Partners Inc. “Pinch-point™” is a trademark registered to Raymond Goldie

44
“Only gold is money”

45
"pinch-point" TM chart for
COPPER
2.0
3.0
4.0
5.0
6.0
7.0
8.0
9.0
10.0
11.0
12.0
13.0
0 10 20 30 40 50 60 PRODUCERS' PLUS EXCHANGE
INVENTORIES (DAYS' CONSUMPTION)
CO
PPER
PR
ICE,
OZ
GO
LD/T
ON
NE
CO
PPER
MONTH-END FIGURESJUNE 2005 TO JULY
2012
Based on average consumption in preceding 3 months, seasonally adjusted
July 2012
Source: ABMS, CRU, ICSG, WBMS, GFMS; Bloomberg; adjustments and estimates by Salman Partners Inc. “Pinch-point™” is a trademark registered to Raymond Goldie

46
FORECASTING METHOD #3:
FORWARD STRIPS

47
Copper Prices, US$/lb, as implied by LME forward strips
$2.00
$2.50
$3.00
$3.50
$4.00
$4.50
2008 2009 2010 2011 2012 2013 2014 2015 2016 2017 2018 2019 2020 2021
US$3.38/lb in 2021
US$3.46/lbin 2016
Source: LME, interpolation by Salman Partners inc., using exponential least-squares regression analysis

48
PROJECTED SEASONAL TRENDS IN THE PRICE OF NICKEL
(as projected by Statistics Canada's "X-11" program)
-20
-15
-10
-5
0
5
10
Sep'12
Oct Nov Dec'12
Jan'13
Feb Mar Apr May Jun Jul Aug'13
month-end figures
% a
bove
or
belo
w lo
ng-t
erm
tren
d
Source: LME, calculations by Salman Partners Inc.

49
NICKEL FUNDAMENTALS

50
The beauty of nickel (in the form of stainless steel): 8 Spruce St., New York, as designed by Frank Gehry. Mr. Gehry has expressed interest in building three towers, modelled on this one, on King St. West in Toronto. Source: dezzen.com
51
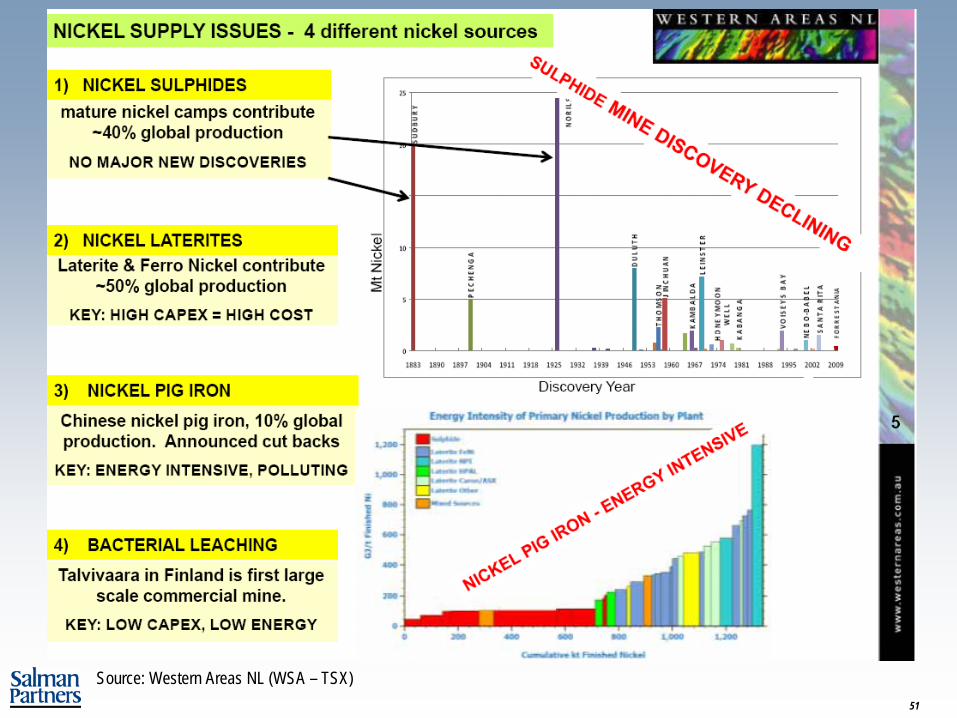
Source: Western Areas NL (WSA – TSX)

52
Source: thecolor.com

53
The Ambatovy nickel mine, Madagascar, May 2010 (photo by Raymond Goldie)

54
Source: Western Areas NL (WSA – TSX)

55
Source: China Steel

56
"pinch-point"TM chart for
NICKEL
$0.00
$2.00
$4.00
$6.00
$8.00
$10.00
$12.00
$14.00
$16.00
$18.00
$20.00
$22.00
0 50 100 150 200 250 300 350
WESTERN WORLD NICKEL INVENTORIES (DAYS' CONSUMPTION)
NIC
KEL
PR
ICE
US$
/LB
QUARTER-END DATAQ1 '75 TO Q2
'12
62.5 days' consumption
72.1 days', as of June 30, 2012
Source: INSG, WBMS, CRU, LME, GFMS, adjustments by Salman Partners Inc. “pinch-pointTM” is a trademark registered to Raymond Goldie. Note that our definition of Western world inventories includes those held by producers. Unlike the inventories registered with the London Metal Exchange (whose levels are published daily), producers’ inventories are published only once a quarter.

57
Stainless steel scrap. Source: okokchina.com

58
Nickel Prices as implied by LME forward strips
$6.00
$7.00
$8.00
$9.00
$10.00
$11.00
2008 2009 2010 2011 2012 2013 2014 2015 2016 2017 2018 2019 2020 2021
US
dolla
rs p
er p
ound
US$7.47/lb in 2016
US$7.74/lb in 2021
US$7.32/lb in 2013
Source: LME, interpolation by Salman Partners Inc., using exponential least-squares regression analysis

59
Cash out of gold and send kids to college “All the gold that has ever been mined is still in existence, but it continues to exist because it is sterile – quite literally useless.”
Source: Financial Times, August 7 2012

60 Source: cine-talkies.com

61 Source: Life magazine

62
Source: media.onsugar.com

63
Approximation of Tiffany & Co's seasonally-adjusted, quarterly sales per store in the Americas
(sales x $'000)
$2,000
$3,000
$4,000
$5,000
$6,000
$7,000
1999 2000 2001 2002 2003 2004 2005 2006 2007 2008 2009 2010 2011 2012
quarter ended July 31, 2012: down
2.8% (seasonally adjusted) from
preceding quarter
Note: These are fiscal years beginning on Feb. 1 (e.g. "2012" refers to the year beginning Feb. 1, 2012)
Source: Tiffany & Co., estimates and adjustments by Salman Partners Inc.

64
Source: monstersandcritics.com Source: amazon.com

65
PROJECTED SEASONAL TRENDS IN GOLD BULLION PRICES, US$
(as estimated by Statistics Canada's "X-11" program)
-4
-3
-2
-1
0
1
2
3
4
Sep'12
Oct Nov Dec'12
Jan'13
Feb Mar Apr May Jun Jul Aug'13
month-end figures
% a
bove
or
belo
w lo
ng-t
erm
tr
end
Month-end London PM fix. Sources: Reuters and "Platt's Metals Week", McGraw-Hill Inc.; estimates by Salman Partners Inc.

66
Month-end London PM fix. Sources: Reuters and "Platt's Metals Week", McGraw-Hill Inc.; estimates by Salman Partners Inc.
PROJECTED SEASONAL TRENDS IN SILVER PRICES, US$
(as estimated by Statistics Canada's "X-11" program)
-12-10-8-6-4-202468
1012
Sep'12
Oct Nov Dec'12
Jan'13
Feb Mar Apr May Jun Jul Aug '13
month-end figures
% a
bove
or
belo
w lo
ng-t
erm
tr
end

67
PROJECTED SEASONAL TRENDS IN GOLD BULLION PRICES, US$
(as estimated by Statistics Canada's "X-11" program)
-4
-3
-2
-1
0
1
2
3
4
Sep'12
Oct Nov Dec'12
Jan'13
Feb Mar Apr May Jun Jul Aug'13
month-end figures
% a
bove
or
belo
w lo
ng-t
erm
tr
end
Month-end London PM fix. Sources: Reuters and "Platt's Metals Week", McGraw-Hill Inc.; estimates by Salman Partners Inc.

68
October 9-14, 2012 Annual Meetings of the International Monetary Fund and the World Bank Group Tokyo
Source: IMF

69
Source: topinews.com
When is Diwali celebrated?
Diwali is celebrated for 5 days according to the lunar Hindu Calendar. It begins in late Ashwin (September–October) and ends in early Kartika (October–November).
Source: Wikipedia

70
Source: current businessnews.net
Wealthy Indian brides can spend $2 million on gold they wear on their big wedding day
Source: ABC News
India is the world’s number one consumer of gold, accounting for almost a fifth of gold sales.
There are spikes in gold demands both January and September … to meet the demands of the two Indian wedding seasons. The first… starts in November and ends in December. The second starts in late March and runs through into early May.
Source: current businessnews.net
71
India’s “demographic dividend” “when a country’s population includes a disproportionate number of young, educated, working age adults, it has a highly positive effect on the country’s economy… a large and relatively young population is entering the [India] workplace and … in 20 years, the middleclass population of India will equal half a billion”.
Source: Nandan Nilekani, Unique Identification Authority of India ; CFA Digest, CFA Institute, 2010

72
Source: stillgoingnative.com

73
Source: stillgoingnative.com

74
RECAPPING

75
1. The prices of the shares of big mining companies are driven more by equity markets than by metals markets.

76
1. The prices of the shares of big mining companies are driven more by equity markets than by metals markets.
2. The prices of the shares of big miners of base metals have been tracking the prices of the base metals themselves. But the shares have been lagging the metals.

77
1. The prices of the shares of big mining companies are driven more by equity markets than by metals markets.
2. The prices of the shares of big miners of base metals have been tracking the prices of the base metals themselves. But the shares have been lagging the metals.
3. Big companies can buy ounces of gold or pounds of copper much more cheaply on the Toronto Stock Exchange than on the metals markets.

78
1. The prices of the shares of big mining companies are driven more by equity markets than by metals markets.
2. The prices of the shares of big miners of base metals have been tracking the prices of the base metals themselves. But the shares have been lagging the metals.
3. Big companies can buy ounces of gold or pounds of copper much more cheaply on the Toronto Stock Exchange than on the metals markets.
4. Junior companies are more likely to reduce spending on exploration to conserve cash.

79
1. The prices of the shares of big mining companies are driven more by equity markets than by metals markets.
2. The prices of the shares of big miners of base metals have been tracking the prices of the base metals themselves. But the shares have been lagging the metals.
3. Big companies can buy ounces of gold or pounds of copper much more cheaply on the Toronto Stock Exchange than on the metals markets.
4. Junior companies are more likely to reduce spending on exploration to conserve cash.
5. Junior companies are more ready takeover targets than are big mining companies.

80

81
The opinions, estimates and projections contained herein are those of Salman Partners Inc. as of the date hereof and are subject to change without notice. Salman Partners makes every effort to ensure that the contents herein have been compiled or derived from sources believed reliable and contain information and opinions which are accurate and complete. However, Salman Partners makes no representation or warranty, express or implied, in respect thereof, takes no responsibility for any errors and omissions which may be contained herein and accepts no liability whatsoever for any loss arising from any use of or reliance on this report or its contents. Information may be available to Salman Partners which is not reflected herein. This report is not to be construed as, an offer to sell or solicitation for or an offer to buy, any securities. Salman Partners, its affiliates and/or their respective officers, directors or employees may from time to time acquire, hold or sell securities mentioned herein as principal or agent. Salman Partners may act as financial advisor and/or underwriter for certain of the corporations mentioned herein and may receive remuneration for same.
Upon approval by the research department and once published in final form, Salman Partners Inc. disseminates its research to all institutional clients simultaneously in electronic form. The firm subsequently disseminates this research in hard copy to those clients who have requested to be on the firm’s distribution list. In addition, Salman Partners Inc. posts its research on the Salman Partners Inc. website and on certain paid research services with which a contract of dissemination has been arranged. Access to these websites is provided using a password provided by the administrator and is limited to Salman Partners Inc.’s institutional clients. Reproduction of this report in part or in whole without permission is prohibited. All rights reserved. Salman Partners Inc.
TO U.S. RESIDENTS:
Salman Partners Inc. accepts responsibility for the contents herein, subject to the terms as set out above. Any U.S. person wishing to effect transactions in any security discussed herein should do so through a registered U.S. securities dealer.
VANCOUVER
Suite 1700, 1095 West Pender Street
Vancouver, B.C. V6E 2M6
tel (604) 685-2450
fax (604) 685-2457
CALGARY
Suite 835, 401-9th Avenue S.W.
Calgary, AB T2P 3C5
tel (403) 261-6065
fax (403) 261-6069
TORONTO
Suite 1800, 100 Yonge Street
Toronto, ON M5C 2W1
tel (416) 861-1270
fax (416) 861-1935