a systems pharmacology-based approach to identify novel
TRANSCRIPT

A systems pharmacology-based approach toidentify novel Kv1.3 channel-dependentmechanisms in microglial activationSrikant Rangaraju, Emory UniversitySyed Raza, Emory UniversityAndrea Pennati, University of WisconsinQiudong Deng, Emory UniversityEric Dammer, Emory UniversityDuc Duong, Emory UniversityMichael W. Pennington, Peptides InternationalMariadeLourdes Tansey, Emory UniversityJames Lah, Emory UniversityRanjita Betarbet, Emory University
Only first 10 authors above; see publication for full author list.
Journal Title: Journal of NeuroinflammationVolume: Volume 14, Number 1Publisher: BioMed Central | 2017-06-26, Pages 128-128Type of Work: Article | Final Publisher PDFPublisher DOI: 10.1186/s12974-017-0906-6Permanent URL: https://pid.emory.edu/ark:/25593/s3t7f
Final published version: http://dx.doi.org/10.1186/s12974-017-0906-6
Copyright information:© The Author(s). 2017This is an Open Access work distributed under the terms of the CreativeCommons Attribution 4.0 International License(https://creativecommons.org/licenses/by/4.0/).
Accessed March 14, 2022 10:15 AM EDT
Rangaraju et al. Journal of Neuroinflammation (2017) 14:128 DOI 10.1186/s12974-017-0906-6
!!!!
R E S E A R C H Open Access !
A systems pharmacology-based approach to identify novel Kv1.3 channel-dependent mechanisms in microglial activation
!
Srikant Rangaraju1* , Syed Ali Raza1, Andrea Pennati2, Qiudong Deng3, Eric B. Dammer1, Duc Duong3, Michael W. Pennington4, Malu G. Tansey5, James J. Lah1, Ranjita Betarbet1, Nicholas T. Seyfried3 and Allan I. Levey1
!!!
Abstract !
Background: Kv1.3 potassium channels regulate microglial functions and are overexpressed in neuroinflammatory diseases. Kv1.3 blockade may selectively inhibit pro-inflammatory microglia in neurological diseases but the molecular and cellular mechanisms regulated by Kv1.3 channels are poorly defined. Methods: We performed immunoblotting and flow cytometry to confirm Kv1.3 channel upregulation in lipopolysaccharide (LPS)-activated BV2 microglia and in brain mononuclear phagocytes freshly isolated from LPS-treated mice. Quantitative proteomics was performed on BV2 microglia treated with control, LPS, ShK-223 (highly selective Kv1.3 blocker), and LPS+ShK- 223. Gene ontology (GO) analyses of Kv1.3-dependent LPS-regulated proteins were performed, and the most representative proteins and GO terms were validated. Effects of Kv1.3-blockade on LPS-activated BV2 microglia were studied in migration, focal adhesion formation, reactive oxygen species production, and phagocytosis assays. In vivo validation of protein changes and predicted molecular pathways were performed in a model of systemic LPS-induced neuroinflammation, employing antigen presentation and T cell proliferation assays. Informed by pathway analyses of proteomic data, additional mechanistic experiments were performed to identify early Kv1.3-dependent signaling and transcriptional events. Results: LPS-upregulated cell surface Kv1.3 channels in BV2 microglia and in microglia and CNS-infiltrating macrophages isolated from LPS-treated mice. Of 144 proteins differentially regulated by LPS (of 3141 proteins), 21 proteins showed rectification by ShK-223. Enriched cellular processes included MHCI-mediated antigen presentation (TAP1, EHD1), cell motility, and focal adhesion formation. In vitro, ShK-223 decreased LPS-induced focal adhesion formation, reversed LPS-induced inhibition of migration, and inhibited LPS-induced upregulation of EHD1, a protein involved in MHCI trafficking. In vivo, intra- peritoneal ShK-223 inhibited LPS-induced MHCI expression by CD11b+CD45low microglia without affecting MHCI expression or trafficking of CD11b+CD45high macrophages. ShK-223 inhibited LPS-induced MHCI-restricted antigen presentation to ovalbumin-specific CD8+ T cells both in vitro and in vivo. Kv1.3 co-localized with the LPS receptor complex and regulated LPS-induced early serine (S727) STAT1 phosphorylation. Conclusions: We have unraveled novel molecular and functional roles for Kv1.3 channels in pro-inflammatory microglial activation, including a Kv1.3 channel-regulated pathway that facilitates MHCI expression and MHCI-dependent antigen presentation by microglia to CD8+ T cells. We also provide evidence for neuro-immunomodulation by systemically administered ShK peptides. Our results further strengthen the therapeutic candidacy of microglial Kv1.3 channels in neurologic diseases.
!
Keywords: Microglia, Neuroinflammation, Potassium channels, Kv1.3, Proteomics !!!!!
* Correspondence: [email protected] 1Department of Neurology, Emory University, 615 Michael Street, Suite 525, Atlanta, GA 30322, USA Full list of author information is available at the end of the article
!© The Author(s). 2017 Open Access This article is distributed under the terms of the Creative Commons Attribution 4.0 International License (http://creativecommons.org/licenses/by/4.0/), which permits unrestricted use, distribution, and reproduction in any medium, provided you give appropriate credit to the original author(s) and the source, provide a link to the Creative Commons license, and indicate if changes were made. The Creative Commons Public Domain Dedication waiver (http://creativecommons.org/publicdomain/zero/1.0/) applies to the data made available in this article, unless otherwise stated.
Rangaraju et al. Journal of Neuroinflammation (2017) 14:128 Page 2 of 20
Background Neuroinflammation is primarily mediated by microglia, the innate immune cells of the brain. Microglia have opposing pro- and anti-inflammatory roles that when dysregulated, contribute to neuroinflammatory and neu- rodegenerative disorders [1, 2]. Selective modulators of pro-inflammatory microglia that do not affect homeo- static and neuroprotective microglial functions may therefore be therapeutically relevant. Kv1.3 is a voltage- gated outward-rectifying potassium channel that is expressed by microglia, macrophages, and other immune cells, wherein it regulates membrane potential, calcium signaling, cytokine production, and proliferative re- sponses, and is a promising therapeutic target for auto- immune, neuroinflammatory, and neurodegenerative diseases [3–6]. Selective upregulation of Kv1.3 channels by microglia in disease contexts has been observed in human disease and animal models [4, 7, 8]. Pro- inflammatory microglial functions that are mediated by Kv1.3 channels include direct neurotoxicity, cytokine production, and reactive oxygen species while homeo- static functions of non-activated microglia appear to in- volve alternative cationic channels [9, 10]. Recent studies have shown that intracellular potassium concentration and potassium efflux mechanisms regulate an immune checkpoint in T cells, raising the possibility that similar roles for Kv1.3 potassium channels in microglia may also exist [11]. However, the molecular and signaling mecha- nisms regulated by Kv1.3 channels in microglia, particu- larly in pro-inflammatory-activated states, remain poorly defined. In this study of pro-inflammatory microglial ac- tivation, we first determined whether Kv1.3 channels are upregulated by pro-inflammatory stimuli in microglia in a model of acute neuroinflammation induced by lipo- polysaccharide (LPS). We then used a systems pharma- cology approach to identify Kv1.3 channel-regulated proteins in pro-inflammatory-activated and resting microglial states. These data informed in vitro and in vivo validation studies to unravel novel molecular mech- anisms, signaling pathways, and cellular functions that are regulated by Kv1.3 channels.
Methods Reagents ShK-223, an analog of sea anemone peptide ShK, was used as a highly selective Kv1.3 channel blocker (IC50 for Kv1.3 25 ± 14 pM, >10,000-fold more selective for Kv1.3 than neuronal Kv1.1 and Kv1.2 channels) [12]. The dose of ShK-223 for intravenous or intraperitoneal injections was 100 µg/kg. Concentration used for in vitro experi- ments was 100 nM. ShK-F6CA, a fluorescein-conjugated ShK analog, was purchased from Peptides International (Louisville, KY). LPS was obtained from Sigma-Aldrich (Cat #L4391, Escherichia coli 0111:B4). Fluorophore-
conjugated monoclonal antibodies for flow cytometry were obtained from BD Biosciences (CD11b-PeCy7 or APC-Cy7, CD45-PerCP or PE-Cy7, ICAM1-APC, CD69- PECy7, pS727-STAT1-Alexa647), eBiosciences (CD3- FITC, CD8-APC, CD95-PE) and Cell Signaling Technologies (pY701-STAT1-Alexa488). Primary microglia isolation and cell culture Adult (8–12-week-old) female C57BL/6 mice were eu- thanized, and the brains were isolated following rapid cold saline perfusion. Single cell suspensions from brain homogenates were washed followed by Percoll-gradient centrifugation and isolation of the mononuclear cell fraction as previously described [13]. Brain mononuclear cells (76–85% pure) were used for flow cytometric studies and for in vitro CD8+ T cell proliferation experi- ments. BV2 microglia were maintained in Dulbecco’s modified Eagle Medium (with 10% FBS). In vivo studies Mice were housed in the Department of Animal Resources at Emory University under standard conditions, no special food/water accommodations. Institutional Animal Care and Use Committee approval was obtained prior to in vivo work. Adult (8–12-week-old) female C57BL/6 mice were treated with four once daily intraperi- toneal doses of sterile PBS, ShK-223 (100 µg/kg), LPS (20 µg), or LPS+ShK-223 [14]. Mice were then anesthe- tized with isoflurane and rapidly cardiac-perfused with cold PBS over 2 min, after which microglia were isolated for flow studies or for in vitro T cell proliferation assays. Gap closure assay BV2 microglia were grown to near confluence in 12 well plates followed by exposure to PBS, ShK-223 (100 nM), LPS (100 ng/mL), or LPS+ShK-223. Two para-median scratches were placed in each well and imaged using an inverted microscope at time 0 and at 24 h and areas of each gap at each time point were calculated (ImageJ), and relative gap closure over 24 h was determined (n = 6 biological replicates per condition). Transmigration assay Fifty thousand BV2 microglia grown in serum-free DMEM were added to the upper chamber of fibronectin-coated transwell chambers (8-µm pore size, Costar Sigma-Aldrich #3464) in the presence of either PBS, ShK-223 (100 nM), LPS (100 ng/mL), or LPS+ShK- 223. Separate experiments were performed to test the effects of 100 nM ShK-186, a well-characterized selective Kv1.3 channel blocker, on LPS-induced effects on trans- migration. Cells were allowed to transmigrate over 24 h into the lower chamber containing either serum-free medium (lacking chemotactic factors) or medium

Rangaraju et al. Journal of Neuroinflammation (2017) 14:128 Page 3 of 20
supplemented with 10% FBS (to induce chemotaxis). Cy- tochalasin D (50 µM) was also added to the upper cham- ber in a separate experiment to inhibit actin-dependent transmigration into serum-containing medium. All ex- periments were carried out in biological triplicates.
Flow cytometry studies Flow cytometric analyses of BV2 microglia and freshly iso- lated primary mouse microglia as well as T cells from T cell proliferation assays were performed using well- characterized fluorophore-conjugated monoclonal anti- bodies against CD11b, CD45, ICAM1, CD69, MHCI (H2Kb), CD3, and CD8. Functional cell surface Kv1.3 channels expressed by BV2 or primary microglia were assessed using ShK-F6CA labeling via a previously vali- dated assay [15]. For primary mouse microglia studies, gating strategies were employed to differentiate resident microglia (CD11b+ CD45low) from peripherally derived brain-infiltrating macrophages (CD11b+ CD45high) [16]. Phospho-flow cytometry was performed to detect pS727 and pY701 STAT1 phosphorylation (pY701-Alexa488 ab: Cell Signaling, pS727-Alexa647: BD Biosciences) [17]. EHD1 was detected in separate experiments using anti-- EHD1 rabbit polyclonal Ab (1:100 [Abcam Cat#EPR4954]) followed by 1:500 Anti-rabbit DyLight-549 (Jackson La- boratories) after cells were fixed (Fixation buffer, eBioscience #00822249) and permeabilized (Permeabilization buffer eBioscience #00833356). Blocking with 10% horse serum and appropriate control experi- ments (unstained cells, cells treated with secondary Ab only) were performed. Compensation experiments were performed prior to each experiment using compensation beads (OneComp eBeads Thermo-Fisher Sci. #01111141). Samples were analyzed on a BD FACSCanto II flow cytometer, and data were collected with CellQuest soft- ware and analyzed with FlowJo software (Version 10).
Phagocytosis assay The ability of BV2 microglia and freshly isolated primary microglia to phagocytose red-fluorescent polystyrene 1- µm microspheres (Thermo-Fisher FluoroSpheres Cat#F13083) was assessed. Cells were exposed to 2.5 µL of the beads (≈200 beads per cell) for 30 min at 37 ° C, followed by washing and flow cytometry [18]. Fluores- cence of single microspheres was determined by running beads in isolation and proportion of cells that phagocy- tosed at least one bead was determined and compared across the treatment groups. BV2 cells were exposed to PBS, LPS, ShK-223, or LPS+ShK-223. Similarly, primary microglia were isolated from the brains of mice treated with four daily IP doses of PBS, LPS, ShK-223, or LPS +ShK-223, followed by flow cytometric analysis after la- beling with anti-CD11b and anti-CD45 fluorophore- conjugated antibodies.
Reactive oxygen species assay Freshly isolated brain mononuclear cells from mice (treated with PBS, LPS, ShK-223 or LPS+ShK-223) were incubated with 5 µM dichlorofluorescein diacetate (DCFDA, Thermo-Fisher #D399) for 30 min, washed in PBS and then analyzed by flow cytometry. DCFDA is a cell-permeant dye that is de-acetylated by cellular ester- ases to a non-fluorescent compound which is then oxidized by hydroxyl, peroxyl, and other reactive oxygen species (ROS) to a green fluorescent compound that can be measured by fluorescence microscopy or flow cytometry. Immunofluorescence microscopy BV2 cells were grown on glass coverslips and exposed to LPS, ShK-223, or LPS+ShK-223 for 24 h, washed twice with PBS and then treated with ShK-F6CA (100 nM) for 30 min, then fixed using 4% formaldehyde for 15 min. In separate experiments, BV2 cells were incubated with anti-EHD1 rabbit polyclonal antibody (Abcam Cat#EPR4954) as well. Following fixation, the cells were washed and permeabilized with 2 mL 0.1% Triton X-100 in PBS for 15 min on ice. Cells were washed thrice followed by image acquisition on an immunofluores- cence microscope (Microscope: Olympus BX51 and camera: Olympus DP70). Cells were also incubated with anti-CD14-PE antibody and co-localization between ShK-F6CA and anti-CD14 labeling was determined by immunofluorescence microscopy and image processing using ImageJ software. Mass spectrometry sample preparation Samples were prepared essentially as described (CITE CELLS SYSTMES) with slight modifications [19]. BV2 microglia were grown to 75% confluence and then exposed to PBS, LPS (100 ng/mL), ShK-223 (100 nM), or LPS+ShK-223 for 24 h and then harvested. Each cell pellet was individually homogenized in 300 µL of urea lysis buffer (8 M urea, 100 mM NaHPO4, pH 8.5), in- cluding 3 µL (100× stock) HALT protease and phosphat- ase inhibitor cocktail (Pierce). All homogenization was performed using a Bullet Blender (Next Advance) ac- cording to manufacturer protocols and as previously published [20]. Briefly, each cell pellet was added to Urea lysis buffer in a 1.5-mL Rino tube (Next Advance) harboring 750 mg stainless steel beads (0.9–2 mm in diameter) and blended twice for 5-min intervals in the cold room (4 °C). Protein supernatants were transferred to 1.5-mL Eppendorf tubes and sonicated (Sonic Dis- membrator, Fisher Scientific) three times for 5 s with 15 s intervals of rest at 30% amplitude to disrupt nucleic acids and subsequently vortexed. Protein concentration was determined by the bicinchoninic acid (BCA) method, and samples were frozen in aliquots at −80 °C.

Rangaraju et al. Journal of Neuroinflammation (2017) 14:128 Page 4 of 20
Protein homogenates (100 µg) were diluted with 50 mM NH4HCO3 to a final concentration of less than 2 M urea and then treated with 1 mM dithiothreitol (DTT) at 25 °C for 30 min, followed by 5 mM iodoacetimide (IAA) at 25 °C for 30 min in the dark. Protein was digested with 1:100 (w/w) lysyl endopeptidase (Wako) at 25 °C for 2 h and fur- ther digested overnight with 1:50 (w/w) trypsin (Promega) at 25 °C. Resulting peptides were desalted with a Sep-Pak C18 column (Waters) and dried under vacuum. For LC- MS/MS analysis, derived peptides were re-suspended in 100 µL of loading buffer (0.1% formic acid, 0.03% trifluor- oacetic acid, 1% acetonitrile). Peptide mixtures (2 µL) were separated on a self-packed C18 (1.9 µm, Dr. Maisch, Germany) fused silica column (25 cm × 75 µM internal diameter (ID); New Objective, Woburn, MA) by a Dionex Ultimate 3000 RSLCNano and monitored on a Fusion mass spectrometer (Thermo-Fisher Scientific, San Jose, CA). Elution was performed over a 2 h gradient at a rate of 400 nL/min with buffer B ranging from 3 to 80% (buffer A: 0.1% formic acid in water, buffer B: 0.1% formic acid in acetonitrile). The mass spectrometer cycle was pro- grammed to collect at the top speed for 3-s cycles. The MS scans (400–1600 m/z range; 200,000 AGC; 50 ms maximum ion time) were collected at a resolution of 120,000 at 200 m/z in profile mode and the HCD MS/MS spectra (0.7 m/z isolation width; 30% collision energy; 10,000 AGC target; 35 ms maximum ion time) were de- tected in the ion trap. Dynamic exclusion was set to ex- clude previous sequenced precursor ions for 20 s within a 10 ppm window. Precursor ions with +1 and +8 or higher charge states were excluded from sequencing.
MaxQuant for label-free quantification and data analysis Raw data files were analyzed using MaxQuant v1.5.2.8 with Thermo Foundation 2.0 for RAW file reading cap- ability, as previously published [20]. The search engine Andromeda was used to build and search a concatenated target-decoy IPI/Uniprot mouse reference (downloaded Aug 14, 2015). Protein methionine oxidation (+15.9949 Da) and protein N-terminal acetylation (+42.0106 Da) were variable modifications (up to five allowed per peptide); cysteine was assigned a fixed car- bamidomethyl modification (+57.0215 Da). Only fully tryptic peptides were considered with up to two misclea- vages in the database search. A precursor mass tolerance of ±10 ppm was applied prior to mass accuracy calibra- tion and ±4.5 ppm after internal MaxQuant calibration. Other search settings included a maximum peptide mass of 6000 Da, a minimum peptide length of six residues, and 0.6 Da Tolerance for ion trap (IT) HCD MS/MS scans. Co-fragmented peptide search was enabled to deconvolute multiplex spectra. The false discovery rate (FDR) for peptide spectral matches, proteins, and site decoy fraction were all set to 1%. Quantification settings
were as follows: re-quantify with a second peak finding attempt after protein identification has completed; match full MS1 peaks between runs; a 1.5-min retention time match window was used after an alignment func- tion was found with a 20 min RT search space. The label-free quantitation (LFQ) algorithm in MaxQuant [21, 22] was used for protein quantitation. Volcano plots were plotted with ggplot2 packages in R. Proteins with >25% overall missing data or more than one missing data point per treatment group were excluded from analysis. Statistical and gene ontology pathway analysis One-way ANOVA (p ≤ 0.05) was used as the first thresh- old for differences across treatment groups. Then, a two-tailed Student’s t test was performed comparing the LPS and control groups and proteins that showed statis- tically significant (p ≤ 0.05), and at least 1.25-fold change in both directions were identified. Within these LPS-re- gulated proteins, pairwise comparisons between LPS- and LPS+ShK-223-treated groups were performed (threshold p ≤ 0.05). A less-stringent approach (p value ≤0.10) for all comparisons described was also taken. Proteins which had expression altered by ShK-223 treat- ment without LPS were also identified by performing pairwise comparisons between the control and ShK-223 groups (p ≤ 0.05 and at least 1.25 fold change in either direction). Gene ontology (GO) analyses were performed using the following lists of proteins (list 1: All LPS-regu- lated proteins with reversal by ShK-223; list 2: LPS- upregulated proteins with reversal by ShK, list 3: LPS- downregulated proteins with reversal by ShK, list 4: ShK-upregulated without LPS, and list 5: ShK- downregulated without LPS) with the background of all sequenced mouse proteins in the entire dataset (3141 proteins). Functional enrichment was determined using the GO-Elite (v1.2.5) package [20, 23]. The set of total proteins identified was used as the background. Z-score determines overrepresentation of ontologies in a module, and permutation P value was used to assess the significance of the Z-score. For these significantly changed proteins, a Z-score cutoff of 1.96, with p value cutoff of 0.05 with a minimum of three proteins per category were used as filters in pruning the ontologies. Circle plots were plotted with circlize package in R software and exploratory pathway analyses were performed using the most highly enriched GO terms in each list using canonical pathway analysis in Metacore (Thomson-Reuters) [24]. This manu- ally curated database captures high-quality experimental evidence from peer-reviewed literature and through curating interactions, omics-disease relationships, and constructing canonical pathways from these omics experi- ments and allows reduction of high dimensional data into a systems biology context.
Rangaraju et al. Journal of Neuroinflammation (2017) 14:128 Page 5 of 20
OT-1 CD8+ T cell proliferation assay by CFSE dilution Ovalbumin (Ova 257-264)-specific CD8-positive T cells were isolated from the spleen of adult OT-1 mice using standard protocols for T cell enrichment (EasySep Kit #19751, Stemcell Tech). T cells were labeled with CFSE (CellTrace™ Cat# C34554) and 100,000 cells were co- cultured with 20,000 Ova-loaded microglia (2 µg/mL for 30 min, Sigma Cat#S7951) that were derived from either (i) BV2 microglia pre-treated with PBS, LPS, ShK-223, or LPS+ShK-223 for 24 h or (ii) primary microglia freshly isolated from the brains of mice that had been treated with four daily IP doses of PBS, LPS, ShK-223, or LPS +ShK-223 as described. After 48 h, T cells were harvested and assessed for CFSE dilution by flow cytometry [18].
Reverse transcriptase quantitative PCR Real-time PCR was performed as previously reported [25]. Total RNA was isolated from cells using a standard Trizol (Invitrogen) extraction protocol using an RNeasy mini extraction kit (Qiagen) according to the manufac- turer’s instructions. RNA was converted to cDNA using a high-capacity cDNA reverse transcription kit (Ambion). Real-time PCR was performed on a 7500 Fast RT-PCR instrument (Applied Biosystems) using 20 ng/uL cDNA, TaqMan PCR master mix (Applied Biosystems), and gene-specific TaqMan probes (Applied Biosys- tems) against TAP1 (Mm00443188_m1), EHD1 (Mm01236839_m1), IRF1 (Mm01288580_m1), IRF7 (Mm00516793_g1), NFkB (Mm00476361_m1), IL1B (Mm00434228_m1), Arg1 (Mm00475988_m1), GAPDH (Mm99999915_g1), and HPRT (Mm03024075_m1). For each RNA sample, each primer set was run in triplicate. Gene expression was normalized to the internal control GAPDH (for BV2 microglia) or HPRT (for primary micro- glial cells), and relative expression was calculated for each gene using the 2ΔΔCT method after normalizing to the control sample.
Western blot experiments Western blot studies were performed per our standard protocols [7]. After overnight protein transfer, PVDF membranes were blocked with 5% fat-free milk for 1 h followed by incubation with primary antibodies over- night. The immunoblots were incubated with anti-Kv1.3 rabbit polyclonal antibody (APC 101, Alomone labs, 1:1000) and anti-beta-actin mAb (Cell Signaling, #3873,1:1000) for 24 h and subsequently appropriate fluorescent secondary antibodies (anti-mouse IgG IRDye® 800 conjugate, Rockland, 1:20,000 and anti- rabbit IgG Alexa Fluor® 680 conjugate, Invitrogen) were added for 1 h. An Odyssey Scanner (LI-COR) was used to visualize labeled proteins.
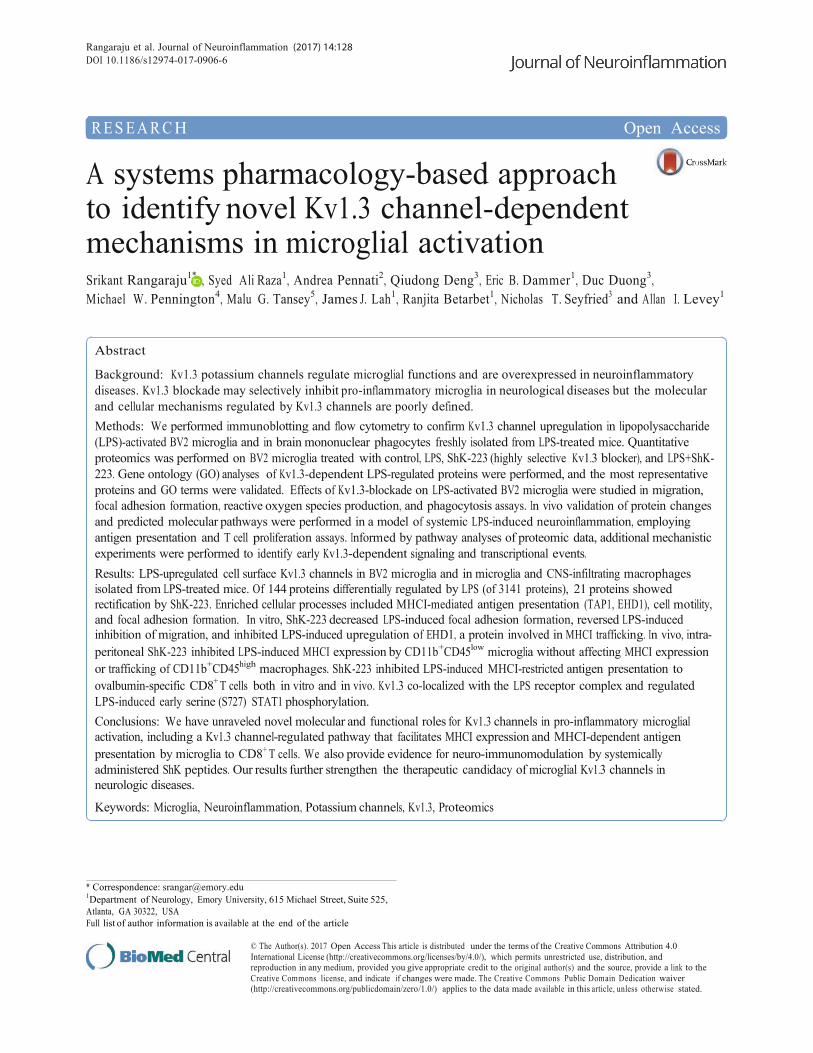
Other statistical considerations Graphs were created using Graphpad Prism Version 5 or SPSS Version 22. Data are shown as mean ± SEM. For group-wise comparisons, one-way ANOVA was per- formed to detect differences across groups and post hoc pairwise comparisons were performed using Tukey’s HSD test. Paired analyses were performed for pairwise comparisons of normalized qRT-PCR data. Statistical significance was set at p value ≤0.05 for all experiments unless separately specified. Results Kv1.3 channel upregulation by microglia and brain- infiltrating macrophages following LPS activation LPS, a bacterial endotoxin, is a prototypic pro- inflammatory activator of microglia and macrophages that has pleiotropic systemic and neuro-inflammatory effects that recapitulate chronic inflammation in neurodegenera- tive diseases [26, 27]. We first investigated whether Kv1.3 channels are upregulated following LPS-induced pro- inflammatory activation of microglia, using both in vitro and in vivo models. BV2 microglia were stimulated in vitro with LPS (100 ng/mL) for 24 h to mimic pro- inflammatory activation. We found that LPS-upregulated Kv1.3 channel protein expression by BV2 microglia by im- munofluorescence microscopy (Fig. 1a) and observed an LPS dose-dependent increase in Kv1.3 protein by im- munoblotting (Fig. 1b). We then utilized a previously vali- dated fluorescent assay for functional and Kv1.3 channel detection that uses a green fluoresceinated ShK analog (ShK-F6CA) that binds to cell surface Kv1.3 channels with high selectivity and affinity (IC50 = 49 pM) at 1:1 stoichi- ometry [15]. ICAM-1, an activation marker of microglia, was also used to confirm LPS-induced activation. As ex- pected, ShK-F6CA labeling of cell surface Kv1.3 channels was increased after LPS activation as compared to resting BV2 microglia in immunofluorescence (Fig. 1c) and flow cytometric experiments (Fig. 1d). ShK-F6CA labeling of Kv1.3 channels could be blocked by competition via pre-- incubation with saturating concentrations of non- fluorescent Kv1.3-blocking ShK analog ShK-223 (Additional file 1: Figure S1). We also confirmed LPS- induced pro-inflammatory activation of BV2 microglia as demonstrated by higher surface ICAM1, MHCII, and CD69 expression (Fig. 1d–e) [28].
BV2 microglia are a suitable model to study pro- inflammatory LPS activation but significant differences between BV2 and primary microglia have been observed, and as a result, observations using BV2 microglia need to be validated using primary microglia [29, 30]. To bet- ter mimic in vivo microglial activation, we administered LPS to adult wild-type mice (single 10-µg injection by tail vein, Fig. 2a) [14]. Brain mononuclear cells were iso- lated from the brain and labeled for CD11b, CD45,

Rangaraju et al. Journal of Neuroinflammation (2017) 14:128 Page 6 of 20 !!!!!!
Fig. 1 LPS-activated BV2 microglia upregulate Kv1.3 channels. a Immunofluorescence microscopic comparison of Kv1.3 protein expression (detected by Anti-Kv1.3 rabbit pAb 1:500) by unstimulated and LPS-activated (100 ng/mL " 24 h) BV2 microglia. b Western blot confirmation of LPS dose-dependent increase in Kv1.3 protein in BV2 whole-cell lysates (Anti-Kv1.3 pAb 1:1000). c Immunofluorescence microscopic comparison of cell surface Kv1.3 channels in unstimulated and LPS-activated BV2 cells using ShK-F6CA. d Flow cytometric comparison of ShK-F6CA-labeled cell surface Kv1.3 channels and microglial activation marker ICAM-1 in unstimulated and LPS-activated BV2 cells. e Assessment of microglial activation markers MHCII and CD69 in unstimulated and LPS-activated BV2 cells
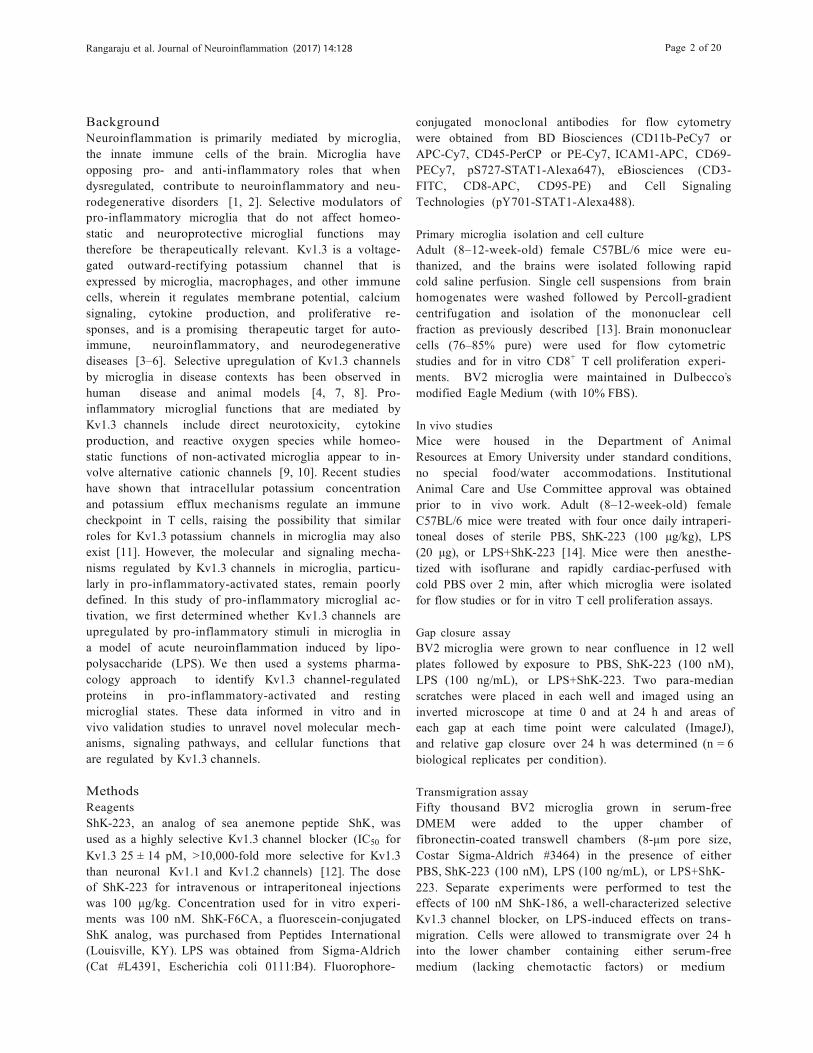
!ICAM-1, and ShK-F6CA. Microglia (CD11b+CD45low) accounted for the majority of isolated cells while brain- infiltrating macrophages (CD11b+CD45high) accounted for a minority (Fig. 2b). As compared to PBS-treated an- imals, microglia (Fig. 2d) and macrophages (Fig. 2e) iso- lated from the brains of LPS-treated animals expressed higher levels of ICAM-1 and ShK-F6CA labeling. Inter- estingly, baseline level of Kv1.3 channel expression was also higher in CD45high brain-infiltrating macrophages as compared to that in CD45low microglia and the
magnitude of Kv1.3 channel upregulation by LPS was also highest in the CD45high macrophage population (Fig. 2c-d). CD11b# cells, in contrast to CD11b+ cells, did not exhibit changes in ICAM1 or Kv1.3 channel ex- pression (Fig. 2e). LPS-treated mice also had a greater proportion of macrophages in the brain, indicating in- creased steady state levels, trafficking, or blood–brain barrier permeability induced by systemic inflammation. As compared to brain-infiltrating macrophages, Kv1.3 channel expression was found to be very low in splenic

Rangaraju et al. Journal of Neuroinflammation (2017) 14:128 Page 7 of 20 !!!!!!
Fig. 2 In vivo demonstration of Kv1.3 channel upregulation by microglia and brain-infiltrating macrophages in a mouse model of LPS-induced neuroinflammation. a LPS was administered to adult C57BL/6 mice by tail vein injection, and brain mononuclear cells were analyzed by flow cytometry (CD11b, CD45, ShK-F6CA, and ICAM-1). b Most cells were CD11b+CD45low microglia while small populations of brain-infiltrating macrophages CD11b +CD45high and CD11b- non-myeloid cells were observed. c–e Comparison of Kv1.3 channel and ICAM-1 expression in brain mononuclear cells isolated from control and LPS-treated mice in microglia (c), brain-infiltrating macrophages (d), and CD11b- subpopulations (e) (*p < 0.05, **p < 0.01, ***p < 0.005)
!!!
macrophages (Additional file 1: Figure S2). These data demonstrate upregulation of Kv1.3 channels by microglia and brain-infiltrating macrophages following LPS activa- tion, in both microglial cell line and in vivo model of LPS activation.
Quantitative proteomics reveals Kv1.3-dependent processes in pro-inflammatory and resting microglia Our data show that upregulation of Kv1.3 channels par- allels pro-inflammatory LPS-induced microglial activa- tion in BV2 as well as primary mouse microglia. Potassium channels regulate membrane potential and calcium signaling in immune cells and, through their co- assembly with key signaling complexes during immune activation, regulate specific signaling cascades that in turn impact gene transcription and cellular processes [31]. To investigate the molecular mechanisms in pro- inflammatory microglial activation that are regulated by Kv1.3 channels, we performed unbiased proteomic screens of unstimulated and LPS-activated BV2 micro- glia, in the presence or absence of a potent Kv1.3 chan- nel blocker ShK-223 (100 nM). As expected, LPS activation (100 ng/mL) induced clear morphological
differences at 24 h (Additional file 1: Figure S3). No changes in cell viability were noted across treatment conditions. At the 24-h time point, we identified 3141 proteins across 12 proteomic datasets (Control, ShK- 223, LPS, LPS+ShK-223; n = 3/group) of which 81.6% proteins had no missing data (Additional file 1: Figure S4). Of these 3141 proteins (Additional file 2: Table S1- S2), 450 were differentially expressed across the four groups (ANOVA p value $0.05). Of these 450 proteins (Fig. 3a), 144 were either significantly up- or downregu- lated by LPS stimulation (fold change &1.25 and pairwise t test p $0.05 comparing LPS vs. control). This list was also consistent with previously published proteomic data (35.9% agreement) and transcriptomic data (94.4% agree- ment) from LPS-treated mouse microglia (Additional file 2: Table S3) [32, 33]. As predicted, GO analysis of the 144 LPS-regulated proteins confirmed that LPS activa- tion resulted in enrichment of pro-inflammatory biological functions, cell proliferation, and immune activation and qRT-PCR confirmed upregulation of pro- inflammatory genes IL1B, IRF1, and IRF7 and down regulation of Arg1 (Additional file 1: Figure S5). Top proteins that were downregulated by LPS treatment
Rangaraju et al. Journal of Neuroinflammation (2017) 14:128 Page 8 of 20 !!!!!!
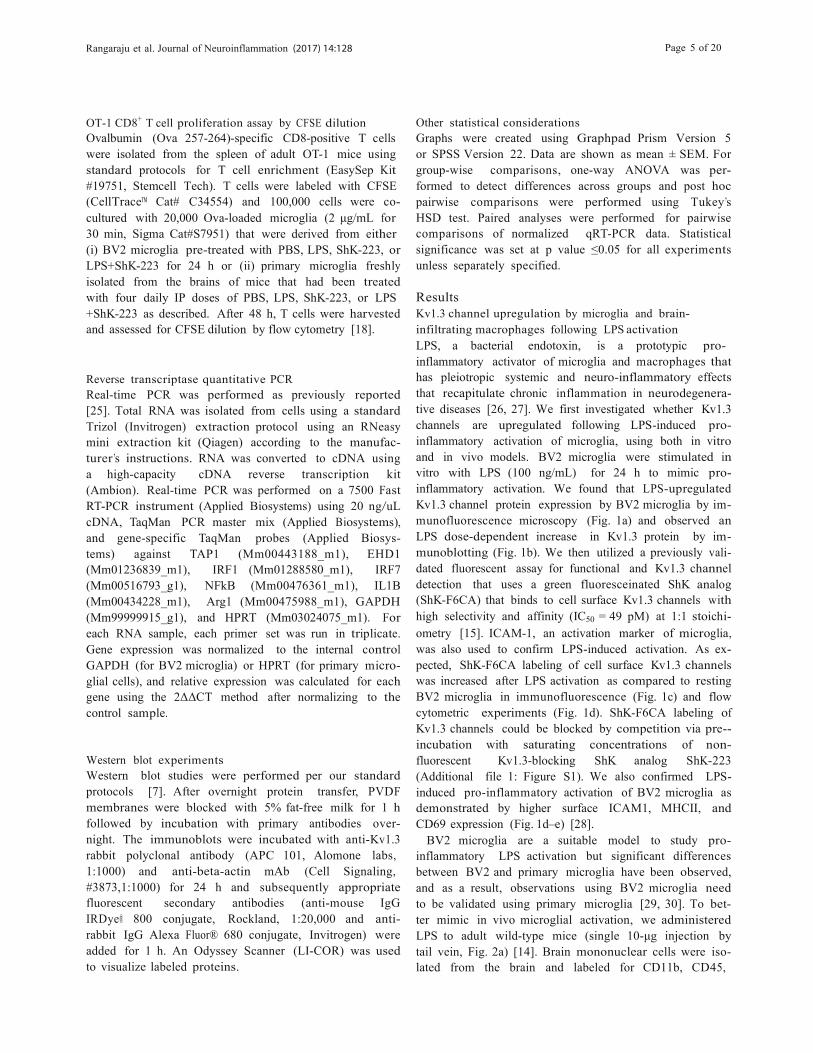
Fig. 3 Identification of novel Kv1.3 channel-dependent molecular mechanisms by microglial quantitative proteomics. BV2 microglia were exposed to PBS, LPS (100 ng/mL), ShK-223 (100 nM), or LPS+ShK-223 for 24 h (3 replicates/group) and whole-cell lysates were used for mass-spectrometric analysis.a Volcano-plot: Of 450 proteins differentially expressed across all 4 groups (black dots), 144 proteins were significantly up- or downregulated following LPS exposure (top-right and top-left quadrants; vertical dotted lines represent the upper and lower boundaries of 1.25-fold change threshold while the horizontal dotted line represents p value threshold of 0.05 comparing LPS vs. control groups). Among these, ShK-223 reversed the LPS effect in 21 proteins (highlighted in red). b LPS-upregulated proteins that were reversed by ShK-223 and c LPS-downregulated proteins reversed by ShK-223 are shown. Relative expression represents label-free quantitation data in each treatment condition normalized to the control PBS group. The dotted horizontal line represents the twofold change threshold as compared to the PBS group. d–f Circle plots representing results from GO analyses are shown (gray: protein/gene symbol, red: biological process, green: cellular component, purple: molecular function). Only significantly enriched GO terms (unadjusted p $ 0.05 based on enrichment score) are shown (*p < 0.05, **p < 0.01, ***p < 0.005). d GO analysis of 21 LPS-regulated Kv1.3-dependent proteins (n = 21, stringent p $ 0.05 threshold comparing LPS vs. LPS+ShK-223). e GO analysis of LPS-upregulated Kv1.3-dependent proteins (n = 26, p $ 0.10 threshold comparing LPSvs. LPS+ShK-223). f GO analysis of LPS-downregulated Kv1.3-dependent proteins (n = 40, p $ 0.10 threshold comparing LPS vs. LPS+ShK-223)
!!
included known anti-inflammatory microglial proteins (ARG1), DNAJC21, LUC7L, and transcription factor Jun (see Additional file 2: Table S1 for complete list). Among the 144 LPS-regulated proteins, 21 showed statistically significant reversal (p $ 0.05) of the LPS effect by ShK- 223 (Fig. 3a–c). Ten of these were proteins that were up- regulated by LPS (Fig. 3b) while 11 were proteins down- regulated by LPS (Fig. 3c). EHD1 and TAP1 proteins demonstrated the highest upregulation while SPP1 and GABPA showed the most downregulation following LPS exposure. We confirmed by immunofluorescence mi- croscopy that EHD1 protein expression was increased by LPS, and this effect was reversed by ShK-223 treatment (Additional file 1: Figure S6). However, we did not ob- serve an effect of ShK-223 on LPS-induced TAP1 and EHD1 transcription in BV2 microglia by qRT-PCR. A combined GO analysis of these 21 proteins revealed
enrichment of several biological process terms including “taxis,” “cell motility” and “positive and negative regula- tion of biological processes,” “defense response,” and “protein oligomerization” (Fig. 3d) suggesting that Kv1.3 channels may regulate cell motility and taxis in LPS- activated microglia. Using less-stringent criteria (p $ 0.1 comparing LPS vs. LPS+ShK-223), an additional 46 LPS- regulated and Kv1.3-dependent proteins were identified. Among the LPS-upregulated Kv1.3 channel-dependent proteins (n = 27), the top enriched GO terms (Fig. 3e) were biological process terms “regulation of GTPase ac- tivity,” “immune process regulation,” and “intracellular protein transport (Fig. 3e).” Several of these proteins were localized to plasma membrane. GO analysis of LPS-downregulated Kv1.3-dependent proteins (n = 40) showed enrichment of the biological process term “RNA metabolic process” and were localized to the nucleus
Rangaraju et al. Journal of Neuroinflammation (2017) 14:128 Page 9 of 20
suggesting a novel role for Kv1.3 channels in regulating nuclear and RNA processes (Fig. 3f ). We also identified significant effects of Kv1.3 channel blockade on 53 pro- teins (≥1.25 fold change and p ≤ 0.05) in unstimulated BV2 microglia (24 upregulated and 29 downregulated by ShK-223, Additional file 2: Table S4) of which two pro- teins (TMF1 and VRK1) were common to those also al- tered by LPS activation. GO analyses showed enrichment of cellular component term “organelle mem- brane” for proteins upregulated by ShK-223 and of bio- logical process term “cellular macromolecule catabolic process” for proteins downregulated by ShK-223. Our results identify novel Kv1.3 channel-dependent proteins and predict regulatory roles for Kv1.3 channels in micro- glial taxis, focal adhesion formation, antigen and intra- cellular protein transport, and RNA processing.
Kv1.3 channels regulate taxis and focal adhesion formation in LPS-activated microglia GO analyses of our proteomic data suggest a role for Kv1.3 channels in cell adhesion and taxis in LPS- activated microglia. Therefore, we hypothesized that Kv1.3 channels regulate LPS-induced migratory re- sponses to local tissue injury and regulate formation of focal adhesion complexes in BV2 microglia. In the gap closure assay of taxis, microglia respond to a local tissue injury (scratch) by chemotaxis and proliferation to close the gap within 24 h. This homeostatic function was inhibited by LPS, presumably due to increased adhesive- ness of activated microglia. While ShK-223 had no direct effect on gap closure, ShK-223 pre-incubation partially reversed the inhibitory effect of LPS (Fig. 4a). In the transmigration assay, LPS inhibited migration of BV2 cells from the upper chamber towards serum-containing medium in the lower chamber while Kv1.3 blockade by ShK-223 rectified this inhibition. As compared to con- trol, ShK-223 also augmented transmigration towards serum. Minimal migration of BV2 cells was observed in the absence of serum in the lower chamber (Fig. 4b). ShK-186, a well-characterized and highly selective inhibi- tor of Kv1.3 channels, also demonstrated similar effects on transmigration (Fig. 4b). Kv1.3 channel blockade also decreased LPS-induced increase in F-actin-enriched focal adhesion complexes in BV2 microglia (Fig. 4c). Un- like gap closure and focal adhesion complex formation in microglia, we found in in vivo experiments that LPS- induced reactive oxygen species production measured by the DCFDA assay (Fig. 4d) and LPS-augmented phago- cytosis of red-fluorescent polystyrene microspheres (Fig. 4e) in brain mononuclear cells were not affected by Kv1.3 channel blockade. These results validate predic- tions based on our proteomic data and confirm that Kv1.3 channels regulate LPS-induced focal adhesion formation as well as inhibition of migration.
Kv1.3 channels regulate EHD1, TAP1, GABPA, and pro- inflammatory gene expression in primary mouse microglia Our proteomic findings were derived from BV2 micro- glia, an immortalized cell line that has been found not to adequately represent primary microglia [34]. Therefore, we performed validation studies of our proteomic find- ings in freshly isolated CNS MPs from wild-type adult mice what were treated with four daily IP doses of either PBS, ShK-223, LPS, or LPS+ShK-223 (Fig. 5a). One-third of CNS MPs were used for flow cytometry to detect EHD1 along with CD11b and CD45 while the rest were used qRT-PCR experiments (Fig. 5a). In flow cytometric studies of permeabilized cells, we found that EHD-1 was strongly upregulated in the CD11b+ CD45low microglial population of CNS MPs and ShK-223 inhibited this up- regulation (Fig. 5b). ShK-223 treated mice (without LPS exposure) also demonstrated lower proportions of EHD1-positive cells compared to PBS-treated mice. CD11b+ CD45high CNS-infiltrating macrophages did not demonstrate any significant changes in EHD1 with LPS or ShK-223 treatment. We were unable to detect TAP1 by flow cytometric methods. In qRT-PCR studies of purified CNS MPs (Fig. 5c), we observed that LPS up- regulated the expression of pro-inflammatory gene IL1B while ShK-223 inhibited LPS-induced IL1B upregulation. TAP1 mRNA expression was upregulated by LPS while ShK-223 inhibited this LPS-induced effect; although, EHD1 mRNA expression was not significantly altered across the treatment groups. GABPA mRNA also dem- onstrated ShK-223-induced upregulation in CNS MPs; although, LPS did not alter GABPA mRNA expression in CNS MPs. Overall, these validation studies at the pro- tein and mRNA levels using freshly isolated primary microglia validate the top Kv1.3 channel-dependent pro- tein expression changes observed in BV2 cells (TAP1, EHD1, and GABPA). Kv1.3 channels regulate MHCI trafficking and MHCI-restricted antigen presentation by LPS-activated microglia Among the Kv1.3 channel-regulated proteins, EHD1 and TAP1 demonstrated the highest LPS upregulation. TAP1, along with TAP2, forms a pore in the endoplas- mic reticulum membrane that allows processed antigenic peptides to enter the ER and assemble with MHCI [35]. Prior work has also shown that knockdown of TAP1 also inhibits LPS-mediated MHCI expression by macro- phages [36]. Tapasin (TAPBP), also upregulated by LPS but is not affected by ShK-223 in our experiments, facili- tates this process [37]. Antigen-MHCI complexes are then transported to the cell surface via a process that involves EHD1 [38]. Therefore, we hypothesized that LPS- induced TAP-1/EHD-1 upregulation facilitates MHCI trafficking and antigen presentation to CD8+ T cells in an

Rangaraju et al. Journal of Neuroinflammation (2017) 14:128 Page 10 of 20 !!!!!!
Fig. 4 Kv1.3 channels regulate microglial taxis and formation of F-actin complexes induced by LPS. a In the gap closure assay of microglial taxis, BV2 cells were grown to near confluence followed by placement of a uniform scratch using a 200-µm pipette tip. Ability of microglia to close this gap was assessed by measuring the percentage of gap closure over a 24-h period. Paired (0 and 24 h) representative images from each treatment group are shown (a, left), and the comparison of percentage gap closure (over 24 h) is shown (a, right) (six replicates per condition). b BV2 microglial transmigration across a transwell membrane (8-µm pore diameter) after exposure to control, ShK-223, ShK-186, LPS or LPS+ShK-223, or ShK-186, towards serum-containing medium (10% fetal bovine serum). Following 24 h of transmigration, cells were detached from undersurface of the insert (0.25% Trypsin), and cells that successfully migrated across the membrane were counted on a hemocytometer (n = 3, independent experiments). c Comparison of F-actin containing focal adhesion complexes in BV2 microglia following exposure to control, ShK-223, LPS, or LPS+ShK-223. Fixed and permeabilized BV2 cells were labeled with phalloidin-rhodamine to detect F-actin (left: immunofluorescence images). The number of focal complexes were counted per cell at "40 magnification (right) and compared (>25 cells counted per condition). d DCFDA assay of ROS production by brain mononuclear cells isolated from C57BL/6 mice treated with PBS, LPS, ShK-223, or LPS+ShK-223 IP for four consecutive days (n = 3, mice/group). Cells were loaded with DCFDA for 30 min and assayed for ROS activity by flow cytometry. e Flow cytometric phagocytosis assay of fluorescent (PE) microbeads by brain mononuclear cells isolated from C57B6/L mice treated with PBS, LPS, ShK-223, or LPS+ShK-223, n = 3/group). Dotted line: fluorescence of cells not exposed to beads; gray histogram: PBS-treated; black histogram: LPS-treated. The proportions of all phagocytic cells and highly phagocytic cells were compared across treatment groups (*p < 0.05, **p < 0.01, ***p < 0.005)
!!
antigen-specific manner and that Kv1.3 blockade inhibits these processes. We observed that MHCI proteins (H2Kb, H2D, and '2 microglobulin as well as TAP1, TAP2, and TAPBP were upregulated by LPS in our proteomics
experiments; although, only TAP1 showed reversal by ShK-223 (Fig. 6a). In flow cytometric studies of LPS- treated BV2 microglia, MHCI surface expression was also increased; although, ShK-223 did not impact MHCI

Rangaraju et al. Journal of Neuroinflammation (2017) 14:128 Page 11 of 20 !!!!!!
Fig. 5 Kv1.3 channels regulate TAP1, EHD1, GABPA, and IL1B expression in primary murine microglia. a Experimental plan for in vivo studies: adult C57BL/6 mice received four daily IP doses of PBS, ShK-223, LPS, or LPS+ShK-223, and brain mononuclear cells were isolated for flow cytometry from one hemisphere and qRT-PCR studies from the other hemisphere (n = 3, mice/group). b Results from flow cytometric studies measuring intracellular EHD1 protein expression in freshly isolated CNS MPs (gated first on live cells, followed by CD11b+ CD45low and CD11b+ CD45high populations). Atleast 10,000 live CNS MPs were counted per sample. Left: Example of flow cytometric histograms comparing EHD1 expression in CD11b+ CD45low
microglia from one mouse from each treatment group. Right: Quantitative analysis of EHD1+ cells in CD11b+CD45low and CD11b +CD45high populations. c Results from pRT-PCR studies measuring mRNA expression of TAP1, EHD1, GABPA, and IL1B in CNS MPs. For these studies, all CNS MPs isolated from one hemisphere were used for RNA extraction in Trizol, followed by cDNA preparation followed by quantitative PCR. HPRT was used as the housekeeping gene. Data normalized to HPRT were then normalized to PBS-treated control samples (*p < 0.05, **p < 0.01, ***p < 0.005).
!expression. The lack of an effect of ShK-223 on surface MHCI in BV2 cells may have been a result of the persist- ent low-level of activation of BV2 microglia. A saturating effect of LPS on MHCI protein synthesis may have also overshadowed any effect on MHCI assembly and traffick- ing. In order to overcome this limitation of our in vitro
BV2 model, we tested this hypothesis in vivo. Adult C57BL/6 mice were given four daily intraperitoneal injec- tions of PBS, ShK-223, LPS, or LPS+ShK-223 (Fig. 6b). Flow cytometric studies of brain mononuclear cells showed that MHCI expression in CD11b+CD45low micro- glia was increased following LPS treatment while ShK-223

Rangaraju et al. Journal of Neuroinflammation (2017) 14:128 Page 12 of 20 !!!!!!
Fig. 6 LPS-induced MHCI trafficking in microglia involves Kv1.3 channels. a Comparison of MHCI and MHCI-related protein expression in BV2 proteomic data. Normalized LFQ data (compared to control-treatment) is shown (three replicates/group). b Experimental plan for in vivo studies: Adult C57BL/6 mice received four daily IP doses of PBS, ShK-223, LPS, or LPS+ShK-223 and brain mononuclear cells were isolated for flow cytometry (pooled n = 9/group). c Comparison of MHCI (H2Kb) expression (median fluorescence intensity) in CD11b+ CD45low microglia. d Representative flow cytometry frequency histograms of MHCI expression in CD11b+ CD45low microglia. e Comparison of MHCI expression in CD11b+CD45high brain-infil- trating macrophages. f Comparison of the proportions of CD11b+CD45high CNS macrophages (among all CD11b+ cells) in the four treatment groups (*p < 0.05, **p < 0.01, ***p < 0.005)
!!
inhibited this effect (Fig. 6c–d). This inhibitory effect of ShK-223 was not significant in CD45high brain-infiltrating macrophages (Fig. 6e). LPS also significantly increased the proportion of CD45high brain-infiltrating macrophages in the brain and ShK-223 appeared to partly inhibit this LPS effect (Fig. 6f ). In summary, these in vivo data confirm
that LPS-induced MHCI upregulation in microglia, but not brain-infiltrating macrophages, is a Kv1.3 channel- dependent process.
Unstimulated microglia, compared to peripheral mac- rophages, have lower antigen-presenting capacity which is significantly increased during inflammation [39, 40].

Rangaraju et al. Journal of Neuroinflammation (2017) 14:128 Page 13 of 20
Based on our results, we hypothesized that induction of MHCI may augment microglial antigen presentation capacity to CD8+ T cells in a MHCI-restricted manner, resulting in more effective activation and proliferation of cytotoxic CD8+ T cells, a response that can be abrogated by Kv1.3 channel blockade. To test this hypothesis, we performed MHCI-restricted T cell proliferation assays using in vitro and in vivo models (Fig. 7a). We observed that LPS-activated and ovalbumin (Ova)-loaded BV2 microglia increased proliferation of Ova-specific CD8+ T cells from Ova-specific OT-1 mice, and this increase in proliferation was inhibited by Kv1.3 channel blockade (Fig. 7b). Similarly, microglia isolated from LPS-treated mice also increased Ova-specific T cell proliferation, which was also inhibited by Kv1.3 blockade (Fig. 7b). Supporting the relevance of our observed increased anti- gen presentation capability of pro-inflammatory micro- glia, we found that LPS-induced neuroinflammation involves a specific increase in CD8+ T cell recruitment to the brain in mice treated (Fig. 7c–e). As compared to CD8− T cells in the brain, CD95 (Fas) expression was also significantly higher in CD8+ T cells, but LPS or ShK-223 did not alter CD95 expression in this subpopu- lation (Fig. 7f ). This selectively increased CD8+ T cell trafficking to the brain in response to LPS treatment suggests that the Kv1.3-dependent upregulation of MHCI by microglia can impact neuroinflammatory re- sponses of CD8+ cytotoxic T cells.
Kv1.3 channel regulates signaling downstream of LPS While our results identified several novel proteins whose regulation is downstream of Kv1.3 channel function, the specific signaling mechanisms regulated by Kv1.3 chan- nels in microglia are not defined. Using our proteomic dataset, we first performed canonical pathway analyses on a list of 120 BV2 microglial proteins whose expres- sion was significantly altered by Kv1.3 channel blockade with or without LPS activation and identified the puta- tive and most highly represented signaling pathways (Additional file 2: Table S4). The top two identified path- ways contained 61 and 52 Kv1.3-regulated proteins re- spectively, and several of which were downstream of GABPA, CREB1, and SRF transcription factors (Fig. 8a, Additional file 2: Table S5). The third most significant pathway contained 36 proteins (including TAP1, EHD1, and VASP proteins) which were downstream of STAT1, IRF1, and STAT3 transcription factors (Fig. 8b). Within our proteomic dataset, GABPA itself was downregulated by LPS and reversed by Kv1.3 blockade while STAT1 and STAT3 were not significantly altered by LPS or Kv1.3 blockade (Fig. 8c). The only IRF family protein identified in our proteomic dataset was IRF5, which did not show altered regulation across experimental condi- tions. Since we validated Kv1.3’s role in MHCI
expression, we focused on signaling mechanisms that may regulate TAP1 and EHD1. Transcriptional regula- tion of TAP1 involves STAT1-signaling, resulting in in- creased transcription of IRF1, which in turn binds to an IRF1 binding site in the TAP1 promoter region to induce TAP1 transcription [41]. IRG1, another strongly upregu- lated protein in LPS-activated microglia that was partly inhibited by ShK-223 in our experiments, is also down- stream of IRF1 signaling [42]. We therefore hypothesized that IRF1 upregulation by LPS can be inhibited by ShK- 223. In qRT-PCR experiments, we observed that the nearly twofold upregulation of IRF1 and IRF7 by LPS1 was partially inhibited by ShK-223, while NFKB1 upreg- ulation was not affected by ShK-223 (Fig. 8d). Since STAT1 protein expression was unaltered in our prote- omic dataset but STAT1 is a known common regulator of TAP1, EHD1, and other proteins (Fig. 8b), we also hypothesized that STAT1 phosphorylation may be regu- lated by Kv1.3 channel function. Serine phosphorylation of STAT1 (S727) is directly induced by LPS-TLR signal- ing and by IFNγ [43], while tyrosine phosphorylation of STAT1 (Y701) is an IFNγ-dependent process that in- volves autocrine IFNγ signaling. In phospho-flow cyto- metric studies of BV2 microglia probing for S727 and Y701 STAT1 phosphorylation, we found that LPS increased S727 STAT1 phosphorylation at 30 min, a re- sponse that was partially inhibited by ShK-223 while no LPS or ShK-223 effects were seen at 3 h (Fig. 8e). Inter- estingly, ShK-223 also inhibited baseline levels of S727 STAT1 phosphorylation, reflecting baseline level of acti- vation in BV2 microglia. Y701 STAT1 phosphorylation was slightly induced by LPS at 30 min and 3 h; although, ShK-223 did not alter the LPS effect. Since LPS binds to the cell surface receptor complex that is comprised of CD14 and toll-like receptors (TLRs) [44], we hypothe- sized that Kv1.3 channels must also lie in proximity to the CD14-TLR receptor complex in activated microglia in order to regulate early signaling events triggered by LPS such as STAT1 phosphorylation. Consistent with this hypothesis, we observed that Kv1.3 channels (labeled by ShK-F6CA) partly co-localized with CD14 in LPS-activated BV2 cells (Fig. 8f ). Discussion We provide confirmatory in vivo and in vitro evidence for upregulation and functional importance of Kv1.3 channels during pro-inflammatory activation of micro- glia. We used LPS as the prototypic immune stimulus that induces systemic and neuroinflammatory responses that recapitulate microglial activation seen in chronic neuroinflammatory and neurodegenerative states [26, 27]. Our proteomics-based approach has unraveled previ- ously novel Kv1.3-dependent molecular mechanisms involved in pro-inflammatory microglial activation,

Rangaraju et al. Journal of Neuroinflammation (2017) 14:128 Page 14 of 20 !!!!!!
Fig. 7 Kv1.3 blockade inhibits LPS-induced MHCI-restricted antigen presentation to CD8 T cells. a Experimental plan for MHCI-restricted T cell proliferation studies: BV2 microglia were treated in vitro with PBS, ShK-223 (100 nM), LPS (100 ng/mL), or LPS+ShK-223 for 24 h (four replicates/group) and then loaded with 2 µg/mL Ova (257-264) peptide for 30 min at 37 °C. Washed microglia were co-cultured with CFSE-labeled splenic T cells from Ova (257-264)-specific OT-1 mice for 48 h (25,000 microglia:150,000 T cells/well). For in vivo experiments, adult wild-type mice were treated with four daily IP doses of saline, ShK-223, LPS, or LPS+ShK-223 (n = 6/group) and isolated brain mononuclear cells were used for in vitro T cell proliferation studies. After 48 h, CFSE dilution (leftward shift in CFSE staining) was assessed by flow cytometry as a measure of CD8+ T cell proliferation. b Comparison of proliferating CD8+ cells across various treatment groups from in vitro and in vivo studies. Right: Representative frequency histograms from in vivo experiments. No direct effects of LPS or Ova peptide on T cells were noted without the presence of microglia. c Flow cytometric detection of CD3+ CD11b# T cells in brain mononuclear cells after thorough cardiac perfusion. Mice were injected (IP, once daily for 4 days) with PBS, LPS, ShK-223, or LPS+ShK-223. Panel a shows the gating strategy. After forward and side-scatter gating for live mononuclear cell population, CD11b# CD3+ cells were gated and assessed for T cell markers (CD3, CD8) and activation/cytolytic marker CD95 (Fas). d Flow cytometric evidence for increased CD8+ T cell trafficking to the brain following LPS treatment. e Comparison of proportions of brain CD8+ and CD8# T cell populations across the 4 treatment groups. f Comparison of CD95 (Fas) expression in brain CD8+ and CD8# T cell populations across treatment groups (*p < 0.05, **p < 0.01, ***p < 0.005)
!!
including microglial chemotaxis and focal adhesion formation. We have also found that Kv1.3 channels regulate antigen-presenting capacity of activated microglia. Specifically, Kv1.3 channel function under- lies upregulation of TAP1 and EHD1, both of which regulate MHCI assembly and trafficking to the cell surface. Inhibition of Kv1.3 reduces LPS-induced TAP1 and EHD1 protein expression and inhibits MHCI trafficking to the cell surface, resulting in de- creased antigen presentation to CD8+ T cells and de- creased T cell proliferation in a MHCI-restricted manner. The relevance of this novel Kv1.3 channel- dependent mechanism is reflected by the increased
trafficking of CD8+ but not CD8# T cells to the acutely inflamed brain, providing the opportunity for microglia with upregulated MHCI to interact with CD8+ T cells and thereby regulate their effector or regulatory functions. Our results also suggest that Kv1.3 channels regulate LPS-induced serine phosphor- ylation (S727) but not tyrosine phosphorylation (Y701) of STAT1, as well as IRF1 expression, as early signaling events following LPS activation. The func- tional coupling between Kv1.3 channels and LPS-TLR signaling in activated microglia is also suggested by the co-localization of Kv1.3 channels with the CD14- TLR complex. Based on these findings, we present a

Rangaraju et al. Journal of Neuroinflammation (2017) 14:128 Page 15 of 20 !!!!!!
Fig. 8 Identification of Kv1.3-regulated signaling mechanisms in LPS-induced microglial activation. a, b Canonical pathway analysis of 120 Kv1.3- dependent proteins identified in our proteomic dataset revealed highly represented signaling pathways, two of which are shown here (see Additional file 2: Table S5 for others). Members of this list of 120 proteins are marked with (red circle). Transcription factors are also highlighted (transparent red circle). Arrows indicate directionality of the interaction (upstream vs. downstream). a GABPA, a Kv1.3-dependent transcription factor that was downregulated by LPS, was placed upstream of several Kv1.3-regulated proteins. b MHCI proteins of relevance to our results (TAP1, Tapasin, and EHD1 proteins) were represented in a signaling network that suggested that STAT1 and IRF1 may serve as upstream regulators of these proteins. c Comparison of normalized protein expression of transcription factors identified in our proteomic dataset across treatment groups. d Quantitative RT-PCR data comparing IRF1, IRF7, and NFKB1 mRNA expression across treatment groups (paired t tests were used for these comparisons; six replicates/group). e Phospho-flow cytometric studies of serine (S727) and tyrosine (Y701) STAT1 phosphorylation in BV2 microglia (n = 5/treatment group) at 30-min and 3-h time points. f Immunofluorescence microscopy showing partial co-localization between Kv1.3 (green, detected by ShK-F6CA labeling) and CD14 (red) in LPS-activated BV2 microglia (*p < 0.05, **p < 0.01, ***p < 0.005)
!
!cohesive model (Fig. 9) suggesting that Kv1.3 channels as- semble with the CD14/TLR complex on microglia during LPS activation and regulate S727 phosphorylation of STAT1, which in turn regulates transcription of TAP-1 and EHD-1 and regulates MHCI assembly and trafficking of the MHCI-antigen complex to the cell surface of microglia. This upregulation of MHCI trafficking and/or assembly with antigen in pro-inflammatory microglia improves their ability to present antigens to CD8+ T cells within the inflamed brain.
The regulation of microglial MHCI expression and antigen presentation highlight novel roles for microglial Kv1.3 channels in adaptive immune responses mediated by CD8+ T cells in the brain. T cell-mediated responses involve both CD4+ and CD8+ T cells, and the pathogenic roles of CD8+ T cells in neuroinflammatory diseases such as multiple sclerosis and neurodegenerative diseases are being increasingly recognized [45, 46]. We found evidence for increased CD8+ T cell traffic to the brain in response to systemic inflammation, and a large

Rangaraju et al. Journal of Neuroinflammation (2017) 14:128 Page 16 of 20 !!!!!!
Fig. 9 Cartoon showing the proposed mechanism by which Kv1.3 channel function regulates LPS-induced EHD1 and TAP1 upregulation and MHC I trafficking an antigen presentation by microglia
!
!!!
proportion of these cells express CD95 (Fas) suggesting their cytolytic effector properties. The proportion of CD8# T cells in the brain, on the other hand, did not change after LPS treatment. Additionally, microglia- induced CD8+ T cell proliferation required Ova peptide (Ova 257-264) which is specific for MHCI but not MHCII. Consistent with our observations, others have also found that CD8+ T cell traffic to the brain and their proliferation within the brain are antigen-specific and MHCI-dependent [47]. However, we did not observe an effect of ShK-223 on LPS-induced brain infiltration by CD8+ T cells, suggesting that CD8+ T cell traffic to the brain does not require Kv1.3 channels. This may be partly explained by the low levels of Kv1.3 channels expressed by most T cells, with the exception of acti- vated CD4+ and CD8+ effector memory T cells [48, 49]. It is also possible that CD8+ T cell traffic to the brain requires antigen-presenting cells other than microglia, such as endothelial cells. Endothelial cells, like microglia, strongly upregulate MHCI in response to systemic inflammation [50] and, unlike microglia, express KCa3.1 potassium channels that are resistant to Kv1.3 blocking ShK peptides [4, 51]. These findings support the possibility that MHCI upregulation by activated
microglia, a Kv1.3 channel-dependent process, may modulate proliferative and cytotoxic responses of CD8+
T cells after they enter the brain. Since CD8+ T cells can adopt cytotoxic and regulatory functions, further characterization of CD8+ T cell subsets in the brain needs to be performed [52]. Our observations provide a rationale for testing microglial Kv1.3 blocking strategies as a novel therapeutic approach to modulate adaptive immune re- sponses mediated by CD8+ T cells in neurological diseases.
Existing literature support the candidacy of microglial Kv1.3 channels as therapeutic targets in neurologic diseases [6]. Kv1.3 channels are highly expressed by microglia in the brains of AD patients as compared to non-AD controls [7]. Microglial Kv1.3 channels are also upregulated following status epilepticus, in radiation neurotoxicity and HIV-TAT neurotoxicity models, and inhibition of Kv1.3 channels in these models has demon- strated anti-inflammatory and neuroprotective effects [53–55]. Our observation of CD14 and Kv1.3 channel co-localization may also be highly relevant to neuro- infectious, neuroinflammatory, and neurodegenerative disorders, where TLR activation has pathologic relevance [55, 56]. Our results provide in vivo evidence for Kv1.3 upregulation in a model of acute neuroinflammation in

Rangaraju et al. Journal of Neuroinflammation (2017) 14:128 Page 17 of 20
addition to providing mechanistic insights into the roles of Kv1.3 channels in pro-inflammatory microglial activa- tion. ShK analogs with high selectivity for Kv1.3 chan- nels are the most potent blockers of this channel, with excellent safety profiles in animals and recently com- pleted phase II human studies [57]. A potential limita- tion of peptide-based therapeutics for neurologic diseases, where microglia mediate neuroinflammation, is their anticipated low CNS bioavailability. Increased BBB permeability has been reported in rodent models of neu- rodegeneration as well as in neuroinflammatory states [58] and may allow for CNS entry of small peptidergic drugs. Our data provide indirect yet compelling evidence for the ability of systemically administered Kv1.3 block- ing ShK peptides to inhibit MHCI upregulation by microglia without altering the activation and recruitment of peripherally derived macrophages or CD8+ T cells to the brain. The ability of peripherally administered ShK- 223 to modulate microglial activation may result from two possible mechanisms: (1) ShK-223 may either affect intermediary cell types in the peripheral immune system which in turn produce factors that enter the brain and activate microglia or (2) ShK-223 is able to enter the brain following LPS treatment and directly modulate microglia. Further studies are needed to clarify these possibilities. We used ShK-223 for our experiments based on its higher selectivity and improved stability profiles as compared to ShK-186 (dalazatide) that is be- ing currently tested in humans [57]. Since ShK-186 is a very well-characterized Kv1.3 blocker, we confirmed that our in vitro observations with ShK-223 were mirrored by ShK-186. Furthermore, binding of ShK-F6CA to microglia was also diminished by pre-incubation with ShK-biotin. These data confirm that our observed results are indeed a result of Kv1.3 channel blockade.
LPS, a classical pro-inflammatory activator of micro- glia and macrophages, directly binds to the TLR-CD14 complex and induces several downstream signaling cas- cades. LPS activation also involves indirect autocrine and paracrine effects of IFNγ and TNF [26, 43, 59]. Our observations support the early regulation of STAT1 S727 phosphorylation by Kv1.3 channels, a signaling event that can result from direct LPS-TLR signaling mediated through p38 MAP kinase activity as well as by IFNγ re- ceptor activation by paracrine or autocrine IFNγ [59]. Since peripherally administered LPS has not been found to substantially cross the blood–brain barrier even with repeated dosing, intermediaries such as brain-infiltrating immune cells or cytokines (TNF) that cross the blood– brain barrier may be involved in microglial activation through non-TLR-based mechanisms [26, 60]. While the small amounts of LPS that cross the blood–brain barrier after systemic administration may be adequate for TLR activation, this seems unlikely to account for the robust
microglial activation observed in our model. Since we found higher proportions of brain-infiltrating macrophages as well as CD8+ T cells in LPS-treated mice, it is possible that these cells contribute to microglial activation and MHCI upregulation. Since Kv1.3 blockade did not alter LPS-induced trafficking of CD8+ T cells or CD45high
macrophages to the brain and did not alter MHCI expres- sion by peripherally derived macrophages in the brain, the observed effects of ShK-223 on microglial MHCI upregula- tion must be mediated by intermediary factors instead. The lack of an effect of Kv1.3 channel blockade on brain- infiltrating macrophages despite their higher expression of Kv1.3 channels also suggests that alternative K channels such as Kir2.1, KCa3.1, and K-ATP channels and possibly other cationic (TRP) channels may play more important roles in peripherally derived macrophages as compared to microglia [61–63]. Since our studies focused on Kv1.3 channels, we are unable to exclude any contribution of alternative cationic channels to MHCI upregulation in microglia.
In addition to the Kv1.3-regulated STAT1-IRF1-TAP1/ EHD1-MHCI antigen presentation pathway highlighted in this manuscript, we have identified several novel puta- tive molecular pathways that may be regulated by Kv1.3 channels in microglia, including roles for Kv1.3 channels as regulators of RNA processing, mitochondrial biogen- esis, and nuclear function. Of particular interest is the transcription factor GABPA, a subunit of the DNA (GA) binding subunit of protein transcription factor GABP that is predicted to regulate transcription of over 50 Kv1.3-regulated proteins. We found that Kv1.3 blockade upregulates GABPA expression in both BV2 microglia and primary microglia. GABP (NRF2) is a key transcrip- tional regulator of mitochondrial proteins involved in oxidative phosphorylation and mitochondrial DNA repli- cation, transcription, and translation [64]. In addition to being expressed on the cell surface, functional Kv1.3 channels are also expressed in the mitochondria membrane where they regulate mitochondrial mem- brane potential and oxidative burst and blockade of mitochondrial Kv1.3 channels inhibits neurotoxicity me- diated by activated microglia [9, 65]. While our studies primarily tested the effect of blockade of cell surface Kv1.3 channels by a membrane non-permeant peptide blocker of Kv1.3 channels, it may be possible that extra- cellular ShK-223 is endocytosed by microglia and re- leased intracellularly, allowing the peptide to interact with intracellular Kv1.3 channels. Independent of this possibility, our results suggest a novel pathway for regulation of mitochondrial biogenesis by Kv1.3 channels mediated through GABPA.
A few caveats about our study merit consideration. Since only 3141 proteins were identified in our prote- omic studies, some Kv1.3 channel-regulated proteins

Rangaraju et al. Journal of Neuroinflammation (2017) 14:128 Page 18 of 20
may not have been identified. Secreted proteins includ- ing cytokines were also likely not identified using our approach. Another limitation is the fact that our studies focused primarily on LPS as the activating stimulus. LPS has pleitropic effects on TLRs 1-4 that result in distinct and overlapping downstream signaling cascades; these were not examined in our studies. Although we are un- able to confirm the functional coupling between a spe- cific TLR and Kv1.3 channels, we provide supportive evidence for Kv1.3 co-localization with CD14, a key member of the LPS-TLR receptor complex. While LPS- induced acute neuroinflammation is a well-established method to induce microglial activation, we cannot be certain that our observed in vivo or in vitro effects were results of direct LPS-TLR interaction as opposed to in- direct autocrine effects of pro-inflammatory cytokines such as IFNγ or TNF. Since we observed an inhibition of STAT1 S727 phosphorylation by ShK-223 within 30 min of LPS exposure, we suspect that Kv1.3 channels regulate early signaling events following LPS-TLR bind- ing but other effects of late responses cannot be excluded. Future studies will focus on investigating the extent to which other activating stimuli for microglia rely on the function of Kv1.3 and will reveal the universality of the mechanism described herein.
Conclusions Using a systems pharmacology approach, we have unrav- eled novel molecular and functional roles for Kv1.3 channels in pro-inflammatory microglial activation, in- cluding a Kv1.3 channel-regulated pathway that facili- tates MHCI expression and MHCI-dependent antigen presentation by microglia to CD8+ T cells. We also provide evidence for neuro-immunomodulation by sys- temically administered ShK peptides. Our results further strengthen the therapeutic candidacy of microglial Kv1.3 channels in neurologic diseases.
Additional files
Additional file 1: Figures S1–S6. Flow cytometric confirmation of Kv1.3-channel specificity of the ShK-F6CA binding assay is shown in Figure S1. Comparison of ShK-F6CA labeling of Kv1.3 channels in splenic and brain-infiltrating macrophages is shown in Figure S2. Morphological changes induced by LPS, ShK-223, and LPS+ShK-223 treatment conditions are shown in Figure S3. Distribution of missing data in the proteomic data set is shown in Figure S4. Quantitative RT-PCR data showing validation of pro-inflammatory activation of BV2 microglia by LPS are shown in Figure S5. EHD1 upregulation by LPS and inhibition of EHD1 upregulation by ShK- 223 is shown in Figure S6. (DOCX 1262 kb) Additional file 2: Tables S1–S5. Raw LFQ expression data from proteomic experiments are provided in Supplemental Tables S1 and S2. Table S3 lists LPS-regulated proteins in our analysis, cross-referenced with previously published microglia proteomics and transcriptomics data.
Kv1.3-dependent proteins. Raw proteomic datasets have been deposited at http://www.proteomexchange.org/. (XLSX 1848 kb)
Abbreviations DCFDA: Dichlorofluorescein diacetate; EHD1: EH domain containing protein I; GO: Gene ontology; LPS: Lipopolysaccharide; MHCI: Major histocompatibility complex I; MS: Mass spectroscopy; PBS: Phosphate-buffered saline; ROS: Reactive oxygen species; STAT1: Signal transducer and activator of transcription 1; TAP1: Transporter associated with antigen processing 1; TLR: Toll-like receptor
Acknowledgements We thank Dr. Christine Beeton (Baylor College of Medicine) for permission to use ShK-223 and Dr. George Chandy (Nanyang Technological University) for the critical reading of our manuscript. The authors declare no competing financial interests. This research project was supported in part by the Emory University School of Medicine Flow Cytometry Core.
Funding This work was supported by the following: Emory Alzheimer’s Disease Research Center Grant (P50 AG025688, AIL, Role: data collection, analysis); American Brain Foundation Award (#00042351, PI: SR, Role: Data collection, analysis, interpretation); NINDS K08 (NS099474-1, PI: SR, Role: Data collection, analysis, interpretation); Emory Neuroscience NINDS Core facilities grant (P30 NS055077, PI: AIL, Role: Data collection and analysis); and 1U01AG046161 (PI: AIL, Role: data collection and analysis).
Availability of data and materials Complete proteomic datasets are provided in the supplemental information. Raw Data, MaxQuant search parameters and search/quantification results are available via ProteomeXchange on the PRIDE consortium website (http:// www.ebi.ac.uk/pride/), accession PXD006753. All data generated or analyzed during this study are included in this published article.
Authors’ contributions SR designed and performed the experiments, acquired and analyzed the data, and wrote the manuscript. SAR and AP designed and performed the experiments and edited the manuscript. QD, EBD, DD, MWP, and RB performed the experiments and data analysis and edited the manuscript. MGT, JJL, NTS, and AIL designed the experiments and edited the manuscript. All authors read and approved the final manuscript.
Competing interests The authors declare that they have no competing interests.
Consent for publication Not applicable.
Ethics approval and consent to participate Approval from the Emory Institutional Animal Care and Use Committee was obtained for all animal studies reported in this manuscript which is in agreement with the NIH Guide for the Care and Use of Laboratory Animals. Publisher’s Note Springer Nature remains neutral with regard to jurisdictional claims in published maps and institutional affiliations. Author details 1Department of Neurology, Emory University, 615 Michael Street, Suite 525, Atlanta, GA 30322, USA. 2Department of Medicine, University of Wisconsin School of Medicine and Public Health, Madison, WI 53726, USA. 3Department of Biochemistry, Emory University, 615 Michael Street, Suite 525, Atlanta, GA
4 5
Table S4 contains lists of all Kv1.3-dependent proteins identified in this study. Table S5 contains results from the canonical pathway analysis of
30322, USA. Peptides International, Louisville, KY 40299, USA. Department of Physiology, Emory University, 615 Michael Street, Suite 525, Atlanta, GA
30322, USA.

Rangaraju et al. Journal of Neuroinflammation (2017) 14:128 Page 19 of 20 !!
!!!!
Received: 7 March 2017 Accepted: 18 June 2017
!
References 1. Crotti A, Ransohoff RM. Microglial physiology and pathophysiology: insights
from genome-wide transcriptional profiling. Immunity. 2016;44(3):505–15. 2. Perry VH, Holmes C. Microglial priming in neurodegenerative disease. Nat
Rev Neurol. 2014;10(4):217–24. 3. Gutman GA, Chandy KG, Grissmer S, Lazdunski M, McKinnon D, Pardo LA,
Robertson GA, Rudy B, Sanguinetti MC, Stuhmer W, et al. International Union of Pharmacology. LIII. Nomenclature and molecular relationships of voltage-gated potassium channels. Pharmacol Rev. 2005;57(4):473–508.
4. Rangaraju S, Chi V, Pennington MW, Chandy KG. Kv1.3 potassium channels as a therapeutic target in multiple sclerosis. Expert Opin Ther Targets. 2009;13(8):909–24.
5. Beeton C, Wulff H, Standifer NE, Azam P, Mullen KM, Pennington MW, Kolski-Andreaco A, Wei E, Grino A, Counts DR, et al. Kv1.3 channels are a therapeutic target for T cell-mediated autoimmune diseases. Proc Natl Acad Sci U S A. 2006;103(46):17414–9.
6. Nguyen HM, Grossinger EM, Horiuchi M, Davis KW, Jin LW, Maezawa I, Wulff H. Differential Kv1.3, KCa3.1, and Kir2.1 expression in “classically” and “alternatively” activated microglia. Glia. 2017;65(1):106–21.
7. Rangaraju S, Gearing M, Jin LW, Levey A. Potassium channel Kv1.3 is highly expressed by microglia in human Alzheimer’s disease. J Alzheimers Dis. 2015;44(3):797–808.
8. Heppner FL, Ransohoff RM, Becher B. Immune attack: the role of inflammation in Alzheimer disease. Nat Rev Neurosci. 2015;16(6):358–72.
9. Fordyce CB, Jagasia R, Zhu X, Schlichter LC. Microglia Kv1.3 channels contribute to their ability to kill neurons. J Neurosci Off J Soc Neurosci. 2005;25(31):7139–49.
10. Nguyen HM, Grossinger EM, Horiuchi M, Davis KW, Jin LW, Maezawa I, Wulff H: Differential Kv1.3, KCa3.1, and Kir2.1 expression in “classically” and “alternatively” activated microglia. Glia 2016.
11. Eil R, Vodnala SK, Clever D, Klebanoff CA, Sukumar M, Pan JH, Palmer DC, Gros A, Yamamoto TN, Patel SJ, et al. Ionic immune suppression within the tumour microenvironment limits T cell effector function. Nature. 2016;537(7621):539–43.
12. Pennington MW, Chang SC, Chauhan S, Huq R, Tajhya RB, Chhabra S, Norton RS, Beeton C. Development of highly selective Kv1.3-blocking peptides based on the sea anemone peptide ShK. Mar Drugs. 2015;13(1):529–42.
13. Lee JK, Tansey MG. Microglia isolation from adult mouse brain. Methods Mol Biol. 2013;1041:17–23.
14. Chen Z, Jalabi W, Shpargel KB, Farabaugh KT, Dutta R, Yin X, Kidd GJ, Bergmann CC, Stohlman SA, Trapp BD. Lipopolysaccharide-induced microglial activation and neuroprotection against experimental brain injury is independent of hematogenous TLR4. J Neurosci Off J Soc Neurosci. 2012;32(34):11706–15.
15. Beeton C, Wulff H, Singh S, Botsko S, Crossley G, Gutman GA, Cahalan MD, Pennington M, Chandy KG. A novel fluorescent toxin to detect and investigate Kv1.3 channel up-regulation in chronically activated T lymphocytes. J Biol Chem. 2003;278(11):9928–37.
16. Hickman SE, Kingery ND, Ohsumi TK, Borowsky ML, Wang LC, Means TK, El Khoury J. The microglial sensome revealed by direct RNA sequencing. Nat Neurosci. 2013;16(12):1896–905.
17. Ramirez-Ortiz ZG, Prasad A, Griffith JW, Pendergraft 3rd WF, Cowley GS, Root DE, Tai M, Luster AD, El Khoury J, Hacohen N, et al. The receptor TREML4 amplifies TLR7-mediated signaling during antiviral responses and autoimmunity. Nat Immunol. 2015;16(5):495–504.
18. Magness ST, Jijon H, Van Houten Fisher N, Sharpless NE, Brenner DA, Jobin C. In vivo pattern of lipopolysaccharide and anti-CD3-induced NF-kappa B activation using a novel gene-targeted enhanced GFP reporter gene mouse. J Immunol. 2004;173(3):1561–70.
19. Seyfried NT, Dammer EB, Swarup V, Nandakumar D, Duong DM, Yin L, Deng Q, Nguyen T, Hales CM, Wingo T, et al. A multi-network approach identifies protein-specific co-expression in asymptomatic and symptomatic Alzheimer’s disease. Cell systems. 2017;4(1):60–72. e64.
20. Seyfried NT, Dammer EB, Swarup V, Nandakumar D, Duong DM, Yin L, Deng Q, Nguyen T, Hales CM, Wingo T, et al. A multi-network approach identifies protein-specific co-expression in asymptomatic and symptomatic Alzheimer’s disease. Cell systems. 2016.
21. Cox J, Hein MY, Luber CA, Paron I, Nagaraj N, Mann M. Accurate proteome- wide label-free quantification by delayed normalization and maximal peptide ratio extraction, termed MaxLFQ. Mol Cell Proteomics. 2014;13(9):2513–26.
22. Luber CA, Cox J, Lauterbach H, Fancke B, Selbach M, Tschopp J, Akira S, Wiegand M, Hochrein H, O’Keeffe M, et al. Quantitative proteomics reveals subset-specific viral recognition in dendritic cells. Immunity. 2010;32(2):279–89.
23. Zambon AC, Gaj S, Ho I, Hanspers K, Vranizan K, Evelo CT, Conklin BR, Pico AR, Salomonis N. GO-Elite: a flexible solution for pathway and ontology over-representation. Bioinformatics. 2012;28(16):2209–10.
24. Mitrea C, Taghavi Z, Bokanizad B, Hanoudi S, Tagett R, Donato M, Voichita C, Draghici S. Methods and approaches in the topology-based analysis of biological pathways. Front Physiol. 2013;4:278.
25. Pranski EL, Dalal NV, Herskowitz JH, Orr AL, Roesch LA, Fritz JJ, Heilman C, Lah JJ, Levey AI, Betarbet RS. Neuronal RING finger protein 11 (RNF11) regulates canonical NF-kappaB signaling. J Neuroinflammation. 2012;9:67.
26. Qin L, Wu X, Block ML, Liu Y, Breese GR, Hong JS, Knapp DJ, Crews FT. Systemic LPS causes chronic neuroinflammation and progressive neurodegeneration. Glia. 2007;55(5):453–62.
27. Frank-Cannon TC, Alto LT, McAlpine FE, Tansey MG. Does neuroinflammation fan the flame in neurodegenerative diseases? Mol Neurodegener. 2009;4:47.
28. Madeddu S, Woods TA, Mukherjee P, Sturdevant D, Butchi NB, Peterson KE. Identification of glial activation markers by comparison of transcriptome changes between astrocytes and microglia following innate immune stimulation. PLoS ONE. 2015;10(7), e0127336.
29. Henn A, Lund S, Hedtjarn M, Schrattenholz A, Porzgen P, Leist M. The suitability of BV2 cells as alternative model system for primary microglia cultures or for animal experiments examining brain inflammation. Altex. 2009;26(2):83–94.
30. Butovsky O, Jedrychowski MP, Moore CS, Cialic R, Lanser AJ, Gabriely G, Koeglsperger T, Dake B, Wu PM, Doykan CE, et al. Identification of a unique TGF-beta-dependent molecular and functional signature in microglia. Nat Neurosci. 2014;17(1):131–43.
31. Cahalan MD, Chandy KG. The functional network of ion channels in T lymphocytes. Immunol Rev. 2009;231(1):59–87.
32. Freilich RW, Woodbury ME, Ikezu T. Integrated expression profiles of mRNA and miRNA in polarized primary murine microglia. PLoS ONE. 2013;8(11), e79416.
33. Bell-Temin H, Culver-Cochran AE, Chaput D, Carlson CM, Kuehl M, Burkhardt BR, Bickford PC, Liu B, Stevens Jr SM. Novel molecular insights into classical and alternative activation states of microglia as revealed by stable isotope labeling by amino acids in cell culture (SILAC)-based proteomics. Mol Cell Proteomics. 2015;14(12):3173–84.
34. Das A, Kim SH, Arifuzzaman S, Yoon T, Chai JC, Lee YS, Park KS, Jung KH, Chai YG. Transcriptome sequencing reveals that LPS-triggered transcriptional responses in established microglia BV2 cell lines are poorly representative of primary microglia. J Neuroinflammation. 2016;13(1):182.
35. Suh WK, Cohen-Doyle MF, Fruh K, Wang K, Peterson PA, Williams DB. Interaction of MHC class I molecules with the transporter associated with antigen processing. Science. 1994;264(5163):1322–6.
36. Song R, Porgador A, Harding CV. Peptide-receptive class I major histocompatibility complex molecules on TAP-deficient and wild-type cells and their roles in the processing of exogenous antigens. Immunology. 1999;97(2):316–24.
37. Gruhler A, Fruh K. Control of MHC class I traffic from the endoplasmic reticulum by cellular chaperones and viral anti-chaperones. Traffic. 2000;1(4):306–11.
38. Caplan S, Naslavsky N, Hartnell LM, Lodge R, Polishchuk RS, Donaldson JG, Bonifacino JS. A tubular EHD1-containing compartment involved in the recycling of major histocompatibility complex class I molecules to the plasma membrane. EMBO J. 2002;21(11):2557–67.
39. Mack CL, Vanderlugt-Castaneda CL, Neville KL, Miller SD. Microglia are activated to become competent antigen presenting and effector cells in the inflammatory environment of the Theiler’s virus model of multiple sclerosis. J Neuroimmunol. 2003;144(1-2):68–79.
40. Wlodarczyk A, Lobner M, Cedile O, Owens T. Comparison of microglia and infiltrating CD11c(+) cells as antigen presenting cells for T cell proliferation and cytokine response. J Neuroinflammation. 2014;11:57.
41. Brucet M, Marques L, Sebastian C, Lloberas J, Celada A. Regulation of murine Tap1 and Lmp2 genes in macrophages by interferon gamma is mediated by STAT1 and IRF-1. Genes Immun. 2004;5(1):26–35.
42. Tallam A, Perumal TM, Antony PM, Jager C, Fritz JV, Vallar L, Balling R, Del Sol A, Michelucci A. Gene regulatory network inference of immunoresponsive gene 1 (IRG1) identifies interferon regulatory factor 1 (IRF1) as its transcriptional regulator in mammalian macrophages. PLoS ONE. 2016;11(2), e0149050.

Rangaraju et al. Journal of Neuroinflammation (2017) 14:128 Page 20 of 20 !!
!!!!
43. Rhee SH, Jones BW, Toshchakov V, Vogel SN, Fenton MJ. Toll-like receptors 2 and 4 activate STAT1 serine phosphorylation by distinct mechanisms in macrophages. J Biol Chem. 2003;278(25):22506–12.
44. Fujihara M, Muroi M, Tanamoto K, Suzuki T, Azuma H, Ikeda H. Molecular mechanisms of macrophage activation and deactivation by lipopolysaccharide: roles of the receptor complex. Pharmacol Ther. 2003;100(2):171–94.
45. Weiss HA, Millward JM, Owens T. CD8+ T cells in inflammatory demyelinating disease. J Neuroimmunol. 2007;191(1-2):79–85.
46. Neumann H, Medana IM, Bauer J, Lassmann H. Cytotoxic T lymphocytes in autoimmune and degenerative CNS diseases. Trends Neurosci. 2002;25(6):313–9.
47. Galea I, Bernardes-Silva M, Forse PA, Van Rooijen N, Liblau RS, Perry VH. An antigen-specific pathway for CD8 T cells across the blood-brain barrier. J Exp Med. 2007;204(9):2023–30.
48. Hu L, Wang T, Gocke AR, Nath A, Zhang H, Margolick JB, Whartenby KA, Calabresi PA. Blockade of Kv1.3 potassium channels inhibits differentiation and granzyme B secretion of human CD8+ T effector memory lymphocytes. PLoS ONE. 2013;8(1):e54267.
49. Wulff H, Calabresi PA, Allie R, Yun S, Pennington M, Beeton C, Chandy KG. The voltage-gated Kv1.3 K(+) channel in effector memory T cells as new target for MS. J Clin Invest. 2003;111(11):1703–13.
50. Yang YM, Shang DS, Zhao WD, Fang WG, Chen YH. Microglial TNF-alpha- dependent elevation of MHC class I expression on brain endothelium induced by amyloid-beta promotes T cell transendothelial migration. Neurochem Res. 2013;38(11):2295–304.
51. Grgic I, Kaistha BP, Hoyer J, Kohler R. Endothelial Ca+-activated K+ channels in normal and impaired EDHF-dilator responses—relevance to cardiovascular pathologies and drug discovery. Br J Pharmacol. 2009;157(4):509–26.
52. Ellwardt E, Walsh JT, Kipnis J, Zipp F. Understanding the role of T cells in CNS homeostasis. Trends Immunol. 2016;37(2):154–65.
53. Menteyne A, Levavasseur F, Audinat E, Avignone E. Predominant functional expression of Kv1.3 by activated microglia of the hippocampus after status epilepticus. PLoS ONE. 2009;4(8):e6770.
54. Peng Y, Lu K, Li Z, Zhao Y, Wang Y, Hu B, Xu P, Shi X, Zhou B, Pennington M, et al. Blockade of Kv1.3 channels ameliorates radiation-induced brain injury. Neuro-Oncology. 2014;16(4):528–39.
55. Liu J, Xu P, Collins C, Liu H, Zhang J, Keblesh JP, Xiong H. HIV-1 Tat protein increases microglial outward K(+) current and resultant neurotoxic activity. PLoS ONE. 2013;8(5), e64904.
56. Kielian T. Toll-like receptors in central nervous system glial inflammation and homeostasis. J Neurosci Res. 2006;83(5):711–30.
57. Tarcha EJ, Chi V, Munoz-Elias EJ, Bailey D, Londono LM, Upadhyay SK, Norton K, Banks A, Tjong I, Nguyen H, et al. Durable pharmacological responses from the peptide ShK-186, a specific Kv1.3 channel inhibitor that suppresses T cell mediators of autoimmune disease. J Pharmacol Exp Ther. 2012;342(3):642–53.
58. Kawarabayashi T, Younkin LH, Saido TC, Shoji M, Ashe KH, Younkin SG. Age- dependent changes in brain, CSF, and plasma amyloid (beta) protein in the Tg2576 transgenic mouse model of Alzheimer’s disease. J Neurosci Off J Soc Neurosci. 2001;21(2):372–81.
59. Hu X, Chakravarty SD, Ivashkiv LB. Regulation of interferon and Toll-like receptor signaling during macrophage activation by opposing feedforward and feedback inhibition mechanisms. Immunol Rev. 2008;226:41–56.
60. Banks WA, Robinson SM. Minimal penetration of lipopolysaccharide across the murine blood-brain barrier. Brain Behav Immun. 2010;24(1):102–9.
61. Villalonga N, David M, Bielanska J, Vicente R, Comes N, Valenzuela C, Felipe A. Immunomodulation of voltage-dependent K+ channels in macrophages: molecular and biophysical consequences. J Gen Physiol. 2010;135(2):135–47.
62. Grimaldi A, D’Alessandro G, Golia MT, Grossinger EM, Di Angelantonio S, Ragozzino D, Santoro A, Esposito V, Wulff H, Catalano M, et al. KCa3.1 inhibition switches the phenotype of glioma-infiltrating microglia/ macrophages. Cell Death Dis. 2016;7:e2174.
63. Desai BN, Leitinger N. Purinergic and calcium signaling in macrophage function and plasticity. Front Immunol. 2014;5:580.
64. Quiros PM, Mottis A, Auwerx J. Mitonuclear communication in homeostasis and stress. Nat Rev Mol Cell Biol. 2016;17(4):213–26.
65. Szabo I, Bock J, Grassme H, Soddemann M, Wilker B, Lang F, Zoratti M, Gulbins E. Mitochondrial potassium channel Kv1.3 mediates Bax-induced apoptosis in lymphocytes. Proc Natl Acad Sci U S A. 2008;105(39):14861–6.
!!!!!!!!!!!!!!!!!!!!!!!!!!!!!!!!!!!!!!!!!!!!!!!!!!!Submit your next manuscript to BioMed Central and we will help you at every step: !
• We accept pre-submission inquiries
• Our selector tool helps you to find the most relevant journal
• We provide round the clock customer support
• Convenient online submission
• Thorough peer review
• Inclusion in PubMed and all major indexing services
• Maximum visibility for your research !
Submit your manuscript at www.biomedcentral.com/submit