a systems biology approach for pathway level analysismreimers/sysbio/draghici - new pathway...
TRANSCRIPT

10.1101/gr.6202607Access the most recent version at doi: 2007 17: 1537-1545; originally published online Sep 4, 2007; Genome Res.
Georgescu and Roberto Romero Sorin Draghici, Purvesh Khatri, Adi Laurentiu Tarca, Kashyap Amin, Arina Done, Calin Voichita, Constantin
A systems biology approach for pathway level analysis
dataSupplementary
http://www.genome.org/cgi/content/full/gr.6202607/DC1 "Supplemental Research Data"
References
http://www.genome.org/cgi/content/full/17/10/1537#References
This article cites 48 articles, 17 of which can be accessed free at:
serviceEmail alerting
click heretop right corner of the article or Receive free email alerts when new articles cite this article - sign up in the box at the
Notes
http://www.genome.org/subscriptions/ go to: Genome ResearchTo subscribe to
© 2007 Cold Spring Harbor Laboratory Press
on October 19, 2007 www.genome.orgDownloaded from
A systems biology approach for pathwaylevel analysisSorin Draghici,1,2,4 Purvesh Khatri,2 Adi Laurentiu Tarca,1,2,3 Kashyap Amin,2
Arina Done,2 Calin Voichita,2 Constantin Georgescu,2 and Roberto Romero3
1,2,3Karmanos Cancer Institute, Wayne State University, Detroit, Michigan 48202, USA; 2Department of Computer Science,Wayne State University, Detroit, Michigan 48202, USA; 3Perinatology Research Branch, NIH/NICHD,Detroit, Michigan 48201, USA
A common challenge in the analysis of genomics data is trying to understand the underlying phenomenon in thecontext of all complex interactions taking place on various signaling pathways. A statistical approach using variousmodels is universally used to identify the most relevant pathways in a given experiment. Here, we show that theexisting pathway analysis methods fail to take into consideration important biological aspects and may provideincorrect results in certain situations. By using a systems biology approach, we developed an impact analysis thatincludes the classical statistics but also considers other crucial factors such as the magnitude of each gene’s expressionchange, their type and position in the given pathways, their interactions, etc. The impact analysis is an attempt to adeeper level of statistical analysis, informed by more pathway-specific biology than the existing techniques. Onseveral illustrative data sets, the classical analysis produces both false positives and false negatives, while the impactanalysis provides biologically meaningful results. This analysis method has been implemented as a Web-based tool,Pathway-Express, freely available as part of the Onto-Tools (http://vortex.cs.wayne.edu).
[Supplemental material is available online at www.genome.org.]
Together with the ability of generating a large amount of data perexperiment, high-throughput technologies also brought thechallenge of translating such data into a better understanding ofthe underlying biological phenomena. Independent of the plat-form and the analysis methods used, the result of a high-throughput experiment is, in many cases, a list of differentiallyexpressed genes. The common challenge faced by all researchersis to translate such lists of differentially expressed genes into abetter understanding of the underlying biological phenomenaand, in particular, to put this in the context of the whole organ-ism as a complex system. In 2002, a computerized analysis ap-proach using the Gene Ontology (GO) was proposed to deal withthis issue (Khatri et al. 2002; Draghici et al. 2003). This approachtakes a list of differentially expressed genes and uses a statisticalanalysis to identify the GO categories (e.g. biological processes,etc.) that are over- or under-represented in the condition understudy. Given a set of differentially expressed genes, this approachcompares the number of differentially expressed genes found ineach category of interest with the number of genes expected to befound in the given category just by chance. If the observed num-ber is substantially different from the one expected just bychance, the category is reported as significant. A statistical model(e.g. hypergeometric) can be used to calculate the probability ofobserving the actual number of genes just by chance, i.e., a P-value. Currently, there are over 20 tools using this over-representation approach (ORA) (Khatri and Draghici 2005). Inspite of its wide adoption, this approach has a number of limi-tations related to the type, quality, and structure of the annota-tions available. An alternative approach considers the distribu-tion of the pathway genes in the entire list of genes and performs
a functional class scoring (FCS), which also allows adjustmentsfor gene correlations (Goeman et al. 2004; Pavlidis et al. 2004).Arguably the state of the art in the FCS category, the Gene SetEnrichment Analysis (GSEA) (Mootha et al. 2003; Subramanianet al. 2005; Tian et al. 2005), ranks all genes based on the corre-lation between their expression and the given phenotypes, andcalculates a score that reflects the degree to which a given path-way P is represented at the extremes of the entire ranked list. Thescore is calculated by walking down the list of genes ordered byexpression change. The score is increased for every gene thatbelongs to P and decreased for every gene that does not. Statis-tical significance is established with respect to a null distributionconstructed by permutations.
Both ORA and FCS techniques currently used are limited bythe fact that each functional category is analyzed independentlywithout a unifying analysis at a pathway or system level (Tian etal. 2005). This approach is not well suited for a systems biologyapproach that aims to account for system level dependencies andinteractions as well as to identify perturbations and modifica-tions at the pathway or organism level (Stelling 2004). Severalpathway databases such as KEGG (Ogata et al. 1999), BioCarta(http://www.biocarta.com), and Reactome (Joshi-Tope et al.2005) currently describe metabolic pathway and gene signalingnetworks offering the potential for a more complex and usefulanalysis. A recent technique, ScorePage, has been developed inan attempt to take advantage of these types of data for the analy-sis of metabolic pathways (Rahnenfuhrer et al. 2004). Unfortu-nately, no such technique currently exists for the analysis of genesignaling networks. All pathway analysis tools currently availableuse one of the ORA approaches above and fail to take advantageof the much richer data contained in these resources. GenMAPP/MAPPfinder (Doniger et al. 2003; Dahlquist et al. 2002) andGene-Sifter use a standardized Z-score. PathwayProcessor (Grosuet al. 2002), PathMAPA (Pan et al. 2003), Cytoscape (Shannon etal. 2003), and PathwayMiner (Pandey et al. 2004) use Fisher’s
4Corresponding author.E-mail [email protected]; fax (313) 577-0868.Article published online before print. Article and publication date are at http://www.genome.org/cgi/doi/10.1101/gr.6202607.
Methods
17:1537–1545 ©2007 by Cold Spring Harbor Laboratory Press; ISSN 1088-9051/07; www.genome.org Genome Research 1537www.genome.org
on October 19, 2007 www.genome.orgDownloaded from

exact test. MetaCore uses a hypergeometric model, while ArrayX-Path (Chung et al. 2004) offers both Fisher’s exact test and a falsediscovery rate (FDR). Finally, VitaPad (Holford et al. 2004) andPathway Studio (Nikitin et al. 2003) focus on visualization aloneand do not offer any analysis.
The approaches currently available for the analysis of genesignaling networks share a number of important limitations.First, these approaches consider only the set of genes on anygiven pathway and ignore their position in those pathways. Thismay be unsatisfactory from a biological point of view. If a path-way is triggered by a single gene product or activated through asingle receptor and if that particular protein is not produced, thepathway will be greatly impacted, probably completely shut off.A good example is the insulin pathway (http://www.genome.ac.jp/KEGG/pathway/hsa/hsa04910.html). If the insulin receptor(INSR) is not present, the entire pathway is shut off. Conversely,if several genes are involved in a pathway but they only appearsomewhere downstream, changes in their expression levels maynot affect the given pathway as much.
Second, some genes have multiple functions and are in-volved in several pathways but with different roles. For instance,the above INSR is also involved in the adherens junction pathwayas one of the many receptor protein tyrosine kinases. However, ifthe expression of INSR changes, this pathway is not likely to beheavily perturbed because INSR is just one of many receptors onthis pathway. Once again, all these aspects are not considered byany of the existing approaches.
Probably the most important challenge today is that theknowledge embedded in these pathways about how variousgenes interact with each other is not currently exploited. Thevery purpose of these pathway diagrams is to capture some of ourknowledge about how genes interact and regulate each other.However, the existing analysis approaches consider only the setsof genes involved on these pathways, without taking into con-sideration their topology. In fact, our understanding of variouspathways is expected to improve as more data are gathered. Path-ways will be modified by adding, removing or redirecting linkson the pathway diagrams. Most existing techniques are com-pletely unable to even sense such changes. Thus, these tech-niques will provide identical results as long as the pathway dia-gram involves the same genes, even if the interactions betweenthem are completely redefined over time.
Finally, up to now the expression changes measured in thesehigh-throughput experiments have been used only to identifydifferentially expressed genes (ORA approaches) or to rank thegenes (FCS methods), but not to estimate the impact of suchchanges on specific pathways. Thus, ORA techniques will see nodifference between a situation in which a subset of genes is dif-ferentially expressed just above the detection threshold (e.g.,twofold) and the situation in which the same genes are changingby many orders of magnitude (e.g., 100-fold). Similarly, FCS tech-niques can provide the same rankings for entire ranges of expres-sion values, if the correlations between the genes and the phe-notypes remain similar. Even though analyzing this type of in-formation in a pathway and system context would be extremelymeaningful from a biological perspective, currently there is notechnique or tool able to do this.
We propose a radically different approach for pathwayanalysis that attempts to capture all aspects above. An impactfactor (IF) is calculated for each pathway incorporating param-eters such as the normalized fold change of the differentiallyexpressed genes, the statistical significance of the set of pathway
genes, and the topology of the signaling pathway. We show on anumber of real data sets that the intrinsic limitations of the clas-sical analysis produce both false positives and false negativeswhile the impact analysis provides biologically meaningful re-sults.
Impact analysis
Our goal is to develop an analysis model that would require botha statistically significant number of differentially expressed genesand biologically meaningful changes on a given pathway. In thismodel, the IF of a pathway Pi is calculated as the sum of twoterms:
IF�Pi� = log�1pi� +
�g∈Pi
|PF�g�|
|�E| � Nde�Pi�. (1)
The first term is a probabilistic term that captures the significanceof the given pathway Pi from the perspective of the set of genescontained in it. This term captures the information provided bythe currently used classical statistical approaches and can be cal-culated using either an ORA (e.g., z-test [Doniger et al. 2003],contingency tables [Pan et al. 2003; Pandey et al. 2004], etc.), aFCS approach (e.g., GSEA; Mootha et al. 2003; Subramanian et al.2005) or other more recent approaches (Robinson et al. 2004;Breslin et al. 2005; Tian et al. 2005). The pi value corresponds tothe probability of obtaining a value of the statistic used at least asextreme as the one observed, when the null hypothesis is true.The results presented here were obtained using the hypergeomet-ric model (Tavazoie et al. 1999; Draghici et al. 2003) in which pi
is the probability of obtaining at least the observed number ofdifferentially expressed gene, Nde, just by chance.
The second term in Equation 1 is a functional term thatdepends on the identity of the specific genes that are differen-tially expressed as well as on the interactions described by thepathway (i.e., its topology). In essence, this term sums up theabsolute values of the perturbation factors (PFs) for all genes g onthe given pathway Pi. The PF of a gene g is calculated as follows:
PF�g� = �E�g� + �u∈USg
�ug �PF�u�
Nds�u�. (2)
In this equation, the first term captures the quantitative infor-mation measured in the gene expression experiment. The factor�E (g) represents the signed normalized measured expressionchange of the gene g determined using one of the available meth-ods (Quackenbush 2001; Churchill 2002; Draghici 2002; Yangand Speed 2002). The second term is a sum of all PFs of the genesu directly upstream of the target gene g, normalized by the num-ber of downstream genes of each such gene Nds(u), and weightedby a factor �ug, which reflects the type of interaction: �ug = 1 forinduction, �ug = �1 for repression. (In KEGG, which is the sourceof the pathways used here, this information about the type ofinteraction is available for every link between two genes in thedescription of the pathway topology.) USg is the set of all suchgenes upstream of g. The second term here is similar to the Page-Rank index used by Google (Page et al. 1998), only we weight thedownstream instead of the upstream connections (a Web page isimportant if other pages point to it, whereas a gene is importantif it influences other genes).
Under the null hypothesis, which assumes that the list ofdifferentially expressed genes only contains random genes, thelikelihood that a pathway has a large IF is proportional to the
Draghici et al.
1538 Genome Researchwww.genome.org
on October 19, 2007 www.genome.orgDownloaded from
number of such “differentially expressed” genes that fall on thepathway, which in turn is proportional to the size of the path-way. Thus, we need to normalize with respect to the size of thepathway by dividing the total perturbation by the number ofdifferentially expressed genes on the given pathway, Nde(Pi). Fur-thermore, various technologies can yield systematically differentestimates of the fold changes. For instance, the fold changes re-ported by microarrays tend to be compressed with respect tothose reported by RT-PCR (Canales et al. 2006; Draghici et al.2006). In order to make the IFs as independent as possible fromthe technology, and also comparable between problems, we also
divide the second term in Equation 1 by the mean absolute foldchange �E, calculated across all differentially expressed genes.Assuming that there are at least some differentially expressedgenes anywhere in the data set, both �E and Nde(Pi) are differentfrom zero so the second term is properly defined. (If there are nodifferentially expressed genes anywhere, the problem of findingthe impact on various pathways is meaningless.)
It can be shown that the IFs correspond to the negative logof the global probability of having both a statistically significantnumber of differentially expressed genes and a large perturbationin the given pathway. IF values, if, will follow a �(2,1) distribu-
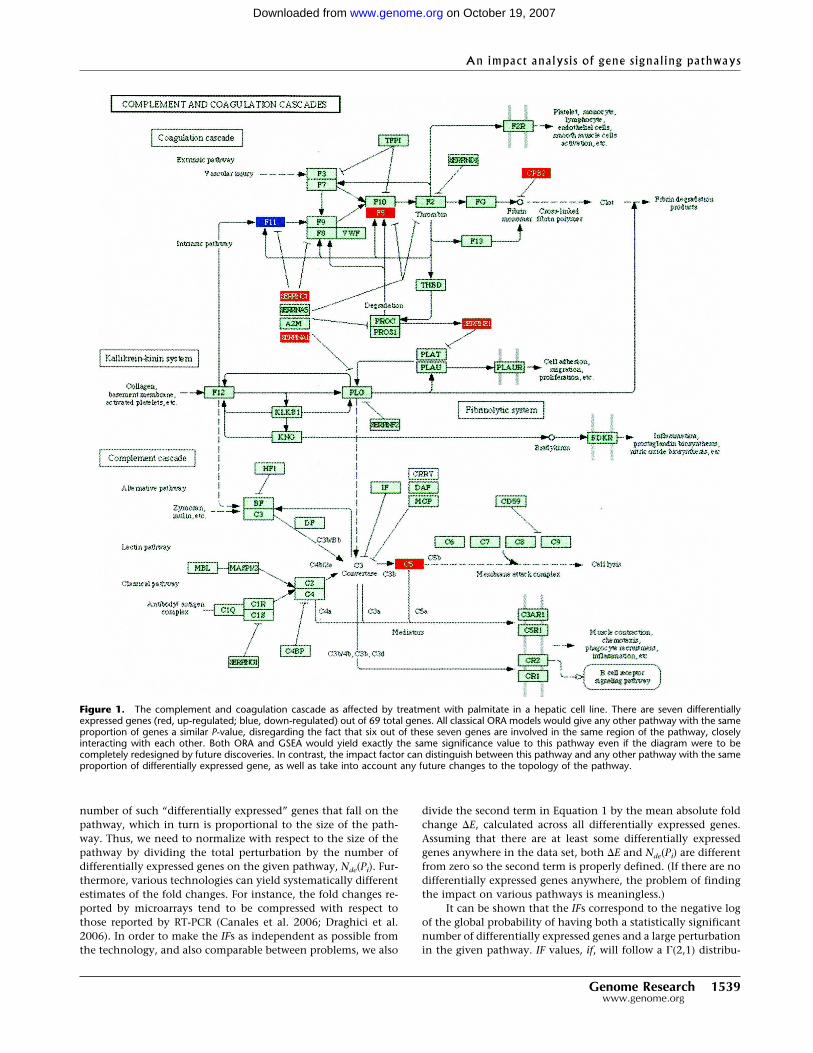
Figure 1. The complement and coagulation cascade as affected by treatment with palmitate in a hepatic cell line. There are seven differentiallyexpressed genes (red, up-regulated; blue, down-regulated) out of 69 total genes. All classical ORA models would give any other pathway with the sameproportion of genes a similar P-value, disregarding the fact that six out of these seven genes are involved in the same region of the pathway, closelyinteracting with each other. Both ORA and GSEA would yield exactly the same significance value to this pathway even if the diagram were to becompletely redesigned by future discoveries. In contrast, the impact factor can distinguish between this pathway and any other pathway with the sameproportion of differentially expressed gene, as well as take into account any future changes to the topology of the pathway.
An impact analysis of gene signaling pathways
Genome Research 1539www.genome.org
on October 19, 2007 www.genome.orgDownloaded from
tion from which P-values can be calculated as P = (if + 1) � e�if (fordetails, see Supplemental materials).
The impact analysis proposed here extends and enhancesthe existing statistical approaches by incorporating the novel as-pects discussed above. For instance, the second term of the geneperturbation (in Equation 2) increases the PF scores of thosegenes that are connected through a direct signaling link to otherdifferentially expressed genes (e.g., the PFs of F5 and F11 inFig. 1 are both increased because of the differentially expressedSERPINC1 and SERPINA1). This will yield a higher overall scorefor those pathways in which the differentially expressed genesare localized in a connected subgraph, as in this example. Inter-estingly, when the limitations of the existing approaches areforcefully imposed (e.g., ignoring the magnitude of the measuredexpression changes or ignoring the regulatory interactions be-tween genes), the impact analysis reduces to the classical statis-tics and yields the same results. For instance, if there are noperturbations directly upstream of a given gene, the second termin Equation 2 is zero and the PF reduces to the measured expres-sion change �E, which is the classical way of assessing the impactof a condition upon a given gene. A more detailed discussion ofvarious particular cases is included in the Supplemental materials.
Results
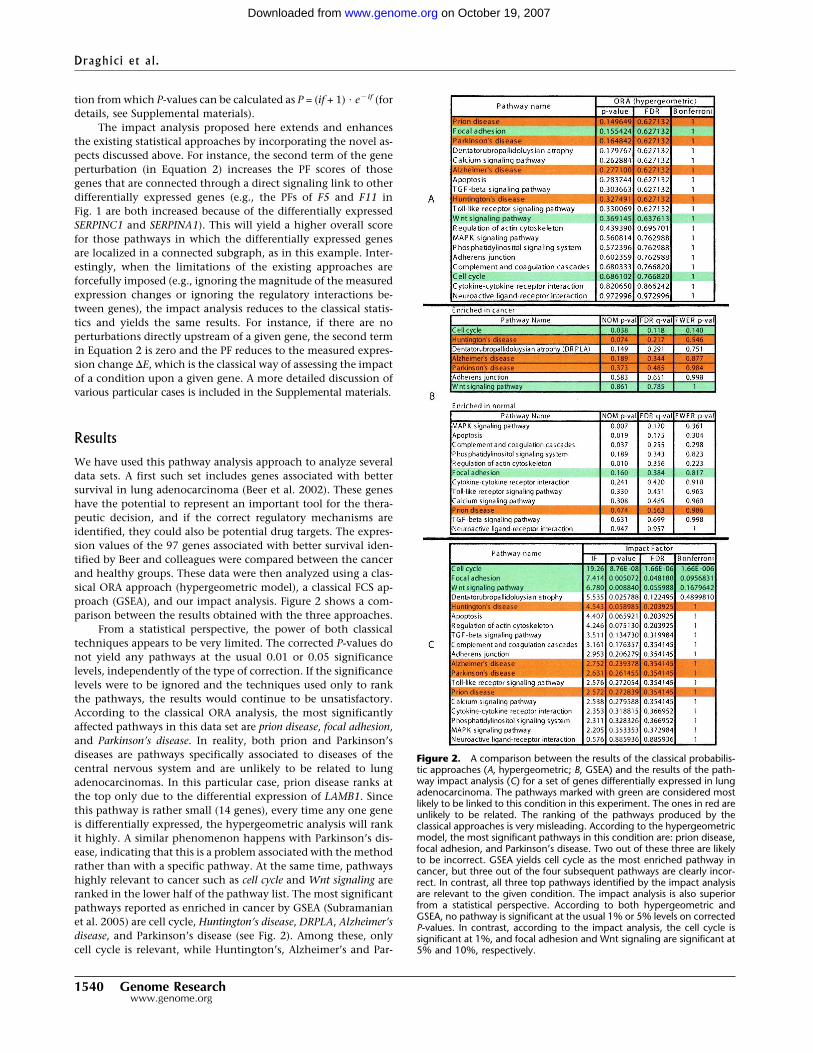
We have used this pathway analysis approach to analyze severaldata sets. A first such set includes genes associated with bettersurvival in lung adenocarcinoma (Beer et al. 2002). These geneshave the potential to represent an important tool for the thera-peutic decision, and if the correct regulatory mechanisms areidentified, they could also be potential drug targets. The expres-sion values of the 97 genes associated with better survival iden-tified by Beer and colleagues were compared between the cancerand healthy groups. These data were then analyzed using a clas-sical ORA approach (hypergeometric model), a classical FCS ap-proach (GSEA), and our impact analysis. Figure 2 shows a com-parison between the results obtained with the three approaches.
From a statistical perspective, the power of both classicaltechniques appears to be very limited. The corrected P-values donot yield any pathways at the usual 0.01 or 0.05 significancelevels, independently of the type of correction. If the significancelevels were to be ignored and the techniques used only to rankthe pathways, the results would continue to be unsatisfactory.According to the classical ORA analysis, the most significantlyaffected pathways in this data set are prion disease, focal adhesion,and Parkinson’s disease. In reality, both prion and Parkinson’sdiseases are pathways specifically associated to diseases of thecentral nervous system and are unlikely to be related to lungadenocarcinomas. In this particular case, prion disease ranks atthe top only due to the differential expression of LAMB1. Sincethis pathway is rather small (14 genes), every time any one geneis differentially expressed, the hypergeometric analysis will rankit highly. A similar phenomenon happens with Parkinson’s dis-ease, indicating that this is a problem associated with the methodrather than with a specific pathway. At the same time, pathwayshighly relevant to cancer such as cell cycle and Wnt signaling areranked in the lower half of the pathway list. The most significantpathways reported as enriched in cancer by GSEA (Subramanianet al. 2005) are cell cycle, Huntington’s disease, DRPLA, Alzheimer’sdisease, and Parkinson’s disease (see Fig. 2). Among these, onlycell cycle is relevant, while Huntington’s, Alzheimer’s and Par-
Figure 2. A comparison between the results of the classical probabilis-tic approaches (A, hypergeometric; B, GSEA) and the results of the path-way impact analysis (C) for a set of genes differentially expressed in lungadenocarcinoma. The pathways marked with green are considered mostlikely to be linked to this condition in this experiment. The ones in red areunlikely to be related. The ranking of the pathways produced by theclassical approaches is very misleading. According to the hypergeometricmodel, the most significant pathways in this condition are: prion disease,focal adhesion, and Parkinson’s disease. Two out of these three are likelyto be incorrect. GSEA yields cell cycle as the most enriched pathway incancer, but three out of the four subsequent pathways are clearly incor-rect. In contrast, all three top pathways identified by the impact analysisare relevant to the given condition. The impact analysis is also superiorfrom a statistical perspective. According to both hypergeometric andGSEA, no pathway is significant at the usual 1% or 5% levels on correctedP-values. In contrast, according to the impact analysis, the cell cycle issignificant at 1%, and focal adhesion and Wnt signaling are significant at5% and 10%, respectively.
Draghici et al.
1540 Genome Researchwww.genome.org
on October 19, 2007 www.genome.orgDownloaded from

kinson’s diseases are clearly incorrect. However, although rankedfirst, cell cycle is not significant in GSEA, even at the most lenient10% significance and with the least conservative correction.
In contrast, the impact analysis reports cell cycle as the mostperturbed pathway in this condition and also as highly signifi-cant from a statistical perspective (P = 1.6 � 10�6). Since earlyarticles on the molecular mechanisms perturbed in lung cancers(Slebos and Rodenhuis 1989; Nau et al. 1985) until the mostrecent articles on this topic (Panani and Roussos 2006; Coe et al.2006), there is a consensus that the cell cycle is highly derangedin lung cancers. Moreover, cell cycle genes have started to beconsidered both as potential prognostic factors and therapeutictargets (Vincenzi et al. 2006). The second most significant path-way as reported by the impact analysis is focal adhesion. Aninspection of this pathway (shown in Fig. 3) shows that in thesedata, both ITG and RTK receptors are perturbed, as well as theVEGF ligand. Because these three genes appear at the very begin-ning and affect both entry points controlling this pathway, theirperturbations are widely propagated throughout the pathway.Furthermore, the CRK oncogene was also found to be up-regulated. Increased levels of CRK proteins have been observed inseveral human cancers, and over-expression of CRK in epithelialcell cultures promotes enhanced cell dispersal and invasion (Rod-rigues et al. 2005). For this pathway, the impact analysis yieldsa raw P-value of 0.005, which remains significant even after theFDR correction (P = 0.048), at the 5% level. In contrast, the ORAanalysis using the hypergeometric model yields a raw P-value of0.155 (FDR corrected to 0.627), while the GSEA analysis yields araw P-value of 0.16 (FDR corrected to 0.384). For both tech-niques, not even the raw P-values are significant at the usual
levels of 5% or 10%. This is not a mere accident but an illustra-tion of the intrinsic limitations of the classical approaches. Theseapproaches completely ignore the position of the genes on thegiven pathways, and therefore, they are not able to identify thispathway as being highly impacted in this condition. Note thatany ORA approach will yield the same results for this pathway forany set of four differentially expressed genes from the set of geneson this pathway. Similarly, GSEA will yield the same results forany other set of four genes with similar expression values (yield-ing similar correlations with the phenotype). Both techniques areunable to distinguish between a situation in which these genesare upstream, potentially commandeering the entire pathway asin this example, or randomly distributed throughout the pathway.
The third pathway as ranked by the impact analysis is Wntsignaling (FDR corrected P = 0.055, significant at 10%). The im-portance of this pathway is well supported by independent re-search. At least three mechanisms for the activation of Wnt sig-naling pathway in lung cancers have been recently identified: (1)over-expression of Wnt effectors such as Dvl, (2) activation of anon-canonical pathway involving MAPK (previously known asJNK), and (3) repression of Wnt antagonists such as WIF(Mazieres et al. 2005). Mazieres and colleagues also argue that theblockade of Wnt pathway may lead to new treatment strategiesin lung cancer.
In the same data set, Huntington’s disease, Parkinson’s dis-ease, prion disease, and Alzheimer’s disease have low IFs (cor-rected P-values of >0.20), correctly indicating that they are un-likely to be relevant in lung adenocarcinomas.
A second data set includes genes identified as being associ-ated with poor prognosis in breast cancer (van’t Veer et al. 2002).
Figure 3. The focal adhesion pathway as impacted in lung adenocarcinoma vs. normal. In this condition, both ITG and RTK receptors are perturbed,as well as the VEGF ligand. Because these three genes appear at the very beginning and affect both entry points controlling this pathway, theirperturbations are widely propagated throughout the pathway and this pathway appears as highly impacted. All classical approaches completely ignorethe positions of the genes on the given pathways and fail to identify this pathway as significant.
An impact analysis of gene signaling pathways
Genome Research 1541www.genome.org
on October 19, 2007 www.genome.orgDownloaded from
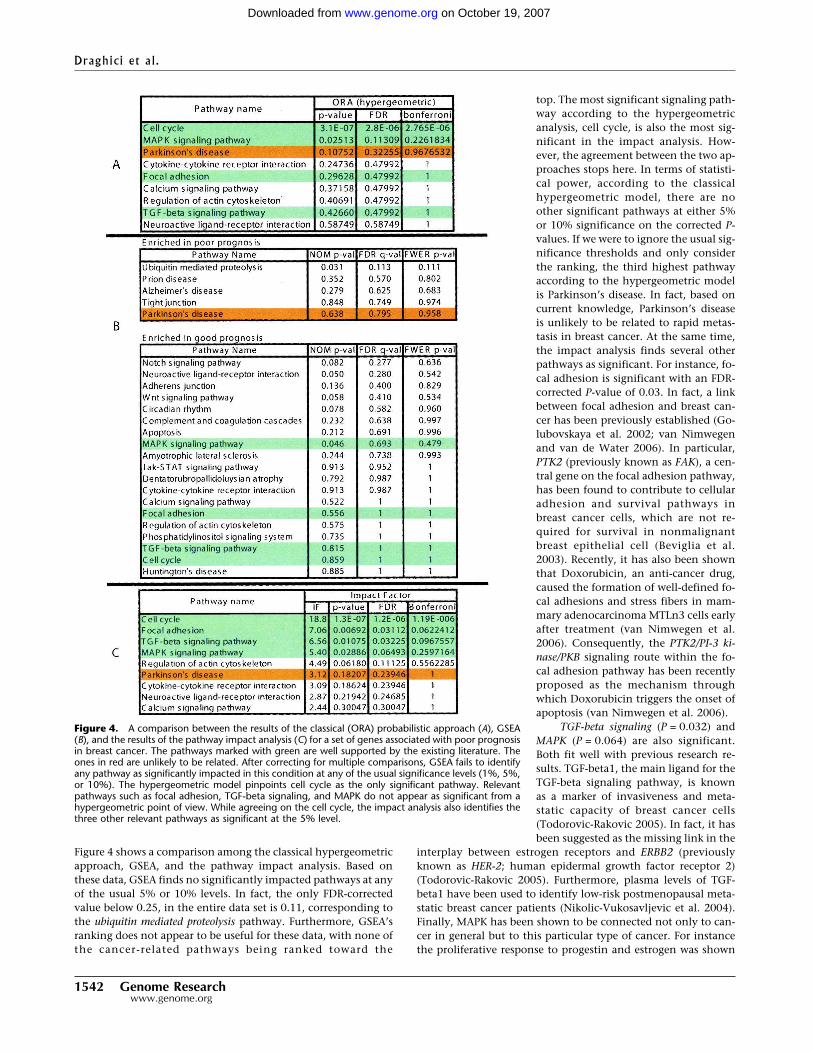
Figure 4 shows a comparison among the classical hypergeometricapproach, GSEA, and the pathway impact analysis. Based onthese data, GSEA finds no significantly impacted pathways at anyof the usual 5% or 10% levels. In fact, the only FDR-correctedvalue below 0.25, in the entire data set is 0.11, corresponding tothe ubiquitin mediated proteolysis pathway. Furthermore, GSEA’sranking does not appear to be useful for these data, with none ofthe cancer-related pathways being ranked toward the
top. The most significant signaling path-way according to the hypergeometricanalysis, cell cycle, is also the most sig-nificant in the impact analysis. How-ever, the agreement between the two ap-proaches stops here. In terms of statisti-cal power, according to the classicalhypergeometric model, there are noother significant pathways at either 5%or 10% significance on the corrected P-values. If we were to ignore the usual sig-nificance thresholds and only considerthe ranking, the third highest pathwayaccording to the hypergeometric modelis Parkinson’s disease. In fact, based oncurrent knowledge, Parkinson’s diseaseis unlikely to be related to rapid metas-tasis in breast cancer. At the same time,the impact analysis finds several otherpathways as significant. For instance, fo-cal adhesion is significant with an FDR-corrected P-value of 0.03. In fact, a linkbetween focal adhesion and breast can-cer has been previously established (Go-lubovskaya et al. 2002; van Nimwegenand van de Water 2006). In particular,PTK2 (previously known as FAK), a cen-tral gene on the focal adhesion pathway,has been found to contribute to cellularadhesion and survival pathways inbreast cancer cells, which are not re-quired for survival in nonmalignantbreast epithelial cell (Beviglia et al.2003). Recently, it has also been shownthat Doxorubicin, an anti-cancer drug,caused the formation of well-defined fo-cal adhesions and stress fibers in mam-mary adenocarcinoma MTLn3 cells earlyafter treatment (van Nimwegen et al.2006). Consequently, the PTK2/PI-3 ki-nase/PKB signaling route within the fo-cal adhesion pathway has been recentlyproposed as the mechanism throughwhich Doxorubicin triggers the onset ofapoptosis (van Nimwegen et al. 2006).
TGF-beta signaling (P = 0.032) andMAPK (P = 0.064) are also significant.Both fit well with previous research re-sults. TGF-beta1, the main ligand for theTGF-beta signaling pathway, is knownas a marker of invasiveness and meta-static capacity of breast cancer cells(Todorovic-Rakovic 2005). In fact, it hasbeen suggested as the missing link in the
interplay between estrogen receptors and ERBB2 (previouslyknown as HER-2; human epidermal growth factor receptor 2)(Todorovic-Rakovic 2005). Furthermore, plasma levels of TGF-beta1 have been used to identify low-risk postmenopausal meta-static breast cancer patients (Nikolic-Vukosavljevic et al. 2004).Finally, MAPK has been shown to be connected not only to can-cer in general but to this particular type of cancer. For instancethe proliferative response to progestin and estrogen was shown
Figure 4. A comparison between the results of the classical (ORA) probabilistic approach (A), GSEA(B), and the results of the pathway impact analysis (C) for a set of genes associated with poor prognosisin breast cancer. The pathways marked with green are well supported by the existing literature. Theones in red are unlikely to be related. After correcting for multiple comparisons, GSEA fails to identifyany pathway as significantly impacted in this condition at any of the usual significance levels (1%, 5%,or 10%). The hypergeometric model pinpoints cell cycle as the only significant pathway. Relevantpathways such as focal adhesion, TGF-beta signaling, and MAPK do not appear as significant from ahypergeometric point of view. While agreeing on the cell cycle, the impact analysis also identifies thethree other relevant pathways as significant at the 5% level.
Draghici et al.
1542 Genome Researchwww.genome.org
on October 19, 2007 www.genome.orgDownloaded from

to be inhibited in mammary cells micro-injected with inhibitors of MAP kinasepathway (Chen et al. 2001). Also, it isworth noting the gap between the P-values for regulation of actin cytoskeleton(P = 0.111), which may be relevant incancer, and the next pathway, Parkin-son’s disease (P = 0.239), which is irrel-evant in this condition.
A third data set involves a set of dif-ferentially expressed genes obtained bystudying the response of a hepatic cellline when treated with palmitate(Swagell et al. 2005). Figure 5 shows thecomparison between the classical statis-tical analysis (ORA) and the pathway im-pact analysis. (The GSEA analysis re-quires expression values for all genes;since this experiment was performedwith a custom array and not all valuesare publicly available, GSEA could not beapplied here.) The classical statisticalanalysis yields three pathways signifi-cant at the 5% level: complement and co-agulation cascades, focal adhesion, andMAPK. The impact analysis agrees on allthese but also identifies several addi-tional pathways. The top four pathwaysidentified by the impact analysis are wellsupported by the existing literature.There are several studies that support theexistence of a relationship between dif-ferent coagulation factors, present in thecomplement and coagulation cascadespathway, and palmitate. Sanders et al.(1999), for instance, demonstrated that ahigh palmitate intake affects factor VIIcoagulant (FVIIc) activity. Interestingly,Figure 1 shows not only that this path-way has a higher than expected propor-tion of differentially expressed genes butalso that six out of seven such genes areinvolved in the same region of the path-way, suggesting a coherently propagatedperturbation. The focal adhesion and tight junction pathwaysinvolve cytoskeletal genes. Swagell et al. (2005) considered thepresence of the cytoskeletal genes among the differentially ex-pressed genes as very interesting and hypothesized that thedown-regulation of these cytoskeletal genes indicates that palmi-tate decreases cell growth. Finally, the link between MAPK andthe palmitate was established by Susztak et al. (2005), whoshowed that p38 MAP kinase is a key player in the palmitate-induced apoptosis.
Conclusions
A statistical approach using various models is commonly used inorder to identify the most relevant pathways in a given experi-ment. This approach is based on the set of genes involved in eachpathway. We identified a number of additional factors that maybe important in the description and analysis of a given biologicalpathway. Based on these, we developed a novel impact analysis
method that uses a systems biology approach in order to identifypathways that are significantly impacted in any condition moni-tored through a high-throughput gene expression technique.The impact analysis incorporates the classical probabilistic com-ponent but also includes important biological factors that are notcaptured by the existing techniques: the magnitude of the ex-pression changes of each gene, the position of the differentiallyexpressed genes on the given pathways, the topology of the path-way that describes how these genes interact, and the type ofsignaling interactions between them. The results obtained onseveral independent data sets show that the proposed approach isvery promising. This analysis method has been implemented as aWeb-based tool, Pathway-Express, freely available as part of theOnto-Tools (http://vortex.cs.wayne.edu).
AcknowledgmentsThis material is based upon work supported by the followinggrants: NSF DBI-0234806, CCF-0438970, 1R01HG003491-01A1,
Figure 5. A comparison between the results of the classical probabilistic approach (A) and the resultsof the impact analysis (B) for a set of genes found to be differentially expressed in a hepatic cell linetreated with palmitate. Green pathways are well supported by literature evidence, while red pathwaysare unlikely to be relevant. The classical statistical analysis yields three pathways significant at the 5%level: complement and coagulation cascades, focal adhesion, and MAPK. The impact analysis agrees onthese three pathways but also identifies several additional pathways. Among these, tight junction is wellsupported by the literature.
An impact analysis of gene signaling pathways
Genome Research 1543www.genome.org
on October 19, 2007 www.genome.orgDownloaded from

1U01CA117478-01, 1R21CA100740-01, 1R01NS045207-01,5R21EB000990-03, 2P30 CA022453-24. Onto-Tools currentlyruns on equipment provided by Sun Microsystems EDU 7824-02344-U and by NIH(NCRR) 1S10 RR017857-01. Any opinions,findings, and conclusions or recommendations expressed in thismaterial are those of the author(s) and do not necessarily reflectthe views of the NSF, NIH, DOD, or any other of the fundingagencies.
References
Beer, D.G., Kardia, S.L., Huang, C.-C., Giordano, T.J., Levin, A.M., Misek,D.E., Lin, L., Chen, G., Gharib, T.G., Thomas, D.G., et al. 2002.Gene-expression profiles predict survival of patients with lungadenocarcinoma. Nat. Med. 8: 816–824.
Beviglia, L., Golubovskaya, V., Xu, L., Yang, X., Craven, R.J., and Cance,W.G. 2003. Focal adhesion kinase N-terminus in breast carcinomacells induces rounding, detachment and apoptosis. Biochem. J.373: 201–210.
Breslin, T., Krogh, M., Peterson, C., and Troein, C. 2005. Signaltransduction pathway profiling of individual tumor samples. BMCBioinformatics 6: 163. doi: 10.1186/1471-2105-6-163.
Canales, R.D., Luo, Y., Willey, J.C., Austermiller, B., Barbacioru, C.C.,Boysen, C., Hunkapiller, K., Jensen, R.V., Knight, C.R., Lee, K.Y., etal. 2006. Evaluation of DNA microarray results with quantitativegene expression platforms. Nat. Biotechnol. 24: 1115–1122.
Chen, Z., Gibson, T.B., Robinson, F., Silvestro, L., Pearson, G., Xu, B.,Wright, A., Vanderbilt, C., and Cobb, M.H. 2001. MAP kinases.Chem. Rev. 101: 2449–2476.
Chung, H.-J., Kim, M., Park, C.H., Kim, J., and Kim, J.H. 2004.ArrayXPath: Mapping and visualizing microarray gene-expressiondata with integrated biological pathway resources using scalablevector graphics. Nucleic Acids Res. 32:W460–W464. doi:10.1093/nar/gkh476.
Churchill, G.A. 2002. Fundamentals of experimental design for cDNAmicroarrays. Nat. Genet. 32 (Suppl. S): 490–495.
Coe, B.P., Lockwood, W.W., Girard, L., Chari, R., Macaulay, C., Lam, S.,Gazdar, A.F., Minna, J.D., and Lam, W.L. 2006. Differentialdisruption of cell cycle pathways in small cell and non-small celllung cancer. Br. J. Cancer 94: 1927–1935.
Dahlquist, K., Salomonis, N., Vranizan, K., Lawlor, S., and Conklin, B.2002. GenMAPP, a new tool for viewing and analyzing microarraydata on biological pathways. Nat. Genet. 31: 19–20.
Doniger, S.W., Salomonis, N., Dahlquist, K.D., Vranizan, K., Lawlor,S.C., and Conklin, B.R. 2003. MAPPfinder: using Gene Ontology andGenMAPP to create a global gene expression profile from microarraydata. Genome Biol. 4: R7. doi:10.1186/gb-2003-4-1-r7.
Draghici, S. 2002. Statistical intelligence: Effective analysis ofhigh-density microarray data. Drug Discov. Today 7: S55–S63.
Draghici, S., Khatri, P., Martins, R.P., Ostermeier, G.C., and Krawetz, S.A.2003. Global functional profiling of gene expression. Genomics81: 98–104.
Draghici, S., Khatri, P., Eklund, A.C., and Szallasi, Z. 2006. Reliabilityand reproducibility issues in DNA microarray measurements. TrendsGenet. 22: 101–109.
Goeman, J.J., van de Geer, S.A., de Kort, F., and van Houwelingen, H.C.2004. A global test for groups of genes: Testing association with aclinical outcome. Bioinformatics 20: 93–99.
Golubovskaya, V., Beviglia, L., Xu, L.H., Earp, H.S., Craven, R., andCance, W. 2002. Dual inhibition of focal adhesion kinase andepidermal growth factor receptor pathways cooperatively inducesdeath receptor-mediated apoptosis in human breast cancer cells. J.Biol. Chem. 277: 38978–38987.
Grosu, P., Townsend, J.P., Hartl, D.L., and Cavalieri, D. 2002. Pathwayprocessor: A tool for integrating whole-genome expression resultsinto metabolic networks. Genome Res. 12: 1121–1126.
Holford, M., Li, N., Nadkarni, P., and Zhao, H. 2004. VitaPad:Visualization tools for the analysis of pathway data. Bioinformatics21: 1596–1602.
Joshi-Tope, G., Gillespie, M., Vasrik, I., D’Eustachio, P., Schmidt, E., deBone, B., Jassal, B., Gopinath, G.R., Wu, G.R., Matthews, L., et al.2005. Reactome: A knowledgebase of biological pathways. NucleicAcids Res. 33: D428–D432. doi: 10.1093/nar/gki072.
Khatri, P. and Draghici, S. 2005. Ontological analysis of gene expressiondata: Current tools, limitations, and open problems. Bioinformatics21: 3587–3595.
Khatri, P., Draghici, S., Ostermeier, G.C., and Krawetz, S.A. 2002.
Profiling gene expression using Onto-Express. Genomics 79: 266–270.Mazieres, J., He, B., You, L., Xu, Z., and Jablons, D.M. 2005. Wnt
signaling in lung cancer. Cancer Lett. 222: 1–10.Mootha, V.K., Lindgren, C.M., Eriksson, K.-F., Subramanian, A., Sihag,
S., Lehar, J., Puigserver, P., Carlsson, E., Ridderstrale, M., Laurila, E.,et al. 2003. Pgc-1�-responsive genes involved in oxidativephosphorylation are coordinately downregulated in human diabetes.Nat. Genet. 34: 267–273.
Nau, M.M., Brooks, B.J., Battey, J., Sausville, E., Gazdar, A.F., Kirsch, I.R.,McBride, O.W., Bertness, V., Hollis, G.F., Minna, J.D., et al. 1985.L-myc, a new myc-related gene amplified and expressed in humansmall cell lung cancer. Nature 318: 69–73.
Nikitin, A., Egorov, S., Daraselia, N., and Mazo, I. 2003. Pathwaystudio—The analysis and navigation of molecular networks.Bioinformatics 19: 2155–2157.
Nikolic-Vukosavljevic, D., Todorovic-Rakovic, N., Demajo, M., Ivanovic,V., Neskovic, B., Markicevic, M., and Neskovic-Konstantinovic, Z.2004. Plasma TGF-beta1-related survival of postmenopausalmetastatic breast cancer patients. Clin. Exp. Metastasis 21: 581–585.
Ogata, H., Goto, S., Sato, K., Fujibuchi, W., Bono, H., and Kanehisa, M.1999. KEGG: Kyoto Encyclopedia of Genes and Genomes. NucleicAcids Res. 27: 29–34.
Page, L., Brin, S., Motwani, R., and Winograd, T. 1998. The pagerankcitation ranking: Bringing order to the Web. Technical report.Stanford University, Palo Alto, CA.
Pan, D., Sun, N., Cheung, K.-H., Guan, Z., Ma, L., Holford, M., Deng, X.,and Zhao, H. 2003. PathMAPA: A tool for displaying gene expressionand performing statistical tests on metabolic pathways at multiplelevels for Arbidopsis. BMC Bioinformatics 4: 56. doi:10.1186/1471-2105-4-56.
Panani, A.D. and Roussos, C. 2006. Cytogenetic and molecular aspectsof lung cancer. Cancer Lett. 239: 1–9.
Pandey, R., Guru, R.K., and Mount, D.W. 2004. Pathway Miner:Extracting gene association networks from molecular pathways forpredicting the biological significance of gene expression microarraydata. Bioinformatics 20: 2156–2158.
Pavlidis, P., Qin, J., Arango, V., Mann, J.J., and Sibille, E. 2004. Usingthe gene ontology for microarray data mining: A comparison ofmethods and application to age effects in human prefrontal cortex.Neurochem. Res. 29: 1213–1222.
Quackenbush, J. 2001. Computational analysis of microarray data. Nat.Rev. Genet. 2: 418–427.
Rahnenfuhrer, J., Domingues, F. S., Maydt, J., and Lengauer, T., 2004.Calculating the statistical significance of changes in pathway activityfrom gene expression data. Stat. Appl. Genet. Mol. Biol. 3: article16.http://www.bepress.com/sagmb/vol3/iss1/art16/
Robinson, P.N., Wollstein, A., Bohme, U., and Beattie, B. 2004.Ontologizing gene-expression microarray data: Characterizingclusters with gene ontology. Bioinformatics 20: 979–981.
Rodrigues, S., Fathers, K., Chan, G., Zuo, D., Halwani, F., Meterissian, S.,and Park, M. 2005. CrkI and CrkII function as key signalingintegrators for migration and invasion of cancer cells. Mol. CancerRes. 3: 183–194.
Sanders, T.A., de Grassi, T., Miller, G.J., and Humphries, S.E. 1999.Dietary oleic and palmitic acids and postprandial factor VII inmiddle-aged men heterozygous and homozygous for factor VIIR353Q polymorphism. Am. J. Clin. Nutr. 69: 220–225.
Shannon, P., Markiel, A., Ozier, O., Baliga, N.S., Wang, J.T., Ramage, D.,Amin, N., Schwikowskis, B., and Ideker, T. 2003. Cytoscape: Asoftware environment for integrated models of biomolecularinteraction networks. Genome Res. 13: 2498–2504.
Slebos, R.J. and Rodenhuis, S. 1989. The molecular genetics of humanlung cancer. Eur. Respir. J. 2: 461–469.
Stelling, J. 2004. Mathematical models in microbial systems biology.Curr. Opin. Microbiol. 7: 513–518.
Subramanian, A., Tamayo, P., Mootha, V.K., Mukherjee, S., Ebert, B.L.,Gillette, M.A., Paulovich, A., Pomeroy, S.L., Golub, T.R., Lander, E.S.,et al. 2005. Gene set enrichment analysis: A knowledge-basedapproach for interpreting genome-wide expression profiles. Proc.Natl. Acad. Sci. 102: 15545–15550.
Susztak, K., Ciccone, E., McCue, P., Sharma, K., and Bttinger, E.P. 2005.Multiple metabolic hits converge on CD36 as novel mediator oftubular epithelial apoptosis in diabetic nephropathy. PLoS Med.2: e45. doi: 10.1371/journal.pmed.0020045.
Swagell, C., Henly, D., and Morris, C.P. 2005. Expression analysis of ahuman hepatic cell line in response to palmitate. Biochem. Biophys.Res. Commun. 328: 432–441.
Tavazoie, S., Hughes, J.D., Campbell, M.J., Cho, R.J., and Church, G.M.1999. Systematic determination of genetic network architecture. Nat.Genet. 22: 281–285.
Tian, L., Greenberg, S.A., Kong, S.W., Altschuler, J., Kohane, I.S., and
Draghici et al.
1544 Genome Researchwww.genome.org
on October 19, 2007 www.genome.orgDownloaded from

Park, P.J. 2005. Discovering statistically significant pathways inexpression profiling studies. Proc. Natl. Acad. Sci. 102: 13544–13549.
Todorovic-Rakovic, N. 2005. Tgf-beta 1 could be a missing link in theinterplay between er and her-2 in breast cancer. Med. Hypotheses65: 546–551.
van Nimwegen, M.J. and van de Water, B. 2006. Focal adhesion kinase:A potential target in cancer therapy. Biochem. Pharmacol.73: 597–609.
van Nimwegen, M.J., Huigsloot, M., Camier, A., Tijdens, I.B., and van deWater, B. 2006. Focal adhesion kinase and protein kinase bcooperate to suppress doxorubicin-induced apoptosis of breast tumorcells. Mol. Pharmacol. 70: 1330–1339.
van’t Veer, L.J., Dai, H., van de Vijver, M.J., He, Y.D., Hart, A., Mao, M.,Peterse, H.L., van der Kooy, K., Marton, M.J., Witteveenothers, A.T.,et al. 2002. Gene expression profiling predicts clinical outcome ofbreast cancer. Nature 415: 530–536.
Vincenzi, B., Schiavon, G., Silletta, M., Santini, D., Perrone, G., DiMarino, M., Angeletti, S., Baldi, A., and Tonini, G. 2006. Cell cyclealterations and lung cancer. Histol. Histopathol. 21: 423–435.
Yang, Y.H. and Speed, T. 2002. Design issues for cDNA microarrayexperiments. Nat. Rev. Genet. 3: 579–588.
Received December 11, 2006; accepted in revised form June 28, 2007.
An impact analysis of gene signaling pathways
Genome Research 1545www.genome.org
on October 19, 2007 www.genome.orgDownloaded from