a synthesis report - review of special education in the commonwealth of massachusetts ·...
TRANSCRIPT

Review of Special Education in the Commonwealth of Massachusetts:
A Synthesis Report
Thomas Hehir and Associates
Thomas Hehir, Ed.D, Laura Schifter, Ed.D, Todd Grindal, Ed.D, Monica Ng, and Hadas Eidelman
Boston, Massachusetts August 2014
Report commissioned by the Massachusetts Department of Elementary and Secondary
Education Mitchell D. Chester, Ed.D., Commissioner

1
Table of Contents Introduction ................................................................................................................................. 2
Overview of Special Education in Massachusetts ............................................................... 3
Overarching Findings ................................................................................................................ 5 Overarching Finding #1: There were substantial differences in the identification,
placement, and performance of low-income and non-low-income students with
disabilities. .............................................................................................................................................. 5
Overarching Finding #2: Students with disabilities who had full inclusion placements appeared to outperform similar students who were not included to the same extent in general education classrooms with their non-disabled peers. .................................................... 8 Overarching Finding #3: Inclusive options for students with disabilities in traditional public schools were limited after the elementary school level. ............................................... 10 Overarching Finding #4: There were meaningful differences from district to district in special education identification, placement, and performance. .............................................. 12
Discussion .................................................................................................................................. 15
Recommendations .................................................................................................................... 17 The State Education Agency Role and Accountability for Special Education in Massachusetts ..................................................................................................................................... 17 Policy Mechanisms ............................................................................................................................ 20
Conclusion ................................................................................................................................. 21
References .................................................................................................................................. 22
Appendix A: Definitions ......................................................................................................... 24 Appendix B: Logic Models for Department of Elementary and Secondary Education Interventions for Identification and Placement ................................................................ 26 Appendix C: Table of Recommendations from the Three Special Education Reports Written by Thomas Hehir & Associates, Organized by the Three Focus Areas for Intervention ............................................................................................................................... 29 Appendix D: Narrative Summary of Recommendations from the Three Special Education Reports Written by Thomas Hehir & Associates, Organized by the Three Focus Areas for Intervention ................................................................................................ 30

2
Introduction In 2011, Massachusetts Commissioner of Elementary and Secondary Education, Dr. Mitchell D. Chester, commissioned Thomas Hehir and Associates to conduct a review of special education in the Commonwealth. The purpose of this review was to develop a comprehensive understanding of the identification, placement, and academic performance of students with disabilities in Massachusetts and to recommend strategies that the Department of Elementary and Secondary Education might use to improve outcomes for students with disabilities. This review consisted of three related reports. The first report focused on students with disabilities enrolled in traditional public schools,1 the second report focused on students enrolled in Career and Technical Education programs,2 and the third report examined students with disabilities enrolled in out-of-district programs.3 Over the course of these three studies, we conducted a wide range of statistical analyses, surveyed district directors of special education, interviewed teachers and administrators in Career and Technical Education programs, and facilitated focus groups with administrators and parents of children with disabilities in Massachusetts.4 This document provides a synthesis of the three reports and focuses on four overarching findings that were present across our studies:
1) There were substantial differences in the identification, placement, and performance of low-income and non-low-income students with disabilities.
2) Students with disabilities who had full inclusion placements5 appeared to outperform similar students who were not included to the same extent in general education classrooms with their non-disabled peers.
3) The inclusive options for students with disabilities in secondary school were limited.
4) There were meaningful differences from district to district in special education identification, placement, and performance.
We begin this report with an overview of special education identification, placement, and performance in Massachusetts. We then elaborate on each of the four overarching findings and conclude with recommendations to improve opportunities for all students with disabilities in the Commonwealth. In the Appendix, we provide definitions for several terms used in this report, including ‘high incidence disabilities,’ ‘full inclusion placements,’ and ‘career and technical education programs.’
1 http://www.doe.mass.edu/sped/hehir/2012-04sped.pdf 2 http://www.doe.mass.edu/sped/hehir/2013-07cte.pdf 3 http://www.doe.mass.edu/sped/hehir/2013-10OutofDistrict.pdf 4 We conducted these studies over a three-year period. Our first report relied on data from the 2010-2011 school year, and the second and third reports relied on data from 2006-2012. Therefore, the findings presented in this synthesis document rely on the data used in the corresponding reports. 5 As defined by the placement guidelines developed by the US Department of Education. See Appendix A.
3
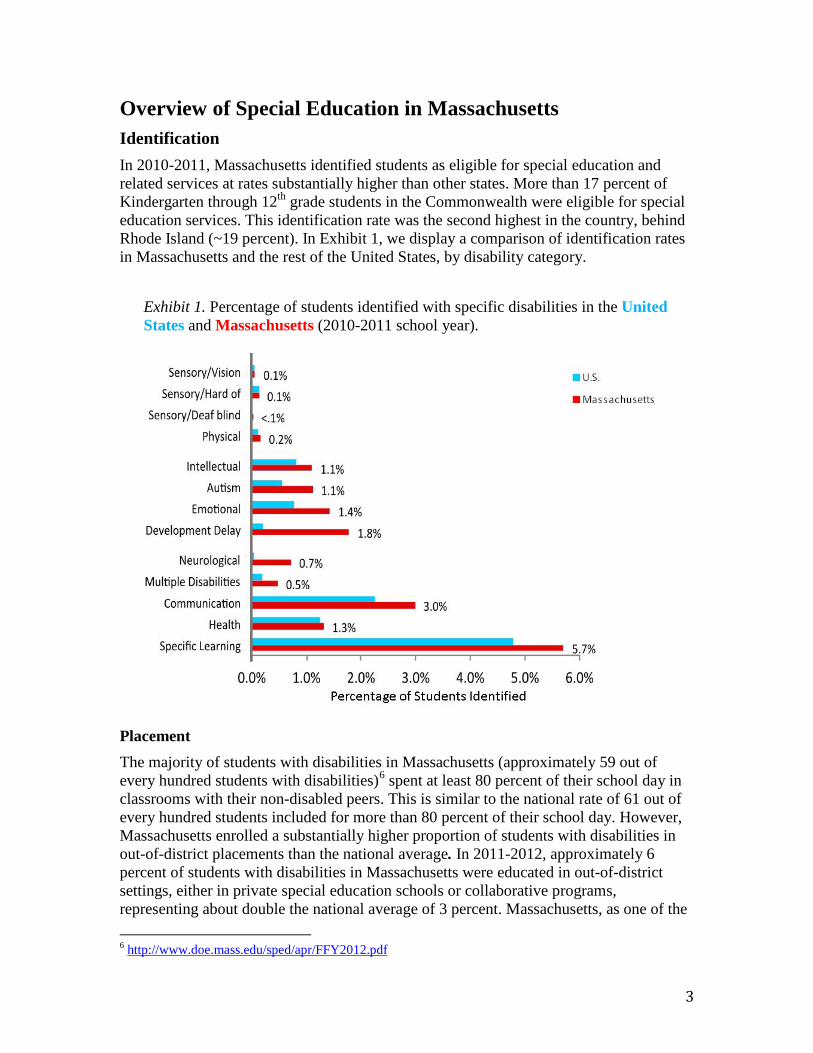
Overview of Special Education in Massachusetts Identification In 2010-2011, Massachusetts identified students as eligible for special education and related services at rates substantially higher than other states. More than 17 percent of Kindergarten through 12th grade students in the Commonwealth were eligible for special education services. This identification rate was the second highest in the country, behind Rhode Island (~19 percent). In Exhibit 1, we display a comparison of identification rates in Massachusetts and the rest of the United States, by disability category.
Exhibit 1. Percentage of students identified with specific disabilities in the United States and Massachusetts (2010-2011 school year).
Placement The majority of students with disabilities in Massachusetts (approximately 59 out of every hundred students with disabilities)6 spent at least 80 percent of their school day in classrooms with their non-disabled peers. This is similar to the national rate of 61 out of every hundred students included for more than 80 percent of their school day. However, Massachusetts enrolled a substantially higher proportion of students with disabilities in out-of-district placements than the national average. In 2011-2012, approximately 6 percent of students with disabilities in Massachusetts were educated in out-of-district settings, either in private special education schools or collaborative programs, representing about double the national average of 3 percent. Massachusetts, as one of the 6 http://www.doe.mass.edu/sped/apr/FFY2012.pdf

4
first states to pass its own special education law in the 1970’s, began building special education capacity early and has developed a robust set of out-of-district options for students with disabilities. While several northeastern states have significant numbers of students in out-of-district settings, many states do not use out-of-district options in the same manner, e.g., a number of states have a “state school” for certain populations rather than the selection of private schools that have developed in Massachusetts. Arguably, Massachusetts has the largest selection of private out-of-district options in the nation. When we consider that Massachusetts identified a higher percentage of students as eligible for special education and related services, the proportion of all students educated in substantially separate placements, both within traditional public schools and in out-of-district placements, was higher than the national rate. Combining Massachusetts students in all substantially separate settings, 2012 data indicated that 32,546 students aged 6 through 21 years old were educated in substantially separate placements housed within traditional public schools, separate schools, residential facilities, or hospital or homebound placements.7 This represented approximately 3.4 percent of all students (compared to about 2.3 percent nationally). Approximately 2.3 percent of all students in the Commonwealth were educated in substantially separate settings in traditional public schools (compared to about 1.8 percent nationally), and the remaining 1.1 percent were educated in separate schools, residential facilities, or hospital or homebound placements (compared to about 0.5 percent nationally).8 Performance Overall, Massachusetts students with disabilities earned higher scores on the National Assessment of Educational Progress (NAEP) and exhibited higher high school graduation rates, on average, than did students with disabilities in other states. In 2013, students with disabilities in Massachusetts scored at or near the top of the national distribution on the NAEP English and Mathematics tests when compared to students with disabilities in other states. This finding was generally consistent across grade levels. In addition, in 2012, 69 percent of Massachusetts students with disabilities graduated from high school in four years or less, slightly higher than the national median of 61 percent.9 Although Massachusetts students with disabilities outperform their special education counterparts in other states, it is important to note that their scores on the Massachusetts Comprehensive Assessment System (MCAS) tests and their rates of high school graduation lag far behind their general education peers within the Commonwealth. In 2012, although more than two out of three (69 percent) tested students (general and special education students combined) scored ‘Proficient’ or above on the MCAS English Language Arts exam, this was true for less than one out of three (31 percent) special education students. Similarly, 59 percent of all students scored ‘Proficient’ or above on
7 http://www.doe.mass.edu/sped/apr/FFY2012.pdf 8 The Massachusetts numbers were calculated using data from the Massachusetts APR on the numbers of students in substantially separate placements and dividing by the total student enrollment for 2012. The national numbers were calculated using NCES enrollment information on the percent of students with disabilities and the percent of students with disabilities in substantially separate placements from the Digest of Education Statistics (http://nces.ed.gov/programs/digest/2013menu_tables.asp). 9 http://eddataexpress.ed.gov/data-element-explorer.cfm/tab/data/deid/3940/sort/idown/

5
the MCAS mathematics exam compared to 21 percent of students with disabilities. Additionally, in 2012, 85 percent of all students graduated high school in four years or less, while only 69 percent of students with disabilities did the same.10
Overarching Findings Overarching Finding #1: There were substantial differences in the identification, placement, and performance of low-income and non-low-income students with disabilities.
From initial special education identification, to subsequent educational placement, to academic performance, we found striking differences between the experiences of low-income and non-low-income students with disabilities. • Low-income students were identified as eligible for special education services at
substantially higher rates than non-low-income students. In 2010-2011, nearly one in four low-income students (23 percent) in Massachusetts were identified as having a disability, compared to one in seven (15 percent) non-low-income students. This difference remained even when taking into account the potential effect of relevant student and district characteristics. For example, our analyses indicated that the odds that a low-income student would receive a high incidence disability designation (in one of three categories: learning disability, communication, or other health impairment) were nearly two times the odds for a non-low-income student. Even more striking, we found that the likelihood that a low-income student would be identified with a disability was significantly higher if he or she attended school in a relatively high-income district than if he or she attended school in a relatively low-income district.
• Among students enrolled in traditional public schools, low-income students with disabilities were educated outside of the general education classroom at rates substantially higher than non-low-income students. In Exhibit 2, we present a descriptive comparison of the degree to which low-income and non-low-income students with disabilities were educated with their typically developing peers. For students educated in traditional public schools, 20.2 percent of low-income students were educated in substantially separate settings (less than 40 percent of the school day in general education classrooms), compared to only 8.5 percent of non-low-income students. Again, this pattern remained even when we accounted for factors that might explain these discrepancies. The odds that a low-income student would be educated in a substantially separate setting were between 1.8 and 2 times the odds for a non-low-income student. This finding was consistent across the elementary, middle, and high school years.
10 http://www.doe.mass.edu/infoservices/reports/gradrates/2012-4yr.pdf

6
Exhibit 2. Percentages of low-income and non-low-income students with disabilities by the percentage of their day that they were educated with typically developing peers in the 2010-2011 school year.
• Although low-income students were more likely to be educated in substantially separate settings within traditional public schools, they were less likely to receive a publicly financed placement in a private special education school. Differences in out-of-district private special education school placement between low-income and non-low-income students were consistent across all grades and disability categories in Massachusetts throughout the 2006-2012 period. Exhibit 3 shows these differences in 2012.
Exhibit 3. Number and percentage of students with disabilities enrolled in private special education schools in 2012 displayed by sending district and low-income status.
Perc
enta
ge o
f Stu
dent
s

7
When we considered what this difference might look like in different disability categories, we found that in 2012, of the 1,959 non-low-income high school students with autism, 451 (23 percent) were placed in private special education schools. Meanwhile, among the 1,007 low-income high school students with autism, only 110 (11 percent) were placed in private special education schools. Similarly, 265 (3 percent) of the 9,898 non-low-income high school students with learning disabilities attended private special education schools, compared to 103 (less than 1 percent) of the 12,721 low-income high school students with learning disabilities.
Although we cannot say with certainty why low-income students enrolled in private schools at such dramatically lower rates, our survey of Massachusetts special education directors provided some reasonable hypotheses. Special education directors suggested that placement in a private special education school was in part driven by families’ use of outside evaluators, advocates, and lawyers. Consistent with this evidence, in our interviews with a small sample of special education directors, parents, and approved private-school administrators, participants noted that this process was almost exclusively available to parents with the time and financial resources to build a case that their child was not receiving appropriate educational services within their local school district. While there was disagreement among the people with whom we spoke as to whether private placements were in the best interest of the child or not, there was agreement that low-income families did not have the same level of resources, time, or advocacy in this process as their higher-income counterparts.
8
Overarching Finding #2: Students with disabilities who had full inclusion placements appeared to outperform similar students who were not included to the same extent in general education classrooms with their non-disabled peers.
Across each of our studies, we found evidence suggesting that students with disabilities benefitted from being included in the general education classroom with their non-disabled peers. Students with disabilities who had full inclusion placements (spending 80 percent or more of the school day in general education classrooms), on average, earned higher MCAS scores, graduated high school at higher rates,11 and were more likely to remain in their local school districts than students who were educated in substantially separate placements (spending less than 40 percent of the day in the general education classroom). Like students across the country, the proportion of time Massachusetts students spent being educated in classrooms with their non-disabled peers varied for students with different disability designations. For example, students with disabilities in the high incidence categories had full inclusion placements with their non-disabled peers at higher rates than students with other disability classifications. Students with intellectual disabilities, autism, multiple disabilities, and emotional disturbance had higher rates of substantially separate placements than students with other disability classifications. • Students with high incidence disabilities who had full inclusion placements, on
average, performed better on the MCAS than students with high incidence disabilities who were in substantially separate placements in traditional public schools. Although there are likely important ways in which included and segregated students differ from one another, we attempted to control for these differences using a rich set of student and district-level characteristics in our statistical models. Our controlled multilevel regression analyses indicated that among students with high incidence disabilities, those who had full inclusion placements with their non-disabled peers, on average, scored higher on the MCAS than students with high incidence disabilities in substantially separate settings. This finding was consistent across the elementary, middle, and high school years as well as across test subject areas.
Exhibit 4 illustrates findings from controlled multilevel regression models for 8th grade students with high incidence disabilities. Although students with high incidence disabilities, on average, scored in the ‘Needs Improvement’ category regardless of instructional setting, students who had full inclusion placements scored approximately 4 raw points higher than those who were partially included (40-79 percent of the school day in general education classrooms) and 7 raw points higher than students who were in substantially separate placements.
11 This finding, described in detail below, comes from Dr. Schifter’s recently completed doctoral thesis, which analyzed the same data used for these reports. These findings were published in Schifter, 2014. For more details contact the author ([email protected]).

9
Exhibit 4. Predicted average scores on the 8th grade English Language Arts MCAS for students with high incidence disabilities by educational placement in the 2010-2011 school year.
• Students with disabilities who had full inclusion placements had a higher probability of graduating high school than students with disabilities educated in substantially separate settings. Across all disability groups and in each subsequent year after high-school entry, students with disabilities in Massachusetts who were educated in the general education classroom for 80 percent or more of the day had a higher probability for graduation, on average, than students educated in substantially separate settings.12 Among students with learning or communication disabilities, the odds that a student with a full inclusion placement would graduate in four years or less were nearly 5 times the odds for a similar student with a substantially separate placement.13 The magnitude of this finding differed by disability category, though even in the least pronounced category, students with emotional disturbances, the odds of on-time graduation were still more than double for students who had full inclusion
12 This finding comes from Dr. Schifter’s recently completed doctoral thesis, which analyzed the same data used for this report. These findings were published in Schifter, 2014. For more details contact the author ([email protected]). 13 These models were created using data on three cohorts of students entering ninth grade in 2005, 2006, and 2007. The analysis were conducted using discrete-time survival analysis and controlled for relevant student and district-level characteristics, including disability, income status, race, gender, English proficiency status, town percent eligible for free or reduced-price lunch, and town percent eligible for special education.
0
5
10
15
20
25
30
35
40
45
50
Included 80-100%of the day
Included 40-79%of the day
Included 0-40% ofthe day
Student with a ‘High Incidence’special education designation
Student with a ‘High Incidence’ special education designation who is also eligible for Free/Reduced Price Lunch
Raw
Sc
MCAS Performance Categories

10
placements versus substantially separate placements.14 All else being equal, students with disabilities who were included at least 80 percent of their day, graduated high school at higher rates than students in substantially separate settings.
• Students with disabilities who had full inclusion placements were less likely to move subsequently to out-of-district placements than students educated in substantially separate settings. When we looked at data from 2006-2012 to find patterns in the events preceding a student’s out-of-district placement, we found that in the year prior to initial placement, students who were educated in substantially separate classrooms were considerably more likely to be placed in a private special education school in the subsequent year.15 Across all disability categories, students who were educated in segregated settings in the prior year had 16 times the odds of receiving a private placement than students who had full inclusion placements.
Again, it is of course possible that the students who are educated in substantially separate settings are also the students who, by nature of their disability, face more significant barriers and thus have lower test scores and graduation rates based on underlying differences in ability. However, the variability across district inclusion rates (described more in the district variation section below) supported the hypothesis that individual student ability was not the sole factor behind these findings. Our analyses found that some districts placed many students with disabilities in substantially separate settings who could have had full inclusion placements had they lived in another district. These systemic differences in placement across districts made it less likely that all students who were educated in substantially separate settings were segregated because of their level of needs or ability.
Overarching Finding #3: Inclusive options for students with disabilities in traditional public schools were limited after the elementary school level.
Throughout our research we found that beginning in middle school and continuing through high school, inclusive educational options for students with disabilities appeared to be insufficient. Furthermore, we found that middle school and high school were the main years when students were placed in out-of-district programs, and the majority of those placements appeared to be related to emotional and behavioral issues. Additionally, beginning in high school, we found that low-income, Latino, and African American students with disabilities were more likely to be segregated than their non-low-income, White, or Asian counterparts. While the lack of sufficient inclusive high school options may have led parents and districts to initiate out-of-district placements, we also found that students with high incidence disabilities attended regional vocational and technical schools at higher rates than traditional public schools. Furthermore, students with disabilities who attended 14 For example, among students with emotional disturbance still enrolled four years after high-school entry, 60% of fully included students will graduate on-time, but only 35% of segregated students will graduate on-time. 15 Other factors, including grade retention, less than 90% attendance, and out-of-school suspension were also associated with subsequent out-of-district placement.

11
regional vocational and technical schools graduated in four years or less at significantly higher rates than their counterparts in comprehensive high schools. • Students with disabilities, with the exception of students with sensory disabilities,
tended to first be placed in out-of-district programs in late middle and early high school. Nearly one in three students who left a traditional public school to be placed in a private special education school did so in late middle school or early high school. The frequency of switching to a private special education school was higher in these grades than at any other point in students' progression through the grades. When we spoke with parents and approved private-school special education administrators, they noted that beginning in middle school, larger settings, expectations for more independence, and greater academic rigor and accountability were a sudden transition for students accustomed to smaller and more nurturing environments. Our sample of parents and private-school special education administrators also discussed how students’ increased size often made some students physically very difficult to manage. The private special education providers with whom we spoke also pointed out that in traditional public schools with zero-tolerance policies, students with emotional and behavioral issues were placed out-of-district quickly.
The parents and private school administrators who we interviewed described how in-district programs at the middle and high school levels struggled to provide sufficient supports to address the unique challenges for students with disabilities who required consistent responses to behavior, coordination of services, and accommodations to access the academic curriculum. We spoke with parents of children with intellectual disabilities who shared their concerns that the inclusion that their children had experienced during elementary school would not continue thereafter. Some of these parents stated that in middle school, substantially separate classrooms were the only options offered. In some cases, these rooms included a broad range of students with different diagnoses and needs. Private special education school administrators corroborated these concerns and noted that demand for placements in their schools increased dramatically once students entered the middle and high school grades.
• Segregation of African American and Latino students was evident at the middle
and high school levels. We found notably high levels of segregation of students with disabilities at the middle and high school levels. This was especially true for low-income students, African American students, and Latino students, who until middle school were included at similar rates to their White, Asian, and non-low-income counterparts. Specifically, in high school, two-thirds of White and Asian students with disabilities were educated within the general education classroom for at least 80 percent of their day, compared with only one-half of African American and Latino students with disabilities. This finding was most stark for students in the category of emotional disturbance, where we found that 21 out of 100 African American students with emotional disturbance had a full inclusion placement, while the rate was almost double (40 out of 100) for White students.
African American and Latino students with disabilities were also more likely than White and Asian students with disabilities to be educated in substantially separate

12
classrooms within traditional public schools. Among all African American and Latino students (special and general education) approximately 5 percent were educated in substantially separate classrooms, compared to 1.6 percent of all White and Asian students, more than a three-fold difference. Taking into account student low-income status, student gender, district median family income, and the overall inclusivity of the district, the odds than an African American or Latino middle or high school student with a high incidence disability would be educated in a substantially separate setting were approximately 1.6 times the odds that a White or Asian middle or high school student with a high incidence disability would be similarly separated.
• We found promising practices and outcomes for students with disabilities in some Career and Technical Education (CTE) schools, but these programs were not accessible to all students, and demands for these schools exceeded their current capacity. Students with high incidence disabilities who attended regional vocational and technical schools graduated from high school in four years at substantially higher rates than students with high incidence disabilities who attended traditional high school programs. Students with high incidence disabilities who did not participate in CTE programs graduated from high school in four years at a rate of 70 percent. Meanwhile, students with high incidence disabilities who attended city vocational and technical schools graduated on time at a rate of 78 percent, and similar students in regional vocational and technical schools had an 84 percent on-time graduation rate. Taking into account a number of factors relevant to student performance, we found that the odds of successful four-year graduation for a student with a high incidence disability in a regional vocational and technical school were approximately 1.7 times the odds for a similar student enrolled in a traditional public school. We hypothesized that the high engagement that the vocational focus offered benefitted students’ academics and this hypothesis was corroborated with the CTE faculty whom we interviewed.
Students with disabilities represented 16 percent of the population in regional vocational and technical schools and 17 percent of the student population in city career and technical programs, compared to 10 percent in traditional high schools. However, CTE programs enrolled students with low incidence disabilities and students with emotional disturbance at disproportionately low rates.
Overarching Finding #4: There were meaningful differences from district to district in special education identification, placement, and performance. The findings reported above highlight trends that were present across the Commonwealth. It is important to note that these trends played out differently from one school district to the next. For example, rates of disability identification in specific categories varied widely across districts. Once identified, the degree to which students were included in general education classrooms with non-disabled peers also varied from district to district. In some districts, more than three out of ten students with disabilities were educated in substantially separate settings, while in other districts this number was less than one out of ten.

13
• Across districts with similar demographic characteristics, district behavior differed for special education identification, placement, and performance. Identification: In 2010, rates of special education identification varied substantially across Massachusetts school districts, ranging from a low of approximately 9 percent to a high of 29 percent of a district’s students identified as students with disabilities. It is important to note that when we examined the impact of higher identification rates on student performance, we found that in districts that identified a higher percentage of children as disabled, students with high incidence disabilities did not demonstrate meaningfully higher scores on the MCAS.
Placement: In examining placement, the extent to which students were included in general education classrooms varied considerably even across districts of similar wealth. For instance, in 2010, among higher-income districts,16 the percentage of students with full or partial inclusion placements ranged from 9 percent to 99 percent. The average was 78 percent with a standard deviation of 16 percentage points. Rates also varied for students with substantially separate placements, ranging from less than 1 percent to a high of 31 percent (mean=5 percent, standard deviation=5 percent). These different patterns also existed among low-income districts.17 In these districts, the mean percentage of students with full inclusion placements was 66 percent with a 15 percentage-point standard deviation (range=37 percent-92 percent), and the mean percent of students with substantially separate placements was 12 percent with a standard deviation of 7 percent (range=<1 percent-35 percent). Both the ranges and the standard deviations demonstrate the extent of variability in practices across districts when making decisions about identification and educational placement. We found similar variability in the extent to which districts sent students to private special education schools. In some towns, 10 percent or more of students with disabilities were educated in private special education schools, whereas in other towns, less than 1 percent of students were enrolled in these schools. These town-level rates of out-of-district placement were more or less consistent across the years 2006-2012. The chart in Exhibit 5 below displays town-level percentages of special education students who were enrolled in a private special education school in 2012. As the chart demonstrates, many communities enrolled a relatively small percentage (0-5 percent) of their students with disabilities in private schools, while some enrolled a higher percentage (5-10 percent), and still others enrolled a relatively large percentage (10-14 percent) of their special education students in these programs.
16 For the purposes of these analyses, higher-income districts included 57 school districts with a median family income higher than $78,000 and with a student enrollment greater than 500 students. These districts represented the top 25 percent of Massachusetts districts along the dimension of district wealth. 17 This finding used 30 districts with a median family income lower than $55,000 and with a student enrollment greater than 500 students. These districts were the lowest 30 districts in terms of district wealth.

14
Exhibit 5. Town-level variation in the percentage of special education students who were enrolled in private special education schools in 2012.
Identification rates and rates of inclusion with typically developing peers differed for otherwise similar communities. However, we identified the following trends that were, at least in part, associated with characteristics of the community. • The performance of a school district’s general education students on the MCAS
was, on average, the strongest district-level predictor of the MCAS performance of that district’s students with disabilities. Although we did find overall differences in the average scores for these two groups of students (with students with disabilities earning, on average, lower MCAS scores than general education students), we found that districts with higher-than-average rates of general education students scoring ‘Proficient’ or higher on the MCAS tended to have higher-than-average rates of special education students scoring ‘Proficient’ or higher, and vice versa. Essentially, districts that were doing well in preparing their general education students for the MCAS also appeared to be supporting MCAS achievement for their students with disabilities.
• The overall wealth of the community was the most common factor that explained cross-district variation. Among the systematic differences in special education practices that we found across Massachusetts districts, district-level wealth seemed to play an important role in a number of ways. All things being equal, rates of special
010
2030
4050
Num
ber o
f tow
ns
0% 5% 10% 15%Town percentage of special education students who were enrolled in private special education schools

15
education identification were higher in districts that enrolled more low-income students. This was particularly true when we looked at identification in the high incidence categories, where every doubling of district percentage of students receiving free or reduced price lunch (for example, from 5 percent to 10 percent) was associated with nearly a one percentage point difference in district percentage of students identified as having a specific learning disability, other health impairment, or communication impairment designation.
Although rates of special education identification were typically higher in districts with more low-income students, the opposite was true for the enrollment of special education students in private special education schools. Communities with a higher median family income, on average, placed students with disabilities in private special education schools at higher rates than less-wealthy communities. This difference is particularly important considering that communities that sent a larger percentage of their students with disabilities to private schools, on average, received a larger per-pupil reimbursement from the Circuit Breaker program in 2012.18
Discussion Massachusetts commits significant resources to the provision of special education, and it appears that most children are benefitting from this commitment. We can be proud of the fact that many students with disabilities are passing the MCAS and graduating from high school at higher than national rates. However, there is evidence that there may be over-identification of low-income students in the Commonwealth. Furthermore, though we can be pleased with our successes, there are still large numbers of students with disabilities who are not passing the MCAS or graduating from high school who do not have intellectual disabilities. When embarking on this study, we were told about the commonly held belief that the high rates of special education identification in Massachusetts were attributable to high-resource parents seeking to secure advantages for their children (for example, untimed or otherwise-accommodated standardized exams) that are only available to students eligible for special education. It is important to note that our analyses refuted this hypothesis. As described in Overarching Finding #1, we found little evidence that non-low-income communities were the source of Massachusetts’ high identification rates. In fact, we found that districts with more low-income students had higher rates of identification for special education. Given that our analyses showed the apparent benefits of inclusion, we are concerned that Massachusetts segregated students with disabilities at higher rates than most states. In particular, we are concerned that low-income, African American, and Latino students were disproportionately educated in separate settings. Considered together, these studies
18 For example, a district that placed 3% of their students with disabilities in private schools, on average, received approximately $493,000 in Circuit Breaker funds in 2012, while a similarly-sized town that placed 4% of its students with disabilities in private schools received, on average, almost $574,000.

16
demonstrate some disturbing disparities in treatment between low-income children and their more affluent peers. Low-income students were identified in very high numbers. This may indicate that the failure to meet the needs of some of these children resides in general education. Assigning disability labels to children who are not disabled runs the risk of lowering expectations and, through segregated placements, restricting access to the general education classroom. Moreover, low-income students were much less apt to be placed in private special education schools. Private special education schools serve important roles in providing special education in the Commonwealth and meet a number of needs. Some serve students with very complicated and low incidence disabilities that many school districts do not have the specialized capacity to serve well. Other private special education schools serve students who are involved with other agencies, particularly the Department of Children and Families, the Department of Youth Services, and the Department of Mental Health. These schools often wrap services around children and families with intense needs. Other private special education schools serve children whose parents allege their children have been denied ‘a free and appropriate public education’ (FAPE) within the public schools. If we assume that all these roles are important, as we do, then these programs should be equally accessible to parents regardless of means. This does not appear to be the case. Another concern evident in these studies is the marked variability between communities on important measures. In particular, our studies documented significant variability between towns on the degree to which children were included in general education. In examining out-of-district placements, we found that some communities sent out relatively large numbers of students with significant disabilities, while others did not. As mentioned before, some of these placements are appropriate, as individual towns may not be able to serve students with complex, low incidence needs. However, the practice may be problematic if children are inappropriately sent out of the district because the town is unwilling to provide services to children who could otherwise be served. Our research documents significant variability even among similar communities on this dimension. We interviewed a small number of parents whose children were in out-of-district placements because, in their view, the district was unwelcoming or failed to provide inclusive opportunities. Since we have published these reports, we have spoken with parents of children who have relatively common disabilities such as Down Syndrome or Cerebral Palsy who are being told by district personnel that their town does not serve that “type” of child. One parent informally shared that someone from the district said, “We don’t do inclusion.” Related to this issue, the Circuit Breaker program in Massachusetts seems to favor more affluent towns, particularly those that send more children to out-of-district placements. We believe the Circuit Breaker is an important source of relief for districts from the costs of education for students with complex needs; however, the distribution of this aid should not be associated with the affluence of the community, or with segregated programs. Currently it is.

17
Finally, the inadequacy of options at the high school level seems to be systemic and in need of attention. The rise in out-of-district placements at the middle school level is likely symptomatic of this bigger problem, as is the drop-out rate of students with disabilities. While the success of students with disabilities within CTE programs is a positive finding, we are not advocating that all students with disabilities belong in vocational programs. Rather, we believe that the high engagement of the situated learning found in many vocational programs is something that should be made available to more students across a variety of settings. Overall, the findings of our studies point to the need to develop more options at the secondary level in traditional public schools for all students with disabilities, and especially for students with emotional disturbance. Specifically, secondary programs that offer a high level of engagement, include students with disabilities with their non-disabled peers, and offer accommodations and supports for behavioral, social, and emotional needs are particularly needed.
Recommendations The State Education Agency Role and Accountability for Special Education in Massachusetts Under IDEA, State Education Agencies (SEAs) have the primary responsibility to provide students with disabilities the rights to a free and appropriate education in the least restrictive environment. The Massachusetts Department of Elementary and Secondary Education (DESE) has a long history of promoting the interests of students with disabilities since the passage of Chapter 766 in the early 1970s. It is our hope that these reports will provide guidance for future action based on the results of our research. We have provided detailed recommendations in each report. The following are three areas where our findings suggest DESE should take action. These areas are based on the findings from our reports as well as the responsibilities of the SEA outlined in the Individuals with Disabilities Education Act. Given the findings of our studies, the challenges Massachusetts faces in improving educational opportunity for students served by special education fall into three broad focus areas:
(1) Identification (Child Find): ensuring children with disabilities are properly identified;
(2) Placement in the Least Restrictive Environment (LRE): ensuring children are educated in inclusive environments as much as appropriate, and;
(3) Access: ensuring that children with disabilities have access to curriculum, programs, and schools that meet their needs.
To do this work effectively, DESE must rely on collaboration between the special education and general education offices. The question that emerges from these studies is: what is the appropriate role for DESE, and particularly for the department of special education in improving outcomes for students with disabilities in the Commonwealth?

18
Responsibility for closing the achievement gap between disabled and non-disabled students must be shared by the general and special education offices. General education plays a central role in providing high-quality supports and services for children; thus, placing accountability for closing this gap solely on special education is inappropriate. The work presented in these studies indicates that the quality of general education in a district is associated with outcomes for students with disabilities—where non-disabled students are performing better, students with disabilities are performing better as well. DESE, within both their special education and general education offices, should focus its efforts tightly on those aspects of law directly related to problems identified in these reports, specifically 1) Child Find, 2) Least Restrictive Environment, and 3) access.19 Below, we provide specific strategies for DESE, and we elaborate on how special education and general education can collaborate to address issues related to identification (Child Find) and placement (LRE) in the logic models for intervention (see Appendix B). (1) Identification (Child Find): Ensure that children with disabilities receive the special education services they need in a timely manner while safeguarding that children who are not disabled, but may be struggling in school, receive effective interventions and support within the general education classroom.
To address the issue of Child Find, the Commonwealth has an interest in ensuring that children who need special education receive these services, and safeguarding that children who do not have disabilities are not being inappropriately identified with disabilities. Although inappropriate identification is typically considered a special education concern, we believe it serves as an indicator that general education classrooms are not sufficiently supporting all students. Given the high identification rates of low-income students in the Commonwealth, we are concerned that special education referral serves to mask problems in the ability of general education to effectively educate students, particularly students from low-income backgrounds. Massachusetts should focus efforts on making sure that general education can sufficiently support students who may need additional interventions within the general education classroom. Powerful practices have proven effective in addressing inappropriate identification and have been implemented in many schools across the United States. Particularly promising approaches utilize multi-tiered systems of support to intervene early with students experiencing difficulty. DESE is already providing technical assistance to a small number of school districts utilizing these practices. DESE should provide technical assistance to increase the number of districts implementing multi-tiered systems of support. Additionally, DESE should require districts with high levels of over-representation of low-income students in special education to implement multi-tiered systems of support and to utilize IDEA funding to support its implementation.
19 The more specific recommendations presented within each report are directly related to these three areas. In Appendix C, we list the recommendations contained in each of the individual reports and detail how they align with these three focus areas.

19
(2) Least Restrictive Environment (Placement): Ensure that children with disabilities be educated in the most inclusive environment appropriate.
In the area of LRE, our study raises serious concerns about the degree to which segregation of students with disabilities occurs in the Commonwealth. Our studies documented that students who are included, on average, earn higher scores on the MCAS and are more likely to graduate than similar students who were segregated. Further, our vocational/technical study demonstrates that access to engaging high school options, such as regional career and technical education programs, corresponds with higher rates of on-time graduation for students with disabilities. Our findings show that school districts in Massachusetts differ widely in their ability to offer effective inclusive options for children with disabilities. The Commonwealth should support strong efforts toward ensuring that children are educated in the least restrictive environment and are placed in segregated settings only when it is clear that such a placement is appropriate. The evidence suggests that the lack of access to effective inclusive options for many students is likely a contributor to the lower levels of achievement and lower graduation rates among students with disabilities. To assist special education in this effort, we recommend that the State’s general education offices support and promote LEAs to implement Universal Design for Learning in general education classrooms. Further, the State should actively intervene in districts that fail to provide effective inclusive options for students with disabilities.
(3) Access: Ensure access to the curricula, programs, and schools that children with disabilities will need to succeed.
The lack of equitable access to effective inclusive options, particularly at the secondary level appears to be a major systemic issue in Massachusetts. The problems identified in our reports concerning access to high-quality secondary options appear to be statewide and therefore justify a statewide response. DESE should ensure that children with disabilities have equal access to schools and programs. Our vocational education study raises concerns that students with certain types of disabilities may not have equal access to these schools and programs. Though we did not research charter schools accessibility, access to these schools by students with disabilities is a widespread concern (Scott, 2012). Finally, though our work broadly supports inclusive placements for most children, it is important to note that some children may need out-of-district placements. Our work indicates that low-income students have unequal access to out-of-district programs. DESE should take steps to ensure that the availability of these programs is determined by students’ needs rather than students’ financial resources.

20
Policy Mechanisms Broadly speaking, DESE can utilize three policy mechanisms to address these focus areas: (1) capacity development, (2) recognition of school districts that are utilizing exemplary practices, and (3) targeted intervention in school districts that fail to meet their obligations to children and families.
(1) Capacity Development: Local Educational Agencies are primarily responsible for delivering education, and the State Educational Agency should support LEAs as they work to improve outcomes for students. Through technical assistance, DESE can build the capacity for LEAs to implement practices that have proven successful. The Commonwealth is already involved in significant capacity development through its IDEA and ESEA programs. Central among them is DESE’s efforts to assist school districts in implementing the Massachusetts Tiered System of Support (MTSS) and Universal Design for Learning (UDL). We recommend these efforts should be intensified and more tightly coordinated between special education and general education.
The findings presented in these reports are based primarily on data that are regularly collected by DESE. We therefore recommend that DESE employ analytic methods similar to those used to conduct these studies to target districts that might need state intervention and to recognize those that are having better results. Although there were meaningful differences across Massachusetts districts, we were able to identify some systematic variation in these differences between school districts. Particularly important data elements to consider are: • The identification rate of students from low-income backgrounds; • The rate of placement in substantially separate classrooms, particularly for students
who are African American, Latino, or low-income; • The rate of out-of-district placement; and • The academic performance of students with disabilities, including scores on MCAS
and the graduation rate (2) Recognition: In our work throughout the Commonwealth we have been impressed
with many of the exemplary practices we have observed in public schools, Chapter 766 private schools, Collaboratives, and regional vocational technical schools. The Commonwealth benefits from many talented educators who engage in cutting edge and effective practices. Too often, we inordinately focus our attention on poorly performing schools and neglect to recognize exemplary practice. For most of the issues identified in these reports, there are schools and districts that have implemented effective practices to solve them. We should not only recognize these educators but also inform other districts about their successful practices to help others improve.
(3) Targeted Interventions: At present, not every school district is either capable or willing to implement effective practices. Given Massachusetts’ ground-breaking history with Chapter 766, it was disconcerting that we encountered parents whose
21
school districts refused to even consider inclusion for their children or failed to provide the mandated services their children needed to succeed, such as access to technology. We believe DESE must forcefully intervene in districts that violate the rights of children and families. Few families have the resources to oppose their districts through the due process system. For too many families, this burden falls on them rather than the SEA. This should cease.
In summary, if DESE, with collaboration between special education and general education, focused its efforts and those of local special education directors on Child Find, promoting inclusive practice, and ensuring accessibility to effective general education, we believe that the children in the Commonwealth will have greater educational opportunity and achieve better outcomes.
Conclusion Massachusetts has a long and proud history as a leader in the education of students with disabilities. These efforts have borne clear results, as more and more children are experiencing unprecedented success in school. Though we have made great progress, more needs to be done to make the promise of effective education a reality for all students. We hope these reports will help policymakers, educators, and parents focus their efforts toward a brighter future for all children.
22
References Hehir, T., Dougherty, S. & Grindal, T. (2013). Students with Disabilities in
Massachusetts Career and Technical Education Programs. Retrieved from: http://www.doe.mass.edu/sped/hehir/
Hehir, T., Grindal, T. & Eidelman, H. (2012). Review of Special Education in the
Commonwealth of Massachusetts. Retrieved from: http://www.doe.mass.edu/sped/hehir/
Hehir, T., Grindal, T., Ng, M., Schifter, L., Eidelman, H. & Dougherty, S. (2013). Use of
Out-of-District Programs by Massachusetts Students with Disabilities. Retrieved from: http://www.doe.mass.edu/sped/hehir/.
Jones, S. M., & Bouffard, S. M. (2012). Social and emotional learning in schools: From
programs to strategies. Social Policy Report. 26(4). Society for Research in Child Development.
Massachusetts Department of Elementary and Secondary Education. (2013). Cohort 2012
Four-Year Graduation Rates – State Results. Retrieved from: http://www.doe.mass.edu/infoservices/reports/gradrates/2012-4yr.pdf.
National Center for Education Statistics. (2013). Percentage distribution of students 6 to
21 years old served under Individuals with Disabilities Education Act (IDEA), Part B, by educational environment and type of disability: Selected years, fall 1989 through fall 2011. Digest of Education Statistics, Table 204.60. Retrieved from: http://nces.ed.gov/programs/digest/d13/tables/dt13_204.60.asp.
Scott, G.A. (2012). Charter Schools: Additional Federal Attention Needed to Help
Protect Access for Students with Disabilities. U.S. Government Accountability Office, Highlights of GAO 12-543 (a report to congressional requesters). Retrieved from: http://www.gao.gov/products/GAO-12-543.
Schifter, L.A. (2014). When Do Students with Disabilities Graduate High School? Using
Survival Analysis to Understand Graduation of Students with Disabilities. Research Brief for the Massachusetts Department of Elementary and Secondary Education. Available from http://www.doe.mass.edu/research/reports/2014/06edlines-graduationswd.pdf

23
Sugai, G., Horner, R. H., Dunlap, G., Hieneman, M., Lewis, T.J., Nelson, C. M., Scott, T., Liaupsin, C., Sailor, W., Turnbull, A.P., Turnbull, H.R., Wickham, D., Wilcox, B. & Ruef, M. (2000). Applying positive behavior supports and functional behavior assessment in schools. Journal of Positive Behavior Interventions, 2(3), 131-144.
U.S. Department of Education, (2012). Regulatory Adjusted Cohort Graduation Rate,
Children with Disabilities: 2011-12. Ed Data Express, EDFacts/Consolidated State Performance Report, 2011-12. Retrieved from: http://www2.ed.gov/admins/lead/account/consolidated/index.html.
24
Appendix A: Definitions Low-income student: Refers to students who are eligible for free or reduced price lunch. High incidence disability: Refers to the combined group of children who are identified as having a specific learning disability, communication impairment, or other health impairment.20 Low incidence disability: Refers to the combined group of students with neurological impairments, multiple disabilities, physical disabilities, and sensory impairments. Out-of-district placement: Refers to an educational placement in either a private special education school or a special education collaborative program. For more detailed information on Massachusetts private special education schools see: maaps.org. For more detailed information on Massachusetts special education collaborative programs see: moecnet.org. Educational placement: Based on terms used by the U.S. Department of Education for reporting the Least Restrictive Environment, educational placements for students with disabilities are identified as follows:
Full Inclusion: Placements where students spend 80 percent or more of the day in classrooms with their non-disabled peers.
Partial Inclusion: Placements where students spend 40-79 percent of the day in classrooms with their non-disabled peers.
Substantially Separate: Placements where students spend less than 40 percent of the day in classrooms with their non-disabled peers.
Career and Technical Education Programs: There are four types of Career and Technical Education Programs in the Commonwealth:
Regional Vocational and Technical Schools: In this category we combined two broad types of schools. The first broad group is regional vocational and technical schools, where the entire student body participates in some form of CTE and where students are drawn from several surrounding communities. The second broad group included in this category was county and statewide agricultural schools, which look very much like the regional vocational and technical schools, but with a greater focus on agriculture, horticulture, and environmental science. Altogether, 29 schools were included in this category.
20 Nearly two out of every three Massachusetts students with a disability were identified as belonging in one of these three categories, and due to the potentially subjective nature of their diagnosis, we saw evidence throughout the commonwealth that indicated that children with similar profiles may have fallen differentially into one of these three categories, depending on the designation conventions of different school districts.

25
City Vocational and Technical Schools: There were five city vocational and technical schools in the Commonwealth of Massachusetts. As with their regional counterparts, all students in these schools participated in some form of CTE. However, the students here originated solely from the specific city in which the given school was located, rather than drawing from several municipalities. These schools existed in five major cities in the Commonwealth: Boston, Holyoke, Lynn, Springfield, and Worcester.
Circuit Breaker: A fund established by the Commonwealth to reimburse districts for higher costs associated with educating students with significant needs. For more information on the circuit breaker, please visit: http://children.massbudget.org/special-education-circuit-breaker.

26
Appendix B: Logic Models for Department of Elementary and Secondary Education Interventions for Identification and Placement In the logic models on the following pages, we offer specific recommendations on how DESE might target district interventions related to Child Find (identification) and Least Restrictive Environment (placement) in the Commonwealth. In the first column, we note the agency responsible for leading the activities listed in the following column. The outcomes column describes the anticipated short-term outcomes resulting from effective implementation of the activities. Finally, in the impact column, we describe the anticipated long-term effects from implementing the activities.

27

28

29
Appendix C: Table of Recommendations from the Three Special Education Reports Written by Thomas Hehir & Associates, Organized by the Three Focus Areas for Intervention Full reports can be found at: http://www.doe.mass.edu/sped/hehir/
Identification (Child Find)
Least Restrictive Environment (Placement) Access
Report 1: Intervene in districts that evidence highly disproportionate levels of enrollment of low-income students in special education (pp. 13-14, 20-21, 33)
Report 1: Monitor and intervene in districts in which there is inordinate use of substantially separate settings for students with disabilities (pp. 25-28, 33)
Report 1: Interventions in districts should focus on requiring better practices in general education (pp. 33-35)
Report 1: Promote adoption of a Response to Intervention (RTI) model in kindergarten through grade three to promote early literacy development (pp. 34-35)
Report 1 and 3: Promote the adoption of principles of Universal Design for Learning (pp. 34-35)
Report 2: Identify high performing vocational schools that have been successful in educating diverse populations of students with disabilities (pp. 11-13)
Report 1: Encourage school districts that identify large numbers of students with disabilities to examine their practices for special education determination (pp. 12-15, 35)
Report 1 and 3: Promote universally designed behavior supports and improve general education approaches to discipline and behavior (Report 1 pp. 34-35; Report 3 pp. 50-53)
Report 2: Ensure equal access to vocational education (pp. 7, 13-14)
Report 3: Work with the Legislature to restructure the Circuit Breaker to directly support the expenses related to children with complex needs (pp. 43-46, 55)
Report 2: Consider expanding the capacity for providing high quality vocational education in areas where there is high demand (pp. 11-14)
Report 3: Improve high school options for students with disabilities (pp. 25-28, 50-53)
Report 3: Establish a stronger system to promote interagency coordination and to resolve interagency disputes (pp. 35-39, 53-54)
Report 3: Create increased opportunities for private schools and public schools to collaborate to support students in a more fluid manner (pp. 40-41, 54-55)

30
Appendix D: Narrative Summary of Recommendations from the Three Special Education Reports Written by Thomas Hehir & Associates, Organized by the Three Focus Areas for Intervention Below, we describe the recommendations from our previous reports and how they align with the three focus areas from the synthesis report. The full text of all three reports can be found at: http://www.doe.mass.edu/sped/hehir/.
Identification (Child Find) Ensure children with disabilities are appropriately identified
From Report 1:
• The Department of Elementary and Secondary Education should intervene in districts that evidence highly disproportionate levels of enrollment of low-income students in special education. In Massachusetts, the numbers of low-income students being served in high incidence categories exceed what most experts would consider appropriate. The student-level data used in these reports were all supplied by the state and thus can be used to target school districts that are most in need of intervention.
• The Department of Elementary and Secondary Education should promote adoption of a Response to Intervention (RTI) model in kindergarten through grade three to promote early literacy development. Response to intervention, when implemented with fidelity, has strong research support as a vehicle to improve early reading development for struggling readers and as improved means to identify students who may have a more intractable reading disability such as dyslexia. A more focused effort on early reading such as RTI might be helpful in promoting better literacy overall and in reducing inappropriate referrals to special education.
• The Department of Elementary and Secondary Education should encourage school districts that identify large numbers of students with disabilities to examine their practices for special education determination. Special education is expensive, and budgets are tight in many districts. Using special education funding to serve students who are inappropriately identified is problematic and needs to be examined in districts serving large numbers of students in special education.
Least Restrictive Environment (Placement)
Ensuring children are educated in inclusive environments as much as appropriate
From Report 1: • The Department of Elementary and Secondary Education should monitor
and intervene in districts in which there is inordinate use of substantially separate settings for students with disabilities. Although ensuring access to the

31
curriculum should be the over-riding concern when making placement decisions about an individual student with a disability, those students with full inclusion placements consistently earn higher scores on the MCAS and graduate at higher rates. Given that there is such variability between districts in the state concerning placement, the Department of Elementary and Secondary Education should intervene in districts that continue to educate higher than average numbers of students in substantially separate settings.
From Report 1 and 3: • The Department of Elementary and Secondary Education should promote
the adoption of principles of Universal Design for Learning. Powerful instructional practices have developed that allow students with disabilities as well as other students with diverse instructional needs to prosper in general education environments. The inclusion of students with disabilities in general education goes beyond simply allowing children to enroll in a school; rather, inclusion often requires the mainstream to adapt. Massachusetts has many examples of successful inclusion, and a strong body of research exists that can help educators in implementing stronger practice through Universal Design for Learning.21 The Commonwealth may need to take an assertive role with some districts and tie these efforts to its obligation to monitor the implementation of IDEA.
• The Department of Elementary and Secondary Education should promote universally designed behavior supports. Programs such as Positive Behavior Intervention Supports (Sugai et al., 2000) have been shown to improve student behavior in schools and to reduce suspensions, while allowing schools to focus support on those students most in need. Allowing students to stay engaged in school is central to improving performance for many students who struggle.
• The Department of Elementary and Secondary Education should improve general education approaches to discipline and behavior. Our study documents that the most frequently cited reason given by special education directors for out-of-district placements was behavior and safety. Research has shown that in order for schools to effectively support children with behavioral issues, whole school approaches work best.22
21 For more information about Universal Design for Learning see http://www.cast.org/. 22 See Sugai, Horner, Dunlap, Hieneman, Lewis, Nelson, Scott, Liaupsin, Salir, Turnbull, Wickham, Wilcox, & Ruef (2000), Jones & Bouffard (2013), and the National Center on Universal Design for Learning: http://www.udlcenter.org/

32
From Report 3: • The Department of Elementary and Secondary Education should work with
the Legislature to restructure the Circuit Breaker to directly support the expenses related to children with complex needs. The Circuit Breaker is an important program that should be preserved but reformed. Our analyses indicate that the Circuit Breaker benefits school districts that send more children to out-of-district placements, and districts receiving the greatest aid from this fund tend to be more affluent districts. DESE, in collaboration with stakeholders, should develop a proposal for the Legislature to revise the program. The proposal should seek to provide more equitable support to districts and to support students in all types of educational placements rather than favoring out-of-district placements.
Access
Ensuring that children with disabilities have access to curriculum, programs, and schools that meet their needs
From Report 1: • Interventions in districts should focus on requiring better practices in
general education. Powerful practices, mentioned above, that have proven effective in addressing the issues contained in these reports have been developed by researchers and implemented in many schools across the United States. DESE should support implementation of these practices and prioritize the needs of students who are eligible for services under both IDEA and Title I of the Elementary and Secondary Education Act.
From Report 2:
• The Department of Elementary and Secondary Education should identify high performing vocational schools that have been successful in educating diverse populations of students with disabilities to serve as models for others.
• The Department of Elementary and Secondary Education should ensure equal access to vocational education. The wide disparities in enrollment of students with disabilities between Regional Vocational Technical Schools (RVTS) and the relatively low participation of students with low incidence disabilities across CTE schools raise questions concerning access. The Department of Elementary and Secondary Education should monitor enrollment in these schools to ensure equal access for students with disabilities.
• The Department of Elementary and Secondary Education should consider expanding the capacity for providing high quality vocational education in areas where there is high demand.
From Report 3: • The Department of Elementary and Secondary Education should improve
inclusive high school options for students with disabilities. The problems identified here concerning access to high quality secondary options seem to be statewide and therefore justify a statewide response. The goal of this activity
33
should be to identify successful approaches and encourage the development of more effective options where they are lacking. The state could launch an initiative to identify high schools in the state that have demonstrated effectiveness in serving students with disabilities. This could take the form of a competitive grant program using federal discretionary funds and should include a strong dissemination component.
• Massachusetts should establish a stronger system to promote interagency coordination and to resolve interagency disputes. The complex needs of many children and their families extend beyond education and include the provision of mental and physical health services and ongoing in-home family support services. We recommend that the state develop clear interagency agreements with the major providers of children’s services: the Department of Mental Health, the Department of Developmental Services, Office for Disabilities, Office for Children and Families and Youth Services, and the Department of Children and Families. These agreements should be made widely available to school districts, service providers, and families.
• The Department of Elementary and Secondary Education should create
increased opportunities for private schools and public schools to collaborate to help support students in a more fluid manner. Currently most students with disabilities placed in out-of-district private special education schools are served in separate programs. The state should promote more fluid relationships between private providers and school districts that enable students who may have been in private schools to continue to be supported in less restrictive options back in their home districts. Furthermore, some private special education schools have expertise that could benefit districts as they build programs that may prevent the need for students to be placed out-of-district in more restrictive programs. In approving private schools, the Commonwealth should consider the degree to which private schools work collaboratively with school districts as part of the approval process.