a survey of the uk benefit system - ifs · pdf filea survey of the uk benefit system . updated...
TRANSCRIPT

A survey of the UK benefit system
IFS Briefing Note BN13 Andrew Hood
Agnes Norris Keiller

© Institute for Fiscal Studies, 2016
1
A Survey of the UK Benefit System
Updated by Andrew Hood and Agnes Norris Keiller November 2016
Institute for Fiscal Studies
Acknowledgements
This briefing note is a revision of earlier versions by James Browne, Claire Crawford, Carl Emmerson, Michelle Jin, Greg Kaplan, Andrew Leicester, Peter Levell, Richard May, Cormac O’Dea, Laura Oakley, David Phillips, Jonathan Shaw, Luke Sibieta and Alexei Vink. A version by the original authors, Carl Emmerson and Andrew Leicester, can be downloaded from http://www.ifs.org.uk/bns/benefitsurvey01.pdf. The paper was funded by the ESRC Centre for the Microeconomic Analysis of Public Policy at IFS (grant ES/M010147/1). The authors would like to thank Stuart Adam and Robert Joyce for their help and advice during revision of this briefing note. The paper has been copy-edited by Judith Payne. All remaining errors are the responsibility of the authors.
*Address for correspondence: [email protected]

© Institute for Fiscal Studies, 2016
2
Contents
1. Introduction ................................................................................................. 3
2. The benefit system: an overview .................................................................. 4
2.1 Administration of the benefit system .................................................................. 4
2.2 Immigration and residence rules ......................................................................... 6
2.3 The uprating of benefits and tax credits .............................................................. 7
2.4 The benefit cap .................................................................................................... 8
2.5 The welfare cap .................................................................................................... 9
3. Government spending on social security benefits ........................................ 11
4. A description of the current benefit system ................................................. 14
4.1 Personal tax credits ............................................................................................ 14
4.2 Benefits for families with children ..................................................................... 19
4.3 Benefits for unemployed people ....................................................................... 25
4.4 Benefits for people on low incomes .................................................................. 30
4.5 Benefits for older people ................................................................................... 40
4.6 Benefits for sick and disabled people ................................................................ 55
4.7 Benefits for bereaved people ............................................................................ 70
4.8 Benefits available only to existing claimants ..................................................... 75
5. Upcoming reforms to social security spending ............................................. 82
5.1 Universal credit .................................................................................................. 82
5.2 Benefits freeze ................................................................................................... 86
5.3 Changes to employment and support allowance .............................................. 86
5.4 Cuts to tax credits .............................................................................................. 86
5.5 Bereavement benefits ........................................................................................ 87
5.6 Tax-free childcare ............................................................................................... 87
6. Conclusions ................................................................................................. 88
Appendix A. GB benefit expenditure from 1948–49 to 2015–16 ............................ 89
Appendix B. War pensions and AFCS .................................................................... 90

© Institute for Fiscal Studies, 2016
3
1. Introduction
This briefing note provides a survey of the benefit system in Great Britain.1 We begin in Section 2 with an overview of the current system, while in Section 3 we present total expenditure on social security and the cost of individual benefits. In Section 4, we look closely at the present system, examining personal tax credits and each benefit in turn. Benefits are arranged into six broad categories based on the primary recipients: families with children, unemployed people, those on low incomes, older people, sick and disabled people, and bereaved people. We also discuss benefits that are now only available to existing claimants. Current benefit rates are for the financial year 2016–17, expenditure figures are out-turns (where possible) or estimates for the financial year 2015–16, and claimant data are the average number of claimants throughout 2015–16, unless otherwise noted. Whenever possible, expenditure and claimant figures relate to Great Britain. Section 5 provides a brief discussion of upcoming reforms to the social security system, in particular the introduction of universal credit. Section 6 concludes.
Further details on benefit eligibility and information about relevant legal issues can be found in the Child Poverty Action Group’s Welfare Benefits and Tax Credits Handbook 2016/2017.2 Current benefit rates, numbers of claimants and expenditure figures are given in the Department for Work and Pensions (DWP)’s Annual Reports, Benefit Expenditure and Caseload Tables, and annual press release detailing new benefit rates.3 In addition, much of the information contained herein can be found on the DWP website, https://www.gov.uk/government/organisations/department-for-work-pensions.
1 The benefit system in Northern Ireland is managed by the Department for Social Development of Northern Ireland (DSDNI), which did not provide sufficiently timely data for Northern Ireland to be included in this briefing note. 2 Hereafter referred to as CPAG 2016/17. 3 Department for Work and Pensions, ‘Benefit expenditure and caseload tables 2016’, https://www.gov.uk/government/publications/benefit-expenditure-and-caseload-tables-2016. Department for Work and Pensions, ‘Benefit and pension rates’, April 2016, https://www.gov.uk/government/uploads/system/uploads/attachment_data/file/524117/benefit-and-pension-rates-from-6-april-2016.pdf.

© Institute for Fiscal Studies, 2016
4
2. The benefit system: an overview
In 2015–16, over £200 billion was spent on the welfare system in Great Britain, making it the largest single area of government spending.4 The system consists of many separate benefits, which can be broadly categorised according to general eligibility criteria. For means-tested benefits such as income support, receipt of the benefit usually depends on the claimant’s family income, together with their family circumstances and personal characteristics. For contributory benefits, such as contributory jobseeker’s allowance, eligibility usually depends on the claimant having paid sufficient National Insurance contributions (NICs) during their lifetime. NICs are made by employees whose earnings are above a threshold (£155 per week in 2016–17), although the government usually treats those earning between the lower earnings limit (LEL, £112 in 2016–17) and £155 per week as though they were making contributions.5 Some benefits, such as disability living allowance, are neither contributory nor means-tested and are universally available to all people who meet some qualification criteria.
2.1 Administration of the benefit system
The many elements of the benefit system are currently administered by several different organisations. The Department for Work and Pensions (DWP) is responsible for most means-tested benefits, local authorities manage housing benefit and council tax reduction schemes and HM Revenue and Customs (HMRC) administers child benefit, guardian’s allowance and the tax credit system.
DWP runs several services, including Jobcentre Plus and the Child Maintenance Service, which are the primary point of contact for benefit applicants. Potential claimants contact these service providers to apply for particular benefits and are required to provide any evidence that is necessary to assess the eligibility of their claim, such as information about their current income. When a claimant is approved, it is then their responsibility to report any changes in circumstance that may affect their entitlement to the service provider and benefit payments are adjusted accordingly.
Housing benefit and council tax reduction schemes are administered by local authorities in a similar manner. Individuals can directly contact their local authority to apply for these benefits, although they can also make a combined application when making benefit claims through a Jobcentre Plus or applying for pension credit from the Pension Service. Again, it is the claimant’s responsibility to report any
4 Source: HM Treasury, ‘Public Spending Statistics release: July 2016’, https://www.gov.uk/government/statistics/public-spending-statistics-release-july-2016.
5 For more about the National Insurance system, see T. Pope and T. Waters, ‘A survey of the UK tax system’, IFS Briefing Note BN9, 2016, https://www.ifs.org.uk/publications/1711.

© Institute for Fiscal Studies, 2016
5
changes in circumstance, and payments are adjusted in response to any change in entitlement.6
HMRC follows a different process when calculating and reviewing child and working tax credit entitlement. Applicants make a claim directly to HMRC, which then calculates an initial annual award based on income from the previous tax year, which is paid to the claimant in monthly instalments. Claimants are required to report changes in certain circumstances throughout the year and monthly payments are adjusted to account for any resultant changes in entitlement. However, other changes in circumstance that may affect a claimant’s maximum entitlement are only reported on a voluntary basis. At the end of the financial year, claimants are then required to verify their circumstances to ensure they have received the correct amount of tax credits over the just-completed year.7
The tax credit system has suffered a significant problem of overpayment and has faced difficulties reclaiming the amounts overpaid. Overpayment of tax credits is more likely than overpayment in the other administration systems because payments are based on an estimated annual entitlement and it is not compulsory to report all changes that may affect a claimant’s maximum entitlement throughout the year. This means that a claimant’s actual entitlement is not finalised until the end of the tax year and the accumulation of mispayments over an entire year can result in large differences between initial and final entitlements. Although the scale of this problem has been reduced since the first two years of operation of child tax credit and working tax credit, an estimated £1.37 billion of personal tax credits was overpaid in 2014–15.8
Since January 2013, child benefit has been withdrawn through an income tax charge from families where one parent’s taxable income is above £50,000 and the benefit is therefore subject to the same entitlement determination process as tax credits. The administration of guardian’s allowance is more straightforward as it is not subject to a means test and therefore entitlement can be determined by the claimant’s current circumstances.
Personal tax credits and housing benefit are being replaced by universal credit, which should improve the efficiency of benefit administration. Universal credit will
6 See ‘Housing benefit claims processing guide’, https://www.gov.uk/government/uploads/system/uploads/attachment_data/file/251256/hb-claims-processing-guidance.pdf.
7 More information on personal tax credits is provided in Section 4.1. See also M. Brewer, ‘Tax credits: fixed or beyond repair?’, in R. Chote, C. Emmerson, R. Harrison and D. Miles (eds), The IFS Green Budget: January 2006, https://www.ifs.org.uk/budgets/gb2006/06chap7.pdf.
8 Source: HMRC, Annual Report and Accounts 2015-16, 2016, https://www.gov.uk/government/uploads/system/uploads/attachment_data/file/539608/HMRC_Annual_Report_and_Accounts_2015-16-web.pdf.

© Institute for Fiscal Studies, 2016
6
be managed by DWP and consist of a monthly payment based on income in the previous month, which the government intends to monitor using HMRC’s proposed real-time PAYE system.9
2.2 Immigration and residence rules
The rules on residence (having your home) and presence (being physically present) in Great Britain vary between different benefits and tax credits.10 Entitlement to social security depends on how long applicants have been in Great Britain, their nationality, their immigration status and whether they are covered by provisions of European law.11
The majority of benefits and tax credits have residency conditions. Contributory benefits, such as contribution-based jobseeker’s allowance (JSA), contributory employment and support allowance (ESA) and state pension, only have presence requirements. With the exception of Category D retirement pension, all retirement pensions are payable without time limit while the claimant is abroad. However, if the claimant is no longer ordinarily resident in Great Britain, they will only have their pension uprated each year if they have gone to another European Economic Area (EEA) state or a country that has a social security agreement with the UK.12 There are no residence or presence conditions for statutory sick, maternity, paternity or adoption pay.
EU law (or sometimes reciprocal agreements with other states) may affect benefit and tax credit entitlement. For instance, if an individual or a member of their family is an EEA national, EU law may give them a right of residence that enables them to satisfy residence requirements. Changes introduced in 2014 mean EEA jobseekers are unable to access JSA until they have been resident in the UK for three months and can only claim for a total of 91 days, although this may be split across several periods of jobseeking.
By and large, people ‘subject to immigration control’ (i.e. people who require leave to enter or to remain in the UK but who do not have it) are unable to claim benefits. This includes people who are not EEA nationals and do not have a ‘right to reside’ under EU law. A person subject to immigration control was previously able to claim contributory benefits (if they have paid sufficient NICs) as well as statutory benefits
9 More information on universal credit is provided in Section 5.1. See also M. Brewer, J. Browne and W. Jin, ‘Universal credit: a preliminary analysis’, IFS Briefing Note BN116, 2011, https://www.ifs.org.uk/bns/bn116.pdf.
10 Part 11 of CPAG 2016/17 provides a detailed explanation of immigration and residence rules in general and for specific benefits and tax credits.
11 There is a reciprocal agreement between Great Britain and Northern Ireland such that, in general, individuals can satisfy residence conditions if they move between Great Britain and Northern Ireland.
12 A list of these countries is provided at https://www.gov.uk/government/publications/state-pensions-annual-increases-if-you-live-abroad/countries-where-we-pay-an-annual-increase-in-the-state-pension.

© Institute for Fiscal Studies, 2016
7
based on previous employment, but since April 2013 entitlement to work in the UK has become a requirement for receiving these benefits.13
As the UK was a signatory to the 1951 UN Convention on the Status of Refugees, refugees in the UK have the right to claim certain benefits, such as income support (IS). However, the Asylum and Immigration Act 1999 removed asylum seekers from mainstream benefit payments and they now have payments administered by the National Asylum Support Service.
2.3 The uprating of benefits and tax credits
Benefits and tax credits are usually uprated at the start of every financial year in line with prices. From 2011–12, almost all benefits, tax credits and public service pensions have been indexed to the consumer prices index (CPI). The CPI tends to increase more slowly than both the retail prices index (RPI) – which previously uprated universal benefits – and the Rossi index (RPI without housing costs), which uprated means-tested benefits. This change to indexation rules saved an estimated £4.26 billion in 2015–16.14 The government has claimed that the CPI better reflects the inflation experience of benefit recipients.15
An important exception to the CPI-uprating of benefits is the ‘triple-lock’ guarantee for the state pension: since 2012–13, it has been increased by the highest of earnings growth, CPI price inflation and 2.5%. Thus, for 2016–17, the state pension increased by earnings growth (2.9%) – the highest of these benchmarks. By default, pension credit rates are uprated in line with earnings growth, but in recent years they have seen the same cash increase as the basic state pension, which has been more generous than earnings indexation.16 The ‘triple-lock’ guarantee will also apply to the new single-tier pension, which is paid to individuals reaching the state pension age from April 2016 onwards, until at least 2020.
In contrast to the uprating of pensioner benefits, benefits and tax credits for working-age people have been subject to less generous indexation. Between 2013–14 and 2015–16, the majority of benefits and tax credits for working-age people were increased by 1% whereas CPI indexation would have led to increases of 2.2%,
13 Source: S. Kennedy, ‘People from abroad: what benefits can they claim?’, House of Commons Library Briefing Paper 06847, 2015, http://researchbriefings.parliament.uk/ResearchBriefing/Summary/SN06847.
14 Source: Table 2.3 of A. Hood and D. Phillips, ‘Benefit spending and reforms: the coalition government’s record’, IFS Briefing Note BN160, 2015, https://www.ifs.org.uk/uploads/publications/bns/BN160.pdf.
15 For discussion of this claim, see T. Crossley, A. Leicester and P. Levell, ‘A tale of 3 indices: further thoughts on benefit indexation’, IFS Observation, October 2010, http://www.ifs.org.uk/publications/5301. 16 To be precise, the minimum guarantee for single pensioners has been increased by the same cash amount as the basic state pension, with the minimum guarantee for couples increasing by the same proportion as that for single pensioners (a larger cash amount).

© Institute for Fiscal Studies, 2016
8
2.7% and 1.2% in each of the three years.17 From April 2016, working-age benefits will be frozen in cash terms until April 2020. According to recent inflation forecasts, this corresponds to a real cut of 6% and will achieve an estimated £4.2 billion reduction in government spending in 2019–20.18 Benefits related to the extra costs of disability and statutory payments are not subject to the freeze.19
2.4 The benefit cap
Since April 2013, a benefit cap has been in force in an attempt to ensure that no family receives more on benefits than the average net earnings of a family in work. The benefit cap only applies to families claiming housing benefit (HB) or universal credit (UC) in which no one works enough hours to qualify for working tax credit. If the family’s total weekly income from ‘specified benefits’ included in the cap exceeds their cap level, their HB or UC payments are reduced to bring them down to the cap. The list of ‘specified benefits’ includes IS, JSA, ESA (if neither they nor their partner are in the support group) and HB (except for ‘exempt accommodation’).20 However, it is currently possible for some claimants to receive more than the cap – for instance, if their HB has been reduced down to the minimum payment of 50p per week. Further, households in receipt of certain benefits, such as personal independence payment or disability living allowance, are exempt from the cap.21
For claimants who receive HB, unless there is an exception, the total amount of certain specified benefits they can receive was originally limited to £350 a week for childless single claimants or £500 a week for lone parents and members of couples, regardless of where the claimant resided. In November 2016, these limits were reduced and separate limits were introduced for claimants living inside and outside Greater London. The limit for childless single claimants living outside (inside) London is now £257.69 (£296.35), while the limit for all other claimants living outside (inside) London is £384.62 (£442.31). Alongside the reduction in the benefit cap, carer’s allowance and guardian’s allowance were added to the list of benefits that exempt a claimant from the cap.
17 Disability benefits and the disability elements of other benefits and tax credits continued to be uprated by the CPI. For more details, see A. Hood, P. Johnson and R. Joyce, ‘The effects of the Welfare Benefits Up-rating Bill’, IFS Observation, January 2013, http://www.ifs.org.uk/publications/6539.
18 Source: C. Emmerson, A. Hood and T. Waters, ‘Falling sterling, rising prices and the benefits freeze’, IFS Observation, 18 October 2016, https://www.ifs.org.uk/publications/8699.
19 The benefits not subject to the freeze are maternity allowance, statutory sick pay, statutory maternity pay, statutory paternity pay, statutory shared parental pay, statutory adoption pay, the employment and support allowance support group component, any disability, carers’ or pensioners’ elements of benefits, and other disability, carers’ and pensioners’ benefits, including personal independence payment and disability living allowance. These will increase in line with either the CPI or earnings, depending on the specific benefit.
20 For more details about the specified benefits limited by the benefit cap, as well as various exceptions, see pages 1162–7 of CPAG 2016/17, or https://www.gov.uk/benefit-cap.
21 See page 1164 of CPAG 2016/17 for more information about the benefit cap with UC.

© Institute for Fiscal Studies, 2016
9
Before these changes, the benefit cap affected approximately 20,000 households of which 42% lived in London. This is because rents in London are considerably higher than in other parts of the country and therefore households were more likely to receive housing benefit high enough to exceed the benefit cap. Ignoring behavioural responses, the changes are expected to increase the number of households affected by the cap to 88,000 and lead to a more even spread of affected households across the country.22
2.5 The welfare cap
In March 2014, the government introduced a cap on social security spending.23 The cap is set by the Treasury for a five-year period and limits forecast spending on certain components of social security spending.24 Spending on the state pension – the largest component of the social security bill – is not included in the cap as it is argued that pensions spending should be controlled using more long-term measures.25 The most cyclical elements of spending (JSA and associated HB spending) are also excluded.
At each Autumn Statement, the Treasury must report whether the latest welfare spending forecasts lie within the cap. The cap is breached if forecast spending exceeds the cap, although a ‘forecast margin’ allows spending to exceed the cap by up to 2% if the excess spending is due to changes to forecasts rather than changes in policy. When the cap is breached, the government must either propose policy measures to reduce welfare spending, seek approval for the cap to be increased or explain why failure to honour the cap is justified. Since these measures increase the political repercussions of failing to meet welfare spending targets, it was hoped that the cap would increase incentives for government to control welfare spending.
Table 2.1. OBR assessment of welfare spending in cap at Budget 2016
£ billion 2016–17 2017–18 2018–19 2019–20 2020-21
Welfare cap 115.2 114.6 114.0 113.5 114.9 Forecast margin (2%) 2.3 2.3 2.3 2.3 2.3 Forecast spending 119.8 118.0 116.4 116.2 118.1 Source: Table 5.3 of Office for Budget Responsibility, Economic and Fiscal Outlook: March 2016, http://budgetresponsibility.org.uk/efo/economic-fiscal-outlook-march-2016/.
22 Source: A. Hood and R. Joyce, ‘A tighter benefit cap’, IFS Observation, 6 November 2016, https://www.ifs.org.uk/publications/8717.
23 See https://www.gov.uk/government/speeches/chancellor-george-osbornes-budget-2014-speech.
24 For a full list of benefits and tax credits included in the welfare cap, see C. Rhodes, ‘The welfare cap’, House of Commons Library Briefing Paper 06852, 2016, http://researchbriefings.parliament.uk/ResearchBriefing/Summary/SN06852.
25 See https://www.gov.uk/government/speeches/chancellor-george-osbornes-autumn-statement-2013-speech.

© Institute for Fiscal Studies, 2016
10
Table 2.1 presents the latest welfare cap limits and spending forecasts and shows that the government is set to breach the cap in each of the next five years. The extent to which the welfare cap has been effective in controlling spending on benefits is therefore clearly in doubt.

© Institute for Fiscal Studies, 2016
11
3. Government spending on social security benefits
It is estimated that, in 2015–16, over £211 billion was spent on social security benefits in Great Britain (henceforth GB).26 This amounts to approximately £3,346 for every man, woman and child in the country, or 11% of GDP. At 28%, expenditure on social security represents by far the largest single area of government spending.27
Table 3.1 presents a breakdown of estimated expenditure for each benefit and an average claimant count for 2015–16, organised into the following categories: personal tax credits, and benefits for families with children, unemployed people, those on low incomes, older people, sick and disabled people, and bereaved people. This breakdown should be treated with caution as the categories correspond to the primary recipient of a given benefit, rather than capturing all of the expenditure on a given group. For example, while spending on benefits targeted specifically at the unemployed is only 1.11% of total social security spending, a large share of spending on items such as housing benefit also goes to support unemployed individuals.
Retirement pensions are the most expensive benefit, accounting for about 42% of total expenditure. The ‘top six’ benefits – retirement pensions, housing benefit, child tax credit, employment and support allowance, disability living allowance and child benefit – together make up over 80% of total expenditure.
Note that although most of the figures in Table 3.1 relate to Great Britain, figures for war pensions and some smaller benefits are only available on a UK basis. However, since total Northern Ireland benefit expenditure is only around £5.8 billion, figures for Great Britain would not be significantly different for these benefits.28
26 Some spending data are on a UK basis because those for GB are not available, as explained in the notes below Table 3.1. Appendix A provides details of government spending on social security from 1948–49 to 2015–16. 27 Source: Great Britain population estimate from https://www.ons.gov.uk/peoplepopulationandcommunity/populationandmigration/populationestimates/bulletins/annualmidyearpopulationestimates/mid2015; GDP from https://www.gov.uk/government/statistics/gdp-deflators-at-market-prices-and-money-gdp-june-2016-quarterly-national-accounts. The quoted 11% is calculated based on an estimate of GB GDP. The quoted 28% is calculated based on total managed expenditure for 2015–16 from table 5.4 of HM Treasury, ‘Public Spending Statistics release: July 2016’, https://www.gov.uk/government/statistics/public-spending-statistics-release-july-2016. 28 Department for Work and Pensions, ‘Benefit expenditure and caseload tables 2016’, https://www.gov.uk/government/publications/benefit-expenditure-and-caseload-tables-2016.

© Institute for Fiscal Studies, 2016
12
Table 3.1. GB expenditure and claimant figures for all benefits and tax credits, 2015–16
Expenditure (£m)a % of total expenditure
Claimantsb
Personal tax credits Child tax credit 21,733c,d 10.27% 3,864,000e,f,g
Working tax credit 5,908c,d 2.79% 2,374,200e,g Total personal tax credits 27,642 13.06% 4,400,800h
Benefits for families with children Child benefit (including former one-parent benefit) 11,281i 5.33% 7,153,935j
Guardian’s allowance 2i 0.00% Not available Statutory maternity, paternity, shared parental & adoption pay 2,449 1.16% 269,000k
Maternity allowance 443 0.21% 63,000 Sure Start maternity grant 30l 0.01% 59,400l
Total benefits for families with children 14,205 6.71% Benefits for unemployed people
Income-based jobseeker’s allowance 2,024 0.96% 692,000m Contribution-based jobseeker’s allowance 306 0.14% New enterprise allowance 23 0.01% 13,390n
Total benefits for unemployed people 2,352 1.11% Benefits for people on low incomes
Income support 2,705 1.28% 706,000 Housing benefit 24,273 11.47% 4,781,000
Discretionary housing payments 125 0.06% Not available Funeral payments 40l 0.02% 28,700l
Cold weather payments 4l 0.00% 154,700l Total benefits for people on low incomes 27,146 12.82%
Benefits for older people Basic state pension (contributory) 68,003 32.12% 12,857,000
Basic state pension (non-contributory) 108 0.05% 46,000 Additional state pension (and pension transfers) 21,177o 10.00% Not availablep
Financial Assistance Scheme 209e 0.10% Not available Pension credit 6,078 2.87% 2,074,000
Over-75s television licences 620e 0.29% 4,429,000e Winter fuel payments 2,080 0.98% 12,260,000
Total benefits for older people 98,275 46.43% Benefits for sick and disabled people
Incapacity benefit 75 0.04% 68,000 Employment and support allowance 14,276 6.74% 2,367,000
Severe disablement allowance 464 0.22% 122,000 Personal independence payment 2,991 1.41% 584,000q
Disability living allowance 13,225 6.25% 2,987,000q Attendance allowance 5,489 2.59% 1,458,000q
Carer’s allowance 2,560 1.21% 762,000q Motability grants 17r 0.01% Not available
Industrial injuries benefits 869s 0.41% 313,000 War pensions 795e,t 0.38% 130,178e,t,u
Armed forces independence payment 7 0.00% 896v Otherw 55 0.03% Not available
Total benefits for sick and disabled people 40,823 19.28% Benefits for bereaved people
Widow(er)s’ and bereavement benefits 569 0.27% 92,000x Industrial death benefit 28 0.01% 5,000
Total benefits for bereaved people 597 0.28% Other benefits
Christmas bonus 160 0.08% 16,035,000 Universal credit 483 0.23% 225,002y
Total other benefits 643 0.30% TOTAL 211,683 100.00%

© Institute for Fiscal Studies, 2016
13
Notes to Table 3.1 a Figures are estimated out-turns, from DWP Benefit Expenditure and Caseload Tables, unless otherwise stated.
This table also includes benefits not administered by DWP. The sum of all benefits and tax credits is therefore greater than the DWP figure for GB total expenditure. Source: https://www.gov.uk/government/publications/benefit-expenditure-and-caseload-tables-2016.
b Unless stated otherwise, claimant figures are the average number of claimants for the year 2015–16. Source: https://www.gov.uk/government/publications/benefit-expenditure-and-caseload-tables-2016.
c The division of the total personal tax credit bill between child and working tax credit assumes the tapering of tax credit entitlement reduces working tax credit before child tax credit. This is consistent with HMRC practice. Source: HMRC, Annual Report and Accounts 2015–16, https://www.gov.uk/government/uploads/system/uploads/attachment_data/file/539608/HMRC_Annual_Report_and_Accounts_2015-16-web.pdf.
d This figure assumes that the division of the total tax credit bill between WTC and CTC is the same for GB and the UK.
e This is a UK figure. f Number of families, covering 7,410,200 children as at 2 April 2016. g Source: HMRC, Child and Working Tax Credits Statistics, April 2016,
https://www.gov.uk/government/uploads/system/uploads/attachment_data/file/519572/cwtc-main-Apr16.pdf.
h This is less than the sum of all child and working tax credit claimants because some individuals qualify for both forms of personal tax credit.
i This figure assumes that the division of the total cost of child benefit and guardian’s allowance between the two benefits is the same for GB and the UK. Source: HMRC, Annual Report and Accounts 2015–16, https://www.gov.uk/government/uploads/system/uploads/attachment_data/file/539608/HMRC_Annual_Report_and_Accounts_2015-16-web.pdf.
j Number of families, covering 12,420,785 children in total as at 31 August 2015. Source: HMRC, Child Benefit Statistics Geographical Analysis: August 2015, https://www.gov.uk/government/statistics/child-benefit-statistics-geographical-analysis-august-2015.
k Figure is for statutory maternity pay only.
l Source: Social Fund Annual Report 2015–16, https://www.gov.uk/government/uploads/system/uploads/attachment_data/file/552482/social-fund-annual-report-2015-2016.pdf.
m This figure includes 580,000 claimants of income-based JSA, 103,000 claimants of contributory JSA and 9,000 claimants of both contributory and income-based JSA.
n Estimated number of new businesses set up as a result of the scheme between March 2015 and February 2016. Source: https://www.gov.uk/government/statistics/new-enterprise-allowance-apr-2011-to-mar-2016.
o Sum of expenditure on state second pension, lump-sum payments, graduated retirement benefit and pension transfers.
p 11,147,000 individuals received graduated retirement benefit, 10,282,000 received the state second pension and 47,000 received lump-sum payments. It is possible to receive more than one of these benefits.
q This is the number of cases in payment; the numbers of entitlements are 591,000 for PIP, 3,014,000 for DLA, 1,605,000 for AA and 1,172,000 for CA.
r Primarily DWP’s Specialised Vehicles Fund (see Section 4.6.6). s Includes industrial injuries disablement benefit and other industrial injuries benefits. t Includes both war disablement and war widow(er)’s pensions. Source: Ministry of Defence, War Pensions
Scheme Statistics: 2016, https://www.gov.uk/government/statistics/war-pensions-scheme-statistics-2016. u Claimants on 31 March 2016. v Source: Ministry of Defence, UK Armed Forces Compensation Scheme Biannual Statistics: 6 April 2005 to 31
March 2016, June 2016, https://www.gov.uk/government/uploads/system/uploads/attachment_data/file/527041/AFCS_March_2016.pdf.
w Includes mesothelioma 2008, pneumoconiosis 1979 and vaccine damage payments. x This figure includes claimants of bereavement allowance, bereavement payment and widowed parent’s
allowance; claimants of war widow(er)’s pension are included in the war pensions statistics (see note t above). y Total claimants in March 2016. Source: https://www.gov.uk/government/statistics/universal-credit-29-apr-
2013-to-7-apr-2016. Note: Figures may not sum exactly due to rounding.

© Institute for Fiscal Studies, 2016
14
4. A description of the current benefit system
This section looks at the components of the social security system in more detail. In Section 4.1, we look at child and working tax credit. The rest of the benefit system is then examined by dividing it into six major categories on the basis of the group a benefit is primarily designed to support: families with children, unemployed people, those on low incomes, older people, sick and disabled people, and bereaved people (Sections 4.2–4.7). Section 4.8 details benefits that are now only available to existing claimants. Each of these sections starts with a brief overview of the support available, alongside a table that summarises every benefit in terms of whether it is taxable or non-taxable, contributory or non-contributory, and means-tested or non-means-tested. These tables also give details of total expenditure and the total number of claimants.
The Christmas bonus is the only national benefit not included in any of these sections. This is a one-off tax-free payment of £10 to the recipients of certain benefits in the week beginning the first Monday of December. Only one bonus can be received per person, although in couples where both partners receive qualifying benefits, two separate payments can be made. If both partners are over the state pension age, they will both receive the Christmas bonus under certain conditions, even if only one receives a qualifying benefit.29 Total expenditure on the Christmas bonus was estimated to be £160 million in 2015–16, with around 16 million claimants.
4.1 Personal tax credits
Since 2003, the personal tax credit system has included two separate tax credits – child tax credit (CTC) and working tax credit (WTC) – which are subject to a single means test.30 After an applicant makes a personal tax credit claim, HMRC estimates annual tax credit entitlement based on the applicant’s family income from the previous year.31 Families with annual pre-tax income of £6,420 or less (£16,105 for families who are eligible only for CTC) are entitled to the maximum CTC and WTC payments according to their circumstances. Income from most other benefits (including child benefit, housing benefit and disability living allowance) is not included in the CTC–WTC calculation, while entitlement to income support, income-
29 This is the case if the only benefit claimed is pension credit, or if the individual in receipt of a qualifying benefit is entitled to an increase in that benefit for their partner. 30 Under international accounting conventions, tax credits are counted as negative taxation to the extent that they are less than the income tax liability of the family and as government expenditure for payments exceeding the tax liability. For our purposes, however, we count all tax credit expenditure as if it were a cash benefit (and therefore public spending).
31 The claim runs from the date it is received by HMRC and claims for WTC can usually be backdated for up to a month.

© Institute for Fiscal Studies, 2016
15
based JSA, income-related ESA or pension credit acts as an automatic passport to maximum CTC.32
For those with an annual family pre-tax income above £6,420, CTC and WTC awards are tapered away at a rate of 41%. WTC entitlement apart from the childcare element is withdrawn first, then the childcare element of WTC, then the child and disability elements of CTC, and finally the family element of CTC. In July 2015, the newly-elected Conservative government proposed reducing the income threshold limit to £3,850, but it subsequently abandoned the policy.
Estimated annual entitlement is then paid in a series of monthly instalments throughout the financial year. If a claimant’s circumstances change within the year in a way that increases their tax credit entitlement, payments increase from when they report the changes to HMRC. In-year increases and falls in income are disregarded for the means-test calculation if they are less than £2,500.
Actual entitlement values for a given tax year are not finalised until families report their actual incomes and circumstances by the following July (or, in some cases, January).33 This means a large number of overpayments and underpayments are generated each year due to changes in circumstances between the date of the claim and the dates awards are paid. For example, HMRC estimates that tax credit overpayments in 2014–15 totalled £1.37 billion.34
Table 4.1.1. Personal tax credit claimants, 2015–16
Families (thousands) Number of children in recipient families
Singles Couples All
Out-of-work families with children 866.1 335.8 1,201.9 2,321.4 In-work families with children 1,197.2 1,464.9 2,662.1 5,088.8 In-work families without children 369.7 148.8 518.5 Total 2,433.0 1,949.5 4,382.4 7,410.2 Note: Figures may not sum due to rounding. Source: HMRC, Child and Working Tax Credits Statistics, April 2016, https://www.gov.uk/government/uploads/system/uploads/attachment_data/file/519572/cwtc-main-Apr16.pdf.
32 Source: HMRC, A Guide to Child Tax Credit and Working Tax Credit, October 2014, http://www.hmrc.gov.uk/leaflets/wtc2.pdf. 33 Most families have until 31 July following the end of the entitlement year to report their finalised incomes for the year in question. However, families where someone completes an income tax self-assessment return (generally the self-employed) have until 31 January of the following year to do this. 34 Source: HMRC Annual Report and Accounts 2015-16, https://www.gov.uk/government/uploads/system/uploads/attachment_data/file/539608/HMRC_Annual_Report_and_Accounts_2015-16-web.pdf.

© Institute for Fiscal Studies, 2016
16
In 2015–16, £27.64 billion was spent on personal tax credits covering approximately 4.4 million families containing 7.4 million children.35 Table 4.1.1 summarises the characteristics of these families and shows that around 61% of tax credit claimants were in-work families with children, 27% of claimants were out-of-work families with children and 12% of claimants were working families without children.
CTC and WTC are gradually being replaced by universal credit and it is not possible to make new claims for tax credits in areas where the UC roll-out has been completed.36 The government currently intends to start moving existing tax credit claimants onto UC from July 2019 and plans the transition to UC to be completed by March 2022.
Benefit T C M Claimants, 2015–16a
Expenditure, 2015–16 (£m)b
4.1.1 Child tax credit 3,864,000c 21,733d 4.1.2 Working tax credit 2,374,200c 5,908d T = taxable, C = contributory, M = means-tested
a Claimant figures are the average number of claimants for the year 2015–16.
b Figures are estimated out-turns. c This is a UK figure. d This figure assumes that the division of the total tax credit bill between WTC and CTC is the same for GB and
the UK. It also assumes the tapering of tax credit entitlement reduces WTC before CTC, which is consistent with HMRC practice.
Source: HMRC, Annual Report and Accounts 2015–16, https://www.gov.uk/government/uploads/system/uploads/attachment_data/file/539608/HMRC_Annual_Report_and_Accounts_2015-16-web.pdf; HMRC, Child and Working Tax Credits Statistics, April 2016, https://www.gov.uk/government/uploads/system/uploads/attachment_data/file/519572/cwtc-main-Apr16.pdf.
4.1.1 Child tax credit
Non-taxable, Non-contributory, Means-tested
Child tax credit (CTC) combines support previously provided by the children’s tax credit, child credits in the working families’ tax credit,37 child additions to most non-means-tested benefits,38 and the child elements (i.e. child additions and family premiums) of income support and income-based JSA. CTC is paid on top of child benefit (see Section 4.2.1) and directly to the main carer in the family.
35 All figures related to personal tax credit claimants are reported on a UK basis as figures for GB are not currently available.
36 A list of these areas is available at https://www.gov.uk/guidance/jobcentres-where-you-can-claim-universal-credit.
37 For details of these, see A. Dilnot and J. McCrae, ‘Family credit and the working families’ tax credit’, IFS Briefing Note BN3, October 1999, http://www.ifs.org.uk/bns/bn3.pdf. 38 These benefits include the basic state pension, incapacity benefit, severe disability allowance and widowed parent’s allowance. Some existing claimants still receive child increases rather than CTC; further details can be found in Section 4.8.7.

© Institute for Fiscal Studies, 2016
17
CTC is made up of a number of elements: a family element (the basic element), a child element, a disabled child additional element and a severely disabled child additional element (see Table 4.1.2). Entitlement to CTC does not depend on employment status, but does require that the claimant be responsible for at least one child under the age of 16 (or aged 16–19 and in full-time education).
Table 4.1.2. Current rates of child tax credit
£ per annum £ per week Family element 545 10.45 Child element (each) 2,780 53.32 Disabled child additional element (each) 3,140 60.22 Severely disabled child additional element (each) 1,275 24.45 Income below which maximum CTC is payable 6,420 123.12 Income below which maximum payable if not entitled to WTC 16,105 308.86 Withdrawal rate 41% 41% Note: Weekly numbers are calculated based upon there being 365/7 weeks a year.
Since 2014, EEA migrants who arrive in the UK looking for work or not intending to work will need to live in the UK for three months before they can claim CTC. EEA jobseekers will then only be able to get this benefit for three months unless they have a genuine chance of finding work (such as a written job offer with a definite start date within the next three months).
From 6 April 2017, support will be limited to two children and the family element will be abolished. Claimants will continue to receive tax credit support for all children born before 6 April 2017, but will not receive support for third and subsequent children born after this date.
4.1.2 Working tax credit
Non-taxable, Non-contributory, Means-tested
Working tax credit (WTC) has been available since 6 April 2003 and provides in-work support for low-paid working adults. WTC requires the claimant (or their partner) to be in full-time paid work. Normally, claimants aged 25 or over are only eligible if they work at least 30 hours per week. More lenient rules apply to disabled workers, those over 60, lone parents and couples with children. The first three of these groups are eligible for WTC provided at least one adult in the household works 16 or more hours per week. To be eligible for WTC, couples with children must, in addition to meeting that condition, work for a combined total of at least 24 hours. This additional requirement is waived if the working partner is disabled or aged 60 or above or if the non-working partner is entitled to carer’s allowance, incapacitated or in prison.

© Institute for Fiscal Studies, 2016
18
The requirement to work a minimum number of hours to qualify for WTC means that individuals experience a considerable jump in their net incomes when they increase their working hours from just below the hours threshold to just above it. This effect is particularly pronounced for certain groups such as lone parents, who gain an extra £3,970 if they work 16 rather than 15 hours. There is evidence that large numbers of individuals work exactly 16 and 30 hours, and this ‘bunching’ suggests that working patterns have responded to the considerable incentives created by the WTC system. One potential advantage of universal credit is that, since there are no hours rules, it does not create the same extremely strong incentives to work a particular number of hours.
WTC is made up of a number of components (see Table 4.1.3). There is a basic element, with an extra payment for couples and lone parents (i.e. for everyone except childless single people), as well as an additional payment for those working at least 30 hours per week.39 WTC also includes supplementary payments for disability and severe disability. Severe disability supplements are payable where the recipient or their partner receives the highest rate of the care component of disability living allowance (see Section 4.6.3) or the higher rate of attendance allowance (see Section 4.6.4).
Table 4.1.3. Current rates of working tax credit
£ per annum £ per week Basic element 1,960 37.59 Couple and lone-parent element 2,010 38.55 30-hour element 810 15.53 Childcare elementa One child 175 3.36
Two or more children 300 5.75 Disability element 2,970 56.96 Severe disability element 1,275 24.45 Income below which maximum WTC is payable 6,420 123.12 Withdrawal rate 41% 41% a 70% of eligible childcare payments are payable (up to the maximum shown). Note: Weekly numbers are calculated based upon there being 365/7 weeks per year.
The childcare element of WTC is available to lone parents working 16 hours or more per week and to couples where both partners work for 16 hours or more per week (or if one is incapacitated or in prison and thus unable to care for children and the other works for 16 hours or more per week). This element is payable until the first week in September following the child’s 15th birthday (16th birthday for disabled children), and care must be given by approved providers such as registered
39 Couples with children are eligible for the 30 hours element provided both members of the couple are in work, total hours worked by the couple is at least 30 per week and one member works at least 16 hours per week.

© Institute for Fiscal Studies, 2016
19
childminders, nurseries and after-school clubs. The childcare component provides 70% of eligible childcare expenditure of up to £175 per week for families with one child or £300 for families with two or more children (i.e. up to £122.50 or £210 per week respectively). Unlike the rest of WTC, which is necessarily paid to the individual in full-time work (or to the individual agreed upon by the couple where both are in full-time work), the childcare credit is paid directly to the main carer, as with child tax credit.
The maximum amount of WTC payable is calculated by adding together all applicable elements. Claimants are automatically entitled to the maximum amount of WTC if they receive income support, income-based JSA, income-related ESA or pension credit, although it should be noted that there are few situations in which any of those four benefits can be claimed at the same time as WTC (due to the working restrictions). WTC also counts fully as income in calculations for all those four benefits.
WTC that either includes a disability element or is received with CTC entitles recipients to a number of health benefits, including free prescriptions, dental treatment, and sight tests and glasses.
4.2 Benefits for families with children
There are a number of benefits that are targeted at families. For instance, child benefit and guardian’s allowance provide near-universal support for parents or guardians bringing up children. Statutory maternity, paternity and adoption pay, as well as maternity allowance, are paid out when there is a new addition to the family, to people who have worked and built up entitlement. In contrast, as part of the Social Fund, Sure Start maternity grants are one-off payments made to new mothers on the basis of need. In addition to the benefits discussed in this section, benefits that are available to other groups may include elements that provide extra financial support for families, such as the housing benefit family premium and child allowances.

© Institute for Fiscal Studies, 2016
20
Benefit T C M Claimants, 2015–16a
Expenditure, 2015–16 (£m)b
4.2.1 Child benefit 7,153,935c 11,281d 4.2.2 Guardian’s allowance Not available 2d 4.2.3 Statutory maternity,
paternity, shared parental and adoption pay
269,000e 2,449
4.2.4 Maternity allowance 63,000 443 4.2.5 Sure Start maternity grant 59,400f 30f T = taxable, C = contributory, M = means-tested
a Claimant figures are the average number of claimants for the year 2015–16, unless otherwise stated.
b Figures are estimated out-turns. c Number of families, covering 12,420,785 children in total as at 31 August 2015. Source: HMRC, Child Benefit
Statistics Geographical Analysis: August 2015, https://www.gov.uk/government/statistics/child-benefit-statistics-geographical-analysis-august-2015.
d This figure assumes that the division of the total cost of child benefit and guardian’s allowance between the two benefits is the same for GB and the UK. Source: HMRC, Annual Report and Accounts 2015–16, https://www.gov.uk/government/uploads/system/uploads/attachment_data/file/539608/HMRC_Annual_Report_and_Accounts_2015-16-web.pdf.
e Figure is for statutory maternity pay only. f Source: Social Fund Annual Report 2015–16,
https://www.gov.uk/government/uploads/system/uploads/attachment_data/file/552482/social-fund-annual-report-2015-2016.pdf.
4.2.1 Child benefit
Non-taxable, Non-contributory, Means-tested40
Child benefit (CB) was introduced in April 1977 to replace the family allowance and the child tax allowance. As at 31 August 2015, approximately 7.2 million families received CB, covering over 12 million children. CB is paid at a higher rate for the eldest or only child, and then at a lower rate for all subsequent children. For the purposes of receiving CB, a ‘child’ is someone under the age of 16, between 16 and 20 and in full-time non-advanced education or training, or 16 or 17 and registered for work, education or training with an approved body. CB does not count as income for the calculation of entitlement to other benefits and tax credits.
Table 4.2.1. Current rates of child benefit, £ per week
Eldest or only childa 20.70 Subsequent children (each) 13.70 a Prior to 6 July 1998, an additional payment for the eldest (or only) child was available to lone parents. This
higher rate remains available to claimants who were eligible to receive it prior to the policy change (and who remain so today).
CB rates were frozen between April 2011 and April 2014, rather than being uprated in line with the CPI, and this will continue until 2020 as part of the freeze on working-age benefits discussed in Section 2.3. Since January 2013, CB has been withdrawn
40 Child benefit is now gradually withdrawn for families with at least one individual with a taxable income over £50,000 per year.

© Institute for Fiscal Studies, 2016
21
through an income tax charge from families where one parent’s taxable income is above £50,000 per year. Claimants lose 1% of their CB for every £100 of income over that level, meaning families containing an individual with a taxable income of £60,000 or more will receive no CB. This is expected to save £1.7 billion each year from 2014–15.41
The CB means test has several unusual features. Unlike other means-tested benefits, which use family income to calculate entitlement, basing child benefit entitlement on the income of the highest earner causes large disparities between one- and two-earner families. For example, a family with a total income of £100,000 split equally between two earners remains eligible for the full amount of CB, while a single-earner family with a total income of £60,000 loses all entitlement. The design of the taper also means that the rate at which CB is withdrawn varies depending on the number of children in the family. For example, 1% of CB equates to £10.79 per year for a one-child family and an additional £7.14 per child for larger families. This means that parents with many children will have only weak incentives to increase their taxable income above £50,000.
Since July 2014, EEA migrants who arrive in the UK looking for work or not intending to work will need to live in the UK for three months before they can claim child benefit or child tax credit. EEA jobseekers will then only be able to get these benefits for three months unless they have a genuine chance of finding work.
In 2015–16, child benefit is estimated to have cost the exchequer £11.3 billion.
4.2.2 Guardian’s allowance
Non-taxable, Non-contributory, Non-means-tested
Guardian’s allowance (GA) is a benefit paid in addition to child benefit to families bringing up a child or children whose parents have died. If only one parent has died, GA may still be payable if the whereabouts of the other parent is unknown. The claimant need not be the child’s legal guardian, but the child must be living with the claimant or the claimant must be making contributions for the maintenance of the child of at least £16.55 per week. A step-parent does not count as a parent and so may be entitled to receive GA for raising a stepchild if both natural parents have died. Adoptive parents count as parents, and so cannot receive GA in most cases. The rules concerning who counts as a child are the same as for child benefit (see Section 4.2.1).42
Expenditure on guardian’s allowance amounted to an estimated £2 million in 2015–16. 41 Source: Tables 2.1 and 2.2 in HM Treasury, Budget 2012, March 2012, https://www.gov.uk/government/publications/budget-2012. 42 For more details on who can claim guardian’s allowance, see page 628 of CPAG 2016/17.

© Institute for Fiscal Studies, 2016
22
Table 4.2.2. Current rate of guardian’s allowance, £ per week
All children (each) 16.55
4.2.3 Statutory maternity pay, statutory paternity pay, statutory adoption pay and statutory shared parental pay
Taxable, Contributory, Non-means-tested
Statutory maternity pay (SMP) is a legal minimum amount that employers must pay to their employees during maternity leave, although almost all the cost can be recouped from the government. Many women receive more than the minimum, but this is paid for by employers and not by the government. To claim, the woman must have been in continuous employment with the same employer for at least 26 weeks up to and including the 15th week before the week in which the baby is due. She must also have earned at least the lower earnings limit for National Insurance contributions (£112 per week in 2016–17) on average during the eight weeks up to and including the 15th week before the week in which the baby is due. To claim SMP, the woman need not intend to return to work.
SMP can be paid for up to 39 weeks: the first six weeks’ pay will be at a higher rate, and the remaining 33 at a lower rate (see Table 4.2.3). The period of payment can begin at any time from the 11th week before the baby is due until the day after the birth itself (to coincide with maternity leave). Some special circumstances, such as absence from work, might change the start of the SMP period.43
Table 4.2.3. Current rates of statutory maternity/paternity/adoption/shared parental pay, per week
Higher rate of SMP and SAP 90% of claimant’s average weekly earnings
SPP, SSPP, lower rate of SMP and SAP The lesser of £139.58 or 90% of claimant’s average weekly earnings
Government expenditure on SMP in 2015–16 is estimated to have been approximately £2.3 billion, with around 269,000 claimants.
Statutory paternity pay (SPP) and statutory adoption pay (SAP) were introduced on 6 April 2003. Both are legal minimum amounts that employers must pay to their employees during paternity/adoption leave, and most of the cost can be reclaimed from the government. SPP is usually paid to individuals whose partner has given birth, but can also be paid when a child is adopted. SAP can only be claimed by one parent (the other may be able to claim SPP).
43 Rules for deciding the SMP period are available at https://www.gov.uk/government/publications/maternity-benefits-technical-guidance.

© Institute for Fiscal Studies, 2016
23
The eligibility requirements for SPP and SAP are very similar to those for SMP, except that they include more stringent employment conditions. For SPP (birth), the claimant must satisfy the 26-week employment rule (see above) and must also be continuously employed by the same employer from the end of the 15th week before the child is due until the child is born. For SPP (adoption) and SAP, the claimant must have been continuously employed for at least 26 weeks ending the week in which notification is received that a child has been matched for adoption. For SPP (adoption) only, employment must then continue with the same employer until the day of the adoption placement.44
Since April 2015, SAP rates have been the same as the SMP rates explained above and detailed in Table 4.2.3. SAP is available for a total of 39 weeks, while SPP is available for up to two consecutive weeks between the date of birth or adoption and eight weeks after that date.
From 5 April 2015, new parents have been able to claim statutory shared parental pay (SSPP), which is intended to encourage more equal sharing of childcare in the earliest stages of parenthood or adoption. To be eligible for SSPP, the mother must qualify for SMP but only claim SMP for less than the maximum 39-week period and the father must qualify for SPP. If both parents meet these conditions and the mother returns to work, the other parent can claim SSPP for the remainder of the 39-week period, up to a maximum of 37 weeks. The same principles apply to parents who adopt a child when one parent reduces the number of weeks they claim SAP. There are plans to change the rules on entitlement to SSPP in 2018 to allow a working grandparent to claim SSPP provided the mother or adopter reduces the period of their SMP or SAP claim.
4.2.4 Maternity allowance
Non-taxable, Contributory, Non-means-tested
Maternity allowance (MA) may be payable to pregnant women and new mothers who are unable to claim SMP.45 To be eligible for MA, claimants must satisfy both an employment test and an earnings condition. To satisfy the employment test, the claimant must have been employed or self-employed (not necessarily continuously or for the same employer) for at least 26 of the 66 weeks up to and including the week before the baby is due (known as the employment test period). The earnings condition requires that average weekly earnings in any 1346 of the previous 66 weeks
44 See pages 791–2 of CPAG 2016/17.
45 For example, mothers who have recently stopped work to have a baby, earn below the NIC LEL threshold or are self-employed would not qualify for SMP but may be eligible for MA.
46 The 13 weeks do not have to be in a row, and can be chosen in order to maximise the average weekly earnings.
© Institute for Fiscal Studies, 2016
24
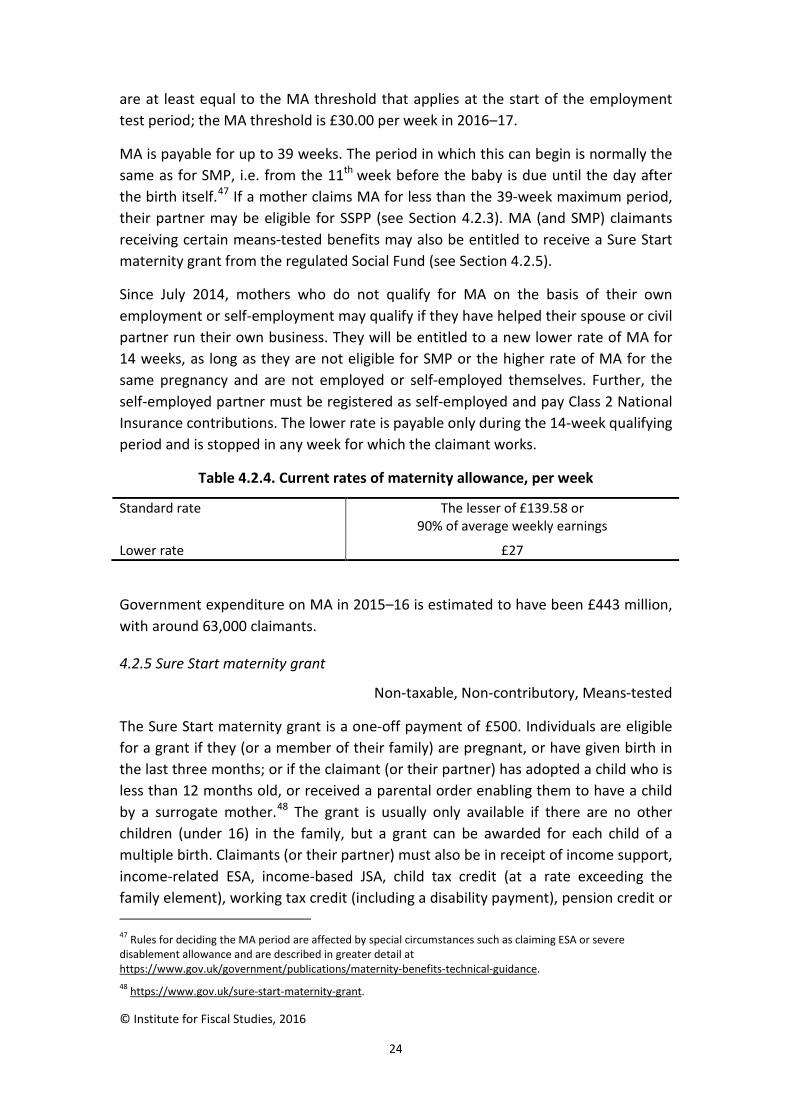
are at least equal to the MA threshold that applies at the start of the employment test period; the MA threshold is £30.00 per week in 2016–17.
MA is payable for up to 39 weeks. The period in which this can begin is normally the same as for SMP, i.e. from the 11th week before the baby is due until the day after the birth itself.47 If a mother claims MA for less than the 39-week maximum period, their partner may be eligible for SSPP (see Section 4.2.3). MA (and SMP) claimants receiving certain means-tested benefits may also be entitled to receive a Sure Start maternity grant from the regulated Social Fund (see Section 4.2.5).
Since July 2014, mothers who do not qualify for MA on the basis of their own employment or self-employment may qualify if they have helped their spouse or civil partner run their own business. They will be entitled to a new lower rate of MA for 14 weeks, as long as they are not eligible for SMP or the higher rate of MA for the same pregnancy and are not employed or self-employed themselves. Further, the self-employed partner must be registered as self-employed and pay Class 2 National Insurance contributions. The lower rate is payable only during the 14-week qualifying period and is stopped in any week for which the claimant works.
Table 4.2.4. Current rates of maternity allowance, per week
Standard rate The lesser of £139.58 or 90% of average weekly earnings
Lower rate £27
Government expenditure on MA in 2015–16 is estimated to have been £443 million, with around 63,000 claimants.
4.2.5 Sure Start maternity grant
Non-taxable, Non-contributory, Means-tested
The Sure Start maternity grant is a one-off payment of £500. Individuals are eligible for a grant if they (or a member of their family) are pregnant, or have given birth in the last three months; or if the claimant (or their partner) has adopted a child who is less than 12 months old, or received a parental order enabling them to have a child by a surrogate mother.48 The grant is usually only available if there are no other children (under 16) in the family, but a grant can be awarded for each child of a multiple birth. Claimants (or their partner) must also be in receipt of income support, income-related ESA, income-based JSA, child tax credit (at a rate exceeding the family element), working tax credit (including a disability payment), pension credit or 47 Rules for deciding the MA period are affected by special circumstances such as claiming ESA or severe disablement allowance and are described in greater detail at https://www.gov.uk/government/publications/maternity-benefits-technical-guidance. 48 https://www.gov.uk/sure-start-maternity-grant.

© Institute for Fiscal Studies, 2016
25
universal credit, and must prove that they have received health and welfare advice from a health professional. There are no capital limits.
In 2015–16, over 59,000 awards were made, worth £30 million.
Table 4.2.5. Current rate of Sure Start maternity grant, £ per week
No other children under 16 All births (each) 500
Already children under 16 (grants for multiple births only) Grant for birth of twins Grant for birth of triplets Previously had at least one child (none from multiple births)
500 1,000
Previously had twins 0 500
Previously had triplets 0 0
4.3 Benefits for unemployed people
The benefits in this section are specifically for those who are currently out of work. Jobseeker’s allowance is paid to unemployed individuals on the understanding that they take steps to find a job. In particular, there are several conditions linked to the payments. For instance, after claiming JSA for a certain length of time, claimants must take part in a Work Programme. Meanwhile, the new enterprise allowance provides financial support to some unemployed individuals who are attempting to start a business. It is important to note that unemployed people may also be able to claim many of the benefits aimed at other groups.
Benefit T C M Claimants, 2015–16a
Expenditure, 2015–16 (£m)b
4.3.1 Income-based jobseeker’s allowance
692,000c
2,024
Contribution-based jobseeker’s allowance
306
4.3.2 New enterprise allowance
13,390d 23
T = taxable, C = contributory, M = means-tested a Claimant figures are the average number of claimants for the year 2015–16, unless otherwise stated. b Figures are estimated out-turns. c This figure includes 580,000 claimants of income-based JSA, 103,000 claimants of contributory JSA and 9,000
claimants of both contributory and income-based JSA.
d Estimated number of new businesses set up as a result of the scheme between March 2015 and February 2016. Source: https://www.gov.uk/government/statistics/new-enterprise-allowance-apr-2011-to-mar-2016.
© Institute for Fiscal Studies, 2016
26
4.3.1 Jobseeker’s allowance
Taxable, either Contributory or Means-tested
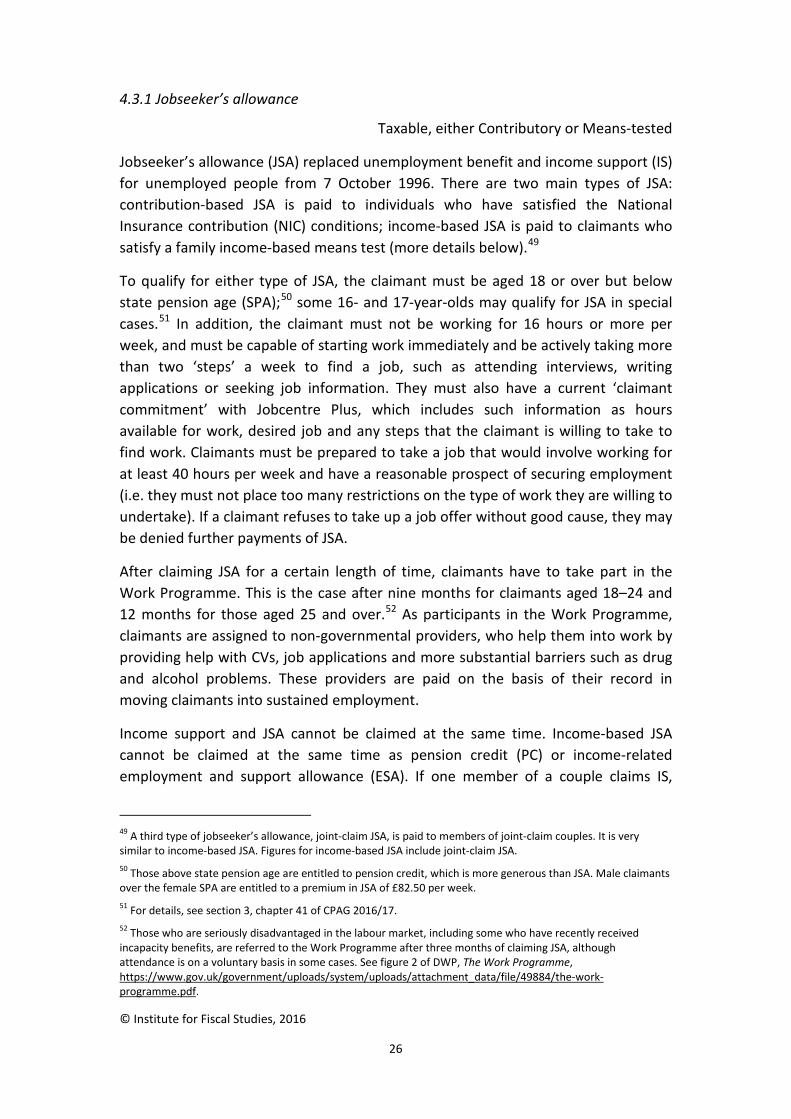
Jobseeker’s allowance (JSA) replaced unemployment benefit and income support (IS) for unemployed people from 7 October 1996. There are two main types of JSA: contribution-based JSA is paid to individuals who have satisfied the National Insurance contribution (NIC) conditions; income-based JSA is paid to claimants who satisfy a family income-based means test (more details below).49
To qualify for either type of JSA, the claimant must be aged 18 or over but below state pension age (SPA);50 some 16- and 17-year-olds may qualify for JSA in special cases.51 In addition, the claimant must not be working for 16 hours or more per week, and must be capable of starting work immediately and be actively taking more than two ‘steps’ a week to find a job, such as attending interviews, writing applications or seeking job information. They must also have a current ‘claimant commitment’ with Jobcentre Plus, which includes such information as hours available for work, desired job and any steps that the claimant is willing to take to find work. Claimants must be prepared to take a job that would involve working for at least 40 hours per week and have a reasonable prospect of securing employment (i.e. they must not place too many restrictions on the type of work they are willing to undertake). If a claimant refuses to take up a job offer without good cause, they may be denied further payments of JSA.
After claiming JSA for a certain length of time, claimants have to take part in the Work Programme. This is the case after nine months for claimants aged 18–24 and 12 months for those aged 25 and over.52 As participants in the Work Programme, claimants are assigned to non-governmental providers, who help them into work by providing help with CVs, job applications and more substantial barriers such as drug and alcohol problems. These providers are paid on the basis of their record in moving claimants into sustained employment.
Income support and JSA cannot be claimed at the same time. Income-based JSA cannot be claimed at the same time as pension credit (PC) or income-related employment and support allowance (ESA). If one member of a couple claims IS,
49 A third type of jobseeker’s allowance, joint-claim JSA, is paid to members of joint-claim couples. It is very similar to income-based JSA. Figures for income-based JSA include joint-claim JSA. 50 Those above state pension age are entitled to pension credit, which is more generous than JSA. Male claimants over the female SPA are entitled to a premium in JSA of £82.50 per week. 51 For details, see section 3, chapter 41 of CPAG 2016/17. 52 Those who are seriously disadvantaged in the labour market, including some who have recently received incapacity benefits, are referred to the Work Programme after three months of claiming JSA, although attendance is on a voluntary basis in some cases. See figure 2 of DWP, The Work Programme, https://www.gov.uk/government/uploads/system/uploads/attachment_data/file/49884/the-work-programme.pdf.
© Institute for Fiscal Studies, 2016
27
income-related ESA or PC, the other may claim contribution-based JSA but not income-based JSA.
In October 2014, the wait period for contributory or income-related JSA claims (the time between a new claim being made and entitlement being granted) was extended from 3 to 7 days which is estimated to save £275 million in 2016–17.53
Jobseeker’s allowance is being replaced by universal credit. Between 2016 and 2018, it will no longer be possible to make a new claim for income-based JSA in certain areas as universal credit is rolled out across the country. DWP currently plans to begin transferring existing income-based JSA claimants to universal credit from 2018.54
Contribution-based jobseeker’s allowance
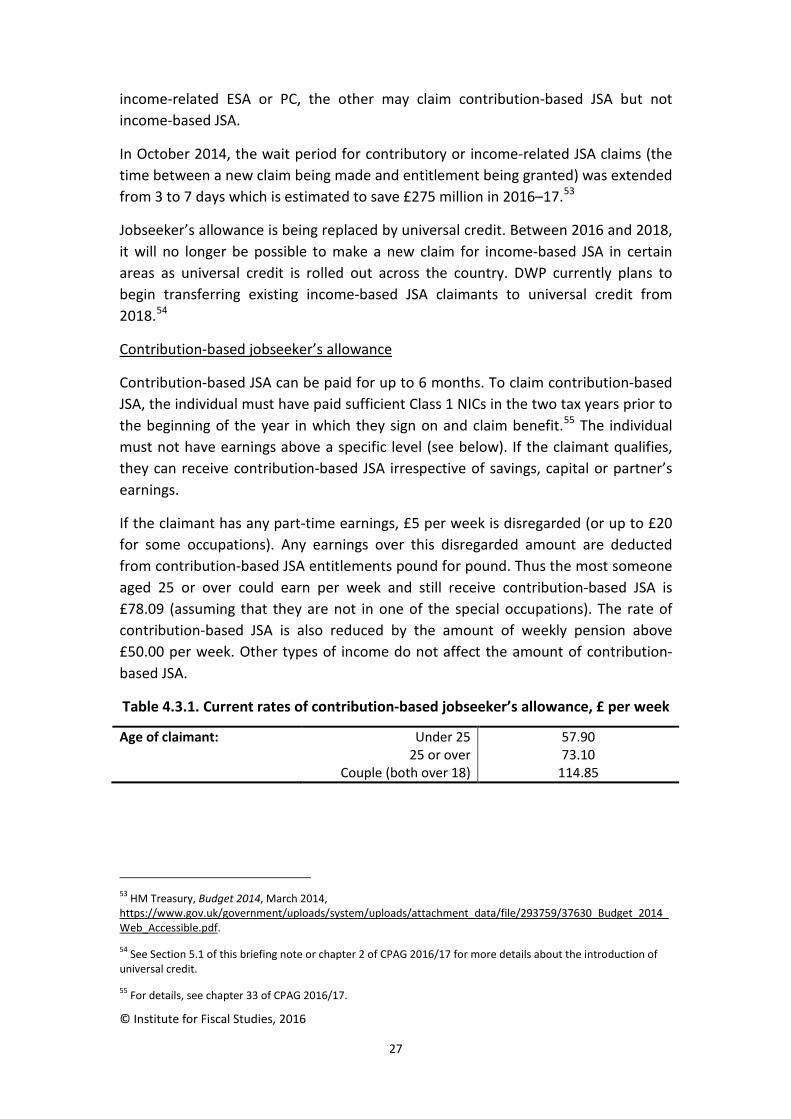
Contribution-based JSA can be paid for up to 6 months. To claim contribution-based JSA, the individual must have paid sufficient Class 1 NICs in the two tax years prior to the beginning of the year in which they sign on and claim benefit.55 The individual must not have earnings above a specific level (see below). If the claimant qualifies, they can receive contribution-based JSA irrespective of savings, capital or partner’s earnings.
If the claimant has any part-time earnings, £5 per week is disregarded (or up to £20 for some occupations). Any earnings over this disregarded amount are deducted from contribution-based JSA entitlements pound for pound. Thus the most someone aged 25 or over could earn per week and still receive contribution-based JSA is £78.09 (assuming that they are not in one of the special occupations). The rate of contribution-based JSA is also reduced by the amount of weekly pension above £50.00 per week. Other types of income do not affect the amount of contribution-based JSA.
Table 4.3.1. Current rates of contribution-based jobseeker’s allowance, £ per week
Age of claimant: Under 25 57.90 25 or over 73.10 Couple (both over 18) 114.85
53 HM Treasury, Budget 2014, March 2014, https://www.gov.uk/government/uploads/system/uploads/attachment_data/file/293759/37630_Budget_2014_Web_Accessible.pdf.
54 See Section 5.1 of this briefing note or chapter 2 of CPAG 2016/17 for more details about the introduction of universal credit.
55 For details, see chapter 33 of CPAG 2016/17.

© Institute for Fiscal Studies, 2016
28
Contribution-based JSA cost the government around £306 million in 2015–16.56
Income-based jobseeker’s allowance
Those who do not qualify for contribution-based JSA may be able to receive income-based JSA if they have sufficiently low income. Only one partner in a couple can receive income-based JSA, and the partner of the claimant must not be working for more than 24 hours per week (as described above, both forms of JSA require that the claimant is not working 16 hours or more per week). Couples without children must claim JSA jointly. This means that both usually have to sign on and meet the conditions for benefit.57
Income-based JSA is designed to top up the claimant’s income to a specified level (called the ‘applicable amount’), which is intended to reflect the needs of the claimant’s family. The applicable amount is the sum of personal allowances, premiums and some housing costs (primarily mortgage interest payments).58 The amount for each individual is usually identical to that for IS (see Table 4.4.1).59 Clearly, to be eligible, the claimant’s income (minus an earnings disregard60) must be less than their applicable amount. The level of JSA payable is just the applicable amount minus the income.
Income-based JSA is only payable if the claimant’s savings and other capital (ignoring their home) do not exceed £16,000. Capital up to £6,000 is ignored (£10,000 for those in care homes). Between these two thresholds, income-based JSA entitlement is reduced by £1 for every £250 of capital exceeding the lower threshold.
It is estimated that expenditure on income-based JSA fell from £4.5 billion in 2012–13 to £2.0 billion in 2015–16 as the economy recovered from the 2008–09 recession and some new claimants moved onto universal credit. Receipt of income-based JSA automatically entitles individuals to free school meals, health benefits (including free prescriptions, dental treatment and sight tests), maximum housing benefit and certain Social Fund payments (including the Sure Start maternity grant and funeral payments). 56 Care should be taken when comparing claimants and expenditure on JSA (both income- and contribution-based) over time, since the introduction of universal credit means that some individuals who would have previously claimed JSA are now claiming universal credit.
57 In certain circumstances, a joint-claim couple can qualify for JSA even if one of them does not satisfy all the rules for claiming JSA. For details, see pages 113–14 of CPAG 2016/17. 58 Some housing costs can be met by not only income-based JSA but also income support (Section 4.4.1), income-related ESA (Section 4.6.1) and pension credit (Section 4.5.3). The weekly amount covered is the home loan – subject to an upper limit and restrictions – multiplied by a centrally-set standard rate of interest, currently 3.12%. More details on calculating housing costs can be found in chapter 20 of CPAG 2016/17. 59 There is a 104-week limit on help with certain types of housing costs for JSA claimants. In contrast, those on IS, ESA or PC may get help with housing costs indefinitely. For details, see chapter 20 of CPAG 2016/17. 60 The earnings disregard is £20, £10 or £5 depending on the circumstances of the claimant. For details, see pages 262–5 of CPAG 2016/17.

© Institute for Fiscal Studies, 2016
29
Table 4.3.2. Current rates of income-based jobseeker’s allowance, £ per week
Personal allowance – single person: Aged 16–24 57.90
Aged 25 or over 73.10 Personal allowance – lone parent: Aged 16–17 57.90 Aged 18 or over 73.10 Personal allowance – couple: One or both aged 16–17 Variesa
Both aged 18 or over 114.85 a If both members of the couple are under 18, there are two rates: £57.90 and £87.50 (payable in special
circumstances). If only one is under 18, there are three rates: £57.90 (if the other is 18–24), £73.10 (if the other is 25 or over) and £114.85 (payable in special circumstances). For details, see pages 219–20 of CPAG 2016/17.
Since January 2014, EEA migrants who arrive in the UK face a three-month wait before they can claim income-based JSA. They can then only claim JSA for three months unless they have evidence of a ‘genuine’ prospect of work – for example, a written job offer with a definite start date within the next three months.
4.3.2 New enterprise allowance
Non-taxable, Non-contributory, Means-tested
The new enterprise allowance is part of the government’s policy of helping people to find and stay in work. If an individual gets certain benefits and has a feasible business idea, then it might be that setting up their own business and becoming self-employed is an effective way back into work.
The scheme was rolled out nationally between April and August 2011 following a pilot scheme in Merseyside. To be eligible, individuals must be aged 18 or over and have a business idea, and they (or their partner) must get either JSA, ESA in the work-related activity group or IS as a lone parent. If a claimant’s business idea is believed to have potential, they get a business mentor who assists them in writing a business plan. If their business plan is approved and they start working for more than 16 hours a week in the business, they are eligible for financial support. This takes the form of a weekly allowance paid for up to 26 weeks (up to a total of £1,274). It may also be possible to receive a loan of up to £2,500 to help with start-up costs.61
Since April 2011, the scheme has resulted in around 84,850 new businesses being set up, with 13,390 of these occurring between March 2015 and February 2016.62 Government expenditure on the scheme was an estimated £23 million in 2015–16.
61 Source: A. Dar, ‘New Enterprise Allowance’, House of Commons Library Briefing Paper 05878, 2016, http://researchbriefings.parliament.uk/ResearchBriefing/Summary/SN05878. Claimants of new enterprise allowance can also apply for loans of up to £25,000 from the Start Up Loans Company, a government-backed private company that was set up in 2012. For more information on Start Up loans, see https://www.gov.uk/start-up-loans.
62 Source: https://www.gov.uk/government/statistics/new-enterprise-allowance-apr-2011-to-mar-2016.
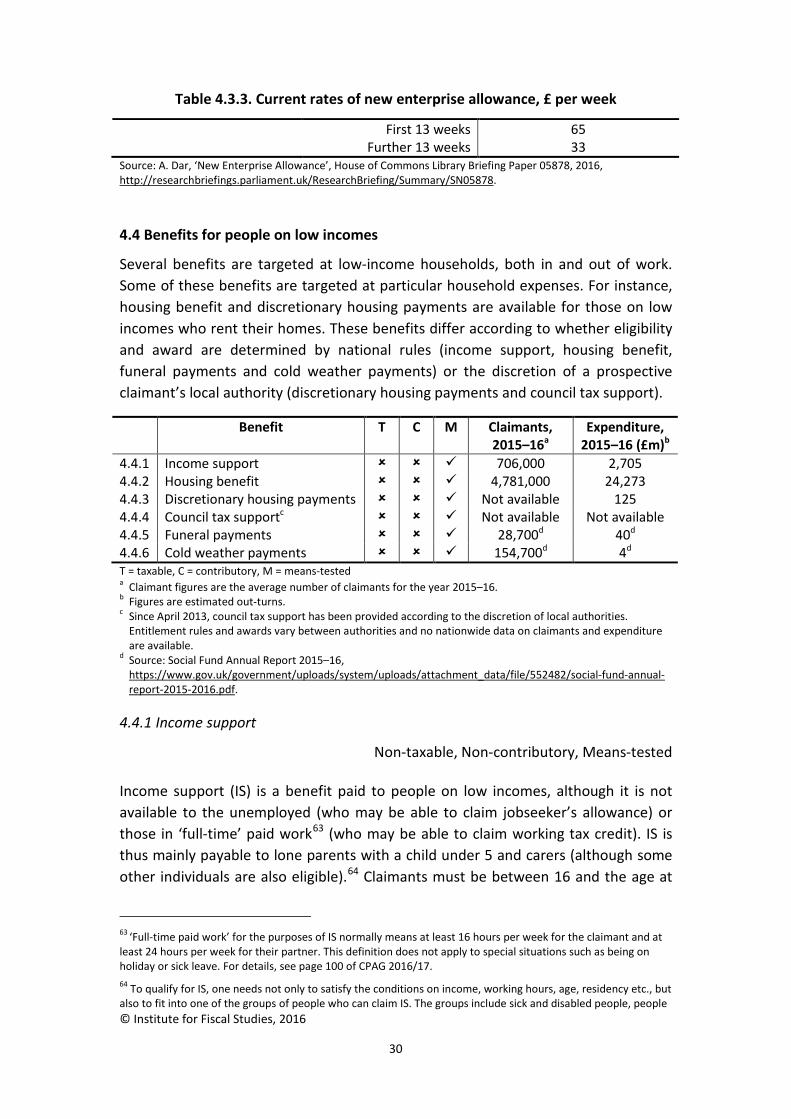
© Institute for Fiscal Studies, 2016
30
Table 4.3.3. Current rates of new enterprise allowance, £ per week
First 13 weeks 65 Further 13 weeks 33 Source: A. Dar, ‘New Enterprise Allowance’, House of Commons Library Briefing Paper 05878, 2016, http://researchbriefings.parliament.uk/ResearchBriefing/Summary/SN05878.
4.4 Benefits for people on low incomes
Several benefits are targeted at low-income households, both in and out of work. Some of these benefits are targeted at particular household expenses. For instance, housing benefit and discretionary housing payments are available for those on low incomes who rent their homes. These benefits differ according to whether eligibility and award are determined by national rules (income support, housing benefit, funeral payments and cold weather payments) or the discretion of a prospective claimant’s local authority (discretionary housing payments and council tax support).
Benefit T C M Claimants, 2015–16a
Expenditure, 2015–16 (£m)b
4.4.1 Income support 706,000 2,705 4.4.2 Housing benefit 4,781,000 24,273 4.4.3 Discretionary housing payments Not available 125 4.4.4 Council tax supportc Not available Not available
4.4.5 Funeral payments 28,700d 40d 4.4.6 Cold weather payments 154,700d 4d T = taxable, C = contributory, M = means-tested a Claimant figures are the average number of claimants for the year 2015–16. b Figures are estimated out-turns. c Since April 2013, council tax support has been provided according to the discretion of local authorities.
Entitlement rules and awards vary between authorities and no nationwide data on claimants and expenditure are available.
d Source: Social Fund Annual Report 2015–16, https://www.gov.uk/government/uploads/system/uploads/attachment_data/file/552482/social-fund-annual-report-2015-2016.pdf.
4.4.1 Income support
Non-taxable, Non-contributory, Means-tested
Income support (IS) is a benefit paid to people on low incomes, although it is not available to the unemployed (who may be able to claim jobseeker’s allowance) or those in ‘full-time’ paid work63 (who may be able to claim working tax credit). IS is thus mainly payable to lone parents with a child under 5 and carers (although some other individuals are also eligible).64 Claimants must be between 16 and the age at
63 ‘Full-time paid work’ for the purposes of IS normally means at least 16 hours per week for the claimant and at least 24 hours per week for their partner. This definition does not apply to special situations such as being on holiday or sick leave. For details, see page 100 of CPAG 2016/17. 64 To qualify for IS, one needs not only to satisfy the conditions on income, working hours, age, residency etc., but also to fit into one of the groups of people who can claim IS. The groups include sick and disabled people, people
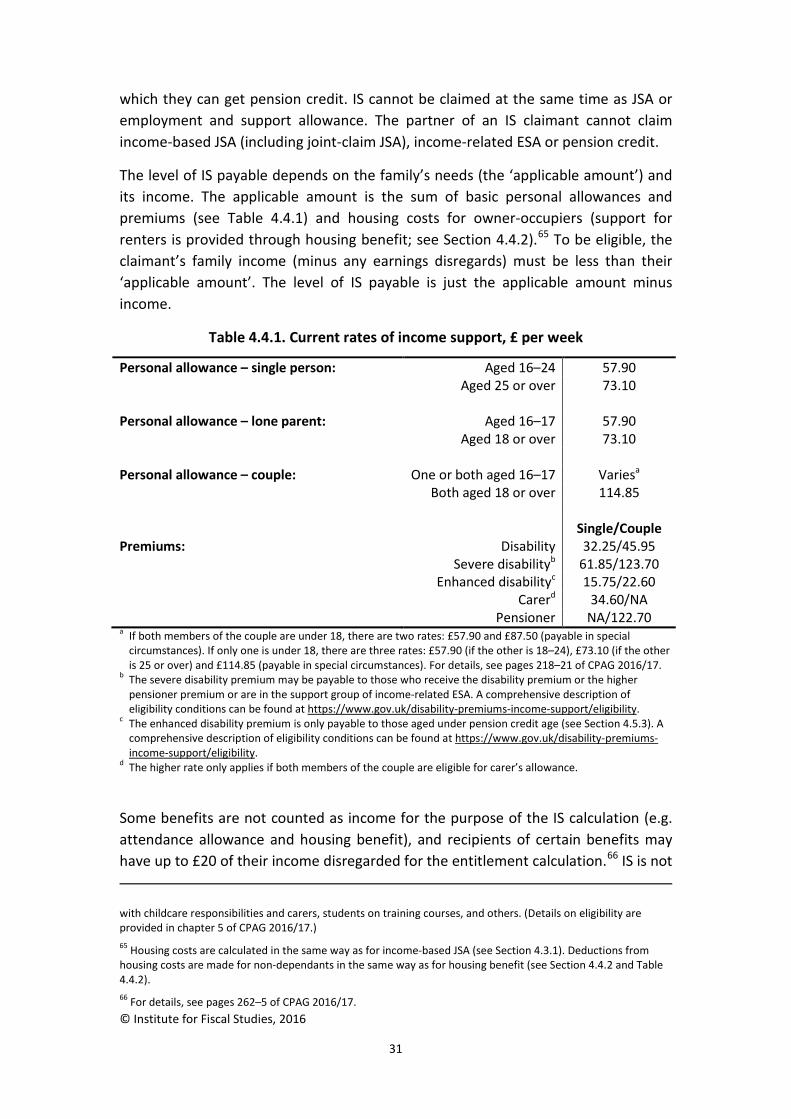
© Institute for Fiscal Studies, 2016
31
which they can get pension credit. IS cannot be claimed at the same time as JSA or employment and support allowance. The partner of an IS claimant cannot claim income-based JSA (including joint-claim JSA), income-related ESA or pension credit.
The level of IS payable depends on the family’s needs (the ‘applicable amount’) and its income. The applicable amount is the sum of basic personal allowances and premiums (see Table 4.4.1) and housing costs for owner-occupiers (support for renters is provided through housing benefit; see Section 4.4.2).65 To be eligible, the claimant’s family income (minus any earnings disregards) must be less than their ‘applicable amount’. The level of IS payable is just the applicable amount minus income.
Table 4.4.1. Current rates of income support, £ per week
Personal allowance – single person: Aged 16–24 57.90
Aged 25 or over 73.10
Personal allowance – lone parent: Aged 16–17 57.90 Aged 18 or over 73.10 Personal allowance – couple: One or both aged 16–17 Variesa
Both aged 18 or over 114.85 Single/Couple Premiums: Disability 32.25/45.95 Severe disabilityb 61.85/123.70 Enhanced disabilityc 15.75/22.60 Carerd 34.60/NA Pensioner NA/122.70 a If both members of the couple are under 18, there are two rates: £57.90 and £87.50 (payable in special
circumstances). If only one is under 18, there are three rates: £57.90 (if the other is 18–24), £73.10 (if the other is 25 or over) and £114.85 (payable in special circumstances). For details, see pages 218–21 of CPAG 2016/17.
b The severe disability premium may be payable to those who receive the disability premium or the higher pensioner premium or are in the support group of income-related ESA. A comprehensive description of eligibility conditions can be found at https://www.gov.uk/disability-premiums-income-support/eligibility.
c The enhanced disability premium is only payable to those aged under pension credit age (see Section 4.5.3). A comprehensive description of eligibility conditions can be found at https://www.gov.uk/disability-premiums-income-support/eligibility.
d The higher rate only applies if both members of the couple are eligible for carer’s allowance.
Some benefits are not counted as income for the purpose of the IS calculation (e.g. attendance allowance and housing benefit), and recipients of certain benefits may have up to £20 of their income disregarded for the entitlement calculation.66 IS is not
with childcare responsibilities and carers, students on training courses, and others. (Details on eligibility are provided in chapter 5 of CPAG 2016/17.) 65 Housing costs are calculated in the same way as for income-based JSA (see Section 4.3.1). Deductions from housing costs are made for non-dependants in the same way as for housing benefit (see Section 4.4.2 and Table 4.4.2). 66 For details, see pages 262–5 of CPAG 2016/17.

© Institute for Fiscal Studies, 2016
32
payable if the claimant and the claimant’s partner together have more than £16,000 of capital. Capital up to £6,000 is ignored (£10,000 for those in care homes).67 Between these two thresholds, IS entitlement is reduced by £1 for every £250 of capital exceeding the lower threshold.
In the past, IS provided support to a wider group of claimants who are now supported through separate benefits: disabled people now on the whole claim ESA (though IS is still available to certain groups such as those in receipt of statutory sick pay); older people now claim pension credit (though, in a small number of cases, pensioner premiums are still payable under IS, e.g. when a claimant aged under 60 has a partner aged over 60); and child tax credit has replaced child additions to IS.
Prior to the introduction of the Lone Parent Obligation in November 2008, lone parents with a youngest child under the age of 16 (or 19 and in full-time education) were eligible for IS solely on the grounds of being a lone parent. From then on, the upper age limit for lone-parent IS eligibility has been reduced in phases until, by November 2012, lone parents could only claim IS if their youngest child was under 5 years old. Instead of being eligible for IS, lone parents with a youngest child older than this are now subject to the conditionality associated with JSA.
The Lone Parent Obligation was intended to increase the number of single parents moving into work as a way to reduce child poverty. An evaluation of the policy found it had a significant positive impact on lone-parent employment rates. Three months after the loss of IS entitlement, 50,000 fewer lone parents were claiming out-of-work benefits and 30,000 more were in work.68 This impact is considerably greater than those of previous initiatives that aimed to encourage single parents into work.
Throughout 2015–16, an average of around 706,000 people received IS, with total 2015–16 expenditure estimated at £2.7 billion. Receipt of IS automatically entitles individuals to free school meals, health benefits (including free prescriptions, dental treatment and sight tests), maximum housing benefit and certain Social Fund payments (including the Sure Start maternity grant and funeral payments).
IS is being replaced by universal credit. Between 2016 and 2018, it will no longer be possible to make a new claim for income-based JSA in certain areas, as universal credit is rolled out across the country. DWP currently plans to begin transferring existing IS claimants to universal credit from 2018.69
67 None of these thresholds includes the value of owner-occupied property. 68 Source: S. Avram, M. Brewer and A. Salvatori, Lone Parent Obligations: An Impact Assessment, DWP Research Report 845, 2013 https://www.gov.uk/government/uploads/system/uploads/attachment_data/file/211688/rrep845.pdf.
69 See Section 5.1 of this briefing note or chapter 2 of CPAG 2016/17 for more details about the introduction of universal credit.

© Institute for Fiscal Studies, 2016
33
4.4.2 Housing benefit
Non-taxable, Non-contributory, Means-tested
Housing benefit (HB) is payable to families with low incomes who rent their homes (for families who own their own homes, mortgage interest payments may be met through income support, JSA, ESA or pension credit). Since April 2014, new EEA jobseekers and family members of EEA jobseekers have not been able to access HB.
The level payable depends on the ‘maximum HB’, the ‘applicable amount’, and the claimant’s income and capital. The maximum level of HB is equal to ‘eligible rent’ minus possible deductions made for any non-dependants because they are expected to contribute towards the rent. An amount is deducted for each non-dependant aged at least 18 based on their gross weekly income.70 Eligible rent is the weekly contractual rate of rent less ineligible charges included in the rent (such as certain fuel charges, service charges for washing, cleaning, etc., and water charges), and subject to rent restrictions. Note that these restrictions depend on the tenancy type (see below). In April 2016, the period over which HB claims could be backdated was reduced from six months to one month.
People on income support, income-based JSA, income-related ESA or the guarantee credit element of pension credit are automatically entitled to maximum HB. For other claimants, the amount of HB payable depends upon income relative to the ‘applicable amount’ in much the same way as for IS or income-based JSA. The individual’s applicable amount is calculated as the sum of the relevant personal allowance, premiums and components (set out in Table 4.4.2). If income is less than or equal to the ‘applicable amount’, maximum HB is payable. When income exceeds this level, there is a 65% taper (so HB entitlement is equal to maximum HB minus 65% of the amount by which income exceeds the applicable amount).
Some benefits are not counted as income (e.g. attendance allowance, disability living allowance and guardian’s allowance), and recipients of certain benefits may have up to £25 of their income disregarded for the HB entitlement calculation. A further £17.10 is disregarded from weekly earnings for claimants who work more than either 16 hours a week if they have children or 30 hours a week if they do not.71 Earnings spent on childcare costs (of up to £175 per week for one child, or £300 for two or more) are also disregarded in the cases of lone parents working 16 hours a week or
70 No deductions are made for any non-dependant if either the claimant or the claimant’s partner is blind, or receives attendance allowance or the care component of disability living allowance. No deductions are made for an individual non-dependant when the non-dependant is a full-time student, or under 25 and on IS or income-based JSA, or in a range of other situations. A single deduction is made for non-dependent couples. For further details, see pages 60–5 of CPAG 2016/17. 71 The £17.10 disregard is also applicable to claimants who work at least 16 hours per week if their housing benefit includes the disability premium or the work-related activity or support component. For more details, see page 265 of CPAG 2016/17.

© Institute for Fiscal Studies, 2016
34
more and of couples who both work 16 hours a week or more.72 Since October 2009, child benefit is disregarded in the calculation of income for housing benefit, but tax credits are counted as income.
Table 4.4.2. ‘Applicable amounts’ for housing benefit, £ per week
Personal allowance – single person: Under 25 57.90a Aged 25 or over 73.10b
Qualifies for pension credit but under 65
155.60
Aged 65 or over 168.70
Personal allowance – couple: Both aged 16–17 87.50 One or both aged 18 or over 114.85c One or both attained pension credit
qualifying age but both under 65 237.55
One or both aged 65+ 252.30
Personal allowance – child: Under 20 66.90
Premiums: Family-related: Familyd 17.45
Family (lone parent)e 22.20 Single/Couple
Disability-related: Disabled child (each) 60.06 Disability 32.25/45.95
Enhanced disability:f child (each) 24.43 adult 15.75/22.60
Severe disabilityg 61.85/123.70 Carer 34.60/69.20h
ESA components:i Work-related activity 29.05
Support 36.20 a This is also the allowance for lone parents aged under 18. b This is also the allowance for those on main phase ESA (including lone parents) and for lone parents aged 18 or
over. c This is also the allowance for those on main phase ESA. d Since May 2016, the family premium has been unavailable to new claimants. For claims that were made before
this date, the family premium is payable if there are any dependent children born before 1 May 2016 in the household.
e The lone-parent premium is only available to lone parents with dependent children who claimed before 5 April 1998.
f The enhanced disability premium is payable where the claimant or a family member receives the highest rate of disability living allowance (care component) and is aged 60 or below.
g The severe disability premium is paid to those receiving either of the two highest rates of the care component of disability living allowance who have no one living with them to care for them. The couple rate only applies when both partners qualify.
h The couple rate only applies when both partners qualify. i See Section 4.6.1 for details on eligibility.
72 This also applies to couples where one works at least 16 hours per week and the other is incapacitated, in hospital or in prison.

© Institute for Fiscal Studies, 2016
35
If the claimant and their partner together have capital that exceeds the upper limit (£16,000), no HB is normally payable. But for individuals receiving the guarantee credit element of pension credit, capital is fully ignored. In all cases, capital under the lower limit – £10,000 for those above the female state pension age or living in a care home, and £6,000 for others – is ignored. Between the two limits, every £500 of capital over the lower limit is assumed to generate £1 of income.
Rent restrictions apply if the claimant is not a local authority tenant. For most private sector tenants, the eligible rent is the lower of the local housing allowance (LHA) rate applicable to the claimant and the ‘cap rent’. The ‘cap rent’ is the rent that the claimant is liable to pay for their home. For tenants renting mobile homes, those whose rent includes board and attendance, and some housing association tenants, eligible rents are restricted according to the local reference rent rules.73 A rent officer determines the claim-related rent (what the landlord could reasonably expect on the open market) and the local reference rent (the mid-point of reasonable market rents in the local area). The claimant’s eligible rent is then the lower of these two determinations. There is transitional protection for those whose claims began before the introduction of new restrictions, i.e. HB is not cut for existing claims.
Growth in the private rented sector, rising rents in that sector and falls in real earnings have combined to cause a significant increase in the amount spent on housing benefit over the last decade. This has been partly offset by a number of cuts in generosity.
Several changes to LHA rules came into effect in April 2011. They are: setting LHA rates at the 30th percentile of local private sector rents rather than the median (50th percentile); removal of up to £15 per week over and above rent that claimants were entitled to if their rent was less than their LHA rate; abolition of the five-bedroom LHA rate; national caps on LHA rates at £250, £250, £290, £340 and £400 per week for the shared accommodation, one-bedroom, two-bedroom, three-bedroom and four-bedroom rates respectively; and, in January 2012, extension of the coverage of the shared accommodation rate to include most single adults without dependent children aged between 25 and 34 not living in shared accommodation.
LHA rates stopped being uprated according to changes in local rents in 2013 and were instead indexed to CPI inflation. The rate will be set at the 30th percentile of local rents, however, if this is lower than the CPI-uprated rate. This will tend to reduce the generosity of HB, with the greatest reductions in areas that experience the fastest rent growth. The policy also fixes relative LHA rates across the country at 2012–13 levels, which means that geographical differences in rent support will, over time, become less closely linked to geographical differences in the costs of renting. In
73 Whether a claimant’s eligible rent is subject to restriction to the local reference rent is partially determined by whether their local authority considers their rent to be unreasonably high. For details, see page 392 of CPAG 2016/17.
© Institute for Fiscal Studies, 2016
36
practice, the CPI indexation rules have only been applied once since their introduction: in 2014–15 and 2015–16, increases in LHA rates were limited to 1%, and it was announced in July 2015 that LHA rates will be frozen from 2016–17 until 2020.
In April 2013, the government introduced rent restrictions for social housing tenants living in properties that exceeded certain size criteria, branded variously as the introduction of a ‘bedroom tax’ or the removal of a ‘spare room subsidy’. The restriction means that claimants in properties that are deemed to have more bedrooms than the claimant’s circumstances require experience a reduction in the maximum rent used to calculate their HB entitlement. The reduction is 14% for claimants in properties with one extra bedroom and 25% for claimants in properties with two or more extra bedrooms.
In theory, this policy should achieve a more efficient allocation of the social housing stock as it discourages ‘under-occupancy’. However, this assumes that tenants are able to move into other properties in the social sector that comply with the house size criteria. In practice, it has been reported that a shortage of small properties makes it impossible for all social tenants to avoid violating the size criteria. For example, the National Housing Federation estimates that the number of social sector tenants ‘under-occupying’ two-bedroom homes in England is more than double the number of available one-bedroom properties.74 This suggests the policy may penalise tenants who do not have the option of moving to a more appropriately sized property.
Changes to housing benefit introduced between 2010 and 2015 saved an estimated £2.5 billion in 2015–16 relative to the 2010 system.75 In more recent attempts to curb HB spending, the government is reducing rents paid by tenants in social housing in England by 1% a year between 2016 and 2020 and will extend LHA rates to social sector tenancies from 2018.76
Roughly 4.7 million people received HB in May 2016, of whom 61% also received IS, income-based JSA, income-related ESA or the guarantee credit of pension credit (and were therefore entitled to maximum HB).77 Expenditure on HB in 2015–16 was an estimated £24.3 billion.
74 See http://www.bbc.co.uk/news/uk-politics-26148099.
75 Source: A. Hood and D. Phillips, ‘Benefit spending and reforms: the coalition government’s record’, IFS Briefing Note BN160, 2015, https://www.ifs.org.uk/uploads/publications/bns/BN160.pdf.
76 Further details can be found at https://www.gov.uk/guidance/welfare-reform-and-work-act-2016-social-rent-reduction.
77 Source: Department for Work and Pensions, Housing Benefit Caseload Statistics: data to May 2016, https://www.gov.uk/government/statistics/housing-benefit-caseload-statistics.

© Institute for Fiscal Studies, 2016
37
Since April 2013, HB claimants have been subject to the benefit cap.78 If a claimant’s income from certain specified benefits exceeds the relevant benefit cap level, their HB payments will be reduced to comply with the cap. This policy attempts to ensure that no family receives more on benefits than the average net earnings of a family in work and is discussed in greater detail in Section 2.4.
HB is being replaced by universal credit. Between 2016 and 2018, it will no longer be possible to make a new claim for housing benefit in certain areas, as universal credit is rolled out across the country. DWP currently plans to begin transferring existing HB claimants to universal credit from 2018.79
4.4.3 Discretionary housing payments
Non-taxable, Non-contributory, Means-tested
Discretionary housing payments are payable to those entitled to housing benefit or universal credit who require additional financial assistance as perceived by their local authority. The amount and duration of payments vary. No one has a right to discretionary housing payments, and awards are made by local authorities out of a cash-limited budget. The central government contribution towards discretionary housing payments was increased substantially in 2012 to increase the ability of local authorities to support those affected by the introduction of the benefit cap and the reforms to housing benefit discussed in Section 4.4.2. Government expenditure on discretionary housing payments was around £125 million in 2015–16.
4.4.4 Council tax support
Non-taxable, Non-contributory, Means-tested
Until April 2013, council tax benefit (CTB) allowed low-income households to claim a reduction on their council tax liability. In some cases, CTB covered the entire council tax bill, ensuring the very poorest households did not have to pay any form of local taxation. CTB was administered by local authorities, but eligibility criteria and the level of support were set nationally and the benefit was funded almost entirely by central government. In January 2012, it was being paid to 5.9 million people, making it the most widely-claimed means-tested benefit at the time.80
In April 2013, CTB was abolished and council tax support was devolved to English local authorities and the Scottish and Welsh governments. At the same time, the
78 Housing benefit is not included in the benefit cap for claimants living in certain types of supported accommodation. For more details, see page 1164 of CPAG 2016/17.
79 See Section 5.1 of this briefing note or chapter 2 of CPAG 2016/17 for more details about the introduction of universal credit.
80 Source: S. Adam and J. Browne, Reforming Council Tax Benefit, IFS Commentary C123, May 2012, https://www.ifs.org.uk/comms/comm123.pdf.

© Institute for Fiscal Studies, 2016
38
government cut the amount of funding for council tax support by 10% (amounting to an annual saving of £500 million). This funding cut was implemented by providing the devolved administrations with 90% of the estimated cost of CTB in each area had the benefit continued to be payable in 2013–14. On top of this, local authorities were required to maintain entitlements for English pensioners at the nationally-set level, implying an even greater cut in funding for the working-age population. The local authorities and national governments were therefore faced with the joint task of designing their own scheme of council tax relief and deciding how to fill the gap in funding while protecting pensioner support.
The Scottish, Welsh and Northern Irish governments chose to maintain support at the same level as under CTB, while most English local authorities made cuts to support. In 2013–14, around 80% of local authorities in England reduced working-age family entitlements and 70% introduced ‘minimum payments’ so that even the poorest households had to pay some of their council tax. Data from 2013–14 show that council tax arrears among working-age recipients of council tax support increased by 10 percentage points in areas where the highest minimum payments were introduced but fell in areas where no minimum payments were introduced.81
Initially, it was planned to incorporate CTB into universal credit as part of government efforts to simplify the benefits system and ‘make work pay’. The devolution of council tax support appears to go against both these aims. The patchwork of bespoke council tax support schemes caused by devolution has undoubtedly increased the complexity of the benefit system and imposed extra administrative burdens on local authorities. Furthermore, keeping council tax support separate from other benefits means individuals may end up being subject to overlapping means tests and face very weak work incentives as a result.
Central government funding for council tax support is now included in general revenue support for local authorities and the devolved governments, and is therefore no longer classified as social security spending. Since these grants have been subject to further cuts, it is not easy to determine the exact amount spent on council tax support in 2015–16. Although local governments individually document annual awards of council tax support, there is no centralised record of these at a national level, which makes it hard to identify how many households are in receipt of support.
81 Source: C. Belfield, J. Cribb, A. Hood and R. Joyce, Living Standards, Poverty and Inequality in the UK: 2015, IFS Report R107, 2015, https://www.ifs.org.uk/uploads/publications/comms/R107.pdf.

© Institute for Fiscal Studies, 2016
39
4.4.5 Funeral payments
Non-taxable, Non-contributory, Means-tested
Funeral payments can be awarded to claimants who are (for good reason) responsible for organising a funeral but who are unable to meet such a large expense. The amount payable covers the costs of burial or cremation, documentation necessary for the release of the deceased’s assets, some travel expenses and up to £700 for other costs (e.g. flowers and funeral director’s fees).
Claimants (or their partners) must be in receipt of income support, income-related ESA, income-based JSA, housing benefit, child tax credit (at a rate exceeding the family element), working tax credit (including a disability element) or pension credit. From April 2013, universal credit was added to the list of qualifying benefits, while council tax benefit was removed (as it has been abolished).
The funeral payments scheme has been criticised as not providing adequate amounts to cover the cost of a funeral. For example, the average award in 2014–15 was £1,375, less than 40% of the estimated average cost of a funeral.82 To address this, access to Social Fund budgeting loans has been expanded to allow easier access to loans for funeral services, although these amounts have to be repaid.
In 2015–16, there were 45,000 applications, with around 29,000 awards (63% of applications). The average award was £1,410, with net expenditure of £39.8 million.83
4.4.6 Cold weather payments
Non-taxable, Non-contributory, Means-tested
Cold weather payments are available to all those who receive pension credit and certain subgroups of those receiving income-related ESA, income-based JSA, income support or universal credit, chiefly those with children who are disabled or under 5.84
The system links all eligible individuals to one of 94 national weather centres. If the daily mean temperature (the average of the maximum and minimum temperatures recorded) at the relevant station is, or is forecast to be, 0°C or below for seven consecutive days, the cold weather payment of £25 (for each seven-day period between 1 November and 31 March) is automatically payable.
82 Source: S. Kennedy, ‘Social Fund funeral payments’, House of Commons Library Briefing Paper 01419, 2016, http://researchbriefings.parliament.uk/ResearchBriefing/Summary/SN01419.
83 Source: Social Fund Annual Report 2015–16, https://www.gov.uk/government/uploads/system/uploads/attachment_data/file/552482/social-fund-annual-report-2015-2016.pdf.
84 For further details, see page 774 of CPAG 2016/17.

© Institute for Fiscal Studies, 2016
40
Clearly, the total cost of this payment is greatly influenced by factors outside the control of the government. For example, in 2013–14, an exceptionally mild winter meant payments were only triggered in one area for one week, resulting in total payments of £27,500.85 This is in contrast to 2010–11, when 17.2 million payments resulted in a cost of £431 million.86 In 2015–16, there were 155,000 payments costing £3.9 million.87
4.5 Benefits for older people
Significant changes to the support for pensioners in recent years mean that individuals who reached state pension age (SPA) on or after 6 April 2016 face a considerably different pension system from the one their slightly older peers face. For individuals who reached SPA before 6 April 2016, the basic state pension (BSP) contains both contributory and non-contributory elements. An earnings-related element is available through additional pension schemes: graduated retirement benefit and the state second pension.88 Pension credit tops up the income of older people to a specified minimum level and improves their incentives to save for retirement. Since 6 April 2016, individuals reaching SPA are subject to the rules of the new single-tier state pension (STP), also known as the flat-rate pension.89 The STP comprises of a single rate of £155.65 per week, provided a claimant has made National Insurance contributions for at least 35 years. The two systems are described and compared in greater detail in Sections 4.5.1–4.5.4. Alongside state pension provision, the Financial Assistance Scheme compensates people who lose their pension provision because their provider unexpectedly shuts down. There are also some other benefits exclusively for older people; winter fuel payments and concessionary television licences are examples.
85 Source: S. Kennedy and E. Parkin, ‘Cold weather payments for winter 2015/16’, House of Commons Library Briefing Paper 7454, 2016, http://researchbriefings.parliament.uk/ResearchBriefing/Summary/CBP-7454.
86 Source: Social Fund Annual Report 2010–11, https://www.gov.uk/government/publications/annual-report-by-the-secretary-of-state-for-work-and-pensions-on-the-social-fund-2010-to-2011.
87 Source: Social Fund Annual Report 2015–16, https://www.gov.uk/government/uploads/system/uploads/attachment_data/file/552482/social-fund-annual-report-2015-2016.pdf.
88 The state second pension replaced the State Earnings-Related Pension Scheme (SERPS) in April 2002.
89 The STP rules on inherited rights also apply to spouses and partners of individuals who are subject to the STP system.

© Institute for Fiscal Studies, 2016
41
Benefit T C M Claimants, 2015–16a
Expenditure, 2015–16 (£m)b
4.5.1 Basic state pension Part 12,876,000c 68,111d
4.5.2 Earnings-related state pensions:
Graduated retirement benefit
11,147,000 2,206
SERPS and state second pension (S2P)
10,282,000 18,209
4.5.3 Pension credit 2,074,000e 6,078 4.5.4 Single-tier state pension 0 0
4.5.5 Winter fuel payments 12,260,000 2,080 4.5.6 Over-75s TV licences 4,429,000f 620f 4.5.7 Financial Assistance Scheme Not available 209 T = taxable, C = contributory, M = means-tested a Claimant figures are the average number of claimants for the year 2015–16, unless otherwise stated.
b Figures are estimated out-turns, unless otherwise stated. c Includes all claimants of a contributory state pension, both basic and additional. d Including £68,003 million contributory basic state pension and £108 million non-contributory basic state
pension (Category D). e Including about 709,000 claimants receiving both savings and guarantee credit, 954,000 receiving the
guarantee credit only and 412,000 receiving the savings credit only. f This is a UK figure.
The state pension age
Individuals become eligible for the BSP or the STP when they reach the SPA. Until March 2010, the SPA was 60 for women and 65 for men and had been unchanged since 1948 despite considerable increases in life expectancy. In 1951, for example, a new-born boy was expected to live until age 66.4, while a new-born girl was expected to live until age 71.5. Babies born in 2011, however, are expected to live until age 79.0 for boys and 82.8 for girls.90 Because the state pension is payable for the remainder of a claimant’s life, these large increases in life expectancy have caused sustained growth in the cost of the state pension system. In response to this, the government is currently implementing a programme of SPA changes that first bring the female SPA into line with the current male SPA and then increase the joint SPA to 68.
From April 2010, the pension age for women has been increasing by one month every two months, reaching 63 in April 2016; it will then increase to 65 at a rate of three months in every month. From November 2018, there will be a single SPA for both men and women. The joint SPA will then increase one month in every month from 65 until it reaches 66 in October 2020 and there are currently plans to increase it to 67 between 2026 and 2028 and to 68 between 2044 and 2046.91 The
90 Source: http://visual.ons.gov.uk/how-has-life-expectancy-changed-over-time/.
91 https://www.gov.uk/government/uploads/system/uploads/attachment_data/file/310231/spa-timetable.pdf.

© Institute for Fiscal Studies, 2016
42
government plans for reviews of the SPA to take place every Parliament. The reviews will be based on the principle that people should spend a given proportion of their lives receiving a state pension92 and will aim to give individuals affected by changes to their SPA at least 10 years’ notice.
Evidence suggests that women have responded to the increase in the SPA by staying in the workforce longer: the increase in the female SPA from 60 to 61 caused the employment rate of women aged 60 to increase by 7.3 percentage points.93
4.5.1 Basic state pension
Taxable, Partly contributory, Non-means-tested
The basic state pension (BSP) was introduced in 1948, following the Beveridge Report, with the aim of providing an income for old-age pensioners based upon their record of National Insurance contributions. Originally, the idea was for the BSP to operate on a funded basis, with each generation paying for its own pensions through NICs. This was abandoned immediately on introduction so that the pension could be made payable to the existing generation of pensioners. This left the current ‘pay-as-you-go’ pension system, whereby the pensions paid out to the generation currently in retirement are funded from general government revenues.
There are currently three categories of state pension: Category A based on the individual’s own National Insurance contribution record; Category B based on the NIC record of their spouse or civil partner or late spouse or civil partner; and Category D for those over 80 who are not entitled to any state pension. The rates applicable to the different categories are listed in Table 4.5.1. For example, if only one member of a couple has sufficient NICs (see below), the other spouse or civil partner will be entitled to £71.50.94 (The latter can, of course, claim Category A BSP based on his/her own NICs if that is higher than the lower rate in Category B.) The spouse or partner will inherit the full amount (£119.30 per week) if the contributor has died. The less generous Category D pension is non-contributory, and it applies if this is more than the entitlement based on the individual’s own contribution record.
92 As part of the 2013 Autumn Statement, the Chancellor announced that the government believes that people should expect to spend up to one-third of their adult life receiving state pension. This implies that the increase of the SPA to 68 would be brought forward to the mid 2030s and the increase to 69 would occur in the late 2040s. For more information, see https://www.gov.uk/government/policies/reviewing-the-state-pension-age.
93 Source: J. Cribb, C. Emmerson and G. Tetlow, ‘Incentives, shocks or signals: labour supply effects of increasing the female state pension age in the UK’, IFS Working Paper 13/03, January 2014, https://www.ifs.org.uk/publications/6622.
94 Prior to 6 April 2010, it was not possible for married men and female civil partners to claim state pensions based on the contribution records of their wives/partners. Before that date, married women could not claim state pensions based on their husband’s NIC records either, if husbands were deferring their claims. Thus, the new rules extended coverage to include some married individuals and civil partners who reached pension age before 6 April 2010 but were not receiving BSP.

© Institute for Fiscal Studies, 2016
43
Table 4.5.1. Current rates of basic state pension, £ per week
Category A 119.30 Category B for widow / widower / surviving civil partner 119.30 Category B for spouse / civil partner 71.50 Category D 71.50
A new single contribution condition was introduced for Category A and B retirement pensions from 6 April 2010.95 In order to qualify for the full BSP, the contributor must have paid sufficient Class 1, 2 or 3 NICs, or received NI credits, for at least 30 years. If the condition is met for at least one year but fewer than 30 years, proportional reductions of the BSP will be made. Individuals may get NI credits when looking for a job, claiming certain state benefits or caring for someone. Thus, the new rules have made it easier for individuals, especially women with children, to qualify for a full BSP.
Individuals can choose to defer receipt of the BSP in return for a higher rate of pension. From April 2005, the rules became more generous: an individual can defer pension payments for as long as they like, as compared with a maximum of five years before then. If an individual puts off claiming their state pension for at least 12 months, they can choose one of two options when they do finally claim. The first option is to earn extra state pension at 1% for every five weeks they put off claiming. The second option is a one-off taxable lump-sum payment based on the amount of normal weekly state pension they would have received, plus interest added each week and compounded.96 Individuals then also get their state pension when they claim it, paid at the normal rate. If an individual is claiming a means-tested benefit while deferring their pension, they do not build up any additional entitlement.
Both of these options use any additional state pension (see Section 4.5.2) that the individual is eligible to receive in calculating their higher state pension or lump-sum payment.
Until the early 1970s, the level of the BSP was uprated on an ad hoc basis, but by more than enough to keep pace with increases in average earnings. It was then formally linked to the faster of growth in prices or growth in earnings and remained so until 1981, when it was formally linked to price inflation. The value of the BSP relative to earnings has therefore changed considerably over time, from just under 14% when it was first introduced, before getting as high as 20% in the early 1980s. 95 The new rule applies to those reaching pension age on or after 6 April 2010. It applies to Category B only for widows, widowers and surviving civil partners, and on the condition that the contributor had not reached pension age before 6 April 2010 and died after that date. 96 The compounded rate will be 2 percentage points above the Bank of England’s base rate (so, as the base rate is currently 0.25%, the annual rate of return is 2.25%). As the Bank of England base rate may change from time to time, the rate of interest used to calculate the lump sum could also change.

© Institute for Fiscal Studies, 2016
44
The BSP is now subject to a ‘triple lock’ whereby it is increased every year by the highest of growth in average earnings, CPI inflation or 2.5%.
Costing over £68 billion and received by about 12.9 million pensioners in 2015–16, the BSP is the largest single benefit, constituting approximately 32% of expenditure on all benefits and tax credits. The Christmas bonus is payable with BSP.
The BSP has been replaced by the single-tier pension (see Section 4.5.4). The BSP remains payable to individuals who reached the SPA before 6 April 2016 but is closed to those who reached the SPA on or after this date.
4.5.2 Earnings-related state pensions
Taxable, Contributory, Non-means-tested
Graduated retirement benefit
The graduated retirement benefit (GRB) scheme operated between April 1961 and April 1975. It involved an earnings-related element to NICs, on top of the then standard flat-rate contribution. This was designed to entitle individuals to an earnings-related element to their state pension. Initially, all individuals had to contribute to the scheme. This requirement changed from 5 October 1966, so that individuals who were members of an occupational pension scheme could contribute at a reduced rate, in return for which they received a reduced rate of GRB. Average payments under this scheme are relatively ungenerous, not least because entitlements were frozen in cash terms between April 1961 and November 1978, during which period prices quadrupled. The largest GRB that beneficiaries can receive is around £11 a week.97 Once the claimant reaches the age of 80, they are entitled to an additional 25 pence per week. The GRB is payable even if the individual is not in receipt of the basic state pension. The Christmas bonus is payable with GRB.
In 2015–16, expenditure on the GRB was estimated to be over £2.2 billion, with around 11 million pensioners having some entitlement to the GRB.
State Earnings-Related Pension Scheme
The State Earnings-Related Pension Scheme (SERPS) was introduced in 1978 to provide additional retirement income to around half the workforce, whose employers did not provide an occupational pension scheme. Despite being introduced with cross-party support, perhaps its most noticeable feature is how
97 An individual could have accrued a maximum of 86 units, which are valued at £0.133 each in 2016–17. See R. Crawford. S. Keynes and G. Tetlow, A Single-Tier Pension: What Does It Really Mean?, IFS Report R82, 2013, https://www.ifs.org.uk/publications/6796 and DWP, ‘Benefit and pension rates’, April 2016, https://www.gov.uk/government/uploads/system/uploads/attachment_data/file/524117/benefit-and-pension-rates-from-6-april-2016.pdf.

© Institute for Fiscal Studies, 2016
45
short-lived it was: SERPS was cut dramatically in the Social Security Acts of both 1986 and 1995, before being replaced by the state second pension (S2P) from 2002 (see below for more details). Since April 2002, no future SERPS benefits are being accrued. SERPS is payable even if the claimant is not in receipt of the basic pension.
In order to avoid crowding out existing private pension provision, those who were members of a defined benefit (final salary) pension were allowed to ‘opt out’ of SERPS on its introduction in 1978. In return, their employer made lower National Insurance contributions on their behalf and the individual’s contribution rate was also reduced. In addition, from 1988, individuals were allowed to ‘opt out’ of SERPS into a defined contribution (money purchase) pension scheme, in return for which a proportion of their NICs were paid into the individual’s pension fund. This led to rapid growth in personal pensions, particularly among the young, for whom SERPS represented a worse deal.98
The original SERPS formula took individuals’ earnings in each year and uprated them by average earnings growth to the year before the individual reached state retirement age. The lower of this amount and the annualised upper earnings limit (UEL) in the year before retirement was used in the SERPS calculation, with the value of the annualised lower earnings limit (LEL) in the year prior to retirement then deducted from this figure. The SERPS pension that an individual would receive was equal to one-quarter of this amount, averaged over the best 20 years’ earnings of their life. No SERPS was paid on earnings below the LEL, since it was deemed that these were covered by the basic state pension. No additional SERPS was paid on earnings above the UEL, since those who were contracted out of SERPS only received a rebate on NICs between the LEL and the UEL. Importantly, while contributions were indexed in line with earnings between the year in which they were made and the year of retirement, once in payment SERPS was indexed to price inflation. In addition, surviving partners could inherit the full amount of their spouse’s entitlement.
The 1986 Social Security Act cut future SERPS expenditure (and hence generosity). Individuals will now receive one-fifth rather than one-quarter of their revalued earnings between the UEL and the LEL. In addition, this will be averaged over their entire lifetime, rather than their best 20 years of earnings. These cuts were phased in between April 1999 and April 2009, although earnings from before April 1988 will continue to accrue at the more generous level. The 1986 Social Security Act also reduced the amount that a surviving partner could inherit, from 100% to 50% of their spouse’s pension. Originally, this was to apply to surviving partners from 6 April 2000, but due to government documentation failing to inform individuals of the change, it was delayed until October 2002, and then phased in gradually until
98 For more details, see R. Disney and E. Whitehouse, The Personal Pensions Stampede, IFS Report R40, 1992, http://www.ifs.org.uk/publications/396.

© Institute for Fiscal Studies, 2016
46
October 2010. The maximum percentage that one can inherit thus depends on the date when the deceased person reached pension age.99
The 1995 Social Security Act further reduced the generosity of SERPS. This was the result of two changes. The first was the increase in the state pension age for women, the timetable for which has been accelerated in more recent legislation. Second, there was a technical change to the SERPS formula. This meant that, instead of subtracting the LEL in the year before retirement, now the actual LEL is deducted from earnings before they are uprated by average earnings growth. This is less generous for those retiring now and for several years to come, since the LEL being deducted now is essentially being uprated in line with earnings to the current year while the LEL that was previously being used was increased only in line with prices.
State second pension
From 6 April 2002, SERPS was replaced (for new contributions) by the state second pension (S2P), essentially a more generous version of SERPS. The original formula used to calculate the amount of S2P entitlement was much the same as that used for SERPS, except that it deliberately favoured lower earners. It has been simplified for those retiring after April 2010, but is still quite complex as earnings made before and after that date are treated differently.100 For pre-April-2010 earnings, S2P divides earnings into three bands using the lower earnings threshold (LET) and the upper earnings threshold (UET) in addition to the LEL and the UEL. Those with earnings between the LEL and the LET (along with carers and those with home responsibility101) qualified for S2P worth 40% of the difference between LET and LEL, regardless of actual earnings. An individual qualified for an additional 10% of earnings between the LET and the UET, and an additional 20% of earnings between the UET and the annualised UEL; all thresholds were uprated annually. This structure was at least as generous as the previous SERPS structure and meant lower earners accrued higher entitlements. In April 2009, the UEL was replaced for the purposes of S2P by an upper accrual point (UAP) fixed at the UEL for 2008–09 (£770 per week). A further simplification in April 2010 eliminated the UET, leaving only two earnings bands. While rules regarding earnings between the LEL (£112 per week in 2016–17) and LET remained the same, individuals earning above the LET (£155 per week in 2016–17) now simply qualify for 10% of the amount of actual earnings (up to the UAP) minus LET. April 2012 saw the introduction of two changes. First, it is no longer possible to contract out of S2P to a defined contribution pension scheme. Second,
99 A table of the maximum percentages can be found at https://www.gov.uk/additional-state-pension/further-information. 100 Additionally, earnings of those retiring before April 2009 accrued different entitlements from those of people retiring after that date. Further details can be found in A. Bozio, R. Crawford and G. Tetlow, The History of State Pensions in the UK: 1948 to 2010, IFS Briefing Note BN105, 2010, http://www.ifs.org.uk/bns/bn105.pdf. 101 See the briefing note in the preceding footnote for further details.

© Institute for Fiscal Studies, 2016
47
earnings in the lower band are now treated as producing a flat-rate amount (currently £93.60 each year).
A widow, widower or surviving civil partner can only inherit a maximum of 50% of their spouse/partner’s S2P. There is a cap (£165.60 per week for 2016–17) on the amount of additional pension (both SERPS and S2P) an individual can receive. This cap applies to the sum of their own additional pension and any additional pension inherited.102
In 2015–16, combined expenditure on additional pensions was estimated to be £18.2 billion, with over 10.2 million pensioners having some entitlement.
All the additional state pension schemes discussed have been replaced by the single-tier pension (see Section 4.5.4). They remain payable to individuals who reached the SPA before 6 April 2016 but are closed to those who reached the SPA on or after this date.
State pension top-up scheme
Class 3A National Insurance contributions were introduced in October 2015 as a temporary measure to help people who have not been able to build much additional state pension but reached SPA before the introduction of the single-tier pension.
The Class 3A contributions are intended to complement the existing Class 3 voluntary NICs. Class 3 contributions are used to top up people’s basic state pension; however, there are a number of restrictions upon the extent to which individuals can pay Class 3 for this purpose. The idea is that individuals should consider making Class 3 contributions where that is possible, before taking up Class 3A. By making a lump-sum Class 3A voluntary NIC, pension income can be boosted by a maximum of £25 per week. The amount people will need to pay to receive the additional pension will depend on their age. For example, for every extra £1 per week state pension for life, a 65-year-old would have to make a lump-sum payment of £890, while an 80-year-old would have to make a lump-sum payment of £544.103
Those who may choose to top up their pension include people who accrued relatively little earnings-related pension (SERPS/S2P) – for instance, women who were caring for children or the self-employed who were excluded from such schemes. The Class 3A scheme will only remain open until 5 April 2017. DWP estimates that around 7 million pensioners will have sufficient savings to pay the
102 For more information, see https://www.gov.uk/additional-state-pension/inheriting.
103 Source: https://www.gov.uk/government/uploads/system/uploads/attachment_data/file/298208/state-pension-top-up-pricing-table.csv/preview.

© Institute for Fiscal Studies, 2016
48
new National Insurance contribution and boost their income in retirement and believes the policy will be broadly cost neutral.104
4.5.3 Pension credit
Non-taxable, Non-contributory, Means-tested
Pension credit (PC) was introduced on 6 October 2003 in place of income support (IS) for the pensioner population (also known as the minimum income guarantee, MIG) in an attempt to improve the incentives to save for retirement. Before PC, pensioners with income in excess of the basic state pension but less than the MIG faced a 100% marginal withdrawal rate (£1 of support lost for every additional £1 of their own income). PC reduces this disincentive to save, by introducing a savings credit with a marginal withdrawal rate of 40%.
There are two elements to the PC: guarantee credit and savings credit. Claimants may be entitled to one or both elements. Guarantee credit works much like the MIG, topping up income to a specified minimum level (called the ‘appropriate minimum guarantee’). The appropriate minimum guarantee is the sum of a standard amount and additional amounts for special needs or housing costs (see Table 4.5.2). To receive guarantee credit, claimants must have reached the minimum (women’s) qualifying age for the BSP (see the introduction to Section 4.5) and have family income below the appropriate minimum guarantee. The sum payable is the difference between family income and the appropriate amount. As with other
Table 4.5.2. Current rates of pension credit guarantee credit, £ per week
Standard amount: Single person 155.60 Couple 237.55 Each additional spouse in a
polygamous marriage 81.95
Additional amounts: Severe disability 61.85a
Carer 34.60a
Housing costs Variesb
Transitional Variesc
a Double this amount is payable if both partners qualify. b Housing cost payments are very similar to those for income-based JSA (see Section 4.3.1). Detailed rules on the
calculation of housing costs are discussed in chapter 20 of CPAG 2016/17. c A transitional element is paid to those previously on income support, income-based JSA or income-related ESA
who would be made worse off by moving onto PC. The transitional payment covers the difference between the applicable amount of the previous benefit and the PC appropriate minimum guarantee (aside from a few adjustments).
104 DWP, ‘Class 3A voluntary National Insurance: policy detail’, December 2013, https://www.gov.uk/government/uploads/system/uploads/attachment_data/file/265390/v2_mw__20131211_policy_brief_formatted_FINAL.pdf.

© Institute for Fiscal Studies, 2016
49
means-tested benefits, capital is assumed to yield a flow of income, but the PC rules are more generous: capital below £10,000 is disregarded, and every £500 of capital above this level is assumed to provide £1 of income. There is no upper limit on the amount of capital that can be held and, as usual, owner-occupied housing is excluded from the calculation.
Recipients of guarantee credit are automatically entitled to maximum housing benefit (see Section 4.4.2), health benefits (including free prescriptions, dental treatment and sight tests) and certain Social Fund payments (for instance, funeral payments and cold weather payments). Recipients of the savings credit may also be entitled to some Social Fund payments. The Christmas bonus is payable with the guarantee credit.
Savings credit helps to ameliorate the disincentive effects of the guarantee credit on private saving. Only those with ‘qualifying income’ (excluding guarantee credit) that exceeds the appropriate savings credit threshold (see Table 4.5.3) are eligible.105 Whereas below the threshold an individual faces a 100% withdrawal rate as private income increases, the withdrawal rate is only 40% above that threshold. This withdrawal rate implies the maximum amounts given in Table 4.5.3.
Table 4.5.3. Current rates of pension credit savings credit, £ per week
Savings credit thresholds: Single person 133.82 Couple 212.97
Maximum savings credit: Single person 13.07
Couple 14.75
Withdrawal rate 40% When savings credit was first introduced, the savings credit threshold was set at the same level as the BSP. From 2008, however, the threshold was indexed to earnings while the BSP continued to be indexed to prices. This caused the savings credit threshold to move above the BSP, which reintroduced the 100% withdrawal rate for households who only had a small amount of private income in addition to the BSP.
The standard guarantee credit in PC is usually uprated in line with earnings but was increased by the same cash rise as the full basic state pension between April 2011 and March 2016. The maximum savings credit award was frozen in cash terms between April 2011 and March 2015 and frozen in real terms between April 2015 and March 2016. The single and couple maximum rates were then cut by 12% and 15% respectively in April 2016 to the levels given in Table 4.5.3. 105 The ‘qualifying income’ for calculating entitlements to savings credit is all income that counts for guarantee credit (total income) except a few non-qualifying benefits, such as contributory ESA, incapacity benefit and working tax credit. The ‘total income’ is any income that counts for PC purposes and includes those non-qualifying benefits for savings credit. See page 137 of CPAG 2016/17.

© Institute for Fiscal Studies, 2016
50
Spending on pension credit was around £6.1 billion in 2015–16, and it was claimed by around 2.1 million people.
The savings credit element has been abolished under the new single-tier pension system (see Section 4.5.4). This means that, while pension credit and other means-tested benefits will continue to provide a safety net for lower-income pensioners, the savings credit element will not be available for those who reached SPA on or after 6 April 2016.
4.5.4 Single-tier state pension
Taxable, Contributory, Non-means-tested
The Pensions Act 2014 has overhauled the UK pension system as described in Sections 4.5.1–4.5.3.106 There are currently large differences in the level of state pension income received by different individuals. The single-tier state pension (STP) instead sets a single level of pension support: from 6 April 2016, individuals reaching retirement age will be eligible for a flat-rate state pension of £155.65 per week, provided they have made ‘contributions’ for at least 35 years. For those who have made fewer years of contributions, the single-tier pension will be reduced pro rata. However, individuals who have contributed for less time than the minimum qualifying period (currently set at 10 years) will not receive anything. The legislation that introduced the STP specified it would be uprated in line with earnings. In 2016, it was announced the STP will be uprated according to the ‘triple lock’ currently in place for the basic state pension (see Section 4.5.1) for the remainder of the current parliament.
In addition to introducing a single level of state pension support, the STP system abolishes the pension credit savings credit. The STP is more generous than the BSP and has been intentionally set at a level above the PC minimum income guarantee. Because of this, it is estimated that around 90% of STP claimants will retire with an income greater than the pension credit minimum guarantee.107 This means that the strong disincentives to save created by pension credit will be less important under the new system, potentially justifying the abolition of savings credit. It is also hoped that this will make it clearer what level of pension income an individual can expect to receive and thus help individuals in making decisions about private saving.
The single STP rate abolishes the extra state pension amounts provided by the S2P and its predecessors. Since 6 April 2016, individuals have therefore been unable to reduce their National Insurance contributions by contracting out of the S2P. The new
106 For details of the reforms included in the Pensions Act, see https://www.gov.uk/new-state-pension.
107 Source: DWP, The Single-Tier Pension: A Simple Foundation for Saving, Cm 8528, 2013, https://www.gov.uk/government/uploads/system/uploads/attachment_data/file/181229/single-tier-pension.pdf.
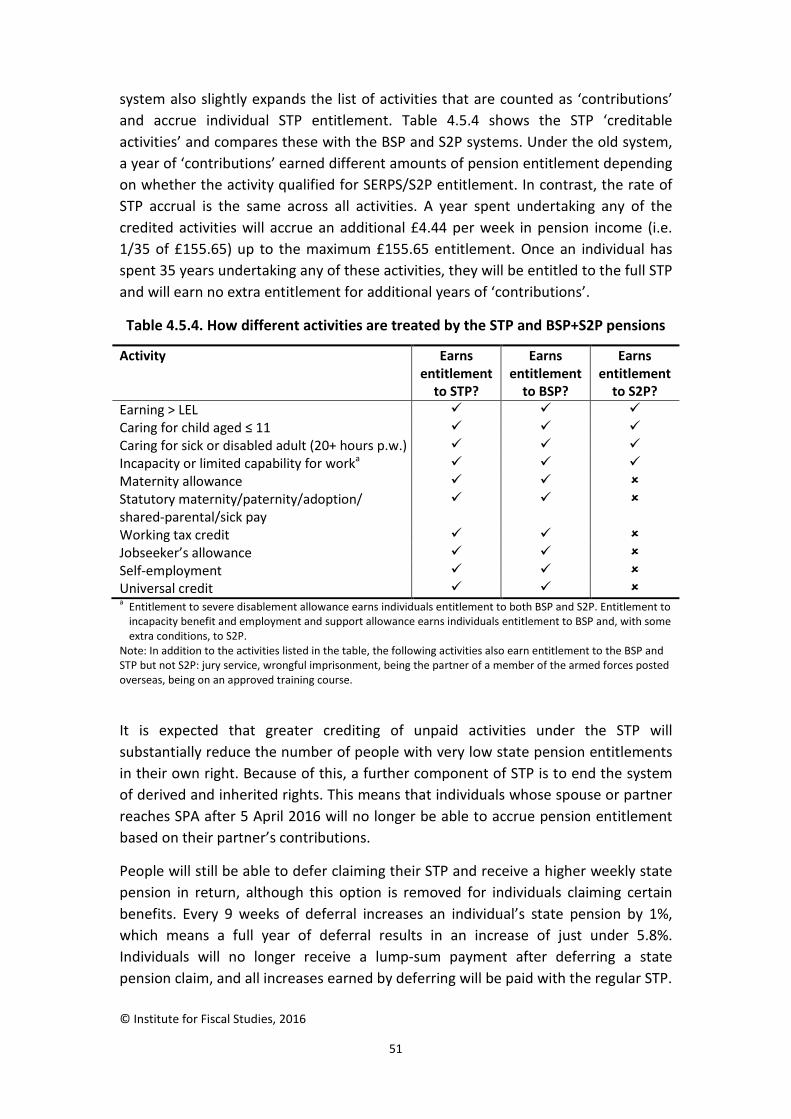
© Institute for Fiscal Studies, 2016
51
system also slightly expands the list of activities that are counted as ‘contributions’ and accrue individual STP entitlement. Table 4.5.4 shows the STP ‘creditable activities’ and compares these with the BSP and S2P systems. Under the old system, a year of ‘contributions’ earned different amounts of pension entitlement depending on whether the activity qualified for SERPS/S2P entitlement. In contrast, the rate of STP accrual is the same across all activities. A year spent undertaking any of the credited activities will accrue an additional £4.44 per week in pension income (i.e. 1/35 of £155.65) up to the maximum £155.65 entitlement. Once an individual has spent 35 years undertaking any of these activities, they will be entitled to the full STP and will earn no extra entitlement for additional years of ‘contributions’.
Table 4.5.4. How different activities are treated by the STP and BSP+S2P pensions
Activity Earns entitlement
to STP?
Earns entitlement
to BSP?
Earns entitlement
to S2P? Earning > LEL Caring for child aged ≤ 11 Caring for sick or disabled adult (20+ hours p.w.) Incapacity or limited capability for worka Maternity allowance Statutory maternity/paternity/adoption/ shared-parental/sick pay
Working tax credit Jobseeker’s allowance Self-employment Universal credit a Entitlement to severe disablement allowance earns individuals entitlement to both BSP and S2P. Entitlement to
incapacity benefit and employment and support allowance earns individuals entitlement to BSP and, with some extra conditions, to S2P.
Note: In addition to the activities listed in the table, the following activities also earn entitlement to the BSP and STP but not S2P: jury service, wrongful imprisonment, being the partner of a member of the armed forces posted overseas, being on an approved training course.
It is expected that greater crediting of unpaid activities under the STP will substantially reduce the number of people with very low state pension entitlements in their own right. Because of this, a further component of STP is to end the system of derived and inherited rights. This means that individuals whose spouse or partner reaches SPA after 5 April 2016 will no longer be able to accrue pension entitlement based on their partner’s contributions.
People will still be able to defer claiming their STP and receive a higher weekly state pension in return, although this option is removed for individuals claiming certain benefits. Every 9 weeks of deferral increases an individual’s state pension by 1%, which means a full year of deferral results in an increase of just under 5.8%. Individuals will no longer receive a lump-sum payment after deferring a state pension claim, and all increases earned by deferring will be paid with the regular STP.

© Institute for Fiscal Studies, 2016
52
The transition to the STP has been designed to implement the new system as quickly as possible. From April 2016, all that will be needed to calculate an individual’s state pension income is their ‘foundation amount’ (defined below), their activities since 2016 and the level of the single-tier pension. This is in contrast to previous reforms to the state pension system, which demanded an understanding of the rules governing previous incarnations of the state pension system and the full history of an individual’s working life.
In April 2016, every working-age individual’s accrued pension entitlement (including entitlement to the BSP, GRB, SERPS and S2P) will be combined to form their ‘current scheme valuation’. The abolition of derived and inherited pension rights, as discussed above, means this will only include entitlement accruing from the individual’s own contributions. The ‘current scheme valuation’ will be compared with the individual’s ‘single-tier valuation’, or the amount of single-tier pension entitlement that they would have accrued if they had spent their working life up to 2016 under the single-tier system instead.108 Entitlement as of 2016 will be the higher of these two valuations, and will form the individual’s ‘foundation amount’. Those who have contracted out in the past will face a ‘contracted-out deduction’ to their valuations under the current and proposed systems, to account for the fact that they will have built up entitlement in a private pension scheme.
From April 2016, up to £155.65 of individuals’ foundation amount entitlement will be earnings indexed, while any state pension entitlement in excess of £155.65 will be increased by CPI inflation (this applies both before and after someone reaches SPA). Under current legislation, SERPS/S2P entitlements are uprated by inflation after the SPA but revalued in line with average earnings growth during working life. Whether specific individuals gain or lose from this change to uprating policy will depend on exactly how much their foundation amount exceeds £155.65 and how many years they have left before they reach the SPA.
Anyone with a foundation amount of £155.65 or more will not be able to accrue any more state pension entitlement. Since the contracted-out deduction reduces the foundation amount of those who contracted out of SERPS/S2P at some point in the past, these individuals are more likely to have foundation amounts under £155.65, which allows them to continue accruing pension entitlement by participating in credited activities. This means such individuals have the potential to accrue a larger total pension than otherwise-identical individuals who had been contracted in, as they will be able to ‘work off’ these contracted-out years in order to qualify for an increased state pension with no loss of private pension from their years spent contracted out.
108 Activities that were previously credited for the BSP will be treated as accruing credits to the single-tier pension.

© Institute for Fiscal Studies, 2016
53
In the short run, many will gain from the new system, with estimates suggesting that 43% of those reaching the state pension age between 6 April 2016 and 5 April 2020 are likely to receive a higher state pension under the new system than under the old system.109 Women and the self-employed are more likely to gain than other groups owing to the expansion of activities that accrue pension entitlement. However, transitional arrangements mean many individuals who reach the SPA over the next four years will not receive the £155.65 amount. Approximately 23% of those reaching SPA over the next four years will receive a greater amount as they have already accrued entitlement to more than the STP under the old state pension arrangements, which will be protected. By contrast, approximately 61% of those reaching SPA over the same period will receive less than the STP. The main reason for this is that many will have contracted out of the S2P and will therefore face deductions on their foundation amount, as described above.
In the long run, the abolition of the S2P and changes to the list of creditable activities are key determinants of whether an individual will gain or lose from the introduction of the STP. Because the STP is more generous than the BSP, individuals who spend long periods undertaking activities that only accrued BSP entitlement will be better off under the STP system. The long-term self-employed and individuals who spend long periods caring for children, for example, will benefit. For individuals who undertake activities that would have previously qualified for BSP and S2P entitlement, however, the STP accrual rate represents a cut in state pension generosity. Since the majority of ‘contributing’ individuals fall into this latter category, the STP will be less generous on average than the system it replaces, slowing the rate at which state pension spending is forecast to grow as a share of GDP.
4.5.5 Winter fuel payments
Non-taxable, Non-contributory, Non-means-tested
Lump-sum winter fuel payments (WFPs) were introduced in 1997 and are available to GB residents over the qualifying age for pension credit on the third Monday of September.110 Although the WFP is a simple cash transfer and does not necessarily have to be spent on heating costs, research has shown that households spend an average of 41% of WFP on fuel while they would spend only 3% if the same income increase came from an ‘unlabelled’ payment.111
109 Source: R. Crawford and G. Tetlow, ‘The new (not yet flat rate) state pension’, IFS Observation, https://www.ifs.org.uk/publications/8224.
110 For 2016-17 these rules mean anyone born on or before 5 May 1953 will be eligible for WFPs.
111 T. Beatty, L. Blow, T. Crossley and C. O’Dea, ‘Cash by any other name? Evidence on labelling from the UK winter fuel payment’, IFS Working Paper WP11/10, 2011, https://www.ifs.org.uk/publications/5603.

© Institute for Fiscal Studies, 2016
54
The payment for 2016–17 will be between £100 and £300, depending on personal circumstances.112 The regular payment is £200 for those below 80 and £300 for those aged 80 or over. When more than one person in a household qualifies, each payment is reduced as long as neither claimant receives pension credit, income-related ESA, income-based JSA or income support. The amount of the reduction varies depending on the age of each qualifying individual in the household, but it ensures that households where all qualifying individuals are aged below 80 receive £200, while households with at least one individual aged 80 or over receive £300. Qualifying individuals who live with a partner who receives one of the listed benefits will receive no WFP as their partner will be paid WFP on their behalf.
Those in residential care homes and not receiving one of the listed benefits are entitled to half the regular payment (£100 if aged 60–79; £150 if aged 80 or over). Those in residential care and receiving one of these benefits do not qualify for WFP. From Autumn 2015, WFP has been withdrawn from qualifying individuals who live in an EEA country with an average temperature higher than that in the warmest region of the UK (i.e. Cyprus, France, Gibraltar, Greece, Malta, Portugal and Spain). This was estimated to save £20 million in 2015–16.113
In 2015–16, approximately 12.3 million WFPs were made, at an estimated cost of £2.1 billion.
4.5.6 Concessionary television licences
Non-taxable, Non-contributory, Non-means-tested
Since November 2000, households including an individual aged 75 or over have not had to pay for a television licence. There are also reduced fees for residents of care homes and for people who are registered blind. Since April 2010, the cost of a colour television licence is £145.50. In 2015–16, over 4.4 million households in the UK benefited from a free TV licence for the over-75s, at a cost of around £620 million.
Under a funding arrangement agreed in 2015, the government is planning to transfer the cost of providing free licences to the BBC. The change will be phased in from 2018–19, with the BBC taking full responsibility from 2020–21.
4.5.7 Financial Assistance Scheme
Taxable, Contributory, Non-means-tested
The Financial Assistance Scheme (FAS) offers help to people who have lost out on their occupational defined benefit pension scheme because their sponsoring
112 Rules on the amount payable are listed at https://www.gov.uk/winter-fuel-payment/what-youll-get. 113 Announced at Spending Round 2013. Source: HM Treasury, Autumn Statement 2013, Cm 8747, 2013, https://www.gov.uk/government/uploads/system/uploads/attachment_data/file/263942/35062_Autumn_Statement_2013.pdf.
© Institute for Fiscal Studies, 2016
55
employer has become insolvent. The scheme was set up under the Pensions Act 2004 along with the similar but distinct Pension Protection Fund (PPF). The FAS is funded by DWP and applies to members of schemes that began to wind up between 1 January 1997 and 5 April 2005, whereas the PPF is funded by a levy on all pensions that are eligible for PPF protection and applies to members of schemes that began to wind up from 6 April 2005.114
To be eligible for a FAS award, individuals must have been a member of a qualifying pension scheme immediately prior to the scheme commencing wind-up. For scheme members who have died but had met (or would have met if they were alive) these conditions, their survivor and dependants may be eligible for an award. The FAS will pay an award of up to 90% of what claimants would have received if their pension scheme had been able to pay out in full the pension that had been accrued before the scheme started to be wound up. This is paid on top of any pension they receive from the scheme. For example, if an individual had accrued a pension of £20,000 a year but their scheme was only able to pay £17,500, the FAS would pay £2,500 a year.115 FAS awards are paid for life and pension accrued from service after 6 April 1997 will be linked to CPI inflation up to a 2.5% limit.
The FAS was originally intended to close in 2006 but was kept open beyond this date to give remaining schemes the chance to apply. The scheme eventually closed to new applicants on 1 September 2016. Approximately 155,000 individuals are covered by the FAS and the scheme made 54,165 payments in 2015–16 at a total cost of £209 million.116
4.6 Benefits for sick and disabled people
The social security system provides a wide range of support for sick and disabled people. Employment and support allowance is now the main benefit for people who are unable to work due to disability. Disability living allowance (DLA) assesses the extent of disability to provide allowances for daily care and/or mobility needs; it is forecast that by 2019–20 all working-age DLA claimants will have moved over to a new personal independence payment, which has different eligibility criteria.117 Other benefits recognise the fact that some sick and disabled people require substantial
114 The FAS also applies to schemes that started winding up after 5 April 2005 but became insolvent before that date. Since the PPF requires no government funding, it is not discussed here in more detail. Further information can be found at http://www.pensionprotectionfund.org.uk/About-Us/Pages/About-Us.aspx.
115 For individuals whose entitlements began between 1 April 2015 and 31 March 2016, FAS protection is capped at £33,890 a year (made up of combined pension and FAS payments). For more information about FAS, see http://www.pensionprotectionfund.org.uk/FAS/howfasworks/Pages/AmIEligible.aspx.
116 Source: Pension Protection Fund Annual Report & Accounts 2015/16, http://www.pensionprotectionfund.org.uk/DocumentLibrary/Documents/ARA_1516.pdf.
117 Source: Office for Budget Responsibility, Welfare Trends Report: June 2015, http://budgetresponsibility.org.uk/docs/dlm_uploads/49754-OBR-Welfare-Accessible-v0.2.pdf.
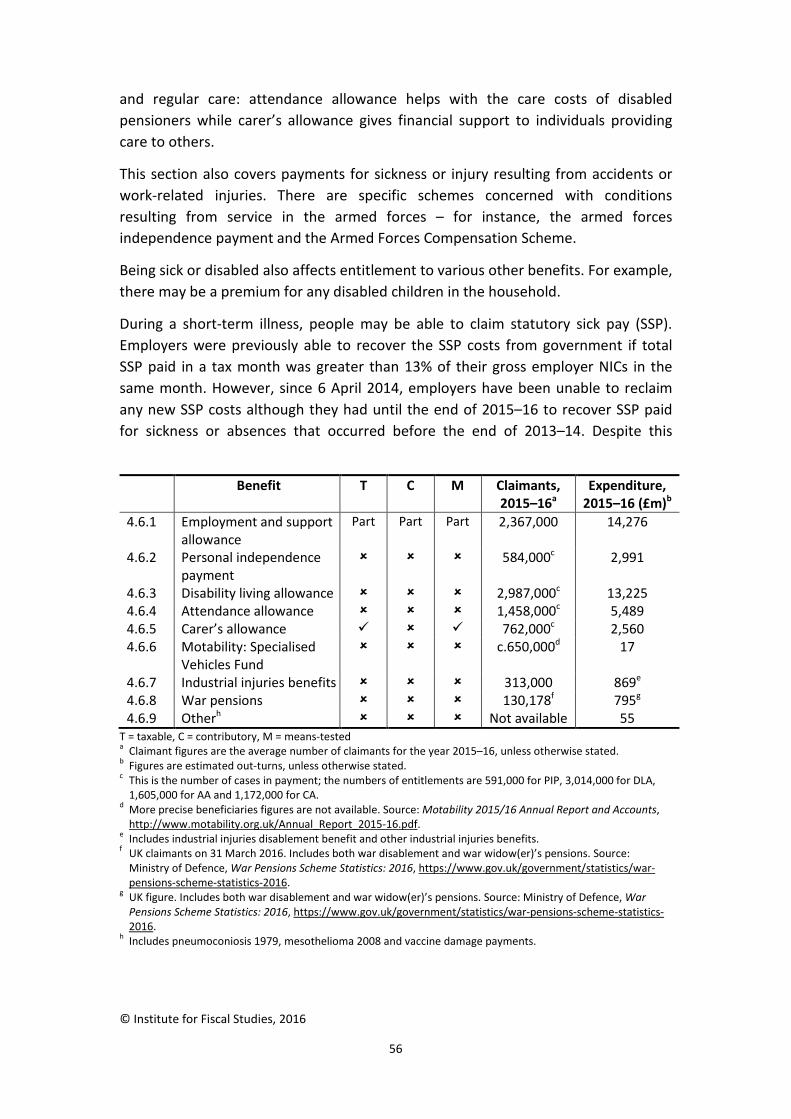
© Institute for Fiscal Studies, 2016
56
and regular care: attendance allowance helps with the care costs of disabled pensioners while carer’s allowance gives financial support to individuals providing care to others.
This section also covers payments for sickness or injury resulting from accidents or work-related injuries. There are specific schemes concerned with conditions resulting from service in the armed forces – for instance, the armed forces independence payment and the Armed Forces Compensation Scheme.
Being sick or disabled also affects entitlement to various other benefits. For example, there may be a premium for any disabled children in the household.
During a short-term illness, people may be able to claim statutory sick pay (SSP). Employers were previously able to recover the SSP costs from government if total SSP paid in a tax month was greater than 13% of their gross employer NICs in the same month. However, since 6 April 2014, employers have been unable to reclaim any new SSP costs although they had until the end of 2015–16 to recover SSP paid for sickness or absences that occurred before the end of 2013–14. Despite this
Benefit T C M Claimants, 2015–16a
Expenditure, 2015–16 (£m)b
4.6.1 Employment and support allowance
Part Part Part 2,367,000 14,276
4.6.2 Personal independence payment
584,000c 2,991
4.6.3 Disability living allowance 2,987,000c 13,225 4.6.4 Attendance allowance 1,458,000c 5,489 4.6.5 Carer’s allowance 762,000c 2,560 4.6.6 Motability: Specialised
Vehicles Fund c.650,000d 17
4.6.7 Industrial injuries benefits 313,000 869e 4.6.8 War pensions 130,178f 795g 4.6.9 Otherh Not available 55
T = taxable, C = contributory, M = means-tested a Claimant figures are the average number of claimants for the year 2015–16, unless otherwise stated.
b Figures are estimated out-turns, unless otherwise stated. c This is the number of cases in payment; the numbers of entitlements are 591,000 for PIP, 3,014,000 for DLA,
1,605,000 for AA and 1,172,000 for CA. d More precise beneficiaries figures are not available. Source: Motability 2015/16 Annual Report and Accounts,
http://www.motability.org.uk/Annual_Report_2015-16.pdf. e Includes industrial injuries disablement benefit and other industrial injuries benefits. f UK claimants on 31 March 2016. Includes both war disablement and war widow(er)’s pensions. Source:
Ministry of Defence, War Pensions Scheme Statistics: 2016, https://www.gov.uk/government/statistics/war-pensions-scheme-statistics-2016.
g UK figure. Includes both war disablement and war widow(er)’s pensions. Source: Ministry of Defence, War Pensions Scheme Statistics: 2016, https://www.gov.uk/government/statistics/war-pensions-scheme-statistics-2016.
h Includes pneumoconiosis 1979, mesothelioma 2008 and vaccine damage payments.

© Institute for Fiscal Studies, 2016
57
window for backdated claims, estimated expenditure on SSP was zero for 2015–16 and therefore SSP is not discussed here in further detail.118
4.6.1 Employment and support allowance
Partially taxable, Partially contributory, Partially means-tested
Employment and support allowance (ESA) has replaced incapacity benefit and disability-related income support for new claimants since October 2008. Like jobseeker’s allowance, there are two forms of ESA: a contributory form and an income-related form. Contributory ESA is only paid to claimants who meet the appropriate National Insurance conditions. Until April 2012, young people were able to claim ‘ESA in youth’ – a form of contributory ESA – without meeting the contribution criteria, but this is no longer available. Income-related ESA is paid to claimants who have not satisfied the contribution criteria but have passed a means test. An increase for partners is included in income-related ESA but not in contributory ESA (see rates in Table 4.6.1). Claimants must be aged 16 or over but under state pension age.
Table 4.6.1. Current rates of employment and support allowance, £ per week
Assessment phase Main phase Single person
Under 25 57.90 73.10 25 or over 73.10 73.10
Lone parent (income-related ESA only)
Under 18 57.90 73.10 18 or over
73.10 73.10
Couple (income-related ESA only) One or both under 18
Both 18 or over Variesa 114.85
Variesb 114.85
a If both members are under 18, the claimant receives £57.90 per week during the assessment phase or £87.50 if they are responsible for a child (or fulfil certain other conditions). If one is under 18 and the other is over 18, there are two rates – £57.90 (if the older of the two is aged 18–24) and £73.10 (if the older member is 25 or over); under certain conditions, the rate may be £114.85.
b If both members are under 18, there is a standard rate of £73.10 and a rate for those who are responsible for a child of £114.85. If only one is under 18, the rate is £73.10; under certain conditions, the rate may be £114.85.
Note: For further details, see pages 218–20 of CPAG 2016/17.
Contributory ESA is taxable whereas income-related ESA is not. Receipt of income-related ESA automatically entitles individuals to free school meals, health benefits (including free prescriptions, dental treatment and sight tests), maximum housing benefit and certain Social Fund payments (including the Sure Start maternity grant and funeral payments). The Christmas bonus is payable with ‘main phase’
118 More information on SSP can be found at https://www.gov.uk/employers-sick-pay/help-with-sick-pay.

© Institute for Fiscal Studies, 2016
58
contributory ESA and ESA cannot be claimed at the same time as income support, JSA or pension credit.
When claimants first apply for ESA, they must go through an ‘assessment phase’ after a seven-day waiting period, which usually lasts for 13 weeks. During the assessment phase for contributory ESA, the claimant is entitled to a basic allowance: £57.90 if under 25 and £73.10 if 25 or over. Entitlements to income-related ESA are calculated in the same way as for income support (see Section 4.4.1), topping up income to a specified level (called the ‘applicable amount’), which is intended to reflect the needs of the claimant’s family. The applicable amount is the sum of personal allowances (which depend on age), premiums (as in Table 4.6.2) and some housing costs (primarily mortgage interest payments). It is possible to receive contributory ESA topped up with income-related ESA in the event that the entitlement for income-related ESA is higher than that for contributory ESA.
Table 4.6.2. Current premiums for employment and support allowance, £ per week
Components of ESA: Work-related activity component 29.05 Support component 36.20
Premiums (income-related ESA): Pensioner: single
Variesa
couple Variesb Enhanced disability:
single
15.75 couple 22.60
Severe disability 61.85c
Carer 34.60c
a In the assessment phase, this is £82.50 per week. In the main phase, it is £53.45 if the claimant is entitled to the work-related activity component of ESA and £46.30 if they are entitled to the support component.
b In the assessment phase, this is £122.70 per week. In the main phase, it is £93.65 if the couple are entitled to the work-related activity component of ESA and £86.50 if they are entitled to the support component.
c If both partners qualify, the premium is doubled.
The process of medical assessment is called the ‘work capability assessment’ (WCA), which is carried out by an external provider. Its first component is the ‘limited capability for work test’, which determines whether the individual can be awarded ESA or should apply for jobseeker’s allowance instead. The second component of the WCA tests whether the individual has ‘limited capability for work-related activity’. This divides claimants into two groups: the work-related activity group and the support group. After the initial WCA, claimants are reassessed periodically to monitor any changes in their ability to work.
Claimants who have been placed in one of the above two groups receive ‘main phase’ ESA. This includes either the ‘work-related activity component’, which is

© Institute for Fiscal Studies, 2016
59
conditional on attending work-focused interviews, or the ‘support component’, for those deemed unable to work. Some claimants also receive a higher basic allowance on moving to the main phase (see Table 4.6.1). Since April 2012, there has been a one-year limit on contributory ESA for those in the work-related activity group, which includes the 13-week assessment phase.
The process of moving existing claimants onto ESA began in October 2010 and was planned to be completed by April 2014. This deadline was not met due to unexpected delays in the WCA process that led the government to terminate the contract with the external provider, Atos.119 Despite a change in the WCA provider, the migration is still ongoing and in 2015–16 there were 68,000 incapacity benefit claimants. The WCA process has repeatedly been criticised for inadequately assessing ability to work and doubling in cost to £579 million.120
In July 2015, the post-election Budget announced the abolition of the work-related activity component, bringing support for individuals in this group into line with the JSA rate. This change will apply to all new claimants from April 2017 and is expected to save £640 million by 2020–21.121 In October 2016, it was announced that individuals with conditions ‘which can only get worse’ will no longer have to undergo WCA reassessment to continue claiming ESA, although the exact conditions this will cover and the date of the change remain unclear.122
Savings made by the introduction of ESA have been lower than anticipated, leading to repeated upward forecasts in spending.123 In 2015–16, the total expenditure on ESA was estimated at around £14.3 billion, of which £4.5 billion was contribution-based and £9.8 billion was income-based. There were around 2.4 million claimants.
ESA is being replaced by universal credit. Between 2016 and 2018, it will no longer be possible to make a new claim for ESA in certain areas as universal credit is rolled out across the country. DWP currently plans to begin transferring existing ESA claims to universal credit from 2018.124
119 Source: http://www.bbc.co.uk/news/uk-26766345.
120 Source: http://www.bbc.co.uk/news/uk-35256386.
121 Source: HM Treasury, Summer Budget 2015 Policy Costings, July 2015, https://www.gov.uk/government/uploads/system/uploads/attachment_data/file/443195/Policy_costings_summer_budget_2015.pdf.
122 Damian Green’s speech to the Conservative Party Conference 2016, http://press.conservatives.com/post/151336048820/green-speech-to-conservative-party-conference.
123 See chart 2.4 of Office for Budget Responsibility, Welfare Trends Report: June 2015, http://budgetresponsibility.org.uk/docs/dlm_uploads/49754-OBR-Welfare-Accessible-v0.2.pdf.
124 See Section 5.1 of this briefing note or chapter 2 of CPAG 2016/17 for more details about the introduction of universal credit.
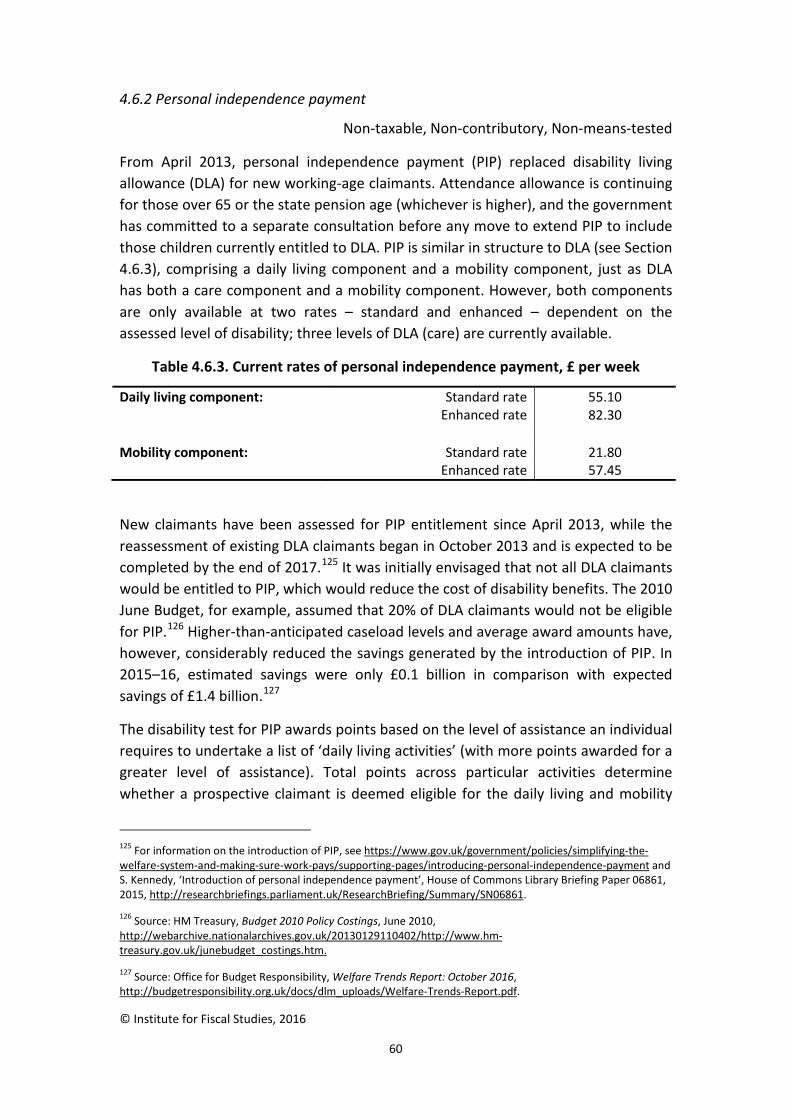
© Institute for Fiscal Studies, 2016
60
4.6.2 Personal independence payment
Non-taxable, Non-contributory, Non-means-tested
From April 2013, personal independence payment (PIP) replaced disability living allowance (DLA) for new working-age claimants. Attendance allowance is continuing for those over 65 or the state pension age (whichever is higher), and the government has committed to a separate consultation before any move to extend PIP to include those children currently entitled to DLA. PIP is similar in structure to DLA (see Section 4.6.3), comprising a daily living component and a mobility component, just as DLA has both a care component and a mobility component. However, both components are only available at two rates – standard and enhanced – dependent on the assessed level of disability; three levels of DLA (care) are currently available.
Table 4.6.3. Current rates of personal independence payment, £ per week
Daily living component: Standard rate 55.10 Enhanced rate 82.30
Mobility component: Standard rate 21.80 Enhanced rate 57.45
New claimants have been assessed for PIP entitlement since April 2013, while the reassessment of existing DLA claimants began in October 2013 and is expected to be completed by the end of 2017.125 It was initially envisaged that not all DLA claimants would be entitled to PIP, which would reduce the cost of disability benefits. The 2010 June Budget, for example, assumed that 20% of DLA claimants would not be eligible for PIP.126 Higher-than-anticipated caseload levels and average award amounts have, however, considerably reduced the savings generated by the introduction of PIP. In 2015–16, estimated savings were only £0.1 billion in comparison with expected savings of £1.4 billion.127
The disability test for PIP awards points based on the level of assistance an individual requires to undertake a list of ‘daily living activities’ (with more points awarded for a greater level of assistance). Total points across particular activities determine whether a prospective claimant is deemed eligible for the daily living and mobility
125 For information on the introduction of PIP, see https://www.gov.uk/government/policies/simplifying-the-welfare-system-and-making-sure-work-pays/supporting-pages/introducing-personal-independence-payment and S. Kennedy, ‘Introduction of personal independence payment’, House of Commons Library Briefing Paper 06861, 2015, http://researchbriefings.parliament.uk/ResearchBriefing/Summary/SN06861.
126 Source: HM Treasury, Budget 2010 Policy Costings, June 2010, http://webarchive.nationalarchives.gov.uk/20130129110402/http://www.hm-treasury.gov.uk/junebudget_costings.htm.
127 Source: Office for Budget Responsibility, Welfare Trends Report: October 2016, http://budgetresponsibility.org.uk/docs/dlm_uploads/Welfare-Trends-Report.pdf.

© Institute for Fiscal Studies, 2016
61
components and whether they will receive these at the standard or enhanced rate. This means that, unlike in DLA, there are no medical conditions that will lead to an automatic entitlement to PIP and the mobility component is allocated on the basis of a claimant’s ability to plan or follow a journey, rather than a simple assessment of their ability to walk unaided. The assumption is that PIP will be awarded for a fixed term, of between 1 and 10 years, rather than being awarded for life. Claimants will automatically be reassessed at the end of their term, as well as during that term if circumstances change.
In the 2016 Budget, the government announced it would halve the number of points that can be awarded for needing to use an aid or appliance to carry out two of the daily living activities. This measure would have been applied to all PIP assessments carried out after January 2017, saving an estimated £1.3 billion by 2020–21.128 However, this proposal was reversed shortly after the Budget.
PIP acts as a passport to disability premiums in a number of means-tested benefits, corresponding to the current role of DLA (see Tables 4.4.1 and 4.4.2). All claimants of PIP are entitled to the disability premium, those claiming the daily living component are entitled to the severe disability premium and those claiming the enhanced daily living component are entitled to the enhanced disability premium. However, there are no such premiums in universal credit. Instead, entitlement to additional support for adults will be assessed through the work capability assessment (currently used for ESA claimants); the government plans to increase the supplement paid to those in the support group to around £72 (from its current level of £36.20) to compensate for the abolition of the other premiums.129 Receipt of the mobility component at the enhanced rate will act as a gateway to the Motability Scheme.
PIP is not counted as income when calculating entitlements to means-tested benefits such as income support, income-based JSA, income-related ESA, housing benefit and pension credit. The Christmas bonus is payable with PIP.
In 2015–16, PIPs were made to 584,000 claimants at a cost of approximately £3 billion.
128 Source: HM Treasury, Budget 2016 Policy Costings, March 2016, https://www.gov.uk/government/uploads/system/uploads/attachment_data/file/508147/PU1912_Policy_Costings_FINAL3.pdf.
129 Source: Universal credit ‘limited capability for work and work-related activity’ element at https://www.gov.uk/government/uploads/system/uploads/attachment_data/file/524117/benefit-and-pension-rates-from-6-april-2016.pdf.

© Institute for Fiscal Studies, 2016
62
4.6.3 Disability living allowance
Non-taxable, Non-contributory, Non-means-tested
New claims for disability living allowance (DLA) can only be made for children under 16. However, many adults who already receive DLA can still renew their claims. By late 2017, the government intends to have moved all existing DLA claimants, who were aged 16–64 on 8 April 2013, to the personal independence payment (see Section 4.6.2).
DLA has two components: a care component and a mobility component.130 Each element is available at different weekly rates depending upon the severity of the claimant’s disability.
Disability living allowance – care component
There are three rates of DLA (care).
For the lowest rate of DLA (care), the claimant must be 16 or over and so disabled that they cannot prepare a cooked main meal for themselves if given the ingredients. Alternatively, they must be so disabled that they require attention from another person for a significant part of each day in connection with bodily functions.
For the middle rate of DLA (care), the claimant must require frequent attention from another person throughout the day or night in connection with bodily functions, or continual daily or prolonged nightly supervision to avoid substantial danger to themselves or others.
For the highest rate of DLA (care), the claimant must be so severely disabled that they require constant supervision or attention throughout the day and night with respect to bodily functions, or to prevent danger to themselves or others.
Table 4.6.4. Current rates of disability living allowance (care), £ per week
Highest rate 82.30 Middle rate 55.10 Lowest rate 21.80
For each rate, the individual must have satisfied the conditions throughout the three months prior to claiming, and they must be likely to continue to satisfy these conditions for at least six months after the claim has been made. Children under the age of 16 must satisfy an additional disability test in order for DLA (care) to be awarded (unless they are terminally ill – see below).
130 The individual only has to make one claim in order to be considered for both components of DLA.

© Institute for Fiscal Studies, 2016
63
Terminally ill claimants with a life expectancy of six months or less are automatically entitled to the highest rate of DLA (care) and do not have to satisfy the qualifying period.
Disability living allowance – mobility component
To qualify for DLA (mobility), claimants must be aged between 5 and 65 (3 and 65 for the higher rate) and must show that they would benefit from taking outdoor journeys. Further, they must satisfy the relevant disability conditions (outlined below). Children under the age of 16 applying for lower-rate DLA (mobility) must also satisfy an additional disability test. There are two rates of DLA (mobility).
To claim lower-rate DLA (mobility), the claimant must show that they cannot walk outside without substantial supervision or guidance.
To claim higher-rate DLA (mobility), the claimant must be (virtually) unable to walk because of their disability, or be deaf and blind, or be severely mentally impaired with severe behavioural problems and qualify for the highest rate of DLA (care).
For both rates of DLA (mobility), the claimant must have satisfied the same three-month qualifying condition and the forward test as for DLA (care). Terminally ill claimants with a life expectancy of six months or less are not guaranteed to receive DLA (mobility), but if they are entitled to it, they do not have to satisfy any qualifying period.
Table 4.6.5. Current rates of disability living allowance (mobility), £ per week
Higher rate 57.45 Lower rate 21.80
Both components of DLA are not payable to people in hospital. The care component is not payable once the claimant has been a resident in a care home for 28 days. DLA is not counted as income when calculating entitlements to means-tested benefits such as income support, income-based JSA, income-related ESA, housing benefit and pension credit. The Christmas bonus is payable with DLA.
On average in 2015–16, over 2.9 million people were receiving DLA. Table 4.6.6 shows the combinations of care and mobility components received by DLA claimants in November 2015. DLA payments are estimated to have cost the exchequer approximately £13.2 billion in 2015–16.

© Institute for Fiscal Studies, 2016
64
Table 4.6.6. Cases in payment of disability living allowance, as at November 2015
Mobility rate None Higher Lower Total
Care
rate
None – 283,820 84,560 368,380 Highest 53,200 492,800 242,100 788,110 Middle 111,360 427,130 507,510 1,046,010 Lowest 199,030 362,080 203,680 764,790
Total 363,600 1,565,820 1,037,860 2,967,280
Note: Numbers do not always sum to totals because of rounding. Source: DWP tabulation tool for disability living allowance, http://83.244.183.180/100pc/dla/tabtool_dla.html.
4.6.4 Attendance allowance
Non-taxable, Non-contributory, Non-means-tested
Attendance allowance (AA) is a benefit paid to individuals over the age of 65 with care or supervision needs. To qualify for AA, the claimant must satisfy the relevant disability conditions for a period of six months before the award.
AA is paid at two rates: the lower rate is paid if the disability conditions for the middle rate of DLA (care) are met (i.e. the claimant has day or night needs) and the higher rate is paid if the conditions for the highest rate of DLA (care) are met (i.e. the claimant has day and night needs). There is no mobility component to AA. AA is not counted as income when calculating entitlements to means-tested benefits such as income support, income-based JSA, income-related ESA, housing benefit and pension credit. The Christmas bonus is payable with AA.
Table 4.6.7. Current rates of attendance allowance, £ per week
Higher rate 82.30 Lower rate 55.10
People with a terminal illness and with a life expectancy of less than six months are automatically eligible for the higher rate of AA and do not have to satisfy the six-month qualifying period.
In 2015–16, an estimated 1.5 million people were receiving AA at an estimated cost of just under £5.5 billion.
4.6.5 Carer’s allowance
Taxable, Non-contributory, Means-tested
Carer’s allowance (CA), previously known as invalid care allowance, is payable to people aged 16 or over who are giving substantial and regular care (usually defined as at least 35 hours per week) to a person receiving the highest or middle rate of DLA
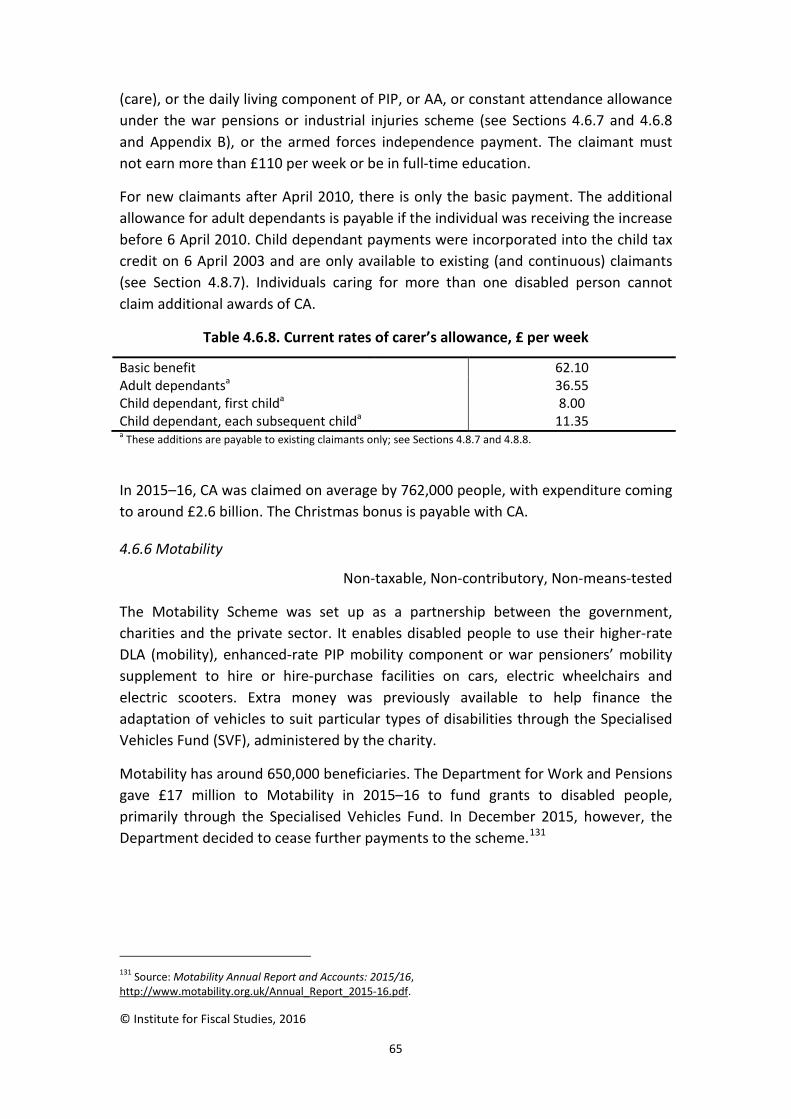
© Institute for Fiscal Studies, 2016
65
(care), or the daily living component of PIP, or AA, or constant attendance allowance under the war pensions or industrial injuries scheme (see Sections 4.6.7 and 4.6.8 and Appendix B), or the armed forces independence payment. The claimant must not earn more than £110 per week or be in full-time education.
For new claimants after April 2010, there is only the basic payment. The additional allowance for adult dependants is payable if the individual was receiving the increase before 6 April 2010. Child dependant payments were incorporated into the child tax credit on 6 April 2003 and are only available to existing (and continuous) claimants (see Section 4.8.7). Individuals caring for more than one disabled person cannot claim additional awards of CA.
Table 4.6.8. Current rates of carer’s allowance, £ per week
Basic benefit 62.10 Adult dependantsa 36.55 Child dependant, first childa 8.00 Child dependant, each subsequent childa 11.35 a These additions are payable to existing claimants only; see Sections 4.8.7 and 4.8.8.
In 2015–16, CA was claimed on average by 762,000 people, with expenditure coming to around £2.6 billion. The Christmas bonus is payable with CA.
4.6.6 Motability
Non-taxable, Non-contributory, Non-means-tested
The Motability Scheme was set up as a partnership between the government, charities and the private sector. It enables disabled people to use their higher-rate DLA (mobility), enhanced-rate PIP mobility component or war pensioners’ mobility supplement to hire or hire-purchase facilities on cars, electric wheelchairs and electric scooters. Extra money was previously available to help finance the adaptation of vehicles to suit particular types of disabilities through the Specialised Vehicles Fund (SVF), administered by the charity.
Motability has around 650,000 beneficiaries. The Department for Work and Pensions gave £17 million to Motability in 2015–16 to fund grants to disabled people, primarily through the Specialised Vehicles Fund. In December 2015, however, the Department decided to cease further payments to the scheme.131
131 Source: Motability Annual Report and Accounts: 2015/16, http://www.motability.org.uk/Annual_Report_2015-16.pdf.

© Institute for Fiscal Studies, 2016
66
4.6.7 Industrial injuries benefits
Non-taxable, Non-contributory, Non-means-tested
Industrial injuries benefits are payable to individuals who have suffered injury in an industrial accident, or who have contracted an industrial disease while at work, and, as a result, experience loss of faculty and are consequently considered to be at least partially disabled. The main benefit is industrial injuries disablement benefit (IIDB). A number of benefits might be paid as increases to IIDB, with the most important being constant attendance allowance and exceptionally severe disablement allowance (see below).
In the case of injury, benefit is payable only for an industrial ‘accident’, such that an injury that accumulates over a number of years – for example, through heavy manual labour – will not normally attract benefit. To receive payment in the case of disease, the claimant must prove that the disease was caused by the occupation itself. In practice, however, onset of disease within a month of last working in the prescribed occupation is normally regarded as sufficient evidence. In addition, a period of 90 days must have elapsed after the onset of the disease, or the time of the accident, before IIDB can be claimed.
The benefit actually paid depends upon the extent of disablement (assessed on a percentage basis).132 To qualify for IIDB, disablement usually has to be at least 14%. Above this level, benefit is paid at the appropriate fraction of the maximum rate, except that disablement of between 14% and 20% counts as 20%, and all assessments above 20% are rounded to the nearest 10% (multiples of 5% are rounded upwards). Thus a person who is 63% disabled would receive 60% of the appropriate maximum rate, while 78% disability attracts 80% of the maximum, and so on. The current rate for someone with maximum (100%) disablement is £168 per week. Increases for dependants are only available if the claimant is also receiving unemployability supplement (US), a benefit which was abolished for new claimants of IIDB in April 1987; US can still be claimed by some war pensioners (see Appendix B).
To be eligible for constant attendance allowance (CAA), the claimant must be entitled to the maximum level of IIDB and must also require constant attendance as a result of their disablement. To receive the normal maximum rate of CAA, the claimant must be entirely (or almost entirely) dependent on such attendance and must be likely to remain so for a prolonged period. For the lower, part-time rate, constant attendance must be required to a ‘substantial extent’ over a prolonged
132 A list of the percentage disablement ascribed to different injuries is given in appendix 2 of DWP, Industrial Injuries Disablement Benefits: Technical Guidance, https://www.gov.uk/government/publications/industrial-injuries-disablement-benefits-technical-guidance/industrial-injuries-disablement-benefits-technical-guidance#appendix-2-prescribed-degrees-of-disablement.

© Institute for Fiscal Studies, 2016
67
period. Exceptionally severe disablement allowance (ESDA) is payable if the individual is in receipt of the exceptional or intermediate rate of CAA and is likely to remain so on a permanent basis. The weekly amount paid is £67.20. See Appendix B for more details.
Table 4.6.9. Current rates of constant attendance allowance, £ per week
Exceptional rate 134.40 Intermediate rate 100.80 Normal maximum rate 67.20 Part-time rate 33.60
In addition, reduced earnings allowance (REA) is payable if the individual had an accident or disease before 1 October 1990 and as a result has been earning less. Retirement allowance (RA) is available for pensioners. For more details on these elements, see Section 4.8.4.
In December 2015, there were 299,720 claimants of industrial injuries disablement benefit, reduced earnings allowance and retirement allowance.133 Spending on industrial injuries benefits (including REA and RA) in 2015–16 was £869 million.
4.6.8 War pensions and AFCS
Non-taxable, Non-contributory, Non-means-tested
War pensions
Individuals who have suffered injury or disability as a result of service in the armed forces before 6 April 2005 are entitled to war pensions, consisting of a number of allowances and supplements (see Appendix B for a detailed breakdown of the various benefits available). Pensions are also available to widows, widowers and dependants of those killed in service (see Section 4.7.5 and Appendix B). As of 31 March 2016, there were 111,228 claimants of the war disablement pension in the UK.134
Armed Forces Compensation Scheme
From 6 April 2005, the War Pension Scheme has been replaced by the Armed Forces Compensation Scheme (AFCS) for injuries and death suffered after that date. Illness and injuries are graded into 15 tariff levels, depending on how severe the conditions 133 This figure includes 49,460 people who were receiving IIDB with REA and RA, 204,280 receiving IIDB only and 45,970 receiving REA and RA only. Source: Department for Work and Pensions, Industrial Injuries Disablement Benefit Quarterly Statistics: Data to December 2015, https://www.gov.uk/government/statistics/industrial-injuries-disablement-benefit-quarterly-statistics-data-to-december-2015. 134 Source: Ministry of Defence, War Pensions Scheme Statistics: 2016, https://www.gov.uk/government/statistics/war-pensions-scheme-statistics-2016.

© Institute for Fiscal Studies, 2016
68
are. A lump sum of at least £1,200 and up to £570,000 is paid according to the tariff level. For those who have lost earnings capacity and already been awarded the lump sum in tariff levels 1 to 11 (the more severe cases), a guaranteed income payment (GIP) is payable for life. The amount of GIP depends on the tariff level and is uprated annually in line with the retail prices index (RPI). As at 31 March 2016, 2,015 individuals were in receipt of a GIP.135
Survivors’ GIPs are paid to surviving partners and children in cases of death caused by the service. See Sections 4.7.4 and 4.7.5 and Appendix B for more details on AFCS and war pensions.
Armed forces independence payment
In April 2013, the government introduced the armed forces independence payment (AFIP) – a new benefit for service and ex-service personnel who have a higher cost of living as a result of being seriously injured during service.
To be eligible for AFIP, individuals must be entitled to a guaranteed income payment (GIP) of 50% or more under the AFCS. This restricts eligibility to those with severe injuries such as loss of a leg or a complex chest injury.136 Since those eligible have already had their disability needs assessed, further assessment is not necessary and the payment will continue for as long as the entitlement to the AFCS GIP continues.
Service personnel and veterans injured before 2005 or compensated for a less serious injury sustained since 2005 are able to apply for personal independence payment in the usual way.
AFIP is payable at a rate of £139.75 per week. About 900 people claimed AFIP in 2015–16, at an estimated cost to the government of nearly £7 million. The Christmas bonus is payable with AFIP.
4.6.9 Other
Non-taxable, Non-contributory, Non-means-tested
Pneumoconiosis 1979
The Pneumoconiosis etc. (Workers’ Compensation) Act 1979 provides lump-sum payments to sufferers of certain dust- and asbestos-related industrial diseases. The
135 Source: Ministry of Defence, UK Armed Forces Compensation Scheme Biannual Statistics: 6 April 2005 to 31 March 2016, June 2016, https://www.gov.uk/government/uploads/system/uploads/attachment_data/file/527041/AFCS_March_2016.pdf.
136 A 50% GIP is payable to individuals with injuries that are classified in tariff levels 1–8 according to the descriptors in schedule 3 of the Armed Forces and Reserve Forces Compensation Scheme Order (AFCS) 2011, http://www.infolaw.co.uk/mod/docs/AFCS-2016-05-31.pdf.

© Institute for Fiscal Studies, 2016
69
diseases included under the Act are pneumoconiosis, diffuse mesothelioma, byssinosis, diffuse pleural thickening, and primary carcinoma of the lung (lung cancer) if accompanied by asbestosis or diffuse pleural thickening.
To be eligible, an individual’s dust-related disease must have been caused by their employment and they must be receiving industrial injuries disablement benefit. Dependants of the sufferer may be able to claim if the sufferer dies, but claims must be made within 12 months of the death.
The one-time payment depends on the age of the claimant when their disease was diagnosed. With maximum disablement, payment ranges from £13,295 for those aged 77 or over at the time of diagnosis to £85,580 (for those aged 37 and under). Meanwhile, payments for surviving dependants range from £3,015 to £44,537, depending upon the level of disability and the age at which the disabled person died.137
It is estimated that expenditure on these payments was £46 million in 2015–16, with 3,520 claimants that year.138
Mesothelioma 2008
Mesothelioma is a cancer of the lining of the lungs or abdomen, and is associated almost exclusively with asbestos; it is usually fatal. A 2008 scheme makes a one-off lump-sum payment to mesothelioma sufferers where there is not an occupational link to the disease. For instance, it may be that the sufferer lived near a factory that used asbestos, or that they were exposed to others who worked around asbestos. Alternatively, they may have been exposed to asbestos while self-employed.
The one-time payment depends on the age of the claimant when their disease was diagnosed. It can range from £13,295 (for those aged 77 or over at the time of diagnosis) to £85,580 (for those aged 37 and under).139 Meanwhile, payments for surviving dependants range from £7,374 to £44,537, depending upon the age at which the disabled person died.140 Claims must be made within 12 months of diagnosis. Sufferers are only eligible if they have not received compensation from an employer or a Ministry of Defence scheme.
137 The Pneumoconiosis etc. Regulations 2014, http://www.legislation.gov.uk/uksi/2014/869/made.
138 Source: DWP, Industrial Injuries Disablement Benefits Quarterly Statistics: Data to December 2015, August 2016, https://www.gov.uk/government/statistics/industrial-injuries-disablement-benefit-quarterly-statistics-data-to-december-2015.
139 Rates can be found at https://www.gov.uk/diffuse-mesothelioma-payment/what-youll-get.
140 S. Kennedy and T. Jarrett, ‘Asbestos-related diseases: payments from the Department for Work and Pensions’, House of Commons Library Standard Note SN/SP/6012, 2014, http://www.parliament.uk/briefing-papers/SN06012.pdf.

© Institute for Fiscal Studies, 2016
70
It is estimated that expenditure on these payments in 2015–16 was over £8 million, with 400 claimants that year.141
Vaccine damage payment
A vaccine damage payment is a one-off tax-free payment of £120,000. It is for people who are severely disabled as a result of a vaccination against a certain disease.142 ‘Severe disablement’ refers to cases where the individual is assessed as at least 60% disabled.
It is estimated that £480,000 was spent on vaccine damage payments in 2015–16.143
4.7 Benefits for bereaved people
When a person dies, the government provides support for their spouse and/or relatives. Bereavement payment is a one-off lump-sum payment to be claimed up to 12 months following a death. Bereavement allowance is a weekly payment that replaced the widow’s pension. If the bereaved person had children or was pregnant at the time of the death, they may be able to claim widowed parent’s allowance, which replaced widowed mother’s allowance. There are separate benefits available to the survivors of people who died as a result of service in the armed forces, namely the war widow(er)’s pension and the survivors’ guaranteed income payment.
After April 2017, the government plans to replace bereavement payment, widowed parent’s allowance and bereavement allowance with a new single system of ‘bereavement support payment’ (see Section 5.5). This will apply for people under state pension age whose spouse or civil partner dies on or after the date the new payment is introduced.
141 Source: DWP, Industrial Injuries Disablement Benefits Quarterly Statistics: December 2015, August 2016, https://www.gov.uk/government/statistics/industrial-injuries-disablement-benefit-quarterly-statistics-data-to-december-2015.
142 For a list of relevant vaccinations, see https://www.gov.uk/vaccine-damage-payment/eligibility.
143 Source: Department for Work and Pensions, ‘Benefit expenditure and caseload tables 2016’, https://www.gov.uk/government/publications/benefit-expenditure-and-caseload-tables-2016.

© Institute for Fiscal Studies, 2016
71
Benefit T C M Claimants, 2015–16
Expenditure, 2015–16 (£m)a
4.7.1 Bereavement payment Not available 569d 4.7.2 Bereavement allowanceb 24,040c
4.7.3 Widowed parent’s allowancee 44,450c
4.7.4 Survivors’ guaranteed income payment in AFCS
623f Not available
4.7.5 War widow(er)’s pension 18,950g 246h T = taxable, C = contributory, M = means-tested a Figures are estimated out-turns, unless otherwise stated. b Bereavement allowance replaced widow’s pension for new claimants from April 2001. However, there were
still over 21,480 claimants of widow’s pension in February 2016. Source: DWP tabulation tool for widow’s allowance, http://83.244.183.180/100pc/wb/tabtool_wb.html.
c As of February 2016. Source: DWP tabulation tool, http://83.244.183.180/100pc/tabtool.html. d Expenditure on both widow(er)s’ and bereavement benefits (not counting war widow(er)’s pension). e Widowed parent’s allowance replaced widowed mother’s allowance from April 2001. However, there were still
almost 1,050 claimants of widowed mother’s allowance in February 2016. Source: DWP tabulation tool for widow’s allowance, http://83.244.183.180/100pc/wb/tabtool_wb.html.
f Figure for 31 March 2016. Source: Ministry of Defence, Armed Forces Compensation Scheme Statistics: Financial Year 2015/16, June 2016, https://www.gov.uk/government/statistics/armed-forces-compensation-scheme-statistics-financial-year-201516.
g Figure for 31 March 2016. Source: Ministry of Defence, War Pensions Scheme Statistics: 2016, https://www.gov.uk/government/publications/war-pensions-scheme-statistics-2016.
h Source: Ministry of Defence, War Pensions Scheme Statistics: 2016, https://www.gov.uk/government/publications/war-pensions-scheme-statistics-2016.
4.7.1 Bereavement payment
Non-taxable, Contributory, Non-means-tested
Bereavement payment is a one-off, lump-sum payment of £2,000 available to widows and widowers (including surviving civil partners) who claim within 12 months of their spouse’s death. Claimants must be under pensionable age when their spouse/partner died, unless the latter was not entitled to Category A state pension (see Section 4.5.1). Furthermore, the late spouse/partner must have actually paid (rather than been credited with) National Insurance contributions in the tax year before their death producing an earnings factor of at least 25 times the lower earnings limit.144 If they died as the result of an industrial illness or accident, this NIC condition is automatically regarded as being satisfied. Bereavement payment can be paid in addition to bereavement allowance or widowed parent’s allowance (see Sections 4.7.2 and 4.7.3).
144 For Class 2 and 3 NICs, this condition is met if 25 contributions are made in the year. For Class 1 NICs, total earnings in the year (excluding those over the upper earnings limit) must be at least 25 times the lower earnings limit.

© Institute for Fiscal Studies, 2016
72
4.7.2 Bereavement allowance
Taxable, Contributory, Non-means-tested
Bereavement allowance (BA) replaced widow’s pension from 9 April 2001 and is payable to men and women widowed on or after this date. Different rules apply to men and women widowed before that date, as described in Section 4.8.5. From 5 December 2005, surviving civil partners are treated the same as widow(er)s for the purposes of the payment of bereavement benefits.
Claimants must be under pensionable age, but aged at least 45, when their spouse died. The late spouse or partner must either have satisfied the NIC conditions or have died as a result of an industrial injury or disease. BA is payable for up to 52 weeks after the date of death, unless the claimant remarries in that time (in which case, entitlement ceases).
BA cannot be claimed at the same time as widowed parent’s allowance (WPA), although recipients of WPA may become entitled to BA once they are no longer eligible to receive WPA.
The basic rate of BA is £112.55 per week for claimants aged 55 or over and where the NIC conditions are satisfied in full. For every year under that age, the claimant receives 7% less, i.e. 93% of the basic rate at age 54 (£104.67 per week), down to 30% of the basic rate at age 45 (£33.77 per week). If the late spouse or partner has made insufficient NICs, then the amount of BA payable is reduced proportionally.
In February 2016, approximately 24,040 people were claiming BA.145
BA is one of the bereavement benefits the government plans to replace with a new single system of ‘bereavement support payment’ (see Section 5.5). This will apply for people under state pension age whose spouse or civil partner dies on or after the date the new payment is introduced (April 2017 according to current plans).
4.7.3 Widowed parent’s allowance
Taxable, Contributory, Non-means-tested
Widowed parent’s allowance (WPA) replaced widowed mother’s allowance from 9 April 2001 and is a weekly benefit payable to men and women who were widowed on or after this date.146 Claimants must be pregnant or have qualifying children (under the same definition as for child benefit – see Section 4.2.1). The late partner
145 DWP tabulation tool for bereavement allowance, http://tabulation-tool.dwp.gov.uk/100pc/bb/tabtool_bb.html.
146 A male widower whose partner died before 9 April 2001 can still receive WPA if he satisfies the conditions on children, age and National Insurance contributions. Women widowed before that date can, however, continue to receive the more generous widowed mother’s allowance.

© Institute for Fiscal Studies, 2016
73
must either have satisfied the NIC conditions (see Section 4.7.1) or have died as a result of an industrial injury or illness. Claimants must be under state pension age.
The basic rate of WPA is £112.55 per week. There is also an additional earnings-related payment if the late partner’s NIC record qualifies. Payment can continue until the claimant no longer receives child benefit. Details of increases for child dependants (now available only to existing claimants) can be found in Section 4.8.7. A lower basic rate of WPA may be payable if the late spouse’s NIC record is insufficient. The Christmas bonus is payable with WPA.
In February 2016, 44,450 people claimed WPA.147 Expenditure on widow(er)s’ and bereavement benefits148 in 2015–16 amounted to approximately £569 million.
WPA is one of the bereavement benefits the government plans to replace with a new single system of ‘bereavement support payment’ (see Section 5.5). This will apply for people under state pension age whose spouse or civil partner dies on or after the date the new payment is introduced (April 2017 according to current plans).
4.7.4 Survivors’ guaranteed income payment in AFCS
Taxable, Non-contributory, Non-means-tested
Survivors’ guaranteed income payment is a component of the Armed Forces Compensation Scheme (AFCS; see Section 4.6.8 and Appendix B) payable to surviving dependants of individuals who died as a result of service in the armed forces on or after 6 April 2005. Those entitled to war pensions for injuries or death suffered prior to that date continue to receive war pensions, as described in Section 4.7.5 and Appendix B.
‘Surviving dependants’ include spouses, civil partners, children, and unmarried partners if a substantial relationship can be demonstrated. Unlike the guaranteed income payment (GIP) paid to former members of the armed forces, survivors’ guaranteed income payment (SGIP) is taxable. The amount of SGIP payable depends on the age when the serviceman or servicewoman died and their salary. The formula can be found in the Armed Forces and Reserve Forces (Compensation Scheme) Order 2005.149 As at 31 March 2016, 623 SGIPs were in payment.150
147 DWP tabulation tool for bereavement allowance, http://tabulation-tool.dwp.gov.uk/100pc/bb/tabtool_bb.html.
148 Excluding war widow(er)’s pensions.
149 Available at http://www.legislation.gov.uk/uksi/2005/439/made. 150 Source: Ministry of Defence, Armed Forces Compensation Scheme Statistics: Financial Year 2015/16, June 2016, https://www.gov.uk/government/statistics/armed-forces-compensation-scheme-statistics-financial-year-201516.
© Institute for Fiscal Studies, 2016
74
4.7.5 War widow(er)’s pension
Non-taxable, Non-contributory, Non-means-tested
The war widow(er)’s pension (WWP) is payable to widow(er)s of those who have died as a result of service in the armed forces before 6 April 2005. Widow(er)s of war pensioners can also claim if their spouse received constant attendance allowance (see Appendix B) at the time of their death, or was assessed as at least 80% disabled and in receipt of the unemployability supplement of the war disablement pension (see Appendix B) at the time of their death. Payment is normally for life unless the widow or widower remarries.
The basic WWP is payable at two rates. The higher rate is paid if the claimant is aged 40 or over, or is aged under 40 but has children or is unable to support themselves financially. It is also automatically payable to all claimants whose spouses were ranked above Major (or equivalent). Childless claimants under the age of 40 receive the lower rate (until they reach 40, whereupon they graduate to the higher rate). WWP rates vary according to the rank of the late spouse. Full details of rates payable can be found in Table B.1 in Appendix B.
Additional payments are made for dependent children and for recipients reaching the ages of 65, 70 and 80. WWP is not payable in addition to a contributory widow’s pension or bereavement allowance (see Section 4.7.2), but it can be paid with a basic state pension (see Section 4.5.1) earned by the widow(er)’s own contributions. The Christmas bonus is payable with WWP.
A number of other groups are also entitled to a war pension. These include unmarried dependants who lived as a spouse with the deceased, child orphans and infirm adult orphans.
As of 31 March 2016, 18,950 widow(er)s were claiming WWP, with 15 claimants of war orphan’s or war parent’s pension and 254 claimants only receiving the child allowance.151 Total UK expenditure on all war pensions was £794.8 million in 2015–16.152
151 Source: Ministry of Defence, War Pensions Scheme Statistics: 2016, https://www.gov.uk/government/publications/war-pensions-scheme-statistics-2016.
152 Source: Ministry of Defence, Annual Report and Accounts 2015-2016, https://www.gov.uk/government/uploads/system/uploads/attachment_data/file/558559/MoD_AR16.pdf.

© Institute for Fiscal Studies, 2016
75
4.8 Benefits available only to existing claimants
There are several benefits that are no longer open for new applications. However, the government continues to honour existing claims and therefore still incurs expenditure on these benefits. Over time, it is expected that the number of claimants and hence spending will fall, as entitlements cease or claimants are rolled onto other benefits.
Benefits that are being replaced by universal credit are no longer available to new single claimants in areas where the roll-out of universal credit has been completed. However, since these benefits are still open to new claimants in certain areas and those who are in couples, they are not discussed here. Further information on universal credit is provided in Section 5.1.
Benefit T C M Claimants, 2015–16a
Expenditure, 2015–16 (£m)b
4.8.1 Incapacity benefit Part Part 68,000 75 4.8.2 Severe disablement
allowance 122,000 464
4.8.3 Independent Living Fund 15,954c 66c 4.8.4 Elements of industrial
injuries benefits 95,430d Not available
4.8.5 Widow’s pension and widowed mother’s allowance
22,530e Not availablef
4.8.6 Industrial death benefit 5,000 28 4.8.7 Child-related increases 18,400g 4.8.8 Adult dependency increases 4.8.9 Housing benefit premiums T = taxable, C = contributory, M = means-tested
a Claimant figures are the average number of claimants for the year 2015–16, unless otherwise stated.
b Figures are estimated out-turns unless otherwise stated. c Responsibility and funding for ILF users was transferred to local authorities in England and the devolved
administrations in Scotland, Wales and Northern Ireland on 1 July 2015. The figures give the number of individuals in receipt of payment as at 30 June 2015 and total expenditure for the 6 months to 30 September 2015. Source: Independent Living Fund, Report and Accounts for the period 1 April 2015 to 30 September 2015, https://www.gov.uk/government/uploads/system/uploads/attachment_data/file/493439/53543_HC_591_Accessible.pdf.
d Claimants of reduced earnings allowance, as of December 2015. Includes 45,970 claiming REA or RA only and 49,460 claiming it in conjunction with industrial injuries disablement benefit. Source: DWP, Industrial Injuries Disablement Benefit Quarterly Statistics: Data to December 2015, https://www.gov.uk/government/statistics/industrial-injuries-disablement-benefit-quarterly-statistics-data-to-december-2015.
e As of February 2016. Including 21,480 receiving widow’s pension and 1,050 receiving widowed mother’s allowance. Source: DWP tabulation tool for widow’s allowance, http://tabulation-tool.dwp.gov.uk/100pc/wb/tabtool_wb.html.
f Spending on widow’s pension and widowed mother’s allowance is included in the £569 million total spending on bereavement payments (see Section 4.7).
g As of April 2016. Source: HMRC, Child and Working Tax Credits Statistics: April 2016, https://www.gov.uk/government/statistics/personal-tax-credits-provisional-statistics-2013-to-2009.

© Institute for Fiscal Studies, 2016
76
4.8.1 Incapacity benefit
Partly taxable, Contributory, Partly means-tested
Incapacity benefit (IB) was payable to individuals who cannot work due to sickness or disability. It was replaced by employment and support allowance (ESA; see Section 4.6.1) for all new claimants from 27 October 2008.153 Existing IB claimants continue to receive the benefit until they are reassessed. The outcome of this reassessment then determines the type of ESA their claim is transferred to. The transfer of existing claimants onto ESA began in October 2010 and was due to be completed by April 2014. Delays in conducting the capability assessments, as discussed in Section 4.6.1, mean this deadline was not met and in 2015–16 there were still over 68,000 claimants of IB.
To qualify for IB, claimants must be incapable of work. The claimant must satisfy the ‘personal capability assessment’, which tests ability to perform a range of activities. Claimants of IB are usually exempt from the personal capability assessment if they are in receipt of another benefit related to some severe condition, such as the highest rate of the care component of disability living allowance (DLA; see Section 4.6.3).
Entitlement to IB requires that the claimant has paid or been credited with enough National Insurance contributions, with exceptions applicable to some widows and widowers and those who became incapable of work in youth.154 IB claimants must be at least 16 years old; for the short-term rates, they cannot be more than five years above state pension age; for the long-term rate, they cannot be above state pension age.
IB rates previously varied according to how long the claimant had been receiving the benefit (see Table 4.8.1). By 2015–16, all IB claimants had been on the benefit for over a year and so were entitled to the (taxable) long-term rate. Recipients of the long-term rate may be entitled to an age-related addition to their benefit, depending on their age when entitlement to IB or statutory sick pay began. Since 6 April 2001, there has been a 50% withdrawal rate of IB for certain pension income above £85 a week.155
In 2015–16, total expenditure on IB was an estimated £75 million, with about 68,000 cases in payment. Recipients of long-term IB are entitled to the Christmas bonus.
153 The Welfare Reform Act 2007, http://www.opsi.gov.uk/Acts/acts2007/pdf/ukpga_20070005_en.pdf. 154 Individuals under the age of 20 (25 with a spell in full-time education), who may not be able to fulfil the NIC requirements for IB eligibility, may still be entitled to claim. 155 Details on the reduction of IB for pension payments can be found on page 678 of CPAG 2013/14.

© Institute for Fiscal Studies, 2016
77
Table 4.8.1. Current long-term rates of incapacity benefit, £ per week
Claimant under pensionable age
Claimant over pensionable age
Short-term IB (lower rate) Standard 79.45 101.10 Increase for dependants: Adulta 47.65 58.90 Short-term IB (higher rate) Standard 94.05 105.35 Increase for dependants: Adulta 47.65 58.90 Long-term IB Standard 105.35 – Increase for dependants: Adulta 61.20 – Age-related addition: Under 35 11.15 n/a
Under 45 6.20 n/a a The adult dependant increase is not paid if, in the previous week, the dependant’s earnings were over £73.10.
Lower limits apply if the dependent adult does not live with the claimant. Note: Increases for child dependants have, since 6 April 2003, been replaced by child tax credit (CTC) for all new claimants; however, existing claimants may still be entitled to claim these additions via IB rather than CTC (see Section 4.8.7). For more information on eligibility for child and adult additions, see pages 653–4 of CPAG 2016/17.
4.8.2 Severe disablement allowance
Non-taxable, Non-contributory, Non-means-tested
Severe disablement allowance (SDA) was payable to individuals who are incapable of work but were unable to claim incapacity benefit because they failed to satisfy the National Insurance contribution conditions. It has been abolished for new claimants since 6 April 2001. However, people who were entitled to SDA before that date may continue to claim it. Recipients of SDA are entitled to the Christmas bonus.
From 31 January 2011, a claimant cannot re-qualify for SDA after a break in their entitlement because all new claims for SDA are treated as claims for employment and support allowance (ESA). Apart from SDA claimants who reached state pension age on or before 6 April 2014, the government has been reassessing SDA claimants, moving those who qualify onto ESA.
The capability tests to determine eligibility for SDA are the same as those for incapacity benefit (see Section 4.8.1), with people claiming SDA prior to 12 April 1995 exempt from the personal capability assessment. Three groups of people can qualify for SDA (the qualifying conditions must have been met prior to 6 April 2001):
• those who are incapable of work for a consecutive 28-week period that began on or before the claimant’s 20th birthday;
• those who have been incapable of work for a consecutive 28-week period and are at least 80% disabled (including registered blind people);

© Institute for Fiscal Studies, 2016
78
• those who were entitled to claim non-contributory invalidity pension before November 1984.
Claimants must be aged between 16 and 65, although there is no upper limit on the age at which entitlement can continue once an award has been made. Claimants under the age of 20 on 6 April 2001 were transferred to long-term incapacity benefit by 6 April 2002, with no requirement to have satisfied the requisite NIC conditions (see Section 4.8.1).
SDA comprises two elements: a basic allowance and an age-related addition dependent upon the age at which the incapacity for work began. Increases for dependent children were abolished on 6 April 2003; however, those who were entitled to them prior to this date can still claim them.
Table 4.8.2. Current rates of severe disablement allowance, £ per week
Basic benefit 74.65 Increase for adult dependanta 36.75 Age-related addition: Under 40 11.15
40–59 inclusive 6.20 a The adult dependant increase is not paid if, in the previous week, the dependant’s earnings were over £73.10.
Lower limits apply if the dependent adult does not live with the claimant. Note: Increases for child dependants have, since 6 April 2003, been replaced by child tax credit (CTC) for all new claimants; however, existing claimants may still be entitled to claim these additions via SDA rather than CTC (see Section 4.8.7). For more information on eligibility for child and adult additions, see pages 653–4 of CPAG 2016/17.
In 2015–16, about 122,000 people received SDA and expenditure was estimated to be around £464 million.
4.8.3 Independent Living Fund
Taxable, Non-contributory, Means-tested
The Independent Living Fund was a government-financed trust to help severely disabled people live at home rather than move into residential care. It was established in 1988 and from 1993 worked in partnership with over 200 local authorities to jointly fund individual-specific care and support packages. The ILF was closed to new applications in 2010–11, and in December 2012 it was decided to permanently close the ILF. On 1 July 2015, the ILF ceased to operate and responsibility for the fund’s services was transferred to local authorities and the national devolved administrations.156
156 Source: Independent Living Fund, Report and Accounts for the period 1 April 2015 to 30 September 2015, https://www.gov.uk/government/uploads/system/uploads/attachment_data/file/493439/53543_HC_591_Accessible.pdf.

© Institute for Fiscal Studies, 2016
79
As at 30 June 2015, just under 16,000 individuals were in receipt of payments, and the total cost of the fund was around £66 million over the part of the 2015–16 financial year that the ILF was in operation.157
4.8.4 Industrial injuries benefits (elements of)
Non-taxable, Non-contributory, Non-means-tested
Reduced earnings allowance
The reduced earnings allowance (REA) is a supplement payable only to those assessed as 1% or more disabled as a result of an industrial injury or disease that can be proved to have happened before 1 October 1990. The payment is made to compensate people for loss of earnings because they are unlikely to be able to return to their regular occupation or to employment of an equivalent standard. The amount of REA payable is the difference between the wage earned in their previous regular employment and the wage in a job they are likely to be able to do, given their disability, up to a maximum of £67.20 a week. The total received from REA and industrial injuries disablement benefit (IIDB; see Section 4.6.7) cannot exceed 140% of the maximum IIDB award.
Retirement allowance
Retirement allowance (RA) is effectively a reduced form of REA for individuals over pension age (for whom REA is not payable). Recipients of REA of at least £2 per week who reach pensionable age and give up regular employment are entitled to RA. The amount payable is the lower of 25% of the REA that was being paid or £16.80 (10% of the 100% IIDB rate; see Section 4.6.7) per week.
In December 2015, there were 45,970 claimants of REA/RA alone and 49,460 claimants receiving it in addition to IIDB.158
4.8.5 Widow’s pension and widowed mother’s allowance
Taxable, Contributory, Non-means-tested
Widow’s pension and widowed mother’s allowance (WMA) were replaced in April 2001 by bereavement allowance (BA; see Section 4.7.2) and widowed parent’s allowance (WPA; see Section 4.7.3). However, women whose husband died before 9 April 2001 can continue to claim the old benefits, which are more generous. Just as
157 Source: Ibid.
158 Source: DWP, Industrial Injuries Disablement Benefit Quarterly Statistics: Data to December 2015, https://www.gov.uk/government/statistics/industrial-injuries-disablement-benefit-quarterly-statistics-data-to-december-2015.

© Institute for Fiscal Studies, 2016
80
BA and WPA are not payable at the same time, neither are widow’s pension and WMA.
Widow’s pension is payable at the same rate as BA (men cannot claim widow’s pension), and widows can receive this pension until they reach the age of 65, whereas BA is payable for only one year. The Christmas bonus is payable with widow’s pension, but not with BA.
Women receiving WMA before 9 April 2001 (men were not eligible) can continue to do so as long as they have an eligible child. Unlike WPA, WMA does not have an upper age limit. WMA is payable at the same rate as WPA per week, and attracts the Christmas bonus.
As of February 2016, approximately 21,480 women were claiming widow’s pension and 1,050 were receiving WMA.159
4.8.6 Industrial death benefit
Taxable, Non-contributory, Non-means-tested
Industrial death benefit (IDB) is payable to widows of men who died as a result of an industrial accident or disease before 11 April 1988. Since 5 December 2012, it has not been possible to make a new claim for IDB, regardless of the date of death. For deaths that occurred after these cut-off dates, other bereavement benefits (mainly bereavement payment and widowed parent’s allowance) are payable instead. Recipients of IDB are entitled to the Christmas bonus.
IDB is payable to existing recipients at one of two rates, depending upon the age at which they were widowed.
Table 4.8.3. Current rates of industrial death benefit, £ per week
Basic rates: Higher rate 119.30 Lower rate 35.79
In 2015–16, approximately 5,000 people received IDB, at an estimated total cost to the exchequer of £28 million.
4.8.7 Child-related benefit increases
Child tax credit (Section 4.1.1) replaced increases for child dependants from 6 April 2003 (for a range of benefits) or from 6 April 2004 (for income support and JSA).
159 Source: DWP tabulation tool for widow’s allowance, http://tabulation-tool.dwp.gov.uk/100pc/wb/tabtool_wb.html.

© Institute for Fiscal Studies, 2016
81
The first wave of benefits included the basic state pension (excluding Category D; see Section 4.5.1), carer’s allowance (Section 4.6.5), widowed parent’s allowance (Section 4.7.3), incapacity benefit (Section 4.8.1) and severe disablement allowance (Section 4.8.2). Existing claimants might still be entitled to the increases if the eligibility conditions for the benefit increase in question have been met continuously since the date of the policy change. The rate of increase is £8.00 for the eldest child and £11.35 for each of the subsequent children.
Child additions to income support (IS) are still payable to claimants who had been claiming for IS continuously since 6 April 2004, on the condition that the previous claims included amounts for dependent children. These can include a child personal allowance of £66.90, as well as the premiums above. Claims cease to include the child dependency increases once child tax credit (CTC) is claimed and awarded, and claimants may be automatically transferred to CTC by the government. The rates of CTC vary depending on family circumstances, such as whether the child is disabled (see Table 4.1.2).
Expenditure on the child-related premiums in IS in 2015–16 was around £86 million and there were approximately 18,400 claimants.160
4.8.8 Adult dependency increases
Increases for adult dependants in carer’s allowance (Section 4.6.5) and Category A state pension (Section 4.5.1) have been abolished for new claimants since 6 April 2010. Entitlements to the increases before that date will continue until the qualifying conditions are no longer satisfied or 5 April 2020, whichever is first.
4.8.9 Housing benefit premiums
Two housing benefit (HB) premiums are only available to existing claimants. Before 6 April 1998, lone parents were entitled to an additional amount (£4.75 in 2016–17) on top of the conventional family premium. The lone-parent increase was abolished on this date and new lone-parent HB claimants thereafter were entitled to the conventional family premium. This family premium was abolished on 1 May 2016. The £17.45 addition will continue to be paid only to existing HB claimants whose first child was born before 1 May 2016 (and hence were eligible for the premium before the date of abolition).
160 For expenditure, see Department for Work and Pensions, ‘Benefit expenditure and caseload tables 2016’, https://www.gov.uk/government/publications/benefit-expenditure-and-caseload-tables-2016. For claimants, see HMRC, Child and Working Tax Credits Statistics: April 2016, https://www.gov.uk/government/statistics/personal-tax-credits-provisional-statistics-2013-to-2009.

© Institute for Fiscal Studies, 2016
82
5. Upcoming reforms to social security spending
The current government was elected on a manifesto that pledged to cut £12 billion from the welfare bill. This continues the priorities of the previous coalition government, which sought to reduce the welfare bill as part of efforts to reduce the deficit following the 2008 financial crisis. Freezing working-age benefits until 2020 will save an estimated £4.2 billion, but the government is also making cuts elsewhere to achieve its target reduction. Perhaps the most significant structural reform planned for this parliament is one originally announced under the coalition. After repeated delays in the roll-out, current plans imply that universal credit will be mostly, if not entirely, in place by 2022. This section first discusses universal credit, and then describes other upcoming major reforms.
5.1 Universal credit161
Universal credit (UC) is a new benefit for those on low incomes. It affects both people in and out of work (including those who are sick or a carer) but does not directly alter means-tested support for adults over the state pension age (SPA).162 UC replaces six of the seven main means-tested welfare benefits and in-work credits designed for working-age adults: income support, income-based jobseeker’s allowance (JSA), income-related employment and support allowance (ESA), housing benefit, child tax credit and working tax credit. Although it is intended eventually to be nationwide, UC is being introduced in gradual stages.
UC is administered by the Department for Work and Pensions (DWP), in contrast to the existing system where HM Revenue and Customs (HMRC) manages tax credits and DWP administrates most means-tested benefits (see Section 2.1). Having a single body in charge of a single benefit should make reporting easier and simpler for households (saving them time, and possibly reducing error and increasing take-up) and make benefit claims easier to check (reducing error and fraud).
The structure of UC resembles a negative income tax administered at the family level. Each family receives a personal amount with additional amounts for children and those with disabilities, and those in rented accommodation receive an additional amount for housing costs. The personal amount is higher for couples than for single people (though not twice as high) and lower for some young people, as is also currently the case in income support, income-based JSA and income-related ESA. The
161 This section draws heavily on M. Brewer, J. Browne and W. Jin, ‘Universal credit: a preliminary analysis of its impact on incomes and work incentives’, Fiscal Studies, 33, 39–71, March 2012. 162 The government plans to combine housing benefit for those over the SPA with pension credit (the main means-tested benefit for those over the SPA) and to abolish housing benefit entirely when universal credit is fully phased in. The government has also said that families will be able to claim pension credit rather than universal credit only if all adults are aged over the female SPA, rather than the current requirement that only one adult need be over it. This means that couples where one person is aged over the female SPA and the other is aged under it will lose out from the reform.

© Institute for Fiscal Studies, 2016
83
housing component is similar to housing benefit (see Section 4.4.2) and child additions are based on child tax credit rates (see Section 4.1.1). This means that most out-of-work welfare claimants with no other sources of income or savings will see their entitlements to benefits unaffected by the move to UC. Disability premiums will be simplified as UC is introduced, in a way that will be revenue neutral overall but that will create winners and losers among those with disabilities.163
Under UC, earned income is subject to a taper rate of 65%. This rate is applied to earned income after income tax and National Insurance contributions (NICs) have been deducted. This means that an individual earning less than the income tax threshold who earns an additional pound will lose 65p of UC. An individual liable for National Insurance and paying income tax at the main rate (of 20%) who earns an additional pound will have to pay an additional 20p in income tax and 12p in NICs and will then lose 65% of the 68p of additional net earnings (or 44.2p) in UC, meaning that they would lose a total of 76.2p of each additional pound earned. Under the present system, such a person would lose between 73p and 90.6p of each additional pound earned, depending on whether they were entitled to housing benefit on top of tax credits.
Some earnings are disregarded before the taper applies, with the size of the disregard – or ‘work allowance’ – depending on personal circumstances, as set out in Table 5.1. The higher work allowance applies to those who do not claim for rental costs and the lower applies to those who do. This feature helps prevent UC from extending far up the earnings distribution for those entitled to a large housing element. In the existing system, the same is achieved by having those entitled to housing benefit facing a higher total withdrawal rate than those who are not, but with the same earnings thresholds.
Table 5.1. Universal credit work allowances, £ per year
Claimant type Higher rate Lower rate
Non-disabled households without children 0 0 All other households 4,764 2,304
Since the government has said there will be only one withdrawal rate for earnings in UC (65%) across all family types and all ranges of earnings, the work allowances are particularly important elements of UC that allow the government to vary entitlements across different family types for a given level of earnings and govern
163 Currently, ‘enhanced’ and ‘severe’ disability premiums exist in most means-tested benefits. The enhanced disability premium is paid to those with the highest needs for care (those claiming the highest rate of the care component of disability living allowance) and the severe disability premium is paid to those receiving either of the two highest rates of the care component of disability living allowance who have no one living with them to care for them (most recipients are single). When universal credit is introduced, these additional premiums will be abolished and the support group premium in ESA will be substantially increased.

© Institute for Fiscal Studies, 2016
84
the generosity of the benefit. The work allowances were frozen during 2014–15 and 2015–16. Rather than extend this freeze into 2016–17 as initially planned, the 2015 Summer Budget announced a cut in work allowances that came into effect in April 2016. Since this date, the work allowance for non-disabled households without children has been cut to zero and all other work allowances have been simplified to a rate of £192 per month for households claiming support for housing costs and £397 for households not claiming support for housing costs. These cuts to work allowances mean that UC is now significantly less generous than the system it is replacing, both for out-of-work and in-work families.164
The 2015 Summer Budget also announced two further reductions in the generosity of support provided to families through UC. From April 2017, people starting a new family will not be eligible for the UC first child premium. Support for children will also be limited to two children only, although existing UC claimants with more than two children will continue to receive support for all children born before 7 April 2017. Both of these changes are matched by cuts to tax credits (see Section 5.4).
Although UC is less generous than the legacy system on average, one area where generosity has been increased is support provided for childcare. In 2014, it was announced UC will cover 85% of childcare costs up to £175 a week for one-child families and £300 a week for families with two or more children. This is in comparison to 70% under the current system and represents a £350 million annual increase in generosity in the long run.165
From April 2017, there will be several changes in the conditions that entitle UC claimants to various types of support. Lone parents with a youngest child aged 3 or above will have to look for work to claim UC at all. This is similar to the Lone Parent Obligation component of the income support system discussed in Section 4.4.1. The UC Youth Obligation will also require 18- to 21-year-old claimants to either apply for training or apprenticeships or attend work placements from six months after the start of their claim. It has also been proposed that the housing element of UC will be restricted to those aged over 21.
Unearned income (mainly income from pensions and maintenance payments from divorcees’ former partners, but not interest income, which has a special treatment – see below) is not subject to a disregard at all, and reduces entitlement to UC pound for pound. In most cases, this is identical to its current treatment under the means-tested welfare benefits, but it represents a stricter means test than the current
164 For more information, see J. Browne, A. Hood and R. Joyce, ‘The (changing) effects of universal credit’, in C. Emmerson, P. Johnson and R. Joyce (eds), The IFS Green Budget: February 2016, https://www.ifs.org.uk/publications/8136.
165 Source: Paragraph 1.229 of HM Treasury, Autumn Statement 2014, Cm 8961, 2014, https://www.gov.uk/government/uploads/system/uploads/attachment_data/file/382327/44695_Accessible.pdf.

© Institute for Fiscal Studies, 2016
85
treatment under tax credits, where unearned income is subject to a taper rate of, at most, 41%.166
The treatment of capital is also identical to the way that means-tested benefits (income support, income-based JSA, income-related ESA and housing benefit) currently operate. But it is different from the current treatment of such income in tax credits, where investment income is ignored altogether if total income from investments and other unearned income sources is less than £300 a year and any investment income above this threshold is subject to a taper rate of, at most, 41%. The most extreme difference between this and the UC treatment of investment income and capital is for a family with savings in excess of £16,000: such families will never be entitled to any UC, but currently could be entitled to tax credits; indeed, with an interest rate of 3%, savings of £16,000 would reduce tax credit entitlement by £1.42 a week.167 Having capital limits in UC limits the payment of UC to those who have both a low income and low levels of savings. But the mechanism will give some families an extremely strong incentive to lower their financial capital to £16,000 or below, and will give others an extremely strong incentive not to accumulate more than this amount.
The first UC claims were made in April 2013, by single jobseekers in the Greater Manchester area, and the progressive national roll-out began in October 2013. UC is currently available in every Jobcentre across Great Britain for new single claimants. Individuals who are part of a couple or have children are currently able to claim in 111 Jobcentre areas, 24 of which also deliver the UC digital service.168 The government has been able to exploit the staged roll-out of the scheme to examine the early labour market effects of the reform.169 Focusing on non-disabled single adults without children who did not claim support for housing costs (the first group of individuals who were able to claim UC), it has found that UC caused an 8 percentage point increase in the probability a claimant was in work at some point within the first nine months after making a new claim. The impact on the total earnings over the nine-month period, however, was not significantly different from zero, which may reflect the fact that UC encourages claimants to accept a small number of hours in short-term temporary work.
166 Some income, such as divorcees’ maintenance payments from former partners (which are particularly important for lone parents), currently does not count as income for the purpose of tax credits but will be counted as unearned income under the UC system. Other types of income, such as widow(er)s’ pensions and private pensions, do count as unearned income for both tax credits and UC, but will be tapered at 100% under UC compared with at most 41% under tax credits currently. 167 {(0.03 × 16,000) – 300} × 0.41 = £73.80/year or £1.42/week. 168 True at September 2016. Latest information on the UC roll-out can be found at https://www.gov.uk/guidance/jobcentres-where-you-can-claim-universal-credit.
169 DWP, Estimating the Early Labour Market Impacts of Universal Credit: Updated Analysis, https://www.gov.uk/government/publications/universal-credit-estimating-the-early-labour-market-impacts-updated-analysis.

© Institute for Fiscal Studies, 2016
86
The government originally planned to complete the transfer to UC by October 2017.170 The UC roll-out has been beset by IT problems and has been repeatedly delayed as a result. According to the latest UC timeline, existing claimants will begin being transferred onto UC from July 2019, with the full transition to UC being completed by March 2022.
5.2 Benefits freeze
Several changes to benefit uprating have been made in recent years as governments search for ways to cut the welfare bill. The latest of these changes was announced in the post-election Summer 2015 Budget and freezes working-age benefits in cash terms for four years from April 2016. According to recent inflation forecasts, this corresponds to a real cut of 6% and will achieve an estimated £4.2 billion reduction in government spending in 2019–20.171 Benefits related to the extra costs of disability and statutory payments are not subject to the freeze.172
5.3 Changes to employment and support allowance
In July 2015, the post-election Budget announced the abolition of the work-related activity component of ESA, bringing support for individuals in this group into line with the JSA rate. This change will apply to all new claimants from April 2017 and is expected to save £640 million by 2020–21.173 In October 2016, it was announced that individuals with conditions ‘which can only get worse’ will no longer have to undergo reassessment for work capability (the WCA) to continue claiming ESA, although the exact conditions this will cover and the date of the change remain unclear.174
5.4 Cuts to tax credits
The 2015 Summer Budget announced two changes to the generosity of support provided to families through tax credits that come into effect from April 2017. First, people starting a new family will not be eligible for the family element in tax credits.
170 Source: Department for Work and Pensions, Universal Credit: Welfare that Works, Cm 7957, 2010, https://www.gov.uk/government/uploads/system/uploads/attachment_data/file/48897/universal-credit-full-document.pdf.
171 Source: C. Emmerson, A. Hood and T. Waters, ‘Falling sterling, rising prices and the benefits freeze’, IFS Observation, 18 October 2016, https://www.ifs.org.uk/publications/8699.
172 The benefits not subject to the freeze are maternity allowance, statutory sick pay, statutory maternity pay, statutory paternity pay, statutory shared parental pay, statutory adoption pay, the employment and support allowance support group component, any disability, carers’ or pensioners’ elements of benefits, and other disability, carers’ and pensioners’ benefits, including PIP and DLA. These will increase in line with either the CPI or earnings, depending on the specific benefit.
173 Source: HM Treasury, Summer Budget 2015 Policy Costings, July 2015, https://www.gov.uk/government/uploads/system/uploads/attachment_data/file/443195/Policy_costings_summer_budget_2015.pdf.
174 Damian Green’s speech to the Conservative Party Conference 2016, http://press.conservatives.com/post/151336048820/green-speech-to-conservative-party-conference.

© Institute for Fiscal Studies, 2016
87
Second, in addition to this, the child element will be limited to two children only. This change will apply to new claimants and to children of existing claimants born after 6 April 2017.
5.5 Bereavement benefits
After April 2017, the government plans to replace bereavement payment, widowed parent’s allowance and bereavement allowance with a new single system of ‘bereavement support payment’.175
Entitlement to bereavement support payment will be based on a single year of Class 1 or 2 National Insurance contributions. It will be paid as a lump sum with monthly instalments for a year, at a higher rate if the bereaved person is pregnant or entitled to child benefit. Moreover, it will be ignored for a year when calculating entitlement to universal credit. This reform should simplify the system of bereavement benefits but will create winners and losers.176
5.6 Tax-free childcare177
Budget 2013 announced a new Tax-Free Childcare Scheme (revised in Budget 2014), which will support 1.9 million working families with 20% of their childcare costs, now set at a maximum of £2,000 of support per child per year. The new system will be phased in during 2017, replacing the existing system of employer-supported childcare (ESC). Households in which all parents work but that do not receive support through tax credits (or universal credit, once it is established) will be eligible, so long as neither parent earns over £100,000 a year and each expects to earn at least £115 a week. The scheme will be rolled out to all eligible families with children under 12 within the first year of the scheme’s operation. Disabled children under 17 years old will also be eligible.
175 Bereavement support payments are provided for in the Pensions Act 2014. More details can be found in the government’s response to the consultation ‘Bereavement Benefit for the 21st Century’, https://www.gov.uk/government/consultations/bereavement-benefit-for-the-21st-century.
176 More details can be found at https://www.gov.uk/government/uploads/system/uploads/attachment_data/file/208850/130626-ad-hoc-bereavement-benefits.pdf.
177 More details can be found at HM Treasury and HM Revenue & Customs, Delivering Tax-Free Childcare: The Government’s Response to the Consultation on Design and Operation, 2014, https://www.gov.uk/government/uploads/system/uploads/attachment_data/file/318953/PU1607_Tax_free_Childcare_response.pdf and https://www.gov.uk/government/news/tax-free-childcare-10-things-parents-should-know.

© Institute for Fiscal Studies, 2016
88
6. Conclusions
This parliament is likely to see the most comprehensive reform of the social security system since the Second World War. The replacement of six of the seven main means-tested benefits for those of working age with the single universal credit should simplify the benefit system and rationalise work incentives. Currently, means-tested benefits and tax credits are administered by two different government departments. This is complicated and burdensome for claimants, who have to submit the same information multiple times, and creates uncertainty about how much better off they will be from moving into work. A single integrated benefit should be simpler for claimants, reduce administrative costs and, by replacing a jumble of overlapping means tests with a single one, eliminate the very highest effective marginal tax rates that exist under the current system. However, this simplification will be undermined by the decision to retain support for council tax outside universal credit.
The introduction of a single-tier pension also represents a simplification of the benefit system and will give people greater certainty about what they can expect from the state in retirement, providing greater clarity for private saving decisions. Under the single-tier pension, all employees will pay the same rate of National Insurance and become entitled to state pension in the same way. It is argued that the removal of savings credit will reduce the number of taper rates that pensioners face, simplifying the pension system. Along with earlier notice of future changes to the state pension age, it is intended that the new pension will make it easier for people to understand what they need to save for their retirement.
Concurrently to these major structural reforms, the social security system will also see large real reductions in expenditure in its history. The current government was elected on a commitment to impose an extra £12 billion in welfare cuts. Although the new Chancellor has signalled reductions in government spending may be less severe than previously promised, any reductions will involve a trade-off between reducing support for those with the lowest incomes and weakening work incentives by reducing support for those in work. Concerns over intergenerational equality may also demand a reassessment of the current practice of protecting pensioner benefits at the cost of working-age households. These decisions, as much as larger structural reforms, will shape the benefit system in the years to come.

© Institute for Fiscal Studies, 2016
89
Appendix A. GB benefit expenditure from 1948–49 to 2015–16
Table A.1. Spending on benefits in cash terms and real terms (2015–16 prices), real increases and spending as a share of GDP
Cash terms (£m)
Real terms (£m)
Real rise (%)
% of GDP
Cash terms (£m)
Real terms (£m)
Real rise (%)
% of GDP
1948–49 460 13,278 3.84 1982–83 31,628 85,427 6.50 9.75 1949–50 575 16,144 21.59 4.52 1983–84 35,332 91,102 6.64 9.95 1950–51 585 16,247 0.63 4.40 1984–85 38,251 93,224 2.33 9.99 1951–52 614 15,841 –2.49 4.16 1985–86 41,768 96,344 3.35 9.92 1952–53 743 18,183 14.78 4.65 1986–87 44,918 99,514 3.29 9.92 1953–54 779 18,717 2.94 4.55 1987–88 46,701 98,100 –1.42 9.20 1954–55 798 18,868 0.81 4.40 1988–89 47,318 93,358 –4.83 8.36 1955–56 894 20,100 6.53 4.52 1989–90 50,314 92,201 –1.24 8.07 1956–57 928 19,778 –1.60 4.34 1990–91 56,479 95,698 3.79 8.40 1957–58 995 20,256 2.42 4.38 1991–92 66,303 106,397 11.18 9.38 1958–59 1,217 23,942 18.20 5.16 1992–93 75,257 117,854 10.77 10.34 1959–60 1,277 25,002 4.43 5.09 1993–94 82,438 126,154 7.04 10.71 1960–61 1,315 25,263 1.04 4.90 1994–95 84,863 128,424 1.80 10.52 1961–62 1,464 27,480 8.78 5.18 1995–96 88,711 130,343 1.49 10.44 1962–63 1,555 28,280 2.91 5.25 1996–97 92,218 130,483 0.11 10.18 1963–64 1,781 31,686 12.04 5.56 1997–98 93,347 130,013 –0.36 9.83 1964–65 1,845 31,327 –1.13 5.28 1998–99 95,565 131,358 1.03 9.64 1965–66 2,185 35,201 12.37 5.82 1999–00 100,104 136,861 4.19 9.67 1966–67 2,318 35,793 1.68 5.80 2000–01 105,672 141,542 3.42 9.68 1967–68 2,645 39,646 10.76 6.21 2001–02 112,162 148,341 4.80 9.91 1968–69 3,019 43,044 8.57 6.46 2002–03 117,882 152,505 2.81 9.90 1969–70 3,234 43,247 0.47 6.37 2003–04 129,133 163,342 7.11 10.25 1970–71 3,637 44,293 2.42 6.32 2004–05 137,168 169,013 3.47 10.39 1971–72 4,230 48,081 8.55 6.57 2005–06 143,908 172,740 2.20 10.26 1972–73 4,900 51,150 6.38 6.65 2006–07 148,908 173,552 0.47 10.08 1973–74 5,505 52,755 3.14 6.67 2007–08 157,704 179,413 3.38 10.19 1974–75 6,902 55,055 4.36 7.06 2008–09 171,772 190,224 6.03 11.10 1975–76 9,338 59,892 8.79 7.77 2009–10 188,257 205,745 8.16 12.29 1976–77 11,115 62,562 4.46 7.87 2010–11 195,063 209,295 1.73 12.25 1977–78 13,369 66,150 5.73 8.10 2011–12 200,786 212,472 1.52 12.29 1978–79 15,873 70,600 6.73 8.31 2012–13 208,090 215,638 1.49 12.31 1979–80 18,777 71,475 1.24 8.12 2013–14 204,629 208,592 –3.27 11.63 1980–81 22,658 72,322 1.18 8.52 2014–15 208,573 209,411 0.39 11.36 1981–82 27,698 80,213 10.91 9.36 2015–16 211,683 211,683 1.08 11.26
Note: Figures should be interpreted with care since many changes have occurred to the ways in which government support for individuals is delivered. For instance, council tax support was localised in 2013–14, so figures from 2013–14 onwards do not include council tax benefit (or its equivalent) whereas previous years do. For more details, see appendix C of Department of Social Security, The Changing Welfare State: Social Security Spending, London, 2000, available by emailing a request to [email protected]. Source: Department for Work and Pensions for benefit expenditure figures, available at https://www.gov.uk/government/publications/benefit-expenditure-and-caseload-tables-2016; HMRC for tax credit and recent child benefit figures, available at https://www.gov.uk/government/organisations/hm-revenue-customs/about/statistics#benefits-and-credits-statistics; HM Treasury for GDP figures, available at https://www.gov.uk/government/statistics/gdp-deflators-at-market-prices-and-money-gdp-june-2016-quarterly-national-accounts; OBR Public Finances Databank for inflation and pre-1955 nominal GDP figures, available at http://budgetresponsibility.org.uk/data/; Bank of England historical data for pre-1955 real GDP figures, available at http://www.bankofengland.co.uk/research/Pages/onebank/threecenturies.aspx.

© Institute for Fiscal Studies, 2016
90
Appendix B. War pensions and AFCS
War pensions have been replaced by the Armed Forces Compensation Scheme (AFCS) as a complete package of financial compensation for injuries and death that occurred on or after 6 April 2005 and are attributable to service in the armed forces. Both schemes provide long-term payments to disabled former servicemen/women as well as surviving spouses/partners.
AFCS is simpler than war pensions. It consists of a lump sum and a guaranteed income payment (GIP; Section 4.6.8) for the injured/disabled person and a survivors’ guaranteed income payment (SGIP; Section 4.7.4) for surviving dependants when death results from service. The actual amounts are calculated by formulas, which can be found in the Armed Forces and Reserve Forces (Compensation Scheme) Order 2005.178
Because recipients of war pensions as a result of injuries and death prior to 6 April 2005 are not affected by the policy change, a much larger number of people are currently entitled to war pensions than to AFCS. As at 31 March 2016, there were only 2,638 recipients of GIP and SGIP.179
The following is a brief description of the various pensions and allowances available to war pensioners. Figures for recipients of each payment are taken from the Ministry of Defence’s War Pensions Scheme Annual Statistics.180 Rates information is provided by the Ministry of Defence and is applicable from April 2016.181 Unfortunately, no figures for expenditure on each allowance are available.
War disablement pension
War disablement pension (WDP) is payable to individuals who have become at least 20% disabled (as assessed by Department for Work and Pensions doctors) while serving in HM Forces. It is payable at varying rates according to the degree of disablement (to the nearest 10%), with a one-off gratuity (lump-sum payment) available to those who are less than 20% disabled. The current maximum rate of WDP is £9,298 per annum for officers and £178.20 per week for other ranks, payable
178 Available at http://www.legislation.gov.uk/uksi/2005/439/made. 179 Source: Ministry of Defence, UK Armed Forces Compensation Scheme Biannual Statistics: 6 April 2005 to 31 March 2016, https://www.gov.uk/government/uploads/system/uploads/attachment_data/file/527041/AFCS_March_2016.pdf.
180 Edition 31 March 2016, released 2 June 2016, https://www.gov.uk/government/uploads/system/uploads/attachment_data/file/527051/20160106-_WPS_2016_New_Bulletin_Format_Revised_FINAL-_O.pdf. 181 Source: Ministry of Defence, 2016 War Pensions and Allowance Rates, https://www.gov.uk/government/news/2016-war-pensions-and-allowance-rates.
© Institute for Fiscal Studies, 2016
91
to those assessed as 100% disabled. As at 31 March 2016, 111,228 people were receiving WDP, of whom 47% were aged 70 or over. Approximately five out of six disablement pensioners (86%) were assessed as 50% disabled or less, and only around 3% (3,015) were assessed as 100% disabled. The Christmas bonus is payable with WDP if the recipient is aged 65 or over.
Unemployability supplement
Unemployability supplement (US) is payable to war pensioners who are (virtually) unemployable as a result of their disability. New claimants must be under the age of 65, with disability assessed to be at least 60%. The current rate of US is £5,745 per annum for officers and £110.10 per week for other ranks, with increases available for both adult and child dependants.182 As at 31 March 2016, 6,121 people were receiving US. The Christmas bonus is payable with US.
Recipients of US may also be entitled to receive invalidity allowance, at a rate that depends upon the age at which unemployability began. There are three rates for invalidity allowance: the highest rate (if aged under 40) is £21.80 per week, the middle rate (if aged between 40 and 49) is £14.20 per week and the lowest rate (if aged between 50 and 59) is £7.10 per week for other ranks – £1,138, £741 and £370 per annum respectively for officers. Invalidity allowance was received by 5,557 people as at 31 March 2016.
Constant attendance allowance / Exceptionally severe disablement allowance
Constant attendance allowance (CAA) is payable to war pensioners who need daily care and attention and whose war disablement pension is payable at the 80% rate or above. CAA is payable at four rates: the part-time (half-day) rate of £33.60 per week for other ranks (£1,753 per annum for officers) if attendance is required for half a day or less; the normal maximum rate of £67.20 per week for other ranks (£3,506 per annum for officers) if attendance is needed for more than half a day; the intermediate rate of £100.80 per week for other ranks (£5,260 per annum for officers) for those who are severely disabled and require extra attendance; and the exceptional rate of £134.40 per week for other ranks (£7,013 per annum for officers) for very severely disabled people who are entirely dependent upon full-time attendance for their everyday needs. The Christmas bonus is payable with CAA.
Claimants of either the intermediate or the exceptional rate of CAA whose need for constant attendance is likely to be permanent may also qualify for the exceptional severe disablement allowance (ESDA) of £67.20 per week for other ranks (£3,506 per annum for officers). As at 31 March 2016, 1,997 people received CAA; of these, 471 also received ESDA. Recipients of either of the highest two rates of CAA who are still 182 A rate of £61.20 per week is payable for an adult dependant of a non-officer (£3,193 per annum for the dependant of an officer); £14.20 per week is payable for the oldest (and £16.75 for each subsequent) child of a non-officer (£741 and £874 per annum respectively for the children of officers).

© Institute for Fiscal Studies, 2016
92
in gainful employment may also be entitled to the severe disablement occupational allowance of £33.60 per week for other ranks (£1,753 per annum for officers), although there have been no claims for this since September 2011.
Allowance for lowered standard of occupation
An allowance for lowered standard of occupation is payable to war pensioners with reduced earnings capacity if their disablement prevents them from pursuing their regular occupation. Claimants must be under 65 and must have a disablement of at least 40% (but less than 100%). The maximum allowance payable to other ranks is £67.20 per week (£3,506 per annum for officers), and 10,374 people were receiving this allowance as at 31 March 2016.
Age allowance
Age allowance is payable to war pensioners aged 65 or over whose disablement is assessed to be 40% or more. The amount varies according to the degree of disability, with the maximum rate (for 100% disability) currently standing at £36.70 per week for other ranks (£1,915 per annum for officers). As at 31 March 2016, 22,312 people were claiming age allowance.183
Clothing allowance
An annual clothing allowance (currently £230) may be payable to war pensioners if they are an amputee or if their disability causes exceptional wear and tear on clothing. As at 31 March 2016, there were 2,544 awards of clothing allowance in payment.
Comforts allowance
Comforts allowance may be payable to a severely disabled war pensioner receiving CAA or US, to help with the extra expenses associated with severe disablement. It is payable at a higher rate of £28.90 or a lower rate of £14.45 per week for other ranks (£1,508 and £754 per annum for officers). Comforts allowance was being paid to 6,597 people as at 31 March 2016.
Mobility supplement
The mobility supplement is payable to war pensioners who are at least 40% disabled and have severe difficulty walking. As at 31 March 2016, 11,790 people were receiving the mobility supplement. The current rate is £64.15 per week for other ranks (£3,347 per annum for officers). The Christmas bonus is payable with mobility supplement.
183 Including 527 disablement pensioners and widow(er)s receiving an addition at age 80 in Northern Ireland.

© Institute for Fiscal Studies, 2016
93
War widow(er)’s pension
There were 18,950 war widow(er)’s pensions in payment as at 31 March 2016. Christmas bonus is payable with war widow(er)’s pension.
Table B.1. Current maximum rates of war widow(er)’s pension
Lower ratea Standard rateb Rank of late husband/wife
Private, Corporal, Sergeant, Staff Sergeant, Warrant Officer Class I and II
£32.37 p.w. £135.15 p.w.
First or Second Lieutenant £1,958 p.a. £7,130 p.a. Captain £2,226 p.a. £7,160 p.a.
Major £2,496 p.a. £7,187 p.a. Lieutenant-Colonel – £7,241 p.a.c
Colonel – £7,279 p.a.c Brigadier – £7,430 p.a.c
Major-General – £7,499 p.a.c Supplementary pension:d Officers £4,717.59 p.a.
Other ranks £90.41 p.w.
Age allowances: Officers: Aged 65–69 £804 p.a.
Aged 70–79 £1,545 p.a. Aged 80+ £2,291 p.a.
Other ranks: Aged 65–69 £15.40 p.w. Aged 70–79 £29.60 p.w. Aged 80+ £43.90 p.w.
Increases for children: Officers: Eldest or only child £1,106 p.a.
Subsequent children (each) £1,239 p.a. Other ranks: Eldest or only child £21.20 p.w.
Subsequent children (each) £23.75 p.w. Maximum rent allowance: Officers £2,656 p.a. Other ranks £50.90 p.w. a For those under 40 with no children. b For those over 40 and for those under 40 with children. c The rates are slightly higher for widows of those who served in the 1914 War. d Payable to widow(er)s of armed forces personnel whose service ended before 31 March 1973.
Source: Ministry of Defence, 2016 War Pensions and Allowance Rates, https://www.gov.uk/government/news/2016-war-pensions-and-allowance-rates and Veterans UK, War Pension Scheme payments increases from April 2015, https://www.gov.uk/government/news/war-pension-scheme-payments-increases-from-april-2015.