a survey of predictive modeling on imbalanced domains
TRANSCRIPT

31
A Survey of Predictive Modeling on Imbalanced Domains
PAULA BRANCO, LUIS TORGO, and RITA P. RIBEIRO, LIAAD-INESC TEC, DCC-Faculty ofSciences, University of Porto, Porto, Portugal
Many real-world data-mining applications involve obtaining predictive models using datasets with stronglyimbalanced distributions of the target variable. Frequently, the least-common values of this target variableare associated with events that are highly relevant for end users (e.g., fraud detection, unusual returnson stock markets, anticipation of catastrophes, etc.). Moreover, the events may have different costs andbenefits, which, when associated with the rarity of some of them on the available training data, createsserious problems to predictive modeling techniques. This article presents a survey of existing techniques forhandling these important applications of predictive analytics. Although most of the existing work addressesclassification tasks (nominal target variables), we also describe methods designed to handle similar problemswithin regression tasks (numeric target variables). In this survey, we discuss the main challenges raisedby imbalanced domains, propose a definition of the problem, describe the main approaches to these tasks,propose a taxonomy of the methods, summarize the conclusions of existing comparative studies as well assome theoretical analyses of some methods, and refer to some related problems within predictive modeling.
CCS Concepts: � Computing methodologies → Cost-sensitive learning; Supervised learning;
Additional Key Words and Phrases: Imbalanced domains, rare cases, classification, regression, performancemetrics
ACM Reference Format:Paula Branco, Luıs Torgo, and Rita P. Ribeiro. 2016. A survey of predictive modeling on imbalanced domains.ACM Comput. Surv. 49, 2, Article 31 (August 2016), 50 pages.DOI: http://dx.doi.org/10.1145/2907070
1. INTRODUCTION
Predictive modeling is a data analysis task whose goal is to build a model of an unknownfunction Y = f (X1, X2, . . . , Xp), based on a training sample {〈xi, yi〉}n
i=1 with examplesof this function. Depending on the type of the variable Y , we face either a classificationtask (nominal Y ) or a regression task (numeric Y ). Models are obtained through asearch process guided by the optimization of some criterion. The most frequent criteria
This work is financed by the European Regional Development Fund (ERDF) through the Operational Pro-gramme for Competitiveness and Internationalisation-COMPETE 2020 Programme within project “POCI-01-0145-FEDER-006961” and by the North Portugal Regional Operational Programme (ON.2 O Novo Norte),under the National Strategic Reference Framework (NSRF), through the European Regional Develop-ment Fund (ERDF), and by national funds, through the Portuguese funding agency, Fundacao para aCiencia e a Tecnologia (FCT) within “Project NORTE-07-0124-FEDER-000059.” Paula Branco was sup-ported by a scholarship from the Fundacao para a Ciencia e Tecnologia (FCT), Portugal (scholarshipnumber PD/BD/105788/2014). Part of the work of Luıs Torgo was supported by a sabbatical scholarship(SFRH/BSAB/113896/2015) from the Fundacao para a Ciencia e Tecnologia (FCT).Authors’ addresses: P. Branco, L. Torgo, and R. P. Ribeiro, LIAAD-INESC TEC, Campus da FEUP,Rua Dr. Roberto Frias, 4200-465 Porto, Portugal; DCC-Faculty of Sciences, University of Porto, Rua doCampo Alegre, s/n, 4169-007 Porto, Portugal; email: [email protected], [email protected], [email protected] to make digital or hard copies of part or all of this work for personal or classroom use is grantedwithout fee provided that copies are not made or distributed for profit or commercial advantage and thatcopies show this notice on the first page or initial screen of a display along with the full citation. Copyrights forcomponents of this work owned by others than ACM must be honored. Abstracting with credit is permitted.To copy otherwise, to republish, to post on servers, to redistribute to lists, or to use any component of thiswork in other works requires prior specific permission and/or a fee. Permissions may be requested fromPublications Dept., ACM, Inc., 2 Penn Plaza, Suite 701, New York, NY 10121-0701 USA, fax +1 (212)869-0481, or [email protected]© 2016 ACM 0360-0300/2016/08-ART31 $15.00DOI: http://dx.doi.org/10.1145/2907070
ACM Computing Surveys, Vol. 49, No. 2, Article 31, Publication date: August 2016.

31:2 P. Branco et al.
are the error rate for classification and the mean-squared error for regression. Forsome real-world applications, it is of key importance that the obtained models are par-ticularly accurate at some sub-range of the domain of the target variable. Examplesinclude diagnosis of rare diseases and forecasting rare extreme returns in financialmarkets, among many others. Frequently, these specific sub-ranges of the target vari-able are poorly represented in the available training sample. In these cases, we facewhat is usually known as a problem of imbalanced domains or imbalanced datasets.Informally, in these domains, the cases that are more important for the user are rareand few exist on the available training set. The combination of the specific preferencesof the user with the poor representation of these situations creates problems at severallevels. Namely, we typically need (i) special purpose evaluation metrics that are biasedtowards the performance of the models on these rare cases, and, moreover, we needmeans for (ii) making the learning algorithms focus on these rare events. Without ad-dressing these two questions, models will tend to be biased to the most frequent (anduninteresting for the user) cases, and the results of the “standard” evaluation metricswill not capture the competence of the models on these rare cases.
The main contributions of this work are as follows: (i) provide a general definitionof the problem of imbalanced domains suitable for classification and regression tasks;(ii) review the main performance assessment measures for classification and regres-sion tasks under imbalanced domains; (iii) propose a taxonomy of existing approachesto tackle the problem of imbalanced domains both for classification and regressiontasks; (iv) describe the most important techniques to address this problem; (v) summa-rize the conclusions of some existing experimental comparisons; and (vi) review sometheoretical analyses of specific methods. Existing surveys address only the problemof imbalanced domains for classification tasks (e.g., Kotsiantis et al. [2006], He andGarcia [2009], and Sun et al. [2009]). Therefore, the coverage of performance assess-ment measures and approaches to tackle both classification and regression tasks is aninnovative aspect of our article. Another key feature of our work is the proposal of abroader taxonomy of methods for handling imbalanced domains. Our proposal extendsprevious taxonomies by including post-processing strategies. Finally, the article alsoincludes a summary of the main conclusions of existing experimental comparisons ofapproaches to these tasks as well as references to some theoretical analyses of specifictechniques.
The article is organized as follows. Section 2 defines the problem of imbalanced do-mains and the type of existing approaches to address this problem. Section 3 describesseveral evaluation metrics that are biased towards performance assessment on therelevant cases in these domains. Section 4 provides a taxonomy of the approachesto imbalanced domains, describing some of the most important techniques in eachcategory. In Section 5 we present some general conclusions of existing experimentalcomparisons of different methods. Section 6 describes the main theoretical contribu-tions for understanding the problem of imbalanced domains. Finally, Section 7 exploressome problems related with imbalanced domains and Section 8 concludes the articlealso including a summary of recent trends and open research questions.
2. PROBLEM DEFINITION
As we have mentioned before, the problem of imbalanced domains occurs in the contextof predictive tasks where the goal is to obtain a good approximation of the unknownfunction Y = f (X1, X2, . . . , Xp) that maps the values of a set of p predictor variablesinto the values of a target variable. This approximation, h(X1, X2, . . . , Xp), is obtainedusing a training dataset D = {〈xi, yi〉}n
i=1.The problem of imbalanced domains can be informally described by the following two
assertions:
ACM Computing Surveys, Vol. 49, No. 2, Article 31, Publication date: August 2016.

A Survey of Predictive Modeling on Imbalanced Domains 31:3
(1) the user assigns more importance to the predictive performance of the obtainedapproximation h(X1, X2, . . . , Xp) on a subset of the target variable domain;
(2) the cases that are more relevant for the user are poorly represented in the trainingset, up to the point of leading to bad estimates of their conditional density by themodels.
The non-uniform importance mentioned in assertion (1) can occur in different forms,namely, (i) by assigning different benefits to accurate predictions of the values of thetarget variable, (ii) by having different costs associated with different types of predic-tion errors, (iii) or by a mixture of both situations. This means that there is a strongrelationship between imbalanced problems and cost-sensitive learning (e.g., Elkan[2001]). Both result from these non-uniform preference biases of the user. However, acost-sensitive problem may not be imbalanced if the cases that are more relevant aresufficiently represented in the training data, that is, if assertion (2) is not true. Thismeans that an imbalanced problem always involves non-uniform costs/benefits, but theopposite is not always true.
The quality of the information we have concerning the user domain preferences (item(1) in the above list) is also of key importance, as it can have an impact on (i) the way weevaluate and/or compare alternative models and (ii) the process used to influence thelearning process in order to obtain models that are “optimal” according to these userpreferences. This was termed by Weiss [2013] as the “problem-definition issue.” In oneextreme, the user may be able to provide information of the full utility function, u(y, y),that determines the value for the user of predicting y for a true value of y. Accordingto Elkan [2001], this should be a positive value for accurate predictions (a benefit)and a negative value for prediction errors (a cost). Having the full specification of thisfunction is the ideal setting. Unfortunately, this information is frequently difficult toobtain in real-world applications, particularly for regression tasks where the targetvariable has an infinite domain. A slightly less challenging task for the user is toprovide a simpler function that assigns a relevance score to each value of the targetvariable domain. We will call this the relevance function, φ(), which is a function thatmaps the values of the target variable into a range of importance, where 1 correspondsto maximal importance and 0 to minimum relevance,
φ(Y ) : Y → [0, 1], (1)
where Y is the domain of the target variable Y . This is an easier function to be definedby the user because, among other aspects, it only depends on one variable (y), while theutility function depends on two variables (y and y). Moreover, the definition of a utilityfunction requires that a non-negligible amount of domain information is available,whereas for the relevance function less information is needed. In effect, the utility ofpredicting a value y for a true value of y depends on both the relevance of each of thesevalues but also on the associated loss [Torgo and Ribeiro 2007; Ribeiro 2011], that is,
u(y, y) = g(φ(y), φ(y), L(y, y)), (2)
where L(y, y) is typically the 0/1 loss for classification tasks or the squared error forregression.
Finally, there are also applications where the available information is very informal,e.g., “the class c is the more relevant for me.” This type of problem definition createsserious limitations both in terms of procedures to evaluate the models but also in termsof how to proceed to learn a model that takes this into consideration.
Let us assume the user has defined the function φ() that represents the importanceassigned to the target variable domain and has also defined a threshold tR that setsthe boundary above which the target variable values are relevant. It is important
ACM Computing Surveys, Vol. 49, No. 2, Article 31, Publication date: August 2016.

31:4 P. Branco et al.
to highlight that this threshold is not used for declaring a class or range of valuesirrelevant. It is used for understanding which target values the user considers normaland which are the most relevant ones. Using this threshold, we can split the domainof the target variable in two complementary subsets, YR ⊂ Y = {y ∈ Y : φ(y) > tR} andYN = Y \YR. In this context, DR is the subset of the training samples D where y ∈ YRand DN is the subset of the training sample with the normal (or less important) cases,that is, DN = D\DR.
Using the above notation, we can provide a more formal definition of required condi-tions for a predictive task to be considered an imbalanced problem:
(1) The non-uniform importance of the predictive performance of the models acrossthe domain of the target variable can result from:(a) L(y, y) = L(x, x) �=⇒ u(y, y) = u(x, x), that is, accurate predictions may have
different benefits;(b) L(y1, y2) = L(x1, x2) �=⇒ u(y1, y2) = u(x1, x2), that is, the cost of similar errors is
not uniform;(c) a mixture of both situations
(2) |DR| |DN|, that is, relevant values are poorly represented in the training set.
As we have mentioned, the problem of imbalanced domains is associated with amismatch between the importance assigned by the user to some predictions (1) and therepresentativeness of the values involved in these predictions on the available trainingsample (2). Still, it is important to stress that among the possible mismatches betweenthese two factors, only one type really leads to the so-called problem of imbalanceddomains. In effect, only when the more important cases are poorly represented in theavailable data do we have a problem. It is this lack of representativeness that causes(i) the “failure” of standard evaluation metrics, as they are biased towards averageperformance and will not correctly assess the performance of the models on these rareevents, and (ii) the learning techniques to disregard these rare events due to theirsmall impact on the standard evaluation metrics that usually guide their learningprocess or due to their lack of statistical significance. Other types of mismatch do nothave these consequences. If the user has a non-uniform preference bias but the datadistribution is balanced, then the second consequence does not occur, as the importantcases are sufficiently represented in the data, while the first consequence is not soserious because the important cases are not rare and thus will have an impact on thestandard performance metrics.1 Moreover, if the user has a uniform preference overthe different types of predictions, then even if the data distribution is imbalanced thisis not a problem given the indifference of the user to where the errors occur.
Regarding the failure of traditional evaluation metrics, several solutions have beenproposed to address this problem and overcome existing difficulties, mainly for classi-fication tasks. We will review these proposals in Section 3.
With respect to the inadequacy of the obtained models a large number of solutionshas also appeared in the literature. We propose a categorization of these approachesthat considers four types of strategies: (i) modifications on the learning algorithms,(ii) changes on the data before the learning process takes place, (iii) transformationsapplied to the predictions of the learned models, and, finally, (iv) hybrid strategies thatcombine different types of strategies. These solutions will be reviewed in Section 4.
We will now illustrate the problem of imbalanced domains with two concrete exam-ples: one in classification and another in regression.
For imbalanced classification we use the Glass dataset from the UCI Machine Learn-ing Repository [Lichman2013]. This dataset contains 213 examples, and the target
1Though potentially not as exacerbated as one could wish.
ACM Computing Surveys, Vol. 49, No. 2, Article 31, Publication date: August 2016.
A Survey of Predictive Modeling on Imbalanced Domains 31:5
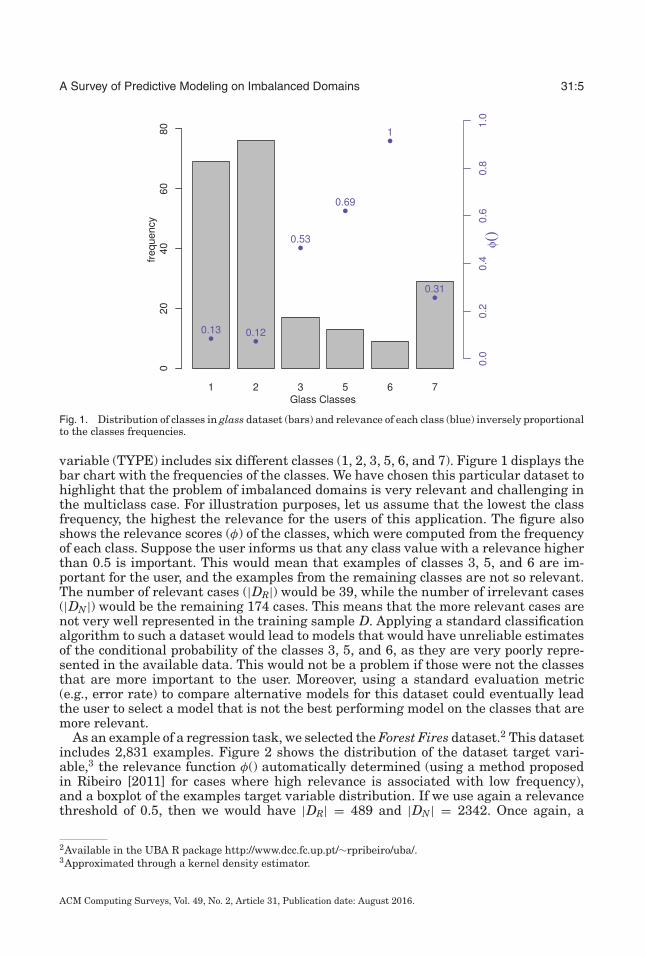
Fig. 1. Distribution of classes in glass dataset (bars) and relevance of each class (blue) inversely proportionalto the classes frequencies.
variable (TYPE) includes six different classes (1, 2, 3, 5, 6, and 7). Figure 1 displays thebar chart with the frequencies of the classes. We have chosen this particular dataset tohighlight that the problem of imbalanced domains is very relevant and challenging inthe multiclass case. For illustration purposes, let us assume that the lowest the classfrequency, the highest the relevance for the users of this application. The figure alsoshows the relevance scores (φ) of the classes, which were computed from the frequencyof each class. Suppose the user informs us that any class value with a relevance higherthan 0.5 is important. This would mean that examples of classes 3, 5, and 6 are im-portant for the user, and the examples from the remaining classes are not so relevant.The number of relevant cases (|DR|) would be 39, while the number of irrelevant cases(|DN|) would be the remaining 174 cases. This means that the more relevant cases arenot very well represented in the training sample D. Applying a standard classificationalgorithm to such a dataset would lead to models that would have unreliable estimatesof the conditional probability of the classes 3, 5, and 6, as they are very poorly repre-sented in the available data. This would not be a problem if those were not the classesthat are more important to the user. Moreover, using a standard evaluation metric(e.g., error rate) to compare alternative models for this dataset could eventually leadthe user to select a model that is not the best performing model on the classes that aremore relevant.
As an example of a regression task, we selected the Forest Fires dataset.2 This datasetincludes 2,831 examples. Figure 2 shows the distribution of the dataset target vari-able,3 the relevance function φ() automatically determined (using a method proposedin Ribeiro [2011] for cases where high relevance is associated with low frequency),and a boxplot of the examples target variable distribution. If we use again a relevancethreshold of 0.5, then we would have |DR| = 489 and |DN| = 2342. Once again, a
2Available in the UBA R package http://www.dcc.fc.up.pt/∼rpribeiro/uba/.3Approximated through a kernel density estimator.
ACM Computing Surveys, Vol. 49, No. 2, Article 31, Publication date: August 2016.

31:6 P. Branco et al.
Fig. 2. Distribution of the burned area in forest fires dataset (black), relevance function automaticallyestimated (blue), and boxplot of the examples distribution.
standard regression algorithm would have difficulties in performing well on the rareextreme high values of the target, because of their rarity in the training set. Again,this would be a problem given the established preference bias for this application, thatis, accuracy in the prediction of the biggest forest fires.
3. PERFORMANCE METRICS FOR IMBALANCED DOMAINS
This section describes existing approaches for performance assessment on imbalancedproblems. This is the most studied aspect of predictive modeling for these tasks. Nev-ertheless, issues such as the error estimation procedure and the statistical tests usedon imbalanced domains are also extremely important and have been, so far, largelyneglected. These issues present challenges when considering imbalanced domains andmuch research is still needed [Japkowicz 2013].
Obtaining a model from data can be seen as a search problem guided by an evalua-tion criterion that establishes a preference ordering among different alternatives. Themain problem with imbalanced domains is the user preference towards the perfor-mance on cases that are poorly represented in the available data sample. Standardevaluation criteria tend to focus the evaluation of the models on the most frequentcases, which is against the user preferences on these tasks. In fact, the use of tradi-tional metrics in imbalanced domains can lead to sub-optimal classification models [Heand Garcia 2009; Weiss 2004; Kubat and Matwin 1997] and may produce misleadingconclusions since these measures are insensitive to skewed domains [Ranawana andPalade 2006; Daskalaki et al. 2006]. As such, selecting proper evaluation metrics playsa key role in the task of correctly handling data imbalance. Adequate metrics shouldnot only provide means to compare the models according to the user preferences butalso can be used to drive the learning of these models.
ACM Computing Surveys, Vol. 49, No. 2, Article 31, Publication date: August 2016.
A Survey of Predictive Modeling on Imbalanced Domains 31:7
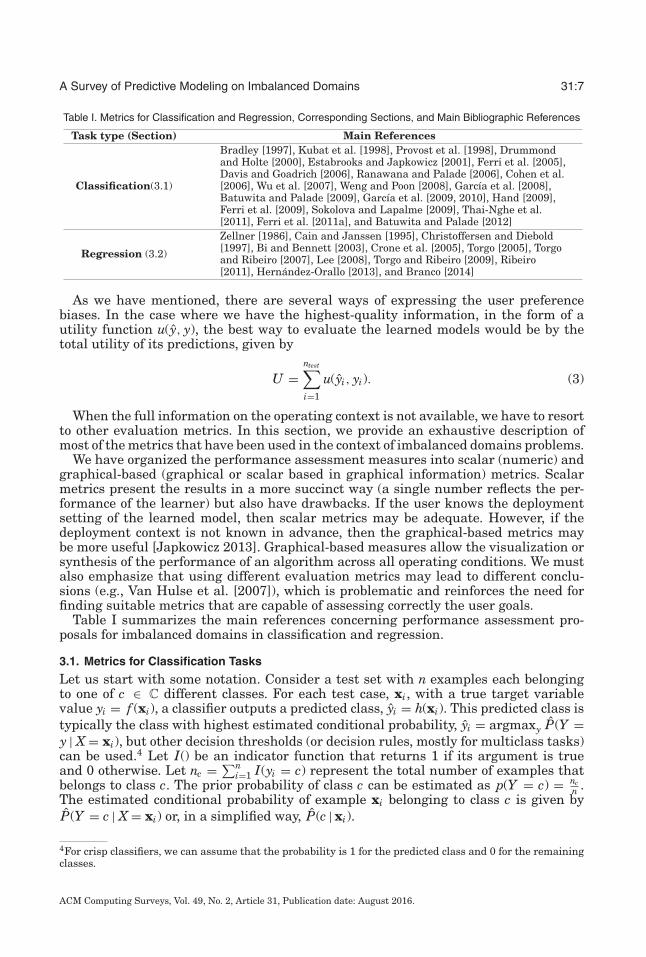
Table I. Metrics for Classification and Regression, Corresponding Sections, and Main Bibliographic References
Task type (Section) Main References
Classification(3.1)
Bradley [1997], Kubat et al. [1998], Provost et al. [1998], Drummondand Holte [2000], Estabrooks and Japkowicz [2001], Ferri et al. [2005],Davis and Goadrich [2006], Ranawana and Palade [2006], Cohen et al.[2006], Wu et al. [2007], Weng and Poon [2008], Garcıa et al. [2008],Batuwita and Palade [2009], Garcıa et al. [2009, 2010], Hand [2009],Ferri et al. [2009], Sokolova and Lapalme [2009], Thai-Nghe et al.[2011], Ferri et al. [2011a], and Batuwita and Palade [2012]
Regression (3.2)
Zellner [1986], Cain and Janssen [1995], Christoffersen and Diebold[1997], Bi and Bennett [2003], Crone et al. [2005], Torgo [2005], Torgoand Ribeiro [2007], Lee [2008], Torgo and Ribeiro [2009], Ribeiro[2011], Hernandez-Orallo [2013], and Branco [2014]
As we have mentioned, there are several ways of expressing the user preferencebiases. In the case where we have the highest-quality information, in the form of autility function u(y, y), the best way to evaluate the learned models would be by thetotal utility of its predictions, given by
U =ntest∑i=1
u(yi, yi). (3)
When the full information on the operating context is not available, we have to resortto other evaluation metrics. In this section, we provide an exhaustive description ofmost of the metrics that have been used in the context of imbalanced domains problems.
We have organized the performance assessment measures into scalar (numeric) andgraphical-based (graphical or scalar based in graphical information) metrics. Scalarmetrics present the results in a more succinct way (a single number reflects the per-formance of the learner) but also have drawbacks. If the user knows the deploymentsetting of the learned model, then scalar metrics may be adequate. However, if thedeployment context is not known in advance, then the graphical-based metrics maybe more useful [Japkowicz 2013]. Graphical-based measures allow the visualization orsynthesis of the performance of an algorithm across all operating conditions. We mustalso emphasize that using different evaluation metrics may lead to different conclu-sions (e.g., Van Hulse et al. [2007]), which is problematic and reinforces the need forfinding suitable metrics that are capable of assessing correctly the user goals.
Table I summarizes the main references concerning performance assessment pro-posals for imbalanced domains in classification and regression.
3.1. Metrics for Classification Tasks
Let us start with some notation. Consider a test set with n examples each belongingto one of c ∈ C different classes. For each test case, xi, with a true target variablevalue yi = f (xi), a classifier outputs a predicted class, yi = h(xi). This predicted class istypically the class with highest estimated conditional probability, yi = argmaxy P(Y =y | X = xi), but other decision thresholds (or decision rules, mostly for multiclass tasks)can be used.4 Let I() be an indicator function that returns 1 if its argument is trueand 0 otherwise. Let nc = ∑n
i=1 I(yi = c) represent the total number of examples thatbelongs to class c. The prior probability of class c can be estimated as p(Y = c) = nc
n .The estimated conditional probability of example xi belonging to class c is given byP(Y = c | X = xi) or, in a simplified way, P(c | xi).
4For crisp classifiers, we can assume that the probability is 1 for the predicted class and 0 for the remainingclasses.
ACM Computing Surveys, Vol. 49, No. 2, Article 31, Publication date: August 2016.

31:8 P. Branco et al.
Table II. Confusion Matrix for a Two-Class Problem
Predicted Total
Positive Negative(Y = +) (Y = −)
TruePositive (Y = +) TP=
n∑i=1
I(yi = +)I(yi = +) FN = n+ − TP n+ =n∑
i=1
I(yi = +)
Negative (Y = −) FP = n− − TN TN=n∑
i=1
I(yi = −)I(yi = −) n− =n∑
i=1
I(yi = −)
Totaln∑
i=1
I(yi = +)n∑
i=1
I(yi = −) n
3.1.1. Scalar Metrics.
Two-Class Problems. Consider a binary classification task with a negative (Y = −)and a positive class (Y = +). The confusion matrix for a two-class problem presents theresults obtained by a given classifier (cf. Table II). This table provides for each classthe instances that were correctly classified, that is, the number of True Positives (TP)and True Negatives (TN), and the instances that were wrongly classified, that is, thenumber of False Positives (FP) and False Negatives (FN).
Accuracy (cf. Equation (4)) and its complement error rate are the most frequently usedmetrics for estimating the performance of learning systems in classification problems.For two-class problems, accuracy can be defined as follows:
accuracy = TP + TNTP + FN + TN + FP
. (4)
Considering a user preference bias towards the minority (positive) class examples,accuracy is not suitable because the impact of the least-represented, but more impor-tant, examples is reduced when compared to that of the majority class. For instance,if we consider a problem where only 1% of the examples belong to the minority class,a high accuracy of 99% is achievable by predicting the majority class for all examples.Yet, all minority class examples, the rare and more interesting cases for the user, aremisclassified. This is worthless when the goal is the identification of the rare cases.
The metrics used in imbalanced domains must consider the user preferences and,thus, should take into account the data distribution. To fulfill this goal, several per-formance measures were proposed. From Table II, the following measures (cf. Equa-tions (5)–(10)) can be obtained:
true positive rate (recall or sensitivity) : TPrate = TPTP + FN
, (5)
true negative rate(specificity) : TNrate = TNTN + FP
, (6)
false positive rate : FPrate = FPTN + FP
, (7)
false negative rate : FNrate = FNTP + FN
, (8)
positive predictive value (precision ) : PPvalue = TPTP + FP
, (9)
negative predictive value : NPvalue = TNTN + FN
. (10)
ACM Computing Surveys, Vol. 49, No. 2, Article 31, Publication date: August 2016.

A Survey of Predictive Modeling on Imbalanced Domains 31:9
However, as some of these measures exhibit a tradeoff and it is impractical to simul-taneously monitor several measures, new metrics have been developed, such as theFβ [Rijsbergen 1979], the geometric mean [Kubat et al. 1998], or the receiver operatingcharacteristic (ROC) curve [Egan 1975].
The Fβ is defined as a combination of both precision and recall, as follows:
Fβ = (1 + β)2 · recall · precisionβ2 · precision + recall
, (11)
where β is a coefficient set by the user to adjust the relative importance of recall withrespect to precision (if β = 1 precision and recall have the same weight, large values ofβ will increase the weight of recall while values less than 1 will give more importanceto precision). The majority of the articles that use Fβ for performance evaluation underimbalanced domains adopt β = 1, which corresponds to giving the same importance toprecision and recall.
The Fβ is commonly used and is more informative than accuracy about the effec-tiveness of a classifier on predicting correctly the cases that matter to the user (e.g.,Estabrooks and Japkowicz [2001]). This metric value is high when both the recall (ameasure of completeness) and the precision (a measure of exactness) are high.
An also frequently used metric when dealing with imbalanced datasets is the geo-metric mean (G-Mean), which is defined as follows:
G-Mean =√
TPTP + FN
× TNTN + FP
=√
sensitivity × speci f icity. (12)
G-Mean is an interesting measure because it computes the geometric mean of theaccuracies of the two classes, attempting to maximize them while obtaining good bal-ance. This measure was developed specifically for assessing the performance underimbalanced domains. However, with this formulation equal importance is given to bothclasses. In order to focus the metric only on the positive class, a new version of G-Meanwas proposed. In this new formulation, specificity is replaced by precision.
Several other measures were proposed for dealing with some particular disadvan-tages of the previously mentioned metrics. For instance, a metric called dominance[Garcıa et al. 2008] (cf. Equation (13)) was proposed to deal with the inability of G-Mean to explain how each class contributes to the overall performance,
dominance = TPrate − TNrate. (13)
This measure ranges from −1 to +1. A value of +1 represents situations where perfectaccuracy is achieved on the minority (positive) class, but all cases of the majority classare missed. A value of −1 corresponds to the opposite situation.
Another example is the index of balanced accuracy (IBA) [Garcıa et al. 2009, 2010](cf. Equation (14)), which quantifies a tradeoff between an index of how balanced bothclass accuracies are and a chosen unbiased measure of overall accuracy,
IBAα(M) = (1 + α · dominance)M, (14)
where (1 + α · dominance) is the weighting factor and M represents any performancemetric. IBAα(M) depends on two user-defined parameters: M and α. The first one, M,is an assessment measure previously selected by the user, and the second one, α, willgive more or less importance to dominance.
Another interesting metric, named mean class-weighted accuracy (CWA), was pro-posed by Cohen et al. [2006]. This metric tries to overcome the limitation of Fβ of nottaking into account the performance on the negative class. At the same time, it also
ACM Computing Surveys, Vol. 49, No. 2, Article 31, Publication date: August 2016.

31:10 P. Branco et al.
tries to deal with the drawback of G-Mean, which does not allow us to give more impor-tance to the minority class. The CWA metric (cf. Equation (15)) tries to deal with bothproblems by providing a mechanism for the user to define the weights to be used,
CWA = w · sensitivity + (1 − w) · specificity, (15)
with 0 ≤ w ≤ 1 as the user-defined weight of the positive class.Other metrics created with similar objectives include optimized precision [Ranawana
and Palade 2006], adjusted geometric mean [Batuwita and Palade 2009, 2012], orB42 [Thai-Nghe et al. 2011].
Multi-class Problems. Although most metrics were proposed for handling two-classimbalanced tasks, some proposals also exist for the multi-class case.
Accuracy is among the metrics that were extended for multi-class problems. Equa-tion (16) presents the definition of accuracy for multi-class tasks as an average of theaccuracy of each class. However, for the reasons that we have already mentioned, thisis not an appropriate choice for imbalanced domains,
accuracy =∑n
i=1 I(yi = yi)n
. (16)
The extension to multi-class of the precision and recall concepts is not an easy task.Several ways of accomplishing this were proposed in the literature. If we focus on asingle class c, then Equations (17) and (18) provide the recall and precision for thatclass, respectively. Equation (19) represents the corresponding Fβ score,
recall(c) =n∑
i=1
I(yi = c)I(yi = c)nc
, (17)
precision(c) =∑n
i=1 I(yi = c)I(yi = c)∑ni=1 I(yi = c)
, (18)
Fβ(c) = (1 + β)2 · recall(c) · precision(c)β2 · precision(c) + recall(c)
. (19)
However, using recall(c) and precision(c) in multi-class problems is not a practicalsolution. If we consider a problem with 5 classes, then we would obtain 10 differentscores (a precision and a recall value for each class). In this case, it is not easy tocompare the performance of different classifiers. In order to obtain a single aggregatedvalue for precision or recall in a certain test set, two main strategies can be used:micro or macro averaging, which we will represent through the use of indexes μ andM, respectively. Equations (20) to (22) provide the definitions of precision and recallconsidering both micro (μ) and macro (M) averaging strategies,
Recμ = Precμ =∑n
i=1 I(yi = yi)n
, (20)
RecM =∑
c ∈ Crecall(c)|C| , (21)
PrecM =∑
c ∈ Cprecision(c)|C| . (22)
We must highlight that macro-averaging measures assign an equal weight to allexisting classes, while for micro-averaging-based metrics more importance is assigned
ACM Computing Surveys, Vol. 49, No. 2, Article 31, Publication date: August 2016.

A Survey of Predictive Modeling on Imbalanced Domains 31:11
to classes with higher frequencies. Therefore, micro-averaging measures are usuallyconsidered unsuitable for imbalanced domains because of the mismatch between theexamples distribution and the relevance φ() assigned by the user.
Regarding the Fβ measure, several different proposals were made to provide anextension for multi-class problems. Equation (23), proposed by Ferri et al. [2009],averages the Fβ values obtained for each class,
MFβ =∑
c ∈CFβ(c)
|C| . (23)
Two other proposals regarding an extension of Fβ to multi-class tasks exist: oneusing the micro averaged values of recall and precision and a similar one that uses themacro averaged values [Sokolova and Lapalme 2009]. Equations (24) and (25) showthese definitions,
MFβμ = (1 + β2) · Precμ · Recμ
β2 · Precμ + Recμ
, (24)
MFβM = (1 + β2) · PrecM · RecM
β2 · PrecM + RecM. (25)
The macro-averaged accuracy (MAvA), presented by Ferri et al. [2009], is obtainedwith an arithmetic average over the recall of each class as follows:
MAvA =∑
c ∈Crecall(c)|C| . (26)
The MAvA measure assigns equal weights to the existing classes. Sun et al. [2006]presented the MAvG metric, a generalization of the G-Mean for more than two classes(cf. Equation (27)). The MAvG is the geometric average of the recall score in each class,
MAvG = |C|√∏
c ∈ C
recall(c). (27)
Finally, we highlight that the CW A measure (cf. Equation (15)) presented for two-class problems was generalized for multi-class problems [Cohen et al. 2006] as follows:
CWA =∑c ∈C
wc · recall(c), (28)
where 0 ≤ wc ≤ 1 and∑
c ∈ Cwc = 1. In this case, it is the user responsibility to specify
the weights wc assigned to each class.Although some effort has been made regarding scalar metrics for multi-class evalua-
tion, there is still a big gap regarding assessment measures for multi-class imbalanceddomains. This is still an open problem, with only few solutions proposed and presentingmore challenges than binary classification.
3.1.2. Graphical-Based Metrics.
Two-Class Problems. Two popular tools used in imbalanced domains are the receiveroperating characteristics (ROC) curve (cf. Figure 3) and the corresponding area underthe ROC curve (AUC) [Metz 1978]. Provost et al. [1998] proposed ROC and AUC asalternatives to accuracy. The ROC curve allows the visualization of the relative tradeoffbetween benefits (TPrate) and costs (FPrate). The performance of a classifier for a certain
ACM Computing Surveys, Vol. 49, No. 2, Article 31, Publication date: August 2016.

31:12 P. Branco et al.
Fig. 3. ROC curve of three classifiers: A, B, and random.
distribution is represented by a single point in the ROC space. A ROC curve consistsof several points, each one corresponding to a different value of a decision/thresholdparameter used for classifying an example as belonging to the positive class.
However, comparing several models through ROC curves is not an easy task unlessone of the curves dominates all the others [Provost and Fawcett 1997]. Moreover, ROCcurves do not provide a single-value performance score, which motivates the use ofAUC. The AUC allows the evaluation of the best model on average. Still, it is notbiased towards the minority class. The area under the ROC curve (AUC) is given by adefinite integral. Several ways exist to evaluate the AUC, with the trapezoidal methodbeing the most widely used. This method obtains the value of AUC through the use oftrapezoids built with linear interpolation of the ROC curve points.
Another interesting property of the AUC regards the equivalence between the AUCand the probability that, given two randomly chosen examples, one from each class,the classifier will rank the positive example higher than the negative [Fawcett 2006].This is also known as the Wilcoxon test of ranks. Using this property, the AUC can bedetermined by the following equation:
AUC(c, c′) =∑n
i=1 I(yi = c)∑n
t=1 I(yt = c′)L(P(c | xi), P(c | xt))nc · nc′
, (29)
where c and c′ are the two classes of the problem and L is a function defined as follows:
L(x, y) ={1 if x > y
0.5 if x = y0 if x < y
. (30)
AUC has become a very popular metric in the context of imbalanced domains. How-ever, one of the problems that affects AUC concerns the crossing of ROC curves, whichmay produce misleading estimates. This issue results from using a single metric for
ACM Computing Surveys, Vol. 49, No. 2, Article 31, Publication date: August 2016.

A Survey of Predictive Modeling on Imbalanced Domains 31:13
summarizing a ROC curve. Another important problem of AUC, highlighted by Hand[2009], regards the existence of variations in the evaluation of AUC depending on theclassifier used. This is a more serious problem because this means that the AUC eval-uates different classifiers through the use of different measures. Hand [2009] showedthat the evaluation provided by AUC can be misleading but has also proposed analternative for allowing fairer comparisons: the H-measure. The H-measure is a stan-dardized measure of the expected minimum loss obtained for a given cost distributiondefined between the two classes of the problem. Hand [2009] proposes the use of abeta(x; 2, 2) distribution for representing the cost. The advantages pointed for usingthis distribution are twofold: It allows a general comparison of the results obtainedby different researchers, and it gives less weight to the more extreme values of cost.Although the coherence of AUC was questioned by Hand, a possible coherent interpre-tation for this measure was also presented by Ferri et al. [2011b]. Despite the fact thatit has been surrounded with some controversy, the AUC is still one of the most usedmeasures under imbalanced domains. To provide a better adaptation of this metric tothese domains, several AUC variants were proposed for two-class problems.
A version of the AUC that incorporates probabilities is Prob AUC [Ferri et al. 2005],defined in Equation (31). The Prob AUC tries to overcome the problem of the AUC mea-sure, which only considers the ranking of the examples disregarding the probabilitiesassociated with them,
Prob AUC(c, c′) =∑n
i=1I(yi=c)P(c |xi )
nc− ∑n
i=1I(yi=c′)P(c′ | xi )
nc′+ 1
2. (31)
The Scored AUC, presented by Wu et al. [2007], is a measure similar to Prob AUCthat also includes probabilities in its definition (cf. Equation (32)). This variant hasalso the goal of obtaining a score more robust to variations in the rankings that occurbecause of small changes in the probabilities.
Scored AUC(c, c′) =∑n
i=1 I(yi = c)∑n
t=1 I(yt = c′)L(P(c | xi)P(c | xt)) · (P(c | xi) − P(c′ | xt))nc · nc′
. (32)
A weighted version of the AUC, WAUC, was proposed by Weng and Poon [2008] fordealing with imbalanced datasets. This new measure assumes that the area near thetop of the graph is more relevant. Therefore, instead of summing the areas to obtainthe AUC giving the same importance to all, WAUC progressively assigns more weightto the areas closer to the top of the ROC curve.
Precision-recall curves (PR curves) are recommended for highly skewed domainswhere ROC curves may provide an excessively optimistic view of the perfor-mance [Davis and Goadrich 2006]. PR curves have the recall and precision rates repre-sented on the axes. A strong relation between PR and ROC curves was found by Davisand Goadrich [2006]. Figure 4 shows both curves for the imbalanced hepatitis dataset.5The results displayed were obtained with an SVM model considering the minority classas the relevant one.
Another relevant tool for two-class problems are the cost curves (Figure 5) that wereintroduced by Drummond and Holte [2000]. In these curves, the performance (i.e.,the expected cost normalized to [0, 1]) is represented in the y-axis. The x-axis (alsonormalized to [0, 1]) displays the probability cost function, which is defined as follows:
PCF(+) = p(+)C(−|+)p(+)C(−|+) + p(+)C(+|−)
, (33)
5This dataset is available in the UCI repository (https://archive.ics.uci.edu/ml/datasets/Hepatitis).
ACM Computing Surveys, Vol. 49, No. 2, Article 31, Publication date: August 2016.

31:14 P. Branco et al.
Fig. 4. Precision-recall curve and ROC curve for the hepatitis dataset.
Fig. 5. Example of a cost curve.
where p(c1) represents the probability of a given class c1 and C(c1|c2) represents thecost of misclassifying an example of a class c2 as being of class c1. There is a relation ofduality between ROC and cost curves. In fact, a point in the ROC space is represented bya line in the cost space, and a line on ROC space is represented by a point in cost space.
Brier curves [Ferri et al. 2011a] are a graphical representation that can be used withprobabilistic binary classifiers that try to overcome an optimistic view of performanceprovided by cost curves. Brier curves and cost curves are complementary in the sensethat these two curves used together are able to condense most of the informationrelative to a classifier performance.
ACM Computing Surveys, Vol. 49, No. 2, Article 31, Publication date: August 2016.

A Survey of Predictive Modeling on Imbalanced Domains 31:15
Multi-class Problems. Dealing with multi-class problems using graphical-based met-rics is a much more complex task. A possible way for obtaining ROC curves with cdifferent classes is to use the one-vs.-all strategy. In this method, each class is consid-ered as the positive class at a time and all the other classes are joined as the negativeclass. However, as the number of classes increases, the complexity of constructing theROC curve grows exponentially. For the simpler case of three classes, a ROC surfacewas proposed [Mossman 1999].
The AUC was also adapted to multi-class problems (e.g., Ferri et al. [2009]). Severalproposals exist to accomplish this adaptation (cf. Equations (34) to (39)), each onemaking different assumptions. AUC of each class against the rest using the uniformclass distribution (AUNU) and AUC of each class against the rest using the a prioriclass distribution (AUNP) use the approach one vs. all to compute the AUC of a|C|-class problem, transforming it into |C| two-class problems. Each one of the classesis considered the positive class and all the others are aggregated into one negativeclass. In AUNU, classes are assumed to be uniformly distributed, and in AUNP theprior probability of each class is taken into account. AU1U and AU1P compute theAUC of all pairs of classes, which corresponds to |C|(|C| − 1) two-class problems.The first measure considers that the classes are uniformly distributed and the latterincorporates the prior probability of the classes. Finally, Scored AUC and Prob AUCwere also extended to a multi-class setting through the metrics called SAUC (cf.Equation (38)) and PAUC (cf. Equation (39)), respectively. These two variants alsoconsider all the combinations of pairs of classes (|C|(|C| − 1)),
AUNU =∑
c ∈ CAUC(c, restc)
|C| , (34)
where restc is the aggregation of all the problem classes with the exception of class c,
AUNP =∑c∈C
p(c) · AUC(c, restc), (35)
AU1U =∑
c ∈ C
∑c′ ∈ C\{c} AUC(c, c′)
|C|(|C| − 1), (36)
AU1P =∑
c ∈ C
∑c′ ∈ C\{c} p(c) · AUC(c, c′)
|C|(|C| − 1), (37)
SAUC =∑
c ∈ C
∑c′ ∈ C\{c} Scored AUC(c, c′)
|C|(|C| − 1), (38)
PAUC =∑
c ∈ C
∑c′ ∈ C\{c} Prob AUC(c, c′)
|C|(|C| − 1). (39)
Comparative studies involving some of the metrics proposed for the multi-classimbalanced context (e.g., Alejo et al. [2013] and Sanchez-Crisostomo et al. [2014])concluded that these metrics do not always reflect correctly the performance in theminority/majority classes. This means that these metrics may not be reliable whenassessing the performance in multi-class problems.
3.2. Metrics for Regression Tasks
3.2.1. Scalar Metrics. A very small effort has been made regarding evaluation metricsfor regression tasks in imbalanced domains. Performance measures commonly used
ACM Computing Surveys, Vol. 49, No. 2, Article 31, Publication date: August 2016.

31:16 P. Branco et al.
in regression, such as Mean Squared Error (MSE) and Mean Absolute Error (MAE)6
(cf. Equations (40) and (41)) are not adequate to these specific problems. These mea-sures assume a uniform relevance of the target variable domain and evaluate only themagnitude of the error,
MSE = 1n
n∑i=1
(yi − yi)2, (40)
MAE = 1n
n∑i=1
|yi − yi|. (41)
Although the magnitude of the numeric error is important, for tasks with imbalanceddomains of the target variable, the metrics should also be sensitive to the errors locationwithin the target variable domain, because, as in classification tasks, users of thesedomains are frequently biased to the performance on poorly represented values ofthe target. This means that the error magnitude must have a differentiated impactdepending on the values of the target domain where the error occurs.
In the area of finance, several attempts have been made for considering differentiatedprediction costs through the proposal of asymmetric loss functions [Zellner 1986; Cainand Janssen 1995; Christoffersen and Diebold 1996, 1997; Crone et al. 2005; Granger1999; Lee 2008]. However, the proposed solutions, such as LIN-LIN or QUAD-EXPerror metrics, all suffer from the same problem: They can only distinguish betweenover- and under-predictions. Therefore, they are still unsuitable for addressing theproblem of imbalanced domains with a user preference bias towards some specificranges of values.
Another alternative is the concept of utility-based regression [Ribeiro 2011; Torgoand Ribeiro 2007]. This concept is based on the assumption that the user assigns anon-uniform relevance to the values of the target variable domain. In this context,the usefulness of a prediction depends on both the numeric error of the prediction(which is provided by a certain loss function L(y, y)) and the relevance (importance) ofthe predicted y and true y values. As within classification tasks, we have a problemof imbalanced domains if the user assigns more importance to predictions involvingvalues of the target variable that are rare (i.e., poorly represented in the trainingsample). The proposed framework for utility-based regression provides means for easyspecification of a utility function, u(y, y), for regression tasks. This means that we canuse this framework to evaluate and/or compare models using the total utility of theirpredictions as indicated in Equation (3).
This utility-based framework was also used by Torgo and Ribeiro [2009] and Ribeiro[2011] to derive the notions of precision and recall for regression in tasks with non-uniform relevance of the target values. Based on this previous work, Branco [2014]proposed the following measures of precision and recall for regression:
precision =∑
φ(yi )>tR(1 + u(yi, yi))∑
φ(yi )>tR(1 + φ(yi))
, (42)
recall =∑
φ(yi )>tR(1 + u(yi, yi))∑
φ(yi )>tR(1 + φ(yi))
, (43)
where φ(yi) is the relevance associated with the true value yi, φ(yi) is the relevanceof the predicted value yi, tR is a user-defined threshold signalling the cases that are
6Also known as Mean Absolute Deviation (MAD).
ACM Computing Surveys, Vol. 49, No. 2, Article 31, Publication date: August 2016.

A Survey of Predictive Modeling on Imbalanced Domains 31:17
Fig. 6. RROC curve of three models: A, B, and C.
relevant for the user, and u(yi, yi) is the utility of making the prediction yi for the truevalue yi, normalized to [−1, 1].
3.2.2. Graphical-Based Metrics. Following the efforts made within classification, someattempts were made to adapt the existing notion of ROC curves to regression tasks.One of these attempts is the ROC space for regression (RROC space) [Hernandez-Orallo2013], which is motivated by the asymmetric loss often present on regression applica-tions where both over-estimations and under-estimations entail different costs. RROCspace is defined by plotting the total over-estimation and under-estimation on the x-axis and y-axis, respectively (cf. Figure 6). RROC curves are obtained when the notionof shift is used, which allows us to adjust the model to an asymmetric operating con-dition by adding or subtracting a constant to the predictions. The notion of dominancecan also be assessed by plotting the curves of different regression models, similarly toROC curves in classification problems. Other evaluation metrics were explored, suchas the Area Over the RROC curve (AOC), which was shown to be equivalent to the errorvariance. In spite of the relevance of this approach, it only distinguishes over fromunder predictions.
Another relevant effort towards the adaptation of the concept of ROC curves to re-gression tasks was made by Bi and Bennett [2003] with the proposal of RegressionError Characteristic (REC) curves that provide a graphical representation of the cu-mulative distribution function (cdf) of the error of a model. These curves plot the errortolerance and the accuracy of a regression function that is defined as the percentageof points predicted within a given tolerance ε. REC curves illustrate the predictiveperformance of a model across the range of possible errors (cf. Figure 7). The Area Overthe Curve (AOC) can also be evaluated and is a biased estimate of the expected error ofa model [Bi and Bennett 2003]. REC curves, although interesting, are still not sensitiveto the error location across the target variable domain.
ACM Computing Surveys, Vol. 49, No. 2, Article 31, Publication date: August 2016.

31:18 P. Branco et al.
Fig. 7. REC curve of three models: A, B, and C.
Fig. 8. An example of the REC surface.
To address this problem, Regression Error Characteristic Surfaces (RECS) [Torgo2005] were proposed. These surfaces incorporate an additional dimension into RECcurves representing the cumulative distribution of the target variable. RECS showhow the errors corresponding to a certain point of the REC curve are distributed acrossthe range of the target variable (cf. Figure 8). This tool allows us to study the behaviorof alternative models for certain specific values of the target variable. By zooming onspecific regions of REC surfaces, we can carry out two types of analysis that are highlyrelevant for some application domains. The first involves checking how certain valuesof prediction error are distributed across the domain of the target variable, which tellsus where errors are more frequent. The second type of analysis involves inspecting thetype of errors a model has on a certain range of the target variable that is of particularinterest to us, which is very relevant for imbalanced domains.
ACM Computing Surveys, Vol. 49, No. 2, Article 31, Publication date: August 2016.

A Survey of Predictive Modeling on Imbalanced Domains 31:19
4. STRATEGIES FOR HANDLING IMBALANCED DOMAINS
Imbalanced domains raise significant challenges when building predictive models. Thescarce representation of the most important cases leads to models that tend to bemore focused on the normal examples, neglecting the rare events. Several strategieshave been developed to address this problem, mainly in a classification setting. Evenwhen considering solely the existing solutions for classification tasks, these are mostlybiased towards binary classification. Proposals exist specifically for the multiclass casebut in a much lower number. The effectiveness and applicability of these strategiesdepends on the information the user is able to provide on his preference biases—the“problem-definition issue” [Weiss 2013] mentioned in Section 2. We propose to group theexisting approaches to learn under imbalanced domains into the following four maincategories:
—Data Pre-processing;—Special-purpose Learning Methods;—Prediction Post-processing;—Hybrid Methods.
Data pre-processing approaches include solutions that pre-process the given imbal-anced dataset, changing the data distribution to make standard algorithms focus onthe cases that are more relevant for the user. These methods have the following ad-vantages: (i) They can be applied with any existing learning tool, and (ii) the chosenmodels are biased to the goals of the user (because the data distribution was previouslychanged to match these goals), and thus it is expected that the models are more inter-pretable in terms of these goals. The main inconvenient of this strategy is that it maybe difficult to relate the modifications in the data distribution with the informationprovided by the user concerning the preference biases. This means that mapping thegiven data distribution into an optimal new distribution according to the user goals istypically not easy.
Special-purpose learning methods comprise solutions that change the existing algo-rithms to be able to learn from imbalanced data. The following are important advan-tages: (i) The user goals are incorporated directly into the models, and (ii) it is expectedthat the models obtained this way are more comprehensible to the user. The main dis-advantages of these approaches are as follows: (i) The user is restricted to the learningalgorithms that have been modified to be able to optimize his goals or has to developnew algorithms for the task; (ii) if the target loss function changes, the model mustbe relearned, and, moreover, it may be necessary to introduce further modifications inthe algorithm, which may not be straightforward; (iii) it requires a deep knowledge ofthe learning algorithms implementations; and (iv) it may not be easy to translate theuser preferences into a suitable loss function that can be incorporated into the learningprocess.
Prediction post-processing approaches use the original dataset and a standard learn-ing algorithm, only manipulating the predictions of the models according to the userpreferences and the imbalance of the data. As advantages, we can enumerate that:(i) It is not necessary to be aware of the user preference biases at learning time; (ii) theobtained model can, in the future, be applied to different deployment scenarios (i.e.,different loss functions), without the need of re-learning the models or even keepingthe training data available; and (iii) any standard learning tool can be used. However,these methods also have some drawbacks: (i) The models do not reflect the user pref-erences and (ii) the models interpretability may be jeopardized as they were obtainedoptimizing a loss function that is not in accordance with the user preference bias atdeployment time.
ACM Computing Surveys, Vol. 49, No. 2, Article 31, Publication date: August 2016.

31:20 P. Branco et al.
Table III. Main Advantages and Disadvantages of Each Type of Strategy for Imbalanced Domains
Strategy Advantages Disadvantages
DataPre-processing
� can be applied to any learningtool
� the chosen models are biased tothe goals of the user
� models more interpretableaccording to the user goals
� difficulty of relating themodifications in the datadistribution and the userpreferences
Special-purposeLearning Methods
� user goals are incorporateddirectly into the models
� models obtained are morecomprehensible to the user
� user is restricted in his choice ofthe learning algorithms thathave been modified to be able tooptimize his goals
� models must be relearned if thetarget loss function changes
� changes in the loss function mayrequire further modifications inthe algorithm
� requires a deep knowledge of thelearning algorithmsimplementations
� not easy to map the userspecification of his preferencesinto a loss function
PredictionPost-processing
� it is not necessary to be aware ofthe user preferences biases atlearning time
� the obtained model can, in thefuture, be applied to differentdeployment scenarios withoutthe need of re-learning themodels or even keeping thetraining data available
� any standard learning tool can beused
� the models do not reflect the userpreferences
� models interpretability may bejeopardized as they wereobtained optimizing a lossfunction that is not in accordancewith the user preference bias
Fig. 9. Main strategies for handling imbalanced domains.
Table III shows a summary of the main advantages and disadvantages of each typeof strategy. Figure 9 provides a general overview of the main approaches within thesestrategies, which will be reviewed in Sections 4.1, 4.2, and 4.3, including solutionsfor both classification and regression tasks. Hybrid solutions will be addressed in
ACM Computing Surveys, Vol. 49, No. 2, Article 31, Publication date: August 2016.

A Survey of Predictive Modeling on Imbalanced Domains 31:21
Section 4.4. Hybrid methods combine approaches of different strategies trying to takeadvantage of their best characteristics.
4.1. Data Pre-Processing
Pre-processing strategies consist of methods of using the available dataset in a waythat is more in accordance with the user preference biases. This means that insteadof applying a learning algorithm directly to the provided training sample, we will firstsomehow pre-process this data according to the goals of the user. Any standard learningalgorithm can then be applied to the pre-processed dataset.
Existing data pre-processing approaches can be grouped into two main types:
—distribution change: change the data distribution with the goal of addressing theissue of the poor representativeness of the more relevant cases; and
—weighting the data space: modify the training set distribution using informationconcerning misclassification costs, such that the learned model avoids costly errors.
Table IV summarizes the main bibliographic references for data pre-processing strat-egy approaches.
4.1.1. Distribution Change. Applying a method that changes the data distribution to ob-tain a more balanced one is an effective solution to the imbalance problem [Estabrookset al. 2004; Batuwita and Palade 2010a; Fernandez et al. 2008, 2010].
However, changing the data distribution may not be as easy as expected. Decidingwhat the optimal distribution is for some user preference biases is not straightforward,even in cases where a complete specification of the utility function, u(y, y), is available.A frequently used approach consists of trying to balance the data distribution (e.g.,make the classes have the same frequency). However, for some classifiers such as C4.5,Ripper, or Naive Bayes, it was proved that a perfectly balanced distribution does notalways provide optimal results [Weiss and Provost 2003]. In this context, some solutionswere proposed to find the right amount of change in the distribution to be applied fora dataset [Weiss and Provost 2003; Chawla et al. 2005, 2008]. For the case of extremeclass imbalance, where the number of normal examples (DN) is much larger than thenumber of rare examples (DR), other class balancing methods are recommended such as2:1 or 3:1 (majority:minority) [Khoshgoftaar et al. 2007]. These results were obtainedbased on experiments with 11 different types of classifiers.
For binary classification problems, changing the class distribution of the trainingdata may improve classifiers performance on an imbalanced context because there is aconnection with non-uniform misclassification costs. This equivalence between the twoconcepts of altering the data distribution and the misclassification cost ratio is wellknown and was first pointed out by Breiman et al. [1984]. However, as mentioned byWeiss [2013], this equivalence does not hold in many real-world situations due to someof its assumptions on data availability.
The existing approaches for changing the data distribution can be of three types:stratified sampling, synthesizing new data, or combinations of the previous methods.Stratified sampling includes strategies that remove and/or add examples to the originaldataset. These are based on a diverse set of techniques, such as random under-/over-sampling, distance methods, data cleaning approaches, clustering algorithms, or evo-lutionary algorithms. Approaches that synthesize new data differ because they involvethe generation of new artificially generated examples that are added to the originaldataset. Finally, it is also possible to combine the previously described approaches. Wenow briefly describe the most significant techniques for changing the data distribution.
Two of the most simple approaches for data sampling that can be applied are under-and over-sampling. The first one removes data from the original dataset, reducing the
ACM Computing Surveys, Vol. 49, No. 2, Article 31, Publication date: August 2016.

31:22 P. Branco et al.
Table IV. Pre-Processing Strategy Approaches, Corresponding Sections, and Main Bibliographic References
Approaches (Section) Main References
DistributionChange(4.1.1)
Stratified Sampling
Random Under/Over-sampling
Chawla et al. [2002], Chang et al. [2003],Drummond and Holte [2003], Chen et al.[2004], Estabrooks et al. [2004], Tao et al.[2006], Wang and Yao [2009], Seiffertet al. [2010], Wallace et al. [2011], andTorgo et al. [2013]
Distance Based Chyi [2003], Mani and Zhang [2003], andBłaszczynski and Stefanowski [2015]
Data CleaningBased
Kubat and Matwin [1997], Laurikkala[2001], Batista et al. [2004], andNaganjaneyulu and Kuppa [2013]
Recognition Based
Japkowicz [2000], Chawla et al. [2004],Raskutti and Kowalczyk [2004], Lee andCho [2006], Zhuang and Dai [2006a,2006b], Bellinger et al. [2012], and Wagstaffet al. [2013]
Cluster BasedJo and Japkowicz [2004], Cohen et al.[2006], Yen and Lee [2006, 2009], andSobhani et al. [2014]
EvolutionarySampling
Del Castillo and Serrano [2004], Garcıaet al. [2006], Doucette and Heywood [2008],Drown et al. [2009], Garcıa and Herrera[2009], Maheshwari et al. [2011], Garcıaet al. [2012], Yong [2012], and Galar et al.[2013]
Synthesizing New Data
Lee [1999, 2000], Chawla et al. [2002,2003], Batista et al. [2004], Han et al.[2005], Liu et al. [2007], He et al. [2008],Bunkhumpornpat et al. [2009], Hu et al.[2009], Wang and Yao [2009], Menardi andTorelli [2010], Maciejewski andStefanowski [2011], Zhang et al. [2011],Barua et al. [2012], Bunkhumpornpatet al. [2012], Martınez-Garcıa et al. [2012],Ramentol et al. [2012a, 2012b], Verbiestet al. [2012], Nakamura et al. [2013], Torgoet al. [2013], Gao et al. [2014], Li et al.[2014], Zhang and Li [2014], Bellinger et al.[2015], and Saez et al. [2015]
Combination of Methods
Liu et al. [2006], Mease et al. [2007], Liet al. [2008], Stefanowski and Wilk [2008],Chen et al. [2010], Jeatrakul et al. [2010],Napierał et al. [2010], Songwattanasiri andSinapiromsaran [2010], Bunkhumpornpatet al. [2011], Vasu and Ravi [2011], Sharmaet al. [2012], Yang and Gao [2012], and Nget al. [2014]
Weighting the Data Space(4.1.2)
Zadrozny et al. [2003]
sample size, while the second one adds data, increasing the sample size. In randomunder-sampling, a random set of majority class examples are discarded. This mayeliminate useful examples leading to a worse performance. Oppositely, in random over-sampling, a random set of copies of minority class examples is added to the data.This may increase the likelihood of overfitting, especially for higher over-samplingrates [Chawla et al. 2002; Drummond and Holte 2003]. Moreover, it may decrease theclassifier performance and increase the computational effort.
ACM Computing Surveys, Vol. 49, No. 2, Article 31, Publication date: August 2016.

A Survey of Predictive Modeling on Imbalanced Domains 31:23
Random under-sampling was also used in the context of ensembles. Namely, it wascombined with boosting [Seiffert et al. 2010] and bagging [Chang et al. 2003; Taoet al. 2006; Wang and Yao 2009; Wallace et al. 2011] and was applied to both classesin random forests in a method named Balanced Random Forest (BRF) [Chen et al.2004]. An interesting theoretically based motivation was provided in Wallace et al.[2011] for using bagging with balanced bootstrap samples obtained through randomunder-sampling. This theoretical approach is further explored in Section 6.
For regression tasks, Torgo et al. [2013] perform random under-sampling of thecommon values as a strategy for addressing the imbalance problem. This method usesa relevance function and a user defined threshold to determine which are the commonand uninteresting values that should be under-sampled.
Despite the potential of randomly selecting examples, under- and over-samplingstrategies can also be carried out by other, more informed, methods. For instance, under-sampling can be accomplished through the use of distance evaluations [Chyi 2003;Mani and Zhang 2003]. These approaches perform under-sampling based on a certaindistance criterion that determines which are the examples from the majority class toinclude in the training set. Several proposals exist, ranging between the extreme casesof selecting the majority class examples that are closer to the minority class examples,or choosing the negative examples with the farthest distance to the positive examples.These strategies are very time consuming, which is a major disadvantage, especiallywhen dealing with large datasets.
Under-sampling can also be achieved through data cleaning methods. The main goalof these methods is to identify possibly noisy examples or overlapping regions and thendecide on the removal of examples. One of those methods uses Tomek links [Tomek1976], which consist of points that are each other’s closest neighbors but do not sharethe same class label. This method allows for two options: only remove Tomek linksexamples belonging to the majority class or eliminate Tomek links examples of bothclasses [Batista et al. 2004]. The notion of the Condensed Nearest Neighbour Rule(CNN) [Hart 1968] was also applied to perform under-sampling [Kubat and Matwin1997]. CNN is used to find a subset of examples consistent with the training set, thatis, a subset that correctly classifies the training examples using a 1-nearest-neighborclassifier. The CNN and Tomek links methods were combined in this order by Kubatand Matwin [1997] in a strategy called One-Sided-Selection (OSS) and in the reverseorder in a proposal of Batista et al. [2004].
Recognition-based methods as one-class learning or autoencoders offer the possibilityto perform the most extreme type of under-sampling where all the examples from theminority class are removed. In this type of approach, and contrary to discrimination-based inductive learning, the model is learned using only examples of one class, and nocounterexamples are included. This lack of examples from the other class(es) is the keydistinguishing feature between recognition-based and discrimination-based learning.
One-class learning tries to set up boundaries that surround the majority class con-cept. This method starts by measuring the similarity between the majority class andan object. Classification is then performed using a threshold on the obtained similarityscore. One-class learning methods have the disadvantage of requiring the tuning of thethreshold imposed on the similarity. In fact, this is a sensitive issue because if we choosea too-narrow threshold, then the majority class examples are disregarded. However,too-wide thresholds may lead to including examples from the minority class. Therefore,establishing an efficient threshold is vital with this method. Also, some learners actu-ally need examples from more than one class and are unable to adapt to this method.Despite all these possible disadvantages, recognition-based learning algorithms havebeen shown to provide good prediction performance in most domains. Developmentsmade in this context include one-class SVMs (e.g., Scholkopf et al. [2001], Manevitz and
ACM Computing Surveys, Vol. 49, No. 2, Article 31, Publication date: August 2016.

31:24 P. Branco et al.
Yousef [2002], Raskutti and Kowalczyk [2004], Zhuang and Dai [2006a, 2006b], andLee and Cho [2006]) and the use of an autoencoder (or autoassociator) (e.g., Japkowiczet al. [1995] and Japkowicz [2000]).
An innovative recognition based-method for large datasets was proposed by Wagstaffet al. [2013] that aims at both facilitating the discovery of novel observations and atproviding an explanation for the detected cases. This is achieved through an incremen-tal Singular Value Decomposition (SVD) method that allows the selection of exampleswith high novelty which is measured by reconstruction error.
Imbalanced domains can influence the performance and the efficiency of clusteringalgorithms [Xuan et al. 2013]. However, due to their flexibility, several approaches ap-peared for dealing with imbalanced datasets using clustering methods. For instance,the cluster-based over-sampling (CBO) algorithm proposed by Jo and Japkowicz [2004]addresses both the imbalance problem and the problem of small disjuncts. Small dis-juncts are subclusters of a certain class that have a low coverage, that is, classifyonly few examples [Holte et al. 1989]. CBO consists of clustering the training data ofeach class separately with the k-means technique and then performing random over-sampling in each cluster. All majority class clusters are over-sampled until they reachthe cardinality of the largest cluster of this class. Then the minority class clusters areover-sampled until both classes are balanced, maintaining all minority class subclus-ters with the same number of examples. Several other proposals based on clusteringtechniques exist (e.g., Yen and Lee [2006, 2009] and Cohen et al. [2006]). Recently,clustering techniques were also combined with ensembles [Sobhani et al. 2014]. Thisproposal starts by clustering the majority class examples. Then, several classifiers aretrained in balanced datasets that use all the minority class examples and at leastone majority class example from each previously determined cluster. A majority votingscheme is used to obtain the final class label.
Another approach for data sampling concerns the use of Evolutionary Algorithms(EA). These algorithms started to be applied to imbalanced domains as a strategyto perform under-sampling through a prototype selection (PS) procedure (e.g., Garcıaet al. [2006] and Garcıa and Herrera [2009]).
Garcıa et al. [2006] made one of the first contributions with a new evolutionarymethod proposed for balancing the dataset. The presented method uses a new fitnessfunction designed to perform a prototype selection process. Some proposals have alsoemerged in the area of heuristics and metrics for improving several genetic program-ming classifiers performance in imbalanced domains [Doucette and Heywood 2008].
However, EA have been used for more than under-sampling. More recently, GeneticAlgorithms (GA) and clustering techniques were combined to perform both under- andover-sampling [Maheshwari et al. 2011; Yong 2012]. Evolutionary under-sampling hasalso been combined with boosting [Galar et al. 2013].
Another important approach for dealing with the imbalance problem as a pre-processing step is the generation of new synthetic data. Several methods exist forbuilding new synthetic examples. Most of the proposals are focused on classificationtasks. Synthesizing new data has several known advantages [Chawla et al. 2002;Menardi and Torelli 2010], namely: (i) It reduces the risk of overfitting, which is in-troduced when replicas of the examples are inserted in the training set, and (ii) itimproves the ability of generalization, which was compromised by the over-samplingmethods. The methods for synthesizing new data can be organized into two groups:(i) one that introduces perturbations and (ii) another that uses interpolation of exist-ing examples.
Lee [1999] proposed an over-sampling method that produces noisy replicates of therare cases while keeping the majority class unchanged. The synthetic examples aregenerated by adding normally distributed noise to the minority class examples. This
ACM Computing Surveys, Vol. 49, No. 2, Article 31, Publication date: August 2016.

A Survey of Predictive Modeling on Imbalanced Domains 31:25
simple strategy was tested with success, and a new version was developed by Lee[2000]. This new approach generates, for a given dataset, multiple versions of trainingsets with added noise. Then, an average of multiple model estimates is obtained.
Recently, Bellinger et al. [2015] proposed a new method for generating syntheticsample named DEnoising Autoencoder-based Generative Oversampling (DEAGO).This proposal is based on the capabilities of recontruction of denoising autoencoders[Vincent et al. 2010]. The denoising autoencoders are neural networks that are able toreconstruct at the output layer clean versions of the network input. DEAGO generatessynthetic samples with Gaussian noise added that are then used as input of the denois-ing autoencoders. This proposal was evaluated for the gamma-ray spectral domain.
Another framework, named Random Over Sampling Examples (ROSE), for dealingwith the problem of imbalanced classification was presented by Menardi and Torelli[2010] based on a smoothed bootstrap re-sampling technique. ROSE generates a morebalanced and completely new dataset from the given training set combining over- andunder-sampling. One observation is drawn from the training set by giving the sameprobability to both existing classes. A new example is generated in the neighborhood ofthis observation, using a width for the neighborhood determined by a chosen smoothingmatrix.
Zhang and Li [2014] use a random-walk-based approach as an over-sampling strategyto generate new examples from the minority class. This approach allows the extensionof the classification border.
A famous method that uses interpolation is the synthetic minority over-samplingtechnique (SMOTE) [Chawla et al. 2002]. SMOTE over-samples the minority classby generating new synthetic data. This technique is then combined with a certainpercentage of random under-sampling of the majority class that depends on a user-defined parameter. Artificial data are created using an interpolation strategy thatintroduces a new example along the line segment joining a seed example and one ofits k minority class nearest neighbors. The number of minority class neighbors (k) isanother user-defined parameter. For each minority class example, a certain number ofexamples is generated according to a predefined over-sampling percentage.
The SMOTE algorithm has been applied with several different classifiers and wasalso integrated with boosting [Chawla et al. 2003] and bagging [Wang and Yao 2009].
Nevertheless, SMOTE generates synthetic examples with the positive class label,disregarding the negative class examples that may lead to overgeneralization [Yen andLee 2006; Maciejewski and Stefanowski 2011; Yen and Lee 2009]. This strategy may beespecially problematic in the case of highly skewed class distributions where the minor-ity class examples are very sparse, thus resulting in a greater chance of class mixture.
Some of the drawbacks identified in the SMOTE algorithm motivated the appear-ance of several variants of this method. We can identify three main types of vari-ants: (i) application of some pre- or post-processing before or after the use of SMOTE,(ii) applying SMOTE only in some selected regions of the input space, or (iii) introducingsmall modifications to the SMOTE algorithm. Most of the first type of SMOTE variantsstart by applying the SMOTE algorithm and, afterwards, use a post-processing mecha-nism for removing some data. Examples of this type of approach include the following:SMOTE and Tomek Links (SMOTE+Tomek) [Batista et al. 2004], SMOTE and EditedNearest Neighbors (SMOTE+ENN) [Batista et al. 2004], SMOTE and Fuzzy Rough SetTheory (SMOTE+FRST) [Ramentol et al. 2012b] or SMOTE and Rough Sets Theory(SMOTE+RSB) [Ramentol et al. 2012a]. An exception is the Fuzzy Rough ImbalancedPrototype Selection (FRIPS) [Verbiest et al. 2012] method, which pre-processes thedataset before applying the SMOTE algorithm. The second type of SMOTE variantsonly generates synthetic examples in specific regions that are considered useful forthe learning algorithms. As the notion of what is a good region is not straightforward,
ACM Computing Surveys, Vol. 49, No. 2, Article 31, Publication date: August 2016.

31:26 P. Branco et al.
several strategies were developed. Some of these variants focus the synthesizing efforton the borders between classes while others try to find which are the harder-to-learninstances and concentrate on these ones. Examples of these approaches are as follows:Borderline-SMOTE [Han et al. 2005], Adaptive Synthetic (ADASYN) [He et al. 2008],Modified Synthetic Minority Oversampling Technique (MSMOTE) [Hu et al. 2009], Ma-jority Weighted Minority Oversampling TEchnique (MWMOTE) [Barua et al. 2012],and SMOTE inspired by the theory of fractal interpolation (FSMOTE) [Zhang et al.2011], among others. Regarding the last type of SMOTE variants, some modificationsare introduced in the way SMOTE generates the synthetic examples. For instance,the synthetic examples may be generated closer or further apart from a seed depend-ing on some measure. The following proposals are examples within this group: Safe-Level-SMOTE [Bunkhumpornpat et al. 2009], Safe Level Graph [Bunkhumpornpatand Subpaiboonkit 2013], Local Neighbourhood Extension of SMOTE (LN-SMOTE)[Maciejewski and Stefanowski 2011], and Density-based synthetic minority over-sampling technique (DBSMOTE) [Bunkhumpornpat et al. 2012].
For regression problems, only one method for generating new synthetic data wasproposed. Torgo et al. [2013] have adapted the SMOTE algorithm to regression tasks.Three key components of the SMOTE algorithm required adaptation for regression:(i) how to define which are the relevant observations and the “normal” cases, (ii) how togenerate the new synthetic examples (i.e., over-sampling), and (iii) how to determinethe value of the target variable in the synthetic examples. Regarding the first issue, arelevance function and a user-specified threshold were used to define DR and DN sets.The observations in DR are over-sampled, while cases in DN are under-sampled. For thegeneration of new synthetic examples the same interpolation method used in SMOTEfor classification was applied. Finally, the target value of each synthetic example wascalculated as a weighted average of the target variable values of the two seed examples.The weights were calculated as an inverse function of the distance of the generatedcase to each of the two seed examples.
Finally, several other interesting methods have appeared that combine some ofthe previous techniques [Stefanowski and Wilk 2008; Bunkhumpornpat et al. 2011;Songwattanasiri and Sinapiromsaran 2010; Yang and Gao 2012]. For instance,Jeatrakul et al. [2010] presents a method that uses Complementary Neural Networks(CMTNN) to perform under-sampling and combines it with SMOTE. The combina-tion of strategies was also applied to ensembles (e.g., Liu et al. [2006], Mease et al.[2007], and Chen et al. [2010]). An interesting approach that combines clustering withrecognition-based methods was proposed by Sharma et al. [2012]. This method startsby applying a clustering algorithm and then, in each determined cluster, a one-classlearner is trained. The final model is obtained by combining the predictions of all theone-class learners trained.
Some attention has also been given to SVMs, leading to proposals such as the oneof Kang and Cho [2006], where an ensemble of under-sampled SVMs is presented.Multiple different training sets are built by sampling examples from the majority classand combining them with the minority class examples. Each training set is used fortraining an individual SVM classifier. The ensemble is produced by aggregating theoutputs of all individual classifiers. Another similar approach is the EnSVM [Liu et al.2006], which adopts a rebalance strategy combining the over-sampling strategy of theSMOTE algorithm and under-sampling to form a number of new training sets whileusing all the positive examples. Then, an ensemble of SVMs is built.
Several ensembles have been adapted and combined with approaches for changingthe data distribution to better tackle the problem of imbalanced domains. Essentially,for every type of ensemble, some attempt has been made. For a more complete reviewon ensembles for the class imbalance problem, see Galar et al. [2012].
ACM Computing Surveys, Vol. 49, No. 2, Article 31, Publication date: August 2016.

A Survey of Predictive Modeling on Imbalanced Domains 31:27
Table V. Special-Purpose Learning Methods, Corresponding Section, and Main Bibliographic References
Strategy type (Section) Main References
Special-Purpose Learning Methods(4.2)
Joshi et al. [2001], Barandela et al. [2003], Maloof[2003], Ribeiro and Torgo [2003], Tan et al. [2003],Torgo and Ribeiro [2003], Wu and Chang [2003],Akbani et al. [2004], Chen et al. [2004], Huanget al. [2004], Wu and Chang [2005], Imam et al.[2006], Tang and Zhang [2006], Zhou and Liu[2006], Alejo et al. [2007], Sun et al. [2007],Cieslak and Chawla [2008], Li et al. [2009], Songet al. [2009], Tang et al. [2009], Batuwita andPalade [2010b], Liu et al. [2010], Wang andJapkowicz [2010], Hwang et al. [2011], Oh [2011],Ribeiro [2011], Cieslak et al. [2012], Rodrıguez etal. [2012], Weiguo et al. [2012], Xiao et al. [2012],Cao et al. [2013], and Castro and de Padua Braga[2013]
4.1.2. Weighting the Data Space. The strategy of weighting the data space is a way ofimplementing cost-sensitive learning and thus can be an effective method for handlingimbalanced domains when information on the costs of errors is available. In fact,misclassification costs are applied to the given dataset with the goal of selecting the besttraining distribution. Essentially, this method is based on the fact that changing theoriginal sampling distribution by multiplying each case by a factor that is proportionalto its importance (relative cost) allows any standard learner to accomplish expectedcost minimization on the original distribution. Although it is a simple technique andeasy to apply, it also has some drawbacks. There is a risk of model overfitting and it isalso possible that the real cost values are unavailable, which can introduce the extradifficulty of exploring effective cost setups.
This approach has a strong theoretical foundation, building on the Translation Theo-rem derived by Zadrozny et al. [2003]. Namely, to obtain a modified distribution biasedtowards the costly classes, the training set distribution is modified with regards tomisclassification costs.
Zadrozny et al. [2003] presented two different ways of accomplishing this conversion:in a transparent box or in a black box way. In the first, the weights are provided tothe classifier, while for the second a careful sub-sampling is performed according to thesame weights. The first approach cannot be applied to an arbitrary learner, while thesecond one results in severe overfitting if sampling with replacement is used. Thus, toovercome the drawbacks of the latter approach, the authors have presented a methodcalled cost-proportionate rejection sampling which accepts each example in the inputsample with probability proportional to its associated weight.
4.2. Special-Purpose Learning Methods
The approaches at this level consist of solutions that modify existing algorithms toprovide a better fit to the user preferences. The task of developing a solution basedon algorithm modifications is not an easy one. It requires a deep knowledge of boththe learning algorithm and also of the user preference biases. In order to perform amodification on a selected algorithm, it is essential to understand why it fails when thedistribution does not match the user preferences. Moreover, any adaptation requiresinformation on the full utility function, which is frequently hard to obtain. On theother hand, these methods have the advantage of being very effective in the contextsfor which they were designed.
Existing solutions for dealing with imbalanced domains at the learning level are fo-cused on the introduction of modifications in the algorithm preference criterion. Table Vsummarizes the main bibliographic references for this type of approach.
ACM Computing Surveys, Vol. 49, No. 2, Article 31, Publication date: August 2016.

31:28 P. Branco et al.
The incorporation of benefits and/or costs (negative benefits) in existing algo-rithms, as a way to express the utility of different predictions, is one of the knownapproaches to cope with imbalanced domains. This includes the well-known cost-sensitive algorithms for classification tasks that directly incorporate costs in the learn-ing process. In this case, the goal of the prediction task is to minimize expected cost,knowing that misclassified examples may have different costs.
The research literature includes several works describing the adaptation of differ-ent classifiers in order to make them cost-sensitive. For decision trees, the impact ofthe incorporation of costs under imbalanced domains was addressed by Maloof [2003].Regarding support vector machines, several ways of integrating costs have been con-sidered, such as assigning different penalties to false negatives and positives [Akbaniet al. 2004] or including a weighted attribute strategy [Yuanhong et al. 2009], amongothers [Weiguo et al. 2012]. Regarding neural networks, the possibility of making themcost-sensitive has also been considered (e.g., Zhou and Liu [2006], Alejo et al. [2007],and Oh [2011]). A Cost-Sensitive Multilayer Perceptron (CSMLP) algorithm was pro-posed by Castro and de Padua Braga [2013] for asymmetrical learning of Multilayerperceptrons (MLP) via a modified (backpropagation) weight update rule. Cao et al.[2013] present a framework for improving the performance of cost-sensitive neuralnetworks that uses Particle Swarm Optimization (PSO) for optimizing misclassifica-tion cost, feature subset, and intrinsic structure parameters. Alejo et al. [2007] proposetwo strategies for dealing with imbalanced domains using radial basis function (RBF)neural networks that include a cost function in the training phase.
Ensembles have also been considered in the cost-sensitive framework to handleimbalanced domains. Several ensemble methods have been successfully adapted toinclude costs during the learning phase. However, boosting was the most extensivelyexplored. Adaptive Boosting (AdaBoost) is the most representative algorithm of theboosting family. When the target class is imbalanced, AdaBoost biases the learning(through the weights) towards the majority class, as it contributes more to the overallaccuracy. Several proposals appeared which modify AdaBoost weight update processby incorporating cost items so examples from different classes are treated unequally.Important proposals in the context of imbalanced domains are RareBoost [Joshi et al.2001]; AdaC1, AdaC2, and AdaC3 [Sun et al. 2007]; and BABoost [Song et al. 2009].All of them modify the AdaBoost algorithm by introducing costs in the used weightupdating formula. These proposals differ in how they modify the update rule. Wangand Japkowicz [2010] proposes an ensemble of SVMs with asymmetric misclassificationcosts. The proposed system works by modifying the base classifier (SVM) using costsand uses boosting as the combination scheme. Random Forests have also been adaptedto better cope with imbalanced domains undergoing a cost-sensitive transformation.Chen et al. [2004] proposes a method called Weighted Random Forest (WRF) for dealingwith highly imbalanced domains based on the Random Forest algorithm. WRF strategyoperates by assigning a higher misclassification cost to the minority class. For anextensive review on ensembles for handling class imbalance see Galar et al. [2012].
Several other solutions exist that also modify the preference criteria of the algorithmswhile not relying directly on the definition of a cost/cost-benefit matrix. RegardingSVMs, several proposals try to bias the algorithm so the hyperplane is further awayfrom the positive class, because the skew associated with imbalanced datasets pushesthe hyperplane closer to the positive class. Wu and Chang [2003] accomplish thiswith an algorithm that changes the kernel function. Fuzzy Support Vector Machinesfor Class Imbalance Learning (FSVM-CIL) was a method proposed by Batuwita andPalade [2010b]. This algorithm is based on an SVM variant for handling the problemof outliers and noise called Fuzzy SVM (FSVM) [Lin and Wang 2002] and improves it
ACM Computing Surveys, Vol. 49, No. 2, Article 31, Publication date: August 2016.

A Survey of Predictive Modeling on Imbalanced Domains 31:29
for also dealing with imbalanced datasets. Potential Support Vector Machine (P-SVM)[Mangasarian and Wild 2001] differs from standard SVM learners by defining a newobjective function and constraints. An improved P-SVM algorithm [Li et al. 2009] wasproposed to better cope with imbalanced datasets.
k-Nearest Neighbors (k-NN) learners were also adapted to cope with the imbalanceproblem. Barandela et al. [2003] present a weighted distance function to be used inthe classification phase of k-NN without changing the class distribution. This methodassigns different weights to the respective classes and not to the individual prototypes.Since more weight is given to the majority class, the distance to minority class examplesbecomes much lower than the distance to examples from the majority class. This biasesthe learner to find their nearest neighbor among examples of the minority class.
A new decision tree algorithm—Class Confidence Proportion Decision Tree(CCPDT)—was proposed by Liu et al. [2010]. CCPDT is robust and insensitive to classdistribution and generates rules that are statistically significant. The algorithm adoptsa new proposed measure, called Class Confidence Proportion (CCP), which forms thebasis of CCPDT. CCP measure is embedded in the information gain and used as thesplitting criterion. In this algorithm, a new approach, using a Fisher exact test to prunebranches of the tree that are not statistically significant, is presented.
Hellinger distance was introduced as a decision tree splitting criterion to buildHellinger Distance Decision Trees (HDDT) [Cieslak and Chawla 2008]. This pro-posal was shown to be insensitive towards class imbalanced domains. More recently,Cieslak et al. [2012] recommended the use of bagged HDDTs as the preferred methodfor dealing with imbalanced domains when using decision trees.
For regression tasks, some works have addressed the problem of imbalanced domainsby changing the splitting criterion of regression trees (e.g., Torgo and Ribeiro [2003]and Ribeiro and Torgo [2003]).
The Kernel Boundary Alignment algorithm (KBA) is proposed in Wu and Chang[2005]. This method adjusts the boundary towards the majority class by modifying thekernel matrix generated by a kernel function according to the imbalanced domain.
An ensemble method for learning over multi-class imbalanced datasets, named en-semble Knowledge for Imbalance Sample Sets (eKISS), was proposed by Tan et al.[2003]. This algorithm was specifically designed to increase classifiers sensitivity with-out losing the corresponding specificity. The eKISS approach combines the rules of thebase classifiers to generate new classifiers for final decision making.
Recently, more sophisticated approaches were proposed as the Dynamic ClassifierEnsemble method for Imbalanced Data (DCEID), presented by Xiao et al. [2012].DCEID combines dynamic ensemble learning with cost-sensitive learning and is ableto adaptively select the more appropriate ensemble approach.
For regression problems, one work exists that is able to tackle the problem of imbal-anced domains through a utility-based algorithm. The utility-based Rules (ubaRules)approach was proposed by Ribeiro [2011]. ubaRules is a utility-based regression ruleensemble system designed for obtaining models biased according to a specific utilityfunction. The system main goal is to obtain accurate and interpretable predictions inthe context of regression problems with non-uniform utility. It consists of two mainsteps: generation of different regression trees, which are converted to rule ensembles,and selection of the best rules to include in the final ensemble. An utility function isused as criterion at several stages of the algorithm.
4.3. Prediction Post-Processing
For dealing with imbalanced domains at the post-processing level, we will consider twomain types of solutions:
ACM Computing Surveys, Vol. 49, No. 2, Article 31, Publication date: August 2016.
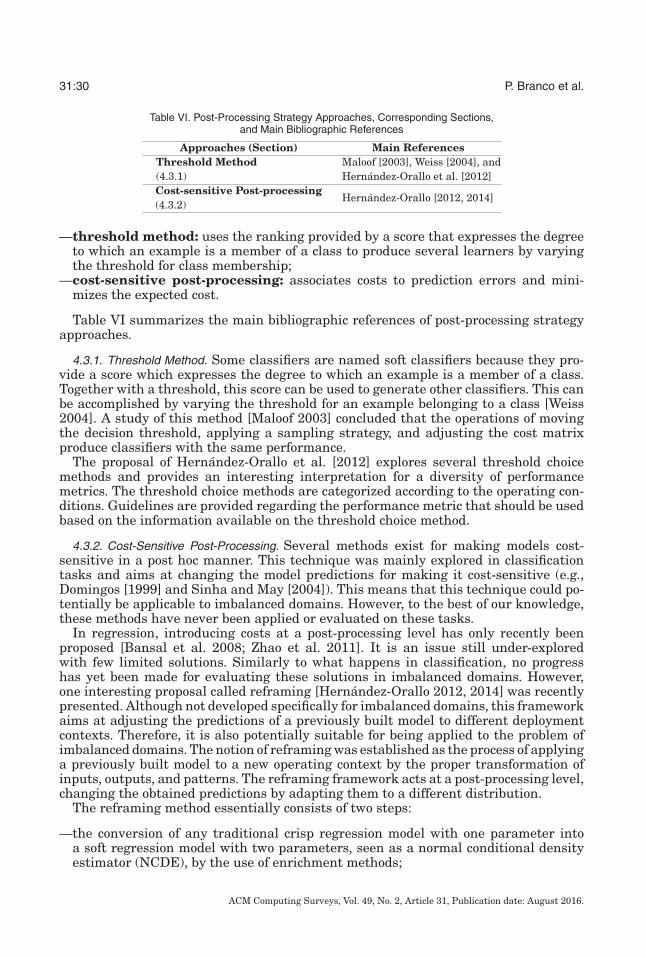
31:30 P. Branco et al.
Table VI. Post-Processing Strategy Approaches, Corresponding Sections,and Main Bibliographic References
Approaches (Section) Main ReferencesThreshold Method Maloof [2003], Weiss [2004], and(4.3.1) Hernandez-Orallo et al. [2012]Cost-sensitive Post-processing(4.3.2)
Hernandez-Orallo [2012, 2014]
—threshold method: uses the ranking provided by a score that expresses the degreeto which an example is a member of a class to produce several learners by varyingthe threshold for class membership;
—cost-sensitive post-processing: associates costs to prediction errors and mini-mizes the expected cost.
Table VI summarizes the main bibliographic references of post-processing strategyapproaches.
4.3.1. Threshold Method. Some classifiers are named soft classifiers because they pro-vide a score which expresses the degree to which an example is a member of a class.Together with a threshold, this score can be used to generate other classifiers. This canbe accomplished by varying the threshold for an example belonging to a class [Weiss2004]. A study of this method [Maloof 2003] concluded that the operations of movingthe decision threshold, applying a sampling strategy, and adjusting the cost matrixproduce classifiers with the same performance.
The proposal of Hernandez-Orallo et al. [2012] explores several threshold choicemethods and provides an interesting interpretation for a diversity of performancemetrics. The threshold choice methods are categorized according to the operating con-ditions. Guidelines are provided regarding the performance metric that should be usedbased on the information available on the threshold choice method.
4.3.2. Cost-Sensitive Post-Processing. Several methods exist for making models cost-sensitive in a post hoc manner. This technique was mainly explored in classificationtasks and aims at changing the model predictions for making it cost-sensitive (e.g.,Domingos [1999] and Sinha and May [2004]). This means that this technique could po-tentially be applicable to imbalanced domains. However, to the best of our knowledge,these methods have never been applied or evaluated on these tasks.
In regression, introducing costs at a post-processing level has only recently beenproposed [Bansal et al. 2008; Zhao et al. 2011]. It is an issue still under-exploredwith few limited solutions. Similarly to what happens in classification, no progresshas yet been made for evaluating these solutions in imbalanced domains. However,one interesting proposal called reframing [Hernandez-Orallo 2012, 2014] was recentlypresented. Although not developed specifically for imbalanced domains, this frameworkaims at adjusting the predictions of a previously built model to different deploymentcontexts. Therefore, it is also potentially suitable for being applied to the problem ofimbalanced domains. The notion of reframing was established as the process of applyinga previously built model to a new operating context by the proper transformation ofinputs, outputs, and patterns. The reframing framework acts at a post-processing level,changing the obtained predictions by adapting them to a different distribution.
The reframing method essentially consists of two steps:
—the conversion of any traditional crisp regression model with one parameter intoa soft regression model with two parameters, seen as a normal conditional densityestimator (NCDE), by the use of enrichment methods;
ACM Computing Surveys, Vol. 49, No. 2, Article 31, Publication date: August 2016.

A Survey of Predictive Modeling on Imbalanced Domains 31:31
Table VII. Hybrid Strategies, Corresponding Sections,and Main Bibliographic References
Strategy type (Section) Main References
Hybrid Strategies(4.4)
Estabrooks and Japkowicz [2001],Kotsiantis and Pintelas [2003],Estabrooks et al. [2004], Phua et al.[2004], Yoon and Kwek [2005], Ertekin etal. [2007a, 2007b], Zhu and Hovy [2007],Liu et al. [2009], Ghasemi et al. [2011a,2011b], Ertekin [2013], Mi [2013], andBarnab-Lortie et al. [2015]
—the reframing of an enriched soft regression model to new contexts by an instance-dependent optimization of the expected loss derived from the conditional normaldistribution.
4.4. Hybrid Methods
In recent years, several methods involving the combination of some of the basic ap-proaches described in the previous sections have appeared in the research literature.Due to their characteristics, these methods can be seen as hybrid methods to handleimbalanced domains. They try to capitalize on some of the main advantages of thedifferent approaches we have described previously.
Existing hybrid approaches combine the use of pre-processing approaches withspecial-purpose learning algorithms. Table VII summarizes the main bibliographicreferences concerning these hybrid strategies.
One of the first hybrid strategies was presented by Estabrooks and Japkowicz [2001]and Estabrooks et al. [2004]. The motivation for this proposal is related to the fact thata perfectly balanced data may not be optimal and that the right amount of over-/under-sample to apply is difficult to determine. To overcome these difficulties, a mixture-of-experts framework was proposed in an architecture with three levels: a classifier level,an expert level, and an output level. The system has two experts in the expert level:an under-sampling expert and an over-sampling expert. The architecture incorporates10 classifiers on the over-sampling expert and another 10 classifiers on the under-sampling expert. All these classifiers are trained in datasets sampled at differentrates of over- and under-sampling, respectively. At the classifier level, an eliminationstrategy is applied for removing the learners that are considered unreliable accordingto a predefined test. Then, a combination scheme is applied both at the expert andoutput levels. These combination schemes use the following simple heuristic: If one ofthe classifiers decides that the example is positive, then so does the expert, and if oneof the two experts decides that the example is positive, then so does the output level.This strategy is clearly heavily biased towards the minority (positive) class.
A different idea involving sampling and the combination of different learners wasproposed by Kotsiantis and Pintelas [2003]. The proposed approach uses a facilitatoragent and three learning agents, each one with its own learning system. The facilitatorstarts by filtering the features of the dataset. The filtered data are then passed tothe three learning agents. Each learning agent samples the dataset, learns using therespective system (Naive Bayes, C4.5, and 5-NN), and then returns the predictionsfor each instance back to the facilitator agent. Finally, the facilitator makes the finalprediction according to majority voting.
In the proposal of Phua et al. [2004], sampling is performed and, afterwards, stackingand boosting are used together. The applied sampling strategy partitions the datasetinto 11 new datasets that include all the minority class examples and a portion ofthe majority class examples. The proposed system uses three different learners (Naive
ACM Computing Surveys, Vol. 49, No. 2, Article 31, Publication date: August 2016.

31:32 P. Branco et al.
Bayes, C4.5, and a back-propagation classifier), each one processing the 11 partitionsof the data. Bagging is used to combine the classifiers trained by the same algorithm.Then stacking is used to combine the multiple classifiers generated by the differentalgorithms identifying the best mix of classifiers.
Other approaches combine pre-processing techniques with bagging and boosting, si-multaneously, composing an ensemble of ensembles. EasyEnsemble and BalanceCas-cade algorithms [Liu et al. 2009] are examples of this type of approach. Both algorithmsuse bagging as the main ensemble method and use AdaBoost for training each bag.As for the pre-processing technique, both construct balanced bags by randomly under-sampling examples from the majority class. In EasyEnsemble algorithm all AdaBoostiterations can be performed simultaneously because each AdaBoost ensemble uses apreviously determined subset of the data. All the generated classifiers are combinedfor a final solution. On the other hand, in the BalanceCascade algorithm, after theAdaBoost learning, the majority examples correctly classified with higher confidenceare discarded from further iterations.
Wang [2008] presents an approach that combines the SMOTE algorithm with Biased-SVM [Veropoulos et al. 1999]. The proposed approach applies the Biased-SVM in theimbalanced data and stores the obtained support vectors from both classes. ThenSMOTE is used to over-sample the support vectors with two alternatives: using onlythe obtained support vectors or using the entire minority class. A final classification isobtained with the new data using the biased-SVM.
Active learning is a semi-supervised strategy in which the learning algorithm is ableto interactively obtain information from the user. Although this method is traditionallyused with unlabelled data, it can also be applied when all class labels are known. Inthis case, the active learning strategy provides the ability of actively selecting thebest, that is, the most informative, examples to learn from. Active Learning by itselfis a technique that is able to deal with moderate imbalanced distributions. However,when a more severe imbalance occurs in the data, special techniques developed foractive learning that incorporate a preference towards the least represented and morerelevant cases (DR) should be used [Attenberg and Ertekin 2013].
Several approaches for imbalanced domains based on active learning have beenproposed [Ertekin et al. 2007a, 2007b; Zhu and Hovy 2007; Ertekin 2013]. These ap-proaches are concentrated on SVM learning systems and are based on the fact that, forthese types of learners, the most informative examples are the ones closest to the hyper-plane. This property is used to guide under-sampling by selecting the most informativeexamples, that is, choosing the examples closer to the hyperplane.
More recent developments try to combine active learning with other techniques tofurther improve the learner’s performance. Ertekin [2013] presents a novel adaptiveover-sampling algorithm named Virtual Instances Resampling Technique Using ActiveLearning (VIRTUAL), which combines the benefits of over-sampling and active learn-ing. Contrary to traditional sampling methods, which are applied before the trainingstage, VIRTUAL generates synthetic examples for the minority class during the train-ing process. Therefore, the need for a separate pre-processing step is discarded. Inthe context of learning with SVMs, VIRTUAL outperforms competitive over-samplingtechniques both in terms of generalization performance and computational complex-ity. Mi [2013] developed a method that combines SMOTE and active learning withSVMs.
Some efforts have also been made for integrating active learning with other clas-sifiers. Hu [2012] proposed an active learning method for imbalance data using theLocalized Generalization Error Model (L-GEM) of radial basis function neural net-works (RBFNN).
ACM Computing Surveys, Vol. 49, No. 2, Article 31, Publication date: August 2016.

A Survey of Predictive Modeling on Imbalanced Domains 31:33
Ghasemi et al. [2011a, 2011b] presented a new approach that also uses active learn-ing methods but only requires examples from the majority class. In these works severalscoring functions for selecting the most informative examples were experimented.
A proposal considering the integration of active learning and one-class classifierswas also presented by Barnab-Lortie et al. [2015].
Still, we must highlight that, overall, active learning-based methods tend to show adegradation in performance as the imbalance of the domain increases [Attenberg andErtekin 2013].
Finally, a strategy using a clustering method based on class purity maximization isproposed by Yoon and Kwek [2005]. This method generates clusters of pure majorityclass examples and non-pure clusters based on the improvement of the clusters classpurity. When the clusters are formed, all minority class examples are added to thenon-pure clusters and a decision tree is built for each cluster. An unlabelled exampleis clustered according to the same algorithm. If it falls on a non-pure cluster, then thedecision tree committee votes the prediction, but if it falls on a pure majority classcluster, then the final prediction is the majority class. If the committee votes for amajority class prediction, then that will be the final prediction. On the other hand, if itis a minority class prediction, then the example will be submitted to a final classifierthat is constructed using a neural network.
5. STUDIES ON THE EFFECTIVENESS OF THE METHODS
The task of evaluating and comparing all the proposed solutions for handling theproblem of imbalanced domains is not simple. First, there is a huge amount of proposalsto deal with imbalanced domains. Second, the impact of the strategies on differentlearning algorithms is not uniform (e.g., Van Hulse et al. [2007]), meaning that anyconclusions are frequently algorithm dependent. Finally, there is also the issue ofassessing the impact in performance of different levels of imbalance in the domain andof different dataset characteristics such as separability of data or the training set size.
The main questions that we would like to answer regarding the performance assess-ment under imbalanced domains are as follows:
—Which data characteristics contribute to further hinder the performance under im-balanced domains?
—Can we find approaches that generally provide the best improvement in the perfor-mance for these domains?
—Is the performance of the used learning algorithms affected in different degreesunder imbalanced domains?
—How does the different degree of imbalance in the data distribution affects theperformance?
Japkowicz and Stephen [2002] conducted one of the first studies to address thesequestions in a classification setting. This work appeared in an early stage of the devel-opment of these approaches, and therefore only five strategies were compared (randomunder-/over-sampling, under-/over-sampling at random but focused in parts of the in-put space far/close to the decision boundary, and, finally, change the misclassificationcosts of the classes). Unfortunately, most of the conclusions of this article were basedon comparisons of the error rate as the performance assessment measure, which is anunsuitable measure for these domains. The main conclusions were the following:
—When using decision trees:—the impact of the imbalanced domain increases as the data separability decreases;—by increasing the training set size, the impact of the imbalance in the domain is
reduced;
ACM Computing Surveys, Vol. 49, No. 2, Article 31, Publication date: August 2016.

31:34 P. Branco et al.
—the imbalance of the domain is only a problem when small disjuncts are presentin the data;
—over-sampling generally outperforms under-sampling;—changing the misclassification cost of the classes generally performs better than
random or focused over-sampling.—Decision trees were found to be the classifier most sensitive to the problem of im-
balanced domains; multi-layer perceptrons came next, showing less sensitivity; and,finally, support vector machines are identified as showing no sensitivity at all to thisproblem.
Batista et al. [2004] highlighted the importance of the contribution of other factors,such as small sample size and class overlap, in the performance degradation whenlearning under imbalanced datasets. This work uses only decision trees and compares10 pre-processing strategies using AUC. In general, it is concluded that over-sampling-based strategies have more advantages than under-sampling.
The results obtained in the two previously mentioned works do not always agree withother works on this issue where over-sampling is reported to be ineffective when usingdecision trees (e.g., Drummond and Holte [2003]). In fact, random under-sampling isnowadays generally considered as one of the most efficient approaches to deal withimbalanced domains.
More recently, a new experimental design was proposed [Batista et al. 2012; Pratiet al. 2014] to overcome the difficulty in assessing the capability of recovering from thelosses in performance caused by imbalance. One of the main conclusion of this work isin agreement with the previously mentioned articles regarding the poor sensitivity ofsupport vector machines to the imbalance in the domain. These were found to be theclassifiers least affected by imbalanced domains, only presenting some sensitivity tothe most severely imbalanced domains.
The authors used real datasets, and for each dataset several training set distributionswere generated with the same number of examples and different degrees of imbalance.The performance loss was measured relatively to the perfectly balanced distributionusing the following metric,
L = B− IB
, (44)
where B represents the performance on the perfectly balanced distribution and I theperformance obtained on the imbalanced distribution. The AUC was the metric selectedfor these experiments.
For all degrees of imbalance in the distribution some degradation in performancewas observed. As expected, this is more pronounced at higher levels of imbalance. Inthis study, the following five strategies were analyzed: random over-sampling, SMOTE,borderline-SMOTE, ADASYN, and Metacost. One of the main conclusions for highlyimbalanced domains (1/99, 5/95, and 10/90) is the general failure of all consideredstrategies. SMOTE was found not to be so competitive as expected when comparedto random over-sampling. Moreover, the results obtained for borderline-SMOTE andADASYN did not show a clear advantage compared to standard SMOTE. RegardingMetacost, its performance was also quite poor when compared to the other strategiesconsidered in the study.
Lopez et al. [2013] compared three types of classifiers (SVM, decision tree, andk-NN) on 66 datasets using the AUC metric. The approaches tested were clusteredinto the following: pre-processing (SMOTE, SMOTE+ENN, borderline-SMOTE, safe-level-SMOTE, ADASYN, Selective Pre-processing of Imbalanced Data (SPIDER2)[Napierała et al. 2010], and DBSMOTE), cost-sensitive learning (Weighted-Classifier,which simply introduces weights on the training set, Metacost, and the cost-sensitive
ACM Computing Surveys, Vol. 49, No. 2, Article 31, Publication date: August 2016.

A Survey of Predictive Modeling on Imbalanced Domains 31:35
classifier from the Weka environment), and ensemble-based techniques (AdaBoost-M1,AdaC2, RusBoost, smoteBagging, and EasyEnsemble).
The main conclusions from this study were as follows:
—regarding pre-processing strategies, SMOTE and SMOTE+ENN are the best per-formers; Borderline-SMOTE and ADASYN also present a robust performance onaverage;
—for the tested cost-sensitive learning methods, Metacost and Weighted-Classifierwere the ones that presented the best performance;
—SmoteBagging was the best ensemble method tested; RusBoost and EasyEnsemblealso performed well;
—For decision trees and k-NN, the best performing strategy was smoteBagging, whilefor SVMs SMOTE obtained the best performance closely followed by the remainingevaluated pre-processing strategies.
We must highlight that some results in Lopez et al. [2013] disagree with the onespresented by Batista et al. [2012], in particular, with respect to the Metacost approach.Another problem with these two latter works is the fact that both dropped from evalu-ation the random under-sampling method which was shown to be quite competitive inother studies.
Recently, Stefanowski [2016] studied the impact of several data characteristics inthe performance of both learning algorithms and pre-processing strategies. These datacharacteristics, called data difficulty factors, include the class overlap problem, theexistence of small disjuncts, and some characteristics of the minority class examples.Stefanowski [2016] proposes a categorization of the minority class cases with respectto their local characteristics into the following four types: safe, borderline, rare, andoutliers. Then, Stefanowski [2016] studies the relation between the dominant type ofminority examples in a dataset and both the performance obtained by several learningalgorithms and pre-processing strategies.
As a final remark, we stress that in all these cases, only binary classification taskshave been considered, and usually only one measure is used to assess the performance.This entails some limitations in the conclusions. I particular, it was shown that differentassessment measures may provide different evaluation results (e.g., Van Hulse et al.[2007]). Moreover, these articles always assumed that the best is to perfectly balancethe distribution that has also been shown not to be the most favorable setting in termsof performance (e.g., Weiss and Provost [2003] and Khoshgoftaar et al. [2007]).
6. THEORETICAL ADVANCES
The problem of imbalanced domains is a relevant problem with important applicationsin a wide range of fields. The scientific community has been producing several ap-proaches to this problem as we have surveyed in the previous sections. These proposalstypically solve the problem in a particular domain or on a small set of tasks. However,many of the developed techniques fail under different imbalanced problems. An impor-tant question that arises then is as follows: Why and when will a particular techniquedeveloped for the problem of imbalanced domains fail or succeed? The reasons behindthis unstable behavior are not understood, and we believe that only with more effortregarding the theoretical foundations of imbalanced domains we will be able to answerthis question. The lack of a theoretical understanding of the problem is holding backthe evolution of the solutions.
In spite of its relevance, the fact is that only a few theoretical contributions havebeen produced by the research community. While the range of approaches for handlingimbalanced problems is increasing, the work on the theoretical foundations of theproblem is scarce. We consider that one of the reasons for this is related to the lack of
ACM Computing Surveys, Vol. 49, No. 2, Article 31, Publication date: August 2016.

31:36 P. Branco et al.
a precise definition of the problem, one that includes the diversity of applications ofimbalanced domains.
The lack of a precise definition of the problem frequently leads to some misconcep-tions being widely spread throughout the scientific community. One example is theequivalence between sampling methods and misclassification costs. This connectionwas first established by Breiman et al. [1984]. However, for real-world applications,Weiss [2013] has shown that the equivalence frequently does not hold. Consider, forinstance, a binary classification problem with 1,100 examples and an imbalanced do-main with a class distribution of 10:1. This means that the positive class consists of100 examples and the negative class is formed by 1,000 cases. Let us set the cost offalse negatives to 10 and the cost of false positives to 1. In this case, we have, the-oretically, a situation of equivalence between the definition of misclassification costsand a balanced domain. A balanced domain could be obtained by under-sampling thenegative class (multiplying it by 1
10 ) or by over-sampling the minority class (multiply-ing it by 10). However, when performing under-sampling, potentially useful data maybe discarded and, when performing over-sampling, there is the risk of overfitting ifreplicas are introduced. The equivalence would only hold if new minority class exam-ples were available from the original distribution. Even the generation of syntheticexamples from the minority class would not be sufficient to hold the equivalence be-cause these new examples are not drawn from the original distribution and are onlyapproximations of that distribution. This means that the equivalence would only holdin real-world scenarios if new minority class examples were available for training. But,if this was possible, then the problem of imbalanced domains would not exist, becauseextra new data would be available as needed.
Regarding further theoretical contributions, we must highlight that this equivalencewas further explored by Elkan [2001]. A theorem was proved, for binary classificationtasks, that established a general formula regarding how to resample the negative classexamples to obtain optimal cost-sensitive decisions using a standard non-cost-sensitivelearning algorithm. In spite of being more general, this formulation also suffers fromthe problems mentioned above on real-world applications.
A theoretical analysis of imbalance was presented by Wallace et al. [2011] and used tosupport a new proposal for tackling the problem of imbalanced domains. The analysistries to answer a question raised by several researchers (e.g., Van Hulse et al. [2007])and that is still not well understood: Why does under-sampling often presents a betterperformance when compared to other, sometimes more complex, techniques? The factis that, empirically, under-sampling tends to outperform other approaches (rangingfrom simple random over-sampling to the generation of new synthetic examples). Still,several problems exist with random under-sampling strategy: It involves discardingpotentially relevant information, and it is a high-variance strategy. It is exactly byfocusing on the latter problem that Wallace et al. [2011] proposed their solution: Theuse of bagging because it is a variance-reduction technique. The authors present atheoretical analysis and are able to establish the necessary and sufficient conditionsfor obtaining a suboptimal separator of the positive and negative distributions. Amongother results, the authors show that, by increasing the degree of imbalance, there is adecrease in the probability of a weighted empirical cost minimization being effective.The theoretical framework developed justifies that, in the majority of imbalanced do-mains, the use of bagging with classifiers induced over balanced bootstrap sets is thebest option.
More recently, Dal Pozzolo et al. [2015] also contributed theoretical advances re-garding imbalanced domains. The focus of this work was also in the under-samplingstrategy. In this article, the authors study two aspects that are consequences of
ACM Computing Surveys, Vol. 49, No. 2, Article 31, Publication date: August 2016.

A Survey of Predictive Modeling on Imbalanced Domains 31:37
applying under-sampling: the potentially increase of variance (due to the reductionin the number of examples) and the warping effect produced in the posterior datadistribution (due to the modification introduced in the prior probabilities). The first as-pect may be addressed by averaging strategies to reduce the variability (as suggestedby Wallace et al. [2011]), while for the second issue it is necessary to calibrate theprobability of the new priors. Dal Pozzolo et al. [2015] analyze the interaction betweenunder-sampling and the ranking error of the posterior probability, and the followingformula was obtained:
β
(p + β(1 − p))2 >
√vs
v, (45)
where β is the under-sampling rate, p is the posterior probability of the testing point,and v and vs are the variances of the classifier before and after sampling. If the formulais satisfied, then under-sampling is effective. However, it is difficult to determine whenthe condition holds because it implies knowing the posterior probability and requiresthe estimation of the ratio of variances before and after under-sampling.
Still, this is a useful theoretical condition for understanding the under-samplingtechnique and some of the results obtained when applying it. In fact, the inequality ofEquation (45) can explain why there are several contradictory results because it showsthat there is a dependency between a good effect of under-sampling and some taskrelated aspects (such as the degree of imbalance and the classifier variance).
In summary, it seems that the research community is finally understanding the im-portance of studying the theoretical foundations of the problem of imbalance domains.However, much remains to be done regarding theoretical foundations for this difficultproblem, and easy heuristic solutions keep appearing at a fast rate.
7. PROBLEMS THAT HINDER PREDICTIVE MODELING UNDER IMBALANCED DOMAINS
In this section, we describe some problems that frequently coexist with imbalanced do-mains and further contribute to degrade the performance of predictive models. Theseproblems have been addressed mainly within a classification setting. Problems such assmall disjuncts, class overlap, and small sample size usually coexist with imbalancedclassification domains and are also identified as possible causes of classifiers perfor-mance degradation [Weiss 2004; He and Garcia 2009; Sun et al. 2009; Stefanowski2016].
We will briefly describe some works that address the relationship between imbal-anced domains and the following problems: (i) class overlapping or class separability,(ii) small sample size and lack of density in the training set, (iii) high dimensionalityof the dataset, (iv) noisy data, (v) small disjuncts, and (vi) data shift.
The overlap problem occurs when a given region of the data space contains an iden-tical number of training cases of each class. In this situation, a learner will have anincreased difficulty in distinguishing between the classes present on the overlappingregion. Since the mid-2000s, some attention has been given to the relationship be-tween these two problems [Prati et al. 2004a; Garcıa et al. 2006]. The combinationof imbalanced domains with overlapping regions causes much more difficulties thanexpected when considering their effects individually [Denil and Trappenberg 2010].Recent works [Alejo Eleuterio et al. 2011; Alejo et al. 2013] presented combinations ofsolutions for handling, simultaneously, both the class imbalance and the class overlapproblem.
The small sample problem is also related with imbalanced domains. In effect, havingtoo few examples from the minority class will prevent the learner from capturing theircharacteristics and will hinder the generalization capability of the algorithm. Therelation between imbalanced domains and small sample problems was addressed by
ACM Computing Surveys, Vol. 49, No. 2, Article 31, Publication date: August 2016.

31:38 P. Branco et al.
Japkowicz and Stephen [2002] and Jo and Japkowicz [2004], where it was highlightedthat minority class examples are easier to learn as their number increases.
The small sample problem may trigger problems such as rare cases [Weiss 2005],which bring an additional difficulty to the learning system. Rare examples are ex-tremely scarce cases that are difficult to detect and use for generalization. The smallsample problem may also be accompanied by a variable class distribution that may notmatch the target distribution.
Some imbalanced domains have a high number of predictor variables. The mainchallenge here is to adequately select features that contain the key information ofthe problem. Feature selection is recommended [Wasikowski and Chen 2010] and isalso pointed as the solution for addressing the class imbalance problem [Mladenic andGrobelnik 1999; Zheng et al. 2004; Chen and Wasikowski 2008; Van Der Putten andVan Someren 2004; Forman 2003]. Several proposals exist for handling the imbalanceproblem in conjunction with the high-dimensionality problem, all using a feature se-lection strategy [Zheng et al. 2004; Del Castillo and Serrano 2004; Forman and Cohen2004; Chu et al. 2010]. In imbalanced domains, noisy data have a greater impact on theleast-represented classes [Weiss 2004]. Recently, Seiffert et al. [2011] concluded that,generally, class noise has a more significant impact on learners than imbalance. Theinteraction between the levels of imbalance and noise is a relevant issue and the twoaspects should be studied together.
One of the most studied related problems is the problem of small disjuncts that isassociated to the imbalance in the subclusters of each class in the dataset [Japkowicz2001; Jo and Japkowicz 2004]. When a subcluster has a low coverage, that is, it classi-fies few examples, it is called small [Holte et al. 1989]. Small disjuncts are a problembecause the learners are typically biased towards classifying large disjuncts and there-fore they will tend to overfit and misclassify the cases in the small disjuncts. Due to theimportance of these two problems, several works address the relation between the prob-lem of small disjuncts and the class imbalance problem (e.g., Japkowicz [2003], Weissand Provost [2003], Jo and Japkowicz [2004], Pearson et al. [2003], Japkowicz [2001],and Prati et al. [2004b]), although the connection between the two problems is not yetwell understood [Jo and Japkowicz 2004]. Weiss [2010] analyzes the impact of severalfactors on small disjuncts and in the error distribution across disjuncts. Pruning wasnot considered an effective strategy for dealing with small disjuncts in the presence ofclass imbalance [Prati et al. 2004b; Weiss 2010]. Weiss [2010] also concluded that evenwith a balanced dataset, errors tend to be concentrated towards the smaller disjuncts.However, when there is class imbalance, the error concentration increases. Moreover,the increase in the class imbalance also increases the error concentration. Thus, classimbalance is partly responsible for the problem with small disjuncts, and artificiallybalancing the data distribution causes a decrease in the error concentration.
The data shift problem has also deserved the attention of the research community.The problem of data shift occurs when there is a difference in the distribution ofthe train and test sets. The data shift occurs frequently, and it usually leads to asmall performance degradation. However, on imbalanced domains, severe performancelosses may happen caused by this problem. Lopez et al. [2013] mentions two differentperspectives of this problem under imbalanced domains: intrinsic and induced datashift. The first one regards shifts in the data distribution that are already presentin the data. This is an unexplored issue that still has no solution. As for induceddata shift, it is related with the evaluation techniques used that may introduce thisproblem by themselves. Moreno-Torres et al. [2012] mentions that sample selectionbias may occur due to a non-uniform random selection and this may produce the datashift problem. This may happen when using, for instance, the well known k-fold cross-validation procedure. Lopez et al. [2014] present a new validation procedure, named
ACM Computing Surveys, Vol. 49, No. 2, Article 31, Publication date: August 2016.

A Survey of Predictive Modeling on Imbalanced Domains 31:39
distribution optimally balanced stratified cross-validation, that tries to maintain thedata distribution across all the partitions, trying to avoid inducing data shift.
The co-occurrence of the problems we have mentioned with imbalanced domainstends to further degrade the classifiers performance, and therefore this relationshipshould not be ignored. We emphasize that these problems have been studied only inthe context of classification tasks. It would be important to generalize these studies toregression tasks as these issues may also have a negative impact when happening inconjunction with imbalanced domains in these contexts.
8. CONCLUSIONS
Imbalanced domains pose important challenges to existing approaches to predictivemodeling. In this article, we propose a formulation of the problem of predictive mod-eling with imbalanced datasets, including both classification and regression tasks. Wepresent a survey of the state of the art solutions for obtaining and evaluating predic-tive models for both classification and regression tasks. We propose a new taxonomy forthe existing approaches grouping them into (i) data pre-processing, (ii) special-purposelearning methods, (iii) prediction post-processing, and (iv) hybrid strategies.
Since the mid-2000s, the problem of predictive modeling under imbalanced domainshas been focused on classification tasks. Existing proposals were developed specificallyfor classification problems, and existing surveys presented this topic only from a clas-sification perspective. More recently, the research community started to address thisproblem within other contexts such as regression [Torgo et al. 2013], ordinal classifica-tion [Perez-Ortiz et al. 2014], multi-label classification [Charte et al. 2015b], associationrules mining [Luna et al. 2015], multi-instance learning [Wang et al. 2013b], and datastreams [Wang and Abraham 2015]. It is now recognized that imbalanced domains area broader and important problem posing relevant challenges in several contexts.
We present a summary of recent theoretical contributions on the study of imbalanceddomains. This is certainly one of the most important open problems in this area. Therelevance of the problem has pushed the community to provide an huge amount ofheuristic solutions. Still, it is necessary to understand why, when, and how they work,and to achieve this we need further theoretical advances.
We briefly describe some problems that are strongly related with imbalanced do-mains, highlighting works that explore the relationship of these other problems withimbalance datasets. The issue of the coexistence of other problems that may hinderthe learners performance has been addressed solely for classification tasks, and this ismostly an unexplored question for other tasks.
With the goal of understanding the current research directions in this area, weidentify a few recent trends:
—Wallace and Dahabreh [2012, 2014] have raised the issue of the reliability of proba-bility estimates when using datasets with imbalanced domains. Although much wasdone for other domains, this had never been considered for the case of imbalanced do-mains. A proposal was presented for the assessment of this problem and an approachfor solving it was also provided.
—Recently, a few articles have appeared that focus their contribution on the theoreticalanalysis of the properties of some approaches to imbalanced domains. This is a veryimportant issue because it will provide a better understanding of the many existingapproaches.
—Regarding performance assessment, the issue of correct experimental proceduresfor obtaining reliable estimates on datasets with imbalanced domains was recentlyraised [Japkowicz and Shah 2011; Raeder et al. 2012; Lopez et al. 2014].
ACM Computing Surveys, Vol. 49, No. 2, Article 31, Publication date: August 2016.

31:40 P. Branco et al.
—The study of the problem of imbalanced domains has been extended to other data-mining tasks. This is the case of regression tasks (e.g., Torgo et al. [2013]), multi-classtasks (e.g., Alejo et al. [2014] and Fernandez-Baldera et al. [2015]), learning from datastreams (e.g., Ghazikhani et al. [2014] and Wang and Abraham [2015]), ordinal targetvariables (e.g., Baccianella et al. [2009], Sanchez-Monedero et al. [2013], and Perez-Ortiz et al. [2014]), multi-label classification (e.g., Tahir et al. [2012] and Charteet al. [2015a, 2015b]), multi-instance learning (e.g., Wang et al. [2013a, 2013b]), andmining association rules (e.g., Mangat and Vig [2014], and Luna et al. [2015]).
Finally, in terms of the open research issues within imbalanced domain problems,we consider the following to be the most relevant ones:
—Establishing the optimal way of translating the user preference biases into concretesettings of the different approaches to the problem (e.g., what is the right amount ofunder-sampling for some given user preferences?).
—More thorough and extensive experimental comparisons among the different ap-proaches. Although some comparison studies exist, mainly for data pre-processingstrategies within a classification setting, not much exists involving comparisonsamong the main different types of approaches (pre-processing, special-purpose learn-ing methods, post-processing, and hybrid). Moreover, there is still no comparison ofthe performance of the approaches across different task types (classification andregression).
—Creating a repository of benchmark datasets for this problem. In fact, although sev-eral open-access dataset repositories exist, no collection of problems with imbalanceddomains is currently available for the research community. This is an important is-sue whose resolution could provide a common baseline for comparison of differentsolutions in a fair and unified way [He and Ma 2013].
—Establishing what the adequate metrics are for evaluating and comparing differentmethods of addressing imbalanced domain problems. Currently, different articlesselect different metrics for comparing the methods, this being often the reason forsome contradictory results.
—Further theoretical analysis of the existing proposals needs to be carried out. Theknowledge about many of the existing approaches is still mostly based on collectedexperimental evidence across some concrete datasets. Further understanding of theproperties, advantages, and limitations of the methods is necessary.
—Extension and/or development of approaches that can cope with other tasks apartfrom binary classification. Most of the existing work on imbalanced domains is fo-cused on binary classification tasks. Recent studies have shown that similar imbal-ance problems exist in other tasks.
REFERENCES
Rehan Akbani, Stephen Kwek, and Nathalie Japkowicz. 2004. Applying support vector machines to imbal-anced datasets. In Machine Learning: ECML 2004. Springer, 39–50.
Roberto Alejo, J. A. Antonio, Rosa Maria Valdovinos, and J. Horacio Pacheco-Sanchez. 2013. Assessmentsmetrics for multi-class imbalance learning: A preliminary study. In Pattern Recognition. Springer, 335–343.
Roberto Alejo, Vicente Garcıa, and J. Horacio Pacheco-Sanchez. 2014. An efficient over-sampling approachbased on mean square error back-propagation for dealing with the multi-class imbalance problem. Neur.Process. Lett. (2014), 1–15.
Roberto Alejo, Vicente Garcıa, Jose Martınez Sotoca, Ramon Alberto Mollineda, and Jose Salvador Sanchez.2007. Improving the performance of the RBF neural networks trained with imbalanced samples. InComputational and Ambient Intelligence. Springer, 162–169.
ACM Computing Surveys, Vol. 49, No. 2, Article 31, Publication date: August 2016.

A Survey of Predictive Modeling on Imbalanced Domains 31:41
Roberto Alejo, Rosa Maria Valdovinos, Vicente Garcıa, and J. Horacio Pacheco-Sanchez. 2013. A hybridmethod to face class overlap and class imbalance on neural networks and multi-class scenarios. PatternRecogn. Lett. 34, 4 (2013), 380–388.
Roberto Alejo Eleuterio, Jose Martınez Sotoca, Vicente Garcıa Jimenez, and Rosa Marıa Valdovinos Rosas.2011. Back propagation with balanced MSE cost function and nearest neighbor editing for handlingclass overlap and class imbalance. (2011).
Josh Attenberg and Seyda Ertekin. 2013. Class imbalance and active learning. In Imbalanced Learning:Foundations, Algorithms, and Applications, Haibo He and Yunqian Ma (Eds.). John Wiley & Sons.
Stefano Baccianella, Andrea Esuli, and Fabrizio Sebastiani. 2009. Evaluation measures for ordinal regres-sion. In Ninth International Conference on Intelligent Systems Design and Applications, 2009. ISDA’09.IEEE, 283–287.
Gaurav Bansal, Atish P. Sinha, and Huimin Zhao. 2008. Tuning data mining methods for cost-sensitiveregression: A study in loan charge-off forecasting. J. Manag. Inform. Syst. 25, 3 (2008), 315–336.
Ricardo Barandela, Jose Salvador Sanchez, Vicente Garcia, and Edgar Rangel. 2003. Strategies for learningin class imbalance problems. Pattern Recogn. 36, 3 (2003), 849–851.
Vincent Barnab-Lortie, Colin Bellinger, and Nathalie Japkowicz. 2015. Active learning for one-class classi-fication. In Proceedings of ICMLA’2015.
Sukarna Barua, Monirul Islam, Xin Yao, and Kazuyuki Murase. 2012. MWMOTE-majority weighted mi-nority oversampling technique for imbalanced data set learning. IEEE Transactions on Knowledge andData Engineering (2012), 1.
Guilherme Batista, Danilo Silva, and Ronaldo Prati. 2012. An experimental design to evaluate class imbal-ance treatment methods. In 2012 11th International Conference on Machine Learning and Applications(ICMLA), Vol. 2. IEEE, 95–101.
Gustavo E. A. P. A. Batista, Ronaldo C. Prati, and Maria Carolina Monard. 2004. A study of the behaviorof several methods for balancing machine learning training data. ACM SIGKDD Explor. Newslett. 6, 1(2004), 20–29.
Rukshan Batuwita and Vasile Palade. 2009. A new performance measure for class imbalance learning. Appli-cation to bioinformatics problems. In International Conference on Machine Learning and Applications,2009. ICMLA’09. IEEE, 545–550.
Rukshan Batuwita and Vasile Palade. 2010a. Efficient resampling methods for training support vectormachines with imbalanced datasets. In The 2010 International Joint Conference on Neural Networks(IJCNN). IEEE, 1–8.
Rukshan Batuwita and Vasile Palade. 2010b. FSVM-CIL: Fuzzy support vector machines for class imbalancelearning. IEEE Trans. Fuzzy Syst. 18, 3 (2010), 558–571.
Rukshan Batuwita and Vasile Palade. 2012. Adjusted geometric-mean: A novel performance measure forimbalanced bioinformatics datasets learning. J. Bioinform. Comput. Biol. 10, 4 (2012).
Colin Bellinger, Nathalie Japkowicz, and Christopher Drummond. 2015. Synthetic oversampling for ad-vanced radioactive threat detection. In Proceedings ICML’2015.
Colin Bellinger, Shiven Sharma, and Nathalie Japkowicz. 2012. One-class versus binary classification: Whichand when? In 2012 11th International Conference on Machine Learning and Applications (ICMLA),Vol. 2. IEEE, 102–106.
Jinbo Bi and Kristin P. Bennett. 2003. Regression error characteristic curves. In Proc. of the 20th Int. Conf.on Machine Learning. 43–50.
Jerzy Błaszczynski and Jerzy Stefanowski. 2015. Neighbourhood sampling in bagging for imbalanced data.Neurocomputing 150 (2015), 529–542.
Andrew P. Bradley. 1997. The use of the area under the ROC curve in the evaluation of machine learningalgorithms. Pattern Recogn. 30, 7 (1997), 1145–1159.
Paula Branco. 2014. Re-sampling Approaches for Regression Tasks under Imbalanced Domains. Master’sthesis. Dept. Computer Science, Faculty of Sciences, University of Porto.
Leo Breiman, Jerome H. Friedman, Richard A. Olshen, and Charles J. Stone. 1984. Classification andregression trees. Wadsworth & Brooks, Monterey, CA (1984).
Chumphol Bunkhumpornpat, Krung Sinapiromsaran, and Chidchanok Lursinsap. 2009. Safe-level-smote:Safe-level-synthetic minority over-sampling technique for handling the class imbalanced problem. InAdvances in Knowledge Discovery and Data Mining. Springer, 475–482.
Chumphol Bunkhumpornpat, Krung Sinapiromsaran, and Chidchanok Lursinsap. 2011. MUTE: Majorityunder-sampling technique. In 2011 8th International Conference on Information, Communications andSignal Processing (ICICS). IEEE, 1–4.
ACM Computing Surveys, Vol. 49, No. 2, Article 31, Publication date: August 2016.

31:42 P. Branco et al.
Chumphol Bunkhumpornpat, Krung Sinapiromsaran, and Chidchanok Lursinsap. 2012. DBSMOTE:Density-based synthetic minority over-sampling technique. Applied Intelligence 36, 3 (2012), 664–684.
Chumphol Bunkhumpornpat and Sitthichoke Subpaiboonkit. 2013. Safe level graph for synthetic minorityover-sampling techniques. In 2013 13th International Symposium on Communications and InformationTechnologies (ISCIT). IEEE, 570–575.
Michael Cain and Christian Janssen. 1995. Real estate price prediction under asymmetric loss. Ann. Inst.Stat. Math. 47, 3 (1995), 401–414.
Peng Cao, Dazhe Zhao, and Osmar R. Zaıane. 2013. A PSO-based cost-sensitive neural network for im-balanced data classification. In Trends and Applications in Knowledge Discovery and Data Mining.Springer, 452–463.
Cristiano Leite Castro and Antonio de Padua Braga. 2013. Novel cost-sensitive approach to improve themultilayer perceptron performance on imbalanced data. IEEE Trans. Neur. Netw. Learn. Syst. 24, 6(2013), 888–899.
Edward Y. Chang, Beitao Li, Gang Wu, and Kingshy Goh. 2003. Statistical learning for effective visualinformation retrieval. In ICIP (3). 609–612.
Francisco Charte, Antonio J. Rivera, Marıa J. del Jesus, and Francisco Herrera. 2015a. Addressing imbalancein multilabel classification: Measures and random resampling algorithms. Neurocomputing 163 (2015),3–16.
Francisco Charte, Antonio J. Rivera, Marıa J. del Jesus, and Francisco Herrera. 2015b. MLSMOTE: Ap-proaching imbalanced multilabel learning through synthetic instance generation. Knowl.-Based Syst.89 (2015), 385–397.
Nitesh V. Chawla, Kevin W. Bowyer, Lawrence O. Hall, and W. P. Kegelmeyer. 2002. SMOTE: Syntheticminority over-sampling technique. JAIR 16 (2002), 321–357.
Nitesh V. Chawla, David A. Cieslak, Lawrence O. Hall, and Ajay Joshi. 2008. Automatically counteringimbalance and its empirical relationship to cost. Data Min. Knowl. Discov. 17, 2 (2008), 225–252.
Nitesh V. Chawla, Lawrence O. Hall, and Ajay Joshi. 2005. Wrapper-based computation and evaluation ofsampling methods for imbalanced datasets. In Proceedings of the 1st International Workshop on Utility-Based Data Mining. ACM, New York, NY, 24–33.
Nitesh V. Chawla, Nathalie Japkowicz, and Aleksander Kotcz. 2004. Editorial: Special issue on learningfrom imbalanced data sets. ACM SIGKDD Explor. Newslett. 6, 1 (2004), 1–6.
Nitesh V. Chawla, Aleksandar Lazarevic, Lawrence O. Hall, and Kevin W. Bowyer. 2003. SMOTEBoost:Improving prediction of the minority class in boosting. In Knowledge Discovery in Databases: PKDD2003. Springer, 107–119.
Chao Chen, Andy Liaw, and Leo Breiman. 2004. Using random forest to learn imbalanced data. Universityof California, Berkeley (2004).
Sheng Chen, Haibo He, and Edwardo A. Garcia. 2010. Ramoboost: Ranked minority oversampling in boosting.IEEE Trans. Neural Networks 21, 10 (2010), 1624–1642.
Xue-wen Chen and Michael Wasikowski. 2008. Fast: A roc-based feature selection metric for small samplesand imbalanced data classification problems. In Proceedings of the 14th ACM SIGKDD InternationalConference on Knowledge Discovery and Data Mining. ACM, New York, NY, 124–132.
Peter F. Christoffersen and Francis X. Diebold. 1996. Further results on forecasting and model selectionunder asymmetric loss. J. Appl. Econom. 11, 5 (1996), 561–571.
Peter F. Christoffersen and Francis X. Diebold. 1997. Optimal prediction under asymmetric loss. Econom.Theor. 13, 6 (1997), 808–817.
Leilei Chu, Hui Gao, and Wenbo Chang. 2010. A new feature weighting method based on probability dis-tribution in imbalanced text classification. In 2010 Seventh International Conference on Fuzzy Systemsand Knowledge Discovery (FSKD), Vol. 5. IEEE, 2335–2339.
Yu-Meei Chyi. 2003. Classification analysis techniques for skewed class distribution problems. Master Thesis,Department of Information Management, National Sun Yat-Sen University (2003).
David A. Cieslak and Nitesh V. Chawla. 2008. Learning decision trees for unbalanced data. In MachineLearning and Knowledge Discovery in Databases. Springer, 241–256.
David A. Cieslak, Thomas R. Hoens, Nitesh V. Chawla, and W. Philip Kegelmeyer. 2012. Hellinger distancedecision trees are robust and skew-insensitive. Data Min. Knowl. Discov. 24, 1 (2012), 136–158.
Gilles Cohen, Melanie Hilario, Hugo Sax, Stephane Hugonnet, and Antoine Geissbuhler. 2006. Learningfrom imbalanced data in surveillance of nosocomial infection. Artif. Intell. Med. 37, 1 (2006), 7–18.
Sven F. Crone, Stefan Lessmann, and Robert Stahlbock. 2005. Utility based data mining for time seriesanalysis: Cost-sensitive learning for neural network predictors. In Proceedings of the 1st InternationalWorkshop on Utility-based Data Mining. ACM, New York, NY, 59–68.
ACM Computing Surveys, Vol. 49, No. 2, Article 31, Publication date: August 2016.

A Survey of Predictive Modeling on Imbalanced Domains 31:43
Andrea Dal Pozzolo, Olivier Caelen, and Gianluca Bontempi. 2015. When is undersampling effective inunbalanced classification tasks? In Machine Learning and Knowledge Discovery in Databases. Springer,200–215.
Sophia Daskalaki, Ioannis Kopanas, and Nikolaos M. Avouris. 2006. Evaluation of classifiers for an unevenclass distribution problem. Appl. Artif. Intell. 20, 5 (2006), 381–417.
Jesse Davis and Mark Goadrich. 2006. The relationship between Precision-Recall and ROC curves. InICML’06: Proc. of the 23rd Int. Conf. on Machine Learning (ACM ICPS). ACM, New York, NY, 233–240.
Marıa Dolores Del Castillo and Jose Ignacio Serrano. 2004. A multistrategy approach for digital text catego-rization from imbalanced documents. ACM SIGKDD Explor. Newslett. 6, 1 (2004), 70–79.
Misha Denil and Thomas Trappenberg. 2010. Overlap versus imbalance. In Advances in Artificial Intelli-gence. Springer, 220–231.
Pedro Domingos. 1999. MetaCost: A general method for making classifiers cost-sensitive. In KDD’99: Pro-ceedings of the 5th International Conference on Knowledge Discovery and Data Mining. ACM Press, NewYork, NY, 155–164.
John Doucette and Malcolm I. Heywood. 2008. GP classification under imbalanced data sets: Active sub-sampling and AUC approximation. In Genetic Programming. Springer, 266–277.
Dennis J. Drown, Taghi M. Khoshgoftaar, and Naeem Seliya. 2009. Evolutionary sampling and softwarequality modeling of high-assurance systems. IEEE Trans. Syst. Man Cybernet. A 39, 5 (2009), 1097–1107.
Chris Drummond and Robert C. Holte. 2000. Explicitly representing expected cost: An alternative to ROCrepresentation. In Proceedings of the Sixth ACM SIGKDD International Conference on Knowledge Dis-covery and Data Mining. ACM, New York, NY, 198–207.
Chris Drummond and Robert C. Holte. 2003. C4. 5, class imbalance, and cost sensitivity: Why under-samplingbeats over-sampling. In Workshop on Learning from Imbalanced Datasets II, Vol. 11. Citeseer.
James P. Egan. 1975. Signal detection theory and {ROC} analysis. (1975).Charles Elkan. 2001. The foundations of cost-sensitive learning. In IJCAI’01: Proc. of 17th Int. Joint Conf.
of Artificial Intelligence, Vol. 1. Morgan Kaufmann Publishers, 973–978.Seyda Ertekin. 2013. Adaptive oversampling for imbalanced data classification. In Information Sciences and
Systems 2013. Springer, 261–269.Seyda Ertekin, Jian Huang, Leon Bottou, and Lee Giles. 2007b. Learning on the border: Active learning
in imbalanced data classification. In Proceedings of the Sixteenth ACM Conference on Conference onInformation and Knowledge Management. ACM, New York, NY, 127–136.
Seyda Ertekin, Jian Huang, and C. Lee Giles. 2007a. Active learning for class imbalance problem. In Pro-ceedings of the 30th Annual International ACM SIGIR Conference on Research and Development inInformation Retrieval. ACM, New York, NY, 823–824.
Andrew Estabrooks and Nathalie Japkowicz. 2001. A mixture-of-experts framework for learning from im-balanced data sets. In Advances in Intelligent Data Analysis. Springer, 34–43.
Andrew Estabrooks, Taeho Jo, and Nathalie Japkowicz. 2004. A multiple resampling method for learningfrom imbalanced data sets. Comput. Intell. 20, 1 (2004), 18–36.
Tom Fawcett. 2006. An introduction to ROC analysis. Pattern Recogn. Lett. 27, 8 (2006), 861–874.Alberto Fernandez, Marıa Jose del Jesus, and Francisco Herrera. 2010. On the 2-tuples based genetic tuning
performance for fuzzy rule based classification systems in imbalanced data-sets. Inform. Sci. 180, 8(2010), 1268–1291.
Alberto Fernandez, Salvador Garcıa, Marıa Jose del Jesus, and Francisco Herrera. 2008. A study of thebehaviour of linguistic fuzzy rule based classification systems in the framework of imbalanced data-sets.Fuzzy Sets Syst. 159, 18 (2008), 2378–2398.
Antonio Fernandez-Baldera, Jose M. Buenaposada, and Luis Baumela. 2015. Multi-class boosting for imbal-anced data. In Pattern Recognition and Image Analysis. Springer, 57–64.
Cesar Ferri, Peter Flach, Jose Hernandez-Orallo, and Athmane Senad. 2005. Modifying ROC curves toincorporate predicted probabilities. In Proceedings of the Second Workshop on ROC Analysis in MachineLearning. 33–40.
Cesar Ferri, Jose Hernandez-orallo, and Peter A. Flach. 2011a. Brier curves: A new cost-based visualisationof classifier performance. In Proceedings of the 28th International Conference on Machine Learning(ICML-11). 585–592.
Cesar Ferri, Jose Hernandez-Orallo, and Peter A. Flach. 2011b. A coherent interpretation of AUC as ameasure of aggregated classification performance. In Proceedings of the 28th International Conferenceon Machine Learning (ICML-11). 657–664.
ACM Computing Surveys, Vol. 49, No. 2, Article 31, Publication date: August 2016.

31:44 P. Branco et al.
Cesar Ferri, Jose Hernandez-Orallo, and R. Modroiu. 2009. An experimental comparison of performancemeasures for classification. Pattern Recogn. Lett. 30, 1 (2009), 27–38.
George Forman. 2003. An extensive empirical study of feature selection metrics for text classification. J.Mach. Learn. Res. 3 (2003), 1289–1305.
George Forman and Ira Cohen. 2004. Learning from little: Comparison of classifiers given little training. InKnowledge Discovery in Databases: PKDD 2004. Springer, 161–172.
Mikel Galar, Alberto Fernandez, Edurne Barrenechea, Humberto Bustince, and Francisco Herrera. 2012. Areview on ensembles for the class imbalance problem: bagging-, boosting-, and hybrid-based approaches.IEEE Trans. Syst. Man Cybernet. C 42, 4 (2012), 463–484.
Mikel Galar, Alberto Fernandez, Edurne Barrenechea, and Francisco Herrera. 2013. Eusboost: Enhancingensembles for highly imbalanced data-sets by evolutionary undersampling. Pattern Recogn. (2013).
Ming Gao, Xia Hong, Sheng Chen, Chris J. Harris, and Emad Khalaf. 2014. PDFOS: PDF estimation basedover-sampling for imbalanced two-class problems. Neurocomputing 138 (2014), 248–259.
Joaquın Garcıa, Salvador Derrac, Isaac Triguero, Cristobal J. Carmona, and Francisco Herrera. 2012.Evolutionary-based selection of generalized instances for imbalanced classification. Knowl.-Based Syst.25, 1 (2012), 3–12.
Salvador Garcıa, Jose Ramon Cano, Alberto Fernandez, and Francisco Herrera. 2006. A proposal of evolu-tionary prototype selection for class imbalance problems. In Intelligent Data Engineering and AutomatedLearning–IDEAL 2006. Springer, 1415–1423.
Salvador Garcıa and Francisco Herrera. 2009. Evolutionary undersampling for classification with imbal-anced datasets: Proposals and taxonomy. Evol. Comput. 17, 3 (2009), 275–306.
Vicente Garcıa, Roberto Alejo, Jose Salvador Sanchez, Jose Martınez Sotoca, and Ramon Alberto Mollineda.2006. Combined effects of class imbalance and class overlap on instance-based classification. In Intelli-gent Data Engineering and Automated Learning–IDEAL 2006. Springer, 371–378.
Vicente Garcıa, Ramon Alberto Mollineda, and Jose Salvador Sanchez. 2008. A new performance evaluationmethod for two-class imbalanced problems. In Structural, Syntactic, and Statistical Pattern Recognition.Springer, 917–925.
Vicente Garcıa, Ramon Alberto Mollineda, and Jose Salvador Sanchez. 2009. Index of balanced accuracy:A performance measure for skewed class distributions. In Pattern Recognition and Image Analysis.Springer, 441–448.
Vicente Garcıa, Ramon Alberto Mollineda, and Jose Salvador Sanchez. 2010. Theoretical analysis of aperformance measure for imbalanced data. In 2010 20th International Conference on Pattern Recognition(ICPR). IEEE, 617–620.
Alireza Ghasemi, Mohammad T. Manzuri, Hamid R. Rabiee, Mohammad H. Rohban, and Siavash Haghiri.2011a. Active one-class learning by kernel density estimation. In 2011 IEEE International Workshop onMachine Learning for Signal Processing (MLSP). IEEE, 1–6.
Alireza Ghasemi, Hamid R. Rabiee, Mohsen Fadaee, Mohammad T. Manzuri, and Mohammad H. Rohban.2011b. Active learning from positive and unlabeled data. In 2011 IEEE 11th International Conferenceon Data Mining Workshops (ICDMW). IEEE, 244–250.
Adel Ghazikhani, Reza Monsefi, and Hadi Sadoghi Yazdi. 2014. Online neural network model for non-stationary and imbalanced data stream classification. Int. J. Mach. Learn. Cybernet. 5, 1 (2014), 51–62.
Clive W. Granger. 1999. Outline of forecast theory using generalized cost functions. Span. Econ. Rev. 1, 2(1999), 161–173.
Hui Han, Wen-Yuan Wang, and Bing-Huan Mao. 2005. Borderline-SMOTE: A new over-sampling method inimbalanced data sets learning. In Advances in Intelligent Computing. Springer, 878–887.
David J. Hand. 2009. Measuring classifier performance: A coherent alternative to the area under the ROCcurve. Machine Learn. 77, 1 (2009), 103–123.
Peter. E. Hart. 1968. The condensed nearest neighbor rule. IEEE Transactions on Information Theory 14(1968), 515–516.
Haibo He, Yang Bai, Edwardo A. Garcia, and Shutao Li. 2008. ADASYN: Adaptive synthetic samplingapproach for imbalanced learning. In IEEE International Joint Conference on Neural Networks, 2008.IJCNN 2008. (IEEE World Congress on Computational Intelligence). IEEE, 1322–1328.
Haibo He and Edwardo A. Garcia. 2009. Learning from imbalanced data. IEEE Knowl. Data Eng. 21, 9(2009), 1263–1284.
Haibo He and Yunqian Ma. 2013. Imbalanced Learning: Foundations, Algorithms, and Applications. JohnWiley & Sons.
Jose Hernandez-Orallo. 2012. Soft (gaussian CDE) regression models and loss functions. arXiv PreprintarXiv:1211.1043 (2012).
ACM Computing Surveys, Vol. 49, No. 2, Article 31, Publication date: August 2016.

A Survey of Predictive Modeling on Imbalanced Domains 31:45
Jose Hernandez-Orallo. 2013. {ROC} curves for regression. Pattern Recogn. 46, 12 (2013), 3395–3411.DOI:http://dx.doi.org/10.1016/j.patcog.2013.06.014
Jose Hernandez-Orallo. 2014. Probabilistic reframing for cost-sensitive regression. ACM Trans. Knowl. Dis-cov. Data 8, 4, Article 17 (Aug. 2014), 55 pages. DOI:http://dx.doi.org/10.1145/2641758
Jose Hernandez-Orallo, Peter Flach, and Cesar Ferri. 2012. A unified view of performance metrics: Trans-lating threshold choice into expected classification loss. J. Mach. Learn. Res. 13, 1 (2012), 2813–2869.
Robert C. Holte, Liane E. Acker, and Bruce W. Porter. 1989. Concept learning and the problem of smalldisjuncts. In IJCAI, Vol. 89. Citeseer, 813–818.
Junjie Hu. 2012. Active learning for imbalance problem using L-GEM of RBFNN. In ICMLC. 490–495.Shengguo Hu, Yanfeng Liang, Lintao Ma, and Ying He. 2009. MSMOTE: Improving classification perfor-
mance when training data is imbalanced. In Second International Workshop on Computer Science andEngineering, 2009. WCSE’09, Vol. 2. IEEE, 13–17.
Kaizhu Huang, Haiqin Yang, Irwin King, and Michael R. Lyu. 2004. Learning classifiers from imbalanceddata based on biased minimax probability machine. In Proceedings of the 2004 IEEE Computer SocietyConference on Computer Vision and Pattern Recognition, 2004. CVPR 2004. Vol. 2. IEEE, II–558.
Jae Pil Hwang, Seongkeun Park, and Euntai Kim. 2011. A new weighted approach to imbalanced dataclassification problem via support vector machine with quadratic cost function. Expert Syst. Appl. 38, 7(2011), 8580–8585.
Tasadduq Imam, Kai Ming Ting, and Joarder Kamruzzaman. 2006. z-SVM: An SVM for improved classifi-cation of imbalanced data. In AI 2006: Advances in Artificial Intelligence. Springer, 264–273.
Nathalie Japkowicz. 2000. Learning from imbalanced data sets: A comparison of various strategies. In AAAIWorkshop on Learning from Imbalanced Data Sets, Vol. 68. Menlo Park, CA.
Nathalie Japkowicz. 2001. Concept-learning in the presence of between-class and within-class imbalances.In Advances in Artificial Intelligence. Springer, 67–77.
Nathalie Japkowicz. 2003. Class imbalances: Are we focusing on the right issue. In Workshop on Learningfrom Imbalanced Data Sets II, Vol. 1723. 63.
Natalie Japkowicz. 2013. Assessment metrics for imbalanced learning. In Imbalanced Learning: Founda-tions, Algorithms, and Applications, Haibo He and Yunqian Ma (Eds.). John Wiley & Sons.
Nathalie Japkowicz, Catherine Myers, and Mark Gluck. 1995. A novelty detection approach to classification.In IJCAI. 518–523.
Nathalie Japkowicz and Mohak Shah. 2011. Evaluating Learning Algorithms: A Classification Perspective.Cambridge University Press.
Nathalie Japkowicz and Shaju Stephen. 2002. The class imbalance problem: A systematic study. Intell. DataAnal. 6, 5 (2002), 429–449.
Piyasak Jeatrakul, Kok Wai Wong, and Chun Che Fung. 2010. Classification of imbalanced data by combiningthe complementary neural network and SMOTE algorithm. In Neural Information Processing. Modelsand Applications. Springer, 152–159.
Taeho Jo and Nathalie Japkowicz. 2004. Class imbalances versus small disjuncts. ACM SIGKDD Explor.Newslett. 6, 1 (2004), 40–49.
Mahesh V. Joshi, Vipin Kumar, and Ramesh C. Agarwal. 2001. Evaluating boosting algorithms to classifyrare classes: Comparison and improvements. In Proceedings IEEE International Conference on DataMining, 2001. ICDM 2001. IEEE, 257–264.
Pilsung Kang and Sungzoon Cho. 2006. EUS SVMs: Ensemble of under-sampled SVMs for data imbalanceproblems. In Neural Information Processing. Springer, 837–846.
Taghi M. Khoshgoftaar, Chris Seiffert, Jason Van Hulse, Amri Napolitano, and Andres Folleco. 2007. Learn-ing with limited minority class data. In Sixth International Conference on Machine Learning and Appli-cations, 2007. ICMLA 2007. IEEE, 348–353.
Sotiris Kotsiantis, Dimitris Kanellopoulos, and Panayiotis Pintelas. 2006. Handling imbalanced datasets: Areview. GESTS Int. Trans. Comput. Sci. Eng. 30, 1 (2006), 25–36.
Sotiris Kotsiantis and Panagiotis Pintelas. 2003. Mixture of expert agents for handling imbalanced datasets. Ann. Math. Comput. Teleinform. 1, 1 (2003), 46–55.
Miroslav Kubat, Robert C. Holte, and Stan Matwin. 1998. Machine learning for the detection of oil spills insatellite radar images. Mach. Learn. 30, 2–3 (1998), 195–215.
Miroslav Kubat and Stan Matwin. 1997. Addressing the curse of imbalanced training sets: One-sided selec-tion. In Proc. of the 14th Int. Conf. on Machine Learning. Morgan Kaufmann, 179–186.
Jorma Laurikkala. 2001. Improving Identification of Difficult Small Classes by Balancing Class Distribution.Springer.
ACM Computing Surveys, Vol. 49, No. 2, Article 31, Publication date: August 2016.

31:46 P. Branco et al.
Hyoung-joo Lee and Sungzoon Cho. 2006. The novelty detection approach for different degrees of classimbalance. In Neural Information Processing. Springer, 21–30.
Sauchi Stephen Lee. 1999. Regularization in skewed binary classification. Comput. Stat. 14, 2 (1999), 277.Sauchi Stephen Lee. 2000. Noisy replication in skewed binary classification. Comput. Stat. Data Anal. 34, 2
(2000), 165–191.Tae-Hwy Lee. 2008. Loss functions in time series forecasting. International Encyclopedia of the Social
Sciences (2008).Chen Li, Chen Jing, and Gao Xin-tao. 2009. An improved P-SVM method used to deal with imbalanced data
sets. In IEEE International Conference on Intelligent Computing and Intelligent Systems, 2009. ICIS2009, Vol. 1. IEEE, 118–122.
Kewen Li, Wenrong Zhang, Qinghua Lu, and Xianghua Fang. 2014. An improved SMOTE imbalanceddata classification method based on support degree. In 2014 International Conference on Identification,Information and Knowledge in the Internet of Things (IIKI). IEEE, 34–38.
Peng Li, Pei-Li Qiao, and Yuan-Chao Liu. 2008. A hybrid re-sampling method for SVM learning fromimbalanced data sets. In Fifth International Conference on Fuzzy Systems and Knowledge Discovery,2008. FSKD’08. Vol. 2. IEEE, 65–69.
M. Lichman. 2013. UCI Machine Learning Repository. University of California, Irvine, School of Informationand Computer Sciences. http://archive.ics.uci.edu/ml.
Chun-Fu Lin and Sheng-De Wang. 2002. Fuzzy support vector machines. IEEE Trans. Neur. Network. 13, 2(2002), 464–471.
Alexander Liu, Joydeep Ghosh, and Cheryl E. Martin. 2007. Generative oversampling for mining imbalanceddatasets. In DMIN. 66–72.
Wei Liu, Sanjay Chawla, David A. Cieslak, and Nitesh V. Chawla. 2010. A robust decision tree algorithm forimbalanced data sets. In SDM, Vol. 10. SIAM, 766–777.
Xu-Ying Liu, Jianxin Wu, and Zhi-Hua Zhou. 2009. Exploratory undersampling for class-imbalance learning.IEEE Trans. Syst. Man Cybernet. B 39, 2 (2009), 539–550.
Yang Liu, Aijun An, and Xiangji Huang. 2006. Boosting prediction accuracy on imbalanced datasets withSVM ensembles. In Advances in Knowledge Discovery and Data Mining. Springer, 107–118.
Victoria Lopez, Alberto Fernandez, Salvador Garcıa, Vasile Palade, and Francisco Herrera. 2013. An insightinto classification with imbalanced data: Empirical results and current trends on using data intrinsiccharacteristics. Inform. Sci. 250 (2013), 113–141.
Victoria Lopez, Alberto Fernandez, and Francisco Herrera. 2014. On the importance of the validation tech-nique for classification with imbalanced datasets: Addressing covariate shift when data is skewed.Inform. Sci. 257 (2014), 1–13.
Jose Marıa Luna, Cristobal Romero, Jose Raul Romero, and Sebastian Ventura. 2015. An evolutionaryalgorithm for the discovery of rare class association rules in learning management systems. Appl. Intell.42, 3 (2015), 501–513.
Tomasz Maciejewski and Jerzy Stefanowski. 2011. Local neighbourhood extension of SMOTE for miningimbalanced data. In 2011 IEEE Symposium on Computational Intelligence and Data Mining (CIDM).IEEE, 104–111.
Satyam Maheshwari, Jitendra Agrawal, and Sanjeev Sharma. 2011. A new approach for classification ofhighly imbalanced datasets using evolutionary algorithms. Intl. J. Sci. Eng. Res 2 (2011), 1–5.
Marcus A. Maloof. 2003. Learning when data sets are imbalanced and when costs are unequal and unknown.In ICML-2003 Workshop on Learning from Imbalanced Data Sets II, Vol. 2. 2–1.
Larry Manevitz and Malik Yousef. 2002. One-class SVMs for document classification. J. Mach. Learn. Res. 2(2002), 139–154.
Olvi L. Mangasarian and Edward W. Wild. 2001. Proximal support vector machine classifiers. In ProceedingsKDD-2001: Knowledge Discovery and Data Mining. Citeseer.
Veenu Mangat and Renu Vig. 2014. Intelligent rule mining algorithm for classification over imbalanced data.J. Emerg. Technol. Web Intell. 6, 3 (2014), 373–379.
Inderjeet Mani and Jianping Zhang. 2003. kNN approach to unbalanced data distributions: A case studyinvolving information extraction. In Proceedings of Workshop on Learning from Imbalanced Datasets.
Jose Manuel Martınez-Garcıa, Carmen Paz Suarez-Araujo, and Patricio Garcıa Baez. 2012. SNEOM: Asanger network based extended over-sampling method. application to imbalanced biomedical datasets.In Neural Information Processing. Springer, 584–592.
David Mease, Abraham Wyner, and Andreas Buja. 2007. Cost-weighted boosting with jittering andover/under-sampling: JOUS-boost. J. Mach. Learn. Res. 8 (2007), 409–439.
ACM Computing Surveys, Vol. 49, No. 2, Article 31, Publication date: August 2016.

A Survey of Predictive Modeling on Imbalanced Domains 31:47
Giovanna Menardi and Nicola Torelli. 2010. Training and assessing classification rules with imbalanceddata. Data Min. Knowl. Discov. (2010), 1–31.
Charles E. Metz. 1978. Basic principles of ROC analysis. In Seminars in Nuclear Medicine, Vol. 8. Elsevier,283–298.
Ying Mi. 2013. Imbalanced classification based on active learning SMOTE. Res. J. Appl. Sci. 5 (2013).Dunja Mladenic and Marko Grobelnik. 1999. Feature selection for unbalanced class distribution and naive
bayes. In ICML, Vol. 99. 258–267.Jose G. Moreno-Torres, Troy Raeder, Rocıo Alaiz-Rodrıguez, Nitesh V. Chawla, and Francisco Herrera. 2012.
A unifying view on dataset shift in classification. Pattern Recogn. 45, 1 (2012), 521–530.Douglas Mossman. 1999. Three-way rocs. Med. Dec. Mak. 19, 1 (1999), 78–89.Satuluri Naganjaneyulu and Mrithyumjaya Rao Kuppa. 2013. A novel framework for class imbalance learn-
ing using intelligent under-sampling. Progr. Artif. Intell. 2, 1 (2013), 73–84.Munehiro Nakamura, Yusuke Kajiwara, Atsushi Otsuka, and Haruhiko Kimura. 2013. LVQ-SMOTE–
learning vector quantization based synthetic minority over–sampling technique for biomedical data.BioData Min. 6, 1 (2013), 16.
Krystyna Napierała, Jerzy Stefanowski, and Szymon Wilk. 2010. Learning from imbalanced data in presenceof noisy and borderline examples. In Rough Sets and Current Trends in Computing. Springer, 158–167.
Wing WY Ng, Jiankun Hu, Daniel S. Yeung, Sha Yin, and Fabio Roli. 2014. Diversified sensitivity-basedundersampling for imbalance classification problems. (2014).
Sang-Hoon Oh. 2011. Error back-propagation algorithm for classification of imbalanced data. Neurocomput-ing 74, 6 (2011), 1058–1061.
Ronald Pearson, Gregory Goney, and James Shwaber. 2003. Imbalanced clustering for microarray time-series.In Proceedings of the ICML, Vol. 3.
Marıa Perez-Ortiz, Pedro Antonio Gutierrez, and Cesar Hervas-Martınez. 2014. Projection-based ensemblelearning for ordinal regression. IEEE Trans. Cybernet. 44, 5 (2014), 681–694.
Clifton Phua, Damminda Alahakoon, and Vincent Lee. 2004. Minority report in fraud detection: Classificationof skewed data. ACM SIGKDD Explor. Newslett. 6, 1 (2004), 50–59.
Ronaldo C. Prati, Gustavo E. A. P. A. Batista, and Maria Carolina Monard. 2004a. Class imbalances versusclass overlapping: An analysis of a learning system behavior. In MICAI 2004: Advances in ArtificialIntelligence. Springer, 312–321.
Ronaldo C. Prati, Gustavo E. A. P. A. Batista, and Maria Carolina Monard. 2004b. Learning with class skewsand small disjuncts. In Advances in Artificial Intelligence–SBIA 2004. Springer, 296–306.
Ronaldo C. Prati, Gustavo E. A. P. A. Batista, and Diego F. Silva. 2014. Class imbalance revisited: A newexperimental setup to assess the performance of treatment methods. Knowl. Inform. Syst. (2014), 1–24.
Foster J. Provost and Tom Fawcett. 1997. Analysis and visualization of classifier performance: Comparisonunder imprecise class and cost distributions. In KDD, Vol. 97. 43–48.
Foster J Provost, Tom Fawcett, and Ron Kohavi. 1998. The case against accuracy estimation for comparinginduction algorithms. In ICML’98: Proc. of the 15th Int. Conf. on Machine Learning. Morgan KaufmannPublishers, 445–453.
Troy Raeder, George Forman, and Nitesh V. Chawla. 2012. Learning from imbalanced data: Evaluationmatters. In Data Mining: Foundations and Intelligent Paradigms. Springer, 315–331.
Enislay Ramentol, Yaile Caballero, Rafael Bello, and Francisco Herrera. 2012a. SMOTE-RSB*: A hybridpreprocessing approach based on oversampling and undersampling for high imbalanced data-sets usingSMOTE and rough sets theory. Knowl. Inform. Syst. 33, 2 (2012), 245–265.
Enislay Ramentol, Nelle Verbiest, Rafael Bello, Yaile Caballero, Chris Cornelis, and Francisco Herrera.2012b. SMOTE-FRST: A new resampling method using fuzzy rough set theory. In 10th Interna-tional FLINS Conference on Uncertainty Modelling in Knowledge Engineering and Decision Making (toAppear).
Romesh Ranawana and Vasile Palade. 2006. Optimized precision-a new measure for classifier performanceevaluation. In IEEE Congress on Evolutionary Computation, 2006. CEC 2006. IEEE, 2254–2261.
Bhavani Raskutti and Adam Kowalczyk. 2004. Extreme re-balancing for SVMs: A case study. ACM SIGKDDExplor. Newslett. 6, 1 (2004), 60–69.
Rita P. Ribeiro. 2011. Utility-based Regression. Ph.D. Dissertation. Dep. Computer Science, Faculty of Sci-ences, University of Porto.
Rita P. Ribeiro and Luıs Torgo. 2003. Predicting harmful algae blooms. In Progress in Artificial Intelligence.Springer, 308–312.
Cornelis V. Rijsbergen. 1979. Information Retrieval. Dept. of Computer Science, University of Glasgow, 2ndedition. (1979).
ACM Computing Surveys, Vol. 49, No. 2, Article 31, Publication date: August 2016.

31:48 P. Branco et al.
Juan J. Rodrıguez, Jose-Francisco Dıez-Pastor, Jesus Maudes, and Cesar Garcıa-Osorio. 2012. Disturbingneighbors ensembles of trees for imbalanced data. In 2012 11th International Conference on MachineLearning and Applications (ICMLA), Vol. 2. IEEE, 83–88.
Jose A. Saez, Julian Luengo, Jerzy Stefanowski, and Francisco Herrera. 2015. SMOTE–IPF: Addressingthe noisy and borderline examples problem in imbalanced classification by a re-sampling method withfiltering. Inform. Sci. 291 (2015), 184–203.
Juan Pablo Sanchez-Crisostomo, Roberto Alejo, Erika Lopez-Gonzalez, Rosa Marıa Valdovinos, and J. HoracioPacheco-Sanchez. 2014. Empirical analysis of assessments metrics for multi-class imbalance learningon the back-propagation context. In Advances in Swarm Intelligence. Springer, 17–23.
Javier Sanchez-Monedero, Pedro Antonio Gutierrez, and Cesar Hervas-Martınez. 2013. Evolutionary ordinalextreme learning machine. In Hybrid Artificial Intelligent Systems. Springer, 500–509.
Bernhard Scholkopf, John C. Platt, John Shawe-Taylor, Alex J. Smola, and Robert C. Williamson. 2001.Estimating the support of a high-dimensional distribution. Neur. Comput. 13, 7 (2001), 1443–1471.
Chris Seiffert, Taghi M. Khoshgoftaar, Jason Van Hulse, and Andres Folleco. 2011. An empirical study ofthe classification performance of learners on imbalanced and noisy software quality data. Inform. Sci.(2011).
Chris Seiffert, Taghi M. Khoshgoftaar, Jason Van Hulse, and Amri Napolitano. 2010. RUSBoost: A hybridapproach to alleviating class imbalance. IEEE Trans.Syst. Man Cybernet. A 40, 1 (2010), 185–197.
Shiven Sharma, Colin Bellinger, and Nathalie Japkowicz. 2012. Clustering based one-class classification forcompliance verification of the comprehensive nuclear-test-ban treaty. In Advances in Artificial Intelli-gence. Springer, 181–193.
Atish P. Sinha and Jerrold H. May. 2004. Evaluating and tuning predictive data mining models using receiveroperating characteristic curves. J. Manag. Inform. Syst. 21, 3 (2004), 249–280.
Parinaz Sobhani, Herna Viktor, and Stan Matwin. 2014. Learning from imbalanced data using ensemblemethods and cluster-based undersampling. In New Frontiers in Mining Complex Patterns. Springer,69–83.
Marina Sokolova and Guy Lapalme. 2009. A systematic analysis of performance measures for classificationtasks. Inform. Process. Manag. 45, 4 (2009), 427–437.
Jie Song, Xiaoling Lu, and Xizhi Wu. 2009. An improved AdaBoost algorithm for unbalanced classificationdata. In Sixth International Conference on Fuzzy Systems and Knowledge Discovery, 2009. FSKD’09.Vol. 1. IEEE, 109–113.
Panote Songwattanasiri and Krung Sinapiromsaran. 2010. SMOUTE: Synthetics minority over-samplingand under-sampling techniques for class imbalanced problem. In Proceedings of the Annual Interna-tional Conference on Computer Science Education: Innovation and Technology, Special Track: KnowledgeDiscovery. 78–83.
Jerzy Stefanowski. 2016. Dealing with data difficulty factors while learning from imbalanced data. In Chal-lenges in Computational Statistics and Data Mining. Springer, 333–363.
Jerzy Stefanowski and Szymon Wilk. 2008. Selective pre-processing of imbalanced data for improving clas-sification performance. In Data Warehousing and Knowledge Discovery. Springer, 283–292.
Yanmin Sun, Mohamed S. Kamel, and Yang Wang. 2006. Boosting for learning multiple classes with im-balanced class distribution. In Sixth International Conference on Data Mining, 2006. ICDM’06. IEEE,592–602.
Yanmin Sun, Mohamed S. Kamel, Andrew K. C. Wong, and Yang Wang. 2007. Cost-sensitive boosting forclassification of imbalanced data. Pattern Recogn. 40, 12 (2007), 3358–3378.
Yanmin Sun, Andrew K. C. Wong, and Mohamed S. Kamel. 2009. Classification of imbalanced data: A review.Int. J. Pattern Recogn. Artif. Intell. 23, 4 (2009), 687–719.
Muhammad Atif Tahir, Josef Kittler, and Fei Yan. 2012. Inverse random under sampling for class imbalanceproblem and its application to multi-label classification. Pattern Recogn. 45, 10 (2012), 3738–3750.
Aik Tan, David Gilbert, and Yves Deville. 2003. Multi-class protein fold classification using a new ensemblemachine learning approach. (2003).
Yuchun Tang and Yan-Qing Zhang. 2006. Granular SVM with repetitive undersampling for highly imbal-anced protein homology prediction. In 2006 IEEE International Conference on Granular Computing.IEEE, 457–460.
Yuchun Tang, Yan-Qing Zhang, Nitesh V. Chawla, and Sven Krasser. 2009. SVMs modeling for highlyimbalanced classification. IEEE Trans. Syst. Man Cybernet. B 39, 1 (2009), 281–288.
Dacheng Tao, Xiaoou Tang, Xuelong Li, and Xindong Wu. 2006. Asymmetric bagging and random subspacefor support vector machines-based relevance feedback in image retrieval. IEEE Trans. Pattern Anal.Mach. Intell. 28, 7 (2006), 1088–1099.
ACM Computing Surveys, Vol. 49, No. 2, Article 31, Publication date: August 2016.

A Survey of Predictive Modeling on Imbalanced Domains 31:49
Nguyen Thai-Nghe, Zeno Gantner, and Lars Schmidt-Thieme. 2011. A new evaluation measure for learningfrom imbalanced data. In The 2011 International Joint Conference on Neural Networks (IJCNN). IEEE,537–542.
Ivan Tomek. 1976. Two modifications of CNN. IEEE Trans. Syst. Man Cybern. 11 (1976), 769–772.Luıs Torgo. 2005. Regression error characteristic surfaces. In KDD’05: Proc. of the 11th ACM SIGKDD Int.
Conf. on Knowledge Discovery and Data Mining. ACM Press, 697–702.Luıs Torgo and Rita P. Ribeiro. 2003. Predicting outliers. In Knowledge Discovery in Databases: PKDD 2003.
Springer, 447–458.Luıs Torgo and Rita P. Ribeiro. 2007. Utility-based regression. In PKDD’07: Proc. of 11th European Conf. on
Principles and Practice of Knowledge Discovery in Databases. Springer, 597–604.Luıs Torgo and Rita P. Ribeiro. 2009. Precision and recall in regression. In DS’09: 12th Int. Conf. on Discovery
Science. Springer, 332–346.Luıs Torgo, Rita P. Ribeiro, Bernhard Pfahringer, and Paula Branco. 2013. SMOTE for regression. In Progress
in Artificial Intelligence. Springer, 378–389.Peter Van Der Putten and Maarten Van Someren. 2004. A bias-variance analysis of a real-world learning
problem: The coil challenge 2000. Mach. Learn. 57, 1–2 (2004), 177–195.Jason Van Hulse, Taghi M. Khoshgoftaar, and Amri Napolitano. 2007. Experimental perspectives on learning
from imbalanced data. In Proceedings of the 24th International Conference on Machine Learning. ACM,935–942.
Madireddi Vasu and Vadlamani Ravi. 2011. A hybrid under-sampling approach for mining unbalanceddatasets: Applications to banking and insurance. Int. J. Data Min. Model. Manag. 3, 1 (2011), 75–105.
Nele Verbiest, Enislay Ramentol, Chris Cornelis, and Francisco Herrera. 2012. Improving SMOTE withfuzzy rough prototype selection to detect noise in imbalanced classification data. In Advances in ArtificialIntelligence–IBERAMIA 2012. Springer, 169–178.
Konstantinos Veropoulos, Colin Campbell, and Nello Cristianini. 1999. Controlling the sensitivity of supportvector machines. In Proceedings of the International Joint Conference on Artificial Intelligence, Vol. 1999.Citeseer, 55–60.
Pascal Vincent, Hugo Larochelle, Isabelle Lajoie, Yoshua Bengio, and Pierre-Antoine Manzagol. 2010.Stacked denoising autoencoders: Learning useful representations in a deep network with a local de-noising criterion. J. Mach. Learn. Res. 11 (2010), 3371–3408.
Kiri L. Wagstaff, Nina L. Lanza, David R. Thompson, Thomas G. Dietterich, and Martha S. Gilmore. 2013.Guiding scientific discovery with explanations using DEMUD. In AAAI.
Byron C. Wallace and Issa J. Dahabreh. 2012. Class probability estimates are unreliable for imbalanceddata (and how to fix them). In 2012 IEEE 12th International Conference on Data Mining (ICDM). IEEE,695–704.
Byron C. Wallace and Issa J. Dahabreh. 2014. Improving class probability estimates for imbalanced data.Knowl. Inform. Syst. 41, 1 (2014), 33–52.
Byron C. Wallace, Kevin Small, Carla E. Brodley, and Thomas A. Trikalinos. 2011. Class imbalance, redux.In 2011 IEEE 11th International Conference on Data Mining (ICDM). IEEE, 754–763.
Benjamin X. Wang and Nathalie Japkowicz. 2010. Boosting support vector machines for imbalanced datasets. Knowl. Inform. Syst. 25, 1 (2010), 1–20.
Heng Wang and Zubin Abraham. 2015. Concept drift detection for imbalanced stream data. arXiv PreprintarXiv:1504.01044 (2015).
He-Yong Wang. 2008. Combination approach of SMOTE and biased-SVM for imbalanced datasets. In IEEEInternational Joint Conference on Neural Networks, 2008. IJCNN 2008. (IEEE World Congress on Com-putational Intelligence). IEEE, 228–231.
Shuo Wang and Xin Yao. 2009. Diversity analysis on imbalanced data sets by using ensemble models. InIEEE Symposium on Computational Intelligence and Data Mining, 2009. CIDM’09. IEEE, 324–331.
Xiaoguang Wang, Xuan Liu, Nathalie Japkowicz, and Stan Matwin. 2013a. Resampling and cost-sensitivemethods for imbalanced multi-instance learning. In 2013 IEEE 13th International Conference on DataMining Workshops (ICDMW). IEEE, 808–816.
Xiaoguang Wang, Stan Matwin, Nathalie Japkowicz, and Xuan Liu. 2013b. Cost-sensitive boosting algo-rithms for imbalanced multi-instance datasets. In Advances in Artificial Intelligence. Springer, 174–186.
Mike Wasikowski and Xue-wen Chen. 2010. Combating the small sample class imbalance problem usingfeature selection. IEEE Trans. Knowl. Data Eng. 22, 10 (2010), 1388–1400.
Deng Weiguo, Wang Li, Wang Yiyang, and Qian Zhong. 2012. An improved SVM-KM model for imbalanceddatasets. In 2012 International Conference on Industrial Control and Electronics Engineering (ICICEE).IEEE, 100–103.
ACM Computing Surveys, Vol. 49, No. 2, Article 31, Publication date: August 2016.

31:50 P. Branco et al.
Gary M. Weiss. 2004. Mining with rarity: A unifying framework. SIGKDD Explor. Newslett. 6, 1 (2004), 7–19.Gary M. Weiss. 2005. Mining with rare cases. In Data Mining and Knowledge Discovery Handbook. Springer,
765–776.Gary M. Weiss. 2010. The impact of small disjuncts on classifier learning. In Data Mining. Springer, 193–226.Gary M. Weiss. 2013. Foundations of imbalanced learning. In Imbalanced Learning: Foundations, Algorithms,
and Applications, Haibo He and Yunqian Ma (Eds.). John Wiley & Sons.Gary M. Weiss and Foster J. Provost. 2003. Learning when training data are costly: The effect of class
distribution on tree induction. J. Artif. Intell. Res.(JAIR) 19 (2003), 315–354.Cheng G. Weng and Josiah Poon. 2008. A new evaluation measure for imbalanced datasets. In Proceedings
of the 7th Australasian Data Mining Conference-Volume 87. Australian Computer Society, Inc., 27–32.Gang Wu and Edward Y. Chang. 2003. Class-boundary alignment for imbalanced dataset learning. In ICML
2003 Workshop on Learning from Imbalanced Data Sets II, Washington, DC. 49–56.Gang Wu and Edward Y. Chang. 2005. KBA: Kernel boundary alignment considering imbalanced data
distribution. IEEE Trans. Knowl. Data Eng. 17, 6 (2005), 786–795.Shaomin Wu, Peter Flach, and Cesar Ferri. 2007. An improved model selection heuristic for AUC. In ECML.
Springer, 478–489.Jin Xiao, Ling Xie, Changzheng He, and Xiaoyi Jiang. 2012. Dynamic classifier ensemble model for customer
classification with imbalanced class distribution. Expert Syst. Appl. 39, 3 (2012), 3668–3675.Li Xuan, Chen Zhigang, and Yang Fan. 2013. Exploring of clustering algorithm on class-imbalanced data. In
2013 8th International Conference on Computer Science & Education (ICCSE). IEEE, 89–93.Zeping Yang and Daqi Gao. 2012. An active under-sampling approach for imbalanced data classification. In
2012 Fifth International Symposium on Computational Intelligence and Design (ISCID). Vol. 2. IEEE,270–273.
Show-Jane Yen and Yue-Shi Lee. 2006. Under-sampling approaches for improving prediction of the minorityclass in an imbalanced dataset. In Intelligent Control and Automation. Springer, 731–740.
Show-Jane Yen and Yue-Shi Lee. 2009. Cluster-based under-sampling approaches for imbalanced data dis-tributions. Expert Syst. Appl. 36, 3 (2009), 5718–5727.
Yang Yong. 2012. The research of imbalanced data set of sample sampling method based on K-means clusterand genetic algorithm. Energy Procedia 17 (2012), 164–170.
Kihoon Yoon and Stephen Kwek. 2005. An unsupervised learning approach to resolving the data imbalancedissue in supervised learning problems in functional genomics. In Fifth International Conference onHybrid Intelligent Systems, 2005. HIS’05. IEEE, 6–pp.
Dai Yuanhong, Chen Hongchang, and Peng Tao. 2009. Cost-sensitive support vector machine based onweighted attribute. In International Forum on Information Technology and Applications, 2009. IFITA’09,Vol. 1. IEEE, 690–692.
Bianca Zadrozny, John Langford, and Naoki Abe. 2003. Cost-sensitive learning by cost-proportionate exampleweighting. In Third IEEE International Conference on Data Mining, 2003. ICDM 2003. IEEE, 435–442.
Arnold Zellner. 1986. Bayesian estimation and prediction using asymmetric loss functions. J. Am. Statist.Assoc. 81, 394 (1986), 446–451.
Dongmei Zhang, Wei Liu, Xiaosheng Gong, and Hui Jin. 2011. A novel improved SMOTE resampling algo-rithm based on fractal. J. Comput. Inform. Syst. 7, 6 (2011), 2204–2211.
Huaxiang Zhang and Mingfang Li. 2014. RWO-sampling: A random walk over-sampling approach to imbal-anced data classification. Inform. Fus. 20 (2014), 99–116.
Huimin Zhao, Atish P. Sinha, and Gaurav Bansal. 2011. An extended tuning method for cost-sensitiveregression and forecasting. Dec. Support Syst. 51, 3 (2011), 372–383.
Zhaohui Zheng, Xiaoyun Wu, and Rohini Srihari. 2004. Feature selection for text categorization on imbal-anced data. ACM SIGKDD Explor. Newslett. 6, 1 (2004), 80–89.
Zhi-Hua Zhou and Xu-Ying Liu. 2006. Training cost-sensitive neural networks with methods addressing theclass imbalance problem. IEEE Trans. Knowl. Data Eng. 18, 1 (2006), 63–77.
Jingbo Zhu and Eduard H. Hovy. 2007. Active learning for word sense disambiguation with methods foraddressing the class imbalance problem. In EMNLP-CoNLL, Vol. 7. 783–790.
Ling Zhuang and Honghua Dai. 2006a. Parameter estimation of one-class SVM on imbalance text classifica-tion. In Advances in Artificial Intelligence. Springer, 538–549.
Ling Zhuang and Honghua Dai. 2006b. Parameter optimization of kernel-based one-class classifier on im-balance learning. J. Comput. 1, 7 (2006), 32–40.
Received May 2015; revised March 2016; accepted March 2016
ACM Computing Surveys, Vol. 49, No. 2, Article 31, Publication date: August 2016.