a supplemental module for facilitative supervision … · a supplemental module for facilitative...
TRANSCRIPT

A SupplementAl module for fAcilitAtive SuperviSion
www.fistulacare.org
data for decision making
in fistula treatment Services

Data for Decision Making in Fistula Treatment Services
Data for Decision Making in Fistula Treatment Services A Supplemental Module for Facilitative Supervision

© 2011 EngenderHealth/Fistula Care. All rights reserved.
Fistula Care c/o EngenderHealth440 Ninth AvenueNew York, NY 10001 U.S.A.Telephone: 212-561-8000Fax: 212-561-8067e-mail: [email protected]
This publication is adapted from Module 6, Using Data to Assure the Quality of Medical Services, in: The ACQUIRE Project. 2008. Facilitative supervision for quality improvement: Trainer’s manual. New York: EngenderHealth/The ACQUIRE Project.
This publication is made possible by the generous support of the American People through the Office of Maternal and Child Health, U.S. Agency for International Development (USAID), under the terms of associate cooperative agreement GHS-A-00-07-00021-00. The contents are the responsibility of the Fistula Care project and do not necessarily reflect the views of USAID or the United States Government.
Printed in the United States of America. Printed on recycled paper.
ISBN: 978-1-937410-00-1
Suggested citation: EngenderHealth. 2011. Data for decision making in fistula care: A supplemental module for facilitative supervision. New York: EngenderHealth/Fistula Care.
FC0020

Data for Decision Making in Fistula Treatment Services
ContentsINTRODUCTION 1
MODULE 1: ROLE OF SUPERVISORS IN INVOLVING STAFF 3 IN THE USE OF DATA FOR DECISION MAKING
Activity A. Introduction and Uses of Data 4Activity B. Data Quality Assurance 6Activity C. Fistula Monitoring Indicators 7Activity D. Assessing Data Quality 8Activity E. Presentation of Data 9Activity F. Utilization of Data 11Activity G. Wrap-Up/End-of-Day Evaluation 13
MODULE 2: USE OF ROUTINE FISTULA REPAIR DATA AT THE FACILITY LEVEL 15Activity A. Introduction and Uses of Data 16Activity B. Data Quality Assurance 17Activity C. Working with Data at a Health Facility 19Activity D. Understanding Numbers and Indicators 19Activity E. Fistula Care Indicators 21Activity F. Ways of Presenting Data 22Activity G. Utilization of Data 24Activity H. Wrap-Up/End-of-Day Evaluation 26
MODULE 3: NATIONAL-LEVEL USE OF DATA FOR DECISION MAKING 27 FOR FISTULA REPAIR PROGRAMMING
Activity A. Introduction and Uses of Data 28Activity B. Fistula Indicators 29Activity C. Data Quality Assurance 30Activity D. Utilization of Data 31Activity E. Wrap-Up/End-of-Day Evaluation 33
APPENDIX 1: FLIPCHART GUIDES 35Module 1. Supervisors 36Module 2. Facility Level 38Module 3. National Level 41

Data for Decision Making in Fistula Treatment Services
APPENDIX 2: PARTICIPANT HANDOUTS 43Participant Handout A. Routine Performance Monitoring Indicators for Fistula Treatment Sites: 44
Definitions of Clinical Monitoring Indicators Participant Handout B. Sample Data for Fistula Repair Service Indicators with Errors 46Facilitator’s Guide for Participant Handout B 47Participant Handout C. Presentation of Data 48Participant Handout D. Key Steps in Audience Analysis 52Participant Handout E. Sample Data for Fistula Repair Services Indicators, Corrected 53Participant Handout F. Sample Repair Data Presented in Six Tables 54Participant Handout G. Sample Fistula Repair Graphs 56Participant Handout H. Sample Data for Fistula Repair Services Indicators 62Participant Handout I. Case Study 64
APPENDIX 3: SMALL GROUP EXERCISE INSTRUCTIONS 67Small Group Exercise A Instructions: Assessing Data Quality 68Small Group Exercise B Instructions: Utilization of Data 69Small Group Exercise C Instructions: Communication of Data 70
INTRODUCTION · FISTUla CaRE · 1
Data for Decision Making in Fistula Treatment Services
Introduction
The goal of the Fistula Care project is to increase and strengthen the number of health care sites providing fistula services, as well as to support prevention services. Fistula Care is focused on:
• Training surgical teams and strengthening the capacity of hospitals to provide optimal care for women with fistula
• Training doctors in fistula repair surgery
• Preventing new cases of fistula by improving the quality of emergency obstetric care and increasing access to family planning
• Engaging communities to change social norms and enable women to have timely access to maternal health care
• Collecting and analyzing data to improve the quality of current fistula services
• Encouraging a supportive policy environment for fistula repair services and prevention
One of the four program results of the Fistula Care project is specifically targeted on the use of data: “Gather, analyze, and report data to improve the quality of performance of fistula services.” Other ongoing activities in support of this result include conducting research studies and strengthening the capacity of our partners in the use of data for decision making. The use of data for decision making is an integral part of Fistula Care’s and EngenderHealth’s shared approach to quality improvement.
This document has been created to serve as a supplement to Module 6 (Using Data to Assure the Quality of Medical Services) of Facilitative Supervision for Quality Improvement: Trainer’s Manual (available on the accompanying CD-ROM and accessible at www.acquireproject.org/fileadmin/user_upload/ACQUIRE/Facilitative-Supervision/default.htm). This supplemental training module has a specific focus on the Fistula Care clinical indicators and is designed for use with three audiences:
1. Supervisors, either on-site or external, who attend facilitative supervision training: to orient them to their role in the process of assuring data quality in reporting and to improve their capacity to analyze, interpret, and use data for decision making and actions in the implementation of fistula programs.
2. Facility-Level Providers: to improve the quality of data reporting and the use of data at a facility level to improve services (The proposed exercises in this module can be carried out with facility staff by on-site or external supervisors.)
3. National-Level Stakeholders: to strengthen their ability to analyze, interpret, and use data for decision making (This module can be implemented by external supervisors or by key program advisors.)
While the modules include examples of data using the Fistula Care project’s clinical monitoring tool (Form 1A), trainers/facilitators should feel free to adapt and use other data as necessary (e.g., family planning service statistics). The primary objectives of the modules and key concepts remain the same, regardless of the data used.

2 · INTRODUCTION · FISTUla CaRE
Data for Decision Making in Fistula Treatment Services
Each module is designed with facilitator guidelines and activities to engage the participants in the process of analyzing and using data, with a focus on fistula indicators. The facilitator’s guide includes suggestions about the use of flipcharts; all flipchart examples are in Appendix 1, and are included in a PowerPoint file on the accompanying CD-ROM. Each module contains handouts for participants (see Appendix 2) and exercises to reinforce the concepts of good data management with various stakeholder groups (see Appendix 3).
Summary of Activities by Module
Module 1: Supervisors
Module 2: Facility-Level
Providers
Module 3: National-level Stakeholders
Introduction to Data for Decision Making
Data Quality Assurance
Fistula Monitoring Indicators
Assessing Data Quality
Presentation of Data
Utilization of Data
Data at the Health Facility
Understanding Numbers and Indicators
Wrap-Up/Evaluation
Total number of activities 7 8 5
Suggested total time needed 4 hours 3 hours, 35 minutes
3 hours, 25 minutes
The last session in each module is the Wrap-Up/Evaluation. Trainers should distribute one form to each participant to complete or conduct a group exercise to get feedback about the working session.
MODUlE 1: ROlE OF SUpERvISORS IN INvOlvINg STaFF · FISTUla CaRE · 3
Data for Decision Making in Fistula Treatment Services
MODULE 1
Role of Supervisors in Involving Staff in the Use of Data for Decision Making
Learning ObjectivesBy the end of this session, the participants will be able to:
• Understand key indicators related to delivery of fistula repair services
• Explore the role of supervisors in the process of assuring data quality
• Improve the capacity of supervisors to analyze, interpret, and use data for decision making and actions for implementation of a fistula program
Materials• Participant Handout A: Routine Performance Monitoring Indicators for Fistula Treatment Sites:
Definitions of Clinical Monitoring Indicators (Activity C)
• Participant Handout B: Sample Data for Fistula Repair Services Indicators with Errors (Activity D)
• Small Group Exercise A Instructions: Assessing Data Quality (Activity D)
• Participant Handout C: Presentation of Data (Activity E)
• Participant Handout D: Key Steps in Audience Analysis (Activity F)
• Participant Handout E: Sample Data for Fistula Repair Services Indicators, Corrected (Activity F)
• Small Group Exercise B Instructions: Utilization of Data (Activity F)
• Flipcharts 1A, 1B, 1C, 1D, 1E, IF, 1G, 1H
• Graph paper, blank paper, flipchart paper, pens, and markers
Advance Preparation1. Make enough copies of participant handouts A, B, C, D, and E, and the instructions for group exercises
A and B.
2. Prepare flipcharts 1A, 1B, 1C, 1D, 1E, 1F, 1G, and 1H (see Appendix 1, Flipchart Guides).
3. If possible, share the Fistula Care project indicators handout (Participant Handout A) with the participants prior to the workshop and ask them to review it. This will save some time in the review of the indicators. If you are working with a group of providers who are not familiar with the indicators, readjust the time allocated for Activity C (allow 10–15 additional minutes for discussion).

4 · MODUlE 1: ROlE OF SUpERvISORS IN INvOlvINg STaFF · FISTUla CaRE
Data for Decision Making in Fistula Treatment Services
Module 1 Session Time: 4 Hours
Training Activities Time
A. Introduction and Uses of Data 15 minutes
B. Data Quality Assurance 15 minutes
C. Fistula Monitoring Indicators 40 minutes
D. Assessing Data Quality 1 hour, 15 minutes
E. Presentation of Data 15 minutes
F. Utilization of Data 1 hour
G. Wrap-Up/End-of-Day Evaluation 20 minutes
Total 4 hours
Activity A. Introduction and Uses of Data Discussion/Presentation (15 minutes)
1. Post Flipchart 1A and present the learning objectives for the session:
• Understanding key indicators related to the delivery of fistula repair services
• Exploring the role of supervisors in the process of assuring data quality
• Improving the capacity of supervisors to analyze, interpret, and use data for decision making and for taking action to implement a fistula program
Ask the participants if they have any questions or specific expectations during the session.
2. Review the ground rules for the session with the participants. (Note: If this session is part of larger training on facilitative supervision, there is no need to review ground rules.) Refer to Module 1 of the Facilitative Supervision Curriculum Trainers Manual for tips on how to brainstorm to set ground rules for the session. These might include the following:
• Explain that you all will be working together for the duration of the training and that it would be a good idea to set some ground rules for how you will run the seminar and how you will interact.
• Tell the participants that you are going to conduct a brainstorming exercise for that purpose.
• Post Flipchart 1B and ask the participants to suggest rules for how the training course should be run and how they should treat each other. Write down the participants’ responses on the flipchart.

MODUlE 1: ROlE OF SUpERvISORS IN INvOlvINg STaFF · FISTUla CaRE · 5
Data for Decision Making in Fistula Treatment Services
Some examples of ground rules:
• Participate actively.
• Respect each other and all opinions.
• Speak one at a time.
• Focus on processes, not on individuals.
• Turn off all cell phones.
• Be supportive rather than judgmental.
3. Tell the participants that during the session, they will learn what types of clinical data are important for monitoring fistula care programs and how these data can be used for different kinds of decision making.
4. Explain to the participants that the term “accountability” may be commonly thought of in financial terms. However, in the area of programs (services), individual patient-level and population-level data can help us be accountable for the services we are expected to provide (such as in reference to the funds given to provide a service, in reference to individual-level outcomes, or in reference to the need among the target audience). Make sure that the participants understand that tracking indicators at the health facility level helps them to measure their progress and keeps them accountable to themselves.
5. Ask the participants to explain how they understand the expression “using data for decision making.” After their responses, post Flipchart 1C and ask for a volunteer to read it.
6. Emphasize all of the steps in the process by asking the following questions (5 minutes):
• What does obtaining data entail? (Possible answer: details about the collecting, processing, and managing of data)
• What is the difference between analyzing and interpreting data? (Possible answer: Analyzing data involves organizing and sifting the data to find important results. Interpreting data is answering the question “what does the information tell us?” from the analysis.)
• Why might it be important to highlight both “making decisions” and “taking action”? (Possible answer: Taking action is acting upon decisions made; no other part of the data for decision-making process matters if no actions are taken as a result.)
7. Ask the participants to share their experiences with collecting or using data in their everyday work. What sources do they use? What is the process of obtaining the data and of sharing them with staff, analyzing them, interpreting them, and using them? Allow 10 minutes for the participants to share these experiences.

6 · MODUlE 1: ROlE OF SUpERvISORS IN INvOlvINg STaFF · FISTUla CaRE
Data for Decision Making in Fistula Treatment Services
Activity B. Data Quality Assurance Presentation (15 minutes)
1. Tell the participants that it is not only an issue of whether supervisors use data to make decisions, but also whether they use good-quality data for those decisions. Explain that sometimes making decisions from bad data can be even worse than making decisions without data. Ask the participants what they think are some of the reasons that it would be important to have good-quality data.
2. Ask the participants for examples of what good-quality data look like. After their responses, reveal Flipchart 1D and tell them that when we talk about data, it is common to break the concept down into what are called the “dimensions of data.” Ask for a volunteer to read the flipchart, pausing after each dimension is read out loud.
3. As the volunteer reads out the list with the definitions, explain for each data dimension what the consequences are of having poor data. Explain that:
a. Inaccurate data (also called invalid data) could involve recording as fistula cases those that are not clinically fistula or recording complications that are unrelated to the surgery as complications related to the surgery.
b. Unreliable data might be data that are not recorded in the same way every time. Perhaps one health care worker is not recording data correctly, even though all of the other health care workers are doing so. However, because of that one health care worker, the whole dataset is no longer reliable.
c. Incomplete data may result from not recording every case, complication, or outcome as required. Sometimes health care workers may get busy and forget to record the data, or they may forget to include women who are already at the health facility at the start of the time period.
d. Imprecise data might involve, for example, providing only a total for an indicator that is supposed to be broken down into subcategories (e.g., outcome of surgery).
e. Untimely data can happen when data are not available for a medical monitoring visit or for when the government or EngenderHealth needs to report the data. Timeliness of data is an important aspect of data for decision making, since the data have to be available for the decisions to be made in a timely manner.
f. Data must have integrity and must be protected from manipulation or deliberate bias.
4. Tell the participants that in addition to the dimensions of data quality, there are also different kinds of “data copy errors.” Explain that these are simple logical and recording errors. Some of the main kinds of data copy errors include:
a. Transposition errors: An example of a transposition error is when the correct number is 93, but you write 39 by mistake.
b. Missing data: This type of error may include data that are truly missing, a sum that has not been appropriately disaggregated, or a “false” zero (i.e., when a zero is recorded to signify a true zero when in fact the data are missing).
c. Copy errors: These include writing that is not easy to read and extra zeros that should not be there (e.g., “10” written as “100”).

MODUlE 1: ROlE OF SUpERvISORS IN INvOlvINg STaFF · FISTUla CaRE · 7
Data for Decision Making in Fistula Treatment Services
5. Explain to the participants that data cleaning is a process that starts during data collection and verification. In general, data cleaning is a two-step process: identifying potential problems, and correcting or verifying any potential problems. To identify problems, you need to look for:
a. Transposition errors, missing data, and copy errors
b. Numbers that are out of the range of what is normal
c. An incorrect sum
d. Logical impossibilities (For example, the number of women screened and counted as requiring fistula repair surgery exceeds the number of women counted as seeking services at the facility. Not all women with incontinence who seek services have a fistula; some women will be suffering from prolapse or stress incontinence.)
6. Tell the participants that to correct or verify errors, the supervisor or the persons responsible for preparing the reports often need to go back to the register itself to review the data. This is why it is very important to make sure that the people recording the data understand what data they are supposed to be collecting and how to record them. Training in data management is essential.
7. Tell the participants that they will have an opportunity to review data to assess their quality.
Activity C. Fistula Monitoring Indicators Discussion/Presentation (40 minutes)
1. Tell the participants that they are going to review 13 core indicators for fistula treatment used by the Fistula Care project. Emphasize that Fistula Care indicators are focused uniquely on service delivery data, but that it is important to keep in mind that other kinds of data can help in making decisions related to fistula programming. Ask the participants what kinds of information they think are important for a fistula program beyond service delivery indicators. (Possible answers: sexual and reproductive health service statistics, population-based surveys such as the Demographic and Health Surveys, census data, client interviews, focus group discussions, and key informant interviews) Tell the participants that while reviewing the core service delivery indicators, they should keep in mind that these are just one kind of the many types of data available.
2. Refer the participants to Participant Handout A. Routine Performance Monitoring Indicators for Fistula Treatment Sites, which lists indicators that are used by the Fistula Care project and their definitions. Guide the participants through this resource, as follows:
a. Review indicators 1–3 (demand for fistula services) together and ask the participants:
• Which of the three indicators is likely to be the largest? (Answer: 1—the number of women arriving and seeking fistula repair)
• What if Indicator 2 (number of women requiring surgery) is very small compared with Indicator 1? What might that tell us? (Answer: Perhaps there are problems in recording cases or problems in understanding what kinds of cases to refer from lower-level facilities or the community.)

8 · MODUlE 1: ROlE OF SUpERvISORS IN INvOlvINg STaFF · FISTUla CaRE
Data for Decision Making in Fistula Treatment Services
• What if Indicator 3 (number of women getting surgery) is much lower than Indicator 2? What could this indicate? (Answer: There may be a backlog of cases; reasons for why there is a backlog need to be discussed—e.g., no surgeon, lack of supplies, etc.)
b. Review the indicators about the profile of women getting surgery (No. 4—type of fistula repair, and No. 5—number of previous repairs) and tell the participants that the sum for 4.1, 4.2, and 4.3 must equal Indicator 3, and that the sum of 5.1, 5.2, and 5.3 must equal the sum of 4.1 and 4.2.
c. Review the indicators about discharge (Indicators 6, 7, and 8) and ask:
• Which indicators do 6 (urinary-only fistula), 7 (urinary and rectovaginal fistula [RVF]), and 8 (RVF only) correspond to? (Answer: Nos. 4.1, 4.2, and 4.3.)
• Can the total number of women discharged (Indicator 9) be larger than the total number who had surgery (Indicator 3)? (Answer: Yes, some women who had surgery in the last reporting period were not discharged in the same quarter in which they had surgery.)
• Can the number of women discharged (Indicator 9) be smaller that the number who had surgery (Indicator 3)? (Answer: Yes, not every woman who has surgery will be discharged in the same quarter.)
d. Review indicators about the outcome of surgery (Indicators 11 and 12) and tell the participants to take note that the sum of 11.1, 11.2, and 11.3 should equal the sum of 6 and 7 (the number of patients discharged with urinary fistula and/or urinary fistula and RVF). The sum of 12.1, 12.2, and 12.3 should equal 8 (the number of patients discharged with RVF only).
e. Review Indicator 13 (complications). Indicator 13 should equal the sum of 13.1, 13.2, and 13.3.
f. Review Indicator 10 (the number of women not discharged this quarter). Tell the participants that Indicator 10 will usually equal any difference between Indicator 3 (the number getting surgery) and Indicator 9 (the total discharged). There will, however, be instances in which the number of women who were not discharged may be larger than this difference. For example, a patient may need to remain in hospital for a long period because she required additional surgeries. The number not discharged helps in knowing about bed capacity for fistula repairs at the facility.
Activity D. Assessing Data Quality Small Group Exercise/Discussion (1 hour, 15 minutes)
1. Tell the participants that they will be using sample data to help them detect data quality assurance issues and will discuss the possible role and actions of supervisors in assuring the quality of data. Refer back to Flipchart 1D (Dimensions of data quality).
2. Divide the participants into four groups. Tell them that each group will use the same set of data from a hypothetical hospital. Groups 1 and 3 will look at demand and profile indicators (Indicators 1–5); Groups 2 and 4 will look at fistula surgery outcome indicators (Indicators 6–13). Distribute copies of Participant Handout B. Sample Data for Fistula Repair with Errors and Small Group Exercise A Instructions. Post Flipchart E and read the following instructions about how the groups should proceed:

MODUlE 1: ROlE OF SUpERvISORS IN INvOlvINg STaFF · FISTUla CaRE · 9
Data for Decision Making in Fistula Treatment Services
a. Tell the groups to review the data in the table and identify potential data errors.
b. Ask the participants to answer each of the questions and to make a list of all of the observed errors. Allow the groups 30 minutes to do their work.
3. After 30 minutes, ask each group to present their results for each question. Allow the entire group 30 minutes to discuss and explore the different data quality issues. (Refer to the Facilitator’s Guide for Participant Handout B for the correct answers.)
4. OPTIONAL. Use this next exercise if the participants have already participated in a facilitative supervision workshop. If the participants are not familiar with the techniques, consider eliminating this exercise. Tell the participants that they will now participate in a role play using the same data. Ask for two volunteers: One person will be the supervisor, and one will be the supervisee. Explain that the role play will show them how to use facilitative supervision techniques to improve data quality. Explain that the supervisor will choose one problem that was identified during the data cleaning exercise to discuss with the supervisee. Explain that the supervisee is to think about the kinds of resistance and imagined criticism that could be encountered in such a typical situation. Allow 5 minutes for the role play. Encourage constructive feedback from the larger group.
Activity E. Presentation of Data Presentation (15 minutes)
1. Tell the participants that there are many different ways in which to present data, some of which they may be very familiar and comfortable with and some less so. However, it is good to review the basics, because we can always learn something new when we look at data again. Distribute Participant Handout C. Presentation of Data.
2. Explain that some of the different ways for presenting data include lists, tables, and graphs (also called charts).
3. Tell the participants that lists will be covered first. Make the following points about lists:
a. Lists are one of the simplest ways to present data, but they are also the least sophisticated.
b. Lists are best if they are bulleted or numbered.
c. Ranking: One useful way to use lists is with ranking. Ranking is when the order of items in a numbered list has some sort of meaning.
• For example, if we wanted to show which type of fistula was most common, “urinary vaginal fistula (UVF) alone” would most likely appear first on the list, “UVF and RVF together” might appear second, and “RVF alone” would be third, with the number of cases for each.
d. However, lists are best when they are short. Reconsider the utility of a list if it has more than 10 items, as it is difficult for the human brain to process more than five pieces of information at once. (A list of 10 items is possible, because it is easy to mentally break the list into two.)

10 · MODUlE 1: ROlE OF SUpERvISORS IN INvOlvINg STaFF · FISTUla CaRE
Data for Decision Making in Fistula Treatment Services
4. Explain that a table is a side-by-side comparison of two or more lists. It presents data with different dimensions, whereas a list presents data with one dimension. For example, a table may show different complications among fistula repair clients across several quarters. Post Flipchart 1F and discuss it with the participants.
a. Explain that this means that tables can make more sophisticated comparisons than lists:
• Across time (quarters, months, years)
• By category (e.g., by type of fistula)
b. Another helpful feature with a table is that it can include totals at the bottom of rows, columns, or the whole table.
c. Post Flipchart 1G and discuss it with the participants.
5. Explain that another way to present data is through graphs (or charts). Make the following points about graphs:
a. These are among the most visual ways to present data.
b. One of the biggest mistakes made when presenting data through graphs or charts is to try to communicate too much information. However, we can avoid this mistake by taking note of when we need to present data in table format or when we can instead create multiple graphs to show different aspects of the same data.
c. One great thing about graphs and tables is that a computer or many materials are not necessarily required to make them. However, sometimes we hesitate to make graphs by hand because we think that a chart needs to be computer-produced for it to be worthwhile. This is not true. It may take more time to make a graph by hand, but both types of graph can be equally effective.
d. Explain that while there are many different types of graphs, this activity will focus on a few of the most common and simplest types.
e. Explain the different types of graphs:
• Cluster bar and column graphs
∗ Results are gathered into small groups, called clusters.
∗ Bar graphs are horizontal, while column graphs are vertical.
∗ There are no real differences between them, but sometimes one is easier to read than the other.
∗ Bar graphs are good for comparing two or more things across time.
• Stacked bar/column graphs
∗ Stacked bar or column graphs can be used to show the cumulative total for a cluster. The data are the same as in a cluster graph, but all of the units within a cluster are added together so the total can be seen for each cluster and the clusters can be compared with each other.
• 100% stacked bar/column graphs
∗ This type of graph converts the clusters in a regular stacked bar graph into percentages, so that all clusters are comparable with each other.
MODUlE 1: ROlE OF SUpERvISORS IN INvOlvINg STaFF · FISTUla CaRE · 11
Data for Decision Making in Fistula Treatment Services
• Line graphs
∗ Line graphs are usually best for showing trends over time.
∗ The line consists of a series of points over time.
• Pie graphs
∗ Pie graphs are best for comparing part of a whole.
∗ They are good for highlighting the largest proportion.
∗ Pie graphs are not ideal for a variable with many potential values—pies become difficult to read if there are too many slices.
Activity F. Utilization of Data Presentation /Discussion/Small Group Exercise (1 hour)
1. Ask the participants what situations they can think of in which they or others may or should use fistula repair services data. Probe by asking about the kinds of decisions or actions that need to be made with such data, who the recipients of those decisions/actions are, and who makes those decisions or takes those actions (e.g., Ministry of Health, EngenderHealth, other nongovernmental organizations, donors, or international groups). Ask someone in the group to write the answers down on a piece of flipchart paper and encourage discussion and creativity.
2. Reveal Flipchart 1H and explain that there are four general categories of when to use data for decision making. Ask the participants how the group-generated list fits these four categories.
3. Tell the participants that although they have identified many different situations in which to use data, they need to take it one step further and be systematic in their treatment of these data. There are three key steps to follow: audience analysis, message identification, and delivery/presentation of the data.
4. Distribute Participant Handout D: Key Steps in Audience Analysis and explain that for audience analysis, the first step is to identify your audience(s), analyze their needs, determine how best to communicate with them, anticipate their questions or concerns, and relate specific actions or decisions that you need them to take. Emphasize that it is important to:
a. Identify what the audience needs rather than what they themselves know or what we want to impress them with.
b. Consider the audience’s level of technical knowledge, as well as their interests and motivations.
c. Anticipate their question and concerns, so you can be prepared with answers.
d. Determine solutions, in the form of specific actions and/or decisions for any problems.
5. For messages, it is very important to prioritize information to share with our audiences. Therefore, it is recommended that you choose 3–5 points only.

12 · MODUlE 1: ROlE OF SUpERvISORS IN INvOlvINg STaFF · FISTUla CaRE
Data for Decision Making in Fistula Treatment Services
6. Ask the participants:
• Why do you think that it is important to focus on 3–5 points of information? (Possible answers include: To keep people’s attention; 3–5 pieces of information are all that most of us can keep in mind at any one time; you don’t want to overwhelm your audience; and it’s about going through the process of interpreting the data and not stopping at simply analyzing it.)
• Why is it important to avoid presenting only negative information? (Possible answers include: It can create a sense of helplessness; it doesn’t present information to suggest that change can actually happen.)
• Why do you think that it might be important to think about your conclusions or the action you want your audience to take when selecting the information that you will present to them? (Possible answers include: It can help keep them focused and motivated on making decisions and taking action; it lessens the burden on them to weed out the important information, thereby increasing the likelihood of keeping them focused and motivated on making decisions and taking action; it appeals to their sense of logic.)
7. Tell the participants that they need to think about the different ways of presenting key points. Generally, there are three format types: numerical formats (percentages, tables, totals), visual formats (charts), and narrative formats (two-page information sheets, stories, reports, etc.). Ideally, it is good to use a combination, but that is not always possible.
8. Tell the participants that further use of the same data will help them analyze and discuss the possible role and actions of supervisors in the use of data. Divide the participants into three groups for Small Group Exercise B. Distribute Participant Handout E (Sample Data for Fistula Repair Service Indicators, Corrected) and the Small Group Exercise B Instructions: Utilization of Data. Distribute graph paper and pens for small group work, and explain that:
a. Group 1 should use data to motivate and encourage staff.
b. Group 2 should use data to improve the quality of services.
c. Group 3 should use data to advocate for support from authorities.
9. Explain that each group has 30 minutes to:
a. Analyze their audiences.
b. Identify three key points.
c. Prepare a small presentation of a plan to communicate the three key points to their audiences.
10. Tell the participants that they will also then conduct a role play:
a. Each group will select three participants among the others in the room to be their respective audiences.
b. Each group will have 5 minutes to present their three points to their “audience” and receive their feedback.
c. Note: Emphasize that being brief is an essential skill when presenting data.

MODUlE 1: ROlE OF SUpERvISORS IN INvOlvINg STaFF · FISTUla CaRE · 13
Data for Decision Making in Fistula Treatment Services
Activity G. Wrap-Up/End-of-Day Evaluation (20 minutes)
Ask the participants for feedback about the sessions. Distribute an evaluation form to each participant, or ask for feedback and write the participants’ responses on a piece of flipchart paper.
Sample questions for the group include:
• What one thing did you learn today that you do not want to forget?
• What information or activity did you find most interesting and useful today?
• What would you recommend for improving the session?

Data for Decision Making in Fistula Treatment Services

MODUlE 2: USE OF ROUTINE FISTUla REpaIR DaTa aT ThE FaCIlITy lEvEl · FISTUla CaRE · 15
Data for Decision Making in Fistula Treatment Services
MODULE 2
Use of Routine Fistula Repair Data at the Facility Level
ObjectivesBy the end of this session, the participants will be able to:
• Understand key indicators related to the delivery of fistula repair services
• Understand the importance of data quality
• Learn how to present information about services provided
Materials• Graph paper, markers, rulers, pencils, etc. (whatever supplies would be readily available at health
facilities where the participants work)
• Flipchart paper
• Scrap paper and pens
• Participant Handouts:
∗ Participant Handout A. Routine Performance Monitoring Indicators for Fistula Treatment Sites: Definitions of Clinical Monitoring Indicators (Activity E)
∗ Participant Handout C. Presentation of Data (Activity F)
∗ Participant Handout F. Sample Fistula Repair Data Presented in Six Tables (Activity G)
∗ Participant Handout G. Sample Fistula Repair Graphs (Activity G)
Advance Preparation1. Adapt materials with relevant local examples and/or data, as appropriate.
2. Make enough copies of the participant handouts.
3. Prepare flipcharts 2A through 2L (see Appendix 1, Flipchart Guides).
If possible, share the Fistula Care project indicators handout (Participant Handout A) with the participants prior to the workshop and ask them to review it. This will save some time in the review of the indicators. If you are working with a group of providers who are not familiar with the indicators, readjust the time allocated for Activity C (allow 10–15 additional minutes for discussion).

16 · MODUlE 2: USE OF ROUTINE FISTUla REpaIR DaTa aT ThE FaCIlITy lEvEl · FISTUla CaRE
Data for Decision Making in Fistula Treatment Services
Module 2 Session Time: 3 Hours, 35 minutes
Training Activities Time
A. Introduction and Uses of Data 10 minutes
B. Data Quality Assurance 15 minutes
C. Working with Data at a Health Facility 15 minutes
D. Understanding Numbers and Indicators 30 minutes
E. Fistula Care Indicators 40 minutes
F. Ways of Presenting Data 15 minutes
G. Utilization of Data 1 hour, 10 minutes
H. Wrap-Up/End-of-Day Evaluation 20 minutes
Total 3 hours, 35 minutes
Activity A. Introduction and Uses of Data Presentation (10 minutes)
1. Post Flipchart 2A and present the learning objectives for this session.
• Understanding key indicators related to the delivery of fistula repair services
• Understanding the importance of data quality
• Learning how to present information about services provided
2. Ask the participants if they have any questions or specific expectations about the session.
3. Review the ground rules for the session. Refer to Module 1 of the Facilitative Supervision Curriculum Trainer’s Manual for tips on how to brainstorm to set ground rules for the session. These might include the following:
• Explain that you all will be working together for the duration of the training and that it would be a good idea to set some ground rules for how you will run the seminar and how you will interact.
• Tell the participants that you are going to conduct a brainstorming exercise for that purpose.
• Post Flipchart 2B and ask the participants to suggest rules for how the training course should be run and how they should treat each other. Write the participants’ responses on the flipchart.

MODUlE 2: USE OF ROUTINE FISTUla REpaIR DaTa aT ThE FaCIlITy lEvEl · FISTUla CaRE · 17
Data for Decision Making in Fistula Treatment Services
Some examples of ground rules:
• Participate actively.
• Respect each other and all opinions.
• Speak one at a time.
• Focus on processes, not on individuals.
• Turn off all cell phones.
• Be supportive rather than judgmental.
4. Tell the participants that the purpose of this workshop is to give them skills and a better understanding of how they can use data or information that they routinely collect—or can collect with a little extra effort—to improve the quality of care at the health facilities where they work and thus have happier, more fulfilling jobs.
5. Explain that the focus of the session will be on data related to obstetric fistula repair services because that is the primary focus of this program, but that the discussion and skills that are addressed in this workshop can extend far beyond fistula care programming. Encourage them to think creatively about how these issues can be applied in different ways in their health facilities and jobs.
6. Emphasize that many people have mixed experiences working with numbers. Explain that sometimes numbers or data can be intimidating if we do not know quite what do with them or how to make sense of them. Sometimes, recording and reporting requirements can feel like an unnecessary burden and can take away from the time that we have to spend with clients. Or sometimes, we do not think much about the data that we collect and report at health facilities, because we see this as just another part of the job that we do. Some people may also feel that the service statistics that are collected could make us look bad or even result in criticism or disciplinary action.
7. Explain to the participants that working with numbers at the health facility can be a very rewarding experience, and that it can not only make their jobs more enjoyable, but also lead to better quality of care and improved patient outcomes.
Activity B. Data Quality Assurance Presentation (15 minutes)
1. Tell the participants that as part of their responsibility of preparing reports for their supervisors or the Ministry of Health, to facilitate good decision making, they need to ensure that the data reported are of good quality. Explain that sometimes, making decisions from bad data can be even worse than making decisions without data. Ask the participants what they think are some of the reasons that it would be important to have good-quality data.
2. Ask the participants for examples of what good-quality data look like. After their responses, reveal Flipchart 2C and tell the participants that when we talk about data, it is common to break the concept down into what are called the “dimensions of data quality.” Ask for a volunteer to read the flipchart, pausing after each dimension is read out loud.

18 · MODUlE 2: USE OF ROUTINE FISTUla REpaIR DaTa aT ThE FaCIlITy lEvEl · FISTUla CaRE
Data for Decision Making in Fistula Treatment Services
3. As the volunteer reads out the list with the definitions, explain for each data dimension what the consequences are of having poor data. Explain that:
a. Inaccurate data (also called invalid data) could involve recording as fistula cases those that are not clinically fistula or as complications related to the surgery complications that are unrelated to the surgery.
b. Unreliable data might be data that are not recorded in the same way every time. Perhaps one health care worker is not correctly recording data, while all of the other health care workers are doing so. However, because of that one health care worker, the whole dataset is no longer reliable.
c. Incomplete data may result from not recording every case, complication, or outcome as required. Sometimes health care workers may get busy and forget to record the data, or they may forget to include women who are already at the health facility at the start of the time period.
d. Imprecise data might involve, for example, providing only a total for an indicator that is supposed to be broken down into subcategories (e.g., outcome of surgery).
e. Untimely data can happen when data are not available for a medical monitoring visit or for when the government or EngenderHealth needs to report the data. Timeliness of data is an important aspect of data for decision making, since the data have to be available for the decisions to be made in a timely manner.
f. Data must have integrity and must be protected from manipulation or deliberate bias.
4. Tell the participants that in addition to the dimensions of data quality, there are also different kinds of “data copy errors.” Explain that these are simple logical and recording errors. Some of the main kinds of data copy errors include:
a. Transposition errors: An example of a transposition error is when the correct number is 93, but you write 39 by mistake.
b. Missing data: This type of error may include data that are truly missing, a sum that has not been appropriately disaggregated, or a “false” zero (i.e., when a zero is recorded as if to signify a true zero when in fact the data are missing).
c. Copy errors: These include writing that is not easy to read and extra zeros that should not be there (e.g. “10” written as “100”).
5. Explain to the participants that data cleaning is a process that starts during data collection and verification. In general, we can think of data cleaning as a two-step process: identifying potential problems, and correcting or verifying any potential problems. To identify the problems, you need to look out for:
a. Transposition errors, missing data, and copy errors
b. Numbers that are out of range of what is normal
c. An incorrect sum
d. Logical impossibilities (for example, the number of women needing surgery being greater than the number seeking services)

MODUlE 2: USE OF ROUTINE FISTUla REpaIR DaTa aT ThE FaCIlITy lEvEl · FISTUla CaRE · 19
Data for Decision Making in Fistula Treatment Services
6. Tell the participants that to correct or verify errors, you often need to go back to the register itself or to the person or people collecting the data. This is why it is very important to make sure that the people recording the data understand what data they are supposed to be collecting and how to record them.
Activity C. Working with Data at a Health Facility Presentation/Discussion (15 minutes)
1. Tell the participants that they will start by sharing experiences about ways in which they have interacted with data in the past, especially at the health facilities where they currently work.
2. Ask them first what kinds of data or information are collected at the health facilities where they work and what is done with that data:
a. Does anyone ever use or discuss the data or information at the health facility other than when they fill in reporting forms?
b. Ask for specific examples of ways in which they have seen data used at the health facility for something other than reporting upward.
c. If no one can provide any specific examples, probe by asking whether they ever post service delivery statistics or discuss service delivery statistics during staff meetings.
d. If they are still not able to give any examples or recognize any experience, rephrase the questions to ask what ways they think that data or information could be used in a way other than for reporting.
3. Ask the participants:
• Do they think that using data or information at the health facility level is something that is worthwhile? Why/why not?
• What are some obstacles to using data at the health facility level?
• What are some of the benefits?
4. Reveal Flipchart 2D and tell the participants that there are reasons for using data or information at the health facility. Ask someone in the group to read the flipchart.
Activity D. Understanding Numbers and Indicators Presentation (30 minutes)
1. Tell the participants that when we talk about data or information, we are mostly talking about numbers or about numbers in the form of indicators. Explain that to help them think about the appropriate use of data or information on fistula repair services at the health facility level, they will talk in more detail about numbers and indicators.

20 · MODUlE 2: USE OF ROUTINE FISTUla REpaIR DaTa aT ThE FaCIlITy lEvEl · FISTUla CaRE
Data for Decision Making in Fistula Treatment Services
2. Explain that numbers are one very important type of information. However, it is still important to keep nonquantitative kinds of information in mind, because numbers only tell one part of the story:
• For example, we may see an increase in postoperative complications related to the perceived success of the surgery, but we may not know what that trend means if we do not also look at other pieces of information, such as infection prevention practices.
3. Explain the need to remember that numeric information almost always has limitations of some sort. This means that we have to be careful in the conclusions that we draw from numbers and try to look at multiple sources of data over multiple time periods on the same issue.
• For example, we can be much more confident in concluding that there is an increase in postoperative complications if we are looking at two years of data rather than just two quarters.
4. Tell the participants that indicators on fistula repair surgeries are a useful tool. So what exactly are indicators?
5. Reveal Flipchart 2E (Indicators) and ask someone from the group to read the quote out loud.
6. Tell the participants that indicators are summary measures; they provide us with a summary of particular data for a specific time period. An indicator measures some aspect of a program (an input, process, output, outcome, or impact). Reveal Flipchart 2F (Indicator definitions).
7. Tell the participants that indicator data provide signals about whether a program is on track, and they should inform corrective management action when there is a problem. An example of an indicator is the number of women getting fistula repair surgery during the previous quarter.
8. Tell the participants that there are different formats in which to present numbers and indicator data, primarily as plain numbers or as fractions.
9. Reveal Flipchart 2G (Plain numbers and fractions) and refer to it as you explain the differences between plain numbers and the different kinds of fractions.
10. Make the following points about plain numbers:
a. Plain numbers tend to present data in their simplest form and do not usually require any calculation beyond addition or subtraction.
• Example: Number of women seeking fistula repair services
b. Plain numbers are good for rare occurrences.
• Example: In September 2009, two fistula repair clients experienced major surgical complications.
c. They can be used to indicate the magnitude of an occurrence.
• Example: Between January and March 2008, the regional hospital repaired 246 fistulas.
d. With plain numbers, comparisons can be made directly, but only among things that are absolutely alike.
• Example: Number of new cases in Quarter 1 compared with the number of new cases in Quarter 2
• But not: Number of clients experiencing an anesthesia-related complication in Quarter 1 compared with the number of clients experiencing a postoperative complication in Quarter 2
MODUlE 2: USE OF ROUTINE FISTUla REpaIR DaTa aT ThE FaCIlITy lEvEl · FISTUla CaRE · 21
Data for Decision Making in Fistula Treatment Services
11. Tell the participants that another useful way to present data is in the form of fractions, such as simple ratios, rates, and proportions. Discuss the following points:
a. Simple ratios, rates, and proportions are all fractions. That means that they all have a numerator and a denominator.
• A numerator is the number on the top of a fraction.
• The denominator is the number on the bottom of the fraction.
12. Proportions or percentages are a way to compare parts of a whole.
a. It is very important to state the denominator somewhere, even if it seems obvious.
• Example: “53% experienced complications”; 53% of whom? Discharged women? All fistula clients?
b. Proportions or percentages are most useful when they are presented alongside the plain number.
• Example: How many women were considered in the denominator? If 100 women, then 53%
means 53 women, but if it is 1,000 women, that means 530 women. This is a very big difference.
Activity E. Fistula Care Indicators Presentation/Discussion/Small Group Work (40 minutes)
1. Ask the participants: Which indicators do you know of for fistula repair services? Post Flipchart 2H (Fistula repair indicators) and make a list of examples of indicators from the group’s responses.
2. Pass out Participant Handout A. Routine Performance Monitoring Indicators for Fistula Treatment Sites: Definitions of Clinical Monitoring Indicators, and explain that it is a list of the reportable indicators that the Fistula Care project is using. The handout includes a description of each indicator.
3. Explain that there are four categories of indicators.
a. Demand for fistula surgery (indicators 1–3)
b. Profile of women getting fistula repair surgery (indicators 4–5)
c. Outcome of surgery (indicators 6–9 and 11–13)
d. Bed capacity (Indicator 10)
4. Tell the participants that they are now going to work in small groups to discuss the fistula repair indicators and what they can tell us at health facility level.
a. Ask the participants to form into groups of 2–3 people.
b. Instruct them to read the list of indicators (10 minutes).
22 · MODUlE 2: USE OF ROUTINE FISTUla REpaIR DaTa aT ThE FaCIlITy lEvEl · FISTUla CaRE
Data for Decision Making in Fistula Treatment Services
c. Once they have read the list, hand out scrap paper and pens and tell them that they should work as groups for 15 minutes to:
• Select the 3–5 key fistula repair indicators that they think are most useful to them at the health facility level.
• Identify the reasons behind their selections.
d. Invite the groups to share their key indicators and the reasons for their selection (10 minutes).
5. Tell the participants that we can and should track trends and review service delivery data on a regular basis. Ask the participants why tracking indicators at the health facility level can be useful. Post Flipchart 2I and make a list of the reasons the group cited. Make sure that the participants understand that tracking indicators at the health facility level helps us to measure our progress and keep us accountable to ourselves.
6. Explain to the participants that the term “accountability” may be commonly thought of in financial terms. However, in the area of programs (services), individual patient-level and population-level data can help us be accountable for the services we are expected to provide (such as in reference to the funds given to provide a service, in reference to individual-level outcomes, or in reference to the need among the target audience).
7. Also, mention that tracking indicators gives us clearer guidance for knowing which numbers to follow, making the job of using data a little easier.
Activity F. Ways of Presenting Data Presentation (15 minutes)
1. Tell the participants that there are many different ways in which to present data, some of which they may be very familiar and comfortable with and some less so. This activity will review the basics, because we can always learn something new when looking at a topic again. Distribute Participant Handout C (Presentation of Data).
2. Explain that some of the different ways in which data can be presented include: lists, tables, and graphs (also called charts).
3. Tell the participants that lists will be covered first. Make the following points about lists:
a. Lists are one of the simplest ways to present data, but they are also the least sophisticated.
b. Lists are best if they are bulleted or numbered.
c. Ranking: One useful way to use lists is with ranking. Ranking is when the order of items in a numbered list has some sort of meaning.
• For example, if we wanted to show which type of fistula was most common, “urethrovaginal fistula (UVF) alone” would most likely appear first on the list, “UVF and RVF together” would appear second, and “rectovaginal fistula (RVF) alone” would be third, with the number of cases for each.

MODUlE 2: USE OF ROUTINE FISTUla REpaIR DaTa aT ThE FaCIlITy lEvEl · FISTUla CaRE · 23
Data for Decision Making in Fistula Treatment Services
d. However, lists are best when they are short: The utility of a list may need to be reconsidered if it has more than 10 items, as it is difficult for the human brain to process more than five pieces of information at once. (A list of 10 items is possible because it is easy to mentally break the list into two.)
4. Explain that a table is a side-by-side comparison of two or more lists. It presents data with different dimensions, whereas a list presents data with only one dimension.
a. For example, a table may show different complications among fistula repair clients across several quarters.
b. Show the participants Flipchart 2J and lead a discussion of it.
c. Explain that this means that tables can make more sophisticated comparisons than lists:
• Across time (quarters, months, years)
• By category (e.g., by type of fistula)
d. Another helpful feature with a table is that it can include totals at the bottom of rows, columns, or the whole table.
e. Reveal Flipchart 2K and lead the participants in a discussion of it.
5. Explain that another way to present data is through graphs (or charts). Make the following points about graphs:
a. These are one of the most visual ways to present data.
b. One of the biggest mistakes when we present data through graphs or charts is that we try to communicate too much information. However, we can avoid this mistake by taking note of when we need to present data in table format or perhaps create multiple graphs to show different aspects of the same data.
c. One great thing about graphs and tables is that a computer or many materials are not necessarily required to make them. However, sometimes we hesitate to make graphs by hand, because we think that a chart needs to be computer-produced for it to be worthwhile. This is not true. It may take more time to make graphs by hand, but both types of graphs can be of equal effectiveness.
d. Explain that while there are many different types of graphs, this activity will focus on a few of the most common and simplest types.
e. Explain the different types of graphs:
• Cluster bar and column graphs
∗ Results are gathered into small groups, called clusters.
∗ Bar graphs are horizontal, while column graphs are vertical.
∗ There are no real differences between them, but sometimes one is easier to read than the other.

24 · MODUlE 2: USE OF ROUTINE FISTUla REpaIR DaTa aT ThE FaCIlITy lEvEl · FISTUla CaRE
Data for Decision Making in Fistula Treatment Services
• Stacked bar/column graphs
∗ Stacked bar or column graphs show the cumulative total for a cluster. The data are the same as in a cluster graph, but all of the units within a cluster are added together so that the total can be seen for each cluster and the clusters can be compared with other clusters.
• 100% stacked bar/column graphs
∗ This type of graph converts the clusters in a regular stacked bar graph into percentages, so that all clusters are comparable with each other.
• Line graphs
∗ Line graphs are usually best for showing trends over time.
∗ The line consists of a series of points over time.
• Pie graphs
∗ Pie graphs are best for comparing part of a whole.
∗ They are good for highlighting the largest proportion.
∗ Pie graphs are not ideal for a variable with many potential values—pies become difficult to read if there are too many slices.
Activity G. Utilization of Data Small Group Work and Large Group Discussion (1 hour, 10 minutes)
Part I (30 minutes)
1. Have the training participants partner up into twos.
2. Give out Participant Handout F: Sample Fistula Repair Data Presented in Six Tables.
3. Hand out scrap paper and pens.
4. Reveal Flipchart 2L. Instruct the participants to discuss the data with their partner and write down the following points for each set of data (15 minutes):
• One or two key points that they think are important for each of the six tables
• How best to present the data so that they are understood by all audiences
• Who would be interested in knowing the different points
5. After time is up, bring the group together again for 10 minutes and:
• Ask how difficult or easy they found the exercise.
• Discuss what each group found.
• Ask whether they ever sit down and look at the numbers at their health facility in this way.
MODUlE 2: USE OF ROUTINE FISTUla REpaIR DaTa aT ThE FaCIlITy lEvEl · FISTUla CaRE · 25
Data for Decision Making in Fistula Treatment Services
Part II (20 minutes)
1. Randomly assign the participants into up to six groups, by having them count off.
2. Hand out graph paper, markers, rulers, pencils, etc.
3. Instruct the groups to create a graph to illustrate the key point for the data table corresponding to the number they were assigned.
4. Have the participants work for 20 minutes.
Part III (20 minutes)
1. Distribute Participant Handout G: Sample Fistula Repair Graphs and ask the participants to look at the graphs for 5 minutes.
2. Ask the participants to discuss the graphs as a group for 15 minutes.
3. For each set of graphs, ask the participants which graph (if any) is better, and why.
4. Use the following discussion points to guide the conversation:
• Example 1: Number of women seeking care, needing care, and receiving care, by quarter, 2008–2009
∗ The line graph works better than the column graph because it allows you to follow trends in the different categories of women across time as well as among the three categories of women. The column graph is confusing because it does not easily let you draw any conclusions.
• Example 2: Number of women receiving surgery, by type of fistula, 2007–2009
∗ Both charts effectively show trends across the three years and highlight the striking differences in number of repairs among three kinds of fistula. However, the second (stacked column) graph also gives information on the total number of fistula repairs for each year; this is not nearly as evident in the first (cluster column) graph.
• Example 3: Numbers of complications among fistula repair clients, by quarter, 2008
∗ The line graph with complications along the x-axis is best because it allows us to see most clearly trends across quarters, as well as the comparison of complications by type.
• Example 4: Numbers of complications among fistula repair clients, 2008 and 2009
∗ Either of these graphs can work to express the point that postoperative complications related to the perceived success of surgery have declined significantly (almost halved) between 2008 and 2009. However, since the trend reverses for other complications, the first cluster column graph with complications on the x-axis is better; it makes that relationship less visually confusing, since your eye does not have to go from one cluster to another, as it does to make the same comparison in the second graph.
• Example 5: Surgery repair order among women getting surgery, by quarter, 2009
∗ Both graphs show trends across quarters and highlight the striking difference in number of repairs. However, the line graph makes a more compelling statement on both points because there is less visual noise.

26 · MODUlE 2: USE OF ROUTINE FISTUla REpaIR DaTa aT ThE FaCIlITy lEvEl · FISTUla CaRE
Data for Decision Making in Fistula Treatment Services
• Example 6: Number of women getting surgery, by fistula repair status at discharge, 2008
∗ Both the cluster column graph and the 100% stacked bar graph show the trend in outcomes for fistula repair surgery as well as how the two categories of type of fistula compare with each other. The difference between them is that the cluster column graph, which uses absolute numbers, highlights how many more repairs were done on only UVF/both UVF and RVF compared with only RVF. The 100% stacked bar graph, on the hand, uses only percentages and allows for much closer side-by-side comparison of repair surgery outcomes between only RFV and only UVF/both UVF and RVF.
Activity H. Wrap-Up/End-of-Day Evaluation (20 minutes)
Ask the participants for feedback about the sessions. Distribute an evaluation form to each participant, or ask for feedback and write the participants’ responses on a piece of flipchart paper.
Sample questions for the group include the following:
• What one thing did you learn today that you do not want to forget?
• What information or activity did you find most interesting and useful today?
• What would you recommend for improving the session?
MODUlE 3: NaTIONal-lEvEl USE OF DaTa · FISTUla CaRE · 27
Data for Decision Making in Fistula Treatment Services
MODULE 3
National-Level Use of Data for Decision Making for Fistula Repair Programming
ObjectivesBy the end of this session, the participants will be able to:
• Understand how to assure the quality of data for activities related to the treatment of fistula.
• Practice using data to communicate/advocate for the fistula program.
Materials• Participant Handout A. Routine Performance Monitoring Indicators for Fistula Treatment Sites:
Definitions of Clinical Monitoring Indicators (Activity B)
• Participant Handout D. Key Steps in Audience Analysis (Activity D)
• Participant Handout H. Sample Data for Fistula Repair Services Indicators (Activity D)
• Participant Handout I. Case Study (Activity D)
• Small Group Exercise C Instructions: Communication of Data (Activity D)
• Flipchart paper
• Graph paper, blank paper, pens, and markers
Advance Preparation1. Make enough copies of the Participant Handouts.
2. Prepare flipcharts 3A, 3B, 3C and 3D (see Appendix 1, Flipchart Guides).
28 · MODUlE 3: NaTIONal-lEvEl USE OF DaTa · FISTUla CaRE
Data for Decision Making in Fistula Treatment Services
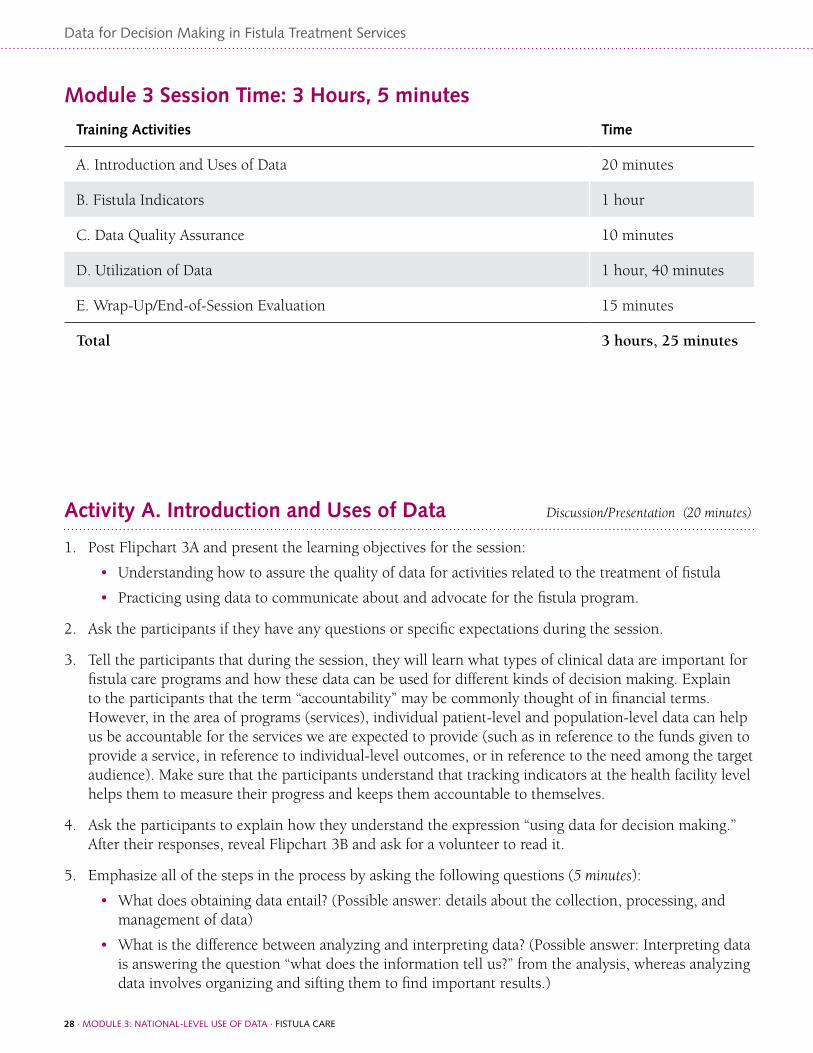
Module 3 Session Time: 3 Hours, 5 minutes
Training Activities Time
A. Introduction and Uses of Data 20 minutes
B. Fistula Indicators 1 hour
C. Data Quality Assurance 10 minutes
D. Utilization of Data 1 hour, 40 minutes
E. Wrap-Up/End-of-Session Evaluation 15 minutes
Total 3 hours, 25 minutes
Activity A. Introduction and Uses of Data Discussion/Presentation (20 minutes)
1. Post Flipchart 3A and present the learning objectives for the session:
• Understanding how to assure the quality of data for activities related to the treatment of fistula
• Practicing using data to communicate about and advocate for the fistula program.
2. Ask the participants if they have any questions or specific expectations during the session.
3. Tell the participants that during the session, they will learn what types of clinical data are important for fistula care programs and how these data can be used for different kinds of decision making. Explain to the participants that the term “accountability” may be commonly thought of in financial terms. However, in the area of programs (services), individual patient-level and population-level data can help us be accountable for the services we are expected to provide (such as in reference to the funds given to provide a service, in reference to individual-level outcomes, or in reference to the need among the target audience). Make sure that the participants understand that tracking indicators at the health facility level helps them to measure their progress and keeps them accountable to themselves.
4. Ask the participants to explain how they understand the expression “using data for decision making.” After their responses, reveal Flipchart 3B and ask for a volunteer to read it.
5. Emphasize all of the steps in the process by asking the following questions (5 minutes):
• What does obtaining data entail? (Possible answer: details about the collection, processing, and management of data)
• What is the difference between analyzing and interpreting data? (Possible answer: Interpreting data is answering the question “what does the information tell us?” from the analysis, whereas analyzing data involves organizing and sifting them to find important results.)

MODUlE 3: NaTIONal-lEvEl USE OF DaTa · FISTUla CaRE · 29
Data for Decision Making in Fistula Treatment Services
• Why might it be important to highlight both “making decisions” and “taking action”? (Possible answer: Taking action is acting upon decisions made; no other part of the data for decision-making process matters if no actions are taken as a result.)
6. Ask the participants to separate into four or more small groups and share their experiences with making decisions with data in their work at the national level. Allow 10 minutes for them to share these experiences. Probe with the following questions (or write the following questions on a piece of flipchart paper and post it for the groups to see):
• Who makes the decisions?
• Which decisions do you make with data related to fistula projects?
• Who benefits from these decisions?
Activity B. Fistula Indicators Small Group Work/Presentation (1 hour)
1. Tell the participants that they are going to review 13 core indicators that EngenderHealth uses in the Fistula Care project. Emphasize that the Fistula Care indicators are focused uniquely on service delivery data, but that it is important to keep in mind that other kinds of data can help in making decisions related to fistula programming. Ask the participants what kind of information they think is important for a fistula program beyond service delivery indicators. (Possible answers: sexual and reproductive health service statistics, population-based surveys such as the Demographic and Health Surveys, census data, client interviews, focus group discussions, and key informant interviews) Tell the participants that while they review the core service delivery indicators, it is important for them to keep in mind that these are just one of many types of data available.
2. Ask the participants: Which indicators do you know of for fistula repair services? Provide each small group with bank flipchart paper and encourage them to write a list of examples of indicators from the group on a flipchart.
3. Give the participants Participant Handout A. Routine Performance Monitoring Indicators for Fistula Treatment Sites and explain that it is a list of the reportable global obstetric fistula repair indicators used by the Fistula Care project, with a description for each.
4. Tell the participants that they are now going to work in small groups to discuss the fistula repair indicators and what they can tell us at national level.
5. Organize the participants into groups of 2–3 people.
6. Instruct them to read the list of indicators (10 minutes).
7. Once they have read the list, hand out three sheets of flipchart paper and markers to each group and tell them to work as a group for 20 minutes to:

30 · MODUlE 3: NaTIONal-lEvEl USE OF DaTa · FISTUla CaRE
Data for Decision Making in Fistula Treatment Services
• Select the 3–5 key fistula repair indicators that they think are the most useful to them at the national level.
• Identify an additional 5–10 indicators for fistula prevention programming at the national level.
• Identify 2–3 additional indicators for the impact of fistula programming at the national level. (Impact indictors usually refer to the ultimate goal of a set of activities. Impact indicators are generally longer term goals, measured at the population level—e.g., population-level morbidity and mortality rates.)
8. Spend 10 minutes having the groups share their key indicators and reasons for selection.
9. Help the participants synthesize the results of the group work and develop a priority list of recommended indicators for repair, prevention, and impact (10 minutes). Emphasize that this is not a final list, but that it is an important exercise to select priority indicators.
Activity C. Data Quality Assurance Presentation/Discussion (10 minutes)
1. Ask the participants for examples of what good-quality data look like. After their responses, reveal Flipchart 3C and tell them that when we talk about data, it is common to break the concept down into what are called the “dimensions of data quality.”
2. Tell the participants that it is an issue not only of whether they use data to make decisions, but also of whether they use good-quality data for those decisions. Explain that sometimes making decisions from bad data can be even worse than making decisions without data. Ask the participants what they think are some of the reasons that it would be important to have good-quality data.
3. Ask for a volunteer to read the flipchart, pausing after each dimension is read out loud. As the volunteer is reading out the list for the dimensions of data, explain the consequences of having poor data. Explain that:
a. Inaccurate data (also called invalid data) could involve recording as fistula cases those that are not clinically fistula or recording complications that are unrelated to the surgery as complications related to the surgery.
b. Unreliable data might be data that are not recorded in the same way every time. Perhaps one health care worker is not recording data correctly, even though all of the other health care workers are doing so. However, because of that one health care worker, the whole dataset is no longer reliable.
c. Incomplete data may result from not recording every case or complication as required. Sometimes health care workers may get busy and forget to record data, or they may forget to include women who are already at the health facility at the start of the time period.
d. Imprecise data might involve, for example, providing only a total for an indicator that is supposed to be broken down into subcategories (e.g., outcome of surgery).

MODUlE 3: NaTIONal-lEvEl USE OF DaTa · FISTUla CaRE · 31
Data for Decision Making in Fistula Treatment Services
e. Untimely data can happen when data are not available for a medical monitoring visit or for when the government or EngenderHealth needs to report the data. Timeliness of data is an important aspect of data for decision making, since the data have to be available for the decisions to be made when they need to be made.
f. Data must have integrity and must be protected from manipulation or deliberate bias.
Activity D. Utilization of Data Presentation/Discussion/Small Group Work (1 hour, 40 minutes)
1. Ask the participants what situations they can think of when they or others may or should use fistula data at the national level. Probe by asking about the kinds of decisions or actions that need to be made with such data, who the recipients of those decisions/actions are, and who makes those decisions or takes those actions (e.g., EngenderHealth, other nongovernmental organizations, donors, international groups, etc.). Ask someone in the group to write the answers down on a piece of flipchart paper, and encourage discussion and creativity.
2. Tell the participants that now that we have identified many different situations in which to use data, we need to take it one step further and be systematic in our analysis of those data. There are three key steps to follow: audience analysis, message identification, and message delivery.
3. For audience analysis, one needs to first identify the audience(s), analyze their needs, determine how best to communicate with them, anticipate their questions or concerns, and relate specific actions or decisions that they need to take. Distribute Handout D. Key Steps in Audience Analysis. Emphasize that it is important to:
• Identify the needs of their audience(s) rather than what they themselves know or want to impress them with.
• Consider their audience’s level of technical knowledge, as well as their interests and motivations.
• Anticipate their questions and concerns, so that they can be prepared with answers.
• Determine solutions in the form of specific actions and/or decisions for any problems that they present to their audience
4. For messages, it is very important to prioritize information to share with audiences. Therefore, it is recommended to choose 3–5 points only.
5. Ask the participants:
• Why do you think that it is important to focus on 3–5 points of information? (Possible answers: to keep people’s attention; 3–5 pieces of information are what most of us can keep in mind at any one time; you do not want to overwhelm your audience; it’s about going through the process of interpreting the data and not stopping at simply analyzing it; etc.)
• Why is it important to avoid presenting only negative information? (Possible answers: It can create a sense of helplessness or demotivate the audience; it does not present information to suggest that change can actually happen; etc.)

32 · MODUlE 3: NaTIONal-lEvEl USE OF DaTa · FISTUla CaRE
Data for Decision Making in Fistula Treatment Services
• Why do you think that it might be important to think about your conclusions or the action you want your audience to take when selecting the information that you will present to them? (Possible answers: It can help keep them focused and motivated on making decisions and taking action; it lessens the burden on them to weed out the important information, thereby increasing the likelihood of keeping them focused and motivated to make decisions and take action; it appeals to their sense of logic; etc.)
6. Tell the participants that they need to think about the different ways of presenting their key points. Generally, we can think about three format types: numerical formats (percentages, tables, totals), visual formats (charts—which can be drawn by hand), and narrative formats (two-page information sheets, stories, reports, etc.). Ideally, it is good to use a combination, but that is not always possible.
7. Tell the participants that further use of the same data will help them analyze and discuss the use of data at the national level.
Two exercises (A and B) have been developed; the facilitator can decide which exercise to use. If the group is large, both exercises could be used by different small groups.
For Exercise A:
1. Distribute Participant Handout H. Sample Data for Fistula Repair Services Indicators. Divide the participants into three groups and provide each group with instructions on how they should proceed using the data provided from two sample sites that provide fistula repair. Post Flipchart 3D with the instructions; distribute Small Group Exercise C Instructions: Communication of Data.
2. Explain that each group will have 50 minutes to:
• Analyze their audience.
• Identify 3–5 key points.
• Prepare a small presentation of a plan to communicate the three key points to their respective audiences.
3. Explain that each group will have 5 minutes to present their three points to the rest of the group as their “audience” and receive feedback (30 minutes total).
Note: Emphasize that being brief is an essential skill when presenting data.
For Exercise B:
1. Distribute Participant Handout I. Case Study and instruct the participants to follow the instructions in the handout.
TRAINER’S TIP

MODUlE 3: NaTIONal-lEvEl USE OF DaTa · FISTUla CaRE · 33
Data for Decision Making in Fistula Treatment Services
Activity E. Wrap-Up/End-of-Day Evaluation (15 minutes)
Ask the participants for feedback about the sessions. Distribute an evaluation form to each participant, or ask for feedback and write the participants’ responses on a piece of flipchart paper.
Example questions for the group:
• What one thing did you learn today that you do not want to forget?
• What information or activity did you find most interesting and useful today?
• What would you recommend for improving the session?

Data for Decision Making in Fistula Treatment Services

Data for Decision Making in Fistula Treatment Services
appENDIx 1: FlIpChaRT gUIDES · FISTUla CaRE · 35
Appendix 1: Flipchart Guides
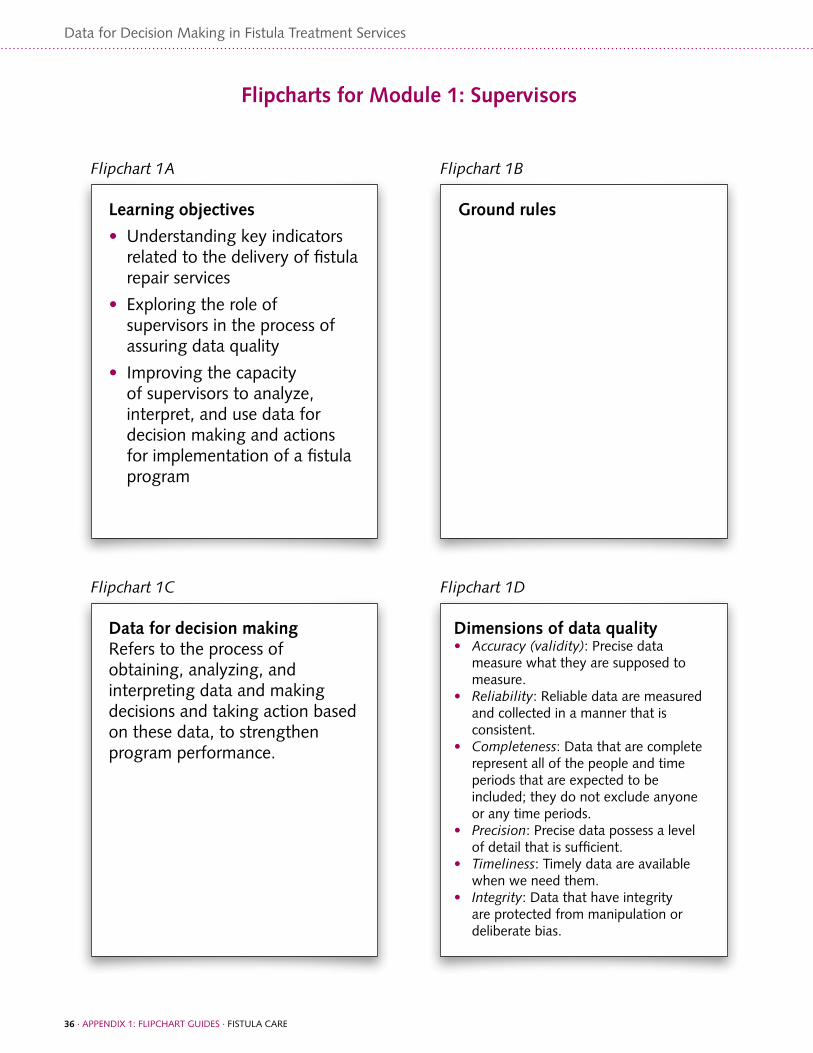
Data for Decision Making in Fistula Treatment Services
36 · appENDIx 1: FlIpChaRT gUIDES · FISTUla CaRE
Flipcharts for Module 1: Supervisors
Learning objectives
• Understanding key indicators related to the delivery of fistula repair services
• Exploring the role of supervisors in the process of assuring data quality
• Improving the capacity of supervisors to analyze, interpret, and use data for decision making and actions for implementation of a fistula program
Data for decision makingRefers to the process of obtaining, analyzing, and interpreting data and making decisions and taking action based on these data, to strengthen program performance.
Dimensions of data quality• Accuracy(validity): precise data
measure what they are supposed to measure.
• Reliability: Reliable data are measured and collected in a manner that is consistent.
• Completeness: Data that are complete represent all of the people and time periods that are expected to be included; they do not exclude anyone or any time periods.
• Precision: precise data possess a level of detail that is sufficient.
• Timeliness: Timely data are available when we need them.
• Integrity: Data that have integrity are protected from manipulation or deliberate bias.
Ground rules
Flipchart1A
Flipchart1C Flipchart1D
Flipchart1B

Data for Decision Making in Fistula Treatment Services
appENDIx 1: FlIpChaRT gUIDES · FISTUla CaRE · 37
Assessing data quality: small group exercise• Examine the data in participant
handout B. • What data quality issues can you find?
list at least three. • are the data in the report complete? • Where are there gaps in the data? • Do all of the numbers look accurate?• how can you be sure that the data are
being transferred accurately from the registers to the report?
• What can you do to check that the data are being recorded correctly?
• as a supervisor, what can you do if you find inaccurate or unreliable data?
When to use data for decision making
• During medical monitoring: to detect issues related to quality of services and to determine the nature or cause of a problem
• During facilitative supervision: to motivate and encourage staff
• During routine quality improvement monitoring
• When advocating for capacity building and other support
Number of fistula repairs, by type, quarters 1 and 2
Quarter1
Quarter2
Urinary fistula alone
143 156
Urinary fistula and RvF together
9 7
RvF alone 3 1
Number of fistula repairs, by type, quarters 1 and 2
Quarter1
Quarter2
Total
Urinary fistula alone
143 156 299
Urinary fistula and RvF together
9 7 16
RvF alone
3 1 4
Total 155 164 319
Flipchart1E
Flipchart1H
Flipchart1F
Flipchart1G
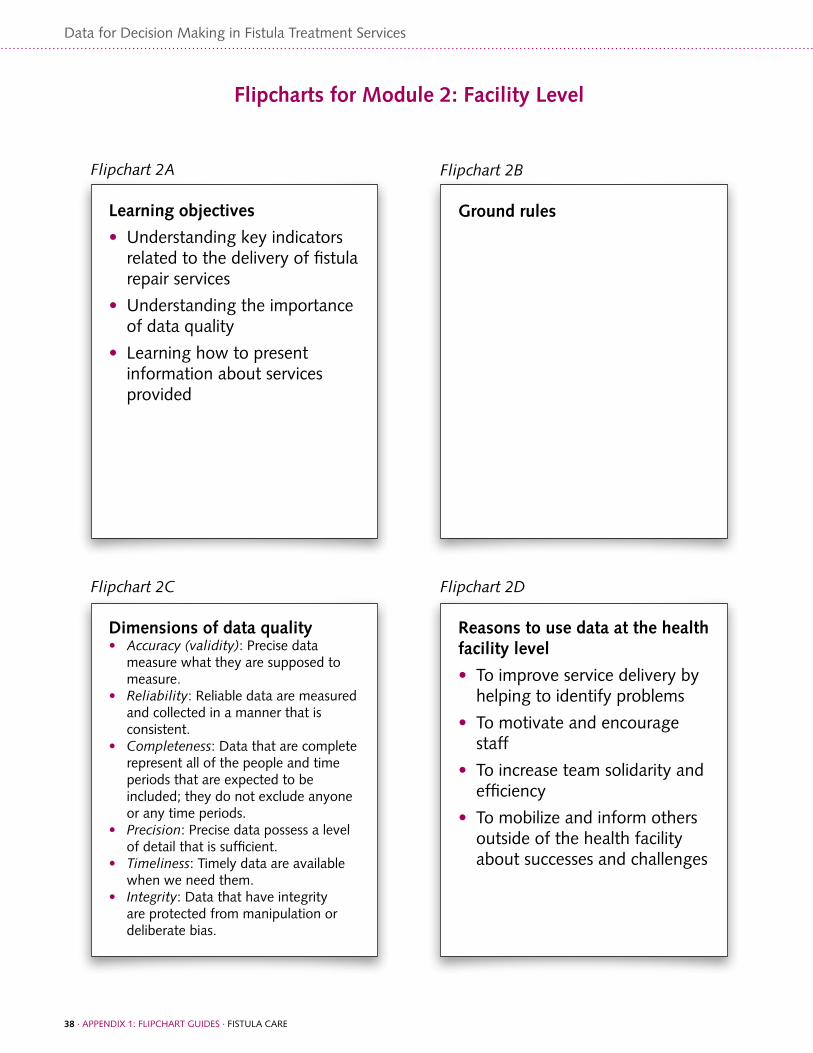
Data for Decision Making in Fistula Treatment Services
38 · appENDIx 1: FlIpChaRT gUIDES · FISTUla CaRE
Flipcharts for Module 2: Facility Level
Learning objectives
• Understanding key indicators related to the delivery of fistula repair services
• Understanding the importance of data quality
• learning how to present information about services provided
Reasons to use data at the health facility level
• To improve service delivery by helping to identify problems
• To motivate and encourage staff
• To increase team solidarity and efficiency
• To mobilize and inform others outside of the health facility about successes and challenges
Ground rules
Flipchart2A
Flipchart2D
Flipchart2B
Dimensions of data quality• Accuracy(validity): precise data
measure what they are supposed to measure.
• Reliability: Reliable data are measured and collected in a manner that is consistent.
• Completeness: Data that are complete represent all of the people and time periods that are expected to be included; they do not exclude anyone or any time periods.
• Precision: precise data possess a level of detail that is sufficient.
• Timeliness: Timely data are available when we need them.
• Integrity: Data that have integrity are protected from manipulation or deliberate bias.
Flipchart2C

Data for Decision Making in Fistula Treatment Services
appENDIx 1: FlIpChaRT gUIDES · FISTUla CaRE · 39
Indicators are like clues, signs, or markers that inform us whether the program is achieving its results or objectives.
Plain numbers and fractions
• Plainnumbers are created by simple addition and subtraction.
• Ratios compare the frequency of some event or occurrence to the frequency of some other events or occurrences.
• Rates represent the frequency with which events occur during a certain time period among the population at risk during that time period.
• Percentages (or proportions) compare parts of something to the whole.
Flipchart2E
Flipchart2H
Flipchart2F
Flipchart2G
Indicator definitionsInputs: human and financial resources, physical facilities, equipment, and operational policies that are required for program implementation
Process: activities that are carried out to achieve program objectives
Output: results of program efforts (Examples of outputs are number of persons trained, or number of services provided—e.g., number of fistula repair surgeries, number of family planning acceptors, etc.)
Outcome: usually refers to results of program efforts at the population level, but can also be measured at the program level (For example, outcome of training in fistula repair surgery would be number of surgeons who are competent to perform simple, medium complex, and complex surgery.)
Impact: usually a long-term outcome of program efforts, measured at the population level (For example, improvements in maternal health services may lead to a reduction in maternal morbidity and mortality.)
Fistula repair indicators

Data for Decision Making in Fistula Treatment Services
40 · appENDIx 1: FlIpChaRT gUIDES · FISTUla CaRE
Utilization of dataUsing handout F: Sample Data (6 Tables):
• Write down 1–2 key points for each table.
• Decide how best to present the data so that it is understood by by all audiences .
• Identify persons who would be interested in this information.
Flipchart2L
Number of fistula repairs, by type, quarters 1 and 2
Quarter1
Quarter2
Urinary fistula alone
143 156
Urinary fistula and RvF together
9 7
RvF alone 3 1
Number of fistula repairs, by type, quarters 1 and 2
Quarter1
Quarter2
Total
Urinary fistula alone
143 156 299
Urinary fistula and RvF together
9 7 16
RvF alone
3 1 4
Total 155 164 319
Flipchart2J
Flipchart2K
Reasons why tracking fistula repair indicators at the health facility level can be useful:
Flipchart2I

Data for Decision Making in Fistula Treatment Services
appENDIx 1: FlIpChaRT gUIDES · FISTUla CaRE · 41
Flipcharts for Module 3: National Level
Learning objectives
• Understanding how to assure the quality of data for activities related to the treatment of fistula.
• practicing using data to communicate and advocate for the fistula program.
• group 1: Develop a plan to advocate to authorities for technical assistance.
• group 2: Develop a plan to use data for advocacy to an international partner for support for equipment.
• group 3: Use data for advocacy to donors for an extension of a project.
Data for decision making Refers to the process of obtaining, analyzing, interpreting, making decisions about, and taking action on data to strengthen program performance.
Flipchart3A
Flipchart3D
Flipchart3B
Dimensions of data quality• Accuracy(validity): precise data
measure what they are supposed to measure.
• Reliability: Reliable data are measured and collected in a manner that is consistent.
• Completeness: Data that are complete represent all of the people and time periods that are expected to be included; they do not exclude anyone or any time periods.
• Precision: precise data possess a level of detail that is sufficient.
• Timeliness: Timely data are available when we need them.
• Integrity: Data that have integrity are protected from manipulation or deliberate bias.
Flipchart3C

Data for Decision Making in Fistula Treatment Services

appENDIx 2: paRTICIpaNT haNDOUTS · FISTUla CaRE · 43
Data for Decision Making in Fistula Treatment Services
Appendix 2: Participant Handouts

44 · appENDIx 2: paRTICIpaNT haNDOUTS · FISTUla CaRE
Data for Decision Making in Fistula Treatment Services
Participant Handout A. Routine Performance Monitoring Indicators for Fistula Treatment Sites: Definitions of Clinical Monitoring Indicators
Indicator ClinicalIndicators,Form1A Definition Data Sources
1. Number of women arriving and seeking fistula repair
Clients may present to a variety of locations for fistula services (e.g., hospitals, satellite centers, health centers, waiting shelters, and staff person’s homes) depending on the country program. Not all women coming to the site seeking care will actually have a fistula, but this indicator tells how may are seeking services for what they perceive to be a fistula.
Number of women arriving at health facility seeking care and treatment for urinary and/or rectal incontinence.
For clients presenting to the health facility for repair, this information may be available from a client register. Data may be more difficult to collect in other cases; collect through project reports, if possible.
2. Number of women requiring fistula surgery
Women requiring fistula services are those who have arrived seeking fistula care, have been screened, and have been found to have a urinary-related fistula and/or a rectovaginal fistula. Urinary fistula include: vesicovaginal, urethrovaginal, ureterovaginal, and vesicouterine fistula.
Client register or client record
3. Number of women receiving fistula repair services
This is the total number of women receiving fistula repair surgery during the quarter at supported sites. This number should include the data from 4.1, 4.2, and 4.3 below.
Client register or client record
4. Type of fistula repair surgery
Specify the number of women who had surgery for 4.1: a urinary fistula only; 4.2: a urinary fistula and an RVF together; 4.3: an RVF only.
Client register or client record
5. For repairs of Urinary fistula only and Urinary fistula and RVF combined, sum indicators 4.1 and 4.2 and report on the number of previous repairs.
Among women who had a urinary fistula repair (urinary alone or urinary/RVF together), please report whether this was the first repair (5.1), if this was a second repair surgery (5.2), or if the woman had had two or more previous repair surgeries (5.3). NOTE: DO NOT report on RVF-only repairs.
Client register or client record
6. Number of women discharged who had Urinary-only fistula repair
Record the number of women who had a urinary-only fistula repair who were discharged in the quarter.
Client register or client record

appENDIx 2: paRTICIpaNT haNDOUTS · FISTUla CaRE · 45
Data for Decision Making in Fistula Treatment Services
Indicator ClinicalIndicators,Form1A Definition Data Sources
7. Number of women discharged who had combined urinary-RVF repair
Record the number of women who had a combined urinary-RVF repair who were discharged in the quarter.
Client register or client record
8. Number of women discharged who had RVF-only repair
Record the number of women who had an RVF-only repair who were discharged in the quarter.
Client register or client record
9. Total number of all fistula repair patients discharged in the quarter
Total number of women discharged after receiving surgery for fistula repair at supported sites (sum of indicators 6, 7, and 8).
Client register or client record
10. Number of women not discharged this quarter
Total number of women who have received any type of fistula repair surgery but have not yet been discharged (remaining in postoperative care). This may include women who received surgery in the current quarter or in a previous quarter.
Client register or client record
11. Outcome of urinary only or urinary and RVF repairs discharged this quarter (sum of indicators 6 and 7)
Record the outcome of surgery at the time of discharge for women who had a urinary only or urinary and RVF repair: 11.1: Number who had a closed fistula and were dry at time of discharge 11.2: Number with a closed fistula and who had remaining urinary incontinence at time of discharge11.3: Number whose fistula was not closed at discharge
Client register or client record
12. Outcome of RVF only repairs discharged this quarter (indicator 8)
Record the outcome of surgery at time of discharge for women with only RVF surgery: 12.1: Closed and dry 12.2: Not closed; incontinent with watery stool and/or flatus (gas)12.3: Not closed; incontinent with firm stool
Client register or client record
13. Total number of women discharged this quarter who experienced complications
Record the total number of women who had any type of fistula repair surgery—urinary only; urinary and RVF; or RVF only—who experienced any type of complication. Provide a breakdown of the type of complications experienced. Some women may experience more than one complication. See Complications Reporting Guidelines for more information about the type of complications to report:. 13.1: Major surgical complication 13.2: Minor complication related to anesthesia 13.3: Minor complication related to perceived success of the surgery
Client register or client record
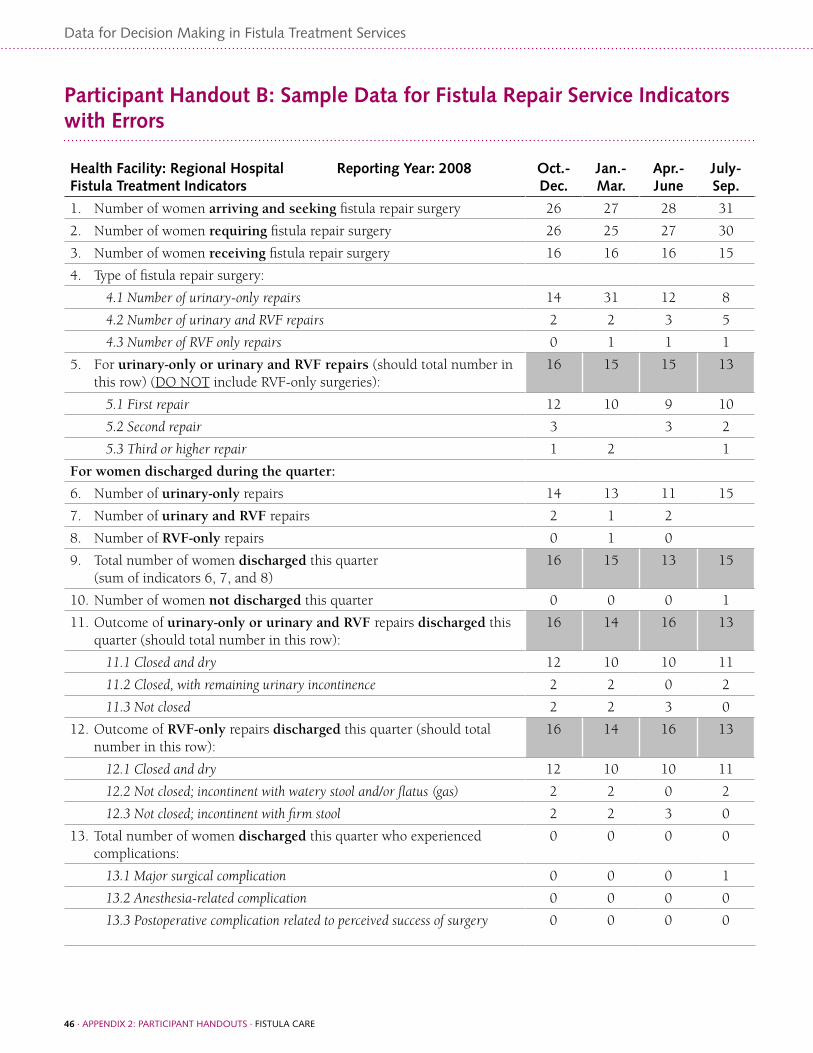
46 · appENDIx 2: paRTICIpaNT haNDOUTS · FISTUla CaRE
Data for Decision Making in Fistula Treatment Services
Participant Handout B: Sample Data for Fistula Repair Service Indicators with Errors
Health Facility: Regional Hospital Reporting Year: 2008 Fistula Treatment Indicators
Oct.-Dec.
Jan.-Mar.
Apr.- June
July- Sep.
1. Number of women arriving and seeking fistula repair surgery 26 27 28 31
2. Number of women requiring fistula repair surgery 26 25 27 30
3. Number of women receiving fistula repair surgery 16 16 16 15
4. Type of fistula repair surgery:
4.1 Number of urinary-only repairs 14 31 12 8
4.2 Number of urinary and RVF repairs 2 2 3 5
4.3 Number of RVF only repairs 0 1 1 1
5. For urinary-only or urinary and RVF repairs (should total number in this row) (DO NOT include RVF-only surgeries):
16 15 15 13
5.1 First repair 12 10 9 10
5.2 Second repair 3 3 2
5.3 Third or higher repair 1 2 1
For women discharged during the quarter:
6. Number of urinary-only repairs 14 13 11 15
7. Number of urinary and RVF repairs 2 1 2
8. Number of RVF-only repairs 0 1 0
9. Total number of women discharged this quarter(sum of indicators 6, 7, and 8)
16 15 13 15
10. Number of women not discharged this quarter 0 0 0 1
11. Outcome of urinary-only or urinary and RVF repairs discharged this quarter (should total number in this row):
16 14 16 13
11.1 Closed and dry 12 10 10 11
11.2 Closed, with remaining urinary incontinence 2 2 0 2
11.3 Not closed 2 2 3 0
12. Outcome of RVF-only repairs discharged this quarter (should total number in this row):
16 14 16 13
12.1 Closed and dry 12 10 10 11
12.2 Not closed; incontinent with watery stool and/or flatus (gas) 2 2 0 2
12.3 Not closed; incontinent with firm stool 2 2 3 0
13. Total number of women discharged this quarter who experienced complications:
0 0 0 0
13.1 Major surgical complication 0 0 0 1
13.2 Anesthesia-related complication 0 0 0 0
13.3 Postoperative complication related to perceived success of surgery 0 0 0 0

appENDIx 2: paRTICIpaNT haNDOUTS · FISTUla CaRE · 47
Data for Decision Making in Fistula Treatment Services
Facilitator’s Guide for Participant Handout B.1
Health Facility: Regional Hospital Reporting Year: 2008 Fistula Treatment Indicators
Oct.-Dec.
Jan.-Mar.
Apr.- June
July- Sep.
1. Number of women arriving and seeking fistula repair surgery 26 27 28 31
2. Number of women requiring fistula repair surgery 26 25 27 30
3. Number of women receiving fistula repair surgery 16 16 16 15
4. Type of fistula repair surgery:
4.1 Number of urinary-only repairs 14 31 12 8
4.2 Number of urinary and RVF repairs 2 2 3 5
4.3 Number of RVF only repairs 0 1 1 1
5. For Urinary-only or urinary and RVF repairs (should total number in this row) (DO NOT include RVF-only surgeries):
16 15 15 13
5.1 First repair 12 10 9 10
5.2 Second repair 3 3 2
5.3 Third or higher repair 1 2 1
For women discharged during the quarter:
6. Number of urinary-only repairs 14 13 11 15
7. Number of urinary and RVF repairs 2 1 2
8. Number of RVF-only repairs 0 1 0
9. Total number of women discharged this quarter(sum of indicators 6, 7, and 8)
16 15 13 15
10. Number of women not discharged this quarter 0 0 0 1
11. Outcome of urinary-only or Urinary and RVF repairs discharged this quarter (should total number in this row):
16 14 16 13
11.1 Closed and dry 12 10 10 11
11.2 Closed, with remaining urinary incontinence 2 2 0 2
11.3 Not closed 2 2 3 0
12. Outcome of RVF-only repairs discharged this quarter (should total number in this row):
16 14 16 13
12.1 Closed and dry 12 10 10 11
12.2 Not closed; incontinent with watery stool and/or flatus (gas) 2 2 0 2
12.3 Not closed; incontinent with firm stool 2 2 3 0
13. Total number of women discharged this quarter who experienced complications:
0 0 0 0
13.1 Major surgical complication 0 0 0 1
13.2 Anesthesia-related complication 0 0 0 0
13.3 Postoperative complication related to perceived success of surgery 0 0 0 0
Jan.-Mar.shouldhave1person;Apr.-Juneshouldbe3.ForJuly-Sept.1couldbecorrectifapatientwhohadsurgeryinapreviousquarterisstillinthehospital.Oritcouldbe0,asallwomenweredischargedwhoreceivedsurgeryinthequarter.
July-Sept.datasumto14insteadof15(#3).Missingonecase.Jan.-Mar.datatransposed,shouldread13.
July–Sept.dataareincorrect.15repairswereperformed,ofwhichonly8wereurinaryrepairs,soitwouldbehighlyunlikelythat15urinary-onlyrepairsweredischarged.
Alldataareincorrect.Datawereperhapscopiedfromurinaryfistulasurgery?
July-Sept.quartershouldlist1fornumberwithcomplications(Thespecificsoftypeofcomplicationarelistedin13.1.)
Apr.-Juneshouldbe13,not16.
Noerrors.Sumof5.1to5.3equalssumof4.1and4.2.
Missing
Apr.-Junedatasumto12insteadof15.5.3should=3.
Jan.-Mar.datasumto12insteadof15.5.2should=3.

48 · appENDIx 2: paRTICIpaNT haNDOUTS · FISTUla CaRE
Data for Decision Making in Fistula Treatment Services
Participant Handout C. Presentation of Data
There are several ways to present data.
1. Lists
• Lists are the simplest way to present data, but they are also the most limited.
• Lists are best if they are numbered or bulleted.
• Ranking—ordering items based on some criteria—is a useful technique in lists.
• Lists are best when they are short. If they have more than five items, try to find some additional way to group them.
2. Tables
• Tables are side-by-side comparisons of two or more lists.
• Tables present different sides of data, whereas a list only shows one side.
• Tables can make comparisons across time and by category.
• Tables can have totals for columns (vertical), rows (horizontal), and the whole table.
Fistula repair clients for quarter 1:
• 143 urinary fistula alone repairs
• 9 urinary fistula alone or urinary fistula and RVF repairs
• 3 RVF-alone repairs
Quarter 1 Quarter 2
Urinary fistula alone 143 156
Urinary fistula and RvF together 9 7
RvF alone 3 1
Quarter 1 Quarter 2 Total
Urinary fistula alone 143 156 199
Urinary fistula and RvF together 9 7 16
RvF alone 3 1 4
Total 155 164 319
LIST EXAMPLE
TABLE EXAMPLE A
TABLE EXAMPLE B

appENDIx 2: paRTICIpaNT haNDOUTS · FISTUla CaRE · 49
Data for Decision Making in Fistula Treatment Services
3. Graphs
• Graphs are the most visual way to present data.
• To be effective, graphs should be limited to making only one or two major points.
• Graphs can easily be made by hand with available supplies.
• The most common types of graphs are:
∗ Bar and column graphs
∗ Stacked (and 100% stacked) bar and column graphs
∗ Line graphs
∗ Pie graphs
• Results are gathered into small groups, called clusters.
• Bar graphs are horizontal, while column graphs are vertical.
• There are no real differences between them, but sometimes one is easier to read than the other.
• Bar graphs are good for comparing two or more things across time.
BAR AND COLUMN GRAPHS
0
100
200
300
400
500
600
700
800
Getting surgery
Needing care
Seeking care
TotalQ4Q3Q2Q1
Number of Women Seeking Care, Needing Repair, and Getting Surgery: Country X
0 200 400 600 800
Seeking care
Needing care
Getting surgery
Q1
Q2
Q3
Q4
Total
Number of Women Seeking Care, Needing Repair, and Getting Surgery: Country X

50 · appENDIx 2: paRTICIpaNT haNDOUTS · FISTUla CaRE
Data for Decision Making in Fistula Treatment Services
• Stacked bar graphs and stacked column graphs show the cumulative total for a cluster of data.
• All units within a cluster appear on the same bar or column.
• The reader can easily see the total for each cluster and can compare totals across clusters.
• These graphs display percentages.
• Each bar or column equals 100%.
• These graphs make it easy to compare percentages across the different bars and columns.
STACKED BAR GRAPHS AND STACKED COLUMN GRAPHS
100% STACKED BAR GRAPHS AND 100% STACKED COLUMN GRAPHS
Discharge Status (#) among Urinary and Urinary-RVF Fistula Repairs, Annual Figures by Site: Country X
Discharge Status (#) among Urinary and Urinary-RVF Fistula Repairs, Annual Figures by Site: Country X
Discharge Status (#) among Urinary and Urinary-RVF Fistula Repairs, Annual
Figures by Site: Country X
0
25
50
75
100
125
150
Not closed
Closed w/remainingincontinence
Closed and dry
Site DSite CSite BSite A
Not closedClosed w/remaining incontinenceClosed and dry
Site DSite CSite BSite A0
25
50
75
100
Discharge Status (#) among Urinary and Urinary-RVF Fistula Repairs, Annual
Figures by Site: Country X
0 25 50 75 100 125 150
Notclosed
Closed w/remainingincontinence
Closedand dry
Site A
Site B
Site C
Site D
0 25 50 75 100
Not closed
Closed w/remainingincontinence
Closed and dry
Site D
Site C
Site B
Site A

appENDIx 2: paRTICIpaNT haNDOUTS · FISTUla CaRE · 51
Data for Decision Making in Fistula Treatment Services
• Line graphs are usually best for showing trends over time.
• The line consists of a series of points over time.
• Best for comparing part of a whole.
• Good for pointing out the majority value.
• Not ideal for a variable with many potential values—pies become difficult to read if there are too many slices.
LINE GRAPHS
PIE GRAPHS
Total # Repairs by Site and Reporting Period: Country X
Discharge Status # Among Urinary Fistula Repairs, Annual Figures, All Sites: Country X (n=237)
0
30
60
90
120
150
Site A
Site B
Site C
Total
Q4Q3Q2Q1
Closed and dry
Closed w/remaining incontinence
Not closed
168
39
30

52 · appENDIx 2: paRTICIpaNT haNDOUTS · FISTUla CaRE
Data for Decision Making in Fistula Treatment Services
Participant Handout D. Key Steps in Audience Analysis
Step 1. Analyze your audience
• Identify what they need rather than what you know and want to impress them with.
• Consider their level of technical knowledge, as well as their interests and motivations.
• Anticipate their questions, so that you can be prepared with answers.
• Determine solutions for any problems that you present them.
• Are there any other considerations for analyzing your audience?
Step 2: Identify three important points with the following considerations:
• Avoid presenting only negative information; try to present both positive and negative points.
• Decide first what action or conclusion you want your audience to draw and select your three points accordingly; try to avoid using nonessential information as your three points.
• Use data that are relevant and understandable to your audience; avoid jargon, technical indicators, or complicated statistical analyses that your audience may not understand.
• Take advantage of different formats for elaborating your three points, if possible, including numerical presentation, visual formats such as charts, and narrative formats.
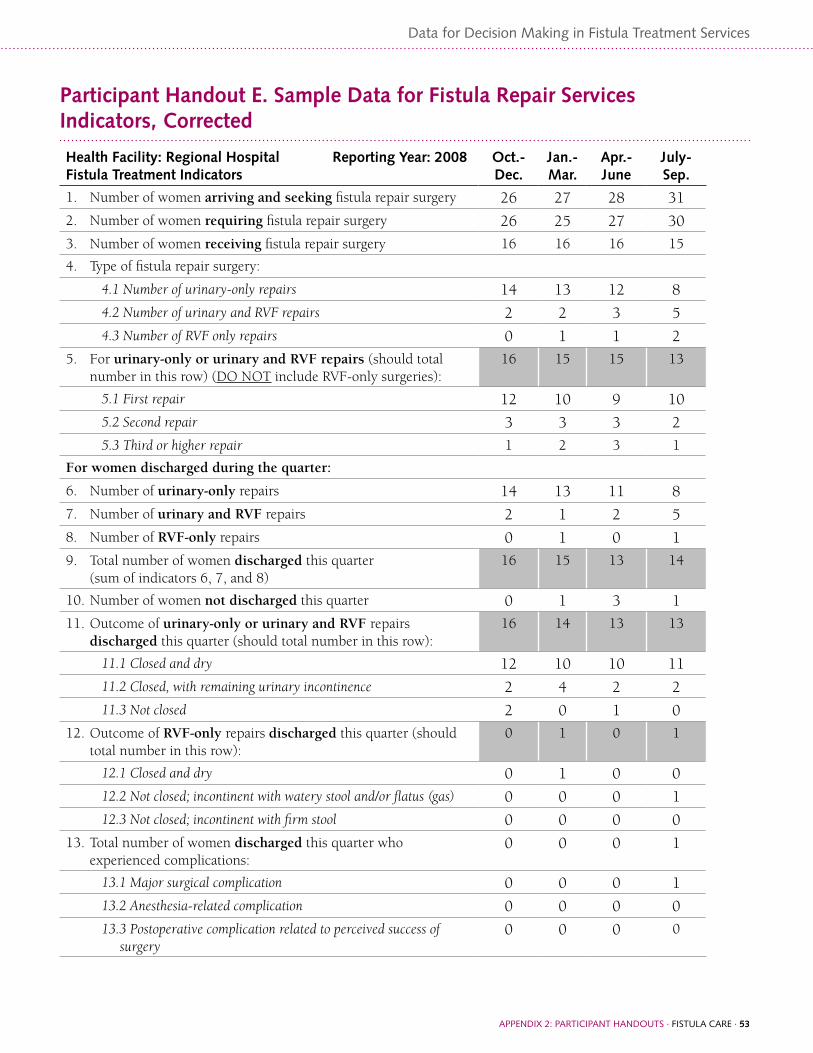
appENDIx 2: paRTICIpaNT haNDOUTS · FISTUla CaRE · 53
Data for Decision Making in Fistula Treatment Services
Participant Handout E. Sample Data for Fistula Repair Services Indicators, Corrected
Health Facility: Regional Hospital Reporting Year: 2008 Fistula Treatment Indicators
Oct.-Dec.
Jan.-Mar.
Apr.- June
July- Sep.
1. Number of women arriving and seeking fistula repair surgery 26 27 28 31
2. Number of women requiring fistula repair surgery 26 25 27 30
3. Number of women receiving fistula repair surgery 16 16 16 15
4. Type of fistula repair surgery:
4.1 Number of urinary-only repairs 14 13 12 8
4.2 Number of urinary and RVF repairs 2 2 3 5
4.3 Number of RVF only repairs 0 1 1 2
5. For urinary-only or urinary and RVF repairs (should total number in this row) (DO NOT include RVF-only surgeries):
16 15 15 13
5.1 First repair 12 10 9 10
5.2 Second repair 3 3 3 2
5.3 Third or higher repair 1 2 3 1
For women discharged during the quarter:
6. Number of urinary-only repairs 14 13 11 8
7. Number of urinary and RVF repairs 2 1 2 5
8. Number of RVF-only repairs 0 1 0 1
9. Total number of women discharged this quarter(sum of indicators 6, 7, and 8)
16 15 13 14
10. Number of women not discharged this quarter 0 1 3 1
11. Outcome of urinary-only or urinary and RVF repairs discharged this quarter (should total number in this row):
16 14 13 13
11.1 Closed and dry 12 10 10 11
11.2 Closed, with remaining urinary incontinence 2 4 2 2
11.3 Not closed 2 0 1 0
12. Outcome of RVF-only repairs discharged this quarter (should total number in this row):
0 1 0 1
12.1 Closed and dry 0 1 0 0
12.2 Not closed; incontinent with watery stool and/or flatus (gas) 0 0 0 1
12.3 Not closed; incontinent with firm stool 0 0 0 0
13. Total number of women discharged this quarter who experienced complications:
0 0 0 1
13.1 Major surgical complication 0 0 0 1
13.2 Anesthesia-related complication 0 0 0 0
13.3 Postoperative complication related to perceived success of surgery
0 0 0 0

54 · appENDIx 2: paRTICIpaNT haNDOUTS · FISTUla CaRE
Data for Decision Making in Fistula Treatment Services
Participant Handout F. Sample Fistula Repair Data Presented in Six Tables
Instructions: Write down the following points for tables 1 through 6.
• 1–2 key points you think are important for each table.
• What the level of difficulty is for all audiences to understand the points.
• Who would be interested in knowing about this information.
1. Women seeking care, needing repair, and getting care, by quarter, 2008 –2009
Year QuarterWomen
seeking careWomen
needing repairWomen
getting care
2008 Q1 95 80 74
Q2 74 59 65
Q3 99 92 75
Q4 102. 52 60
2009 Q1 53 45 46
Q2 77 69 70
Q3 98 92 75
Q4 68 74 75
2. Women getting surgery, by type of fistula, 2007–2009
2007 2008 2009
Urinary Fistula alone 900 1002 1200
Both UvF and RvF 102 101 90
Only RvF 120 114 149
3. Number of complications among fistula patients, by quarter, 2008
Q1 Q2 Q3 Q4
Minor postoperative complications related to perceived success of surgery
15 8 7 3
Minor complications related to anesthesia 1 3 8 4
Major surgical complications 2 4 1 0

appENDIx 2: paRTICIpaNT haNDOUTS · FISTUla CaRE · 55
Data for Decision Making in Fistula Treatment Services
4. Complications among fistula patients, 2008 and 2009
2008 2009
Minor postoperative complications related to perceived success of surgery
15 8
Major surgical complications 2 4
Minor complications related to anesthesia 1 3
5. Surgery status among women getting fistula repair surgery, by quarter, 2009
Q1 Q2 Q3 Q4
1st repair 56 45 51 42
2nd repair 12 23 20 22
>2nd repair 3 1 4 3
6. Outcome of fistula repair surgery at time of discharge, by type of fistula, 2008
Urinary Fistula only +
Urinary & RVF RVF only
Closed and dry 141 43
Closed with remaining incontinence 114 22
Not closed ..15 ..4

56 · appENDIx 2: paRTICIpaNT haNDOUTS · FISTUla CaRE
Data for Decision Making in Fistula Treatment Services
Participant Handout G. Sample Fistula Repair Graphs
1. Number of women seeking care, needing repair, and receiving care, by quarter, 2008–2009
0
20
40
60
80
100
120
Women getting careWomen needing repairWomen seeking care
Q4Q3Q2Q1Q4Q3Q2Q1
2008 2009
0
20
40
60
80
100
120
Women getting care Women needing repair Women seeking care
Q4Q3Q2Q1Q4Q3Q2Q1
2008 2009

appENDIx 2: paRTICIpaNT haNDOUTS · FISTUla CaRE · 57
Data for Decision Making in Fistula Treatment Services
2. Number of women receiving surgery, by type of fistula, 2007–2009
0
200
400
600
800
1000
1200
Only RVFBoth UVF and RVFUrinary fistula alone
200920082007
0 300 600 900 1200 1500
Only RVFBoth UVF and RVFUrinary fistula alone
2007
2008
2009

58 · appENDIx 2: paRTICIpaNT haNDOUTS · FISTUla CaRE
Data for Decision Making in Fistula Treatment Services
3. Numbers of complications among fistula repair patients by quarter, 2008
0
3
6
9
12
15
Q4Q3Q2Q1
Majorsurgical
complications
Minorcomplications
related toanesthesia
Minor postoperativecomplications relatedto perceived success
of surgery
0
3
6
9
12
15
Major surgical complications
Minor complications related to anesthesia
Minor postoperative complications related to perceivedsuccess of surgery
Q4Q3Q2Q1
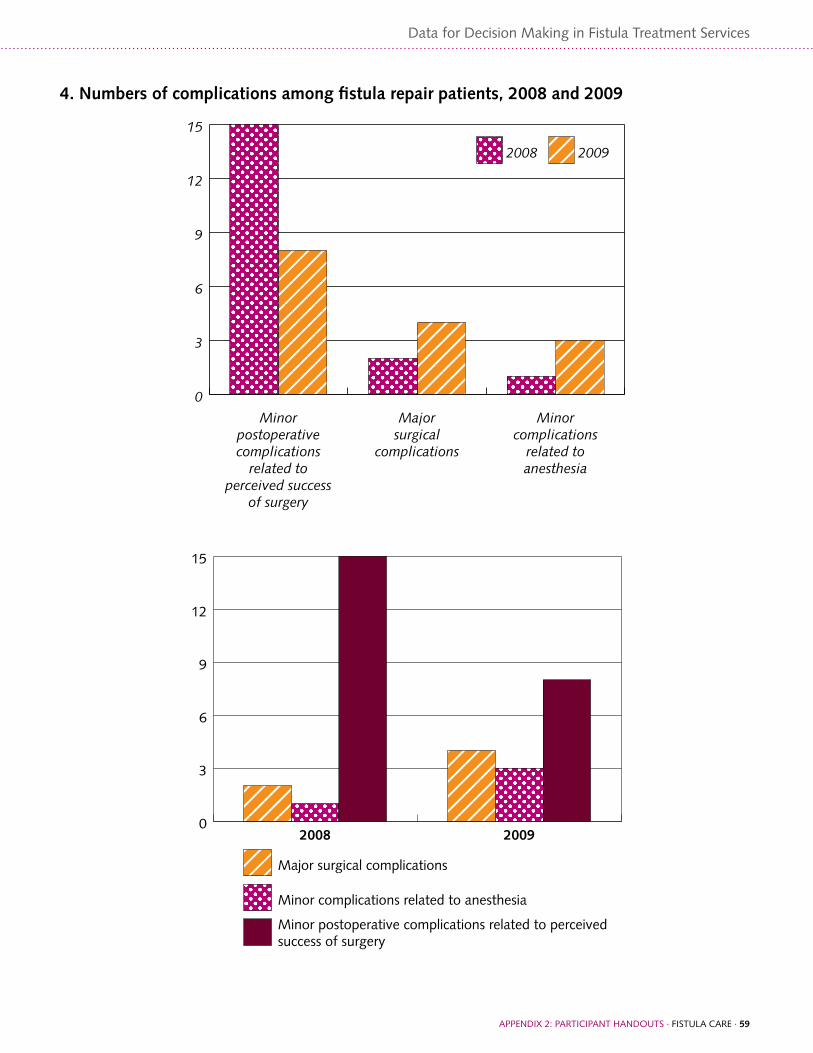
appENDIx 2: paRTICIpaNT haNDOUTS · FISTUla CaRE · 59
Data for Decision Making in Fistula Treatment Services
4. Numbers of complications among fistula repair patients, 2008 and 2009
0
3
6
9
12
15
20092008
Minorcomplications
related toanesthesia
Majorsurgical
complications
Minorpostoperativecomplications
related toperceived success
of surgery
0
3
6
9
12
15
Minor complications related to anesthesia
Major surgical complications
Minor postoperative complications related to perceivedsuccess of surgery
20092008
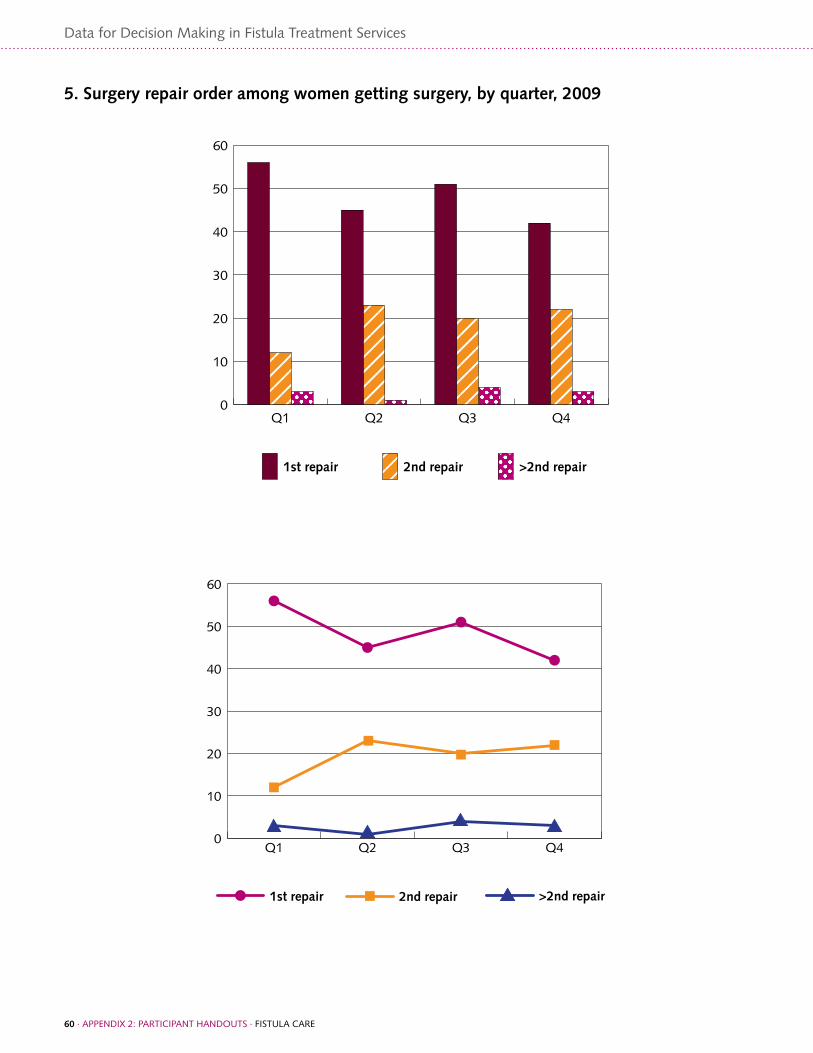
60 · appENDIx 2: paRTICIpaNT haNDOUTS · FISTUla CaRE
Data for Decision Making in Fistula Treatment Services
5. Surgery repair order among women getting surgery, by quarter, 2009
0
10
20
30
40
50
60
>2nd repair2nd repair1st repair
Q4Q3Q2Q1
0
10
20
30
40
50
60
>2nd repair2nd repair1st repair
Q4Q3Q2Q1

appENDIx 2: paRTICIpaNT haNDOUTS · FISTUla CaRE · 61
Data for Decision Making in Fistula Treatment Services
6. Number of women getting surgery, by fistula repair status at discharge, 2008
0
30
60
90
120
150
Not closedClosed with remainingincontinence
Closed and dry
RVF onlyUrinary Fistula only +Urinary & RVF
0% 10% 20% 30% 40% 50% 60% 70% 80% 90% 100%
Not closedClosed with remainingincontinenceClosed and dry
Urinary Fistula only +Urinary & RVF
RVF only

62 · appENDIx 2: paRTICIpaNT haNDOUTS · FISTUla CaRE
Data for Decision Making in Fistula Treatment Services
Participant Handout H. Sample Data for Fistula Repair Services Indicators
Health Facility: Regional Hospital A Reporting Year: 2009 Fistula Treatment Indicators
Oct.-Dec.
Jan.-Mar.
Apr.-June
July-Sept.
Total
1. Number of women arriving and seeking fistula repair surgery 26 27 28 31 112
2. Number of women requiring fistula repair surgery 26 25 27 30 108
3. Number of women receiving fistula repair surgery 16 16 16 15 63
% women getting surgery who require surgery (#3/#2 *100) 61.5% 655 59.2% 50% 58%
4. Type of fistula repair surgery:
4.1 Number of urinary-only repairs 14 13 12 8 47
4.2 Number of urinary and RVF repairs 2 2 3 5 12
4.3 Number of RVF-only repairs 0 1 1 2 4
5. For urinary-only or urinary and RVF repairs (should total number in this row) (DO NOT include RVF only):
16 15 15 13 59
5.1 First repair 12 10 9 10 41
5.2 Second repair 3 3 3 2 11
5.3 Third or higher repair 1 2 3 1 7
For women discharged during the quarter:
6. Number of urinary-only repairs 14 13 11 8 46
7. Number of urinary and RVF repairs 2 1 2 5 10
8. Number of RVF-only repairs 0 1 0 1 2
9. Total number of women discharged this quarter (sum of indicators 6, 7, and 8)
16 15 13 14 58
10. Number of women not discharged this quarter 0 1 3 1 5
11. Outcome of urinary-only or urinary and RVF repairs discharged this quarter (should total number in this row):
16 14 13 13 56
11.1 Closed and dry 12 10 10 11 43
11.2 Closed, with remaining urinary incontinence 2 4 2 2 10
11.3 Not closed 2 0 1 0 3
% with closed fistula who are dry (urinary-only and urinary/RVF) ((11.1/6+7)*100))
75% 71.4% 76.9% 84.6% 76.8%
12. Outcome of RVF-only repairs discharged this quarter (should total number in this row):
0 1 0 1 2
12.1 Closed and dry 0 1 0 0 1
12.2 Not closed; incontinent with watery stool and/or flatus 0 0 0 1 1
12.3 Not closed; incontinent with firm stool 0 0 0 0 0
13. Total number of women discharged this quarter who experienced complications:
0 0 0 1 1
13.1 Major surgical complication 0 0 0 1 1
13.2 Minor complication related to anesthesia 0 0 0 0 0
13.3 Minor complication related to perceived success of surgery 0 0 0 0 0
% discharged who had complications (13/9)*100 0 0 0 7% 1.7%

appENDIx 2: paRTICIpaNT haNDOUTS · FISTUla CaRE · 63
Data for Decision Making in Fistula Treatment Services
Health Facility: Regional Hospital B Reporting Year: 2009 Fistula Treatment indicators
Oct.-Dec.
Jan.-Mar.
Apr.-June
July-Sep.
Total
1. Number of women arriving and seeking fistula repair surgery 23 29 32 37 121
2. Number of women requiring fistula repair surgery 23 29 32 37 121
3. Number of women receiving fistula repair surgery 23 29 31 32 115
% women getting surgery who require surgery (3/2 *100) 100% 100% 97% 86% 95%
4. Type of fistula repair surgery:
4.1 Number of urinary-only repairs 23 28 29 30 110
4.2 Number of urinary and RVF repairs 0 0 1 1 2
4.3 Number of RVF-only repairs 0 1 1 1 3
5. For urinary-only or urinary and RVF repairs (should total number in this row) (DO NOT include RVF-only)
23 28 30 31 112
5.1 First repair 12 22 26 23 83
5.2 Second repair 6 6 3 5 20
5.3 Third or higher repairs 5 0 1 3 8
For women discharged during the quarter::
6. Number of urinary-only repairs 32 22 40 19 113
7. Number of urinary and RVF repairs 0 0 0 1 1
8. Number of RVF-only repairs 0 1 1 1 3
9. Total number of women discharged this quarter (sum of indicators 6, 7, and 8)
32 23 41 21 117
10. Number of women not discharged this quarter 4 10 0 11 n/a
11. Outcome of urinary-only or urinary and RVF repairs discharged this quarter (should total number in this row):
32 22 41 19 114
11.1 Closed and dry 24 20 36 17 97
11.2 Closed, with remaining urinary incontinence 5 0 4 1 10
11.3 Not closed 3 2 1 2 8
% with closed fistula who are dry (urinary-only and urinary/RVF) ((11.1/6+7)*100))
75% 90.9% 90% 85% 85%
12. Outcome of RVF-only repairs discharged this quarter (should total number in this row):
0 1 1 1 3
12.1 Closed and dry 0 1 1 1 3
12.2 Not closed; incontinent with watery stool and/or flatus (gas) 0 0 0 0 0
12.3 Not closed; incontinent with firm stool 0 0 0 0 0
13. Total number of women discharged this quarter who experienced complications:
0 0 1 0 1
13.1 Major surgical complication 0 0 0 0 0
13.2 Minor complication related to anesthesia 0 0 0 0 0
13.3 Minor complication related to perceived success of surgery 0 0 1 0 1
% discharged who had complications (13/#)*100 0 0 2.4% 0 .9%

64 · appENDIx 2: paRTICIpaNT haNDOUTS · FISTUla CaRE
Data for Decision Making in Fistula Treatment Services
Participant Handout I. Case Study
In 2005, Country X launched a national initiative to reduce maternal mortality and morbidity by two-thirds. In the last two years, the Ministry of Health (MOH) put in place a national technical working group to eliminate fistula. One international partner, Fistula No More, has been working with the MOH to implement a fistula treatment and prevention program in two regions.
Two other international donors are supporting maternal health programs in the other three regions. Fistula No More has trained two surgeons in simple repairs. More complicated cases are deferred until visiting surgical trainers visit the sites. These trained surgeons are not able to perform fistula repair surgery routinely due to other responsibilities at the hospital and a lack of trained nurses to assist with surgery. One surgeon in each of the other three regions has been identified for training; to date, these three surgeons have only attended an orientation to fistula and are not skilled to provide surgery.
Although fistula treatment services are operational in only two regions, the working group requires that all five regions submit data on the following indicators pertaining to fistula on a quarterly basis:
• The number of women seeking fistula repair surgery
• The number of women needing fistula repair surgery
• The number of women receiving fistula repair surgery (is applicable)
• The number of women referred for fistula repair surgery
See the tables for the relevant data.
Awareness of fistula and availability of treatment are growing with the support of Fistula No More. Based on the data, the subgroup feels that they need to scale up the fistula program within the regions and to include the other regions. They have made this recommendation to the head of the Safe Motherhood Committee and to the MOH, but there are currently not enough funds in the MOH’s budget to support scale-up of the project.
Questions:
1. Identify the potential audiences that will be critical to scale up the program.
2. Identify 3–5 key points to present a strong argument for scaling the project up to the other regions.
3. Prepare a small presentation of a plan to communicate the three key points to your audiences.

appENDIx 3: SMall gROUp ExERCISE INSTRUCTIONS · FISTUla CaRE · 65
Data for Decision Making in Fistula Treatment Services
Indicator Q1 Q2 Q3 Q4 Total
Region 1
1. The number of women seeking fistula repair surgery 35 42 34 54 165
2. The number of women needing fistula repair surgery 30 42 26 44 142
3. The number of women receiving fistula repair surgery 20 19 18 17 74
4. The number of women referred for fistula repair surgery (if applicable) or backlog
10 23 8 27 68
Region 2
1. The number of women seeking fistula repair surgery 28 39 54 88 209
2. The number of women needing fistula repair surgery 15 38 52 63 168
3. The number of women receiving fistula repair surgery 15 17 25 21 78
4. The number of women referred for fistula repair surgery (if applicable) or backlog
0 21 27 42 90
Region 3
1. The number of women seeking fistula repair surgery 10 14 9 5 38
2. The number of women needing fistula repair surgery 5 3 5 0 13
3. The number of women receiving fistula repair surgery (if applicable) 0 0 5 0 5
4. The number of women referred for fistula repair surgery (if applicable) or backlog
5 3 0 0 8
Region 4
1. The number of women seeking fistula repair surgery 22 35 40 62 159
2. The number of women needing fistula repair surgery 9 22 36 40 107
3. The number of women receiving fistula repair surgery (if applicable) 0 0 0 0 0
4. The number of women referred for fistula repair surgery (if applicable) or backlog
9 22 36 40 107
Region 5
1. The number of women seeking fistula repair surgery 11 25 40 23 99
2. The number of women needing fistula repair surgery 5 18 33 15 71
3. The number of women receiving fistula repair surgery (if applicable) 0 0 0 0 0
4. The number of women referred for fistula repair surgery (if applicable) or backlog
5 18 33 15 71

Data for Decision Making in Fistula Treatment Services

appENDIx 3: SMall gROUp ExERCISE INSTRUCTIONS · FISTUla CaRE · 67
Data for Decision Making in Fistula Treatment Services
Appendix 3: Small Group Exercise Instructions

68 · appENDIx 3: SMall gROUp ExERCISE INSTRUCTIONS · FISTUla CaRE
Data for Decision Making in Fistula Treatment Services
Small Group Exercise A Instructions: Assessing Data Quality (Module 1, Supervisors)
Review of Data Quality
1. Examine the data in Participant Handout B
2. What data quality issues can you find? List at least three issues.
3. Are the data complete? Where are the gaps in the data?
4. Do all of the numbers look accurate?
a. Are the sums correct?
b. Are there items in the table that seem impossible?
c. Are there irrational increases or decreases between months?
d. What other accuracy issues to you see?
5. How can you be sure that the data are being transferred accurately from the registers? How would you supervise this?
6. What can you do to check that the data are being recorded reliably?
7. As a supervisor, what can you do if you find the data are inaccurate or unreliable?
appENDIx 3: SMall gROUp ExERCISE INSTRUCTIONS · FISTUla CaRE · 69
Data for Decision Making in Fistula Treatment Services
Small Group Exercise B Instructions: Utilization of Data (Module 1, Supervisors)
• Group #1 should use data to motivate and encourage staff.
• Group #2 should use data to improve the quality of services.
• Group #3 should use data to advocate for support from authorities.
Each group has 30 minutes to prepare a presentation on how they will use the data from Handout 1.3 for one of the three assigned scenarios listed above. They are to:
• Analyze the audience.
• Identify three key points from the data that they want to communicate about.
• Prepare a small presentation of a plan to communicate the three key points to their respective audiences.
• Use graph paper to make charts to present data (optional)
Following the small group discussions, each group will be called upon to conduct a role play to communicate how they will use the data for each scenario:
• Each group is to select three participants from among those in the room to be their respective audience.
• Each group will have five minutes to present their three points to their “audience” and receive their feedback.

70 · appENDIx 3: SMall gROUp ExERCISE INSTRUCTIONS · FISTUla CaRE
Data for Decision Making in Fistula Treatment Services
Small Group Exercise C Instructions: Communication of Data (Module 3, National Level)
Group #1 should develop a plan to advocate to authorities for technical assistance.
Group #2 should develop a plan to use data for advocacy to an international partner for support in equipment.
Group #3 should use data for advocacy to donors for an extension of a project.
Each group will have 50 minutes to:
• Analyze your audience(s).
• Identify 3–5 key points.
• Prepare a small presentation of a plan to communicate the three key points to your audience(s).
• Prepare a five-minute role play to present three points to the rest of the group as your “audience” and receive their feedback.


Fistula Care c/o EngenderHealth440 Ninth AvenueNew York, NY 10001 U.S.A.Telephone: 212-561-8000Fax: 212-561-8067e-mail: [email protected]
ISBN: 978-1-937410-00-1