a summary of major solar proton events
TRANSCRIPT

A S U M M A R Y OF M A J O R S O L A R P R O T O N E V E N T S *
M . A . S H E A and D. F. S M A R T
Air Force Geophysics Laboratory, Hanscom AFB, Bedford, MA 01731-5000, U.S.A.
(Received 5 June, 1989; in revised form 29 January, 1990)
Abstract. Solar proton events have been routinely detected by satellites since the 20th solar cycle; however, before that time only very major proton events were detected at the Earth. Even though the detection thresholds differed between the 19th and more recent cycles, more than 200 solar proton events with a flux of over 10 particles (cm z s s te r ) - ~ above 10 MeV have been recorded at the Earth in the last three solar cycles. At least 15 50 of these events had protons with energies greater than 450 MeV detected at the Earth. Other than an increase in solar proton event occurrence with increasing solar cycle, no recognizable pattern could be identified between the occurrence of solar proton events and the solar cycle. The knowledge we have gained from the data acquired over the past 40 years illustrates the difficulty in extrapolating back in time to infer the number and intensity of major solar proton events at the Earth.
I. Introduction
The fact that the Sun can accelerate particles with sufficient energy to penetrate to the Earth's atmosphere has been known for approximately 40 years. These solar particle
events have been referred to by a number of descriptive names such as solar cosmic ray
events, solar proton events, ground-level events, polar cap absorption events, and solar electron events. Each of these names was associated with a particular detection tech-
nique. Cosmic-ray sensors on the Earth, specifically ionization chambers, recorded the first observed energetic solar flare particle outbursts and, hence, the name solar cosmic-
ray event was derived. When balloon borne cosmic-ray detectors observed particle events not detected at the Earth's surface, the name solar proton event was introduced to distinguish between those solar proton events detected at ground level (GEE) and
those observed only near the top of the atmosphere. Beginning in the 1950's the Earth's polar ionosphere was shown to respond to solar flare protons with energies from about
1 to 50 MeV, and the term polar cap absorption (PCA) events was extended to include solar proton events. Spacecraft measurements, many orders of magnitude more sensi- tive than Earth-based measurements, allow determination of the composition of solar
particle events, and the term solar electron event was introduced after 1965 to dis- tinguish the species of particles present.
To analyze and summarize the solar proton events over the past three solar cycles, it is necessary to understand solar particle propagation in the interplanetary medium. Since the techniques for detecting solar protons at the Earth have changed over this time period it is also necessary to describe each of the techniques and the methods we used to assemble a list of solar proton events that is as homogeneous as possible.
* The U.S. Government retains a nonexclusive, royalty-free license to publish or reproduce the published form of this contribution, or allow others to do so, for U.S. Government purposes.
Solar Physics 127: 297-320, 1990. �9 1990 Kluwer Academic Publishers. Printed in Belgium.

298 M. A. SHEA AND D. F. SMART
2. Historical Summary of Solar Particle Event Detection Techniques
The first instances where the Sun was unambiguously identified as the source of particles detected at the Earth were on 28 February and 7 March, 1942. As summarized by Lovell (1987) the measurements of the associated solar activity (observed as interference in detection and surveillance equipment) were shrouded in secrecy by the antagonists of the Second World War. It was not until the 25 July, 1946 ground-level event detected by the Godhavn and Cheltenham ionization chambers that Forbush (1946) published both these measurements and his earlier measurements of the 1942 events and suggested that these sudden increases were associated with the emission of energetic particles by a solar flare (Elliot, 1985). This suggestion was viewed with skepticism; however, the event of 19 November, 1949, measured by the experimental neutron monitor at Manchester, UK as well as by ionization chambers, gave respectable scientific credence to the explanation of solar flare accelerated particles detected on the Earth (Adams, 1950; Adams and Braddick, 1950; Forbush, Stinchcomb, and Schein, 1950).
The initial observations of 'solar cosmic rays' relied on ground-based measurements of secondary particles generated at the 'top' of the Earth's atmosphere. Ground-based ionization chambers or muon* detectors respond to the muons generated by incident high energy protons; only nucleons > 4 GeV have sufficient energy to generate muons that can penetrate through the atmosphere. In the 1950's a standardized cosmic-ray monitor (Simpson, 1957) was develop for the IGY (International Geophysical Year). This monitor can detect secondaries generated by incident high energy (> 450 MeV) protons interacting at the top of the atmosphere. Oddly enough solar particle increases were thought to be so rare that the initial specifications for recording the galactic cosmic-ray intensity during the IGY did not suggest small time recording intervals for detailed analyses of these events. It was not until the major event of 23 February, 1956, sometimes referred to as the granddaddy of all ground-level events, that the guidelines for recording cosmic ray intensity were revised to strongly recommend recording inter- vals as small as feasible (Nicolet, 1959). Some of the initial IGY monitors are still in operation although the neutron monitor design has evolved with the development of the so-called 'super' neutron monitor (Carmichael, 1968). The development of his instru- ment for the IQSY greatly augmented the ground-based neutron monitor network.
Concurrently, with advances in nuclear physics, more sensitive instruments were being developed which could directly measure the incident solar particles. These detec- tors were initially carried by balloons to get above as much of the Earth's atmospheric shield as possible; later these detectors were adapted for the initial manmade Earth- orbiting satellites.
Charged particles, such as solar protons, interacting with the Earth's ionosphere enhance the ionization thereby changing the electromagnetic propagation characteristics of the medium. In the late 1950's the development of the riometer (for radio ionosphere
* Muons are a class of weakly interacting secondary particles generated by the decay ofpi -mesons (pions) produced in the breakup of atomic nuclei that collide at high energy.

A SUIVlIVIARY OF MAJOR SOLAR PROTON EVENTS 299
opacity meter, Little and Leinbach, 1959) proved to be very sensitive to particle energy deposition in the ionosphere directly above the instrument. Even though the riometer measurements could not uniquely identify the type of particle incident to the atmosphere, its sensitivity to particles incident in the deep polar cap was equivalent to the sensitivity of the early satellite instruments. Most of the solar particle flux and fluence data available from the 19th solar cycle were derived from riometer measurements in the Earth's polar regions. Figure 1 gives a conceptual history of the availability and energy threshold of each technique used to detect solar cosmic-ray events since 1933.
I0000
I000
>,. (.9 .,,,,..
L,O
z I00 bJ
I0
) . .
r ~ w Z LIJ
MUON
NEUTRON MONITORS
BALLOONS -.
SATELLITES
I00
I0
I 1930
IONOSPHERIC
DETECTION TECHNIQUES
I J I ~ I J I i I ,
1940 1950 1960 1970 1980
YEAR
Fig. 1. Conceptual history of the detection thresholds of solar cosmic-ray events. The thickness of the lines indicates the relative number of each type of detector in use. The differences in shading in the ionospheric
section indicates changes in detection technique.
3. Solar Particles
3.1. THE SOLAR PARTICLE SOURCE
So la r flares are a s soc i a t ed with e l ec t romagne t i c emiss ions , the acce le ra t ions o f e lec t rons
and ions, and, i f cond i t i ons are favorable , the in jec t ion o f these par t ic les into space. (See

300 M. A. SHEA AND D. F. SMART
Chupp (1988) for a review of energetic processes on the Sun.) Each solar flare is unique, and the generation of these emissions can differ from event to event. Solar X-rays and other types of electromagnetic radiation reach the Earth at essentially the speed of light
- i.e., in approximately eight minutes. At times radio and X-ray emissions are detected without a corresponding optical emission, a phenomena that most commonly occurs when the solar flare is located behind the visible portion of the solar disk, particularly near the eastern or western limb. Significant solar particle events have been associated with assumed flares on the invisible hemisphere, particularly behind the west limb of the Sun (Smart et al., 1976).
There is no unique indicator that a specific solar flare will generate a significant solar proton event. At times solar emissions expected to be associated with solar particle acceleration seem to be weak even for 'significant' solar particle events (Cliver et al.,
1983; Shea and Smart,,1986). Even the popular belief that energetic solar particles are always associated with large solar flares has come under serious attack with the measurement of E > 50MeV protons at the Earth associated with a disappearing filament without an accompanying flare (Kahler et al., 1986).
3.2. SOLAR PARTICLE PROPAGATION
Energetic solar particles reach the orbit of the Earth from a few minutes, if the particles are relativistic, to hours for the lower energy particles. Enhanced solar plasma usually propagates to the Earth within one or two days and can manifest itself by the occurrence of aurora and geomagnetic disturbances.
Although the intensity of the radio and soft X-ray emissions observable at one astronomical unit is approximately independent of the location of the flare on the visible disk of the Sun, the observed solar particle flux is a strong function of the heliolongitude of the flare with respect to the detection point in space. This directionality is a conse- quence of the fact that particles will move most easily along the interplanetary magnetic field lines.
The maximum particle flux is presumed to be at the solar flare site with a gradient in the solar corona extending from the flare site to other heliolongitudes (see, e.g., McCracken et al., 1971; McGuire, van Hollebeke, and Lal, 1983). This gradient atte- nuates the maximum particle intensity as the angular distance from the flare site increases with a factor of 10 per radian considered a reasonable approximation for estimating the solar particle flux at heliolongitudes other than the flare site (Smart and Shea, 1979, 1985, 1989a). As the solar particles diffuse through the solar corona, they will also be transported into the heliosphere along the interplanetary magnetic field lines, which, during 'quiet' conditions, can be approximated by an Archimedian spiral.
Particle events at one astronomical unit are characterized by the following: a propa- gation delay from the time of the solar flare until the first particles are observed, a rise in intensity to a maximum value, and a slow decay to the background level as illustrated in Figure 2. Although these general features are always recognizable, the onset time of the particle event, the time of maximum intensity, the maximum (peak) particle flux, and the total fluence of the event are all a function of the heliographic distance between the

A SUMMARY OF MAJOR SOLAR PROTON EVENTS 301
START OF INCREASE
SOLAR TIME OF FLARE MAXIMUM
~ R O M RELATIVE TIME ~ ,'" PROPAGATION START TO MAX DELAY
AMPLITUDE OF MAXIMUM FLUX
Fig. 2. Illustration of the general characteristics of solar proton events observed at 1 AU.
'footpoint' of the interplanetary magnetic field line connecting the detector location with the Sun and the heliolongitude of the flare itself. These parameters are also a function of the interplanetary conditions at the time of the flare, and these conditions are highly variable.
Particle events from flares on the eastern hemisphere of the Sun, with respect to the Earth, usually have slower rates of rise than events from flares west of central meridian. Particle events from flares that occur near the 'footpoint' of the interplanetary magnetic field line connecting the Sun with the Earth generally have a rapid rise to maximum intensity. While particles from these type of flares are propagating along the interplane- tary magnetic field line to the Earth, they are also propagating, albeit with a reduced intensity, through the solar corona to other interplanetary field lines. There are some arguments and observational evidence that, after the initial flare, the maximum flux for long duration particle events may be coming from nearby coronal holes (Reinhard, Roelof, and Gold, 1986).
At times, when interplanetary conditions are favorable, major flares can populate the entire inner heliosphere with solar particles as illustrated in Figure 3. For this event a flare in active region 10882, on the invisible hemisphere of the Sun about three days before east limb passage, was assumed to be the source of the increases measured on the Pioneers 8 and 9 space probes and the Earth-orbiting IMP 5 satellite (Dodson-Prince, Hedeman, and Mohler, 1977; Smart and Shea, 1989b).
3.3. SPECTRUM OF SOLAR PARTICLE EVENTS
Solar particle events typically have softer spectra than the galactic cosmic radiation. Just as the flux observed at the Earth may differ between two apparent similar events, the spectrum may also differ. There are general patterns between the solar particle spectra

302 M. A. SHEA AND D. F. SMART
RELATIVE SOLAR PROTON AMPLITUDE VS.
SPACECRAFT POSITION
8 - 9 AUG 1970 /
/ /
/ /
/
'1 I
\ \
@ \
\
f
\ [ ] / j
N
\ \
I I
/ /
/ /
/ /
Fig. 3. The particle increases observed on 8 and 9 August, 1970 by the Pioneers 8 and 9 space probes and the Earth orbiting IMP 5 satellite. Pioneer 9 observed the largest maximum increase on 8 August, and Pioneer 8 had a smaller increase with maximum intensity on 9 August. A possible flare located approxi- mately 40 ~ behind the east limb was assumed to be the source of this particle event. The small increase
observed on IMP 5 is consistent with this flare location.
observed at the Earth and the flare position on the Sun, although there may be a large
variance between events even for the same solar location. The exponent of the differen-
tial energy spectra of solar proton events observed at the Earth has been summarized
by Van Hollebeke, Ma Sung, and McDonald (1975) as illustrated in Figure 4. From inspection of the figure we note that the hardest spectra were from flares close to the expected 'footpoint' of the idealized interplanetary magnetic field line connecting the Earth to the Sun (,-, 60 ~ west) with the spectra softening as the solar longitudinal distance to the flare site increases.
3.4. C O M P O S I T I O N OF SOLAR PARTICLE EVENTS
Although alpha particles and heavier nuclei have been measured in solar particle events, the measurements are relatively recent (Goswami eta l . , 1988; McGuire, yon Rosenvinge, and McDonald, 1986; Cook, Stone, and Vogt, 1984; Mason et al., 1980)

A SUMMARY OF MAJOR SOLAR PROTON EVENTS 303
X LO t23 Z
g < tw ).... (.2, LO
Fig. 4.
@' t I 1 ' I
20-80 MeV PROTONS +
N
+
' I ' i% ' I ' l ' I ' I ' I
\
+ X
Nq \ f . . 1
rlrl,l'l'l'l~
7 / / / , /
/ / .
/ ' / / / t / /
.~j~, I , [ , I , I , I ~ I ~ I L t ~ [ ' I L I , I J I i I , I J I ~ I
: A S T 1 2 0 ~ 8 0 ~ 4 0 ~ 0 ~ 4 0 ~ 8 0 ~ 1 2 0 ~ 1 6 0 ~ W E S T
H E L I O L O N G I T U D E W I T H R E S P E C T T O T H E C E N T R A L M E R I D I A N
Summary of the 20-80 MeV differential spectral exponents as determined by Van Hollebeke, Ma Sung, and McDonald (1975).
and are generally for particles with less than 20 MeV per nucleon. A discussion of these particles is beyond the scope of this paper, especially since a homogeneous data base is not available; the reader is referred to reviews by Lin (1987) and Mason (1987) on the variation of the elemental abundances in solar particle events. Large solar particle events have an elemental composition that is consistent with 'normal' coronal material being selected by its first ionization potential and then accelerated to high energies (Bremean and Stone, 1985).
4. Solar Proton Events: 1955-1986
4.1. T H E EXISTING DATA BASE
There have been Earth-based measurements of solar flare generated particles since 1942. However, the indirect detection techniques did not stabilize until approximately 1958, and the spacecraft measurements were not really systematic until about 1965. Based on contemporary knowledge, it is possible to interpret the riometer sensed data to form a useful continuous data base extending from the present back until about 1955.

304 r,,I. A. SHEA AND D. F. SMART
There are 'inferred' measurements of polar cap absorption events extending back to solar cycle 17 (Svestka, 1966), but we have no way to translate these early ionospheric measurements into inferred proton flux or fluence. Inclusion of all the available flux and fluence data form a 'measured' data base extending over three solar cycles. The flux and fluence data base for solar cycle 19 is primarily derived from riometer or riometer equivalent data (Bailey, 1964) supplemented with limited spacecraft data in the early 1960's. The data base for solar cycle 20 is derived from Earth-orbiting satellite measure- ments of solar particle events plus simultaneous polar riometer measurements; this allows a cross calibration of the detection techniques. Finally, the data base for solar cycle 21 is primarily from very sensitive spacecraft instruments (so sensitive, in fact, that they 'saturate' in large events), with only a minor contribution from ionospheric data since many of the polar riometer stations had closed.
The most homogeneous list of solar proton events derived from a standard obser- vational technique is a list of'ground-level events' detected with neutron monitors. The sensitivity of this instrument has been essentially unchanged since its inception in 1953. During the 19th solar cycle some smaller events may not have been identified because of a sparsity of detectors. Since the 1960's a more dense net of instruments has been installed as a result of the IQSY, particularly in the Earth's polar regions, and events with increases of only a few percent have been readily identified since 1966. Figure 5 shows the temporal distribution of these relativistic solar proton events over the past
RELATIVIST[: ,gOL~R PROTON EVENTS
FREQUENCY SOJRCE
~ 200
E3
J
o i l r 3
f . . . . I . . . . I . . . . I . . . . I . . . . I . . . . I . . . . I ' ' ' 55 60 65 70 75 80 85
YEAR
N
E " t - ~ + c o w ~ o
TO ~ r r H
Fig. 5. The observed high energy solar proton events (E > 450 MeV) over three solar cycles. The top part of the figure shows the smoothed sunspot number. The bottom part of this figure shows the number of high-energy solar particle events (GLE events) each )'ear. The right part of the figure shows the location
of the source solar flare on the Sun.

4. SUMMARY OF MAJOR SOLAR PROTON EVENTS 305
three solar cycles, and the location of the flare associated with each event. Notice that
seven of the 35 events have been associated with flares behind the west limb of the Sun.
The largest ground-level event of the past three solar cycles was on 23 February, 1956. The associated flare, at W80, would have been near the 'footpoint' of the Archimedean spiral path from the Sun to the Earth, thereby probably resulting with a maximum intensity at the Earth. An increase of over 4000 ~~ o above background radiation was
recorded by the neutron monitor at Leeds, U.K. The intensity increase recorded by the neutron monitor at Huancayo, Peru and the muon telescope in Kodaikanal, India,
indicated that particles in excess of 17 GV were present. No other flare since then has produced this magnitude of high-energy particles at the Earth. However, this does not
mean that similar solar events have not occurred. It is possible that a similar flare was not in a favorable location for such fluxes or energies to be recorded at the Earth.
There have been a number of attempts to organize the lower energy solar particle data in order to derive statistics on the frequency, magnitude and fluence of these events.
However, until extensive direct satellite particle measurements were available, there
were always questions as to the possible contamination of the measurements in the polar ionosphere by local magnetospheric effects. When spacecraft data became available it
was possible to compare these measurements with simultaneous ground-based measurements and learn how to extrapolate the earlier ground-based riometer measure- ments to solar particle fluxes. Some of the early lists were compiled by Malitson (1963), Webber (1963), and Bailey (1964). The first comprehensive catalog of solar proton
events including ground-based and satellite measurements, and associated solar phe- nomena, covered the 15-year period from 1955 through 1969 (Svestka and Simon,
1975). This was followed by a similar catalog for 1970-1979 (Akiniyan et al., 1982). The
NOAA/USAF Space Environment Services Center in Boulder, Colorado, U.S.A. now maintains a current list of solar proton events which is published in Solar-Geophysical Data.
Obviously it is not possible to assemble a completely homogeneous list of solar proton events detected over the last three solar cycles, primarily because of the different measurement techniques used. However, we have attempted to assemble a list of MeV
class solar particle events which is as homogeneous as possible. Our data sources and criteria are as follows:
All polar riometer (or riometer equivalent) events with at least a 1.0 dB absorption were included unless satellite measurements indicated the > 10 MeV peak flux was
lower than 10 particles (cm 2 s ster) - ~. (A practical 'rule &thumb" useful for converting sunlit polar cap riometer absorption to proton flux is J = 10 A 2, where J is the flux of protons with energy > 10 MeV (in units of (cm 2 s ster) - 1) and A is the 30 MHz polar
cap riometer absorption.) The catalog by Svestka and Simon (1975) supplemented by Shea and Smart (1977) were our basic sources for the years 1955-1969. Our basic sources for 1970-1979 were Shea and Smart (1979) and the catalog by Akiniyan et al. (1982). Satellite measurements from the synchronous orbiting GOES spacecraft were used for the period 1976-1986 (Solar-Geophysical Data, 1988). These sources were augmented by the data assembly of Krimigis and Armstrong (1988) who have processed

306 M.A. SHEA AND D. F. SMART
the IMP 7 and 8 spacecraft data from 1972 to 1988 in order to generate a 'uniform' assembly of proton flux data at standardized energy levels. Application of this criteria systematically excludes 'small' events. A number of'small ' events included in Feynman
et al. (1989) are not in Table I because they did not meet our peak flux criteria. When several sources overlapped in time, they were cross checked. Questionable events were resolved in the following way. If satellites measured a minimum of at least 10 particles
(cm 2 s ster)- 1 above 10 MeV, the event was included. This was selected as the particle flux necessary to produce a 1.0 dB riometer absorption in the sunlight polar cap. If
satellite measurements were not available, the polar cap riometer measurements were used.
Table I is a list of the 218 events between 1955 and 1986 that met the above criteria.
The dates of the particle onset and peak intensity (> 10 MeV) at the Earth are both
given. The riometer absorption, in dB, is listed for most events until 1982 after which there is a decrease in the availability of sunlit riometer measurements. Peak flux and
fluence data, obtained from a variety of sources are also shown. Care should be taken in utilizing some of the values shown on the lists initially published in Solar-Geophysical
Data as omissions and discrepancies have been found; these will be corrected in a later
issue.
5. Solar Proton Events and the Solar Cycle
The number of discrete solar proton events each calendar year for the past three solar
cycles (1955-1986) is plotted in the top portion of Figure 6; the yearly average sunspot numbers are shown in the bottom portion of this figure. An inspection of Table I shows that significant solar proton events occur in episodes with a large variance in the
distribution. There can be relatively long periods between significant events during the sunspot solar maximum (e.g., 1980); conversely, significant solar proton events, includ- ing ground-level events, have occurred during solar minimum (e.g., 1976).
5 . 1 . S O L A R P R O T O N E V E N T S F O R S U N S P O T C Y C L E S 19-21
Since most major flares and proton events occur in conjunction with sunspot activity,
we have used the monthly mean sunspot number as our major parameter (McKinnon,
1987); however, we used the smoothed sunspot number to define the length of each cycle since the monthly mean numbers have a wide variance.
The top portion of Figure 7 shows the number of solar proton events that occurred each 12-month period after sunspot minimum for the past three solar cycles; the 12-month mean sunspot number for the same periods is shown in the bottom of the figure. A summary of the number of events for each solar cycle is given in Table II. The three histograms in the top part of Figure 7 are all different, and beyond the obvious fact that there are more solar proton events during solar activity maximum than at solar minimum, there does not appear to be any repeatable solar cycle pattern.
Using solar minimum as our fiducial mark, we summed the number of solar proton events for successive 12-month periods after statistical sunspot minimum for the past

A SUMMARY OF MAJOR SOLAR PROTON EVENTS
TABLE I
Solar proton events for solar cycles 19, 20, and 21
307
Year Onset Maximum Peak > 10 MeV > 10 MeV > 30 MeV Comments
Ivlo Day Mo Day db Ref. Peak flux Ref. Fluence Ref. Fluence Ref.
1955 I 16 2 a
1956 2 23 2 23 13 a 1.8E+09 b 1.0E+09 b GLE 1956 3 10 3 11 3.5 a 1.1E+08 b
1956 8 31 9 1 4.9 a 8.0E+07 c 2.5E+07 b GLE 1956 11 13 11 14 5.4 a 4.0E+08 c* 1.0E+08 b 1957 1 20 1 21 4.1 a 1.6E+09 c* 3.0E+08 b 1957 4 3 4 4 3.9 a 2.4E+08 c* 5.0E+07 b 1957 4 6 4 6 3.2 a 3.8E+07 b 1957 5 19 - - 1 a
1957 6 22 6 24 5.0 a 7.3E+08 c* 1.5E+08 b 1957 7 3 7 3 9.2 a 1.4E+08 c* 2.0E+07 b 1957 7 24 7 25 2 a 7.5E+06 b 1957 8 9 8 10 3.1 a 1.5E+06 b
1957 8 29 8 29 3.2 a I f b 1957 8 29 8 30 9.0 a ~ 1.1E+09 c* ~ 1.2E.08 b 1957 8 31 9 1 4.9 a 3.9E+08 c* 8.0E+07 b
1957 9 2 9 3 7.2 a 2.6E+08 c* 5.0E+07 b Note l 1957 9 21 9 22 5.1 a (* b
1957 9 26 9 26 2 a . ]1 .5E+06 b 1957 10 20 10 21 7.8 a 1.7E+08 c* 5.0E+07 b 1957 11 5 11 5 2.6 a 9.0E+06 b 1958 2 10 2 10 3.2 a 5.0E+06 b
1958 3 23 3 25 3.2 a 1" b 2.5E+06 b 1958 3 25 3 26 10 a j 2 . 0 E + 0 9 b 6.0E+08 b 1958 4 10 4 10 4.4 a 5.0E+06 b
1958 7 7 7 8 23.7 a 1.8E+09 b 2.5E+08 b 1958 7 29 7 29 1.5 a 8.5E+06 b 1958 8 16 8 16 >15 a 4.0E+08 b 4.0E+07 b 1958 8 21 8 22 3 a (" b
1958 8 22 8 23 10.6 a ~!8.0E+08 b 7.0E+07 b 1958 8 26 8 26 >13 a 1.5E+09 b 1.1E+08 b 1958 9 22 9 23 5.0 a 9.0E+07 b 6.0E+06 b 1959 2 13 2 13 2.6 a 1.2E+08 e* 2.8E+07 b 1959 5 10 5 12 >17 a 5.5E+09 b 9.6E+08 b 1959 6 13 1.5 a 4.5E+08 c* 8.5E+ 07 b 1959 7 10 7 11 20 d 4.5E+09 b 1.0E+09 b 1959 7 14 7 15 23.7 d 7.5E+09 b 1.3E+09 b 1959 7 16 7 17 21.2 d 3.3E+09 b 9.1E+08 b GLE 1959 8 18 ~1 a 1.8E + 06 b 1960 1 12 ~2 a 4.0E + 05 b 1960 3 30 3 31 5.5 a 6.0E+06 b 1960 4 1 4 ! 3 a 1.5E+07 b 5.0E+06 b 1960 4 5 4 5 3.1 a 1.4E+07 b 1.1E+06 b 1960 4 28 4 28 3 a (" b 5.0E+06 b 1960 4 29 4 30 14 a J l . 3 E + 0 7 b 7.0E+06 b 1960 5 4 5 4 5 a r b 6.0E+06 b GLE 1960 5 6 5 8 >15 a ~|1.2E+07 b 4.0E+06 b

308
Table I (continued)
M. A. SHEA AND D. F. SMART
Year Onset Maximum Peak > 10 MeV > 10 MeV > 30 MeV Comments
Mo Day Mo Day db Ref. Peak flux Ref. Fluence Ref. Fluence Ref.
1960 5 13 1960 9 3 1960 9 26 1960 11 12 1960 II 15 1960 11 21 1961 7 11 1961 7 12 1961 7 18 1961 7 20 1961 9 7 1961 9 10 1961 9 28 1961 11 10 1962 2 1 1963 2 9 1963 9 21 1963 9 26 1965 2 5 1966 3 24 1966 7 7 1966 8 28 1966 9 2 1966 9 14 1967 1 28 1967 2 2 1967 3 11 1967 5 23 1967 5 28 1967 6 6 1967 12 3 1968 6 9 1968 7 9 1968 7 12 1968 9 28 1968 9 29 1968 10 4 1968 10 31 1968 11 1 1968 11 4 1968 11 18 1968 12 3 1969 2 25 1969 2 26 1969 2 27 1969 2 28 1969 3 30 1969 4 11
5 13 4.5 a 9 4 2.7 a
~ 2 a 11 13 21.2 a 11 15 >20 a 11 21 5 a 7 12 ~ 1 a 7 13 17 a 7 18 11 a 7 21 5 a 9 7 1 a 9 11 6.5 a 9 30 3.3 a
11 10 1.5 a 2 2 2.8 a 2 10 2.4 a 9 21 4 a 9 26 4.6 a 2 6 1.3 a 3 24 1.6 a 7 7 2.1 a
4.0 a
9 2 14.0 a 9 15 1.2 a 1 28 7.0 a 2 3 2.6 a 3 12 1.6 a 5 25 11.0 a 5 28 4.1 a 6 7 1.8 a
12 3 1.8 a 6 10 6.5 a 7 11 1.1 a 7 13 3.0 a 9 28 1.2 a 9 29 1.7 a
10 4 1.6 a 10 31 5.5 a 11 2 4 a 11 4 1.6 a 11 18 12.5 a 12 6 4.7 a
2 25 2.1 a 2 26 1.3 a 2 27 1.3 a 2 28 1.1 a 3 30 1.4 a 4 13 >16 a
1015 f 115 f 20 e 31 f
354 f 10 e 54 e 10 e 32 f 36 f
133 f 152 f 20 e
849 f 152 f
88 f 14 e 28 f 10 e 26 f
1375 f
1.5E+07 b 4 .0E+06 b 9.0E+07 b 3 .5E+07 b 2 .0E+07 b 2 .0E+06 b 3 .2E+10 b 9 .0E+09 b 2 .5E+09 b 7 .2E+08 b 1.4E+08 b 4 .5E+07 b 1.7E+07 b 3 .0E+06 b 5.0E+08 b 4 .0E+07 b 1.0E+09 b 3 .0E+08 b 1.5E+07 b 5 .0E+06 b
b
f 5 . 0 E + 0 7 b J~3.0E+06 b 5 .0E+07 b 6 .0E+06 b 3 .0E+07 b
5 .0E+07 b 2 .9E+08 c* 6 .0E+07 c 1.6E+07 b 2 .5E+06 b 1.1E+07 b 8 .7E+05 b 6 .4E+07 b 3 .0E+06 b
�9 b b J 1.1E+07 b J ' l . 0 E + 0 9 b
b f l l E + 0 9 b . b f l . 6 E + 0 7 b
1.6E+07 b 2 .8E+06 b
, f7 .8E+08 b b J '5 .8E+ 07 b b
2 .4E+07 b 1.4E+07 b 2 .5E+07 b 1.0E+07 b 2 .9E+08 b 1.4E+07 b
b b 29 .9E+ 06 b $4 .7E+ 07 b
.f ul b b 7 .4E+07 b ~,2.1E+07 b
i b f b b b 2 .1E+08 b 2 .2E+07 b 1.0E+09 b 2 .1E+08 b 2 .3E+08 b 4 .2E+07 b
b b b b
7 .6+07 b 2 .9E+07 b 7 .8E+07 b 3 .8E+07 b 2 .2E+09 b 2 .1E+08 b
GLE
GLE, Note 2 GLE, Note 2 GLE, Note 2
GLE GLE
GLE
GLE, No te3
GLE
GLE
GLE
GLE

A SUMMARY OF MAJOR SOLAR PROTON EVENTS 309
Table I (conthTued)
Year Onset Maximum Peak > 10 MeV > i0 MeV > 30 MeV Comments
Mo Day Mo Day db Ref. Peak flux Ref. Fluence Ref. Fluence Ref.
1969 5 13 5 15 1.2 a 15 e 1969 6 7 6 8 1.4 a 25 e 1 9 6 9 9 2 5 9 2 5 0.7 a 15 e j" b i b 1969 9 27 9 28 1.7 a 11 e 1.8E+07 b 4.1E+06 b 1969 11 2 11 2 13 a 1317 f 6.4E+08 b 2.1E+08 b 1970 l 31 2 1 1.9 g 24 f 2.8E+07 b 9.9E+07 b
1970 3 6 3 7 1 g 13 e f b f b 1970 3 6 3 8 3.8 h 93 f 6.8E+07 b 4.5E+07 b 1970 3 29 3 29 1.8 h 66 f 9.4E+07 3.9E+07 b 1970 5 30 5 30 1.3 g 18 e 1.4E+07 b 3.5E+06 b 1970 6 26 6 26 1.5 g 12 g 1970 7 24 7 25 4.5 h 206 f 3.6E+07 b 4.0E+06 b 1970 8 13 8 16 3.0 h 183 f 1.9E+08 b 1.4E+07 b 1970 I1 5 11 6 2.5 g 42 f 6.6E+07 b 8.5E+06 b 1971 I 24 1 25 14.5 h 1171 f 1.5E+09 b 3.5E+08 b GLE 1971 4 6 4 6 2.2 g 51 f 3.2E+07 b 6.8E+06 b 1971 5 16 5 16 1.3 h 12 e 1.4E+07 b 9.9E+06 b 1971 9 1 9 2 5.2 h 352 f 3.9E+08 b 1.8E+08 b GLE 1972 1 20 1 20 2 g 21 g 1 9 7 2 4 1 7 4 1 8 1.4 g 15 e j" b i b 1972 4 18 4 19 4.1 g 34 g 3.0E+07 b . 7.8E+06 b 1972 5 28 5 30 2.6 h 39 f 7.6E+07 b 1.5E+07 b
1972 6 8 6 8 1 g 10 g r4 .0E+07 b f e 8 E + 0 7 b 1972 6 16 6 17 2.2 h 20 e . b . b 1972 7 22 7 22 0.8 h 12 e 5.4E+07 b 2.4E+07 b 1972 8 2 8 4 2.3/'9.4 g 42/1070 g (' b I ~ b Note4 1972 8 4 8 4 > 22 h 86000 f ~ b ~ b GLE 1972 8 7 8 9 17 g 3500 f .. 1.1E+10 b ~ . 5.0E+09 b ~ GLE 1972 10 29 10 31 3.1 h 46 i 6.0E+07 b 1.5E+07 b 1973 4 29 4 30 1.2 g 20 i 1.6E+07 b 1.1E+07 b GLE 1973 9 7 9 7 1.2 g 13 i 1.9E+07 b 4.4E+06 b
1974 7 3 7 4 1.6 g 42 i t/'2.4E b J|~2.6E+07 b 1974 7 4 7 5 1.3 g 23 i b b 1974 7 5 7 5 5.2 g 329 i b b 1974 7 6 7 6 5.3 g 95 i L +08 b b 1974 9 1l 9 12 1.2 j 42 i (" b [~ b
1974 9 13 9 15 3.0 j 107 i J b t b 1974 9 19 9 20 3.0 j 127 i b b 1974 9 23 9 25 0.9 g 11 i 3.3E+08 b 4.3E+07 b 1974 11 5 11 5 1.8 g 40 i 1.3E+07 b 3.5E+06 b 1975 8 22 8 22 0.6 g 11 g 6.6E+06 b 2.8E+06 b 1976 4 30 5 1 2.7 g 180 k 1.0E+08 b 3.0E+07 b GLE 1976 8 22 8 22 0.9 g 14 i 1.0E+07 b 2.5E+06 b 1977 9 16 9 17 1.5 g 35 i [~ b |" b 1977 9 19 9 19 5.5 g 200 k J b J b GLE 1977 9 24 9 24 2.4 g 81 i 4.3E+08 b 9.8E+06 b GLE 1977 11 22 11 22 4.8 g 446 i 2.8E+08 b 6.3E+07 b GLE 1978 2 13 2 14 11.8 g 1160 i 1.5E+09 b 1.3E+08 b

310
Table I (continued)
M. A. SHEA AND D. F. SMART
Year Onset Maximum Peak > 10 MeV > 10 MeV > 30 MeV Comments
Mo Day Mo Day db Ref. Peak flux Ref. Fluence Ref. Fluence Ref.
1978 4 11 1978 4 19 1978 4 21 1978 4 28 1978 4 29 1978 4 30 1978 5 7 1978 5 31 1978 6 22 1978 7 10 1978 9 23 1978 10 9 1978 11 10 1978 11 II 1979 2 17 1979 4 3 1979 4 4 1979 6 6 1979 7 6 1979 8 19 1979 8 21 1979 9 14 1979 11 16 1980 2 6 1980 7 17 1980 10 15 1981 3 30 1981 4 10 1981 4 24 1981 4 26 1981 4 29 198l 4 30 1981 5 9 1981 5 10 1981 5 16 1981 7 20 1981 7 25 1981 8 9 1981 10 9 1981 10 12 1981 12 10 1982 1 31 1982 2 l 1982 3 7 1982 6 4 1982 6 9 1982 7 10 1982 7 12
4 11 3.8 g 65 i 4 20 >0.7 g 13 i 4 25 0.9 g 10 i 4 29 - g 225 i 4 30 4.8 g 307 i 4 30 14.2 g 1486 i 5 7 5 g 216 i 6 2 1.9 g 19 k 6 24 1.8 g 36 i 7 13 1.6 g 20 k 9 24 14.2 g 2200 k
10 10 17 i 11 11 1.2 g 16 i 11 11 11 i 2 17 0.6 g 25 i 4 4 2.4 g 21 i 4 5 1.9 g 23 i 6 7 7.6 g 549 i 7 7 2.4 g 19 i 8 20 5.4 g 500 k 8 21 5.0 g 332 i 9 18 2.6 g 89 i
11 16 2.3 g 65 i 2 6 1.0 k 12 k 7 18 2.0 k 119 i
10 15 10 i 3 30 12 i 4 10 1.8 k 55 i 4 24 3.2 k 224 i 4 27 91 i 4 29 88 i 4 30 82 i 5 10 57 i 5 10 220 i 5 16 3.7 k 201 i 7 20 2.5 k 103 i 7 25 18 i 8 10 34 i
10 11 1.7 k 83 k 10 13 6.3 k 2000 k 12 10 107 i
1 31 832 i 2 2 343 i 3 7 17 i 6 6 10 k 6 9 30 k 7 12 38 i 7 13 12.5 k 1864 i
7.0E+07 b
X b b b
2.4E+09 b 1.8E+ 07 b 1.4E+ 07 1 5.3E+07 b 3.2E+08 b 2.9E + 09 b 8.6E+06 b
f b 1.8E+ 07 b 1.6E+ 07 b
b f 2.1E+07 b
2.1E + 08 b 2.1E+ 07 b
~ b J 6 . 0 E + 0 8 b
3.6E+08 b 3.2E+07 b 3.0E+06 b 1.2E + 08 b 3.0E+07 b 2.8E+07 b 8.5E+07 b
b b b b b b
1.0E+ 09 b b
8.1E+07 b 1.4E+07 b
" b I J 9 1E+09 b
7.7E +07 b
f b 1.1E + 09 b 1.1E + 07 b
b f 7 . 0 E + 0 7 b
b f 8.4E+08 b
1.8E+ 07 b j. b b b b
2.9E+08 b 2.0E+06 b
4.5E+06 b 3.1E + 06 b 4.4E+08 b 2.9E+06 b
b f 2 . 0 E + 0 6 b
4.5E+06 b
1.8E+ 06 b 1.5E+ 07 b 2.2E+06 b
b f 9 . 5 E + 07 b
1.2E + 08 b 2.7E+06 b 1.1E + 06 b 1.2E + 07 b 4.0E+06 b 5.6E+06 b 1.9E + 07 b
b b b b b b
1.4E+ 08 b b
1.2E +07 b 1.4E + 06 b
b f 4 . 2 E + 0 8 b
5.8E+06 b b
f l .8E+08 b 2.0E+06 b
2.3E + 07 b b
f 9 . 1 E + 0 7 b
GLE, N o t e l
GLE
GLE
GLE
GLE
GLE

A S U M M A R Y O F MA J O R SO LAR P R O T O N EVENTS 311
Table I (continued)
Year Onset Maximum Peak > 10 MeV > 10 MeV > 30 MeV Comments
Mo Day Mo Day db Ref. Peak flux Ref. Fluence Ret2 Fluence Ref.
1982 7 22 7 23 3.0 k 256 i 1.2E+08 b 1982 9 4 9 6 1.0 k 19 i 1.4E+07 b 1982 11 22 11 22 40 k l" b 1982 11 23 11 24 82 i J b 1982 11 26 11 26 3.0 k 161 i 2.5E+08 b 1982 12 8 12 8 10 k 1000 k 5.7E + 08 b
1982 12 17 12 18 3.7 k 130 k TI+I.3E+08 b 1982 12 19 12 20 3.0 k 85 k + h
1982 12 25 12 27 20 i +'2.1E+08 b 1982 12 27 12 27 4.6 k 201 i b 1983 2 3 2 4 3.9 k 132 i 1.0E+08 b 1983 6 15 6 15 18 k 2.1E+07 b 1984 2 16 2 16 660 k |+ b 1984 2 18 2 21 55 k .J 1.6E+08 b
1984 3 13 3 13 10 k +'2.9E+07 b 1984 3 14 3 14 100 k b 1984 4 25 4 26 17.0 k 2500 k 1.3E+09 b 1984 5 24 5 24 31 k 1984 5 31 5 31 15 k 1985 1 22 1 22 14 k 8.7E+06 b 1985 4 24 4 26 160 k 2.8E+08 b 1985 7 9 7 9 140 k 2.3E+ 07 b 1986 2 6 2 6 100 m |+ 1 1986 2 7 2 7 130 k .J 1.0E+08 1 1986 2 14 2 15 2.3 k 130 k 3.1E+08 1 1986 3 6 3 6 21 k 1986 5 4 5 4 16 k
1.3E+07 b 1.6E+06 b
b b
4,6E+07 b 1,2E+08 b
b 3.0E§ 07 b
b 2.9E+ 07 b 8.3E+ 06 b 8.4E+ 06 b
�9 b
4,2E+ 07 b
f7 .1E+06 b b 3.6E+08 b
2.9E+06 b I.IE+ 07 b 6.9E+06 b
f l . 5 E + 07 1 i 2.2E+ 07 1
GLE GLE
GLE
* 10 MeV fluence reported by Reedy (1977) interpolated from higher energy. ]" Beginning of flux integration with this injection: flux integration includes this injection; end of flux integration after this
injection. Note 1: fluence includes other events too small to meet the peak flux criterion of 10 protons (cm 2 s ster)- 1 at energies
> 10 MeV. Note 2: there are large differences in the estimates of the fluence in the November 1960 events. The data given by Feyman
et al. (1989) are significantb' larger than those given by Reedy (1977), McDonald (1963) or Webber (1963). Note 3: two GLE's on 28 January, 1967. Note 4: riometer absorption and flux before and after SC at Earth. # King (1974) treazs August 1972 as t~o activity episodes. a Shea and Smart (1977j. b Feynman et al. (1989). c Reedy (1977). d Bailey (1964). e Unpublished solar particle flux data compilation from Shea and Smart. f King (1974). g Akiniyan et al. (1982). h Shea and Smart (1979). i Armstrong (1988). j Unpublished riometer data compilation from Shea and Smart. k Solar-Geophyskal Data, NOAA, Nat. Geophys. Data. Cntr., Boulder, Colorado. 1 Goswami et al. (1988). m Pre6minarv Report and Forecasts of Solar-Geophysical Data, NOAA, SEL, Boulder, Colorado.

312 M. A. SHEA AND D. F. SMART
Fig. 6.
2 0
I-
Z O
2OO
m 180 n,,
m w 160
D 1 4 0 z I - o 1 2 0 ,,,I uJ z I 0 0 (/)
z 8 0
ILl :~ 6O >- ..J re 4 0
LU ;- 20
I I t I I 5 5 6 0 6 5 7 0 7 5 8 0 8 5
Y E A R
The number of significant discrete solar proton events per calendar year (top) and the yearly
averages of the mean sunspot number (bottom) for the period 1955-1986.
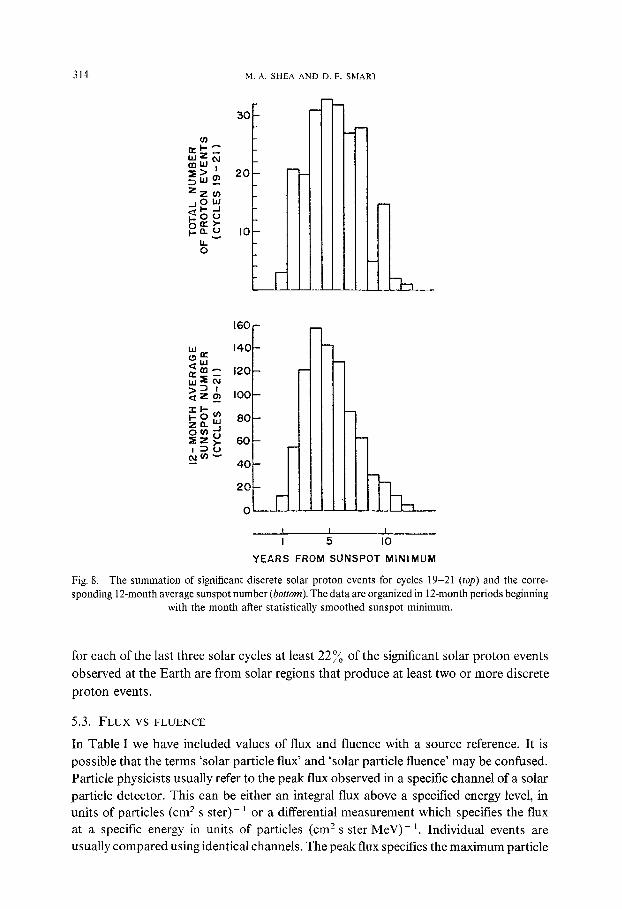
three solar cycles and present these results as a 'stack plot' in the top half of Figure 8. The 12-month average sunspot number, illustrated in the bottom half of Figure 8, has
been calculated in the same manner. This figure indicates that the majority of solar proton events will occur from the second through eighth years after sunspot minimum. When repeating these calculations but using the month of smoothed sunspot maximum as a fiducial mark, we find that the majority of solar proton events will occur from two
years before to four years after sunspot maximum. These results are in agreement with
those of Feynman et aL (1989) who performed a similar analysis using proton fluence.
5.2. EPISODES OF ACTIVITY
In compiling the list of significant solar proton events we tried to identify each event with a solar flare on the Sun, in most cases using the identification given in each of the data sources. In many cases, there were multiple flares on the Sun, all of which may have released particles associated with the aggregate particle event observed at the Earth. There were two types of sequences of activity, the most common being multiple particle events associated with multiple flares from the same active region such as the events in July 1959, November 1960, and August 1972. The other type of activity sequence occurs when different regions on the Sun each produce copious solar particles.

A S U M M A R Y OF MAJOR SOLAR PROTON EVENTS 313
2O
w
~ w
~ ,o Z O
CYCLE 19 C Y C L E 2 0 C Y C L E 21
2 0 0 -
IE 180 -
D 160 - Z
I.- o 140 -
O3 z 120 - :D
z I 0 0 -
8 0 -
6 0 - Z 0
4 0 - i
- 2 0 -
r
I
I I
I IO
JL I I I I 5 I o
Y E A R S FROM S U N S P O T M I N I M U M
I I I I 5 I0
i I
Fig. 7. The number of significant discrete solar proton events for each 12-month period after solar minimum (top) and the 12-month mean sunspot number for the corresponding period (bottom) for the past
three solar cycles.
We have calculated the number of discrete solar proton producing regions associated with proton events detected at the Earth for each of the last three solar cycles (i.e.,
multiple events from the same region contributed to only one episode and was only counted once). The results are included in Table II. From these calculations we find that
TABLE II
Summary of solar proton events for solar cycles 19, 20, and 21
Cycle Start a End No. of No. of No. of Solar cycle months discrete discrete integrated in cycle proton proton solar proton fluence
events producing regions > 10 MeV > 30 MeV
19 May1954 Oct. 1964 126 65 47 7.2 • 101~ 1.8 • 101~ 20 Nov. 1964 June 1976 140 72 56 2.2 • 101~ 6.9 • 109 21 July 1976 Sept. 1986 123 81 57 1.8 • 101~ 2.8 • 109
a The start &each solar cycle was selected as the month after the minimum in the smoothed sunspot number (McKinnou, 1987).
314 M. A, SHEA AND D. F. SMART
~ > ' LuO~ E) - -
z z t./)
~. Q.. u b
o
30
2 0
I0
[-
hi
"[" I-- ~o~ z~ o ~ ~ z
,0o[- 140~-
120~-
I00~
8 0
6O
4O
2O
0 i !
I I l I 5 I0
YEARS FROM SUNSPOT MINIMUM
Fig. 8. The summation of significant discrete solar proton events for cycles 19-21 (top) and the corre- sponding 12-month average sunspot number (bottom). The data are organized in 12-month periods beginning
with the month after statistically smoothed sunspot minimum.
for each of the last three solar cycles at least 22 % of the significant solar proton events
observed at the Earth are from solar regions that produce at least two or more discrete
proton events.
5.3. F L U X VS FLUENCE
In Table I we have included values of flux and fluence with a source reference. It is possible that the terms 'solar particle flux' and 'solar particle fluence' may be confused. Particle physicists usually refer to the peak flux observed in a specific channel of a solar particle detector. This can be either an integral flux above a specified energy level, in units of particles (cm z s ster)- ~ or a differential measurement which specifies the flux at a specific energy in units of particles (crees ster MeV)-~. Individual events are usually compared using identical channels. The peak flux specifies the maximum particle
I
O "
A SUMMARY OF MAJOR SOLAR PROTON EVENTS
CYCLE 19
315
CYCLE 20
z w 0 ~ > [a3 z 0
CYCLE 21
J I 0 0 '
[a. 0 11r ill m
CYCLES 19-21 z 3 0 -
ill h
f
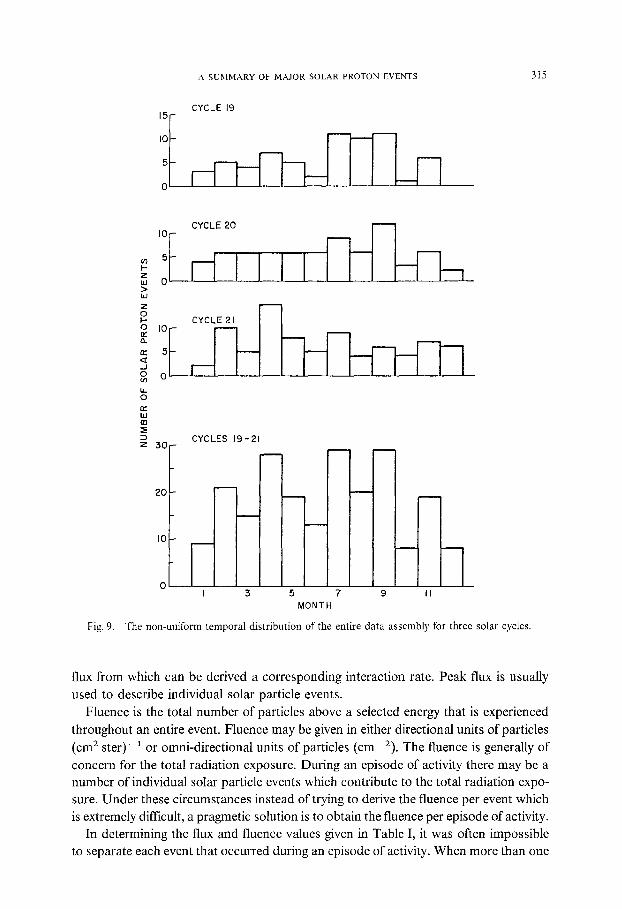
Fig. 9.
20
I0
I I 3 5
MONTH 7 9 II
T h e n o n - u n i f o r m t e m p o r a l d i s t r i b u t i o n o f t he en t i r e d a t a a s s e m b l y for t h r e e so l a r cycles .
flux from which can be derived a corresponding interaction rate. Peak flux is usually
used to describe individual solar particle events.
Fluence is the total number of particles above a selected energy that is experienced
throughout an entire event. Fluence may be given in either directional units of particles
(cm 2 ster) - ~ or omni-directional units of particles ( c m - 2). The fluence is generally of
concern for the total radiation exposure. During an episode of activity there may be a number of individual solar particle events which contribute to the total radiation expo- sure. Under these circumstances instead of trying to derive the fluence per event which is extremely difficult, a pragmetic solution is to obtain the fluence per episode of activity.
In determining the flux and fluence values given in Table I, it was often impossible to separate each event that occurred during an episode of activity. When more than one

316 I,,l. A. SHEA AND D. F. SMART
distinct particle increase could be discerned in the records, a peak flux associated with each increase is given. However, the fluence values usually include the entire sequence of activity.
5.4. D A T A A R T I F A C T S
A careful examination of the data acquisition techniques reveals artifacts that have been introduced in the data sets. In the identification of proton events from an interpretation of ionospheric data there are at least two pronounced seasonal trends. The riometer is most sensitive to the sunlight polar ionosphere (its night-time response is about one order of magnitude less sensitive), and since most polar ionospheric observing sites are in the northern hemisphere (particularly during the 19th solar cycle), there is a distinct northern hemisphere bias in the ionospheric data set with more events reported in the northern hemisphere summer than the northern hemisphere winter. The ionosphere also has a strong response to geomagnetic activity which has a statistically significant peak during the equinox (Allen, 1982). As shown in Figure 9, these two effects combine to give a very non-uniform temporal distribution of the data assembly.
The small number of events over the past 33 years results in a severe limitation for meaningful statistical studies. In spite of its limitations, this data base or selected portion of the data base has been analyzed in a number of different ways to develop statistics and models of solar particle event frequency, magnitude and fluence (King, 1974; Stassinopoulos and King, 1974; Stassinopoulos, 1975; Chenette and Dietrich, 1984; Feynman et al., 1989). The so called NASA model (Stassinopoulos, 1975) is presently the contemporary standard against which other work is compared. In the past few years this model has suffered a two-pronged and contradictory attack as being too limited and not truly representative of what can occur. One argument is that the model predicts too high because very large fluence events were not observed by Earth-orbiting satellites during solar cycle 21 (Chenette and Dietrich, 1984); a second argument is that the model predicts too low since it does not properly include the possibility that very large fluence events could, and historically have occurred (Feynman et al., 1989).
The fluence data base contains a detection technique artifact that essentially cannot be removed. The tremendous advances in detector technology are such that satellite sensors now routinely detect events that were far below the detection threshold even 15 years ago. In the compilation of the events in Table I we have tried to compensate for this effect by selecting a flux threshold that could be applied uniformly over three solar cycles. In the derivation of the proton flux and fluence data from ionospheric measure- ments, a number of exponential forms were utilized to model the event. (For examples, see McDonald, 1963; Bailey, 1964, and Webber, 1963.) The utilization of these exponential forms introduces apparent systematic behavior into some of the derived particle fiuence data for solar cycle 19. When the extra-magnetospheric satellite sensed solar proton event data for solar cycle 20 (such as NSSDC data set 69-053A-07C) are summed over event intervals, similar systematic patterns are not found. Using the fluence data base we note a definite difference between solar cycle 19 and the other two cycles. The 19th solar cycle sample is deficient in 'small event' identification; never-

A SUMMARY OF MAJOR SOLAR PROTON EVENTS 317
theless this cycle contains the largest solar particle events and event fluences. The analysis by Feynman et al. (1989) concludes that all of the fluence data for the three solar cycles combine to form a continuous log-normal distribution that is representative of solar particle history. In contract, the analyses of Stassinopoulos (1975) and Chenette and Dietrich (1984), which do not include the 19th cycle events, find a smaller distribu- tion function for which the very large events are not part of the 'expected' log-normal distribution; they calculate independently the probability of a very large event.
Table II presents the solar cycle summed fluences at energies greater than 10 and 30 MeV from the data contained in Table I. These can be interpreted as showing a systematic downward trend; however, this trend is not reflected in the maximum sunspot number for the respective cycles. The solar cycle 20 fluence was dominated by one very large event; one additional very large solar particle episode at the Earth during solar cycle 21 might have contributed enough flux to equalize the fluences for the 20th and 21st cycles.
6. Extremely Large Events
Solar particle scientists who were active during the 19th solar cycle readily remember the major events that occurred, particularly those of 23 February, 1956, July 1959, and November 1960. (See McDonald, 1963, for a summary of the early solar proton events.) Scientists who started their careers after these events remember the August 1972 sequence as the largest event. The three previously mentioned events in the 19th cycle were each as significant as the August 1972 sequence.
As mentioned previously the flux of solar particles detected at the Earth for any event is a function of the location of the associated flare on the Sun. The event of 23 February 1956 had a large flux of relativistic solar particles that lasted for about 24 hours. In contrast, the events of July 1959 and August 1972 contained large fluences of lower energy particles that were present for several days. The 1956 flare occurred at 80 ~ west, near the favorable propagation path. The initial flares of the 1959 and 1972 episodes of activity were on the eastern side of the solar disk; the active region continued to produce major flares throughout its central meridian passage. Smart and Shea (1989b) have argued that the 1959 and 1972 events were the result of a sequence of major flares, particle events, and solar-generated interplanetary shock structures which re- accelerated the existing solar particle population to an extraordinary solar particle population.
The re-acceleration of the existing solar particle flux in space by interplanetary shocks is more common than generally appreciated. In the more distant heliosphere beyond the orbit of the Earth, Sarris, Decker, and Krimigis (1985) have noted that the largest solar particle flux observations are at spatial locations west of the flare radial direction (i.e., the solar flare was east of the Sun-spacecraft meridian). Cane (1988) and Cane, Reames, and von Rosenvinge (1988) have argued that this is also a general case for events at 1 AU, and that the shock acceleration phenomena is responsible for the time-intensity profile observed at the Earth from eastern hemisphere source solar particle events.

318 M. A. SHEA AND D. F. SMART
7. Solar Proton Event Archeology
It is tempting to try to use our limited data base to extrapolate back through the past century. Svestka (1966) has interpreted vertical ionospheric sounding data during polar cap absorption events and compiled a list of PCA events probably associated with solar proton events between 1938 and 1955. In this work, he comments on the validity of each event, possible associated source solar flare, and inferred solar flares.
There are naturally created records that can be utilized to investigate the historical record created by solar proton events. One remote proxy is the association of historical auroral events; however, the low latitude aurora is always associated with geomagnetic activity and is a magnetospheric particle phenomena. Using tree ring analyses, Damon (1973) and Fan et al. (1985) reported an increase in the 14C content in 1943 tree rings, which they associated with the 1942 ground-level events. The bombardment of lunar material and meteorites by solar protons creates radionuclides in the material that can be recovered and analyzed. Similar processes occur in the Earth's atmosphere and these radionuclides precipitate out of the atmosphere and are preserved in polar ice. In addition, the proton flux impacting in the Earth's atmosphere catalyze chemical reactions resulting in the formation of NO x ions which attach to nuclides and may precipitate out and be preserved in polar ice (Zeller and Parker, 1981). Although the analysis of meteorites and returned lunar samples is a more mature technology than the more recent analysis of polar ice cores (Dreschhoff and Zeller, 1989) for the determi- nation of historical proton events, each of these techniques can be used to improve our knowledge of solar proton event occurrence prior to the mid 20th century.
The question of 'How large an event can the Sun produce?' is of interest not only for historic research but also for planning and protection of future space missions. Using recent records, Goswami et al. (1988) have found that the mean solar proton fluence values for the last three solar cycles agreed fairly well with the fluence values deduced from solar flare proton and alpha particle induced radioactivity in lunar samples. Reedy (1977) and Reedy and Marti (1990), using depth-versus-activity profiles of short-lived radioactivities (for the recent years) and long-lived radionuclides (to infer solar-proton fluxes averaged over several time periods in the past), have found that the average solar proton fluences for the last one to ten million years deduced from these records are similar to the fluences obtained for the recent solar cycles. Finally, Lingenfelter and Hudson (1980) have argued that the analysis of returned lunar samples and co smogenic isotopes indicate that events from our Sun with fluence greater than 10 l~ protons (cm- 2) with energies > 10 MeV are very rare.
From an inspection of Table I we find three sequences of events (July 1959, Novem- ber 1960, and August 1972) where the 10 MeV proton fluence exceeded 10 m protons (cm- 2). From our knowledge of the ground-level events detected by ionization cham- bers it seems likely that the events of 28 February-7 March, 1942 and 25 July, 1946 might also have had fluences of the order of 10 l~ protons with energies > 10 MeV. If the above assumption is correct then there would have been at least one event (or sequence of events) with 10 MeV fluences greater than 10 l~ (cm-2) in each of solar

A SUMMARY OF M~JOR SOLAR PROfON EVENTS 319
cycles 17-20. Although an event of this same magnitude was not recorded at the Earth during the 21 st solar cycle, there were a total of seven events with 10 MeV fluences above 109 (cm -2) during this cycle, compared to six events in the 20th cycle. It is entirely possible that had the Earth been at a slightly different location with respect to the solar flares associated with the seven largest events of the 21st solar cycle then the solar particle fluence at the Earth might have met the 10t~ (cm -2) threshold. Therefore, the assumption that the Sun will produce at least one major solar particle event (with fluences > 10 ~~ each cycle having a sunspot maximum number of at least 100 appears completely reasonable.
8. Concluding Remarks
We have tried to summarize the solar particle data available from the past three solar cycles in an unbiased manner and point out the limitations, deficiencies and pitfalls inherent in an analysis of this data base. Although the data base is limited and episodes of activity dominate the occurrences of solar particle events, there are certain charac- teristics of the observed proton event distribution found by all investigators. The large flux and fluence events of the 19th solar cycle were not totally repeated in the 20th or 21st solar cycles. Nevertheless, we have shown that proton events with a fluence of approximately 10 ~~ particles (cm- 2) have probably occurred during the past five solar cycles.
References
Adams, N.: 1950, Phil. Mag. 41, 503. Adams, N. and Braddick, H. J. J.: 1950, Phil. Mag. 41, 505. Akiniyan, S. T., Brazilevskaya, G. A., Ishkov, V. N., Miroshnichenko, L. I., Nazarova, M. N., Pereyaslova,
I. K., Pogodin, I. E., Sladkova, A. I., Ulyev, V. A.. and Chektok, (. M.: 1982, Catalog of Solar Ptvton Events, 1970-1979, published by the Academy of Sciences of the USSR, Scientific Council on Solar Terrestrial Physics, Moscow (in Russian).
Allen, J. H.: 1982, in Proceedings of a Workshop on Satellite Drag, NOAA, ERE, Boulder, Colorado, p. 114. Allen, J. H.: 1987, Unpublished data set, available from NGCD, NOAA, Boulder, Colorado. Bailey, D. K.: 1964, Planetary Space Sci. 12, 495. Bremean, H. H. and Stone, E. C.: 1985, Astrophys. J. 299, L57. Carmichael, H.: 1968, in Annals of the IQSY, l, MIT Press, Cambridge, p. 178. Cane, H. V.: 1988, J. Geophys. Res. 93, 1. Cane, H. V., Reames, D. V., and von Rosenvinge, T. T.: 1988, J. Geophys. Res. 93, 9555. Chenette, D. L. and Dietrich, W. F.: 1984, IEEE Trans. on Nucl. Sei. NS-31, 1217. Chupp, E. L.: 1988, Phys. Seripta TI8, 5. Cliver, E. W., Kahler, S. W., Cane, H. V., Koomen, M. J., Michels, D. J., and Sheeley, N. R., Jr.: 1983, Solar
Plo,s. 89, 181. Cook, W. R., Stone, E. C., and VoW, R. E.: 1984, Astrophys. J. 297, 827. Damon. P. E.: 1973, Earth Planetary Sci. Letters 20, 300. Dodson-Prince, H. W., Hedeman, E. R., and Mohler, O. D.: 1977, Survey" and Comparison of Solar Activity
and Energetic Particle Emission in 1970, AFGL-TR-77-0222, Air Force Geophysics Laboratory, Hanscom Air Force Base, Massachusetts.
Dreschhoff, G. A. M. and Zeller, E.J.: 1990, Solar Phys. 127, 333 (this issue). Elliot, H.: 1985, in Y. Sekido and H. Elliot (eds.), Early Histoo" of Cosmic Ray Studies, Astrophysics and
Space Science Library, 118, D. Reidel PuN. Co., Dordrecht, Holland, p. 375.

320 r~.l. A. SHEA AND D. F. SMART
Fan, C. Y. Chen, T. M., Yun, S. X., and Dai, K. M.: 1985, Proc. 19th Int. Cosmic Ray Conf. 5, 371. Feynman, J., Armstrong, T., Dao-Gilbner, L., and Silverman, S.: 1989, J. Spacecraft and Rockets (submitted). Forbush, S. E.: 1946, Phys. Rev. 70, 771. Forbush, S. E., Stinchcomb, T. D., and Schein, M.: 1950, Phys. Rev. 78, 501. Goswami, J. N., McGuire, R. E., Reedy, R. C., Lal, D., and Jha, R.: 1988, J. Geophys. Res. 93, 7195. Kahler. S.W.. Cliver, E.W., Cane, H. V., McGuire, R.E., Stone, R.G., and Sheeley, N. R., Jr.: 1986,
Astrophys. J. 302, 504. King, J. H.: 1974, J. Spacecraft and Rockets 11,401. Krimigis, S. M. and Armstrong, T.: 1988, NSSDC Data Set 73-078A-08G, NASA, Greenbelt, MD. Lin, R. P.: 1987, Rev. Geophys. 25, 676. Lingenfelter. R. E. and Hudson, H. S.: 1980, in R. O. Pepin, J. A. Eddy, and R. B. Merrill (eds.), Proc. Colr
Ancient Sun, Pergamon Press, New York, p. 69. Little, C. G. and Leiubach, H.: 1959, Proc. IRE 47(2), 315. Lovell, B.: 1987, Quart. J. Roy. Astron. Soc. 28, 1. Malitson, H. H.: 1963, in F. B. McDonald (ed.), Solar Proton Manual, NASA TR R-169, September 1963,
National Aeronautics and Space Administration, Washington, D.C., p. 109. Mason. G. M.: 1987, Rev. Geophys. 25, 685. Mason, G. M., Fisk, L. A., Hovestadt, D., and Gloeckler, G.: 1980, Aso'ophys. J. 239, 1070. McCracken, K. G., Rao, U. R., Bukata, R. P., and Keath, E. P.: 1971, Solar Phys. 18, 100. McDonald, F. B. (ed.): 1963, Solar Proton Manual, NASA TR R-169, September 1963, National Aeronautics
and Space Administration, Washington, D.C. McGuire, R. E., van Hollebeke, M. A. I., and Lal, N.: Proc. 18th Int. Cosmic Ray Conference, Cotference
Papers 10, 353. McGuire, R. E., yon Rosenvinge, T. T., and McDonald, F. B.: 1986, Aso'ophys. J. 301,938. McKinnon, J. A.: 1987, Sunspot Numbers 1610-1986 Based on the Sunspot ActiviO; in the Years 1610-1960,
UAG-95, NOAA, Nat. Geophys. Data. Cntr., Boulder, Colorado. Nicolet, M. (ed.): 1959, Ann. I G Y IIA, Pergamon Press, London, p. 361. Reedy, R. C.: 1977, Proc. Lunar Sci. Conf. 8th, p. 825. Reedy, R. C. aud Marti, K.: 1990, in The Sun in Time, Univ. of Arizona Press, Tucson, AZ (in press). Reinhard, R., Roelof, E. C., and Gold, R. E.: 1986, in R. G. Marsden (ed.), The Sun and the Heliosphere #~
Three Dimensions, Proceedings of the XIX ESLAB Symposium, Astrophysics and Space Science Library, 123, D. Reidel Publ. Co., Dordrecht, Holland, p. 123.
Sarris, E. T., Decker, R. B., and Krimigis, S.M.: 1985, J. Geophys. Res. 90, 3961. Shea, M. A. and Smart, D.F.: 1977, in Solar-Terrestrial Physics and Meteorology. lu Document H,
SCOSTEP Secretariat, Nat. Academy of Sei., Washington, D.C., p. 119. Shea, M. A. arid Smart, D.F.: 1979, in Solar-Terrestrial Physics and Meteorology, Working Document IH,
SCOSTEP Secretariat, Nat. Academy of Sci., Washington, D.C., p. 109. Shea, M. A. and Smart. D. F.: 1986, in V. E. Stepanov and V. N. Obridko (eds.), Solar Maximum AnaO,sis,
VSN Science Press, p. 309, Simpson. J. A.: 1957, Ann. I G Y 4, 374. Smart, D. F. and Shea, M. A.: 1979, in R. F. Donnelly (ed.), Solar-Terrestrial Predictions Proceedings, U.S.
Department of Commerce. NOAA/ERL, Vol. 1, p. 406. Smart, D. F. and Shea, M. A.: 1985, in A. S. Jursa (ed.), Handbook of Geophysics and Space Environment,
Chapter 6, Air Force Geophysics Laboratory, Bedford, MA. Smart, D. F. and Shea, M. A.: 1989a, Adv. Space Res. 9(10), 281. Smart, D. F. and Shea, M. A.: 1989b, J. Spacecraft and Rockels 26, 403. Smart, D. F., Shea, M. A., Dodson, H. W., and Hedeman, E. R.: 1976, Space Res. XVI, 797. Solar-Geophysical Data: 1988, No. 530, Part II, NOAA, Nat. Geophys. Data. Cntr., Boulder, Colorado,
p. 72. Stassinopoulos, E. G.: 1975, SOLPRO : A Computer Code to Calculate Probabilistic Energetic Solar Proton
Fluences, NSSDC 75-11, NASA, Greenbelt, MD. Stassinopoulos, E. G. and King, J. H.: 1974, IEEE Trans. Aerospace and Electronic Systems AES-10. 424. Svestka, Z.: 1966, Bull. Astron. Inst. Czech. 17, 262. Svestka, Z. and Simon, P. (eds.): 1975, Catalog of Solar Proton Events 1955-1969, Astrophysics and Space
Science Library, Vol. 49, D. Reidel Publ. Co., Dordreeht, Holland. Van Hollebeke, M. A. I., Ma Sung, L. S., and McDonald, F. B.: 1975, Solar Phys. 41, 189. Webber, W. R.: 1963, All Evaluation of the Radiation Hazard Due to Solar Particle Events, Boeing Report
D2-90469. Zeller, E.J. and Parker, B. C.: 1981, Geophys. Res. Letters 8, 895.