a study on recommendation intention among malaysian private universities’ undergraduates
TRANSCRIPT
A study on recommendation intention among Malaysian private universities’ undergraduates
1 UC3F1301KMGT – TP025076 – Rahman Karimiyazdi
Acknowledgement
I would like to show my greatest gratitude to my research project supervisor, Dr. Benjamin Chan
Yin Fah for guiding me throughout the period of the research project. The words of advices for
looking from different aspects in my research project enabled me to understand the flow and the
requirements of the research project from beginning till end. Also, my heartfelt gratitude to him,
on his continuous guidance, supporting and giving encouragement to me in finalizing the
research project.
A study on recommendation intention among Malaysian private universities’ undergraduates
2 UC3F1301KMGT – TP025076 – Rahman Karimiyazdi
Abstract
The purpose of the study was to investigate the recommendation intention among Malaysian
private universities’ undergraduates and its association with course characteristic, learning
resources & facilities, lecturer performance, and student satisfaction. . Data for this study was
collected through self-administrative questionnaire, and distributed in A.P.U University. A total
of 100 questionnaires completed and collected. Hypotheses were tested to determine the level
significant of different variables on recommendation intention. Findings of study limited by the
number of respondents, area and location the study had covered, and the absence of other
methods to obtain results other than secondary research and questionnaire. This study is
important to the marketers to understand students’ recommendation intention. Marketer could
also make improvement and strengthen the selected variable to be more competitive.

A study on recommendation intention among Malaysian private universities’ undergraduates
3 UC3F1301KMGT – TP025076 – Rahman Karimiyazdi
Table of Contents
Acknowledgement ..................................................................................................................... 1
Abstract ...................................................................................................................................... 2
Table of Contents ..................................................................... Error! Bookmark not defined.
List of Figures ............................................................................................................................ 5
CHAPTER 1: INTRODUCTION TO THE STUDY ................................................................. 6
1.0 Research Title ...................................................................................................................... 6
1.1. Background of Study ......................................................................................................... 7
1.2. Marketing and Education .................................................................................................. 9
1.3. Privatization and Education ............................................................................................ 10
1.4. Problem Statement Definition ......................................................................................... 11
1.5. Research Objectives ......................................................................................................... 12
1.6. Frame Work...................................................................................................................... 12
1.7. Significance of Study ........................................................................................................ 13
1.8. Limitations of Study ......................................................................................................... 13
1.9. Definition of Terminology ............................................................................................... 14
1.10. Scope of Study ................................................................................................................ 15
CHAPTER 2: LITERATURE REVIEW ................................................................................. 16
2.0 Introduction ....................................................................................................................... 17
2.1. Course Characteristic ...................................................................................................... 17
2.2. Learning Resources and Facilities .................................................................................. 18
2.3. Lecturer Performance ...................................................................................................... 19
2.4 Student Satisfaction .......................................................................................................... 21
2.5 Recommendation Intention .............................................................................................. 22
2.6 Pervious Related Model or Theory .................................................................................. 23
CHAPTER 3: RESEARCH METHODOLOGY ..................................................................... 27
3.0 Introduction ....................................................................................................................... 28
3.1.Validity and Reliability ..................................................................................................... 28
3.2. Purposes of Study ............................................................................................................. 28
3.3. Qualitative and Quantitative Research Methods .......................................................... 29
3.4. Primary Data and Secondary Data ................................................................................ 29

A study on recommendation intention among Malaysian private universities’ undergraduates
4 UC3F1301KMGT – TP025076 – Rahman Karimiyazdi
3.5. Research Design................................................................................................................ 30
3.6. Framework of the Research Methodology ..................................................................... 30
3.7. Sampling ............................................................................................................................ 30
3.8. Data Collection Method ................................................................................................... 31
3.9. Document Analysis ........................................................................................................... 31
3.10. Summary ......................................................................................................................... 31
CHAPTER 4: PRESENTATION AND ANALYSIS .............................................................. 32
4.0. Introduction ...................................................................................................................... 33
4.1. Questionnaire’s Response Rate ....................................................................................... 34
4.2. Respondent’s Characteristics .......................................................................................... 35
4.3. Course Characteristic ...................................................................................................... 36
4.4. Learning Resources and Facilities .................................................................................. 40
4.5. Lecturer performance ...................................................................................................... 43
4.6. Student Satisfaction ......................................................................................................... 47
4.7. Recommendation Intention ............................................................................................. 49
CHAPTER 5: DATA HYPOTHESIS ....................................................................................... 51
5.1. Hypothesis Testing ........................................................................................................... 52
CHAPTER 6: CONCLUSION AND RECOMMENDATION ................................................ 56
6.0. Managerial Implication and Recommendation ............................................................. 57
6.1. Limitations ........................................................................................................................ 59
6.2. Further research ............................................................................................................... 60
7.0 REFRENCES ..................................................................................................................... 61
8.0APPENDICES…………………………………………………………………………….66
Appendix A: Project Log Sheet……………………………………………………….....
Appendix B: Project Specification Form (PSF)………………………………………….
Appendix C: Ethics Form…………………………………………………………………
Appendix D: Learning Contract Form…………………………………………………...
Appendix E: Gantt chart………………………………………………………………….
Appendix F: Sample Questionnaire……………………………………………………...
Appendix G: Questionnaire Collected……………………………………………………

A study on recommendation intention among Malaysian private universities’ undergraduates
5 UC3F1301KMGT – TP025076 – Rahman Karimiyazdi
List of Figures and Tables
Figure 1.1 Five Stages Model of the Consumer Buying Process (Kotler & Keller, 2012)……………….
7
Figure 1.2 A Model of the University Selection Process (Chapman, 1986)………………………………
9
Figure 1.3 Recommendation Intention among Malaysian private universities’ undergraduates.................
12
Figure 2.1 Model of lecture performance among public higher education institutions (Chan & Syuhaily,
2011)…………………………………………………………………………………………..
19
Figure 2.2 Model of Influences on Student College Choice (Chapman, 1986)………………………..….
24
Figure 2.3 University Selection Process (Litten, 1982)…………………………………………...............
25
Figure 2.4 A model of student satisfaction and perceived service quality in higher education
(Athiyaman, 1997)……………………………………………………………………………..
26
Figure 4.1 Questionnaire’s Response Rate……………………………………………………………….. 34
Figure 4.2 Distribution of Summation of Course Characteristic…………………………………………. 37
Figure 4.3 Distribution of Summation of Learning Resources and Facilities……………......................... 40
Figure 4.4 Distribution of Summation of Lecturer performance………………………………................. 44
Figure 4.5 Student Satisfaction Level…………………………………………………………………….. 47
Figure 4.6 Distribution of Summation of Student Satisfaction…………………………............................ 47
Figure 4.7 Student Recommendation Intention…………………………………………………............... 49
Figure 4.8 Distribution of Summation of Recommendation Intention……………………........................ 49
Figure 5.1 52
Figure 5.2 55
Table 1.4 Conceptual and Operational definitions of key terms……………………........................... 14
Table 4.1 Respondent’s Characteristic……………………………………………………………….. 35
Table 4.2 Course Characteristic……………………………………………………………………… 37
Table 4.3 Cross Tabulation – Total of Course Characteristic Category with Selected
Variable…….........................................................................................................................
38
Table 4.4 Learning Resources and Facilities 40
Table 4.5 Cross Tabulation – Total of Learning Resources and Facilities Category with Selected
Variable…………………………………………………………………………………….
41
Table 4.6 Lecturer performance……………………………………………………………………… 43
Table 4.7 Cross Tabulation – Total of Lecturer Performance Category with Selected Variable……. 45
Table 5.1 Model Summary…………………………………………………………………………… 54
Table 5.2 AVONA Analysis…………………………………………………………………………. 54
Table 5.3 Coefficients………………………………………………………………………………… 54
A study on recommendation intention among Malaysian private universities’ undergraduates
6 UC3F1301KMGT – TP025076 – Rahman Karimiyazdi
CHAPTER 1:
INTRODUCTION TO THE STUDY
A study on recommendation intention among Malaysian private universities’ undergraduates
7 UC3F1301KMGT – TP025076 – Rahman Karimiyazdi
1.0 Research Title
A study on recommendation intention among Malaysian private universities’ undergraduates
1.1. Background of Study
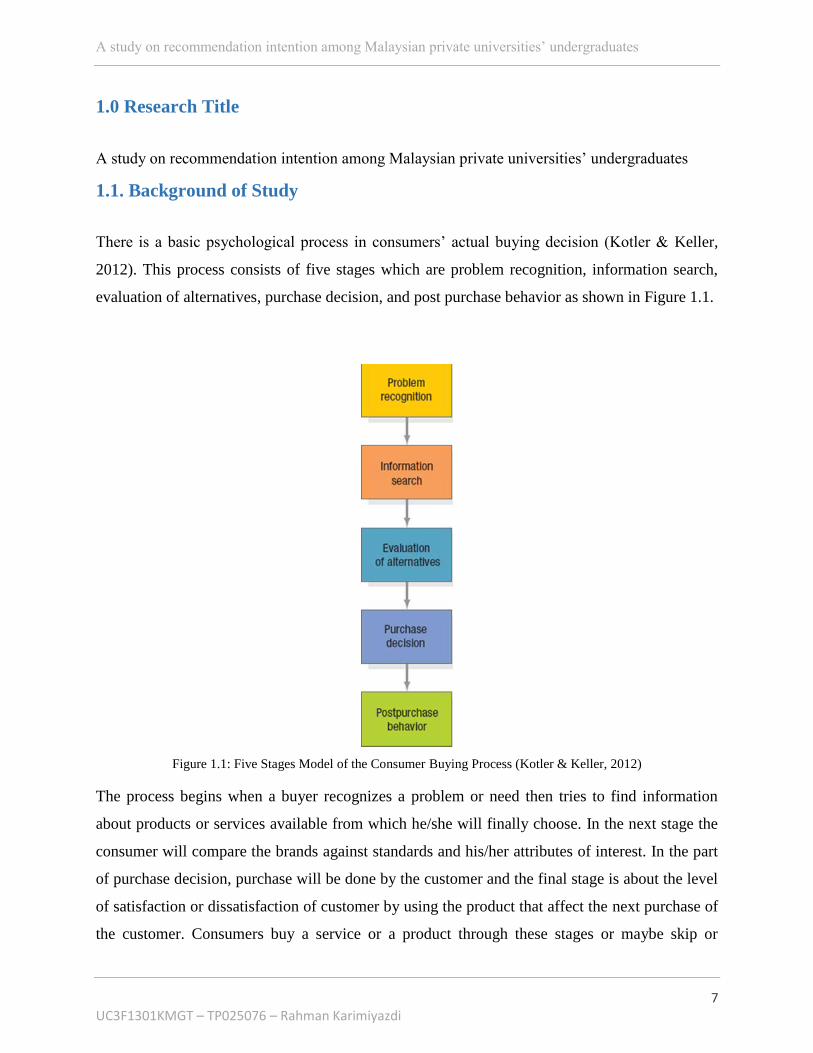
There is a basic psychological process in consumers’ actual buying decision (Kotler & Keller,
2012). This process consists of five stages which are problem recognition, information search,
evaluation of alternatives, purchase decision, and post purchase behavior as shown in Figure 1.1.
Figure 1.1: Five Stages Model of the Consumer Buying Process (Kotler & Keller, 2012)
The process begins when a buyer recognizes a problem or need then tries to find information
about products or services available from which he/she will finally choose. In the next stage the
consumer will compare the brands against standards and his/her attributes of interest. In the part
of purchase decision, purchase will be done by the customer and the final stage is about the level
of satisfaction or dissatisfaction of customer by using the product that affect the next purchase of
the customer. Consumers buy a service or a product through these stages or maybe skip or
A study on recommendation intention among Malaysian private universities’ undergraduates
8 UC3F1301KMGT – TP025076 – Rahman Karimiyazdi
reverse some of them. For example when a consumer buys his regular brand of soap, he goes
directly to purchase decision and skips information search and evaluation of alternative. But for
buying a complicated product such as a car, he/she passes all stages to reduce the risk and
mistake and make a better choice.
Students who intend to select a university or college basically pass these processes but it is a
little different. This is because in institutional services such as hospitals, universities, and
government it is not only the customers who select their services but also the institutions choose
their customers. For example, some Universities only accept students under specific terms and
select those who meet the selection criteria and likely to succeed within the study environment.
In such situations, students have to choose the universities that choose them (Brennan, 2001).
But universities which are market oriented consider and track the student criteria and behavior
for choosing a university. Brennan has gone on to the list the criteria in her discussion (see
discussion in chapter 2). There is also a behavioral theory that shows how students select a
university (Chapman, 1986). It consists of five components and shows the stages that student
move through to select a university. The stages are as follow: Pre-Search Behavior; Search
Behavior; Application Decision; Choice Decision; and, Matriculation Decision. Figure 1.2 shows
the stages.

A study on recommendation intention among Malaysian private universities’ undergraduates
9 UC3F1301KMGT – TP025076 – Rahman Karimiyazdi
Figure 1.2: A Model of the University Selection Process (Chapman, 1986)
1.2. Marketing and Education
There is a fierce debate over whether students are customers or consumers and universities
should do marketing activity or not. Holbrook (2005) stated that it is not acceptable and even
shameful to name students ‘customers’. Marketing in education resulted in concern and mistrust
towards educational institutions (Gibbs& Knapp, 2002). It causes universities become profit
center organization rather than education center organization (Gerald, 2008).
But the opposing side believes that marketing should involve in education. Marketing is also
practiced by non-profit organization and even in charities (Levy, 2006). Kirp (2003) questioned
that “Do teachers work for free? And where are the salaries they get coming from?” Moreover,
there is a similarity between educational institutions and companies. Students can be known as
consumers, teachers are producers, and educational systems are market (Marginson, 1997).
Today, consumer analysis, market research and segmentation have become more familiar and are
applied by educational institutions (Kenway, 1993). Students calculate the cost against benefits
when they want to decide to apply for higher education which is similar to the buying process for
purchasing a product or service (Pasternak, 2005). Furthermore, money for higher education
causes more ‘consumerist behavior’ by students and it is a major issue in the buying process for
many students (Maringe, 2006).

A study on recommendation intention among Malaysian private universities’ undergraduates
10 UC3F1301KMGT – TP025076 – Rahman Karimiyazdi
1.3. Privatization and Education
There are two sides about privatization in education. One side believes privatization is a serious
threat to the principles and values of national local systems of education (Chitty, 2009). Private
universities promote their interest and not Government interest. Private company only care
about profitability and market share. These values are not reconcilable for universities
(Camilleri, 2008).
The other side believes privatization in education causes regular development and improvement.
Privatization is the result of changing political, economic, and social patterns and educational
institutions need to assess the new situation and adapt accordingly (Gerald, 2008). For example,
in India, there is a perception that the services offered by private institutions, have more quality
in comparison those at public institutions. Moreover, in India private institutions not only service
the wealthy people, but also the poor (Tooley, 2007).

A study on recommendation intention among Malaysian private universities’ undergraduates
11 UC3F1301KMGT – TP025076 – Rahman Karimiyazdi
1.4. Problem Statement Definition
There is similarity between consumer buying process and student university selection process but
there is also a different in the end of the processes. University selection process ends with
matriculation decision stage but consumer buying process ends with post purchase behavior. It
means university selection process ends when a student pays money and registers in the
university and at this point, the job of marketer division of university ends. Universities
marketers are not concerned about post purchase behavior of students to see that they are
satisfied with services, or will they register in this university for their post graduate studies and
further more they will recommend their universities to others.
The question as to whether the students will recommend this university to others is also not given
consideration. In fact, consumer buying process never ends because marketers always track
customers’ post purchase behavior to see whether they will continue to buy companies’ products
or services, recommend it to others, and whether there is positive word of mouth about their
product or services. For example, data on car brand choice illustrates a strong connection
between being immensely satisfied with the last brand bought and intention to purchase the
brand again. One survey highlighted that 75% of Toyota customers were extremely satisfied and
about 75% planned to buy a Toyota again; 35% of Chevrolet buyers were very satisfied and
about 35% liked to purchase a Chevrolet again (Admin, 2006). Universities’ marketers also
should pay attention to post purchase behavior of students to reduce the dropout rate and increase
the retention of current students for their next level of study because the cost of catching a new
customer is estimated to be five times the cost of keeping an existing customer satisfied and
happy (Kotler & Keller, 2012).
Although there is some study that focus this area in Australia and UK but there is no information
about post purchase behavior of student who study/ied in Malaysia and there is a gap that will
covered in this study. Moreover there is no information that shows students will recommend
their universities to others or dissuade them.

A study on recommendation intention among Malaysian private universities’ undergraduates
12 UC3F1301KMGT – TP025076 – Rahman Karimiyazdi
1.5. Research Objectives
1. To determine the lecturer performance level among the private universities’ undergraduates
2. To determine the course characteristic among the private universities’ undergraduates
3. To determine learning resources and facilities among the private universities’ undergraduates
4. To determine the recommendation intention among the private universities’ undergraduates
5. To determine the student satisfaction among the private universities’ satisfaction
1.6. Frame Work
Figure 1.3: Recommendation Intention among Malaysian private universities’ undergraduates
Figure 1.3: Recommendation Intention among Malaysian private universities’ undergraduates
INPUT THROUGHPUT OUTPUT
1. Gender
2. Age
3. Nationality
4. GPA
5. Residence
Respondents’
characteristics
Course
Characteristic
Learning
Resources
& Facilities
Lecturer
Performance
Student
Satisfaction
Recommendation
Intention

A study on recommendation intention among Malaysian private universities’ undergraduates
13 UC3F1301KMGT – TP025076 – Rahman Karimiyazdi
1.7. Significance of Study
Today the number of universities is growing dramatically and there is a lot of competition
between the universities. If a university wants to be more competitive, it should focus on the post
purchase behavior of students. Marketers’ job does not end after selling the service to students.
Marketers must measure the level of students’ satisfaction during their studying and by
eliminating the service mistakes, increase students’ satisfaction. In this way, the universities
make the students loyal to their establishments and there is no need to invest a lot on attracting
new students. Loyal students will continue their studies to a higher level and also recommend the
university to friends and relations who intend to go to university. Thus, the universities’
marketing costs decrease in the long run. In result, they will be more competitive compared with
other rival universities.
1.8. Limitations of Study
The reliability of this study depends on the honesty and memory of the respondents in giving the
information needed. The findings from this exploratory study should not be generalized as whole
as it only consist one private university in Malaysia which is A.P.U. Time and cost constraints
are also part of the limitation for this study.

A study on recommendation intention among Malaysian private universities’ undergraduates
14 UC3F1301KMGT – TP025076 – Rahman Karimiyazdi
1.9. Definition of Terminology
The conceptual and operational definitions of key terms in this study are as follows:
Term/s Conceptual Definition Operational Definition
Course characteristic Course characteristics refer to
the level of difficulty which
perceived by students and
negatively affect the student
evaluation of the lecturer’s
performance (Chang, 2000;
Mukherji & Rustagi, 2008).
Course characteristic in this
study refers six items adopted
by Chan and Syuhaily (2011)
which was measured using
five point ordinal scales.
Learning resources and
facilities
Physical facilities refer to all
of the physical, tangible items
an institution makes available
to customers ranging from
brochures to the infrastructure
(Palmer, 2011).
Learning resources and
facilities in this study relate to
five items adopted by Hussain
and Bhamani (2012) which
was measured using five point
ordinal scales.
Lecturer performance Lecturer performance, which
is one of the elements in
student evaluations, greatly
affects the student satisfaction
which subsequently influences
student loyalty and university
image (Helgesen and Nesset,
2007 cited in Bowden and
Alessandro 2011).
Lecturer performance in this
study relate to 20 items
adopted by Chan and Syuhaily
(2011) which was measured
using five point ordinal scales.
Student satisfaction Student satisfaction refers to a
student’s feelings of pleasure
or disappointed after his/her
subjective evaluation of an
education service (Oliver &
Desarbo, 1989).
Student satisfaction in this
study refers to a self-created,
single measured item by the
author which using five point
ordinal scales.
Recommendation
intention
Refers to the post purchase
behavior of satisfied or
delighted customer (Kotler
and keller, 2012)
Recommendation intention in
this study refers to a self-
created, single measured item
by the author which using five
point ordinal scales.

A study on recommendation intention among Malaysian private universities’ undergraduates
15 UC3F1301KMGT – TP025076 – Rahman Karimiyazdi
Table 1.4: Conceptual and Operational definitions of key terms
1.10. Scope of Study
This assignment focuses on degree students of a private university (A.P.U) in Kuala Lumpur
Malaysia. Because of the time and cost constraints, it is not feasible to publish the questionnaires
in other private universities.

A study on recommendation intention among Malaysian private universities’ undergraduates
16 UC3F1301KMGT – TP025076 – Rahman Karimiyazdi
CHAPTER 2:
LITERATURE REVIEW
A study on recommendation intention among Malaysian private universities’ undergraduates
17 UC3F1301KMGT – TP025076 – Rahman Karimiyazdi
2.0 Introduction
In this chapter, some relevant literatures related to this topic will be presented. The chapter will
be divided into several subtopics, namely: course characteristic, learning resources and facilities,
lecturer performance, student satisfaction, recommendation intention. Beside that previous model
related with students’ recommendation intention preferences will be presented in section 2.6.
2.1. Course Characteristic
In a study that conducted by Weimer (2009) there are four course characteristics: 1) how much
the assignments and testing requirements define clearly; 2) convenience of class location and
time; 3) the accessibility and helpfulness of instructor; 4) relevance of course subjects to life
skills and job goals. In higher education poor course curriculum plan lead to poor quality (Kohn,
1993). Higher education institutions intend to equip students with essential skills such as
thinking and communication skills and encourage independent learning and creativity (Prabhu
and Ramarapu, 1994). Global satisfaction in a university comes from students’ evaluation of
course quality and other curriculum related factors (Browne, 1998 cited in Elliot and Shin,
2010).
A study on recommendation intention among Malaysian private universities’ undergraduates
18 UC3F1301KMGT – TP025076 – Rahman Karimiyazdi
2.2. Learning Resources and Facilities
Learning resources and facilities of university have significant effect on students’ satisfaction.
Out dated teaching and learning facilities and poorly lecture and library buildings result in
decline of quality and are unable to meet the needs of student learning (Ndirangu and Udoto,
2010). Yurko (2005) stated “space quality is a function of an educational facility”. For example,
Classrooms’ size, comfort and cleanliness, welcoming atmosphere, availability of natural
lighting of class room. Educational buildings should have learning space that support the
learning process and can fit for the purpose (Abend, 2006).
Learning resources and facilities greatly affect the undergraduate student to choose a university.
Over two years Price et al (2003 cited in Douglas and Barnes 2006) surveyed a number of
universities and determined a university’s facilities such as the quality of library facilities,
availability of computers, and availability of quiet areas are top reasons for a student to decide to
enroll a university. In the other study by Sohail and Shaikh (2004) Saudi Arabian students of
King Fahad University expressed classrooms, lighting, layout, physical environment, and
appearance of building and grounds significantly affect their perception of university.
In a UK university, IT facilities have ranked by the students as the most important items which
show the importance of Internet, hardware, and software for doing research, coursework
assignments and dissertation. Furthermore, it shows students ranked low ancillary services such
as catering facilities, vending machine, and decoration of lecture and tutorial facilities (Douglas
and Barnes, 2006).

A study on recommendation intention among Malaysian private universities’ undergraduates
19 UC3F1301KMGT – TP025076 – Rahman Karimiyazdi
2.3. Lecturer Performance
In evaluating the performance of lecturer, students’ suggestions and ideas is beneficial as a
supervisory agent and they should be used as a data source in the performance evaluating of a
lecturer (Gul, 2010). The quantity and quality of lecturers affect the students’ satisfaction.
Students desire to know how to motivate themselves to study and achieve success in the class
and not only to get a good mark in exam (Bembenutty, 2009). Low job satisfaction of lecturers
affects the lecturers’ performance negatively and consequently dissatisfies the students
(Gumuseli, 2002 cited in Gul, 2010).
Lecturer’s characteristics also affect the lecturer performance evaluation by the students. For
example, students like those lecturers who have a good sense of humor, are friendly and
concerned about their students (Magno & Sembrano, 2008; cited in Chan, 2012). Moreover, the
findings from the study that conducted by Chan & Syuhaily (2012) indicate that course
characteristics, tutorial characteristic and lecturer characteristics affected on lecturers
performance which causes improvement of students’ satisfaction, loyalty, and university image.
Figure 2.1 Model of lecture performance among public higher education institutions (Chan & Syuhaily, 2011)

A study on recommendation intention among Malaysian private universities’ undergraduates
20 UC3F1301KMGT – TP025076 – Rahman Karimiyazdi
There is possible source of bias in students’ evaluation of lecturers’ performance. Students’
characteristics such as age, ethnicity, gender, and expected grade in the subject also affect the
student evaluation of teaching (Worthington, 2002). Strict marking by a lecturer caused students
to rate the lecturer lower even in unrelated areas such as attitude to students (Chacko, 1983).
Wachtel (1998) stated “students with high expectations and high experiences give higher ratings
than those with low expectations and high experiences or with low experiences”. Furthermore,
there is a relationship between class size and teaching appraisal and teachers of relatively small
and relatively large classes got better ratings (Feldman, 1984 cited in Worthington, 2002).
Students who satisfied by a lecturer performance like to attend lecture which presented by the
same lecturer or choose another course or module by him/her (Banwet and Datta, 2003 cited in
Douglas and Barnes, 2006). In the other word, students’ willingness to re-attend and recommend
lectures depends on their perceptions of quality and the satisfaction they gained from previous
lecturers.

A study on recommendation intention among Malaysian private universities’ undergraduates
21 UC3F1301KMGT – TP025076 – Rahman Karimiyazdi
2.4 Student Satisfaction
Customer satisfaction is a vague concept because its manifestations differ from one person to
another and from one product to another. Customer satisfaction depends on several factors such
as psychological variables, personal beliefs, and attitudes which affect the customer satisfaction
(Ajzen and Fishbein, 1980 cited in Munteanu, et al., 2010). That’s why the evaluation of people
is different towards the same service or product. Student satisfaction is evaluation of educational
experience based on difference between the earlier expectation and the perceived performance after
passing through the educational cycle (Munteanu, et al., 2010). Student satisfaction defines as the
favorability of students’ assessment of education service based on experience associated with
education and life campus (Oliver & Desarbo, 1989). It means the student’s judgment about the
difference between what he/she expected of the service (expectations) and what was received
(perceived performance). Therefore, if the perceived performance is less than expectations, the
student is dissatisfied; if it matches expectations the student is satisfied and if it exceeds
expectations the student is delighted. Services are delivered to people by people and there is a
contact time between them. Carlzon (1989, cited in Douglas and Barnes, 2006) called this
contact time “moments of truth” which can improve or mar a university’s image (Banwet and
Datta, 2003 cited in Douglas and Barnes, 2006). In order to satisfy student with the service, all
staff of a university should follow the principles of customer service, whether they are front line
contact employee such as lecturers and admin staff or non-contact employee such as managers
(Gold, 2001). Today, student satisfaction is a highly significant indicator of the quality of
teaching performance and necessary measure of the education service (Ramsden, 1991).
Many students are satisfied with their curriculum but less pleased with the support services such
as job consultation and academic advising (Kotler and Fox, 1995 cited in Thomas, 2011).
Although a university’s physical facilities affect the students’ choice (Price, 2003) but the most
important factor that result in satisfaction or dissatisfaction is the quality of teaching and learning
(Douglas and Barnes, 2006). Student satisfaction positively affects the student loyalty through
A study on recommendation intention among Malaysian private universities’ undergraduates
22 UC3F1301KMGT – TP025076 – Rahman Karimiyazdi
positive recommendation (Mavondo 2004), reduce cost and increase revenue (Shah, 2009 cited
in Bowden and Alessandro, 2011).
2.5 Recommendation Intention
Customers who are satisfied or delighted by the product or service of a company, remain loyal to
the company, keep buying, and will talk favorably about it and spread positive word of mouth
and recommend it to others (Kotler and Keller, 2012). Satisfaction has positive and profound
effect on loyalty which results in positive recommendation and continuous student university
relationship (Hennig-Thurau et al. 2001; Shah 2009; Helgesen & Nesset 2007 cited in Moore,
Hwa, and Everson, 2012). Post purchase behavior of loyal student after graduation includes some
activities such as alumni membership, donation, and positive world of mouth communication
(Marzo-Navarro, Pedraja, and Rivera, 2005).
High amount of customer loyalty result in reduction in marketing cost, increase in market share,
and consumer resistance to competitor strategies (Bowden and Alessandro, 2011) that is why in
higher education, student loyalty has got increasing attention (Carvalho & de Oliveira Mota
2010; Arnett,German & Hunt 2003; Hennig-Thurau, Langer & Hansen, 2001 cited in Bowden
and Alessandro, 2011). In prior studies, several factors have been found by previous researchers
that determine the student loyalty which includes institutional reputation, facilities, social
interaction, service quality, image, satisfaction, and trust. Mavondo (2004) stated that high level
of student loyalty result in repeat purchase through continuing education and positive
recommendation. Bowden and Alessandro (2011) surveyed students in Australia and found that
student satisfaction is positively and directly in coloration with student loyalty.

A study on recommendation intention among Malaysian private universities’ undergraduates
23 UC3F1301KMGT – TP025076 – Rahman Karimiyazdi
2.6 Pervious Related Model or Theory
Today, Student retention in universities which are facing cut-throat competition is so important.
In order to iron out this problem, universities start to use marketing orientation (Thomas &
Cunningham 2009; Mansfield & Warwick 2006; Helgesen 2008 cited in Bowden and
Alessandro, 2011). Students should be known as a customer in university because they are highly
active participants in service exchanges (Yeo, 2009).
There is a very instance competition between companies in different industries such as
automobile, air plane, mobile phone, apparel, fast food and even companies that provide service
such as, air lines, hotel, search engine, soft wares, and education service. Keeping customer loyal
to a company and in result having more market share is the most important goal of each
company. Customer centered firms constantly monitor customer satisfaction. They measure how
well they treat customers and recognize the factors that shape satisfaction. If the performance of
company cannot meet the customer expectations the customer is dissatisfied. If it meets the
expectations the customer is satisfied and if it exceeds expectations the customer is delighted.
Customers who are satisfied and delighted stay loyal to the company, buy more products or
services of company, are less price sensitive, and talk favorably to others about company and act
as an external sale force for a company (Olaru, Purchase, and Peterson, 2008).
Students are the customers of universities. They buy education service from universities. If a
university wants to keep students loyal, it should deliver all the value that promised and monitor
the level of students’ satisfaction to understand whether they are satisfied or dissatisfied by their
service. Universities should know the students criteria and process to choose a university and
their post purchase behavior.
A study on recommendation intention among Malaysian private universities’ undergraduates
24 UC3F1301KMGT – TP025076 – Rahman Karimiyazdi
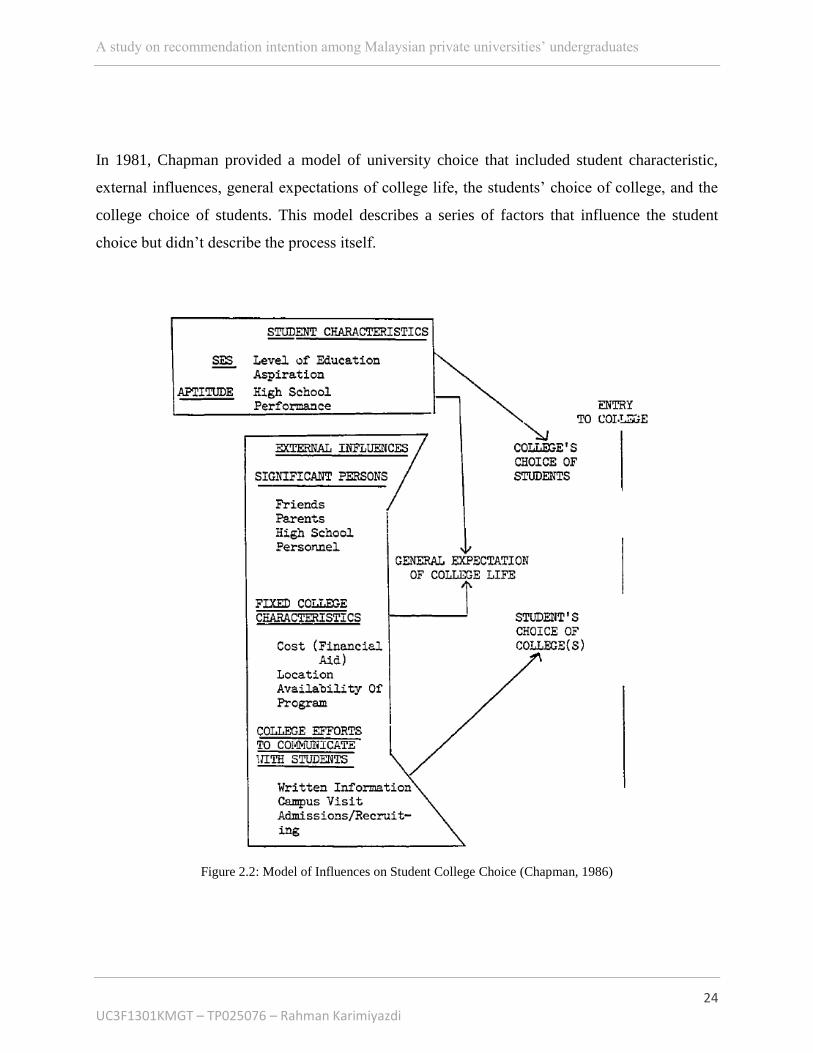
In 1981, Chapman provided a model of university choice that included student characteristic,
external influences, general expectations of college life, the students’ choice of college, and the
college choice of students. This model describes a series of factors that influence the student
choice but didn’t describe the process itself.
Figure 2.2: Model of Influences on Student College Choice (Chapman, 1986)
A study on recommendation intention among Malaysian private universities’ undergraduates
25 UC3F1301KMGT – TP025076 – Rahman Karimiyazdi
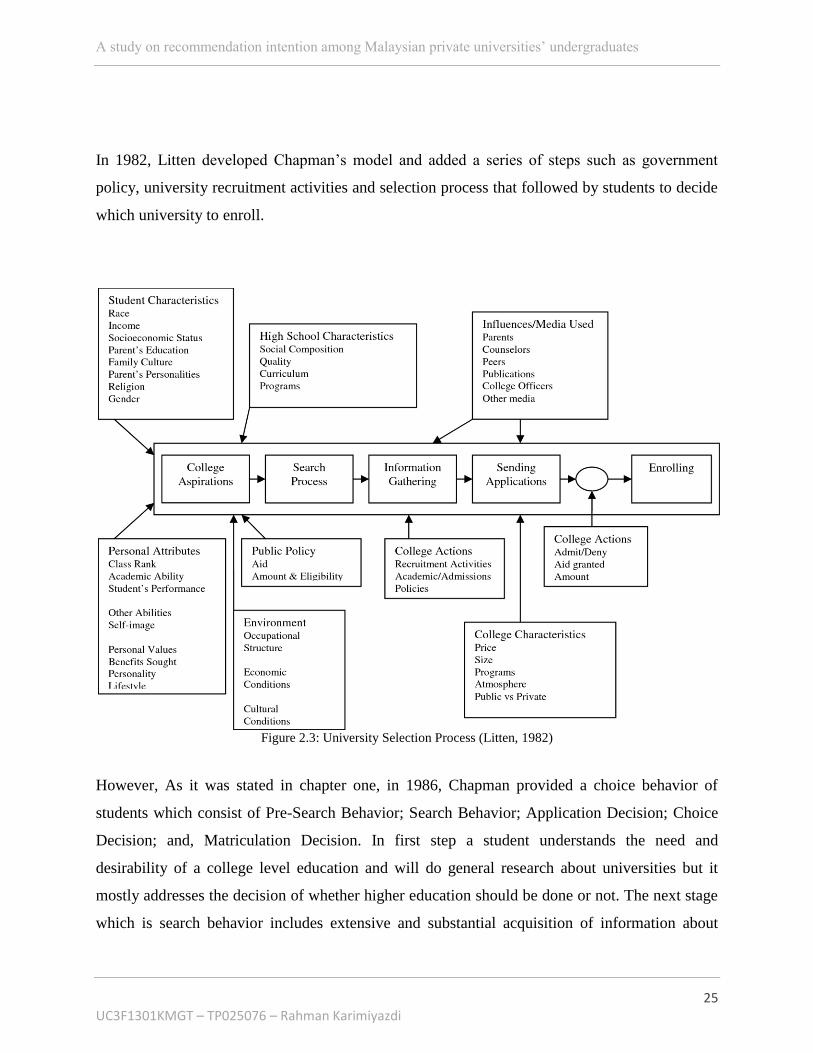
In 1982, Litten developed Chapman’s model and added a series of steps such as government
policy, university recruitment activities and selection process that followed by students to decide
which university to enroll.
Figure 2.3: University Selection Process (Litten, 1982)
However, As it was stated in chapter one, in 1986, Chapman provided a choice behavior of
students which consist of Pre-Search Behavior; Search Behavior; Application Decision; Choice
Decision; and, Matriculation Decision. In first step a student understands the need and
desirability of a college level education and will do general research about universities but it
mostly addresses the decision of whether higher education should be done or not. The next stage
which is search behavior includes extensive and substantial acquisition of information about

A study on recommendation intention among Malaysian private universities’ undergraduates
26 UC3F1301KMGT – TP025076 – Rahman Karimiyazdi
possible universities alternative. In this stage, reference group such as family, friends or teachers
deeply affect the student preference about a university. Many universities examine in this stage
but in the end only a few given serious consideration. Search ends when a student decides to
apply for a university. In this stage the student submits application to several universities.
Students apply for those universities that think will admit them and can afford the cost. Choice
decision phase includes all universities that admit the student. The last phase is matriculation
decision to the chosen college. Chapman didn’t mention to students post purchase behavior and
their actions after enter to university and using education service.
Although Litten’s model is more detailed and improved in comparison with Chapman model but
there is no step about students' post purchase behavior in both figures. Both researchers did not
concern about the behavior of students after they buy the education service from the university
and its influence on the process. Dissatisfied students may switch to another university before
graduation. Also they can affect negatively or positively to their relatives who wants to study in
the same university. Athiyaman (1997) provided a model that illustrates the student buying
behavior before enrolling and after graduating. Although it is a very comprehensive model but it
did not determine specific items that affect the recommendation intention.
Figure 2.4: A model of student satisfaction and perceived service quality in higher education
(Athiyaman, 1997)

A study on recommendation intention among Malaysian private universities’ undergraduates
27 UC3F1301KMGT – TP025076 – Rahman Karimiyazdi
CHAPTER 3:
RESEARCH METHODOLOGY

A study on recommendation intention among Malaysian private universities’ undergraduates
28 UC3F1301KMGT – TP025076 – Rahman Karimiyazdi
3.0 Introduction
Chapter three illustrates how the research will be conducted and directed. In fact, for advancing
the research work, methodology builds a platform for researcher to mapping the research work. It
discusses the methods those are selected to collect information which are qualitative and
quantitative. Moreover, it talks about sampling population size, data collection methods, and
document analysis.
3.1. Validity and Reliability
The study is valid for private universities in Malaysia to understand students’ criteria to select
their university and to know about their post purchase behavior. Today, Private universities in
Malaysia face fierce competition. Therefore, they need to know perfectly the students who are
their customers in order to retain them and prevent them to switch to other universities. Knowing
the students criteria causes universities provide better service for students and delight them.
Delighted students will recommend their university to others.
3.2. Purposes of Study
The study tries to discover the satisfaction level of A.P.U students about facilities, lecturer
performance, and course and then understand their post purchase behavior. Furthermore, the
study will reveal the likely of students’ recommendation intention whether they recommend
A.P.U to others or not. Moreover, the study will show implicitly how much there is positive or
negative word of mouth about the university.

A study on recommendation intention among Malaysian private universities’ undergraduates
29 UC3F1301KMGT – TP025076 – Rahman Karimiyazdi
3.3. Qualitative and Quantitative Research Methods
Qualitative research is about understanding not just what people think but why they think it. It’s
about listening to people’s talk and knowing their opinions so researcher can understand their
motivations and feelings. Face-to-face interviews and group discussions are the best method to
get this kind of useful feedback. Qualitative research can be valuable when the firm developing
new products or coming up with new marketing initiatives and intends to test reactions.
Quantitative research is about asking people for their opinions in a structured way so that the
researcher can produce hard facts and statistics. To get reliable statistical results, it’s important to
survey people in large numbers and to make sure they are a representative sample of
organization target market. Quantitative method is used in this study by distributing detailed
questionnaire and then analyzing them.
3.4. Primary Data and Secondary Data
The primary data is the data that has not been collected before and doesn’t exist before and it is
the first hand information that collected by the researcher. It can be collected either quantitative
research or qualitative research (Wild and Diggines, 2010). In this study primary date collected
by questionnaire. Secondary data is the data that has been collected by other researchers. The
secondary data exist in literatures such as books, journals, and websites. In this study secondary
data of previous authors is applied and this study tries to continue to provide new information
about students’ satisfaction and post purchase behavior.

A study on recommendation intention among Malaysian private universities’ undergraduates
30 UC3F1301KMGT – TP025076 – Rahman Karimiyazdi
3.5. Research Design
This is a quantitative study. In terms of Objectives, this is an explanatory study. Looking into the
sampling methodology, the population in this study is undergraduates. The sample in this study
refers to A.P.U undergraduates. In terms of sampling methodology, this study had used
convenience sampling methodology. Since, the total A.P.U undergraduates in year 2012 was
approximately 8000 (student business center, 2012), which considered as a large sample group.
The results from Raosoft Sample Size Calculator suggested that 96 is the minimum sample size
of the survey. A convenience sampling method was conducted among 100 APU students inside
the different faculty of A.P.U University. This is to avoid bias for surveying all the respondents
from particular faculty. This sampling method was chosen due to the unavailability of all private
university students in Malaysia.
3.6. Framework of the Research Methodology
There are 100 questionnaires that will be distributed to 100 undergraduate students in a private
university in Malaysia which is A.P.U University. Students will be selected from different
courses which are IT, business, and engineering students.
3.7. Sampling
A sample is a group of people, objects, or items that are selected from a large population to
measure. The sample should represent the population because the researcher needs to generalize
the results from the research sample to the population as a whole. In this research A.P.U students
are as a sample of university students in Malaysia. A.P.U students consist of local and
international students and can represent the student population of private universities. Sample
A study on recommendation intention among Malaysian private universities’ undergraduates
31 UC3F1301KMGT – TP025076 – Rahman Karimiyazdi
size is also important. It depends on the various factors such as time, type of data, funding, and
how heterogeneous the sample population is. The sample size of this research is 100 students of
A.P.U University.
3.8. Data Collection Method
The researcher directly gathers the primary data from his/her original sources. A method refers to
the way or mode of gathering data. There is various method of data collection. The important
methods are observation, interviewing, mail survey, experimentation, simulation, and projective
technique. In this study data will be collected by questionnaire which is distributed among
undergraduate students of A.P.U University.
3.9. Document Analysis
After collecting data through questionnaire it will be organized and interpreted. The data that
obtained will be analyzed according to the researcher’s best knowledge and the nature of the
data. The task of interpretation will be done directly by the researcher. In fact, after data
analyzing the researcher will find the answer of his/her questions. In this study one statistical
diagram will be drawn for each question and it will show the percentage of different answers
about that issue. Generally there are two types of diagram which are graph based diagrams and
chart like diagrams. The tree diagram, network diagram, flowchart, Venn diagram, existential
graph are samples of graph based diagrams and histogram, bar chart, pie chart, function graph,
scatter plot are samples of chart like diagrams. In this study the results of the questionnaire will
be presented by bar chart and pie chart diagrams.
3.10. Summary

A study on recommendation intention among Malaysian private universities’ undergraduates
32 UC3F1301KMGT – TP025076 – Rahman Karimiyazdi
This chapter summarizes the research design and research methodology used in this study. This
is a quantitative study to recommendation intention among Malaysian private universities’
undergraduates. In terms of sample A.P.U undergraduates are selected and in terms of
questionnaire the questions are adopted from previous researchers as mentioned in chapter one.
Lastly, T test and Pearson moment correlation test are used for the data analysis purpose.
CHAPTER 4:
PRESENTATION AND ANALYSIS

A study on recommendation intention among Malaysian private universities’ undergraduates
33 UC3F1301KMGT – TP025076 – Rahman Karimiyazdi
4.0 Introduction
Chapter four includes the analysis and presentation of data and information which obtained from
the data collection. The data will be analyzed by the SPSS software in a way that is easy to
understand. This chapter consists of a few parts including questionnaire response rate,
respondent’s characteristic, course characteristic, learning resources and facilities, lecturer
performance, student satisfaction, and recommendation intention. Moreover, information related
to each of the variables selected to test the hypothesis of this research.
There are frequency tables in order to show the weightage of each answer for each question in
each variable. It has followed by a figure of histogram showing the distributions of the variables.
Central tendencies measurement of mean and median is also shown. A cross tabulation is also
presented to shown the relations between respondent’s characteristics and recommendation
intention with the selected variables category.

A study on recommendation intention among Malaysian private universities’ undergraduates
34 UC3F1301KMGT – TP025076 – Rahman Karimiyazdi
4.1 Questionnaire’s Response Rate
In the primary data collection, a total of 100 questionnaires have been distributed in the A.P.U
University and because of the effective cooperation finally all 100 questionnaires have been
successfully collected back from the respondents which result in 100% response rate.
Figure 4.1: Questionnaire’s Response Rate
A study on recommendation intention among Malaysian private universities’ undergraduates
35 UC3F1301KMGT – TP025076 – Rahman Karimiyazdi
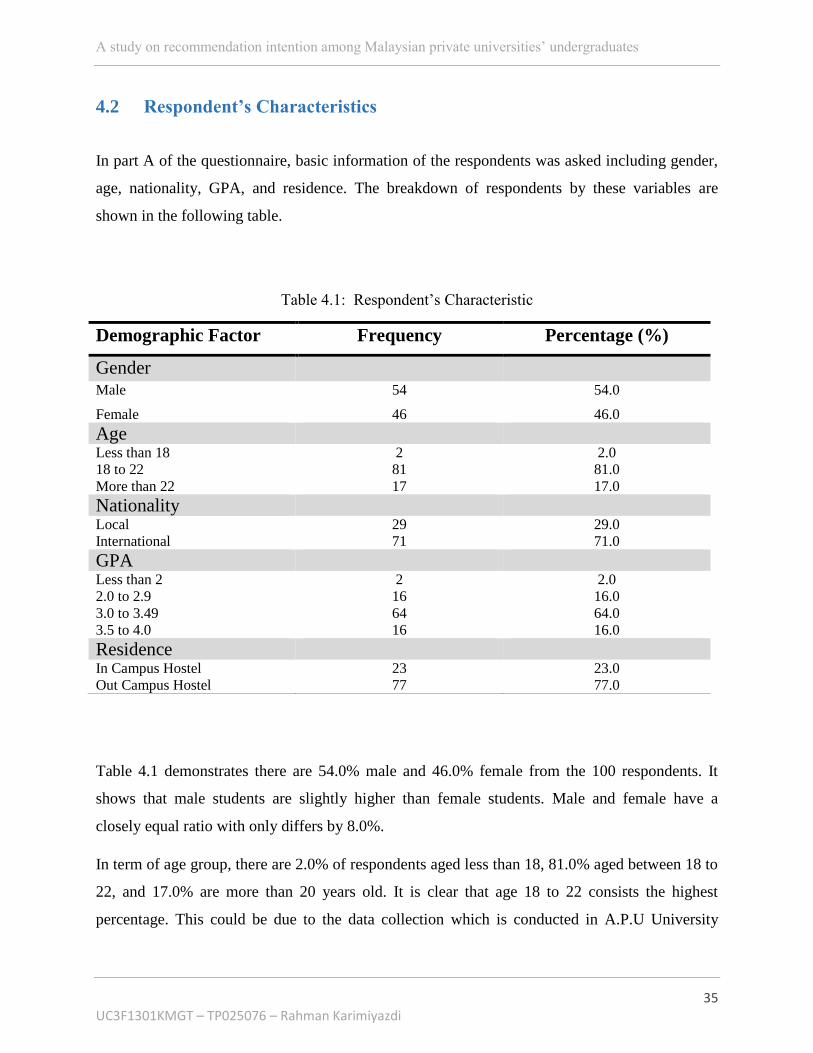
4.2 Respondent’s Characteristics
In part A of the questionnaire, basic information of the respondents was asked including gender,
age, nationality, GPA, and residence. The breakdown of respondents by these variables are
shown in the following table.
Table 4.1: Respondent’s Characteristic
Demographic Factor Frequency Percentage (%)
Gender
Male 54 54.0
Female 46 46.0
Age
Less than 18 2 2.0
18 to 22 81 81.0
More than 22 17 17.0
Nationality
Local 29 29.0
International 71 71.0
GPA
Less than 2 2 2.0
2.0 to 2.9 16 16.0
3.0 to 3.49 64 64.0
3.5 to 4.0 16 16.0
Residence
In Campus Hostel 23 23.0
Out Campus Hostel 77 77.0
Table 4.1 demonstrates there are 54.0% male and 46.0% female from the 100 respondents. It
shows that male students are slightly higher than female students. Male and female have a
closely equal ratio with only differs by 8.0%.
In term of age group, there are 2.0% of respondents aged less than 18, 81.0% aged between 18 to
22, and 17.0% are more than 20 years old. It is clear that age 18 to 22 consists the highest
percentage. This could be due to the data collection which is conducted in A.P.U University
A study on recommendation intention among Malaysian private universities’ undergraduates
36 UC3F1301KMGT – TP025076 – Rahman Karimiyazdi
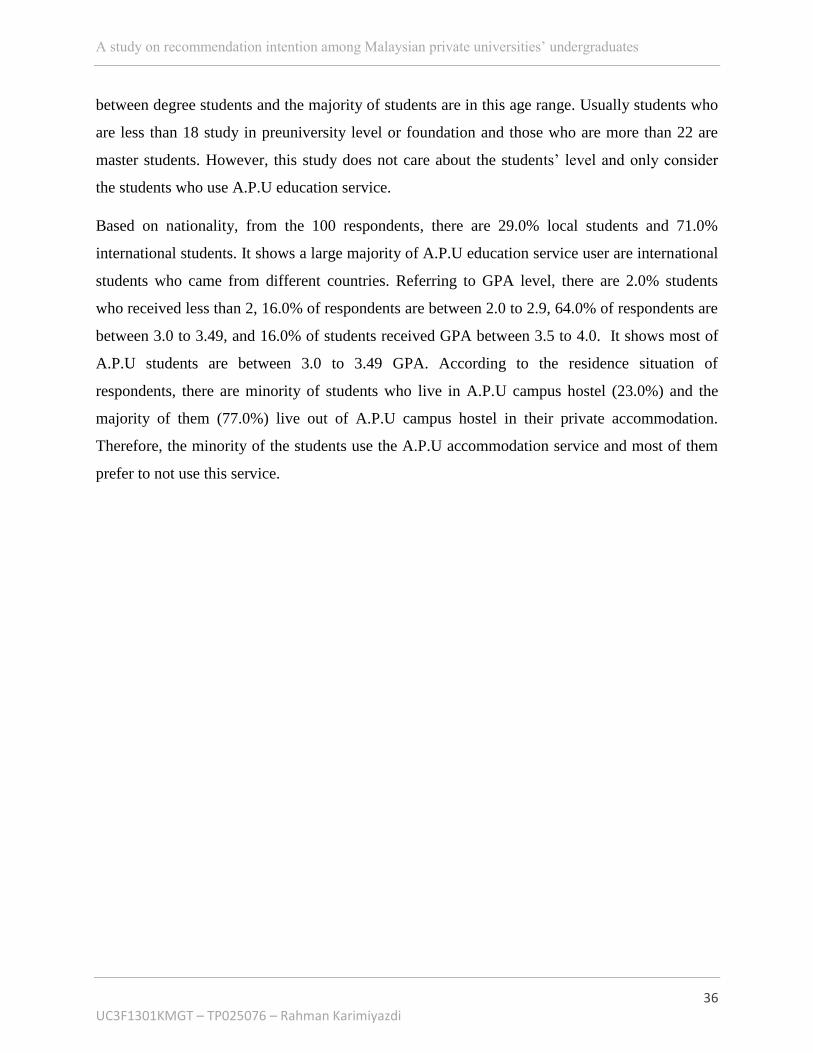
between degree students and the majority of students are in this age range. Usually students who
are less than 18 study in preuniversity level or foundation and those who are more than 22 are
master students. However, this study does not care about the students’ level and only consider
the students who use A.P.U education service.
Based on nationality, from the 100 respondents, there are 29.0% local students and 71.0%
international students. It shows a large majority of A.P.U education service user are international
students who came from different countries. Referring to GPA level, there are 2.0% students
who received less than 2, 16.0% of respondents are between 2.0 to 2.9, 64.0% of respondents are
between 3.0 to 3.49, and 16.0% of students received GPA between 3.5 to 4.0. It shows most of
A.P.U students are between 3.0 to 3.49 GPA. According to the residence situation of
respondents, there are minority of students who live in A.P.U campus hostel (23.0%) and the
majority of them (77.0%) live out of A.P.U campus hostel in their private accommodation.
Therefore, the minority of the students use the A.P.U accommodation service and most of them
prefer to not use this service.

A study on recommendation intention among Malaysian private universities’ undergraduates
37 UC3F1301KMGT – TP025076 – Rahman Karimiyazdi
4.3 Course Characteristic
Table 4.2: Course Characteristic (in %)
No Statement 1 2 3 4 5
B1 The course given information is just right 6.0 16.0 25.0 50.0 3.0
B2 The level of difficulty is just right 4.0 31.0 32.0 31.0 2.0
B3 The arrangement of information and topics is clear 5.0 14.0 38.0 41.0 2.0
B4 The illustration of the topics is clear 3.0 33.0 40.0 24.0 0.0
B5 The course’s presentation is appealing 2.0 34.0 36.0 26.0 2.0
B6 The examples or case study are helpful 2.0 24.0 43.0 27.0 4.0 Note: 1= Strongly Disagree, 2= Disagree, 3= Neutral, 4= Agree, 5= Strongly Agree
Figure 4.2: Distribution of Summation of Course Characteristic
Mean: 18.29, Median: 19

A study on recommendation intention among Malaysian private universities’ undergraduates
38 UC3F1301KMGT – TP025076 – Rahman Karimiyazdi
Table 4.3: Cross Tabulation – Total of Course Characteristic Category with Selected Variable
Variable Low Level (6 to 18) High Level (19 to 30)
Frequency Percentage Frequency Percentage
Gender
Male 34 59.6% 20 46.5%
Female 23 40.4% 23 53.5%
Age
Less than 18 2 3.5% 0 0.0%
18 to 22 49 86.0% 32 74.4%
More than 22 6 10.5% 11 25.6%
Nationality
Local 12 21.1% 17 39.5%
International 45 78.9% 26 60.5%
GPA
Less than 2 2 3.5% 0 0.0%
2.0 to 2.9 10 17.5% 8 18.6%
3.0 to 3.49 40 70.2% 24 55.8%
3.5 to 4.0 5 8.8% 11 25.6%
Residence
In Campus Hostel 14 24.6% 9 20.9%
Out Campus Hostel 43 75.4% 34 79.1%
A study on recommendation intention among Malaysian private universities’ undergraduates
39 UC3F1301KMGT – TP025076 – Rahman Karimiyazdi
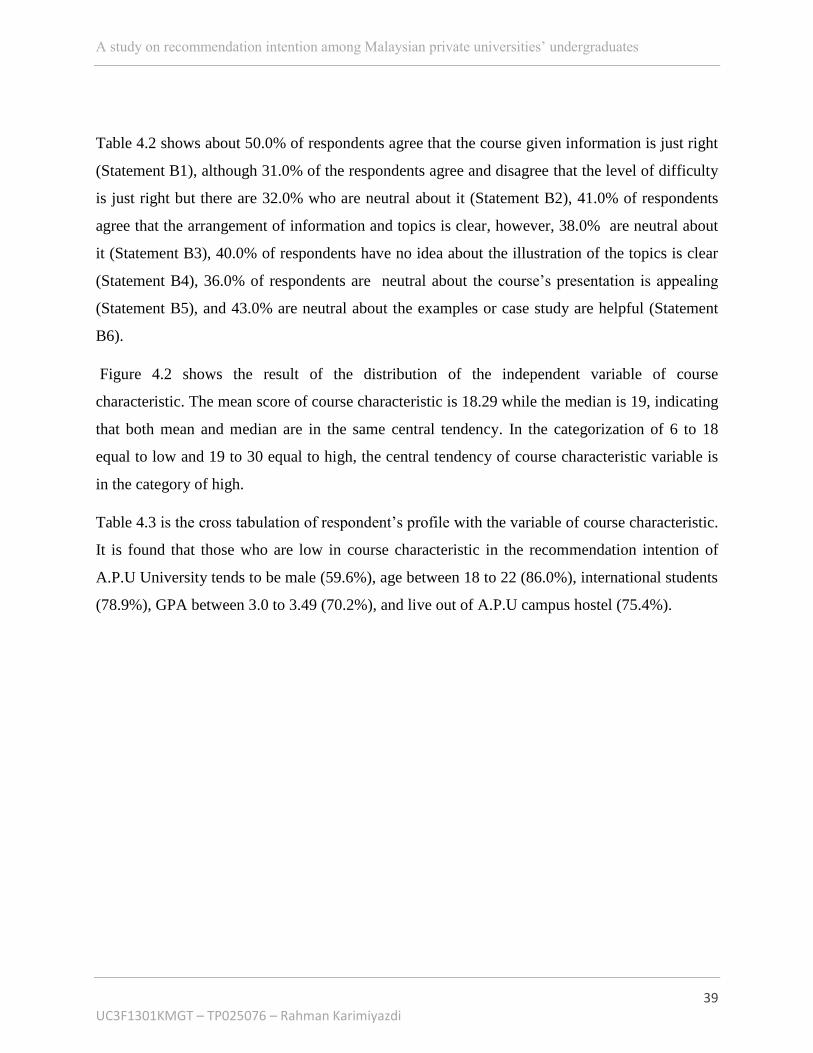
Table 4.2 shows about 50.0% of respondents agree that the course given information is just right
(Statement B1), although 31.0% of the respondents agree and disagree that the level of difficulty
is just right but there are 32.0% who are neutral about it (Statement B2), 41.0% of respondents
agree that the arrangement of information and topics is clear, however, 38.0% are neutral about
it (Statement B3), 40.0% of respondents have no idea about the illustration of the topics is clear
(Statement B4), 36.0% of respondents are neutral about the course’s presentation is appealing
(Statement B5), and 43.0% are neutral about the examples or case study are helpful (Statement
B6).
Figure 4.2 shows the result of the distribution of the independent variable of course
characteristic. The mean score of course characteristic is 18.29 while the median is 19, indicating
that both mean and median are in the same central tendency. In the categorization of 6 to 18
equal to low and 19 to 30 equal to high, the central tendency of course characteristic variable is
in the category of high.
Table 4.3 is the cross tabulation of respondent’s profile with the variable of course characteristic.
It is found that those who are low in course characteristic in the recommendation intention of
A.P.U University tends to be male (59.6%), age between 18 to 22 (86.0%), international students
(78.9%), GPA between 3.0 to 3.49 (70.2%), and live out of A.P.U campus hostel (75.4%).

A study on recommendation intention among Malaysian private universities’ undergraduates
40 UC3F1301KMGT – TP025076 – Rahman Karimiyazdi
4.4 Learning Resources and Facilities
Table 4.4: Learning Resources and Facilities (in %)
No Statement 1 2 3 4 5
C1 University’s learning environment is conducive 9.0 32.0 31.0 27.0 1.0
C2 Classrooms are well equipped with educational
resources
2.0 13.0 19.0 59.0 7.0
C3 IT labs are well equipped to meet my need 14.0 21.0 37.0 23.0 5.0
C4 There is a wide range of resources relevant to my
studies in university’s library
7.0 29.30 31.0 32.0 1.0
C5 There is a wide range of research journals in
university’s library
7.0 24.0 45.0 24.0 0.0
Note: 1= Strongly Disagree, 2= Disagree, 3= Neutral, 4= Agree, 5= Strongly Agree
Figure 4.3: Distribution of Summation of Learning Resources and Facilities
Mean: 14.96, Median: 15

A study on recommendation intention among Malaysian private universities’ undergraduates
41 UC3F1301KMGT – TP025076 – Rahman Karimiyazdi
Table 4.5: Cross Tabulation – Total of Learning Resources and Facilities Category with Selected
Variable
Variable Low Level (5 to 15) High Level (16 to 25)
Frequency Percentage Frequency Percentage
Gender
Male 29 52.7% 25 55.6%
Female 26 47.3% 20 44.4%
Age
Less than 18 2 3.6% 0 0.0%
18 to 22 45 81.8% 36 80.0%
More than 22 8 14.5% 9 20.0%
Nationality
Local 15 27.3% 14 31.1%
International 40 72.7% 31 68.9%
GPA
Less than 2 2 3.6% 0 0.0%
2.0 to 2.9 9 16.4% 9 20.0%
3.0 to 3.49 36 65.5% 28 62.2%
3.5 to 4.0 8 14.5% 8 17.8%
Residence
In Campus Hostel 13 23.6% 10 22.2%
Out Campus Hostel 42 76.4% 35 77.8%
A study on recommendation intention among Malaysian private universities’ undergraduates
42 UC3F1301KMGT – TP025076 – Rahman Karimiyazdi
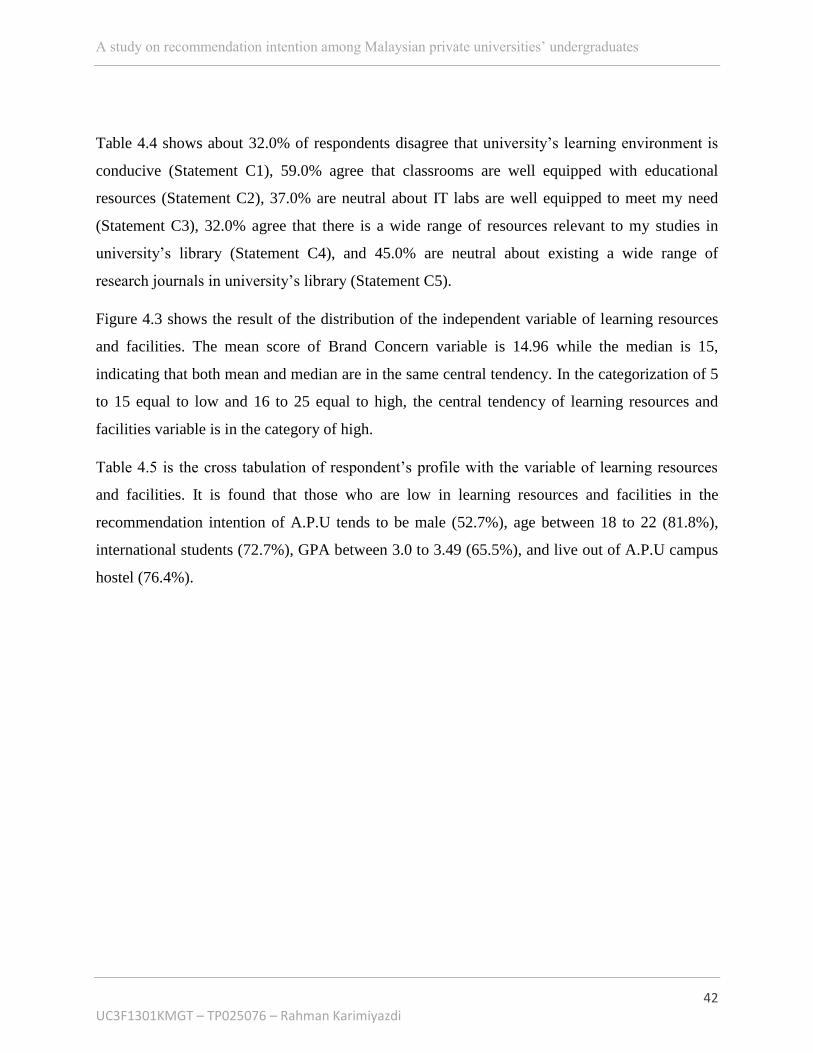
Table 4.4 shows about 32.0% of respondents disagree that university’s learning environment is
conducive (Statement C1), 59.0% agree that classrooms are well equipped with educational
resources (Statement C2), 37.0% are neutral about IT labs are well equipped to meet my need
(Statement C3), 32.0% agree that there is a wide range of resources relevant to my studies in
university’s library (Statement C4), and 45.0% are neutral about existing a wide range of
research journals in university’s library (Statement C5).
Figure 4.3 shows the result of the distribution of the independent variable of learning resources
and facilities. The mean score of Brand Concern variable is 14.96 while the median is 15,
indicating that both mean and median are in the same central tendency. In the categorization of 5
to 15 equal to low and 16 to 25 equal to high, the central tendency of learning resources and
facilities variable is in the category of high.
Table 4.5 is the cross tabulation of respondent’s profile with the variable of learning resources
and facilities. It is found that those who are low in learning resources and facilities in the
recommendation intention of A.P.U tends to be male (52.7%), age between 18 to 22 (81.8%),
international students (72.7%), GPA between 3.0 to 3.49 (65.5%), and live out of A.P.U campus
hostel (76.4%).
A study on recommendation intention among Malaysian private universities’ undergraduates
43 UC3F1301KMGT – TP025076 – Rahman Karimiyazdi
4.5 Lecturer performance
Table 4.6: Lecturer performance (in %)
No Statement 1 2 3 4 5
D1 Teaching plan given is clearly explained 3.0 30.0 33.0 34.0 0.0
D2 Lecturer is always prepared for each teaching session 4.0 22.0 33.0 36.0 5.0
D3 Learning activities are managed effectively 2.0 15.0 39.0 39.0 5.0
D4 Teaching delivery is easily understood 3.0 18.0 39.0 36.0 4.0
D5 Important aspects are emphasized in teaching 1.0 17.0 35.0 42.0 5.0
D6 Lesson contents are summarized at end of class 1.0 25.0 33.0 37.0 4.0
D7 Delivery method stimulates my thoughts 2.0 20.0 37.0 36.0 5.0
D8 Delivery method enhances my interest in the subject 4.0 23.0 32.0 37.0 4.0
D9 Illustrations/ example used are helpful in the learning
process
1.0 15.0 34.0 44.0 6.0
D10 Teaching materials/ aids used help in the learning
process
2.0 17.0 30.0 46.0 5.0
D11 Students are encouraged to ask questions/ to express
opinion
2.0 14.0 33.0 44.0 7.0
D12 Students are exposed to current issues/ industrial
practices
6.0 17.0 34.0 38.0 5.0
D13 Assessment are implemented as planned 3.0 16.0 34.0 46.0 1.0
D14 The assignment given conformed with the course
content
4.0 12.0 40.0 43.0 1.0
D15 Feedbacks on test/ laboratory work are given 3.0 20.0 38.0 38.0 1.0
D16 Assessment marks are announced within stipulated
period
9.0 18.0 34.0 37.0 2.0
D17 Lecturer shows concerns and demonstrates
responsibility
6.0 14.0 38.0 42.0 0.0
D18 I am being respected as a student 3.0 16.0 35.0 43.0 3.0
D19 Lecturer portrays a good image 4.0 14.0 43.0 38.0 1.0
D20 The lecturer’s delivery is convincing 6.0 12.0 38.0 43.0 1.0 Note: 1= Strongly Disagree, 2= Disagree, 3= Neutral, 4= Agree, 5= Strongly Agree

A study on recommendation intention among Malaysian private universities’ undergraduates
44 UC3F1301KMGT – TP025076 – Rahman Karimiyazdi
Figure 4.4: Distribution of Summation of Lecturer performance
Mean: 64.66, Median: 65
A study on recommendation intention among Malaysian private universities’ undergraduates
45 UC3F1301KMGT – TP025076 – Rahman Karimiyazdi
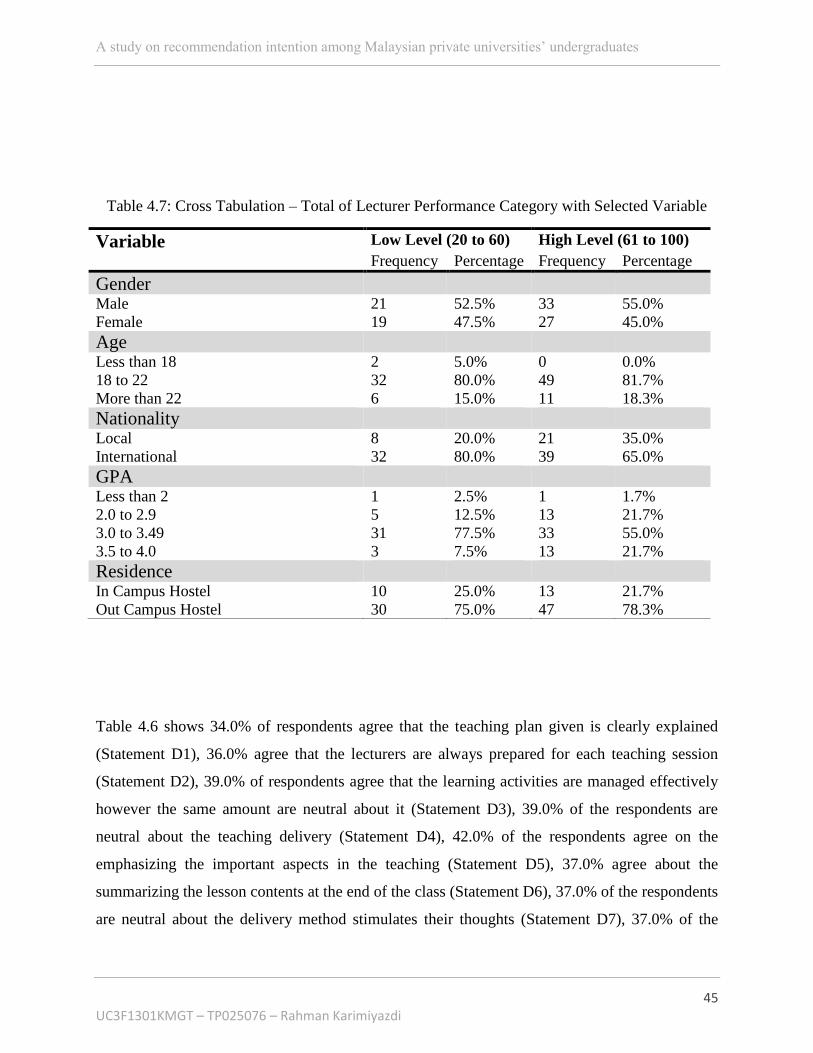
Table 4.7: Cross Tabulation – Total of Lecturer Performance Category with Selected Variable
Variable Low Level (20 to 60) High Level (61 to 100)
Frequency Percentage Frequency Percentage
Gender
Male 21 52.5% 33 55.0%
Female 19 47.5% 27 45.0%
Age
Less than 18 2 5.0% 0 0.0%
18 to 22 32 80.0% 49 81.7%
More than 22 6 15.0% 11 18.3%
Nationality
Local 8 20.0% 21 35.0%
International 32 80.0% 39 65.0%
GPA
Less than 2 1 2.5% 1 1.7%
2.0 to 2.9 5 12.5% 13 21.7%
3.0 to 3.49 31 77.5% 33 55.0%
3.5 to 4.0 3 7.5% 13 21.7%
Residence
In Campus Hostel 10 25.0% 13 21.7%
Out Campus Hostel 30 75.0% 47 78.3%
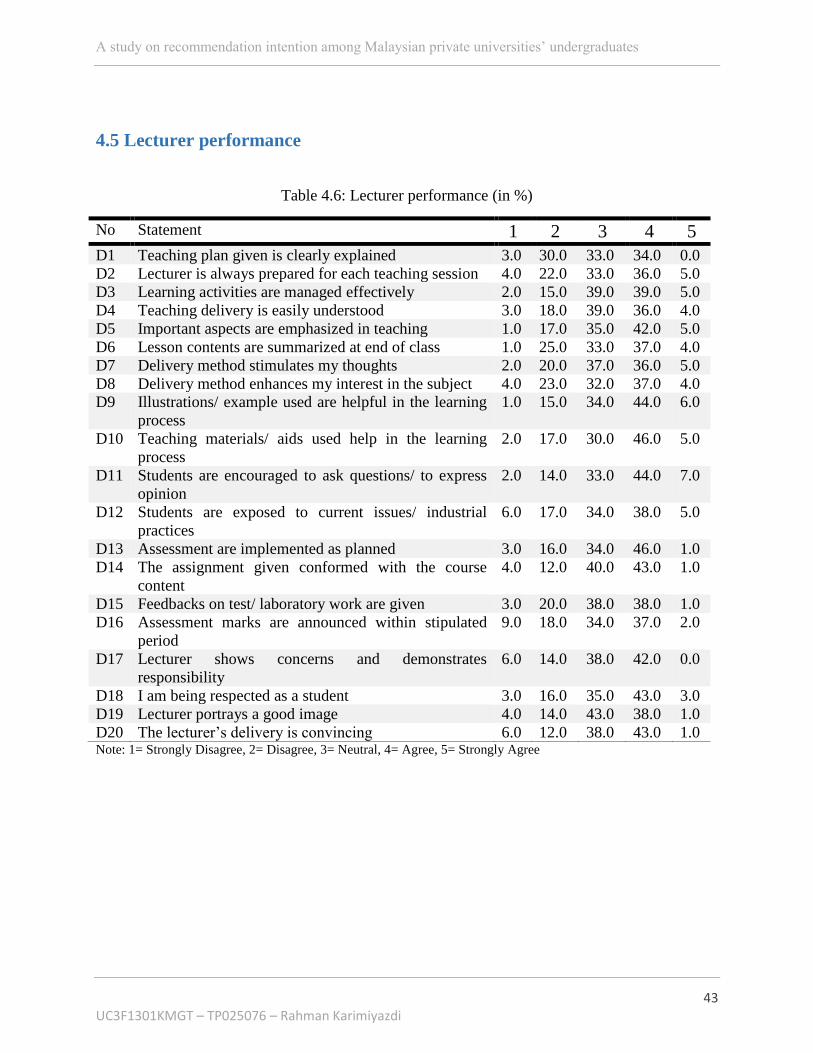
Table 4.6 shows 34.0% of respondents agree that the teaching plan given is clearly explained
(Statement D1), 36.0% agree that the lecturers are always prepared for each teaching session
(Statement D2), 39.0% of respondents agree that the learning activities are managed effectively
however the same amount are neutral about it (Statement D3), 39.0% of the respondents are
neutral about the teaching delivery (Statement D4), 42.0% of the respondents agree on the
emphasizing the important aspects in the teaching (Statement D5), 37.0% agree about the
summarizing the lesson contents at the end of the class (Statement D6), 37.0% of the respondents
are neutral about the delivery method stimulates their thoughts (Statement D7), 37.0% of the

A study on recommendation intention among Malaysian private universities’ undergraduates
46 UC3F1301KMGT – TP025076 – Rahman Karimiyazdi
respondents agree on delivery method enhances their interest in the subject (Statement D8),
44.0% of the respondents agree that Illustrations or example used are helpful in the learning
process (Statement D9), 46.0% of the respondents agree that teaching materials help in the
learning process (Statement D10), 44.0% of the respondents agree that students are encouraged
to ask questions or to express their opinion (Statement D11), 38.0% of the respondents agree that
students are exposed to current issues and industrial practices (Statement D12), 46.0% of the
respondents agree that the assessment are implemented as planned (Statement D13), 43.0% of
the respondents agree that the assignment given conformed with the course content (Statement
D14), 38.0% of the respondents agree that feedbacks on test or laboratory work are given
however, the same amount are neutral about it (Statement D15), 37.0% of the respondents agree
that assessment marks are announced within stipulated period (Statement D16), 42.0% of the
respondents agree that the lecturer shows concerns and demonstrates responsibility (Statement
D17), 43.0% of the respondents agree that they are being respected as a student (Statement D18),
43.0% of the respondents are neutral about lecturers’ good image (Statement D19), and finally
43.0% of the respondents agree about the convincing of lecturer’s delivery (Statement D20).
Figure 4.4 shows the result of the distribution of the independent variable of the lecturer
performance. The mean score of the lecturer performance variable is 64.66 while the median is
65, indicating that both mean and median are in the same central tendency. In the categorization
of 20 to 60 equal to low and 61 to 100 equal to high, the central tendency of lecturer performance
variable is in the category of high.
Table 4.7 is the cross tabulation of respondent’s profile with the variable of lecturer performance.
It is found that those who are high in lecturer performance in the recommendation intention of
A.P.U tends to be male (55.0%), age between 18 to 22 (81.7%), international students (65.0%),
GPA between 3.0 to 3.49 (55.0%), and live out of A.P.U campus hostel (78.3%).
A study on recommendation intention among Malaysian private universities’ undergraduates
47 UC3F1301KMGT – TP025076 – Rahman Karimiyazdi
4.6 Student Satisfaction
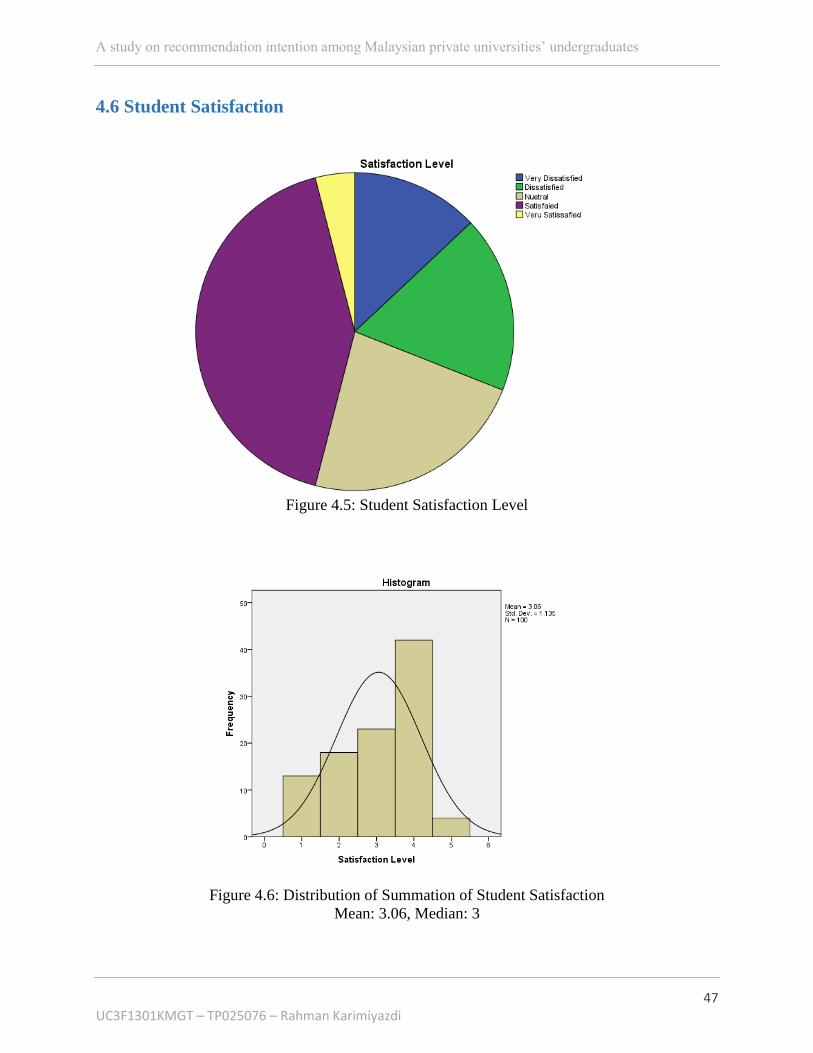
Figure 4.5: Student Satisfaction Level
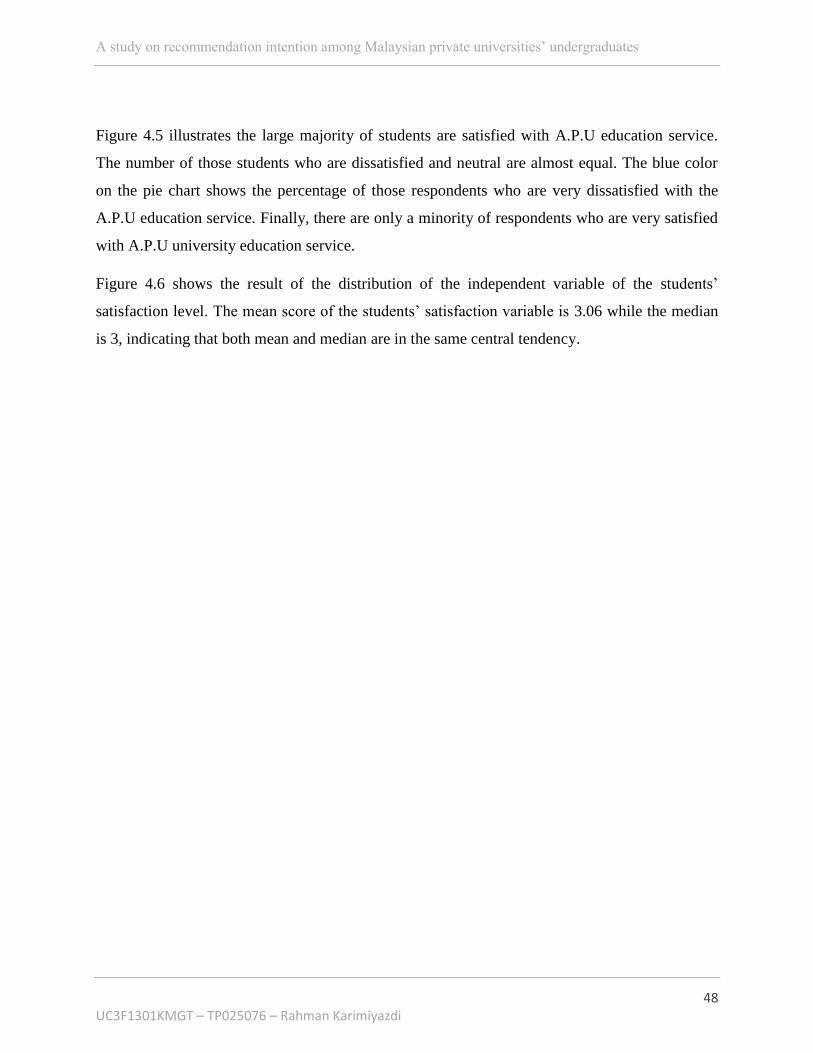
Figure 4.6: Distribution of Summation of Student Satisfaction
Mean: 3.06, Median: 3
A study on recommendation intention among Malaysian private universities’ undergraduates
48 UC3F1301KMGT – TP025076 – Rahman Karimiyazdi
Figure 4.5 illustrates the large majority of students are satisfied with A.P.U education service.
The number of those students who are dissatisfied and neutral are almost equal. The blue color
on the pie chart shows the percentage of those respondents who are very dissatisfied with the
A.P.U education service. Finally, there are only a minority of respondents who are very satisfied
with A.P.U university education service.
Figure 4.6 shows the result of the distribution of the independent variable of the students’
satisfaction level. The mean score of the students’ satisfaction variable is 3.06 while the median
is 3, indicating that both mean and median are in the same central tendency.

A study on recommendation intention among Malaysian private universities’ undergraduates
49 UC3F1301KMGT – TP025076 – Rahman Karimiyazdi
4.7 Recommendation Intention
Figure 4.7: Student Recommendation Intention
Figure 4.8: Distribution of Summation of Recommendation Intention

A study on recommendation intention among Malaysian private universities’ undergraduates
50 UC3F1301KMGT – TP025076 – Rahman Karimiyazdi
Mean: 2.57, Median: 3
Figure 4.7 illustrates the likelihood of the recommendation intention among the respondents. As
it shows only a small percentage of students will definitely recommend A.P.U University to
others. Conversely, one quarter of respondents will never recommend A.P.U University to others
at all. The percentages of those who are likely to recommend and are not likely to recommend
are the same. Finally, there are more than one quarter of respondents who have no opinion
(neutral) about the recommendation of A.P.U to others.
Figure 4.8 shows the result of the distribution of the independent variable of the students’
recommendation intention level. The mean score of the students’ recommendation intention
variable is 2.57 while the median is 3, indicating that both mean and median are in the same
central tendency.

A study on recommendation intention among Malaysian private universities’ undergraduates
51 UC3F1301KMGT – TP025076 – Rahman Karimiyazdi
CHAPTER 5:
DATA HYPOTHESIS

A study on recommendation intention among Malaysian private universities’ undergraduates
52 UC3F1301KMGT – TP025076 – Rahman Karimiyazdi
5.1 Hypothesis Testing
To identify the predictors of student recommendation intention among A.P.U university students.
Figure 5.1: the coefficient model
n.s = no significant

A study on recommendation intention among Malaysian private universities’ undergraduates
53 UC3F1301KMGT – TP025076 – Rahman Karimiyazdi
Table 5.1 shows that the coefficient determination (R^2) = 0.649. It represents that course
characteristic, learning resources and facilities, lecturer performance, and student satisfaction
have contributed to almost 0.65% towards recommendation intention of A.P.U. however, the
35% (100 – 65%) is classified as the elastic factor. This factor is uncontrollable.
Based on Table 2 above, the F value is 43.870 is significant at the level of p<0.05 Hence, the
overall regression model for course characteristic, learning resources and facilities, lecturer
performance, and student satisfaction is working properly in explaining the difference in
recommendation intention of students.
The F statistic for the overall goodness of fit of model is 43.870, which is significant at p < 0.05
as shown in table 3. After excluding the non-significant variables, the final regression model
produced by enter method for recommendation intention is:
Recommendation intention = -1.322 + 0.058 course characteristic + 0.024 Lecturer
performance + 0.513 Student satisfaction.
This model explains around 65% of the variance in recommendation intention. This indicates
that 65% of the dependent variable (recommendation intention) was explained by the linear
combination of the four-predictor variables. Among the four predictor variables, course
characteristic was found to contribute more significantly towards one’s recommendation
intention.

A study on recommendation intention among Malaysian private universities’ undergraduates
54 UC3F1301KMGT – TP025076 – Rahman Karimiyazdi
Table 5.1: Model Summary
Model R R Square Adjusted R Square Std. Error of the Estimate
1 0.805 0.649 0.634 0.721
Table 5.2: AVONA Analysis
Model Sum of Squares df Mean Square F Sig.
Regression 91.159 4 22.790 43.870 0.000
Residual 49.351 95 .519
Total 140.510 99
Table 5.3: Coefficients
Variables
Unstandardized
Coefficients
Standardized
Coefficients
Beta
t
Sig.
B Std. Error
(Constant)
-1.322
.417
-
-3.168
.002
Course Characteristic
.058 .021 .195 2.785 .006
Learning Resources
&Facilities
-.018 .026 -.052 -.679 .499
Lecturer Performance
.024 .008 .294 3.024 .003
Student Satisfaction
.513 .097 .489 5.276 .000
R square = 0.649, df = 4 , F = 43.870, p < 0.05

A study on recommendation intention among Malaysian private universities’ undergraduates
55 UC3F1301KMGT – TP025076 – Rahman Karimiyazdi
In the hypothesis testing, the p value of all hypotheses except learning resources and facilities is
highly significant, where p value <0.05. It shows that course characteristic, lecturer performance,
and student satisfaction are highly significant with recommendation intention.
Figure 5.2: Result of Hypothesis Testing

A study on recommendation intention among Malaysian private universities’ undergraduates
56 UC3F1301KMGT – TP025076 – Rahman Karimiyazdi
CHAPTER 6:
CONCLUSION AND RECOMMENDATION
A study on recommendation intention among Malaysian private universities’ undergraduates
57 UC3F1301KMGT – TP025076 – Rahman Karimiyazdi
6.0 Managerial Implication and Recommendation
Based on the information obtained from the study towards factors affecting students’
recommendation intention, some managerial implications and recommendation of researcher are
giving, where it might be useful for A.P.U and other universities for their future strategies
planning in improving education service.
With the large opportunities in the universities’ education service market in the near future,
education service providers should seize the opportunities to fulfill what affect recommendation
intention of students. Study shows course characteristic plays the most important role in
students’ recommendation intention. Course characteristics includes the course given
information, the level of difficulty of the course, the clarity and illustration of the topics, the
quality of course’s presentation, and the usefulness of case study and examples. To improve the
quality of course characteristics, A.P.U should consider the mentioned variables. Moreover,
A.P.U should consider other course characteristics; for example, how much the assignments and
testing requirements define clearly; convenience of class location and time; the accessibility and
helpfulness of instructor; relevance of course subjects to life skills and job goals. By better
improve the course characteristics and providing what is demanded, it might help A.P.U to
increase the students’ recommendation intention and improve sales and profit.
Lecturer performance is the second consideration based on the research, indicate that students
recommend a university if its lecturers performance is good. In evaluating the performance of
lecturer, students’ suggestions and ideas is beneficial as a supervisory agent and they should be
used as a data source in the performance evaluating of a lecturer. The quantity and quality of
lecturers affect the students’ satisfaction. It is recommended that A.P.U hire the lecturers who
show concerns and demonstrate responsibility and are well knowledgeable and prepared and
deliver the subject well and encourage the student to ask question and express their opinions.
Moreover, A.P.U should evaluate the lecturers’ performance regularly and ask those who do not
perform well to improve their performing and fire them if they did not make any improvement.

A study on recommendation intention among Malaysian private universities’ undergraduates
58 UC3F1301KMGT – TP025076 – Rahman Karimiyazdi
Student satisfaction has also a significant impact on students’ recommendation intention.
Students should be satisfy by the education service of the university. All the independent
variables which consist course characteristics, learning resources and facilities, and lecturer
performance affect the students’ satisfaction. Students’ judgment about the difference between
what he/she expected of the service (expectations) and what was received (perceived
performance). Therefore, if the perceived performance is less than expectations, the student is
dissatisfied; if it matches expectations the student is satisfied and if it exceeds expectations the
student is delighted. The high students’ satisfaction the more is the recommendation intention. In
order to satisfy student with the service, all staff of a university should follow the principles of
customer service, whether they are front line contact employee such as lecturers and admin staff
or non-contact employee such as managers. Students’ satisfaction is a highly significant indicator
of the quality of teaching performance and necessary measure of the education service.
Learning resources and facilities has the least impact on the students’ recommendation intention,
which indicate that learning resources and facilities should not be the main concern for A.P.U
University. Learning resources and facilities will not be so important to the students and it is the
last variables to consider. A.P.U shouldn’t focus much on learning resources and facilities
because the impact is very least.

A study on recommendation intention among Malaysian private universities’ undergraduates
59 UC3F1301KMGT – TP025076 – Rahman Karimiyazdi
6.1 Limitations
This research was carried out using a convenient non-probability random sampling method
towards the targeted respondents group randomly. Result collected might not be entirely balance
in term of respondents’ demographic.
Without any funding involved and budget constrain, only 100 questionnaires was distributed, and
thus, result might not be able to accurately represent all the private universities of Malaysia as a
whole. Moreover, the result collected in general can only represents the factors that affect the
recommendation intention of private universities only, not the governmental universities, and not
the whole group of students such as postgraduates.
Due to time constrain, this research was not in-depth as only 100 samples was distributed and
responded to this research. Thus, the analysis and results concluded in this research is further
narrow down to reflect the selected private university, not all the private universities. Moreover,
this research only able to conduct by examines the respondents in the A.P.U University only due
to time constrain and lack of ability to cover a wider coverage.
During answering the questions, there are also chances where respondents do not have sufficient
knowledge and understanding about the subject or the questions asked in the questionnaire.
Thus, respondents might interpret the questions wrongly and might answer the questions in a
wrong assumption in this case. There are also several factors that might affect the quality of the
answers such as respondents’ honesty and patience, which is uncontrollable, and thus limiting
the accuracy of the findings.

A study on recommendation intention among Malaysian private universities’ undergraduates
60 UC3F1301KMGT – TP025076 – Rahman Karimiyazdi
6.2 Further research
As this research only conduct in Malaysia, and particularly in A.P.U University, further research
could be done on similar research toward A.P.U respondents, with more numbers of respondents.
Research can also conduct towards respondents from the other places or states of Malaysia, and
it is better to cover the whole Malaysia if time, cost and other factors are allowed. It is better to
include people from all the states in Malaysia because people in different location have different
demographic and different thinking toward using the education service.
Also, further research could be done on similar research in Malaysia by choosing other
demographic factors such as race and nationality. This research was only asked the students
whether they are local or international and did not specify the race of local students and the
country of international students. Moreover, researchers are recommended to use other method to
obtain the data, such as interview or focus group, so that respondents will be more understand on
the subject studied and more precise and accurate results could be obtained. Researchers could
consider translating the language in conducting questionnaire if necessary as Malaysia is a multi-
cultural country with multi-language.
Last but not least, further research can also consider including different independent variables
that will affect the dependent variable of recommendation intention, which is not examine in this
studies.

A study on recommendation intention among Malaysian private universities’ undergraduates
61 UC3F1301KMGT – TP025076 – Rahman Karimiyazdi
7.0 References
A study on recommendation intention among Malaysian private universities’ undergraduates
62 UC3F1301KMGT – TP025076 – Rahman Karimiyazdi
Abend, A. (2006), Evaluating Quality in Educational Facilities, PEB Exchange, Programme on
Educational Building, 2006/1, OECD Publishing, Paris.
Admin. (2006). Post Purchase Behavior of a Customer. Available:
http://www.citeman.com/1308-post-purchase-behavior-of-a-customer.html. Last accessed 25th
Mar 2013.
Athiyaman, A. (1997). Linking Student Satisfaction and Service Quality Perceptions: The Case
of University Education. European Journal of Marketing. Vol. 31, 528-540.
Bembenutty, H. (2009). Teaching effectiveness, Course Evaluation, and Academic Performance:
The Role of Academic Delay of Gratification. Journal of Advanced Academic, Vol. 20, 326-355.
Bowden, J.L. and Alessandro, S. (2011). Co-creating Value in Higher Education: The Role of
Interactive Classroom Response Technologies. Asian Social Science. Vol. 7, 35-49.
Brennan, L. (2001). How prospective students choose universities: A buyer Behaviour
Perspective, PhD thesis, Centre for the Study of Higher Education, The University of Melbourne.
Camilleri, A. (2008) The Risks of Privatisation of Higher Education, in SSU Higher Education
Conference, 12/01/2008, Rogastka, Slovenia, Available :
http://www.eric.ed.gov/ERICDocs/data/ericdocs2sql/content_storage_01/0000019
b/80/43/6b/f4.pdf. Last accessed 20th Mar 2013.
CHACKO, T.I. (1983). Student Ratings of Instruction: A Function of Grading Standards,
Educational Research Quarterly, 8(1), 19–25.
Chan, Y.F., and Shuhaily, O. (2011). A Case Study of Student Evaluation of Teaching in
University. International Education Studies, 4(1), 44-50.
Chang, T.S. (2000). Student Ratings: What Are Teacher College Students Telling Us About
Them? Paper Presented at the Annual Meeting of the American Educational Research
Association, New Orleans, LA.
Chapman, R.G. (1986). Toward A Theory of College Selection: A Model of College Search and
Choice Behavior. Available: http://www.acrwebsite.org/search/view-conference-
proceedings.aspx?Id=6497. Last accessed 20th Oct 2012.
Chitty, C. (2009) The Privatisation of Education, FORUM for Promoting 3-19 Comprehensive
Education, 51(1), 73-84.
Douglas, J, Douglas, A and Barnes, B. (2006). Measuring Student Satisfaction at a UK
University. Quality Assurance in Education . Vol. 14, 251-267.
Elliott, K.M and Shin, D. (2010), Student Satisfaction: An Alternative Approach to Assessing
This Important Concept, Journal of Higher Education Policy and Management, Vol. 24, 197-202.

A study on recommendation intention among Malaysian private universities’ undergraduates
63 UC3F1301KMGT – TP025076 – Rahman Karimiyazdi
Gerald, W. (2008) Globalisation and Higher Education Funding Policy Shifts in Kenya, Journal
of Higher Education Policy and Management, 330(3), 215-229.
Gibbs, P., and Knapp, M. (2002) Marketing Higher and Further Education : an Educator's Guide
to Promoting Courses, Departments and Institutions. London: Kogan Page.
Gold, E. (2001), Customer Service: A Key Unifying Force for Today’s Campus, Netresults,
National Association of Student Personnel Administrators, Work Study, Vol. 52 (5), 234-43.
Gul, H. (2010). Evaluation of Lecturer Performance Depending on Student Perception in Higher
Education. Education and Science. Vol. 35, 158-168.
Holbrook, M. (2005) Marketing Education as Bad Medicine for Society: The Gorilla Dances,
Journal of Public Policy and Marketing, 24(1), 134-145.
Hussain, N and Bhamani, S. (2012). Development of the Student University Satisfaction
SCALE: Reliability and Validity. Interdisciplinary Journal of Contemparory Research in
Business. Vol.4,332-341.
Kenway, J., Bigun, C., and Fitzclarance, F. (1993) Marketing Education in the Postmodern Age,
Educational Policy, 8(2), 105-122.
Kirp, D. (2003) Shakespeare, Einstein, and the Bottom Line: the Marketing of Higher Education,
Cambridge, Massachusetts: Harvard University Press.
Kohn, A. (1993), Turning Learning into a Business: Concerns about Total Quality, Educational
Leadership, 51 (1), 58-61.
Kotler, P and Keller, K.L. (2012). Marketing Management. 14th ed. U.S.A: Pearson.
Levy D. (2006) Market University? Comparative Education Review, 50(1), 113-124.
Litten, L.H. (1982). Different Strokes in the Applicant Pool: Some Refinements in a Model of
Student Choice. Journal of Higher Education, 53(4), 383-402.
Marginson, S. (1997) Markets in Education. St. Leonards, Australia: Allen & Unwin.
Maringe, F. (2006) University and Course Choice: Implications for Positioning, Recruitment and
Marketing, International Journal of Educational Management, 20(6), 466-479.
Marzo-Navarro, M., Pedraja., and Rivera. P. (2005). Measuring Customer Satisfaction in
Summer Courses. Quality Assurance in Education, Vol.13, 53–65.
Mavondo, F. Y. Tsarenko and M. Gabbott. (2004). International and Local Student Satisfaction:
Resources and Capabilities. Journal of Marketing for Higher Education, 14(1), 41-60.

A study on recommendation intention among Malaysian private universities’ undergraduates
64 UC3F1301KMGT – TP025076 – Rahman Karimiyazdi
Moore, D., Hwa, J.L., and Everson, B. (2012). An Appealing Connection–The Role of
Relationship Marketing in the Attraction and Retention of Students in an Australian Tertiary
Context. Asian Social Science, Vol. 8, 65-80.
Mukherji, S., and Rustagi, N. (2008). Teaching Evaluations: Perception of Students and Faculty.
Journal of College Teaching and Learning, 5(9), 45-54.
Munteanu, C., Ceobanu, C., Bobalca, C., and Anton, O. (2010). An Analysis of Customer
Satisfaction in a Higher Education Context. International Journal of Public Sector Management.
Vol. 23, 124-140.
National Association of Student Personnel Administrators,Work Study, 52(5), 234-43.
Ndirangu, M and Udoto, M.O. (2010). Quality of Learning Facilities and Learning Environment.
Challenges for Teaching and Learning in Kenya’s Public Universities. Quality Assurance in
Education. Vol. 19, 208-223.
Olaru, D., Purchase, S., and Peterson, N.. (2008). From Customer Value to Repurchase
Intentions and Recommendations. Journal of Business and Industrial Marketing. 23 (8), 554-465.
Oliver, R. L. and Desarbo, W. S. (1989) Processing of the Satisfaction Response in
Consumption: a Suggested Framework and Research Proposition, Journal of Consumer
Satisfaction, Dissatisfaction and Complaining Behavior, 2, 1–16.
Palmer, A. (2001) Principles of Services Marketing (3rd Ed.), London: McGraw-Hill.
Pasternak, R. (2005) Choice of Institution of Higher Education and Academic Expectations: The
Impact of Cost-Benefit Factors, Teaching in Higher Education, 10(2), 189-201.
Prabhu, S.S. and Ramarapu, N.K. (1994), A Prototype Database to Monitor Course
Effectiveness: a TQM approach, T H E Journal, 22 (3), 99-103.
Ramsden, P.A. (1991), Performance Indicator of Teaching Quality in Higher Education: The
Course Experience Questionnaire, Studies in Higher Education, 16 (2), 129-50.
Sohail, M.S. and Shaikh, N.M. (2004), Quest for Excellence in Business Education: A Study of
Student Impressions of Service Quality, The International Journal of Educational Management,
18 (1), 58-65.
Thomas, S. (2011). What Drives Student Loyalty in Universities: An Empirical Model from
India. International Business Research. Vol. 4, 183-192.
Tooley, J. (2007) Could for-Profit Private Education Benefit the Poor? Some a Priori
Considerations Arising from Case Study Research in India, Journal of Educational Policy, 22(3),
321-342.

A study on recommendation intention among Malaysian private universities’ undergraduates
65 UC3F1301KMGT – TP025076 – Rahman Karimiyazdi
Wachtel, H.K. (1998). Student Evaluation of College Teaching Effectiveness: A Brief Review,
Assessment and Evaluation in Higher Education, 23(2), 191–211.
Weimer, M. (2009). Course Characteristics that Are Most Important to Students. Available:
http://www.facultyfocus.com/articles/teaching-and-learning/course-characteristics-that-are-most-
important-to-students/. Last accessed 26th Apr 2013.
Wild, J., Diggines, C. (2010). Marketing Research. South Africa: Juta and Company Ltd.
Worthington, A.C. (2002). The Impact of Student Perceptions and Characteristics on Teaching
Evaluations: A Case Study in Finance Education. Assessment and Evaluation in Higher
Education. 27 (1), 49-64.
Yeo, R. (2009). Service Quality Ideals in a Competitive Tertiary Environment. International
Journal of Educational Research, Vol. 48, 62-76.
Yurko, A. (2005), “Educational adequacy assessments”, Available at: www.brainspaces.com/
CEPI/PRES-BrainSpaces Assessment.pdf. Last accessed 20th Apr 2013.
A study on recommendation intention among Malaysian private universities’ undergraduates
66 UC3F1301KMGT – TP025076 – Rahman Karimiyazdi
8.0 APPENDICES