a study on physico-chemical and microbiological … kumar bariki and geetha... · of water borne...
TRANSCRIPT
Int.J.Curr.Microbiol.App.Sci (2016) 5(9): 89-104
89
Original Research Article http://dx.doi.org/10.20546/ijcmas.2016.509.011
A Study on Physico-chemical and Microbiological Quality of Drinking Water
in Tribal Area of Hukumpeta Mandal, Visakhapatnam District,
Andhra Pradesh, India
Syam Kumar Bariki1*
and Geetha Saramnada2
1Department of Environmental Sciences, Andhra University, Visakhapatnam, India
2Department of Microbiology, Andhra University, Visakhapatnam, India
*Corresponding author
A B S T R A C T
Introduction
Water is an essential unique solvent
prerequisite for life, to the extent that extra-
terrestrial life is sought by identifying
whether a planet or heavenly body has
water. In case of human beings, around 57%
of the body weight is constituted by water
(Guyton, 1991). Water can be obtained from
a number of sources among which are
streams, lakes, rivers, ponds, rain, spring
and wells. About 97.2% of water on earth
International Journal of Current Microbiology and Applied Sciences ISSN: 2319-7706 Volume 5 Number 9 (2016) pp. 89-104
Journal homepage: http://www.ijcmas.com
The present work was aimed for assessing the quality (physico-chemical and
bacteriological) of water samples collected from 07 different locations of
Hukumpeta Mandal, Visakhapatnam district, Andhra Pradesh, India in 2014-2015.
The study was subjected for physico-chemical and bactrioiological analysis‟s
involving parameters pH, Turbidity, Electric Conductivity (EC), Total Dissolved
Solids (TDS), Total Hardness (TH), Calcium, Magnesium, Chloride, Fluoride,
Sulphate, Nitrite ,Dissolved oxygen(DO) etc and microbial analysis (Heterotrophic
plate count, faecal coliforms, E.coli and faecal steptroccoi), was performed
(APHA,2005). On comparing the results against the drinking water quality
standards lead by BIS and WHO, it was found that some parameters namely, EC,
Turbidity, Total solids, Calcium, Magnesium, and DO were higher than the
prescribed limits while other parameters, Fluorides, sulphates, nitrates, chlorides
and total solids were observed to be lower than the limits. Bacteriological
examination based on MPN/100 ml of sample, revealed that 90% of samples do not
meet Bureau of Indian Standards BIS & World Health Organization (WHO)
standards. Most Probable Number (MPN) count ranges between 14-1100MPN
/100ml.The faecal coliform counts ranged between 0.32 x 10⁴
CFU/100ml to 4.0 x
104 CFU /100 ml, exceeding the standard limit of BIS, 2006. Isolated and identified
organisms were Escherichia, Staphylococci, Salmonella, Shigeila species, Vibrio
species, Pseudomonas species, Aeromonas etc. The results indicate that prevalence
of water borne diseases may be usually related to the source of drinking water.
These interrelated effects have definite impact on developmental efforts and health
status of the tribal community, and needed treatment before consumption.
K e y w o r d s
Physical, chemical,
parameters,
drinking water,
WHO, BIS, E.coli,
coliform.
Accepted:
07August 2016
Available Online: 10 September 2016
Article Info

Int.J.Curr.Microbiol.App.Sci (2016) 5(9): 89-104
90
has trace of salt and only 2.8% is present as
fresh water from which about 20%
constitutes ground water. Ground Water is
rain water, which reaches the earth surface
and percolates into the earth. During the
percolation downwards, it comes into
contact with a number of mineral salts
present in the soil which may be dissolved in
the water. It flows down till it reaches hard
rock and may retread upward coming out in
the form of spring water. Ground water is
highly valued because of certain properties
not possessed by surface water (Rajankar et
al., 2011).
In about 85% cases, water supply from tube
well and bore wells with proper sanitary
protection are found to be good quality
having few or no sign of contamination with
bacteria of faecal origin. Tube wells
sometimes show evidence of persistent
contamination, even though sanitary
inspection reveals few local hazards. This
may be the result of aquifer contamination,
which is a particular problem, where
fissured geological strata are combined with
thin topsoil. The ground water is generally
believed to be free from contamination and
thus considered it as safe. Contamination of
drinking water may occur by percolation of
toxins through the soil to the ground water
(Sargaonkar et al., 2003).
Spring water has been very important to
man‟s existence. Early human civilization
centred depended on spring and streams.
When ground water appears at the surface,
springs are formed. Springs are a good
source of water supply for small towns,
especially near hills or bases of hills. In
many developing countries, availability of
water has become a critical and urgent
problem and it is a matter of great concern
to families and communities depending on
non-public water supply system.
Conformation with microbiological standard
is a special interest because of the capacity
of water to spreading water borne diseases
to the barest minimum in addition to being
pleasant to drink, which implies that it must
be wholesome and palatable in all respects
(Edema et al., 2001).
The ground water quality is a function of
natural process as well as anthropogenic
activities. Safe potable water is enormously
essential for living being and groundwater is
one of the sources for human consumption
in both urban as well as rural areas. In India
almost 80 percent of the rural population
depends on untreated groundwater for
potable supplies (Sudhakar et al., 2004).
Around the world people have used
groundwater as a source of drinking water,
and even today more than half the world‟s
population depends on groundwater for
survival (UNESCO, 1992).
In India, about 80% of the diseases are
believed to be water related and the World
Health Organization has reported that nearly
five million human deaths occur every year
through polluted drinking water (Singh,
2004). The impact of anthropogenic
activities has been so extensive that the
water bodies have lost their self-purification
capacity to large extent (Sood et al., 2008).
The quality of water is typically determined
by monitoring microbial presence,
especially faecal coliform bacteria (FC) and
physico-chemical parameters (EPA, 1999.)
The provision of potable water to the rural
and urban population is necessary to prevent
health hazards (Lemo, 2002). Before water
can be described as potable, it has to comply
with certain physical, chemical and
microbiological standards, which are
designed to ensure that the water is palatable
and safe for drinking (Tebutt, 1983).
Int.J.Curr.Microbiol.App.Sci (2016) 5(9): 89-104
91
The main source of drinking water in
Hukumpeta Mandal is open wells and
Kundi‟s (spring water, well and tap). Natural
springs (Oota) are the only source available
in remote villages for drinking water as well
as utility purpose. The tribal population
mostly drinks water without treatment under
unhygienic conditions, the impact of the
developmental activities on drinking water
sources has not been explored, and hence
there is a need to estimate the degree of
contamination in the water.
The main objective of this study to analyze
the twelve Physico-chemical parameters, of
drinking water in Bore, spring, Well, Tap
and tank (Kundi Water). To determine the
most probable number (MPN) of coliforms
and E. coli present in different drinking
water sources and also to confirm
characteristics of bacterial species by using
standard microbiological methods.
Materials and Methods
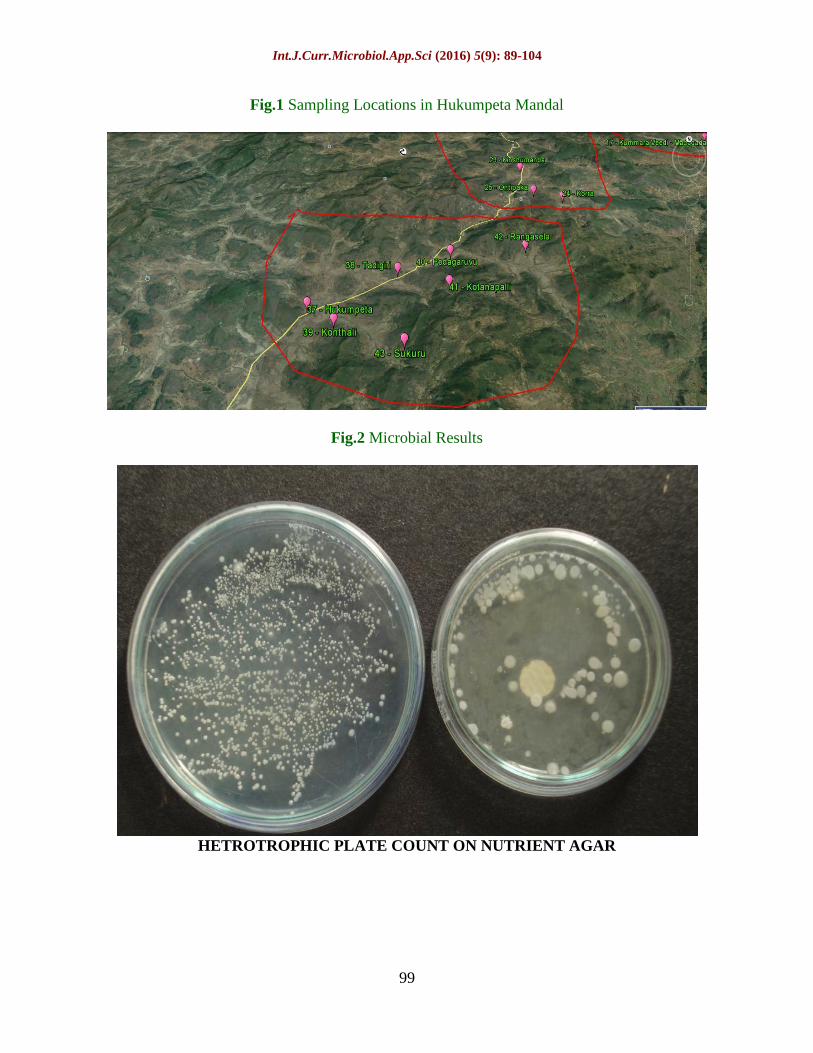
Study Area
The study area Hukumpata Mandal is 12 km
from Paderu Division located on the North
Easter part of Visakhapatnam dist., in
Andhra Pradesh, India. It lies between
18º12‟44.4” North longitude and
82º54‟51.6”E East longitude. The climate
conditions are very cool in the area on
account of elevation, green vegetation and
think forest. The temperature gets down
with the onset of south west monsoon and
tumbles to a mean minimum of 4oC by
January after which there is reversal trend
till the temperature reaches mean maximum
of 34oC by end of May, that is April to June
are warmest Months. The average minimum
temperature ranges from 30o to 40
oC in
November/December while average
maximum temperature ranges from 35oto
40oC in May/June. Regarding rainfall and
seasonal conditions usually the southwest
monsoon starts from 3rd week of April
every year and northeast monsoon starts
from October.
Sample Collection
Drinking water samples were collected from
springs, bores, wells and distribution system,
of different villages by grab sampling
method depending on the consumption
sources. The water samples collected in
sterilized bottles label with sample code and
transported to the laboratory in an icebox
and stored at 4oC, by following the standard
procedure laid by APHA 2005. The sample
were processed and analyzed for their
physical, chemical and bacteriological
parameters.
The physical, chemical analyses were
carried out at the Department Environmental
Sciences laboratory, in Andhra University
Visakhapatnam. The physical parameters
pH, Dissolved Oxygen (DO), Total
Dissolved Solids (TDS), Total Hardness
(TH), Calcium, Magnesium, Fluoride, and
Chloride, Nitrates, BOD, Sodium,
Potassium, Phosphors were determined.
Bacteriogical assay was used in the
determination of Heterotrophic Plate Count
CFU/100ml (HPC), Total coliforms
(100ml), Fecal coliform (100ml) analyzed in
drinking water according to APHA
(American public health Association 1995).
Analysis
Samples were collected from Oct 2014-15
respectively in Table1. The temperature was
determined using a mercury thermometer
(Tenson Delux make) on the spot, and the
pH was measured by pH meter (Elico
make), Electrical conductivity was measured
by using a digital conduct meter (systronic
make). Nephlo/Turbido meter was used for
Int.J.Curr.Microbiol.App.Sci (2016) 5(9): 89-104
92
turbidity determination. The samples are
also analyzed for TDS, Total hardness,
nitrate (NO3), calcium, Mg, chloride by
using Titration methods. DO was
determined by WINEUR‟S Iodometric
method. The Flouride was determined by
SPADAN‟S UV- Spectrophotometric.
Method. (Systronic make). Turbidimetric
method was employed for the estimation of
sulfate (SO4), nitrate amount was derived by
using the phenol disulphonic acid method.
All the results were compared with the BIS
(ISO-100500, 1994) and WHO standards for
drinking water quality.
The microbiological quality was determined
by standard most probable number (MPN)
method. In total coliform counts (TC) after
the necessary dilution was carried out in the
water samples. 10 ml of the sample was
taken in three tubes each with double
strength lactose broth tubes 1 ml was taken
into each of first three single strength lactose
broth tubes and 0.1 ml sample was
transferred into each one of the other three
tubes and incubated at 37oC for 24-48 hrs.
After the incubation period the gas
accumulation in Durham tubes was observed
and most probable coliform number was
determined using the MPN index (APHA,
2005). The media used for the
bacteriological analysis of water include
Plate Count Agar (PCA), Nutrient Agar
(NA), Lactose Broth (LB) and Eosin
Methylene Blue Agar (EMB). A serial
dilution method was used for total viable
count and the presumptive tests for
coliforms.
Results and Discussion
Physico-chemical aspects
In the study 16 physico-chemical parameters
in the drinking water samples were collected
from selected Bore, Well, spring, and tap
water sources has been studied. The
sampling stations were chosen on the basis
of the consumption by the Tribal people in
the study area. The samples were collected
as per schedule and the parameters are
analyzed three times in the season during the
entire period of investigation. An average of
three observations in a season with respect
to each sampling station and parameters
were calculated for further statistical
analysis. The results are summarized in table
1&2.
pH: The pH value of the water samples in
the study area varied from 6.5– 8.39 with a
mean of 7.60 indicating slight acidic to
alkaline nature. pH below 6.5 corrodes the
water pipe lines thereby releasing toxic
metals such as zinc, lead, cadmium and
copper (Shrivastava and Patil, 2002). It was
also observed that the relative quantities of
calcium, carbonates and bicarbonates
influence the pH value of the water. The
water tends to be more alkaline when it
possesses carbonates (Zafar, 1966;
Suryanarayana, 1995). Generally the pH
values of water source vary due to changes
in temperature and biological activities. pH
has been categorised under secondary
drinking water standard as it does not pose a
health risk. All biochemical reactions are
sensitive to the variation of pH (Jeyakumar
et al., 2003). PH value of all the sources
found to be below the permissible limit of
WHO i.e. 6.5-8.5.
Electrical conductivity
Electrical conductivity is a measure of
water‟s capacity to conduct electric current
since most of the salts in the water are
present in the ionic form. In general,
groundwater tends to have high electrical
conductivity due to the presence of high
amount of dissolved salts. Electrical

Int.J.Curr.Microbiol.App.Sci (2016) 5(9): 89-104
93
conductivity is a decisive parameter in
determining suitability of water for a
particular purpose. The recommended
permissible limits for electrical Conductivity
are 300µs/cm to 400µs/cm (ISO
10500:2004). The samples showed the
Electric Conductivity ranges from 147 to
730 us/cm.
The Electrical conductivity is higher than
the permissible limits in spring and well
water samples. The similar observations
were reported by Rao et al., (2004). , The
mean electrical conductivity in pre and post
monsoon are 378.5 us/cm. The high Electric
conductivity may be due to the silt carried
by the surface runoffs during rainy season in
the hilly areas.
Turbidity
The turbidity indicates clarity of water and
which is caused by living and nonliving
suspended matter and also colour producing
substances. The turbidity readings of the
samples range from 7.8 to 12.9 NTU, with
mean of 9.27 NTU in all the sources. In all
the water samples the turbidity values were
above the WHO and BIS standards, in the
spring and open well the turbidity value
were highly above the prescribed limits.
Since turbidity is a water quality parameter
that which can be monitored easily, and it
may also serve as a promising indicator for
microbial contamination of wells and
springs, although its reliability has been
discussed controversially (Ryan and
Meiman, 1996; Mahler et al., 2000; Pronk et
al., 2006, 2007). Leaching of organic matter,
industrial, domestic wastes etc., also
contribute to turbidity in groundwater
samples (Byragi et al., 2013).The presence
of in organic nutrients such as nitrogen and
phosphorus which may stimulate the growth
of algae, also contribute to turbidity (Sawyer
et al., 2000).
TDS
Total dissolved solids is a measure of the
combined content of all inorganic and
organic substances contained in a liquid in
molecular, ionized or micro granular
suspended form Balachandar et al., (2010).
Since TDS higher than 1000 mg/L impart
taste to the water, therefore, a desirable
value of 1000 mg/L is proposed by WHO.
Furthermore, a value higher than 1000 mg/L
results in excessive scales in water pipes,
heaters, boilers and household appliances
(WHO), Geneva, (2004).
The TDS values were recorded to be 380
mg/L to 1291mg/L and with mean of 812.85
mg/L. In spring water sample, the value was
found to be in the ranges of 1280- 1291
mg/L. However 40% of samples are within
the permissible limit and 60% of samples
are having high total dissolved solids TDS,
this may be due to the weathering of rocks
and soil.
Total hardness
The total hardness is represented by CaCo3
contamination in water. Hardness of water is
primarily due to dispersion of bicarbonates,
chlorides, and sulphates in water. According
to classification of total hardness (Durfor
and Becker, 1964). The value for the total
hardness varies from 60 to 160mg/L, and
with mean of 109.71mg/L. It can be seen in
the table 03 hardness in all the sources were
below the limits of WHO guideline i.e. 500
mg/L as CaCO3.
The hardness may be advantageous in
certain conditions; it prevents the corrosion
in the pipes by forming a thin layer of scale,
and reduces the entry of heavy metals from
the pipe to the water (Shrivastava et al.,
2002). As a matter of fact, this guideline
value is not proposed on the basis of health.
Consumers can tolerate water hardness in
excess of 500 mg/L. Water hardness above

Int.J.Curr.Microbiol.App.Sci (2016) 5(9): 89-104
94
500 mg/L needs excess use of soap to
achieve cleaning.
Calcium and magnesium (Ca2+ and
Mg2+)
The distribution of calcium and magnesium
concentrations in the water samples were
highly fluctuations during different periods.
The average concentration of calcium and
magnesium was 49.0mgL-1 and 60.71mgL-
1 respectively. The desirable limits for
calcium and magnesium for drinking water
are 75 and 30 mg/L, respectively (BIS
1991). The values were above the
permissible limit in both the monsoon period
compared to the WHO standard value of 75
mg/L. Maximum concentration of Calcium
was observed in well, spring and bore water
and minimum was in tap water, where as the
magnesium concentration found to be low in
well and bore sample and high value was
observed in spring and tap. Calcium may be
added to water system as it passes through
soil and rock containing large amounts of
these elements in mineral deposits (Renn,
1970).
Chlorides
Chlorides occur naturally in all types of
water but the concentration is very low in
natural water. Higher value of chloride
indicates pollution of water and gives an
undesirable taste. The Chloride
concentration ranges from 65 to 156 mg/L
with the mean of 85.65 mg/L to. The
desirable limit for chloride in drinking water
is 250mg/L (WHO, 1984), as the observed
in the table, 10 the values were below the
permissible limits in all sources. In general,
chlorides occur in all types of waters and the
contribution of chloride in the groundwater
is due to minerals like apatite, mica, and
hornblende and also from the liquid
inclusions of igneous rocks (Das and Malik,
1988).
Fluoride
The presence of fluoride in drinking water is
essential and WHO (1984) prescribed 1.5
mg/L fluoride as desirable limits in drinking
water. In this study fluoride concentration
health problems may arise from either
deficiency or excess amount (Gopal et al,
1985). The concentration of fluoride ions in
drinking water of study area is observed to
be within the permissible limits of WHO
and BIS standards. Fluoride concentration of
0.4 ppm in drinking water causes mild type
of dental fluorosis (Dinesh, 1999; Gupta et
al., 1993; Yadav and Lata, 2004).
Sulphates
Sulphates are a naturally occurring anion
found almost in all types of water. It gets
leached into the ground water by many
processes. One of those may be the
breakdown of organic substance in the soil
as mentioned by Alexander (1961). Sulphate
ion is one of the major anions occurring in
natural waters since they are readily soluble
in water. In the study the SO4-2
concentration varies from 1.6 to 20.5 mg/L.
No sample from the different sources has
exceeded BIS and WHO prescribed
standards i.e. (200mg/L) in the overall study
area the ground water appears to be suitable
for drinking purposes in respect of SO4. The
levels of sulphate in these water samples are
low. The sulphate recommended by WHO is
500 mg/L.
Nitrate
Presence of nitrate in water leads to organic
pollution. The water samples had nitrite
level range from 0.9 to 4.4 mg/L with mean
of 2.34 mg/L present. The nitrates
concentrations in all the samples were below
the prescribed standard of WHO, the level of
nitrate in the water samples is low generally.

Int.J.Curr.Microbiol.App.Sci (2016) 5(9): 89-104
95
Table.1 Sample Location and Samples Collected:
S.no Sampling location name Sample code Longitude latitude
1 Hukumpeta S1 18º12‟44.4”N 18º12‟44.4”N
2 Tadigiri S2 18º13‟3.9”N 82º54‟51.6”E
3 Konthili S3 18º17‟9.2”N 82º47‟36.5”E
4 Peddagaruvu S4 18º14‟27.3”N 82º42‟44.0‟‟E
5 Kotanapalli S5 18º12‟44.4”N 82º48‟44.5‟E
6 Rangasella S6 18º13‟3.9”N 82º54‟51.6”E
7 Sukuru S7 18º13‟21.25‟‟N 82º62 „ 38.2” E
Table.2 Analytical methods and equipment used in the study.
Table.4 MPN Index per100ml, HPC,Faecal streptococci and Faecal Coliform count.
S.No. Parameter Method Instruments/Equipment
A. Physico-chemical
1. pH Electrometric pH Meter
2. TDS Electrometric Conductivity/TDS Meter
3. Hardness Titration by EDTA -
4. Chloride Titration by AgNO3 -
5. Nitrate Phenol disulphinic Method UV-VIS Spectrophotometer
6. Fluoride SPADNS UV-VIS Spectrophotometer
7. Turbidity Nephlometric method Turbidity Nephlometer
8. Sulphates (TurbidometricMethod) Colourimeter
9. Calcium Titration by EDTA -
10. Magnesium Titration by EDTA -
11. DO Titration by Sodium
thiosulphate solution
-
12. BOD 5 days incubation at 20oC
followed by titration
BOD Incubator
Sampling location Sample
code
MPN/100m
l
Faecal coliform
count/
CFU/100ml
HPC/
CFU/100ml
Faecal
Streptococci
CFU/100ml
Hukumpeta S1 14 0.32 X 10⁴ 1.02 X 10
4 0.021 X 10
4
Tadigiri S2 20 0.54 X 10⁴ 1.62 X 10
4 0.012 X 10
4
Konthili S3 23 0.64 X 10⁴ 1.96 X 10
4 0.013 X 10
4
Peddagaruvu S4 120 2.21 X 10⁴ 2.86 X 10
4 0.69 X 10
4
Kotanapalli S5 150 3.20 X 10⁴ 3.24 X 10
4 1.23 X 10
4
Rangasella S6 460 3.65 X 10⁴ 6.90 X 10
4 1.45 X 10
4
Sukuru S7 1100 4.0 X 10⁴ 4.86 X 10
4 1.32 X 10
4

Int.J.Curr.Microbiol.App.Sci (2016) 5(9): 89-104
96
Table.3 Physico- Chemical Parameters of different sources.
S.no Parameters S1 S2 S3 S4 S5 S6 S7 mean ISO (10500:2004)
(Desirable limit)
WHO (Maximum
allowable limit)
SOURCE Bore Bore Bore Spring well well Spring
1 pH 7.60 8.39 6.92 7.76 8.39 6.50 7.65 7.601 6.5-8.5 6.5-8.5
2 TURBIDITY 8.6 7.8 8.9 10.2 8.5 8.0 12.9 9.271 5-10 NTU -
3 CONDUCTIVITY 210 334 147 196 363 670 730 378.5 300-400us/cm -
4 TOTAL SOLIDS 560 652 380 1291 658 869 1280 812.8 500 mg/L -
5 TOTAL HARDNESS 66 160 144 88 90 60 160 109.7 300 mg/L -
6 CALCIUM 38 60 12 49 40 34 110 49 75 mg/L 75mg/L
7 MEGNESIUM 28 100 132 39 50 26 50 60.71 30mg/L 50mg/L
8 CHLORIDES 86.1 78.2 156 68 69 77.3 65 85.65 250mg/L 250mg/L
9 FLOURIDES 0.6 0.2 0.1 0.3 0.2 0.3 0.2 0.271 1mg/L 1.0-1.5mg/L
10 SULPHATES 19.2 20.5 17.8 8.751 16.3 19.1 1.6 14.75 200mg/L 500mg/L
11 NITRATES BDL 1.6 3.6 4.4 1.2 0.9 BDL 2.34 - 3mg/L
12 DISSOLVED OXYGEN 6.5 6.1 5.2 6.6 6.9 6.5 3.9 5.957 - 5.0mg/L
Int.J.Curr.Microbiol.App.Sci (2016) 5(9): 89-104
97
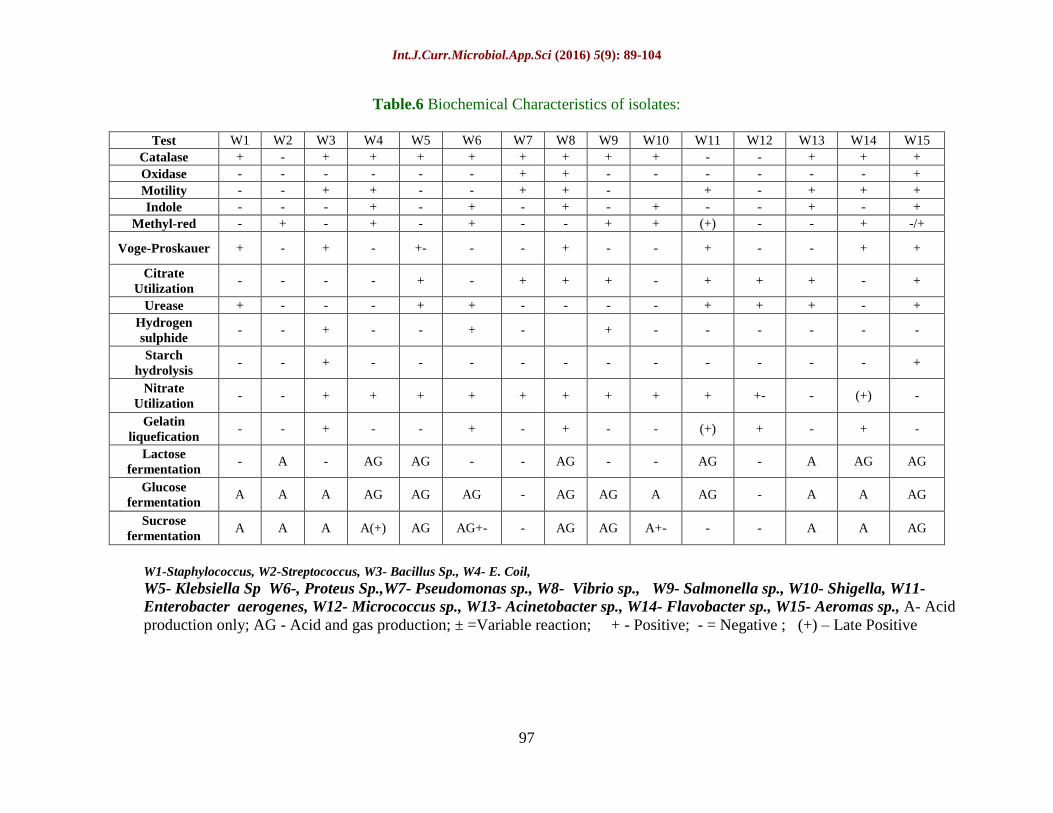
Table.6 Biochemical Characteristics of isolates:
Test W1 W2 W3 W4 W5 W6 W7 W8 W9 W10 W11 W12 W13 W14 W15
Catalase + - + + + + + + + + - - + + +
Oxidase - - - - - - + + - - - - - - +
Motility - - + + - - + + - + - + + +
Indole - - - + - + - + - + - - + - +
Methyl-red - + - + - + - - + + (+) - - + -/+
Voge-Proskauer + - + - +- - - + - - + - - + +
Citrate
Utilization - - - - + - + + + - + + + - +
Urease + - - - + + - - - - + + + - +
Hydrogen
sulphide - - + - - + - + - - - - - -
Starch
hydrolysis - - + - - - - - - - - - - - +
Nitrate
Utilization - - + + + + + + + + + +- - (+) -
Gelatin
liquefication - - + - - + - + - - (+) + - + -
Lactose
fermentation - A - AG AG - - AG - - AG - A AG AG
Glucose
fermentation A A A AG AG AG - AG AG A AG - A A AG
Sucrose
fermentation A A A A(+) AG AG+- - AG AG A+- - - A A AG
W1-Staphylococcus, W2-Streptococcus, W3- Bacillus Sp., W4- E. Coil,
W5- Klebsiella Sp W6-, Proteus Sp.,W7- Pseudomonas sp., W8- Vibrio sp., W9- Salmonella sp., W10- Shigella, W11-
Enterobacter aerogenes, W12- Micrococcus sp., W13- Acinetobacter sp., W14- Flavobacter sp., W15- Aeromas sp., A- Acid
production only; AG - Acid and gas production; ± =Variable reaction; + - Positive; - = Negative ; (+) – Late Positive

Int.J.Curr.Microbiol.App.Sci (2016) 5(9): 89-104
98
Table.5 Morphological characteristics of isolates
Isolate Morphogical Characteristics Organism
W1 Non- spore forming and non- motile, gram positive
cocci, circular, low convex with entire margin,
smooth, medium, opaque colony on Nutrient Agar,
Yellow colure colonies on Mannitol Salt Agra
Media grown at pH 7 and 370 C
Staphlococcus sp.
W2 Gram positive cocci, thin, even, growth on Nutrient
Agar, black or brown colure colonies on Bile esilin
Agar.
Group
DStreptococcus,
W3 Gram positive rod, spore forming, abundant, opapue,
white waxy growth on Nutrient Agar . Bacillus Sp.
W4 Gram negative rod, circular, low convex, with entire
margin, mucoid, opaque, growth on Nutrient Agar,
green metallic sheen colony on Eosin Methlene Blue
(EMB) Agar.
E. coil
W5 Gram negative rod, Slimy, white somewhat
translucent, raised growth on Nutrient Agar, Dark
pink colure colonies on MacConkey Agar. Klebsiella Sp
W6 Gram negative rod, thin, blue gray, spreading growth
on Nutrient Agar. Proteus Sp.,
W7 Gram negative rod, abundant, thin, white medium
turns green on Nutrient Agar. pink Colure colonies
on Phenothalin diphospate Agar. Pseudomonas sp.,
W8 Gram negative curved rod, abundant, thick, mucous
white colure colonies on Nutrient Agar. Yellow
colure colonies on TCBS agar Vibrio cholera
W9 Gram negative curved rod abundant, thick, mucous
white colure colonies on Nutrient Agar. Green
colure colonies on TCBS agar
Vibrio
.parahaemolytics
W10 Gram negative rod, thin even grayish growth on
Nutrient Agar Salmonella sp
W11 Gram negative rod, thin even grayish growth on
Nutrient Agar Shigella
W12 Gram negative rod, abundant thick, white glistening
growth on Nutrient Agar Enterobacter
aerogenes
W13 Gram positive, soft, smooth, yellow growth on
Nutrient Agar Micrococcus sp.
W14 Gram positive, grey-white with undulated margin on
Nurient Agar Acinetobacter sp.,
W15 Gram negative, non spore forming rod shaped,
facultatively anaerobic bacteria. Thick, mucous
white colure colonies on Nutrient Agar. Light yellow
to light to tan homogenous free flowing powder on
Starch Ampicillin Agar
Aeromas sp.,
Int.J.Curr.Microbiol.App.Sci (2016) 5(9): 89-104
99
Fig.1 Sampling Locations in Hukumpeta Mandal
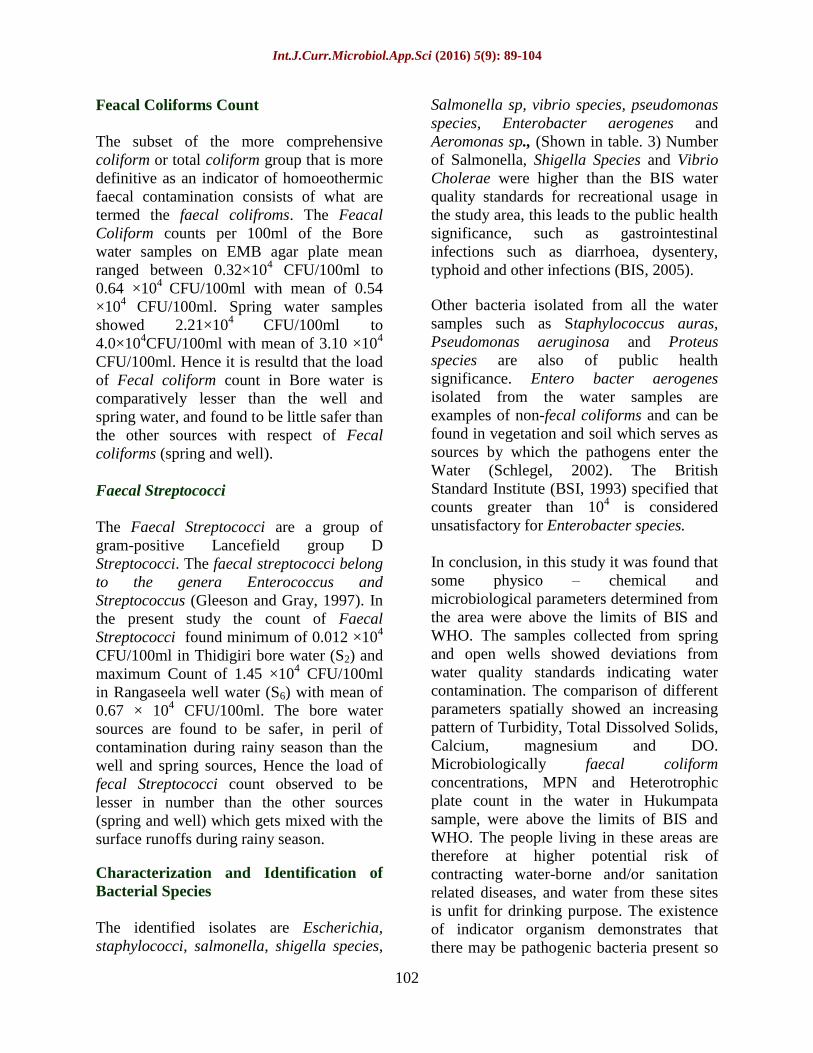
Fig.2 Microbial Results
HETROTROPHIC PLATE COUNT ON NUTRIENT AGAR

Int.J.Curr.Microbiol.App.Sci (2016) 5(9): 89-104
100
E.coli (Dark Pink) on Endo agar. Brown colonies on Bileesulin Agar (Fecal
Streptococci)
Graph.1 HPC, Faecal streptococci and Faecal Coliform count in sampling locations

Int.J.Curr.Microbiol.App.Sci (2016) 5(9): 89-104
101
The WHO standard for nitrate is 50mg/L
and above this limits may cause cyanosis
disease or blue baby syndrome in infants
less than 3months (WHO, 2006). Human
and animal wastes, industrial effluents,
application of agro chemicals, seepage and
silage through drainage system are the main
sources of nitrate contamination in
groundwater (Robertson et al., 1991 and
Agrawal et al., 1999).
Dissolved Oxygen
It is one of the most important aspect in
evaluating water quality and signifies
physical and biological process dealing with
water quality. Good water should have
solubility of oxygen in 7.0 to 7.6 mg/L at
350C to 36
0C respectively (Kudesia, 1995).
Oxygen saturated water have pleasant taste.
In the study, the DO found to be in the range
of 13.9 to 6.9 mg/L with mean of 5.95mg./L.
In spring bore and well sample the Do
concentration were found to be slightly
above the permissible limit of WHO i.e. 5.0
mg/L.
Microbiological aspects
In this study 07 drinking water samples
collected from Different sources in
Hukumpeta Mandal of Visakhapatnam were
analyzed for the bacteriological quality. It
was found that all microbiological and some
chemical values determined from
groundwater were above the limits set by
CPCB and World Health Organization
(WHO). The microbiological examination of
water is a direct indicator of faecal
contamination and its extent of risk to
human health. Selected indicator organisms
are routinely monitored to indicate the
probability of pathogenic population in
water. Many indicators have been studied
and recommended for water quality
assessment (ISO, 1990; Standard methods
1998).
The Most Probable Number (MPN)
The quality of water is typically determined
by monitoring microbial presence,
especially Faecal Coliform bacteria (FC)
and physico chemical parameters (EPA,
1999). MPN counts were recorded highest at
Sukuru spring (1100MPN/100ml) and
Hukumpeta (bore) has recorded the lowest
value of 14 MPN/100ml as shown in the
Table 4. Presence of coliforms in drinking
water sources indicates inadequate treatment
and sanitation which is necessary for
drinking (Christine et al., 2006).
Accordingly the Total Coliform Count for
all the samples was higher than the BIS. The
high Coliform count obtained in the samples
may be an indication that the water sources
are feacelly contaminated. According to BIS
Standards every water sample that has
coliform must be analyzed for either faecal
coliforms or E.coli (BIS, 2005). The present
study exposed that the spring water and
open well water has high load of coli form,
when compared with that of some bore, tank
and tap water samples.
Heterotrophic Plate Count
A number of aerobic and facultative
anaerobic bacteria can be isolated by using
Heterotrophic Plate Count. It includes both
gram positive and gram negative bacteria.
This HPC will give the total bacterial count
present in 100 ml of water. They form the
colony forming units by counting this
CFU/100ml. In the study the minimum HPC
count was 1.02 x 10⁴
CFU/100ml in
Hukumpeta bore (S1) water and maximum
count was observed at Rangaseela well
water sample (S6). HPC mean value was
3.06×10⁴ CFU/100ml. The total bacterial
counts for all the water samples were
generally high exceeding the limit of
1.0×10⁴ CFU/100ml which is the standard
limit of heterotrophic count for drinking
water (EPA, 2002).
Int.J.Curr.Microbiol.App.Sci (2016) 5(9): 89-104
102
Feacal Coliforms Count
The subset of the more comprehensive
coliform or total coliform group that is more
definitive as an indicator of homoeothermic
faecal contamination consists of what are
termed the faecal colifroms. The Feacal
Coliform counts per 100ml of the Bore
water samples on EMB agar plate mean
ranged between 0.32×10⁴ CFU/100ml to
0.64 ×10⁴
CFU/100ml with mean of 0.54
×104
CFU/100ml. Spring water samples
showed 2.21×10⁴
CFU/100ml to
4.0×10⁴CFU/100ml with mean of 3.10 ×10
4
CFU/100ml. Hence it is resultd that the load
of Fecal coliform count in Bore water is
comparatively lesser than the well and
spring water, and found to be little safer than
the other sources with respect of Fecal
coliforms (spring and well).
Faecal Streptococci
The Faecal Streptococci are a group of
gram-positive Lancefield group D
Streptococci. The faecal streptococci belong
to the genera Enterococcus and
Streptococcus (Gleeson and Gray, 1997). In
the present study the count of Faecal
Streptococci found minimum of 0.012 ×10⁴
CFU/100ml in Thidigiri bore water (S2) and
maximum Count of 1.45 ×10⁴ CFU/100ml
in Rangaseela well water (S6) with mean of
0.67 × 10⁴ CFU/100ml. The bore water
sources are found to be safer, in peril of
contamination during rainy season than the
well and spring sources, Hence the load of
fecal Streptococci count observed to be
lesser in number than the other sources
(spring and well) which gets mixed with the
surface runoffs during rainy season.
Characterization and Identification of
Bacterial Species
The identified isolates are Escherichia,
staphylococci, salmonella, shigella species,
Salmonella sp, vibrio species, pseudomonas
species, Enterobacter aerogenes and
Aeromonas sp., (Shown in table. 3) Number
of Salmonella, Shigella Species and Vibrio
Cholerae were higher than the BIS water
quality standards for recreational usage in
the study area, this leads to the public health
significance, such as gastrointestinal
infections such as diarrhoea, dysentery,
typhoid and other infections (BIS, 2005).
Other bacteria isolated from all the water
samples such as Staphylococcus auras,
Pseudomonas aeruginosa and Proteus
species are also of public health
significance. Entero bacter aerogenes
isolated from the water samples are
examples of non-fecal coliforms and can be
found in vegetation and soil which serves as
sources by which the pathogens enter the
Water (Schlegel, 2002). The British
Standard Institute (BSI, 1993) specified that
counts greater than 104 is considered
unsatisfactory for Enterobacter species.
In conclusion, in this study it was found that
some physico – chemical and
microbiological parameters determined from
the area were above the limits of BIS and
WHO. The samples collected from spring
and open wells showed deviations from
water quality standards indicating water
contamination. The comparison of different
parameters spatially showed an increasing
pattern of Turbidity, Total Dissolved Solids,
Calcium, magnesium and DO.
Microbiologically faecal coliform
concentrations, MPN and Heterotrophic
plate count in the water in Hukumpata
sample, were above the limits of BIS and
WHO. The people living in these areas are
therefore at higher potential risk of
contracting water-borne and/or sanitation
related diseases, and water from these sites
is unfit for drinking purpose. The existence
of indicator organism demonstrates that
there may be pathogenic bacteria present so
Int.J.Curr.Microbiol.App.Sci (2016) 5(9): 89-104
103
that it is necessary to disinfect the
groundwater before human use. In
conclusion, it is necessary to apply strong
preventions immediately to save water from
deterioration in the study area. Its evidence
that water borne diseases, sewage treatment
and purify the water to make it fit for
drinking, since the associable organisms are
of public health significance being
implicated in one form of infection or other.
The areas which are no facility of municipal
tap water, in those areas educative
programmes must be organized by
researchers and Government agencies to
aware the villagers on the proper use of
surface water.
References
Agrawal, G.D., S.K. Lunkad and T.
Malkhed. 1999. Diffuse agricultural
nitrate pollution of groundwater in
India, Water science and technology,
39(3), pp 67-75Institute, Washington
D.C, pp. 333-340.
Agrawal, G.D., S.K. Lunkad and T.
Malkhed. 1999. Diffuse agricultural
nitrate pollution of groundwater in
India, Water science and technology,
39(3), pp 67-75Institute, Washington
D.C, pp. 333-340.
Alexander, M.M., P. Longabucco & D.M.
Philips. 1981. The impacts of oil on
marsh communities in the St.
Lawrence River: Oil Spill Conference,
American Petroleum.
APHA, AWWA and WPCF, “Standard
Methods for the Examination of Water
and Wastewater,” 20th Edition,
Published Jointly by American Public
Health Association, American Water
Works Association and Water
Pollution Control Federation,
Washington, 1998.
APHA. 2005. Standard methods for water
and Waste Water Analysis,American
Public Health Association. USA.
Balachandar, D., Sundararaj, P., Rytharvel,
Murthy, K., Kumaraswamy, K. 2010.
An investigation of ground water
quality and its suitability to irrigate
agriculture in Coimbatore district,
Tamil Naidu, India- Int. J. Environ.
Sci., vol1, no 2:176-190.
BIS. 2005. Indian Standards for Drinking
Water Quality Specifications (IS
10500 - 1991) Bureau of Indian
standards.
Byragi Reddy, T., Prasada Rao, P.V.V.,
Ch.Venkata Ramana, Hema Latha, S.,
Syam Kumar, B. 2013. Assessment of
ground water quality in an industrial
agglomeration of Visakhapatnam, A. P
Int. J. Environ. Sci., Volume 3 No.5,
Dinesh, C. 1999. Fluoride and human health
– cause for concern, Indian J. Environ.
protection, 19(2), 81-89 (1999). 32.
Edema, M.O., Omemu, A.M., Fapetu, O.M.
2001. Microbiology and
physicochemical Analysis of different
Sources of drinking water in
Abeokuta. Nigeria. Niger J.
Microbial., 15: 57-61.
EPA. 2002. U.S. Environment Protection
Agency, Safe Drinking Water Act.
USA.
EPA. 2003. U.S. Environment Protection
Agency, Safe Drinking Water
Act.USA.
EPA. 2003. U.S. Environment Protection
Agency, Safe Drinking Water
Act.USA.
Gupta, S.C., G.S. Rathore and C.S. Doshi.
1993. Fluorida distribution in ground
waters of South-eastern Rajasthan,
Indian J. Environ. Health, 35(2), Pp
97-106 33.
Jeyakumar, T., Indira, S., and Thillai Aasu,
p. 2003 .Status of ground water quality
and public health around Tiruchendur
Indian J. Env. Prot., 23(3): 256-260.
Lamikanra. 1999. Essential Microbiology of

Int.J.Curr.Microbiol.App.Sci (2016) 5(9): 89-104
104
Students and Practitioners of
Pharmacy, Medicine and
Microbiology. 2nd ed. Amkra Books
Lagos, P.406
Lemo, O. 2002. Bacteriology Determination
of Water with long term Storage
UNAAB A beokuta,p.40.
Mahler, B.J., Personne´ J.C., Lods, G.F.,
Drogue, C. 2000. Transport of free and
particulate-associated bacteria in karst.
J. Hydrol., 238: 179–193.
Pronk, M., Goldscheider, N., Zopfi, J. 2007.
Particle-size distribution as indicator
for fecal bacteria contamination of
drinking water from karst springs.
Environ, Sci, Technol.
Rajankar, P.N., D.M., Tambeekar and S.r.
Wate, Seasonal Variation in Ground
Water Quality of Yavatmal District
India, E-Journal Chem.,
http://www.e.journals.net.
Renn, C.E. 1970. Investigating water
problems. Educational Products
division Lamotte Chemical Products
company Maryland, U.S.A.
doi:10.1021/es071976
Robertson, W.D., J.A. Cherry and E.A.
Sudicky. 1991. Groundwater
contamination from two small.
Ryan, M., Meiman, J. 1996. An examination
of short-term variations in water
quality at a karst spring in Kentucky.
Ground Water, 34: 23–30.
Sargaonkar, A. and Deshpande, V. 2003.
Environ. Monit Assess, 89: 43-67.
8(2); 870-874.
Sawyer, Clair, N., Perry, L. McCarty, Gene
F., Parkin. 2000. Chemistry for
environmental engineering. IVth Ed.,
Tata McGraw-Hill. New Delhi.
Schlegel, H.G. 2002. General Microbiology.
7th ed. cambridge University
press.480p.
Shrivastava, V.S. and P.R. Patil. 2002. Tapti
river water pollution by industrial
wastes: A statistical approach, Nature
Environ. Pollu. Technol., 1(3): pp 279-
283.
Singh, K. 2004. Fluoride Scenario some
preventive steps. Jojana, Vol.48, No.6
Singh, R.P., and Mathur, P. 2005.
Investigation of variations in
physicochemical characteristics of a
fresh water reservoir of Ajmer city,
Rajasthan, Ind. J. Environ. Sci., 9: 57-
61.
Sood, A., Singh, K.D., Pandey, P., &
Sharma, S. 2008. Assessment of
bacterial indicators and physic-
chemical parameters to investigate
pollution status of Gangetic river
system of Uttarkhand (India).
Ecol.Indicator ,Vol.8. pp.709-717.
WHO. 2004. Water Sanitation and Health
Programme. Managing Water in the
Home: Accelerated Health gains from
Improved Water Sources. World
Health Organization. www.who.int.
Yadav, J.P. and S. Lata. 2004. Fluoride
levels in drinking water sources in
rural areas of block Jhajjar, district
Jhajjar, Haryana, J. Indian Water
Works Assoc., pp 131-136.
How to cite this article:
Syam Kumar Bariki and Geetha Saramnada. 2016. A Study on Physico-chemical and
Microbiological Quality of Drinking Water in Tribal Area of Hukumpeta Mandal,
Visakhapatnam District, Andhra Pradesh, India. Int.J.Curr.Microbiol.App.Sci. 5(9): 89-104.
doi: http://dx.doi.org/10.20546/ijcmas.2016.509.011