a study on hydrogen storage through adsorption in
TRANSCRIPT

HAL Id: pastel-00001383https://pastel.archives-ouvertes.fr/pastel-00001383
Submitted on 25 Oct 2005
HAL is a multi-disciplinary open accessarchive for the deposit and dissemination of sci-entific research documents, whether they are pub-lished or not. The documents may come fromteaching and research institutions in France orabroad, or from public or private research centers.
L’archive ouverte pluridisciplinaire HAL, estdestinée au dépôt et à la diffusion de documentsscientifiques de niveau recherche, publiés ou non,émanant des établissements d’enseignement et derecherche français ou étrangers, des laboratoirespublics ou privés.
A study on hydrogen storage through adsorption innanostructured carbons
David Langohr
To cite this version:David Langohr. A study on hydrogen storage through adsorption in nanostructured carbons. En-gineering Sciences [physics]. École Nationale Supérieure des Mines de Paris, 2004. English. NNT :2004ENMP1249. pastel-00001383

Collège doctoral
N° attribué par la bibliothèque
|__|__|__|__|__|__|__|__|__|__|
T H E S E
pour obtenir le grade de Docteur de l’Ecole des Mines de Paris
Spécialité “Energétique”
présentée et soutenue publiquement par David LANGOHR
le 21 octobre 2004
ÉTUDE DU STOCKAGE D’HYDROGÈNE PAR ADSORPTION DANS DES CARBONES NANOSTRUCTURÉS /
A STUDY ON HYDROGEN STORAGE THROUGH ADSORPTION IN NANOSTRUCTURED CARBONS
Directeurs de thèse : Patrick ACHARD et Laurent FULCHERI
Jury :
M. Edward McRAE.........................................................................Président / Rapporteur M. Pierre LE CLOIREC ....................................................................................Rapporteur M. Gilles FLAMANT..................................................................................... Examinateur M. Alain RAVEX........................................................................................... Examinateur M. Laurent FULCHERI.................................................................................. Examinateur M. Patrick ACHARD ..................................................................................... Examinateur

A toi Amanda, Nuit tropicale et caressante, Où, sur la mer, bondissant, Notre navire au front puissant Trace une frange éblouissante. Sur la route qu’il s’est frayée, Quelquefois le regard rêveur Voit flamboyer une lueur. C’est une baleine, effrayée. Puis, quand vient l’aube, la rosée, Sous l’éclat du soleil Fusant de biais au ciel vermeil, Sur les cordages s’est posée. Et sur l’immense piste verte, A pleines voiles, en longs remous, Nous cinglons toujours devant nous, Sur la piste immense et déserte.
Rudyard Kipling, The Long Trail, 1892.

Cette thèse s’est déroulée dans le laboratoire du Centre d’Energétique de l’Ecole des Mines de Paris sur le site de Sophia-Antipolis. Je remercie Didier Mayer, Directeur-Adjoint du CENERG, de m’avoir accueilli dans son laboratoire.
Merci à mes deux directeurs de thèse, Patrick Achard et Laurent Fulcheri, responsables scientifiques au CENERG. Il n’est pas forcément évident de s’entendre avec son directeur de thèse. J’ai eu la chance - et le challenge - d’en avoir deux ! De tempéraments fort différents, mais qui - fort heureusement - se révélèrent complémentaires dans mes progressions et mes enlisements… Qu’ils trouvent ici l’expression de toute ma gratitude pour leur écoute respective, tant scientifique qu’humaine.
Merci à Edward McRae, Directeur de Recherche du groupe Matériaux à squelette carboné au laboratoire CNRS de Nancy, d’avoir bien voulu tenir le double rôle de rapporteur de ce manuscrit et de président du jury pendant la soutenance. Au delà de ces ‘missions’, je tiens à remercier Ted pour la qualité de nos échanges ces dernières années. Son regard critique et son recul tout au long de mon cheminement m’ont aidé à accepter que le résultat final ne devait pas être une fin en soi. Toute démarche scientifique prend racine dans l’exigence de la fiabilité d’une mesure.
Merci au Professeur Pierre Le Cloirec, responsable du département Systèmes Energétiques et Environnement de l’Ecole des Mines de Nantes, d’avoir également accepté la fonction de rapporteur de ce travail et d’avoir participé au jury de ma thèse. A sa suggestion de deuxième thèse je réponds que je préfère en rester au bon souvenir de celle-ci !
Merci à Alain Ravex, Directeur Technique de la Division des Techniques Avancées d’Air Liquide à Sassenage, et au Professeur Gilles Flamant, Directeur de Recherche et directeur du laboratoire CNRS PROMES (PROcédés, Matériaux et Energie Solaire) à Odeillo, qui ont bien voulu faire partie de mon jury de thèse. Je n’ai malheureusement pu profiter de leur présence lors de la soutenance - qui heureusement ne sera pas partie remise ! Néanmoins, j’espère avoir l’occasion de travailler avec des personnes de leur compétence dans les années à venir.
Merci à Sandrine Berthon-Fabry et José Gonzalez-Aguilar pour leur disponibilité et leurs compétences complémentaires qui m’ont été d’un grand recours. Ils ont facilité la cohésion du travail contractuel et scientifique entre les directeurs de thèse et le doctorant.
Merci à Arnaud Rigacci pour son aide précieuse sur le SAXS et son enthousiasme quotidien, ainsi qu’à Rudolf Metkemeijer, qui fut un des initiateurs de ce projet sur l’étude du stockage d’hydrogène et sans lequel il n’aurait jamais eu lieu. Tous deux se sont toujours montrés à l’écoute.
Merci également à toute l’équipe permanente du CENERG de Sophia-Antipolis qui contribue quotidiennement au bon fonctionnement du laboratoire, au niveau informatique, technique ou logistique, et facilite la vie du doctorant.
J’ai passé de longues heures dans le bureau B-R07 en compagnie d’Antoine, Julien et Yasmine. Je leur suis reconnaissant d’avoir su partager les moments « difficiles » et les prie de garder plus spécialement les bons souvenirs qui ne manquent pas. Merci à la bouilloire d’Antoine !
Un grand merci à toute ma famille et tout particulièrement à mes parents pour leur soutien inconditionnel.
Merci enfin à ma femme, d’être à mes côtés, tout simplement…


1 Introduction .....................................................................................................................9
2 Hydrogen and various means to store it......................................................................10
2.1 Hydrogen ...................................................................................................................... 10 2.1.1 Hydrogen properties ............................................................................................................. 10 2.1.2 Hydrogen production............................................................................................................ 12 2.1.3 The issues of hydrogen storage ............................................................................................ 13
2.2 Compressed hydrogen .................................................................................................. 13 2.2.1 Types of vessels for compression......................................................................................... 13 2.2.2 Conformable vessels............................................................................................................. 14
2.3 Liquefied hydrogen (LH2)............................................................................................ 15 2.3.1 The liquefaction process....................................................................................................... 16 2.3.2 The cylinders used for LH2.................................................................................................. 16 2.3.3 Actors and applications ........................................................................................................ 17
2.4 Metal hydrides .............................................................................................................. 19 2.4.1 The hydriding and dehydriding process ............................................................................... 19 2.4.2 Different types of metal hydrides ......................................................................................... 21
2.5 Other storage techniques .............................................................................................. 23
2.6 Summary of hydrogen storage technologies................................................................. 24
2.7 Physical adsorption in carbons ..................................................................................... 25 2.7.1 A few definitions .................................................................................................................. 25 2.7.2 Gas on Solid adsorption........................................................................................................ 27 2.7.3 The specific case of carbon .................................................................................................. 28
3 Carbon materials used for hydrogen storage..............................................................29
3.1 Graphitic carbon ........................................................................................................... 29
3.2 Carbon black and activated carbon............................................................................... 31 3.2.1 The main elaboration processes............................................................................................ 32 3.2.2 Growth and texture of carbon blacks.................................................................................... 33 3.2.3 Activated carbon................................................................................................................... 33
3.3 Carbon nanofibres ........................................................................................................ 34
3.4 Carbon fullerenes.......................................................................................................... 36
3.5 Carbon nanotubes ......................................................................................................... 37 3.5.1 Presentation of the Carbon nanotubes .................................................................................. 37 3.5.2 Producing carbon nanotubes................................................................................................. 39 3.5.3 Various theories on the nucleation and growth of carbon nanotubes ................................... 41 3.5.4 Influence of various parameters ........................................................................................... 42
4 Methods available to measure the hydrogen storage .................................................44
4.1 Expressing the amount of hydrogen stored .................................................................. 44
4.2 The experimental techniques to measure the hydrogen storage ................................... 46 4.2.1 Gravimetric method.............................................................................................................. 46 4.2.2 Volumetric method............................................................................................................... 47 4.2.3 Temperature programmed desorption (TPD) ....................................................................... 48 4.2.4 Electrochemical measurements ............................................................................................ 49

4.3 Classical pitfalls on measuring hydrogen storage......................................................... 50 4.3.1 The sample............................................................................................................................51 4.3.2 The pressure vessel ...............................................................................................................51 4.3.3 Experimental protocol ..........................................................................................................52 4.3.4 Measurement techniques.......................................................................................................52
4.4 The experimental calibration ........................................................................................ 53
5 Hydrogen storage in nanostructured carbon materials ............................................ 53
5.1 Graphite, carbon black and activated carbons .............................................................. 53 5.1.1 Preliminary results ................................................................................................................53 5.1.2 The influence of the experimental conditions.......................................................................54 5.1.3 Carbon treatment effect ........................................................................................................56
5.2 Carbon nanofibres......................................................................................................... 58 5.2.1 Catalytic hydrogen transfer...................................................................................................59 5.2.2 High temperature heat treatment...........................................................................................59
5.3 Carbon nanotubes ......................................................................................................... 60 5.3.1 Alkali-doped nanotubes ........................................................................................................61 5.3.2 Purification by chemical and/or heat treatment ....................................................................61 5.3.3 The sonication of nanotubes .................................................................................................62 5.3.4 Multi Wall carbon nanotube .................................................................................................62 5.3.5 Electrochemical storage of hydrogen in carbon nanotubes...................................................63
5.4 The chemical adsorption of hydrogen in fullerenes...................................................... 64
6 Conclusion ..................................................................................................................... 65
1 Introduction................................................................................................................... 74
2 Presentation of the experimental set-up...................................................................... 75
2.1 Presentation and instrumentation of the test bench....................................................... 75 2.1.1 Presentation of the set-up......................................................................................................75 2.1.2 Acquisition unit ....................................................................................................................77
2.2 Measuring range ........................................................................................................... 78
2.3 Advantages of such a process ....................................................................................... 79
3 Calculating the weight percent stored and the errors generated ............................. 81
3.1 The volumetric method................................................................................................. 81
3.2 Desorbing the empty pressure vessel ............................................................................ 82 3.2.1 The determination of the equation for the empty pressure vessel.........................................82 3.2.2 Calculating the volume of the pressure vessel ......................................................................82
3.3 The gravimetric percentage – a comparison to pure compression................................ 84
3.4 Calculating the intrinsic gravimetric percentage of our materials ................................ 86 3.4.1 Configuration of the carbon in the vessel .............................................................................86 3.4.2 Defining the intrinsic weight percent....................................................................................87
3.5 Calculation of the errors ............................................................................................... 88 3.5.1 Wt% calculated compared to compression ...........................................................................88 3.5.2 The intrinsic weight percent .................................................................................................89
3.6 The limits of the test bench........................................................................................... 89
4 Experimental protocol and calibration of the experimental set-up ......................... 91

4.1 Experimental protocol .................................................................................................. 91 4.1.1 The outgassing of the sample ............................................................................................... 91 4.1.2 The pressurisation of the pressure vessel.............................................................................. 92 4.1.3 The desorption process ......................................................................................................... 93
4.2 Calibration of the measuring device ............................................................................. 94 4.2.1 Leak proof tests .................................................................................................................... 94 4.2.2 Reproducibility of an empty measurement........................................................................... 95
4.3 Calibration with a non adsorbing material.................................................................... 96 4.3.1 Experimental protocol .......................................................................................................... 96 4.3.2 Measurements and errors...................................................................................................... 97 4.3.3 Conclusions on this measurement ........................................................................................ 98
4.4 Calibration with a metal hydride .................................................................................. 99
4.5 Testing our materials in a different laboratory ........................................................... 100
5 Conclusion ....................................................................................................................100
1 Introduction .................................................................................................................104
2 Carbon aerogels ...........................................................................................................105
2.1 The elaboration process of Carbon aerogels............................................................... 105 2.1.1 The sol-gel reaction ............................................................................................................ 106 2.1.2 The CO2 supercritical drying.............................................................................................. 107 2.1.3 The pyrolysis ...................................................................................................................... 110 2.1.4 Experimental procedure...................................................................................................... 110
2.2 The influence of the chemistry on the microstructure ................................................ 112 2.2.1 Representation of a carbon aerogel .................................................................................... 112 2.2.2 The influence of the R/C ratio and the solid percent .......................................................... 113 2.2.3 The influence of the heat treatment: pyrolysis and activation ............................................ 114
2.3 Properties and applications of carbon aerogels .......................................................... 116 2.3.1 Properties of carbon aerogels ............................................................................................. 116 2.3.2 Applications of carbon aerogels ......................................................................................... 117 2.3.3 Hydrogen storage ............................................................................................................... 118
3 The high temperature plasma process.......................................................................119
3.1 Production of carbon blacks ....................................................................................... 119 3.1.1 Presentation of the initial technology ................................................................................. 119 3.1.2 The operating principle....................................................................................................... 120 3.1.3 Numerical modelling .......................................................................................................... 123
3.2 Adaptation of the plasma technology ......................................................................... 123 3.2.1 Production of carbon fullerenes.......................................................................................... 126 3.2.2 Production of carbon nanotubes ......................................................................................... 126
3.3 Advantages of the plasma process.............................................................................. 127
4 Conclusion ....................................................................................................................128
1 Introduction .................................................................................................................132
2 Characterisation of the two families of samples .......................................................133

2.1 Characterisation of the carbon aerogels ...................................................................... 133 2.1.1 Mercury pycnometry ..........................................................................................................133 2.1.2 Elemental analysis ..............................................................................................................134 2.1.3 Raman spectroscopy ...........................................................................................................134 2.1.4 Helium pycnometry ............................................................................................................135 2.1.5 TEM analysis ......................................................................................................................136 2.1.6 Nitrogen adsorption ............................................................................................................137 2.1.7 SAXS analysis ....................................................................................................................142
2.2 The samples produced by the high temperature plasma process ................................ 145 2.2.1 Carbon black.......................................................................................................................146 2.2.2 Fullerene rich soots.............................................................................................................150 2.2.3 Nanotube rich soots ............................................................................................................152 2.2.4 Conclusion on the carbons from the plasma process ..........................................................157
3 The experimental results with the carbon aerogels ................................................. 157
3.1 Presentation of the results ........................................................................................... 157
3.2 Microstructural effect on the hydrogen storage .......................................................... 159 3.2.1 Influence of the specific surface area..................................................................................159 3.2.2 Influence of the porosity .....................................................................................................160 3.2.3 The surface area..................................................................................................................164 3.2.4 The gaseous chord length and the particle size...................................................................164 3.2.5 Conclusions ........................................................................................................................166
4 Results with the carbons coming from the plasma process..................................... 167
4.1 Three families of carbons tested ................................................................................. 167
4.2 The problem of the intrinsic weight percent ............................................................... 167 4.2.1 The skeleton density ...........................................................................................................167 4.2.2 The weight percent of nanotubes ........................................................................................168
4.3 Analysing the hydrogen weight percent compared to compression............................ 169
5 Carbon nanofibres ...................................................................................................... 171
6 Conclusions .................................................................................................................. 172
! ! " # $
1 Appendix 1 : The experimental protocol for hydrogen storage measurements and security issues ....................................................................................................................... 202
2 Appendix 2 : The estimation of the experimental technical errors ........................ 206
3 Appendix 3 : Experimental techniques for the characterisation of materials ...... 208
3.1 Nitrogen adsorption .................................................................................................... 208 3.1.1 Classification of the isotherms............................................................................................208 3.1.2 The BET treatment .............................................................................................................211 3.1.3 Pore size distribution ..........................................................................................................212
3.2 Small Angle X-Ray Scattering.................................................................................... 213 3.2.1 Basic principles of X-Ray scattering ..................................................................................213 3.2.2 The Porod regime ...............................................................................................................215 3.2.3 The Guinier regime.............................................................................................................216 3.2.4 Fractal diffusion..................................................................................................................217 3.2.5 Calculating the specific surface area...................................................................................217

3.2.6 The two phase media model ............................................................................................... 217
3.3 Mercury pycnometry .................................................................................................. 218
3.4 Helium pycnometry .................................................................................................... 219
3.5 Elemental analysis ...................................................................................................... 220
3.6 Raman Spectroscopy .................................................................................................. 220
3.7 Electron microscopy ................................................................................................... 221
%


Chapter I General Introduction
1

Chapter I General Introduction
2
I GENERAL INTRODUCTION

Chapter I General Introduction
3
Energy and environment are two major concerns for our modern society. With the coming shortage in primary energy sources provided from fossil fuels, and the greenhouse effect with the increasing emission of carbon dioxide and the considerable pollution coming from industrialisation, the technical challenge for the coming years is to found new energy resources compatible with sustainable energies and the cut-down in the polluting emissions.
Hydrogen has been under investigation for its potential use as an alternative energy for the past number of decades. Clean, renewable and adaptable, it has a wide range of possible applications, as both stationary and mobile source of energy. Current developments in hydrogen technology include its use in fuel cells.
A fuel cell is an electrochemical device that converts hydrogen and oxygen into water to produce electricity. This technology can be used to provide power to both mobile and stationary applications, from personal vehicles with the proton exchange membrane fuel cell (PEMFC), to central power plants with the solid oxide fuel cell (SOFC). This technology is pollution-free with no greenhouse gas emissions.
One of the most important challenges in the development of fuel cells for automotive applications is the storage of the hydrogen fuel. This one can either be produced on-board thanks to the internal reforming of hydrogen rich hydrocarbons such that the hydrogen is produced on demand, or it can be stored in the vehicle, either as a gas or as a liquid.
The actual requirements of the American department of energy are set to 2.9 kg of hydrogen for a driving range over 500 km. If one considers a storage at room temperature and ambient pressure in the same volume as previously used by the conventional gasoline tank, a volume of 32000 L of hydrogen gas should be stored in a physical volume of around 60 L. This is the main issue in the on-board storage of hydrogen. One of the solutions being to store hydrogen at a higher pressure and a lower temperature, which increases the gas density. In order not to store the hydrogen gas at a pressure too high, it has been decided to test the ability of carbon adsorbent to store hydrogen, thereby reducing the total gas pressure in the cylinder.
The Centre for Energy Studies has research activities dealing with fuel cells and applications for carbons. Two types of carbon materials are being produced in the laboratory, and the two activities of the production of carbon materials for energy studies and the fuel cell activity have been joined for a new study concerning the feasibility of using the carbon materials produced for the adsorption of hydrogen.
The carbon materials produced are nanostructured with high surface areas, interesting porosities and pore size distribution for one type of family, and the other type of carbons are essentially composed of new exotic nanostructures that could reveal to possess appropriate characteristics for hydrogen storage.
The aim of this work is to build and calibrate an experimental set-up for the testing of the materials, to produce some carbon materials in large amounts and characterise them, and finally, to test these materials in their ability to store hydrogen. This will help in establishing a link between the hydrogen storage capacities of the carbons and their nanostructure.
The script is divided into four chapters. The first chapter will deal with the literature review on the thematic of hydrogen storage through adsorption in the carbon materials, while the second chapter will present the experimental set-up elaborated in the laboratory. The third chapter explains the processes used to produce the two families of carbon materials and finally, the last chapter presents the structural characterisation of the samples as well as the experimental results of hydrogen storage on the materials elaborated. For practical reasons the units used for the temperature will be degree Celsius and the pressure unit used in the script will be bars even though they are not the conventional international units used (1 bar = 0.1 MPa).
The literature review on the subject presents the hydrogen gas as well as the various means available in storing the gas, either physically or chemically. The various carbons tested in hydrogen storage will also be presented. The literature review will show that measuring the capacity of the

Chapter I General Introduction
4
carbon materials to store hydrogen is a complex task especially considering the great amount of results that have been published on the subject. Some scepticism exists on the majority of the results, and no real conclusions have been put forward on the theory of hydrogen storage through adsorption in carbon materials.
Following this literature review, the experimental test bench made in the laboratory will be presented, as well as the different steps required in calibrating the set-up using various experiments. A major importance has been pointed out to the calibration and to estimate the theoretical experimental errors that can occur during an experiment taking into account the various parameters influencing the final results, might they be the human or the technical errors. All these steps will be presented in this chapter.
The carbon materials produced in the laboratory are coming from two different processes which have their specificities. The particularities of both processes generate carbon materials that have different properties and structures but are all composed of nanostructured carbon. Another common feature of both processes is that they can produce large amount of material available for testing for hydrogen storage.
The backstage being set, the final chapter will reveal the hydrogen storage capacities of the materials produced at the Centre for energy studies. The results will be presented for each family of carbon and some conclusions and perspectives on these results will be made in order to improve our general knowledge on hydrogen storage. The results observed in our materials will be compared with those presented in the literature review.

Chapter I General Introduction
5

Chapter II Literature review on hydrogen storage and on the carbons used for hydrogen adsorption
6
II LITERATURE REVIEW ON HYDROGEN STORAGE AND ON THE CARBONS USED FOR HYDROGEN ADSORPTION
This literature review will present the various techniques available to store hydrogen, the experimental possibilities on measuring hydrogen storage, as well as the carbons that have been used
for studying the hydrogen adsorption for its storage. The results published in the literature on this topic will also be discussed as well as the problems encountered during all these studies

Chapter II Literature review on hydrogen storage and on the carbons used for hydrogen adsorption
7
1 Introduction .....................................................................................................................9
2 Hydrogen and various means to store it......................................................................10
2.1 Hydrogen ...................................................................................................................... 10 2.1.1 Hydrogen properties ............................................................................................................. 10 2.1.2 Hydrogen production............................................................................................................ 12 2.1.3 The issues of hydrogen storage ............................................................................................ 13
2.2 Compressed hydrogen .................................................................................................. 13 2.2.1 Types of vessels for compression......................................................................................... 13 2.2.2 Conformable vessels............................................................................................................. 14
2.3 Liquefied hydrogen (LH2)............................................................................................ 15 2.3.1 The liquefaction process....................................................................................................... 16 2.3.2 The cylinders used for LH2.................................................................................................. 16 2.3.3 Actors and applications ........................................................................................................ 17
2.4 Metal hydrides .............................................................................................................. 19 2.4.1 The hydriding and dehydriding process ............................................................................... 19 2.4.2 Different types of metal hydrides ......................................................................................... 21
2.5 Other storage techniques .............................................................................................. 23
2.6 Summary of hydrogen storage technologies................................................................. 24
2.7 Physical adsorption in carbons ..................................................................................... 25 2.7.1 A few definitions .................................................................................................................. 25 2.7.2 Gas on Solid adsorption........................................................................................................ 27 2.7.3 The specific case of carbon .................................................................................................. 28
3 Carbon materials used for hydrogen storage..............................................................29
3.1 Graphitic carbon ........................................................................................................... 29
3.2 Carbon black and activated carbon............................................................................... 31 3.2.1 The main elaboration processes............................................................................................ 32
3.2.2 Growth and texture of carbon blacks.................................................................................... 33 3.2.3 Activated carbon................................................................................................................... 33
3.3 Carbon nanofibres ........................................................................................................ 34
3.4 Carbon fullerenes.......................................................................................................... 36
3.5 Carbon nanotubes ......................................................................................................... 37 3.5.1 Presentation of the Carbon nanotubes .................................................................................. 37 3.5.2 Producing carbon nanotubes................................................................................................. 39
3.5.3 Various theories on the nucleation and growth of carbon nanotubes ................................... 41 ! " #$%
3.5.4 Influence of various parameters ........................................................................................... 42
4 Methods available to measure the hydrogen storage .................................................44
4.1 Expressing the amount of hydrogen stored .................................................................. 44

Chapter II Literature review on hydrogen storage and on the carbons used for hydrogen adsorption
8
4.2 The experimental techniques to measure the hydrogen storage ................................... 46 4.2.1 Gravimetric method ..............................................................................................................46 4.2.2 Volumetric method ...............................................................................................................47 4.2.3 Temperature programmed desorption (TPD)........................................................................48 4.2.4 Electrochemical measurements.............................................................................................49
4.3 Classical pitfalls on measuring hydrogen storage......................................................... 50 4.3.1 The sample............................................................................................................................51 4.3.2 The pressure vessel ...............................................................................................................51 4.3.3 Experimental protocol ..........................................................................................................52 4.3.4 Measurement techniques.......................................................................................................52
4.4 The experimental calibration ........................................................................................ 53
5 Hydrogen storage in nanostructured carbon materials ............................................ 53
5.1 Graphite, carbon black and activated carbons .............................................................. 53 5.1.1 Preliminary results ................................................................................................................53 5.1.2 The influence of the experimental conditions.......................................................................54 5.1.3 Carbon treatment effect ........................................................................................................56
& '$ ( )$*$+
5.2 Carbon nanofibres......................................................................................................... 58 5.2.1 Catalytic hydrogen transfer...................................................................................................59 5.2.2 High temperature heat treatment...........................................................................................59
5.3 Carbon nanotubes ......................................................................................................... 60 5.3.1 Alkali-doped nanotubes ........................................................................................................61 5.3.2 Purification by chemical and/or heat treatment ....................................................................61 5.3.3 The sonication of nanotubes .................................................................................................62 5.3.4 Multi Wall carbon nanotube .................................................................................................62 5.3.5 Electrochemical storage of hydrogen in carbon nanotubes...................................................63
5.4 The chemical adsorption of hydrogen in fullerenes...................................................... 64
6 Conclusion ..................................................................................................................... 65

Chapter II Literature review on hydrogen storage and on the carbons used for hydrogen adsorption
9
,
The aim of this literature review is to view various aspects on hydrogen storage. This specific gas has been chosen in order to provide the chemical element necessary to feed a fuel cell. With the advent of fuel cells in the world of electric and zero emissions vehicle, a major problem encountered during various engine testing is the space required in the vehicle to store the hydrogen available for the fuel cell. Fuel cells are not only used for automotive applications, they can also provide the electricity necessary for portable applications such as mobile phones and laptop computers.
Different techniques are available for storing hydrogen, either through compression in elaborated tanks in shape and in increasing resistant materials, or through liquefaction, which requires the cooling of hydrogen and adapted tanks. Beyond the different possibilities available for storing hydrogen in a fuel cell car, a network of hydrogen distribution is not yet available, which should not be a hindrance in developing and testing prototype fuel cell powered engines.
When looking more than 150 years behind, when the internal combustion engine was first introduced, a network distribution of gasoline was not available initially, but with the new discovery of the engine, it developed fairly well. At that time, no resistance from the governing parties appeared on the development of the internal combustion engine. It is to be expected that the problem of the network is a secondary problem, when there is so much in stake in the economy for the development of a hydrogen economy, which goes through the fuel cell. Nevertheless, no storage technique actually available fulfils the storage capacities required for a 500 km autonomy in an engine in terms of economy and safety, and the different means for storing hydrogen will be presented.
The major part of this literature review will be dedicated to the storage of hydrogen through adsorption in carbonaceous adsorbent materials. This physical phenomenon appeared almost forty years ago at cryogenic temperatures in activated carbon, and has since then been largely developed and studied with the production of new types of nanostructured carbon materials.
Studying hydrogen storage through adsorption means studying several different areas. Adsorption of gas on solid is a specific concept that has to be understood, that implies an adsorbent, the carbon material, and an adsorbate, the hydrogen gas.
In order to estimate the storage capacities of a material, one should be able to properly measure the phenomenon by establishing an appropriate experimental technique and by understanding what is exactly measured, without falling in some classical pitfalls that can strongly influence the experimental results.
Last but not least, a large amount of literature exists on this subject, and it is of primer importance to get an appropriate overview of what has been studied, and what can be studied by taking into consideration the past experiences published. The literature in this subject encountered, for the moment, more controversies than solutions, either due to the material itself or due to the experimental technique used to measure the hydrogen storage capacity of a carbon material.
Chapter II Literature review on hydrogen storage and on the carbons used for hydrogen adsorption
10
- $*
Hydrogen can be stored through different means: physical storage via compression or liquefaction, chemical storage using irreversible carriers (methanol...) or metal hydrides, and adsorption gas on solid. Each method possesses desirable characteristics, but no approach satisfies all of the efficiency, size, weight, cost and safety requirements for transportation or utility uses. Hydrogen will be introduced, as well as the various physical and chemical techniques that are available for storing hydrogen [1].
22..11 HHyyddrrooggeenn
Hydrogen was discovered in 1766 by Henry Cavendish and named by Lavoisier from the Greek words hydro meaning water and genes meaning generator. It is the first element of the periodic table and the most abundant element in the universe, accounting for 90 percent of the universe by weight.
However, it is not commonly found in its pure form, since it readily combines with other elements. Hydrogen is a colourless, odourless, tasteless, and a non-poisonous gas under normal conditions on Earth. It typically exists as a diatomic molecule, meaning each molecule has two atoms of hydrogen - this is why pure hydrogen is commonly expressed as "H2".
2.1.1 Hydrogen properties
Hydrogen is most commonly seen as a gas or a liquid, and at ambient conditions it is a gas. It has an atomic number of 1, a molecular weight of 2.016 g.mol-1 and molecular dimensions varying from 3.1 to 2.4 Angstroms. The molecular hydrogen at atmospheric conditions is a mixture of 75% of ortho-hydrogen and 25% para-hydrogen, two isometric forms distinguished by different nuclear spins. The stable variety below –253°C is para-hydrogen, and the equilibrium composition is obtained at -73°C.
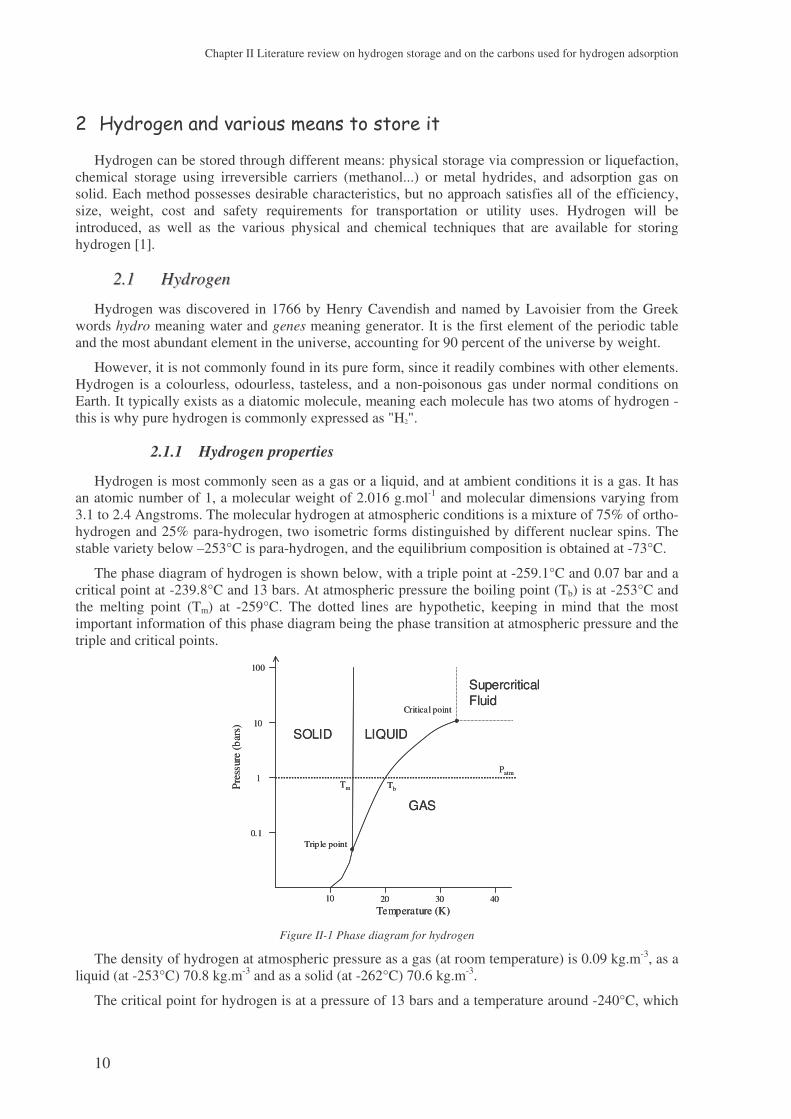
The phase diagram of hydrogen is shown below, with a triple point at -259.1°C and 0.07 bar and a critical point at -239.8°C and 13 bars. At atmospheric pressure the boiling point (Tb) is at -253°C and the melting point (Tm) at -259°C. The dotted lines are hypothetic, keeping in mind that the most important information of this phase diagram being the phase transition at atmospheric pressure and the triple and critical points.
Temperature (K)4010 20 30
0.1
100
10
1
Pres
sure
(bar
s)
Trip le point
Critical point
GAS
LIQUIDSOLID
SupercriticalFluid
Patm
Tm Tb
Temperature (K)4010 20 30
0.1
100
10
1
Pres
sure
(bar
s)
Trip le point
Critical point
GAS
LIQUIDSOLID
SupercriticalFluid
Patm
Tm Tb
Figure II-1 Phase diagram for hydrogen
The density of hydrogen at atmospheric pressure as a gas (at room temperature) is 0.09 kg.m-3, as a liquid (at -253°C) 70.8 kg.m-3 and as a solid (at -262°C) 70.6 kg.m-3.
The critical point for hydrogen is at a pressure of 13 bars and a temperature around -240°C, which

Chapter II Literature review on hydrogen storage and on the carbons used for hydrogen adsorption
11
means that at any temperature above -240°C hydrogen remains a gas whatever the pressure, and will never become liquid at room temperature. For liquid hydrogen, the temperature should be kept between -240°C and -259°C with the corresponding pressure. The lower the temperature the lower the pressure required for hydrogen to be liquid.
Hydrogen as a gas is very sensitive to the fluctuation of temperature and / or pressure and the variations of the gas density as a function of the pressure and the temperature are shown below.
98 103 113 123 138 153 173 198 223 248 273 298 323 348 373 398 4231 bar
30 b
100 b
200 b0
5
10
15
20
25
30
35
40
45
50
Dens
ity (k
g.m
-3)
Temperature (K)
Pressure (bars)
Figure II-2 3-D surface area of the hydrogen gas density [2]
The gas density increases with a decreasing temperature at constant pressure, and at constant temperature the greater the pressure the greater the gas density. In order to increase the density at a constant temperature the pressure should be increased, and similarly, to increase the gas density at a constant pressure, the temperature should be decreased. Moreover, a similar gas density can be obtained at a relatively low temperature and pressure, or at a high pressure and high temperature.
The major concern for hydrogen storage is the increase of the mass and volume storage capacities of the different hydrogen storage techniques. In the case of storage under pressure, the increase of the storage capacities comes with an increase in the pressure, but hydrogen is not an ideal gas, and the ideal gas law can not be applied. The classical relationship between the pressure, volume, temperature and number of moles of a gas has to be combined with a compressibility factor through the following equation: P.V = n.R.T.Z where P is the absolute pressure of the gas (MPa), V is the volume (m3), n is the number of moles (mol), R the ideal gas constant equal to 8.314 (J.mol-1.K-1), T is the temperature of the gas (K) and Z is the gas compressibility factor that has no unit.
The compressibility factor is not constant and depends on the temperature and pressure of the gas. Values can be found in various chemical thermodynamic engineering books [2].
This deviation from the ideal gas law is illustrated in the figure below, with the gas density as a function of pressure for an ideal gas and for hydrogen. The full lines represent the behaviour of an ideal gas and the dotted lines represent the behaviour of hydrogen.

Chapter II Literature review on hydrogen storage and on the carbons used for hydrogen adsorption
12
0
20
40
60
80
100
120
140
160
0 50 100 150 200 250 300 350 400 450 500
Pressure (bars)
Den
sity
(kg.
m-3
)
ideal 98 K
hydrogen 98 K
ideal 298 K
hydrogen 298 K
Figure II-3 Deviation from the ideal gas law
The hydrogen gas density is lower than the ideal gas density, meaning that for hydrogen storage applications, the increase of the mass capacity is being done at the detriment of the volume capacity. Hydrogen deviates from the gas law at high pressures and whatever the temperature, corrections with the compressibility factor should be done, especially at pressures above 150 bars, where the deviation from the ideal gas law is not negligible.
Hydrogen is highly flammable and it only takes a small amount of energy to ignite it and make it burn. It also has a wide flammability range, meaning it can burn when it makes up 4 to 75 percent of the air by volume at 1 bar, whilst as a comparison, natural gas is flammable from 5.3 to 15% of the air by volume. The minimum auto ignition temperature in air at 1 bar is 570°C. Hydrogen burns with a pale-blue, almost-invisible flame, making hydrogen fires difficult to see.
2.1.2 Hydrogen production
Few techniques exist to produce hydrogen, with the most important one being methane steam reforming. High temperature steam separates hydrogen from the carbon atoms in natural gas (CH4 and other hydrocarbons in natural gas). Steam reforming is possible for any hydrocarbon, and the generic reaction is 22 2 H).mn(CO.n OH.nHC mn ++→+ .
Other reforming techniques are possible, such as partial oxidation 22 22 H.mCO.nO.nHC mn +→+ , auto-thermal that consists in a combination of steam reforming and partial oxidation, thermal cracking
22 H.mC.nHC mn +→ and plasma reforming. These are all possible techniques for producing hydrogen, and depending on the type of fuel cell used, a second step is required, clean-up, to eliminate by-products harmful for a proper functioning of the fuel cell. These techniques could be alternative solutions in the storage of hydrogen, as they can be produced on-board upon demand.
This steam reforming technique and its generic family of catalytic hydrocarbon reforming technique produces hydrogen from fossil fuel - gaseous, solid and liquid hydrocarbons. It is probably one of the most cost effective way to produce hydrogen, but unfortunately, it uses fossil fuels during the manufacturing process as raw material as well as energy source. Gas reforming for the production of hydrogen is a wide source of research, as it could be used for the on-site production of hydrogen for automotive and residential applications.
Another way of producing hydrogen is by electrolysis. An electric current splits water into its basic elements: hydrogen at the cathode (+) and oxygen at the anode (-). The hydrogen produced through this mean is extremely pure, and electricity from renewable sources (solar or wind) can be used, although still very expensive at this time. Water being abundant and renewable, and the technology advances in renewable electricity could make electrolysis a more attractive way to produce hydrogen in the future.

Chapter II Literature review on hydrogen storage and on the carbons used for hydrogen adsorption
13
Steam electrolysis is a variation of the conventional electrolysis. It replaces a part of electricity by heat, to provide some of the energy needed to split water, making the process more energy efficient. Photo-electrolysis uses sunlight to split the water molecules into its components. A semi-conductor absorbs the energy from the sun and acts as an electrode to separate the water molecules. Thermo-chemical water splitting uses chemicals and heat in multiple steps to split water into its main components, whilst thermal water splitting uses a very high temperature (higher than 1300°C) to split water.
In the biomass gasification, wood chips and agricultural wastes are turned into pure hydrogen and other gases. Biological systems use microbes to break down a variety of biomass feedstock into hydrogen. It has also been discovered that some photo-biological systems use micro-organisms (algae and bacteria) to produce hydrogen under certain conditions, using sunlight as energy source.
2.1.3 The issues of hydrogen storage
Cost is the biggest impediment in using hydrogen more widely as a fuel. Many expensive changes must be made in the infrastructure to accommodate hydrogen. As an example, electricity is required by many hydrogen production methods, which makes hydrogen more expensive than the fuels it would replace. Another impediment on using hydrogen is its storage, which is the following step to the production.
The techniques available for storing hydrogen can be divided in two different types: the first type being physical and the second one chemical. Physical means concern the gaseous and liquid state of hydrogen, and the chemical one, can be either reversible or irreversible. The reversible chemical storage of hydrogen is done with metal hydrides or to hydrogen adsorption on carbon materials, and the irreversible chemical storage is done with some complex hydrides.
Two physical storage techniques - hydrogen compression and hydrogen liquefaction - and one chemical storage technique - hydrogen chemisorption on metal hydrides - will be explained in the following paragraphs, and the gas on solid adsorption from hydrogen on carbonaceous surfaces will be more largely explained in the following part of this literature review.
22..22 CCoommpprreesssseedd hhyyddrrooggeenn
Hydrogen can be stored as a compressed gas in storage tanks, and new materials allow storage tanks to keep hydrogen at extremely high pressures. Considering that hydrogen has an extremely low critical temperature, unless it is brought to cryogenic temperatures, hydrogen remains a gas whatever the pressure applied at temperatures down to -239.8°C.
Once a pressure tank is built as a reservoir for compressed hydrogen, safety tests have to be conducted in order to certify the pressure vessel [3]. Typical safety tests completed in order to ensure safety and reliability of a compressed tank in an automotive service, environment included, concerns burst tests (2.35 safety margin), fatigue, extreme temperature, hydrogen cycling, bonfire, severe drop impact test, flaw tolerance, acid environment, gunfire penetration, accelerated stress, permeation and material tests.
In the case of the compression of hydrogen in a tank, the amount of hydrogen stored in the tank is determined by a gravimetric percentage. This gravimetric percentage is defined as the mass of hydrogen compressed in the tank divided by the mass of the tank and of the hydrogen present in the tank. Hence, it is important to store a maximum of hydrogen in the tank, meaning increasing the pressure, decreasing the mass of the tank and optimising the volumetric energy density in the envelope used in the automotive industry for the gasoline reservoir.
2.2.1 Types of vessels for compression
Two major advances that have been done in the tanks for the compression of hydrogen are the new materials that allow higher hydrogen pressures and the evolution of the concept of the tank concept.
Four different types of vessel are presently being built, showing a great evolution since the 1970s,

Chapter II Literature review on hydrogen storage and on the carbons used for hydrogen adsorption
14
for compressed tanks. Initially steel tanks were used, and due to the presence of delocalised stress on the tanks and the weakening through hydrogen, failure problem occurred. Steel was then replaced by aluminium, and restrictions were done on the maximum crack size allowed on the material. The increasing interest in the storage of natural gas has contributed in the development of new cylinders.
The idea was to place a double envelope on the cylinders, the first liner for the non-permeability of the cylinder and the second reinforcement - the over-wrapping - for the strength to weight ratio [3,4,5]. The initial reinforcement was only on the cylindrical part with a hoop wrap (type II tank), but this reinforcement was quickly evolved to a complete wrapping of the cylinder, a fully wrap (type III tank), until the final tanks have been developed where the liner, in the type IV tank, is a non-metal liner. The four different types are shown on the Figure II-4 below :
Figure II-4 Four different types of tanks
The four different types of tanks actually developed : • Type I - all metal cylinder • Type II - metal liner hoop wrapped with resin impregnated continuous filament • Type III - metal liner fully wrapped with resin impregnated continuous filament • Type IV - non-metal liner wrapped with resin impregnated continuous filament
The mass per unit volume since the type I cylinder has diminished by 75%, decreasing from 1.16 kg/L for a type I steel cylinder to 0.30 kg/L for a plastic/carbon type IV cylinder. In terms of storage gravimetric capacities of hydrogen, the type I cylinder is around 2 to 3%, the type III cylinder is around 5% and the storage capacity of the type IV cylinder should reach up to 10% [6].
Currently, the most preferred lightweight composite cylinder on the market is the DyneCell cylinder, developed and manufactured by Dynetek industries [7]. It is a lightweight cylinder designed for the storage of compressed gases such as hydrogen and natural gas and is built from a seamless ‘thin wall’ aluminium liner with a full carbon fibre overwrap, hence a type three cylinder. The liner technology guarantees ultra light weights, high storage capacities and non-permeability while the carbon fibre overwrapping insures the corrosion resistance and maximises the strength to weight ratio and operation performance under the harshest environments.
The high performance design materials selected for the lightweight fuel cylinder reduces the weight of the cylinder by two to four fourfold over conventional designs without compromising the structural properties or the quality of the cylinder. Dynetek is selling worldwide and a major hindrance in the development of high pressure tanks (300 and 750 bars) concerns all the auxiliary equipment that has to withstand such pressures.
Even though all these technologies are not optimal yet, it is of primer importance for the major automotive companies to propose zero emission vehicles as soon as possible as the future in transportation resides in clean energy transportation technologies.
2.2.2 Conformable vessels
Developments of compressed hydrogen can not only be done on the material used for the hydrogen tank. Considering that the tanks are cylindrical, this geometry is not optimum and the highest efficient
use of the normally rectangular fuel storage volume available on a vehicle. On the figure on the left hand side, in a rectangular envelope with an aspect ratio (width/height) equal to an integer, cylinders occupy less than 75% of the available storage volume. For non-integer aspect ratios, the available
Type I tank Type II tank Type III tank Type IV tankType I tank Type II tank Type III tank Type IV tank

Chapter II Literature review on hydrogen storage and on the carbons used for hydrogen adsorption
15
storage volume can be as less as 50% as seen on the Figure II-5 below. In both cases the energy density is not the same, and the packaging efficiency an important parameter for gaseous fuelled vehicles.
A lower energy density in the conventional rectangular envelope implies that a larger volume of fuel will be required for the same range as a conventionally fuelled vehicle. However, the requirements of pressurized storage dictate that a smaller volume of fuel can be stored in the same envelope used for a conventional gasoline tank, resulting in the additional gaseous fuel storage cylinders in the vehicle. This results in an increase of the vehicle range at the expense of the total load of the vehicle.
In order to maximize on-board gaseous fuel storage [8], a conformable pressurized tank has been developed. The general approach results in a multi-cell pressure vessel, where the number of internal cells is optimised for envelope and pressure capacity, and depends on a large part on the aspect ratio of the envelope.
The Figure II-5 below shows the expected benefits in volumetric efficiency of the conformable tank compared to multiple cylinders in a rectangular envelope. The conformable and cylindrical envelopes are explained on the right hand side of the figure below :
Figure II-5 Comparison of storage efficiencies as a function of storage envelope [9]
Regardless of the aspect ratio, the internal volume of the multiple cylinders never exceeds 70% of the volume of the envelope. The conformable tank provides significant increased storage volume compared to the multiple cylinder configuration except for aspect ratios of 1.
The individual cells comprising the tank are wound with a combination of hoop and helical composite layers. The cells are then joined together to form a complete tank using winding tooling, allowing a final hoop overwrap to be wound over all of the cells. A U.S. Patent [10] has been obtained for the design and fabrication approach. The conformable tank has a working pressure of 345 bars with a burst pressure of 776 bars, meaning a safety factor of 2.25. Thiokol’s research activities are presently held on conformable cylinders able to sustain pressures up to 700 bars with research and development on the materials and the production processes in order to decrease the production costs. At present, even though the cylinder and compression costs are high, the technology is available for future developments and commercialisation.
22..33 LLiiqquueeffiieedd hhyyddrrooggeenn ((LLHH22))
An alternative to the storage of hydrogen through compression is the storage of hydrogen in its liquid state through liquefaction. Condensing hydrogen gas into the more dense liquid form enables a larger quantity of hydrogen to be stored and transported. As a reminder, the density of hydrogen as a gas is 0.09 kg.m-3 (at room temperature and atmospheric pressure) and as a liquid 70.8 kg.m-3 and the critical point of hydrogen is at a temperature of Tc = -239.8°C and a pressure of Pc = 13 bars. In order to liquefy the hydrogen gas it is essential to decrease the temperature below that critical temperature. Compressing the gas at a temperature above the critical temperature will not liquefy it, whatever the

Chapter II Literature review on hydrogen storage and on the carbons used for hydrogen adsorption
16
pressure applied.
2.3.1 The liquefaction process
Prior to the liquefaction process, the gaseous hydrogen used is purified, because at the boiling temperature of liquid hydrogen, all gases are solid. This enables to obtain very pure hydrogen. The hydrogen liquefaction consists of a heat exchange process with three essential steps:
− the pre-cooling stage from 27°C down -193°C
This enables to bring the gaseous hydrogen below the inversion temperature of Joule-Thomson, temperature above which a gas expansion leads to the heating of the gas. This is done thanks to a mechanical refrigeration system from 27°C down to -38°C, and by a nitrogen cycle (vaporization of liquid nitrogen) from -38°C to -193°C.
− the final cooling and liquefaction from -193°C down to -253°C
This stage is realised by using either an helium cycle (Brayton cycle) or a hydrogen cycle (Claude cycle). Either of these cycles consist in a succession of compression cycles with one or more gas compressors followed by some gas expansions (with heat extraction) through one or more turbines. The gas is cooled down during these cycles to -253°C, and is subject to a Joule-Thomson expansion through a valve. At the end of this transformation, liquid hydrogen is obtained.
− the conversion of ortho to para-hydrogen
It is catalysed by hydroxide iron Fe(OH)3 during liquefaction as it is a low exothermic reaction. Indeed at -253°C and 1 bar, the conversion enthalpy (520 kJ.kg-1), is greater than the vaporization enthalpy of liquid hydrogen (448 kJ.kg-1). If the conversion does not occur prior to the storage, it can lead to the vaporisation of a large amount of the liquid hydrogen during the storage, which can reach up to 50% of the evaporation of the liquid hydrogen in 10 days [11].
The liquefaction of hydrogen requires around 10 kWh.kg-1 for industrial processes, which represents about 30 to 40% of the energy contained in hydrogen if one refers to the net calorific value of 33 kWh.kg-1. This makes the process a very costly one, and constitutes one of the major inconveniences on the use of liquid hydrogen for specific applications such as the automobile. In addition to the cost of the liquefaction, comes the costs of the reservoirs used for liquid hydrogen.
2.3.2 The cylinders used for LH2
Once the hydrogen is liquefied one should store it in a super-insulated tank. These tanks are generally either cylindrical or spherical in order to minimise the surface to volume ratio, which limits the heat exchanges through the surface.
Whatever the level of isolation obtained for these tanks, there is always some heat exchange, which can be limited to less than 1 W for certain tanks. The vaporisation heat of LH2 being very low there is always some liquid hydrogen evaporation in the tank. For every tank a boil off rate (BOR) is always defined, which represents the percentage of the total volume of liquid hydrogen evaporated every day. The accumulation of the vapours in the tank leads to an increase in the pressure inside the tank, that has to be boiled off. In case of prolonged storage, it is essential to evacuate the gaseous hydrogen in order to maintain the pressure below the maximal critical pressure, generally 8 bars. If a vehicle is left with a container filled with hydrogen gas during a week, all the gas evaporates.

Chapter II Literature review on hydrogen storage and on the carbons used for hydrogen adsorption
17
A typical tank for liquid hydrogen consists in a volume with a double envelope in between which the insulating materials are placed.
High Vacuum VCS
Tanks
MLI
Liquid Hydrogen
High Vacuum VCS
Tanks
MLI
Liquid Hydrogen
Figure II-6 Schematic representation of a liquid hydrogen tank [12]
The principle is based on minimising the heat transfer between the two envelopes and the thermal bridges between the internal and external surfaces. The space between the shells is under vacuum in order to minimise the conduction and convection heat transfers. Hydrogen being a very small molecule it tends to diffuse out the internal shell to the annular space. In order to maintain the vacuum, it is required to place an adsorbent.
An insulating material is placed in between the shells and reduces the heat conduction. This material forms the multilayer insulation (MLI) and is placed under vacuum. Moreover, to increase the insulation, a vapour cooled shield (VCS) is placed in the double envelope. This shield is metallic and is cooled by the circulation of a cold fluid (nitrogen).
The insulating material should be the most performing one at low temperatures on the basis of the thermal conductivity. The materials used are Perlite and multi layer vacuum super insulation (MLVSI). This material consists in a series of reflecting screens of weak emissivity separated by layers of low conducting materials. The thickness of this super-insulation is around 2 to 5 cm with an optimal of 15 to 40 layers per cm thickness.
The super insulation is more efficient than Perlite, and the heat flux authorised by Perlite are five to ten times more important than the MLVSI. Perlite has this advantage of being less expensive than the MLVSI, and its performance can be increased to the detriment of weight. Hence, Perlite is solely used for stationary applications where the weight of the tank is not of primer importance and for very large volumes. The super insulation stays nevertheless the most widely used material and unchallenged for small size tanks.
The type of tank used with various possibilities of insulating material and the VCS depends on the application considered. The construction of these tanks is extremely delicate as no default is accepted in the material, and creating the vacuum in the annular zone can take up to 10 days. The entire construction process takes up to three months.
2.3.3 Actors and applications
Three major different types of applications are possible for liquid hydrogen: stationary, spatial and automotive applications. Stationary applications consist in storing the liquid hydrogen close to sites where liquid hydrogen will be required and more specifically on spatial sites. The largest capacities are in the spatial industry due to the high demand of the space shuttles. The biggest tank in the world, 3800 m3, is located at the Kennedy Space Centre in Florida, and the annual demand for the European space shuttle Ariane 5 is of 156 tons of liquid hydrogen.
Concerning the automotive application, this mean of storing hydrogen is studied as it is a potential solution. The technology is available, and safety is a function of keeping the hydrogen cold, and in the liquid state. In May 1999 the world’s first public filling station for liquid hydrogen was taken into

Chapter II Literature review on hydrogen storage and on the carbons used for hydrogen adsorption
18
service at Munich airport. It operates fully automatically by supplying a fleet of vehicles with hydrogen that are used in special services at the airport and in the BMW vehicle fleet [13,14] :
Figure II-7 Photos of the refuelling system from BMW in Munich [13]
The three photos above show the refuelling station for the liquid hydrogen, the docking procedure of the robot and the cryogenic coupling. The system delivers about 120 litres of liquid hydrogen in a minute a half.
A few examples of the use of liquid hydrogen for automotive applications exist, such as BMW in 2001 with a tank of 120 L of LH2, Renault in the FEVER project with a tank reservoir of 120 L in 1997, Daimler Chrysler in 1999 with the NECAR 4 and 70.5 L of LH2 in a 100 L tank or Ford with 68 L of LH2 in 2001. The classical capacities used for the most recent demonstrations are comprised between 63 and 120 L of LH2, meaning between 4.5 and 8.5 kg of hydrogen.
The advantages of this storage technique is its high density and the low pressure storage, but the drawbacks are still important due to the energy requirements for liquefaction, the cost, the complexity of the tank fabrication and the losses due to evaporation.
The main directives for research and development on liquid hydrogen storage are on the optimisation of the insulation system, new geometries for the tanks and reducing the weight and cost of the tank. Most importantly is that this technique, although not optimised yet, is available and can be used for the testing of various fuel cell automotive applications such as cars, buses and airplanes with the European cryoplane project.
After the description of two physical means of storing hydrogen, through compression and liquefaction, the following mean to store hydrogen is chemical. There are two important chemical storage possibilities, metal hydrides and gas on solid adsorption on carbon materials. The latter one being the subject of this work, it will be more precisely described further on, while metal hydride storage will be explained in the following paragraph.

Chapter II Literature review on hydrogen storage and on the carbons used for hydrogen adsorption
19
22..44 MMeettaall hhyyddrriiddeess
Another method of storing hydrogen is to trap it in a metal hydride. When certain metal alloys are exposed to hydrogen gas, a chemical reaction occurs between the alloy and the hydrogen. The alloy absorbs large quantities of hydrogen and forms a solid metal hydrogen compound. The hydrogen can be released (desorbed) as a gas and the alloy returns to its original state.
2.4.1 The hydriding and dehydriding process
The hydriding and dehydriding of metals M by both direct dissociative chemisorption of hydrogen gas and electrochemical splitting of H20 are simple :
xMHHxM ↔+ 22 equation II-1
OHxMHexOHxM x−− +↔++ ... 2 equation II-2
A common method used to characterise metal hydrides is by using a graph in which the hydrogen equilibrium pressure is plotted versus the hydrogen to metal ratio at a constant temperature. These curves are commonly called the pressure composition isotherms and give the equilibrium pressure-composition at a given temperature.
Hydrogen / Metal ratio (H/M)
Pre
ssur
e (l
og s
cale
)
T1
TC
T4
T3
T2
T6
Increasing temperature
+
Hydrogen / Metal ratio (H/M)
Pre
ssur
e (l
og s
cale
)
Desorption
Absorption
C1 C2 CMAX
Reversible capacity
A
B
C
D
E
F
Pa
Pd
Hydrogen / Metal ratio (H/M)
Pre
ssur
e (l
og s
cale
)
T1
TC
T4
T3
T2
T6
Increasing temperature
+
Hydrogen / Metal ratio (H/M)
Pre
ssur
e (l
og s
cale
)
Desorption
Absorption
C1 C2 CMAX
Reversible capacity
A
B
C
D
E
F
Hydrogen / Metal ratio (H/M)
Pre
ssur
e (l
og s
cale
)
T1
TC
T4
T3
T2
T6
Increasing temperature
+
Hydrogen / Metal ratio (H/M)
Pre
ssur
e (l
og s
cale
)
T1
TC
T4
T3
T2
T6
Increasing temperature
+
Hydrogen / Metal ratio (H/M)
Pre
ssur
e (l
og s
cale
)
Desorption
Absorption
C1 C2 CMAX
Reversible capacity
A
B
C
D
E
F
Hydrogen / Metal ratio (H/M)
Pre
ssur
e (l
og s
cale
)
Desorption
Absorption
C1 C2 CMAX
Reversible capacity
A
B
C
D
E
F
Pa
Pd
Figure II-8 Schematic isothermal pressure composition hysteresis loop and the influence of the temperature on the isotherms
In the figure above, P is the hydrogen equivalent pressure, H/M the hydrogen to metal ratio, α represents the metal phase (with interstitial hydrogen), β the hydride phase, Pa the hydrogen absorption pressure and Pd the hydrogen desorption pressure.
At temperatures below the critical temperature, TC, two phase regions exist between the solid solution (α phase) and the hydride (β phase). A two-phase region, as indicated in the figure above on the right hand side, separates these two regions. At a temperature above the critical temperature this two-phase region no longer exists. The PC isotherm delineate three distinct sections:
1. Initially the isotherm ascends fast (section A-B) as hydrogen enters the metal lattice and occupies interstitial positions: solid solution of hydrogen in the metal lattice. By convention, this metal/hydrogen compound is called the α-phase. The hydrogen is then dissolved interstitially [15]. Sievert’s law can often be applied in this particular region:
P.KMH s= equation II-3
When the hydrogen content in the metal increases, the hydrogen atom interact, via the elastic strains introduced in the metal lattice, and the pressure/composition behaviour departs from

Chapter II Literature review on hydrogen storage and on the carbons used for hydrogen adsorption
20
ideality. This is reflected by a decrease in the slope of the isotherm compared to the ideal Sievert’s law behaviour. There is however a limit in the amount of hydrogen the α-phase can store.
2. Once the α phase is saturated, a new phase, the hydride phase (β phase), starts to form. The saturation level in the α phase is quite low. There is a discontinuity in the amount of hydrogen that the metal can store: the maximum hydrogen solubility in the α phase is C1 which is significantly lower than the minimum concentration (C2) which can be stored in the
β phase : typically, ( ) 1.0MH
1C whereas ( ) 1
MH
2C . The plateau region (B-C) in the PCT curve
corresponds to the coexistence of the α and β phases. As more hydrogen enters the metal, the fraction of the α-phase decreases whereas the fraction of the β-phase increases. According to Gibb’s phase rule, the equilibrium pressure ideally remains constant in the two-phase region, but most practical hydriding metals do not show perfectly flat plateaus or zero hysteresis. Nevertheless, with constant temperature, the equilibrium pressure should ideally remain constant but this equilibrium pressure is highly temperature dependent (right hand side of the Figure II-8).
3. At the end of the plateau, the entire metal/hydrogen alloy consists of only the β phase. To force more hydrogen into the alloy requires increasing the external gas pressure, which is represented by the rapid increase of the equilibrium pressure in the C-D region of the PCT curve. This is an indication of a solid solution of hydrogen in the β phase.
The hydrogen absorption and desorption reactions can be modelled thanks to the shrinking core model [16], illustrated in the Figure II-9 below:
Alloy particle
Partly hydrogenated
particle
Fully hydrogenated
particle
Hydride ()Alloy ()
Fully hydrogenated
particle
Alloy particle
Partly discharged
particle
Hydride ()Alloy ()
Charge
Hydrogen absorption
Discharge
Hydrogen desorption
Alloy particle
Partly hydrogenated
particle
Fully hydrogenated
particle
Hydride ()Alloy ()
Alloy particle
Partly hydrogenated
particle
Fully hydrogenated
particle
Alloy particle
Partly hydrogenated
particle
Fully hydrogenated
particle
Hydride ()Alloy ()
Fully hydrogenated
particle
Alloy particle
Partly discharged
particle
Hydride ()Alloy ()
Charge
Hydrogen absorption
Charge
Hydrogen absorption
Discharge
Hydrogen desorption
Discharge
Hydrogen desorption
Figure II-9 Hydrogen absorption and desorption in a spherical shaped hydrogen storage alloy assuming the shrinking core model [16]
In practice, the reversible hydrogen storage capacity equals the length of the plateau C2-C1. The reversible capacity is defined as the plateau width, which can be considerably less than the maximum storage capacity Cmax. Depending on the available pressure and temperature ranges, the engineering capacity is usually somewhere between the reversible hydrogen storage capacity and the maximum storage capacity.
The storage capacity can either be listed in the atomic ratio (H/M), or as a weight percent. It is also possible to express the capacity in volumetric terms which is the number of hydrogen atoms per unit volume.
The Van’t Hoff plot can also be frequently used in order to compare hydrides of varying thermal stability, and is based upon the effect of the temperature on the PCT isotherm and allows the calculation of the change in the standard enthalpy and entropy. An illustration on how the Van’t Hoff plot is made is shown in the Figure II-10 below:

Chapter II Literature review on hydrogen storage and on the carbons used for hydrogen adsorption
21
Hydrogen / Metal ratio (H/M)
Pre
ssur
e (lo
g sc
ale)
T1
Tc
T4
T3
T2
T6
Increasing temperature
+
1/T (K-1)
Pre
ssur
e (lo
g sc
ale)
T1
Tc
T4
T3
T2
RH
slope0∆
=
RS
erceptint0∆
=
Hydrogen / Metal ratio (H/M)
Pre
ssur
e (lo
g sc
ale)
T1
Tc
T4
T3
T2
T6
Increasing temperature
+
1/T (K-1)
Pre
ssur
e (lo
g sc
ale)
T1
Tc
T4
T3
T2
RH
slope0∆
=
RS
erceptint0∆
=
Figure II-10 Temperature effect on the isotherms and Van’t Hoff plot for a hydrogen storage alloy
The standard free energy change in the reaction of hydrogen absorption/desorption is given by the equation
)ln(. 20 HPRTG =∆ equation II-4
where pH2 is the equilibrium hydrogen pressure. The correlation between the free energy, the enthalpy and the entropy is well known through the equation
000 STHG ∆−∆=∆ equation II-5
and by combining the three equations we can find the Van’t Hoff reaction:
R
0S
0)2ln(
∆−
∆= RT
HHP equation II-6
The entropy and the enthalpy of the hydriding reaction can be found from the Van’t Hoff plot by plotting the logarithm of the plateau pressure versus the inverse of the temperature for different temperatures. The entropy change and the enthalpy change can be found by linear regression:
intercept = RS0∆
and slope = RH 0∆
equation II-7
It should be noted that the free entropy change and the free enthalpy change are both negative as the hydriding process is exothermic and requires cooling, whereas the dehydriding process is endothermic and requires heating.
2.4.2 Different types of metal hydrides
The temperature and pressure of the hydriding and dehydriding reactions depend on the specific composition of the hydride, but generally, metal hydride systems for hydrogen storage can be classified as either high (~300°C) or low (< 150°C) temperature, depending on their operating temperature at low pressure (1 to 10 bars). Hydrogen can be stored in the form of a hydride at higher densities than by simple compression, but hydrides are very susceptible to contamination, so the hydrogen supplied must be very pure.
In order to achieve desirable Pressure-Composition-Temperature (PCT) properties it is necessary to combine some strongly hydriding elements (denoted as ‘A’) with elements that have weaker hydriding properties (denoted as ‘B’). There are several types of intermetallic compounds containing different amounts of A and B elements, compounds that are more like solid solutions, and hydride complexes that are formed with transition metals. These different “hydride-families” are shown below.

Chapter II Literature review on hydrogen storage and on the carbons used for hydrogen adsorption
22
The figure below shows the Van’t Hoff lines for various AB5 intermetallic compounds. The most important example of AB5 class alloys is LaNi5. This family has an extraordinary versatility because many different elemental species can be substituted into A and B lattice sites. Classical examples of substitutes for A are Mm [17], Ca, Y, Zr. and for B Al, Mn, Si, Zn, Cr, Fe, Cu, and Co. A partial replacement of the A and B components significantly changes the alloy macrostructure. For example, replacing some of the Ni in LaNi5 alloy with Co and Fe decreases the volume expansion upon hydriding, decreases the corrosion rate, and improves the cycle lifetime of the hydride.
The PCT properties of various AB5 alloys are shown in Figure II-11. The broad range of PCT versatility and modifiability is evident. With the AB5’s the hysteresis is usually quite low, except for MmNi5 [18]. One distinct advantage of AB5 alloys is that they do not form protective oxide layers and have thus a good tolerance against small amounts of O2 and H2O impurities in H2.
Figure II-11 Van’t Hoff lines for various AB5 hydrides [18]
The hydrogen capacity of AB5 hydrides is unfortunately low. A maximum capacity of 1.9 wt% can be achieved with LaCo5 and Ca0.7Mm0.3Ni5 with a nominal amount of about 1 wt% [19]. The reversible capacity of 1.28 wt% can be achieved with LaNi5, with the nominal amount being about 0.7 – 1 wt% [18,19]. Also the cost of AB5 alloys is quite high [19].
Like the AB5s, the AB2 intermetallic alloys represent a large and versatile group with favourable PCT properties near the ambient temperature. The A elements are usually Ti, Zr, Hf, TH, or a lanthanide (atomic number 57 – 71). The B elements can be a variety of transition and non-transition metals, such as V, Cr, Mn, and Fe. A wide variety of substitutes provide a high degree of tuning the PCT and other properties. The hydrogen capacities of AB2 alloys are comparable to AB5 on a reversible basis but generally have higher maximum capacities, especially, when larger pressures and temperatures are available. The maximum capacities are usually in the range of 1.5 – 2 wt% [18,20] and with TiCr1.2V0.8 even 3.4 wt% can be achieved [19].
The intermetallic AB alloys are mainly TiFe-based. They tend to have two plateaus, the upper of which not necessarily very stable, and the hysteresis is also quite large. PCT properties can be modified by partial substitution of Fe by Mn or Ni. Oxide films are easily formed on TiFe-based alloys. This decreases the sensitivity to impurities in hydrogen.
The maximum hydrogen capacities of AB alloys vary from less than 1 to 2 wt%. The two interesting alloys, TiFe and TiFe0.85Mn0.15, have the maximum capacity of about 1.9 wt% and a reversible capacity of 1.5 wt%. The major reasons why AB alloys are not used commercially are the instability of the upper plateau and the sensitiveness for impurities [18,19].

Chapter II Literature review on hydrogen storage and on the carbons used for hydrogen adsorption
23
Besides the alloys described above, there are several other families of intermetallics having a capability of hydrogen adsorption, none of which has attained commercial interest. These include, for example, A2B, AB3, A2B7, A3B, etc. Some of these have good hydrogen capacities but do not have favourable PCT properties. Those with PCT properties in the area of practical applications have usually either poor hydrogen capacities or too narrow plateaus.
Because heat is required to release the hydrogen, the chances of accidental release are limited making hydrides intrinsically safe. This safe and efficient storage system can be used, but depends on a metal with sufficient adsorption capacity operating under appropriate temperature ranges, but these systems are heavy, with low gravimetric hydrogen densities (1%-7%) and are generally expensive. These materials are nevertheless available and with the database available [19] a clear selection of a specific alloy can be made as a function of the application considered.
22..55 OOtthheerr ssttoorraaggee tteecchhnniiqquueess
Beyond these three major hydrogen storage techniques, few other storage techniques exist:
• Complex hydrides are mixed compounds ionic and covalent. They are described as M(M’H4)n
where M is a metal (group IA or IIA) and M’ is trivalent metal from the group IIIB (B, Al, Ga). In the cation M’H4
- the hydrogen atom is tetrahedrally coordinated around the M atom and is rich in electrons. Four of these compounds are already commercialised : NaAlH4, LiAlH4, NaBH4 and LiBH4. The major advantage of the complexe hydrides compared to the metal hydrides is that they have storage capacities varying from 2 to 20%.
Millenniumcell, developed the Hydrogen on Demand™ [21] system using sodium borohydride, in which hydrogen is stored at ambient conditions in a non-flammable liquid fuel - an aqueous solution of sodium borohydride, NaBH4. The process supplies pure hydrogen for energy applications without the need for compression or liquefaction. The system releases the hydrogen stored in sodium borohydride solutions by passing the liquid through a chamber containing a proprietary catalyst. The hydrogen is liberated in the reaction:
heatNaBOH OHNaBH catalyst ++→+ 2224 42
The reaction occurs rapidly in the presence of a catalyst and there is no need to supply external heat to access the hydrogen. The heat generated is sufficient to vaporize a fraction of the water present, and as a result the hydrogen is supplied with co-generated moisture, which can be beneficial for the fuel cell.
These complexe hydrides are widely studied [22,23,24,25,26] as they could provide interesting solutions for the future and the hydrogen-on-demand technique is currently being tested on-board prototype vehicles.
• Zeolites [27] are microporous inorganic compounds with an effective pore size of about 0.3 – 1.0 nm. The pore size is sufficient to permit the diffusion of some small molecules, such as hydrogen, under elevated temperatures and pressures. However, most of the pores are smaller than the kinetic size of a hydrogen molecule in ambient temperature. Thus, when reducing the temperature, the hydrogen is trapped into the cavities of the molecular sieve host [28, 29]. Zeolites have structures based on TO4 tetrahedra, where T is a silicon or aluminium atom. Depending on the structure, Si / Al – ratio, and substituting atoms, such as Na, K, and Pd, the zeolites are named as zeolite A, X, Y, or mordenites etc.
The hydrogen storage capacity of zeolites is quite poor. At temperatures of 200 – 300°C and pressures of about 100 - 600 bars about 0.1 - 0.8 wt% of hydrogen is adsorbed. The cyclic stability of zeolites has not been really studied. Ernst et al. [29] suggested that by applying sophisticated techniques of synthesis and modification there may exist a potential in zeolites. However, this is yet to be seen.
• Glass micro-spheres can also be used to store hydrogen. These small glass spheres are small hollow glass micro-balloons with a diameter varying from about 25 µm to 500 µm and with a wall

Chapter II Literature review on hydrogen storage and on the carbons used for hydrogen adsorption
24
thickness of about 1 µm. It is charged with hydrogen at high pressure and in a temperature range of 200 to 400 °C. High temperature makes the glass wall permeable and the hydrogen is able to fill in and pass through the glass wall. At very low temperatures (room temperature) the glass is impervious to hydrogen and is trapped in the spheres. Once stored the pressure in the carrying tank can be low, adding to safety. These micro-spheres are inert, they resist to contamination and only require moderate heat to release the hydrogen.
The hydrogen can be released by heating or crushing the spheres. The crushing naturally prevents the reuse of spheres and is not necessarily a very favourable option. The glass spheres can also cause accidents when breaking down if not handled properly. The storage capacity of spheres is about 5 – 6 wt% at 200 – 490 bars [30].
22..66 SSuummmmaarryy ooff hhyyddrrooggeenn ssttoorraaggee tteecchhnnoollooggiieess
The important fact to keep in mind at this stage is that the main common advantage of all these techniques is that whatever the price and the hydrogen density, these techniques are available, which means that they can be used for the development and the testing in various projects for fuel cell applications. Even if they are not yet optimised they are not a hindrance in the fuel cell development for automobile applications.
When the idea came that hydrogen could be used as a gas for transportation, the American Department of Energy (DOE) started by establishing some energy density goals for vehicular hydrogen storage. They were dictated to provide a 350 mile range for a fuel cell powered vehicle, meaning a storage amount of 2.9 kg of hydrogen in the weight and volume occupied by a conventional gasoline tank. This calls for systems with energy densities of 6.5 wt% H2 and 62 kg(H2).m-3 .
The energy density goals established by the DOE are not necessarily the goals established for all the automobile companies. Their requirements might vary, and are even more specific on the limiting temperature and pressure required for such a storage system. Automotive industries do not always consider as a good eye the fact that hydrogen is adsorbed at low temperatures and desorbed at high temperatures. Typically, measurements are actually done, for gas on solid adsorption, at the liquid nitrogen temperature – for the low temperature range – and at temperatures up to 327°C for the high temperature range. The pressures studied in the case of compressed hydrogen may reach up to 770 bars for the cylinders under research, and keeping the hydrogen liquid requires extremely low temperatures in the car. Hence, the requirements for automotive industries are more specific on the mass of hydrogen required, and the temperature and pressure limits authorized for such a storage system.
The storage technique and requirements can be adapted to the application. Some applications require a lower amount of hydrogen compared to others and the volume available for the gas storage is not the same in the case of a portable or a static application such as a building or a gas station.
Gaseous Liquid Hydride - disponibility - commercial - security with low pressures - massic capacity - volumic capacity - volumic capacity - kinetics - kinetics - flexibility - costs (low pressure) - the infrastructure - security - security - cost - volume occupied - boil off phenomenon - weight - energy required for compression
- energy required for liquefaction
- kinetics
Advantages
Disadvantages
Liquid hydrogen presents a few advantages and disadvantages compared to gaseous hydrogen. The
main advantage is the high density of liquid hydrogen which allows the storage of greater quantities of hydrogen than in the gaseous state, providing a greater autonomy to the vehicle. Another major advantage is its storage at low pressure.
Nevertheless, the major drawback with its cost and energy consumption for liquefaction are the losses due to evaporation [31], and some numbers illustrating this are commonly accepted:
- in case a vehicle equipped with liquid hydrogen is kept parked, the hydrogen in the

Chapter II Literature review on hydrogen storage and on the carbons used for hydrogen adsorption
25
storage system would completely evaporate after 10 to 14 days; - about 8% of the hydrogen introduced in a tank is evaporated.
BMW and General Motors are the main automotive companies working with liquid hydrogen, and all other companies such as Daimler Chrysler, Ford, Honda, Toyota and Nissan/Renault think more seriously on gaseous hydrogen, initially at 350 bars with the future development of tanks at 700 bars. It should not be forgotten that other chemical storage systems exists for automotive applications such as hydrocarbon storage and reforming for on board production of hydrogen.
Other techniques exist such as gas on solid adsorption on adsorbents. What basically happens during adsorption is that the gas is physically or chemically attracted at the surface of the adsorbent and remains in a stable equilibrium at the surface of the adsorbent until pressure and/or temperature are applied for desorption.
It should be noted at this stage that the development of hydrogen compression is important. Indeed, if adsorption on carbon materials or metal hydrides is used as a mean to store hydrogen, the adsorbent will be placed in a hydrogen reservoir and hydrogen will be compressed in this same reservoir. The fact of adding a carbon material in a compressed hydrogen bottle will enable an increase of the total mass of hydrogen placed in the bottle. The simple compression of hydrogen in the reservoir, will be replaced by a compression and adsorption in the material placed in the same reservoir. Hence the development of hydrogen reservoirs is not done at the expense of the adsorption of hydrogen on carbon or hydride materials but are two parallel means that can be fused together in order to improve the hydrogen storage techniques.
22..77 PPhhyyssiiccaall aaddssoorrppttiioonn iinn ccaarrbboonnss
Before considering the gas on solid adsorption, it is important to have a small knowledge on physical adsorption [32]. In order not to expand the explanations to fields that are not our straight concern in this work, we will try to give some explanations on the adsorption of gases on powders and porous solids.
2.7.1 A few definitions
A porous solid is a solid that contains cavities or channels that are deeper than they are wide. The surface irregularities, wider than deep, are generally a simple manifest of the roughness of the solid, labelled R on the figure below, that schematically shows the different types of pores that can be observed.
TR
B
C
I
TR
B
C
I Figure II-12 Cross section of a hypothetical porous grain showing the various types of porosity [32]
We can start by distinguishing the open and the closed pores. On the opposite to the open pores, closed pores (C) are not open to the surface, and hence not accessible to gas. In the open type pores, there are blind pores (B – pores with a single connection to the surface), through pores (T – pores open on both sides of the particle) or interconnected pores (I – pores which communicates with other pores).

Chapter II Literature review on hydrogen storage and on the carbons used for hydrogen adsorption
26
The porosity of a sample is often defined as the ratio of the pores and voids (space between the particles) to the volume occupied by the solid, although this depends on the characterisation technique used. Once again the pore volume is often regarded as the volume of open pores, but depending on the technique used, the closed pores are also taken into account in the total porosity.
Once the various types of pores have been defined, they are also categorized in size. The pore size or the pore width represents the smallest characteristic dimension of the pore, for example the diameter for a spherical pore or cylindrical pores. The classification of the pores according to the International Union of Pure and Applied Chemistry (IUPAC) is as follows :
• Micropores are the pores with an internal diameter less than 2 nm • Mesopores are the pores with the internal diameter between 2 and 50 nm • Macropores are the pores with the internal diameter greater than 50 nm.
It is quite usual in the literature to see the notation of ultra-micropores or nanopores, instead of micropores, as this implies pores of the micron size. In the case of adsorption, the micro and mesopores are especially important compared to macropores.
The general term of adsorption consists of the enrichment of a substance (liquid or gas) at an interface (solid or liquid). In the case of gas on solid adsorption, the interface is solid-gas and the adsorbent is the solid material on which the adsorption occurs, and the adsorbate, is the substance in the adsorbed state. The illustration below gives an indication of the complexity of the process of surface coverage on a heterogeneous surface.
Figure II-13 Model illustrating adsorption processes on a heterogeneous porous surface [33]
Label 1 indicates part of the surface which has a low adsorption potential and accommodates only few adsorbate molecules, whereas label 2 indicates part of the surface which has a high adsorption potential. Not only is the entire surface of the region covered but adsorbate molecules are adsorbed on top of each other to form a multilayer adsorption. Position 3 illustrates another phenomenon in adsorption processes. Part of the surface of activated carbons has an entrance too small for the adsorbate molecule (such as nitrogen) to enter, whereas a smaller molecule can enter in such a porosity. Position 4 illustrates adsorption in porosity where the process of pore filling, with multilayer adsorption, occurs. Position 5 shows a surface, intermediate in surface energy potential between positions 1 and 2, where the adsorption process is restricted to a monolayer formation. This illustration is quite representative for adsorption processes in carbon materials as very few surfaces are homogeneous.
In the case of this work, we are concerned with the adsorption of hydrogen on carbon. This technique is extensively studied in the scientific community, as it has been initially declared as a potential solution for a mean to store gaseous hydrogen for fuel cell applications.
Adsorbate Adsorptive
Adsorbent
5 4
4
3
2
1
1
Adsorbate Adsorptive
Adsorbent
5 4
4
3
2
1
1

Chapter II Literature review on hydrogen storage and on the carbons used for hydrogen adsorption
27
2.7.2 Gas on Solid adsorption
When two molecules are in a near neighbourhood they attract each other and are subject to different types of forces, categorised either by attraction or repulsion forces. The attraction forces are characterised by the London forces. The potential energy ε of two isolated atoms separated by a distance r is given by the following relation,
( ) 6rC
ra−=ε equation II-8
and the repulsion forces are given by the following relation :
( ) mr rBr =ε equation II-9
where B and C are constants that depend on the interacting molecules.
Once they have reached a distance smaller than a few molecular distance they stop attracting each other and start repulsing. If we consider the isolated system and separate the two molecular forces of attraction and repulsion, at large interatomic spacing a stronger attraction force exists and the repulsion is non-existent. As the interatomic separation diminishes, the repulsion forces increases, and so does the attraction. The attraction force in the case of an atom and a surface is proportional to 1/r3 and the repulsion force to 1/r9, so the general shape of each curve is similar, with opposite signs, and because of the difference in their exponent each force has its influence. These forces are short distance forces, and when the attractive forces are decreased by a factor of 102, the repulsive forces are decreased by a factor of 106. Therefore the influence of each force depends on the interatomic separation, and a minimum of energy exists between these two forces creating a dynamic equilibrium, as shown in Figure II-14.
Atomic separation
Sum
Repulsive
Attractive
Potential Energy V
rAtomic separation
Sum
Repulsive
Attractive
Potential Energy V
r
Figure II-14 The atomic interaction during adsorption [34]
At this minimum of the sum of the two forces, a thermodynamic physical equilibrium between the adsorbent and the adsorbate exists, and during this equilibrium, the adsorbed molecule vibrates at its equilibrium position. This phenomenon can be expected during any type of gas on solid adsorption, such as hydrogen adsorption for hydrogen storage or in the nitrogen adsorption for the materials characterisation.
Adsorption is the property of an interface between two immiscible phases to attract and concentrate components of either phase, or both phases as an adsorbed interfacial film. It is a basic thermodynamic property of interfaces, resulting from a discontinuity in intermolecular or interatomic forces. There are different forms of adsorption, the major difference being between a monolayer and a multilayer type of adsorption. Adsorption of nitrogen at -196°C is a frequent technique used for the analysis of the adsorption character of a porous material and for the determination of the specific surface area and

Chapter II Literature review on hydrogen storage and on the carbons used for hydrogen adsorption
28
porous volume of a material. The different types of isotherms for adsorption are discussed in appendix 3.
In the multilayer type, once the adsorbent has adsorbed a layer, another layer forms on top of the first one, creating a double layer of gas on the solid adsorbent. In the case of adsorption in micropores, the monolayer adsorption is the most common as no space is available for multilayer. Adsorption in the micropores is favoured when the atoms of the adsorbed gas are as small as possible in order to maximise the amount adsorbed. When adsorbing larger atoms, the efficiency is lower as the micropores are not entirely filled.
Adsorption for a porous material depends on the specific surface area of the material and on the size and distribution of the pores. The gas adsorption of a porous solid is maximised when the pores are not larger than a few molecular diameters. Under these conditions the potential fields from the walls of the pores overlap to produce a stronger interaction than would be possible for adsorption on a semi-infinite plane. At a sufficiently low temperature, where the escaping tendency of the gas is much less than the adsorption potential, the entire pore may be filled with a condensed adsorbate phase.
The ideal adsorbent should have a high surface area solely composed of microporosity. The volume and mass of the adsorbent skeleton should be the minimum necessary to develop the adsorption potential and provide thermal conductivity for the management of heat fluxes associated with adsorption and desorption. Although it is important for the adsorbent to have a high surface area, it should also have a high bulk density to minimise the volume for adsorption. A problem that currently subsists is that although the ideal conditions for hydrogen storage are known or evaluated up to a certain point, the material parameters that are critical for an efficient hydrogen adsorption system (surface area, pore size distribution, micropore volume, heat of adsorption, thermal conductivity etc.) are typically measured but not yet controlled. There is an actual challenge for many scientists, on finding the optimum conditions required to produce the ideal adsorbent and reproduce it. The best actual candidate materials for hydrogen storage through adsorption are the carbon adsorbents.
2.7.3 The specific case of carbon
Porous carbons contain an extensive internal network of porosity with dimensions close to those of small molecules. This network of porosity in which the surfaces of the pores are close to each other, confers to the carbons the properties of adsorption. The carbons can take into themselves considerable quantities of small molecules and retain them, quite strongly, within the porosity. This process is reversible and the adsorbed gases can be desorbed by reducing the pressure or by heating the carbon adsorbent.
The atoms that constitute a solid surface exhibit van der Waals forces of physical adsorption, and by being in high concentration at the surface, the combined forces of attraction become significant. As a result, all solid surfaces attract gas molecules and adsorb oxygen, nitrogen, carbon dioxide etc. As solid surface come together to create porosity, reaching separation distance of a few molecular distances, these van der Waals forces of physical attraction increase rapidly in intensity.
The van der Waals forces within the porosity are not just a function of the distance between walls and pore size, but are also a function of the chemical composition of the surface. The polarity of the surfaces vary from relatively inert surfaces such as plastics and covalent compounds, through to polar organic surfaces such as those found in coals, to ionic surfaces of metals. Carbon surfaces resemble more those of covalent compounds, but they can contain oxygen and nitrogen both of which introduce considerable polarity to the surface and thereby increasing adsorption potentials.
The process of physical adsorption in which the van der Waals forces of interaction operate is a dynamic process. The adsorbate penetrates within the porous network to locate a position of minimal energy, as adsorption is an exothermic process, and only stays there for a short period of time, 10-10 seconds, before moving to another site. There are many available sites, and statistically speaking, one gram of a typical porous activated carbon contains about 1020 sites for adsorption.
The complex heterogeneous nature of the surface of a carbon, as illustrated in Figure II-13, make them potential candidates for gas adsorption. The first investigations [35] of the adsorption of

Chapter II Literature review on hydrogen storage and on the carbons used for hydrogen adsorption
29
hydrogen on high-surface-area carbon were reported on the behaviour of these adsorbents from a cryogenic engineering point of view. Already at that time, almost forty years ago, the authors discussed a major source of confusion associated on the understanding of the adsorption of hydrogen in carbon. The problem of expressing the amount of hydrogen stored will be detailed in section 4.1, and the problematic on the experimental techniques available for measuring the hydrogen storage capacity in section 4.2.
.$$
The carbon materials actually tested for hydrogen storage are mainly activated carbons, graphite nanofibre, carbon nanotubes and fullerenes. These materials exhibit interesting properties for hydrogen storage either for hydrogen adsorption (graphite nanofibres, activated carbon and nanotubes) or through chemical storage (fullerenes). Prior to investigating the recent research done on the hydrogen storage in these carbon materials, the following paragraph will present these various families of carbon materials that are interesting for hydrogen storage.
33..11 GGrraapphhiittiicc ccaarrbboonn
Graphite and diamond were initially the two only forms of crystalline carbon until the fullerene was discovered. The phase diagram below shows that the stable phase for carbon is graphite at low and medium pressure and temperature, whereas diamond is the stable form at high pressure due to its higher density [36].
Figure II-15 Phase diagram for the carbon with the crystal structures of diamond and graphite
On the figure above a unit cell of a diamond crystal structure can be seen. This unit cell shows the smallest group of carbon atoms, arranged in three-dimensions that can represent the essential features of the diamond crystal. The edges for this cube are 3.57 Angstroms long. Each carbon atom in diamond is surrounded by four nearest neighbours. They are connected together by covalent, sigma bonds that separate them by a distance of 1.54 Angstroms. The angles between these bonds are 109 degrees. As a result, the central atom and its neighbours form a tetrahedron. The interlocking network of covalent bonds makes the diamond structure very rigid. This bonding arrangement results from sp3 hybridisation of the carbons electronic orbital.
The unit cell of graphite can equally be seen on the figure above. Crystalline graphite consists of parallel sheets of carbon atoms, each sheet containing hexagonal arrays of carbon atoms. Each atom is connected to three nearest neighbours, within the sheets, by covalent bonds that separate them by a distance of 1.42 Angstroms. This bonding arrangement results from the sp2 hybridisation of the carbon electronic orbital. Another intriguing aspect of the bonding scheme within the graphite sheets is the
Vapor
Diamond
Liquid
Graphite
1 64 532010-2
102
101
10
1
10-1
T (103 K)
P (kbar)
Vapor
Diamond
Liquid
Graphite
1 64 532010-2
102
101
10
1
10-1
Vapor
Diamond
Liquid
Graphite
Vapor
Diamond
Liquid
Graphite
1 64 532010-2
102
101
10
1
10-1
T (103 K)
P (kbar)
T (103 K)
P (kbar)

Chapter II Literature review on hydrogen storage and on the carbons used for hydrogen adsorption
30
distributed π bonding between the carbon atoms. This distributed π bonding gives rise to delocalised electrons that makes graphite electrically conducting. The sheets are held together by weak Van der Waals forces and are separated from each other by a distance of 3.35 Angstroms.
1/3
1/3
1/3 1/3
1/3
1/3
dc-c=0.1421 nm
1/3
1/3
1/3 1/3
1/3
1/31/3
1/3
1/3 1/3
1/3
1/3
dc-c=0.1421 nm
Figure II-16 Representation of a few unit cells of a graphene sheet
This diagram will help us calculate the surface area of the arrangement of carbon atoms in graphene. The specific surface area is defined as the ratio of the surface area to the mass. In this case the surface area is the area taken by a unit cell, and the mass is the atomic mass in the unit cell :
(W) mass cellunit (S) area surface cellunit (SSA) area surface Specific =
The surface area of the unit cell is the surface area of an hexagon with a side length equal to the interatomic distance of two carbon atoms in the graphene sheet :
2
233
ccdS −=
Considering the unit cell and the graphene sheet, every atom is shared between three unit cells, meaning that two carbon atoms are present in a unit cell. Knowing the number of atoms in the unit cell, the unit cell mass can be calculated :
a
c
NMW .2=
with Mc the molar mass of carbon (12.01 g.mol-1) and Na the Avogadro’s number (6.023*1023 mol-1).
Therefore the specific surface area of a graphene sheet is :
c
acc
MNdSSA .*
433 2−=
and considering that dc-c is 0.1421 nm, the specific surface area of a graphene sheet is 1315 m2.g-1.
Thanks to experimental techniques, we are able to measure the specific surface area of carbon materials. The most commonly and widely used technique is the adsorption of nitrogen at –196°C, and the determination of the specific surface area is made thanks to the BET technique, that supposes a monolayer adsorption of nitrogen on the surface of the material (refer to appendix 3). This means that the maximum theoretical specific surface area for a graphite carbon is 2630 m2.g-1, as the adsorption takes place on both sides of the sheet. Experimental values with surface areas greater than this theoretical maximum should be seriously reconsidered. This value is important, as nanostructured carbons derived from graphite can not exhibit a higher surface area than this maximum calculated value.
As shown earlier, three different allotropes exist for carbon : cubic diamond, fullerene C60 and

Chapter II Literature review on hydrogen storage and on the carbons used for hydrogen adsorption
31
hexagonal graphite. From these three allotropes, some derived and defective forms can be obtained:
Figure II-17 The three allotropic forms of carbon and the main derivatives [37]
In this literature review, three families of carbon are being studied deriving from two different allotropes, the fullerene and the hexagonal graphite. Carbon nanotubes derive from the fullerene allotrope whereas the other families of carbon derive from hexagonal graphite. It can be considered that materials such as carbon black, activated carbons and carbon fibres can not have specific surface areas greater than the maximum theoretical one previously calculated.
The two families of carbon that will now be presented are the carbon black one and the activated carbon one.
33..22 CCaarrbboonn bbllaacckk aanndd aaccttiivvaatteedd ccaarrbboonn
Carbon black has been known for centuries, initially used for inks, and are mostly characterised by the process that is being used to elaborate them. These various processes are the furnace process, the channel process, the lampblack process, the acetylene black process and the thermal process [38].
Carbon black consists of finely divided carbon more or less structured. Different levels in the structure can be observed. The first level is constituted of primary particles that are generally spherical with diameters varying from ten to hundreds of nanometers. These particles are recollected in secondary structures or aggregates, which form agglomerates. The first two structural levels exhibit strong covalent bonds, whereas the agglomerate organisation is the result of weak Van Der Waals bonds.
Carbon blacks are not solely composed of pure carbon. Depending on the production process and the origin of the primary organic substance they can contain elements such as sulphur, oxygen, hydrogen or nitrogen.

Chapter II Literature review on hydrogen storage and on the carbons used for hydrogen adsorption
32
3.2.1 The main elaboration processes
The existing elaboration processes are divided into two categories : the incomplete combustion of hydrocarbons, or the thermo-oxidant decomposition, and the thermal decomposition of hydrocarbons. The two categories differ by the presence or not of oxygen during the process, and the first category of processes are the most developed ones.
3.2.1.a The incomplete combustion of hydrocarbons
The carbon blacks obtained through the furnace process represent more than 95% of the total worldwide production. The working principle is based on the incomplete combustion of heavy hydrocarbons. The temperatures obtained depend on the fuel to combustible ratio and are generally in the temperature range of 1127°C to 1627°C. It is a continuous process in a closed reactor characterised by high fluid velocities.
The raw material is sent continuously in the reactor via some pre-heating. The thermo-oxidant decomposition of the hydrocarbon takes place in the first part of the reactor and continues in the second part where the concentration in oxygen decreases. The resultant gases are sent back upstream of the reactor, and mixed to preheated air. At a certain distance from the injection point, the thermo-oxidant reaction is stopped by a quench using a water circulation system. After this cooling zone, the mixture of carbon black and gas is directed in the filters where the carbon black is separated from the gases. A certain part of these gases is then burnt and the heat collected is used to dry the carbon.
The particle growth is terminated by the water quench in the process that affects the particle size and the quality of the carbon, as well as the porosity in the sample due to the gasification.
The lampblack process is one of the oldest elaboration process of carbon black. The reactor is composed of a flat container made of cast-iron containing a liquid combustible. A hood is placed on top of the container, leaving a small pathway for the air between the container and the hood. A cooling tube is connected to the hood to cool down the carbon black fumes, which are separated from the gas using filters.
The channel process uses natural gas as fuel and has an output of only 5 %, which is economically unattractive. The carbon black is issued from thousands of little flames coming from the combustion of natural gas. These flames are placed just below a water cooled iron channel. The carbon black deposits itself on a moving mat.
3.2.1.b The thermal decomposition of hydrocarbons
The thermal black process is a cyclic process working in a closed system. The carbon blacks produced are different from those obtained through the furnace process. The particles evolve extremely slowly and can become large. They tend to form filament-like structures that have different physico-chemical properties. The particle size can attain 500 nm and help increasing the mechanical properties of tyres and other polymers.
The process is composed of two vertical reactors that work in an alternating way every 5 to 8 minutes. During the heating stage, the fuel is burnt with air in one of the two chambers to heat the walls up to a predetermined temperature. The air feeding is then stopped and the hydrocarbon is then introduced, generally natural gas, and the thermal decomposition cycle then starts. Carbon black and hydrogen is then formed, and their separation occurs through successive filters. When the first reactor is in the decomposition cycle, the second one is in the heating stage, and the hydrogen produced in the first reactor is used for the heating in the second reactor.
In the acetylene process, the acetylene black is produced in a closed reactor by thermal decomposition of acetylene, a thermally instable hydrocarbon. Acetylene decomposes then in carbon and hydrogen in a temperature around 2200°C. The reaction conditions and the hydrocarbon used confer to the acetylene black some unique properties : a high purity and a high degree of micro structural organisation in between the furnace type carbon black and graphite.
In the family of carbon black, the acetylene black is a family apart from the traditional ones. It has a strong added value and is used for very specific applications, especially due to their electrical
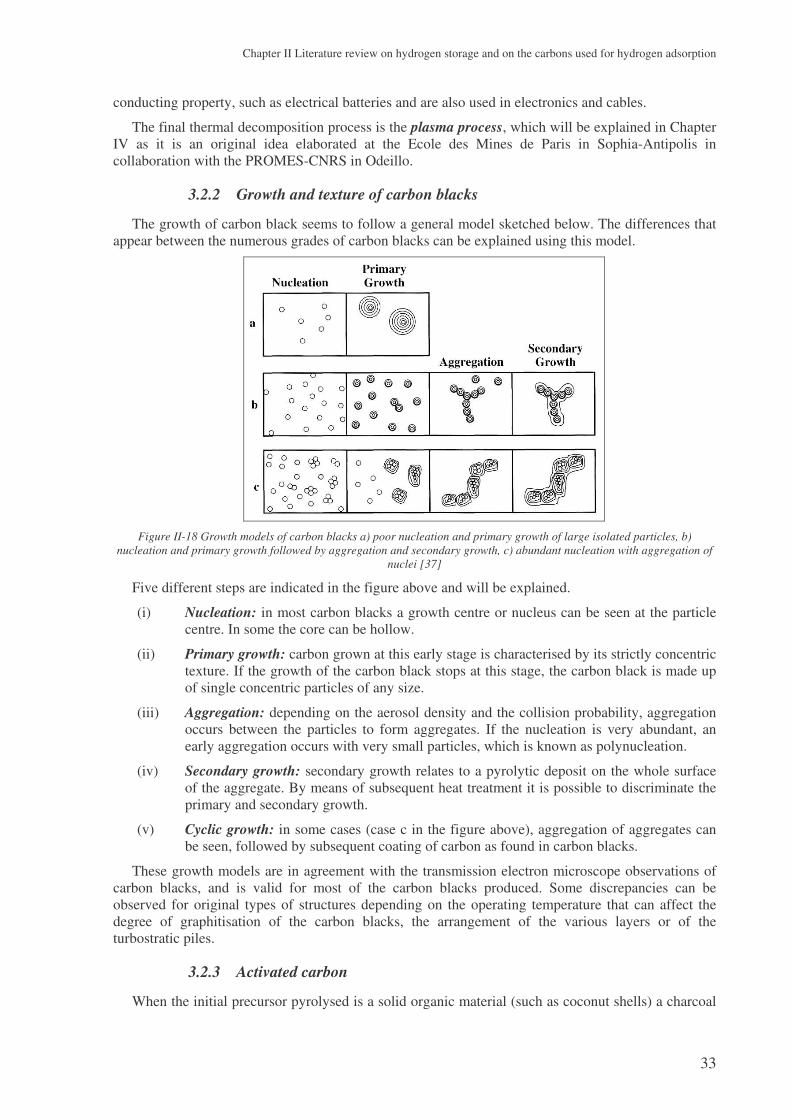
Chapter II Literature review on hydrogen storage and on the carbons used for hydrogen adsorption
33
conducting property, such as electrical batteries and are also used in electronics and cables.
The final thermal decomposition process is the plasma process, which will be explained in Chapter IV as it is an original idea elaborated at the Ecole des Mines de Paris in Sophia-Antipolis in collaboration with the PROMES-CNRS in Odeillo.
3.2.2 Growth and texture of carbon blacks
The growth of carbon black seems to follow a general model sketched below. The differences that appear between the numerous grades of carbon blacks can be explained using this model.
Figure II-18 Growth models of carbon blacks a) poor nucleation and primary growth of large isolated particles, b)
nucleation and primary growth followed by aggregation and secondary growth, c) abundant nucleation with aggregation of nuclei [37]
Five different steps are indicated in the figure above and will be explained.
(i) Nucleation: in most carbon blacks a growth centre or nucleus can be seen at the particle centre. In some the core can be hollow.
(ii) Primary growth: carbon grown at this early stage is characterised by its strictly concentric texture. If the growth of the carbon black stops at this stage, the carbon black is made up of single concentric particles of any size.
(iii) Aggregation: depending on the aerosol density and the collision probability, aggregation occurs between the particles to form aggregates. If the nucleation is very abundant, an early aggregation occurs with very small particles, which is known as polynucleation.
(iv) Secondary growth: secondary growth relates to a pyrolytic deposit on the whole surface of the aggregate. By means of subsequent heat treatment it is possible to discriminate the primary and secondary growth.
(v) Cyclic growth: in some cases (case c in the figure above), aggregation of aggregates can be seen, followed by subsequent coating of carbon as found in carbon blacks.
These growth models are in agreement with the transmission electron microscope observations of carbon blacks, and is valid for most of the carbon blacks produced. Some discrepancies can be observed for original types of structures depending on the operating temperature that can affect the degree of graphitisation of the carbon blacks, the arrangement of the various layers or of the turbostratic piles.
3.2.3 Activated carbon
When the initial precursor pyrolysed is a solid organic material (such as coconut shells) a charcoal

Chapter II Literature review on hydrogen storage and on the carbons used for hydrogen adsorption
34
is produced in place of a carbon black. The oxidation of this material leads to an activated carbon. On the other hand, the carbon blacks can also be activated, and in this case an activated carbon black is produced.
Activated carbons are treated in an oxidising atmosphere, usually with water vapour, carbon dioxide or oxygen, for a certain time and at a certain temperature. Activation eliminates the oxygen, aromatic or organic functional groups and purifies the material. The oxidation attack in the carbon produces a strong internal porosity shifting the porosity to the small pores when the process is optimised in temperature and time, and creating a surface area where the most intense contribution comes from the micropores. The structure consists of a network of rearranged particles and the porosity is considered as a three-dimensional, interconnected network of spaces of different size and shape. The particle size also tends to decrease and due to the elimination of these functionalised groups, the density of the carbon tends to increase.
Carbon blacks and activated carbon both contain graphitic sheets as building blocks, the difference being the extent of the order. In the case of carbon blacks, high temperature treatments improve the graphitic structure. Activated carbons will remain disordered, the extent of the graphitic domains being limited to approximately 2 to 3 nm and 2 to 4 layers. These structural similarities are sufficient to ensure locally similarities in the microporosity of the two types of carbon. It has been shown that the micropores of activated carbons are locally slit-shaped, at least to a width of 1 nm. The micropore system may be regarded as a three dimensional collection of interconnected slits, the difference with carbon blacks being the extent of regularity.
Figure II-19 Pore models for granular active carbon and active carbon fibre [37]
The figure above shows the differences in the porosity between active carbon fibre and granular active carbon. Porosity of the active carbon fibre opens directly to the outer surface with minimum diffusion restriction in the porosity. In contrast, for the granular activated carbon, the oxidation starts at the outer surface and gradually progresses to the interior of the granule. Therefore the outer surfaces of the granules are more extensively oxidized to create macropores of larger entrance diameters, and the outer zone has extensive mesoporosity and the core has the microporosity.
Due to their increased porosity and increased surface area compared to carbon blacks, activated carbons are attractive materials for hydrogen storage. The next family of carbon materials result from a specific rearrangement of the graphene sheets in order to form nanostructured carbon materials.
33..33 CCaarrbboonn nnaannooffiibbrreess
Carbon nanofibres are materials that are produced by the catalytic decomposition of certain hydrocarbons on small metal particles at temperatures ranging from 400°C to 800°C. They consist in graphite platelets arranged in various ways with respect to the fibre axis: parallel, perpendicular or at a certain angle. These structures are respectively called tubular, platelet or herringbone. These graphitic platelets are stacked together with an interlayer spacing of 0.34 nm, as shown in Figure II-20 below, in various orientations with respect to the axis (c.f. Figure II-21), and a review article is available [39].

Chapter II Literature review on hydrogen storage and on the carbons used for hydrogen adsorption
35
Figure II-20 Schematic representation of the arrangement of platelets in a catalytically grown graphite nanofibre [40]
An outstanding feature of these structures is the presence of large number of edges due the stacking of the various graphene layers, which in turn constitute sites readily available for chemical or physical interaction. An unexpected finding on the carbon nanofibres, is that these ordered crystalline solids can exhibit high surface areas, 300 to 700 m2/g, where the totality of the surface area is chemically active. From the physical point of view, carbon nanofibres vary from 5 to 100 microns in length and are between 5 to 100 nm in diameter.
Figure II-21 High resolution electron micrographs and schematic representation of carbon nanofibres with their graphitic platelets; left: perpendicular or parallel to the fibre axis or right: the herringbone structure [41,42]
As for any chemical process, many parameters intervene in the production of carbon nanofibres. For the catalytic decomposition, various different carbon rich hydrocarbons or hydrocarbon mixtures can be used, mixtures of ethylene, hydrogen, methane and carbon monoxide, on various selected metal or alloy catalysts, such as iron, nickel, cobalt. The various choices influence the final material produced and its properties.
From in-situ electron microscopy studies it has been possible to determine the sequence of events leading to the formation of carbon nanofibres. The key steps in the process are schematically shown in Figure II-21. A hydrocarbon is adsorbed on a metal surface (A) and conditions exist that favour the scission of a carbon-carbon bond in the molecules. The resulting carbon atomic species may dissolve in the metal catalyst particle (B), diffuse through the bulk to the rear faces, and ultimately precipitate at the interface (C) to form a carbon nanostructure. The catalytic particle remains at the growing end of the carbon structure.
The degree of crystalline perfection of the deposited fibre (D) is dictated by the chemical nature of the catalyst particle, the composition of the reactant gas, and the temperature. In this case, the graphite

Chapter II Literature review on hydrogen storage and on the carbons used for hydrogen adsorption
36
platelets are oriented in a herringbone arrangement. Surface science studies have revealed that certain faces favour precipitation of carbon in the form of graphite, whereas less ordered carbon will be deposited from other faces [43].
By judicious choice of the catalyst, the ratio of the hydrocarbon/hydrogen reactant mixture, and reaction conditions, it is possible to tailor the morphological characteristics, the degree of crystallinity, and the orientation of the precipitated graphite crystallites with regard to the fiber axis.
In the as-grown conditions the graphite layers are separated from one another by a distance of 0.34 nm. This spacing can be increased by introducing selected groups between the layers, a process known as intercalation, thereby generating new types of sophisticated molecular sieves. Such unique structural conformations found in carbon nanofibres opens up numerous possibilities in the fabrication of new materials. Depending on the crystallographic orientation of the faces that exist at the metal-carbon interface, it is possible to generate nanofibres that consist entirely of graphite platelets or contain a certain fraction of amorphous carbon exhibiting a duplex structure.
The evaluation of the potential of a number of metals and bimetallics as catalysts for the production of carbon nanostructures has been studied over the recent years. It appears that certain nickel- and iron-based alloys are among the most effective catalysts for the reaction [44,45,46]. The herringbone structure is frequently found when alloy catalysts are used. Three distinct regions exist that have a strong influence on the nanofibre growth and the type of nanofibre formed : the catalyst/gas interface, the bulk of the catalyst and the catalyst/solid carbon interface. They determine the manner to which the hydrocarbon bonds and decomposes, the chemistry of the carbon dissolution rate and diffusion and, respectively, the orientation of the interface determines the structural characteristics of the material.
Beyond the whisker-like structure, other more intricate conformations have been observed corresponding to carbon filaments with various conformations such as bi-directional, helical, branched and coiled. The carbon nanostructure consists in a cylindrical arrangement in which the central part is less dense with a short range crystalline order, and the outer region of the tube that shows an extremely ordered arrangement in which the individual graphite platelets are aligned parallel to the side faces of the catalyst particle.
The final material is mainly composed of various forms of carbon nanofibres with a certain amount of amorphous carbon, impurities and metal catalyst particles. These particles (< 0.4%) can be removed by various post production treatments, acid treatment for example, producing high purity graphite nanofibres.
33..44 CCaarrbboonn ffuulllleerreenneess
The carbon fullerenes are more commonly named to the general public as Buckyballs. As shown in Figure II-22 they look like soccerballs, pentagons and hexagons bound together into round hollow molecular cages along the same architectural lines as the geodesic domes created by the architect and philosopher R. Buckminster Fuller. Fullerenes were discovered in 1985 by Robert Curl and Richard Smalley of Rice University while doing experiments with carbon clusters in supersonic beams. Fullerenes join the carbon diamond and graphite as the third known form of pure crystalline carbon.
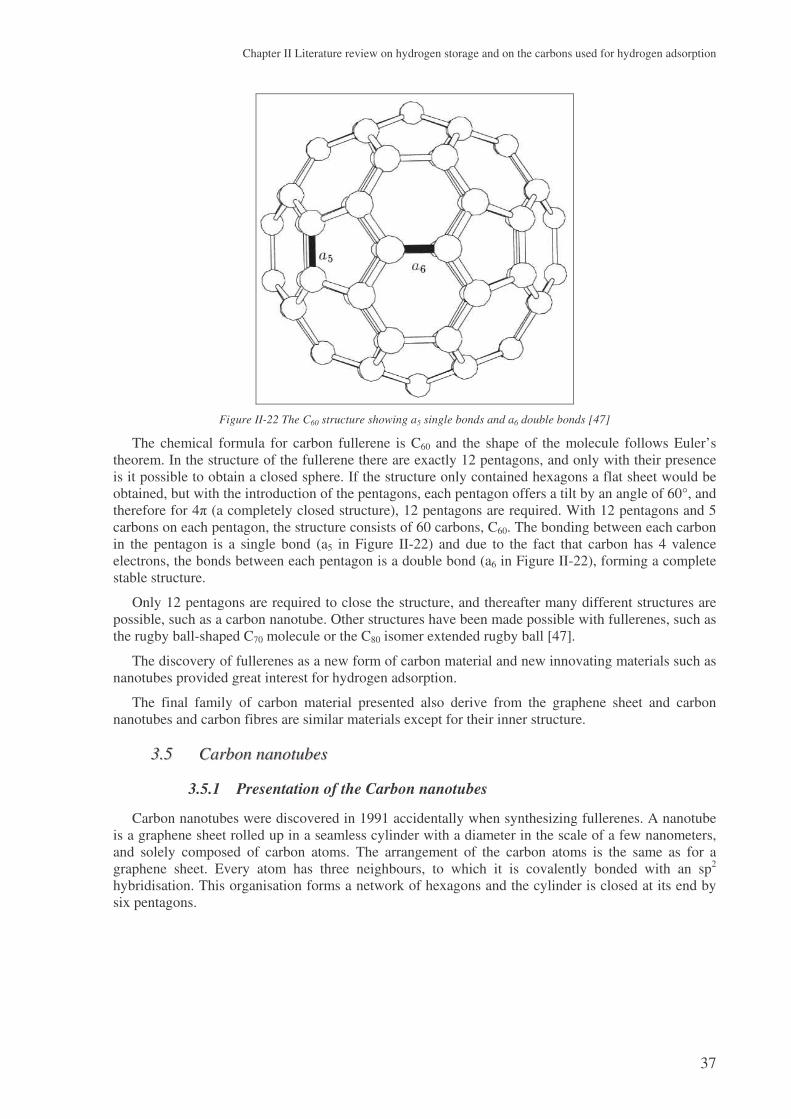
Chapter II Literature review on hydrogen storage and on the carbons used for hydrogen adsorption
37
Figure II-22 The C60 structure showing a5 single bonds and a6 double bonds [47]
The chemical formula for carbon fullerene is C60 and the shape of the molecule follows Euler’s theorem. In the structure of the fullerene there are exactly 12 pentagons, and only with their presence is it possible to obtain a closed sphere. If the structure only contained hexagons a flat sheet would be obtained, but with the introduction of the pentagons, each pentagon offers a tilt by an angle of 60°, and therefore for 4 (a completely closed structure), 12 pentagons are required. With 12 pentagons and 5 carbons on each pentagon, the structure consists of 60 carbons, C60. The bonding between each carbon in the pentagon is a single bond (a5 in Figure II-22) and due to the fact that carbon has 4 valence electrons, the bonds between each pentagon is a double bond (a6 in Figure II-22), forming a complete stable structure.
Only 12 pentagons are required to close the structure, and thereafter many different structures are possible, such as a carbon nanotube. Other structures have been made possible with fullerenes, such as the rugby ball-shaped C70 molecule or the C80 isomer extended rugby ball [47].
The discovery of fullerenes as a new form of carbon material and new innovating materials such as nanotubes provided great interest for hydrogen adsorption.
The final family of carbon material presented also derive from the graphene sheet and carbon nanotubes and carbon fibres are similar materials except for their inner structure.
33..55 CCaarrbboonn nnaannoottuubbeess
3.5.1 Presentation of the Carbon nanotubes
Carbon nanotubes were discovered in 1991 accidentally when synthesizing fullerenes. A nanotube is a graphene sheet rolled up in a seamless cylinder with a diameter in the scale of a few nanometers, and solely composed of carbon atoms. The arrangement of the carbon atoms is the same as for a graphene sheet. Every atom has three neighbours, to which it is covalently bonded with an sp2 hybridisation. This organisation forms a network of hexagons and the cylinder is closed at its end by six pentagons.

Chapter II Literature review on hydrogen storage and on the carbons used for hydrogen adsorption
38
Figure II-23 Representation of a carbon nanotube
The helicity of the nanotube is described by the Hamada vector, Ch, defined as
Ch = n.a1 + m.a2 equation II-10
where n, m are integers and a1 and a2 are unit vectors, as shown in Figure II-24, which indicate how the graphene sheet is rolled up along a lattice vector. The orientation of a tube with respect to the graphite sheet can change and the value of the integers n and m identify the general geometry of the single wall nanotube (SWNT). The tubes for which n = m are named armchair, and tubes with either n=0 or m = 0 are named zigzag, and all others have chiral symmetry.
Figure II-24 Nanotube chirality and conformation [48]
Using the figure above it is possible to determine the diameter of a nanotube as a function of the Hamada constants, knowing that the unit distance between two consecutive carbon atoms in a graphene layer is 1.421 nm, the nanotube diameter is [48] :
2222 .246.0..3 mmnnmmnnad cct ++=++= −
ππ equation II-11
Single wall nanotubes are generally found in bundles and the bulk product is composed of nanotubes of various sizes. The homogeneity of the sample depends on the diameter size distribution of the various tubes. The nanotube rich soot contains also the catalyst used as well as a certain amount of impurities and amorphous and partially graphitised carbon.
The initial forms of nanotube produced were actually the multi walled carbon nanotubes :
Chair conformation
Zigzag conformation
Chiral conformation
Chair conformation
Zigzag conformation
Chiral conformation

Chapter II Literature review on hydrogen storage and on the carbons used for hydrogen adsorption
39
Figure II-25 Multi Wall Nanotube (MWNT) [48]
They consist in concentric single wall nanotubes stacked one over each other. The core nanotube determines the diameter of the multi wall nanotube, and the external diameter increases, while each nanotube has its own helicity. The interlayer distance between each nanotube has been measured to be equal to 0.344 nm, as for the polyaromatic turbostratic carbons.
Nanotubes have several interesting properties, such as mechanical, electronic, optical, thermal, chemical and adsorptive properties. For example, their modulus of elasticity is about five times the value of steel and if buckled they elastically resize when the deflection is loosed. They also have special electronic properties depending on the chirality of the tube: some behave like metallic conductors and the others like semiconductors.
3.5.2 Producing carbon nanotubes
Various techniques are presently available for producing carbon nanotubes. The first two methods presented are techniques described as violent techniques. They consist in submitting the carbon to a strong intensive heating around its sublimation point under a low pressure of an inert gas. The last few methods are the soft methods. They consist in a much slower growth of the carbon structures from a surface thanks to a soft chemical process.
3.5.2.a The electric arc technique
This is probably the most popular technique used for the production of nanotubes, which is schematically represented below.
Inert Gaz
PC control unit
Vacuum
fixed cathode mobile anode
water cooling
current
Inert Gaz
PC control unit
Vacuum
fixed cathode mobile anode
water cooling
current
Figure II-26 Schematic diagram of the electric arc discharge process [49]
The principle of operation is simple [49]. The two graphite electrodes are subject to a high discharge current (generally between 35 and 100 V) in a hermetically closed chamber filled with a neutral gas at low pressure (50 to 700 mbar). The gas can be dynamically swept in the chamber, or on
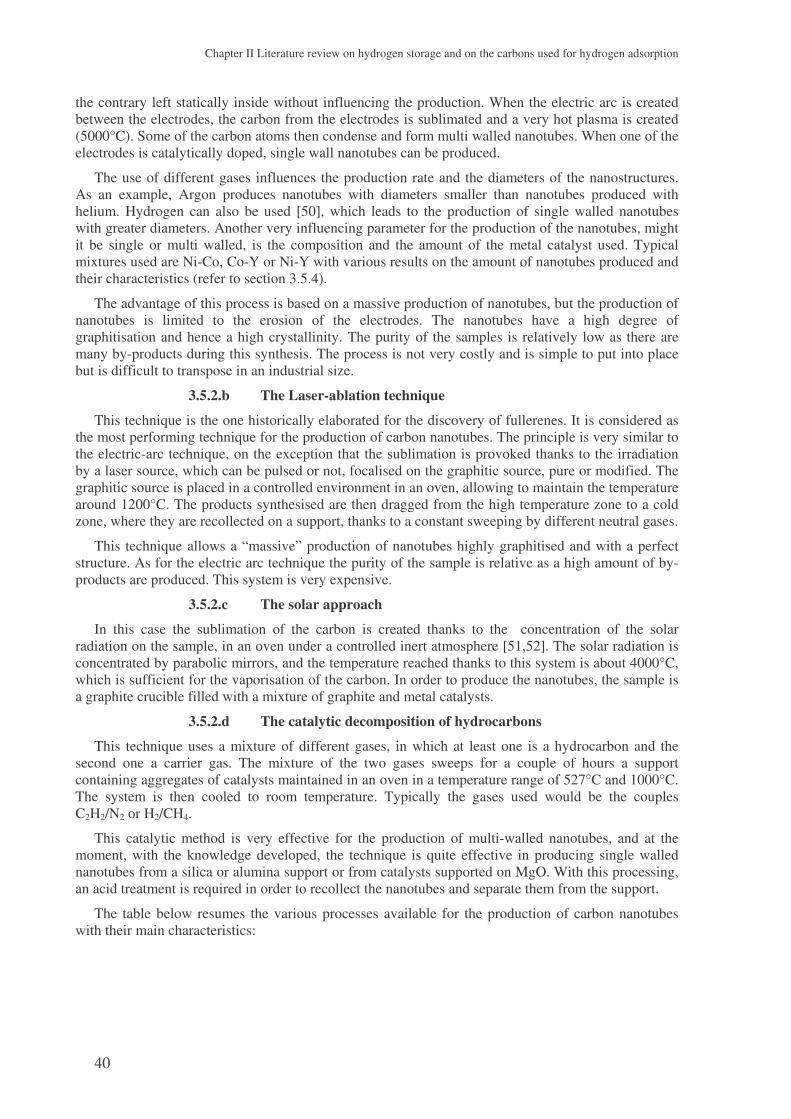
Chapter II Literature review on hydrogen storage and on the carbons used for hydrogen adsorption
40
the contrary left statically inside without influencing the production. When the electric arc is created between the electrodes, the carbon from the electrodes is sublimated and a very hot plasma is created (5000°C). Some of the carbon atoms then condense and form multi walled nanotubes. When one of the electrodes is catalytically doped, single wall nanotubes can be produced.
The use of different gases influences the production rate and the diameters of the nanostructures. As an example, Argon produces nanotubes with diameters smaller than nanotubes produced with helium. Hydrogen can also be used [50], which leads to the production of single walled nanotubes with greater diameters. Another very influencing parameter for the production of the nanotubes, might it be single or multi walled, is the composition and the amount of the metal catalyst used. Typical mixtures used are Ni-Co, Co-Y or Ni-Y with various results on the amount of nanotubes produced and their characteristics (refer to section 3.5.4).
The advantage of this process is based on a massive production of nanotubes, but the production of nanotubes is limited to the erosion of the electrodes. The nanotubes have a high degree of graphitisation and hence a high crystallinity. The purity of the samples is relatively low as there are many by-products during this synthesis. The process is not very costly and is simple to put into place but is difficult to transpose in an industrial size.
3.5.2.b The Laser-ablation technique
This technique is the one historically elaborated for the discovery of fullerenes. It is considered as the most performing technique for the production of carbon nanotubes. The principle is very similar to the electric-arc technique, on the exception that the sublimation is provoked thanks to the irradiation by a laser source, which can be pulsed or not, focalised on the graphitic source, pure or modified. The graphitic source is placed in a controlled environment in an oven, allowing to maintain the temperature around 1200°C. The products synthesised are then dragged from the high temperature zone to a cold zone, where they are recollected on a support, thanks to a constant sweeping by different neutral gases.
This technique allows a “massive” production of nanotubes highly graphitised and with a perfect structure. As for the electric arc technique the purity of the sample is relative as a high amount of by-products are produced. This system is very expensive.
3.5.2.c The solar approach
In this case the sublimation of the carbon is created thanks to the concentration of the solar radiation on the sample, in an oven under a controlled inert atmosphere [51,52]. The solar radiation is concentrated by parabolic mirrors, and the temperature reached thanks to this system is about 4000°C, which is sufficient for the vaporisation of the carbon. In order to produce the nanotubes, the sample is a graphite crucible filled with a mixture of graphite and metal catalysts.
3.5.2.d The catalytic decomposition of hydrocarbons
This technique uses a mixture of different gases, in which at least one is a hydrocarbon and the second one a carrier gas. The mixture of the two gases sweeps for a couple of hours a support containing aggregates of catalysts maintained in an oven in a temperature range of 527°C and 1000°C. The system is then cooled to room temperature. Typically the gases used would be the couples C2H2/N2 or H2/CH4.
This catalytic method is very effective for the production of multi-walled nanotubes, and at the moment, with the knowledge developed, the technique is quite effective in producing single walled nanotubes from a silica or alumina support or from catalysts supported on MgO. With this processing, an acid treatment is required in order to recollect the nanotubes and separate them from the support.
The table below resumes the various processes available for the production of carbon nanotubes with their main characteristics:

Chapter II Literature review on hydrogen storage and on the carbons used for hydrogen adsorption
41
Process Principle Temperature (°C) Pressure Continuous / batch
Catalytic Catalytic decomposition of a hydrocarbon 700 – 1,000 1 barBatch
(Continuous)
ArcRemoval of a graphitic bar containing a catalytic element under the influence of
an electric arc~ 3,500 650 mbar Batch
LaserRemoval of a graphitic bar containing a
catalytic element under the influence of a laser beam
~ 3,500 500 mbar Batch
SolarRemoval of a graphitic bar containing a
catalytic element under the influence of a concentrated solar radiation
~ 3,500 400-600 mbar Batch
PlasmaVaporisation of a carbonated precursor in presence of a catalyst thanks to a thermal
plasma1,000 – 12,000 1 bar Continuous
Table II-1 Summary of the various techniques available for the production of carbon nanotubes
Last but not least for the production of nanotubes is the high temperature plasma process. The high temperature plasma process developed at the Centre for Energy Studies will be presented in chapter IV. Yet, various theories on the formation on carbon nanotubes will be briefly explained.
3.5.3 Various theories on the nucleation and growth of carbon nanotubes
Quite a few models on the growth of carbon nanotubes have been proposed which will not be developed as a large literature exists on this subject. The models vary depending on the type of catalyst used. It can either be on the atomic shape, or can be presented as aggregates or under the structure of nanometric particles. It is as nanometric particles that we will consider the catalyst in order to put forward a few models that can help in the understanding of the growth mechanism of the carbon nanotubes.
3.5.3.a The Saïto model
This type of growth mechanism is of the VLS type (Vapour-Liquid-Solid), and enables to explain the formation mechanism of a certain number of nanotubes from the same catalyst particle.
The model resides on the formation of carbon and metal vapours. The temperature decrease leads to the condensation of the metal in nanoparticles of average dimensions ranging from 10 to 30 nm and containing an significant concentration of carbon. As the temperature decreases, the carbon solubility in the nanoparticle decreases and the solubility limit is reached, provoking a violent segregation of the carbon to the surface of the nanoparticle. Two phenomenon can then occur: either the formation of graphene layers surrounding the metal catalyst blocking the formation of nanotubes, either the nucleation and growth of nanotubes due to the diffusion of the carbon from the metal to the surface.
In the latter case, the carbon nanotube growth source comes from the particle as described above or from the carbon atoms and the C2 in the gaseous phase.
Figure II-27 The Saïto growth mechanism [53] : hypothetical growth process from a metal/carbon alloy particle: (a)
segregation of carbon towards the surface (b) nucleation of SW tubes on the particle surface and (c) growth of the SW tubes.
3.5.3.b Variations of the growth mechanism
Two different VLS models have been proposed: the first one has been established by Kataura and Kumazawa and the second one by A. Loiseau and J. Gavillet, each of them consisting with three different stages:

Chapter II Literature review on hydrogen storage and on the carbons used for hydrogen adsorption
42
• The VLS model proposed by Kataura and Kumazawa is composed of three stages. In a first step, the carbon aggregates and fullerene fractions are produced and adsorbed at high temperatures by the liquid metallic particle. In the second stage, when the temperature decreases, the metal particle stops the adsorption of the fullerene fractions and is covered with half-fullerenes. In the final stage, the growth of the single wall nanotube comes with the consumption of the amorphous carbon. During the various stages the temperature of the system decreases and the diameter of the various tubes is determined by the second step and the size of the metal particle.
• The next derivative of the Saïto model has been proposed by A. Loiseau and J. Gavillet. The first step resides in the production of liquid metal particles of the catalyst of sizes ranging from 1 to 20 nm, and saturated in carbon thanks to the condensation of the vapours. The next step corresponds to the nucleation of the nanotube thanks to the segregation of the carbon on the surface of the particle. Two processes are then in competition: for low segregation rates graphene layers form on the surface, and for high segregation rates the surface of the particle is unstable and nucleation of the nanotube occurs. This occurs during the cooling phase, as it decreases the carbon solubility and consequently provokes the segregation of the carbon. The particle has to be liquid and its temperature close to the solidification temperature of the particle or to the carbon-metal eutectic.
The last stage is the nanotube growth. Once the nucleation of the nanotube occurred, the growth starts thanks to the local incorporation of the carbon at the root of the nanotube nucleus. Different possibilities subsist: an anisotropy exists on the surface of the particle enabling a directional and axisymmetrical growth of the carbon nanotubes, or the surface favours long and unidirectional tubes or the nanotube growth did not occur and the carbon densified on the surface of the particle either under a graphitic form or either recovering the particle with amorphous carbon. During the growth stage, the tube must be in a plateau temperature close to the solidification temperature of the particle and the carbon feeding must be continuous.
Other models are available for explaining the nanotube growth in the various experimental techniques, such as the solid-liquid-solid model by Gorbunov [54], the Kanzow model [55] or the Blank model [56]. These theories have not been further developed as it is believed that the growth mechanism in the high temperature process is close to the Saïto model or of its derivatives. As it can be seen, a certain number of parameters are present during the growth mechanism and have their influence on the final material produced.
3.5.4 Influence of various parameters
The formation of carbon nanotubes is a complex chemical phenomenon that can be influenced by many parameters, might they be chemical or physical. A large amount of literature is available on the influence of all the parameters as they are studied for all the production techniques, and the purpose of this paragraph [57] is to show some of the influences that can occur, and in no means does it claim detailing the subject.
3.5.4.a The chemical parameters
The catalyst has a major influence on the production of the nanotubes [52], and particularly on the diameter and the length of the nanotube, as it determines the energy difference between the metal particle (the catalyst) and the carbon, and hence the ease with which the nanotube will nucleate and/or grow. The nature of the catalyst also controls two important temperatures during the production of the nanotubes: the vaporisation temperature of the precursors and the metal-carbon eutectic temperature, and consequently dictates the temperature range that should be reached during the process inside the reactor and the final properties of the nanotube. Similarly a metal mixture as catalyst can be more efficient than a metal on its own: the yield is more important with a mixture Co/Bi or Co/Pd than when Co is used on its own, and the diameter distribution is larger. The catalyst concentration and the size of the catalyst particle are also important influencing parameters.
The carrying gas is also an important parameter for the nucleation and growth of nanotubes.

Chapter II Literature review on hydrogen storage and on the carbons used for hydrogen adsorption
43
Studies on various production techniques [58,59] have shown that the tube diameters are smaller when Nitrogen is used rather than Ne, Ar or Kr and a larger amount of nanotubes is obtained when Helium is used rather than Argon. In addition to this it appears [60] that the nature of the gas has a greater influence on the quality and quantity on the products than the gas flow rate.
Concerning the pressure of the carrying gas its influence resides more on the quantity of nanotubes produced in the soots rather than on the tube diameter. Once again no general rule can be given as it depends also on the precursor used, but nevertheless it appears that the amount of nanotube produced is greater at pressures comprised between 0.2 and 0.5 bar [51,58,59] depending on the type of gas used and the experimental technique.
Moreover, the ratio of the carbon to catalyst in the carrying gas is an influencing parameter and a compromise should be done between the carbon and catalyst content in the gas and the gas flow rate. The gas flow rate should be high enough to prevent any vapour mixtures in the various evolution stages and insuring at the same time that the particles present have enough time to heat in order for the nucleation stage to occur. The residence time of these particles should be sufficient to allow the nanotube growth.
The presence of impurities also affects the process, might they be in the gaseous or solid phase. In a work implying a gas mixture [61], it appeared that the presence of hydrogen favoured the growth of single wall nanotubes. Similarly [49], the presence of nitrogen in the gaseous mixture allows to increase the vaporisation rate which increases the production yield in nanotubes.
The role of Sulphur has been put forward in a work [51], which shows that the main effect of the presence of sulphur is to form small diameter (0.9-1.1 nm) nanotubes, and it appears in another work that the presence of phosphorus inhibits the growth of nanotubes due to a poisoning of the catalyst.
3.5.4.b The physical parameters
The temperature is a critical criterion for the growth of nanotubes, which should be done within a temperature range of 800°C and the eutectic temperature. For temperatures above the eutectic the growth of the nanotubes is stopped, and the higher the eutectic temperature, the larger the average tube diameter. It appears that the optimal temperature for the growth of nanotubes is 100 to 200°C below the eutectic temperature.
In addition to this, a heat treatment has a considerable effect on the nanotubes: between 1600°C and 2000°C the nanotubes coalesce, which increases the diameter of the nanotubes. Above temperatures of 2200°C, the single wall nanotubes disappear to form multi wall nanotubes.
The cooling and residence time in the experimental process are important parameters for the formation and growth of nanotubes. The quenching has a slope varying from 100°C/ms to 300°C/ms and depending on the operating temperature, determines the residence time of the particles in the operating conditions. If the quench is too important the carbon might stay in an aggregate form and the nanotubes might not grow. In the case where the quenching is too low, the residence time in the operating conditions is important enough for the nucleation and growth of the nanotube. The residence time is also an important physical parameter as it should be long enough at the required temperature in order for the nanotubes to nucleate and grow.
Once again, as in all chemical processes for the production of a type of material, everything consists in taking into account the requirements for the final material and its application, as the optimum parameters will depend on the type of material required. It is often a question of compromise between the amount of nanotubes, the type of nanotubes with diameter and length, and the presence or not of impurities in the final product.
The three families of nanostructured carbon materials that are being used for the adsorption of hydrogen have yet been presented. Prior to studying the adsorption of hydrogen in these carbons, it is important to understand the various experimental techniques available for measuring hydrogen storage as well as the expression of the amount of hydrogen a carbon material can store per unit mass of material. These elements will help in understanding the controversies that exist on the subject of hydrogen adsorption in carbon materials.

Chapter II Literature review on hydrogen storage and on the carbons used for hydrogen adsorption
44
/ *$$
Considering that the different means for storing hydrogen have been presented, it is important to understand how the effective amount of hydrogen stored is actually measured with the different drawbacks of the various techniques. Prior to the experimental explanations on the techniques used to measure the amount of hydrogen stored, the significance of the amount of hydrogen stored will be explained.
44..11 EExxpprreessssiinngg tthhee aammoouunntt ooff hhyyddrrooggeenn ssttoorreedd
There are basically two means of expressing the amount of hydrogen stored in a carbon. It can either be expressed as a volumetric density (volume of hydrogen) or as a gravimetric density (the mass of hydrogen).
The gravimetric density is the ratio of the weight of hydrogen stored in the system over the total weight of the system, and is measured as a percentage (wt %). The system is usually the material used as the adsorbent for the storage of hydrogen, but some doubts may subsist on the definition of the system. Considering an automobile application the total weight of the system could be the mass of the container plus the mass of the adsorbent and the hydrogen in the container. It represents the total weight of the system that is taken by the hydrogen, and does not consider the volume taken by the hydrogen. Care should be taken on the denominator. Indeed, a comparison of the mass of hydrogen stored in a carbon to the mass of carbon tested should be done in order to estimate whether or not the mass of hydrogen should be included in the denominator. Nevertheless, strictly speaking, the mass of hydrogen should be taken into account.
The volumetric density is defined as the ratio of the weight of hydrogen stored over the total volume of the system and is measured in kg(H2)/m3. It represents the mass of hydrogen taken per unit volume of the system. The ideal situation being to store the maximum amount of hydrogen in the minimum volume possible. This data is extremely important as it determines the volume required for the hydrogen storage.
Beyond this simple expression of the amount of hydrogen stored it is also important to clearly explain what hydrogen is considered in this expression. During an adsorption process, a certain amount of hydrogen is compressed and another part is adsorbed in the material and dissociating either is not always possible depending on the experimental set-up used for measuring hydrogen adsorption.
The best way to judge the performance of a carbon adsorbent is to measure the amount of hydrogen that can be retrieved from a system. This can be done by using the usable capacity ratio (UCR), defined as the ratio of the mass of hydrogen released from a vessel with adsorbent over the mass of hydrogen released from the same vessel without adsorbent.
The amount of hydrogen available from either pressure vessels depends on the working pressure, the pressure used to fill the vessel, and the discharge pressure, pressure below which the vessel cannot deliver hydrogen to the intended application. It allows to measure the efficiency of the adsorbent.

Chapter II Literature review on hydrogen storage and on the carbons used for hydrogen adsorption
45
Figure II-28 Pressure dependence of H2 mass in an empty and carbon-filled vessel [62]
Hydrogen adsorption increases with the gas pressure, but so does the density of the compressed hydrogen gas. In Figure II-28 the mass of hydrogen that can fit within an empty cylinder increases almost linearly with pressure, the mass that can fit within a carbon-filled cylinder does not. The carbon sorption is quite effective at lower pressures (UCR>1) but reaches a saturation as the pressure increases. For any carbon, there will be some pressure at which the carbon filled curve crosses the empty line, and then UCR=1. Above that point, UCR<1.
Certain carbons only function as hydrogen adsorbents at temperatures of -123°C or below. These carbons adsorb roughly twice the hydrogen at -193°C than they do at -123°C. Considering that even an empty vessel holds twice the hydrogen at -123°C as it does at 27°C, roughly four times as much hydrogen at -193°C as at 27°C and that carbon-filled vessels hold more hydrogen than do empty vessels at these temperatures but only at sufficiently low pressures, the investment might be justified in order to operate at these low temperatures [62].
Instead of measuring the ratio of the mass of hydrogen released from a vessel with adsorbent with the mass of hydrogen released from the same vessel without adsorbent, one can measure the difference between the two previous entities. This method is the excess amount of hydrogen present in the pores over that which would be present under the normal density at the equilibrium pressure. In this method a plot is made of the excess amount of hydrogen versus pressure that often exhibits a maximum. Beyond this maximum the bulk gas density increases more quickly with increasing pressure than does the adsorbed gas density, and higher hydrogen storage densities could be achieved by removing the adsorbent. The excess adsorption is the amount of gas uptake on the walls of the pores and in addition to the quantity of gas that would have normally occupied the adsorbent volume under the same conditions of temperature and pressure.
Another method consists of plotting the amount of hydrogen contained in the adsorbent filled container as a function of pressure. In this case no attempt is being made to dissociate the hydrogen stored through the adsorbent or through the non-adsorbing volume of the container, implying that the role played by the adsorbent is unclear. The amount of hydrogen contained in the adsorbent filled container can therefore not be entirely attributed to the adsorbent.
Finally one can measure the total amount, being the amount contained in the pore volume. It consists of all the matter under the influence of the adsorption forces or the excess amount to which an additional amount that accounts for gas compressed into the active volume of the sample is subtracted. In this case the skeleton density of the adsorbent is required and is measured through helium pycnometry, as it determines the volume taken by the solid matter of the adsorbent. The ratio between the bulk and skeleton density gives an idea of the porosity of the adsorbent, and thereby its pore volume.
It should be noted that the definition of the weight percent of hydrogen stored in an adsorbent has

Chapter II Literature review on hydrogen storage and on the carbons used for hydrogen adsorption
46
never been properly defined and no regulations are made to establish a reference in order to be able to compare the various experimental results found in the literature. Indeed it is not always clear on the exact amount of hydrogen stored that is presented, and this frequently depends on the experimental technique used to measure the hydrogen storage capacity of an adsorbent.
44..22 TThhee eexxppeerriimmeennttaall tteecchhnniiqquueess ttoo mmeeaassuurree tthhee hhyyddrrooggeenn ssttoorraaggee
Different techniques are used for measuring the amount of hydrogen stored in a material, might it be a metal hydride or any other type of material, and no standardized method exists either for the measurement or for the pre-treatment of the material. Depending on the method used, the storage conditions may vary from liquid nitrogen temperature to higher temperatures (300°C) and from 0 to 300 bars. Even though these procedures are not standard, the most recurrent common point between the various experiments is the amount of material used for the measurements. The mass varies from milligrams to 0.1 g, which is a very small amount of material. Four techniques are commonly used in the literature and in different laboratories studying the subject. These techniques have their own characteristics and operating conditions, with advantages and disadvantages, and a brief review of these techniques - the gravimetric and the volumetric method, temperature programmed desorption spectroscopy and the electrochemical measurement - will be given below.
4.2.1 Gravimetric method
This method measures the variation of the mass during the adsorption and desorption of hydrogen in the sample [63].
A typical design of a thermobalance of high precision that can be used for such experiments is shown below. The system comprises a computer controlled microbalance, a pressurised chamber in stainless steel that can also be used in ultra vacuum, a specific chamber for the sample and another one for the balance, a system for the control of the gas pressure, a system for the control of the temperature and a system for the introduction of the gas.
Figure II-29 Schematic diagram of the thermobalance Hiden IGA
This technique enables to determine the experimental adsorption isotherms with pressures comprised between 1 and 10 bars and temperatures varying from -191°C to -120°C.
Concerning the precision of the measurement, the minimum amount of material required for the measurements is a few milligrams, for a maximum capacity of 5 grams, which is never attained. The resolution of the equipment is of 0.2 micrograms and the stability of the measurement reaches ± 1 microgram. The resolution of the measurement of the pressure depends on the scale used during the
Gas Pressure and inlet/outlet control
Vacuum Balance tare and sample
Thermo regulation

Chapter II Literature review on hydrogen storage and on the carbons used for hydrogen adsorption
47
different adsorption and desorption stages, but the sensitivity is of 0.15%. The thermocouples used are of type K and a double control of the temperature is placed in the sample in order to measure the real sample temperature.
The tare pan (point F of the schema) is at a constant temperature of 54°C whereas the temperature inside the sample containing chamber is variable. Prior to any adsorption tests, the sample is outgassed in a secondary vacuum at a predetermined temperature comprised between 150°C and 600°C, in order to reproduce the initial state of the surface of the adsorbent. During this outgassing the mass loss of the sample is measured directly in the microbalance. The sample is then brought back to room temperature and the whole system tarred. A small amount of hydrogen (10 mbar) is then introduced in the system and the system is brought to the required temperature. When the temperature is reached the system is pressurised by stages up to 10 bars thanks to a variable leak valve. The time period for the different stages is around 20 minutes maximum as the total mass stabilises quickly. Desorption is then immediately activated, and the same pressure stages are used when taking-off the hydrogen by successive increments. The remaining hydrogen is then pumped out and the chamber evacuated, and the sample reheated to room temperature. Some air is finally reintroduced in the cell and the sample is weighted again.
This technique presents the advantage that no corrections are required in order to transform a volume of gas into a mass for the estimation of the weight percent of hydrogen stored in the sample. The mass of hydrogen in the carbon is directly measured.
The problem that can occur with this technique is that it is sensitive to all gases absorbed or desorbed since it is only based on the weighting. Another major correction to bring to the calculation of the weight percent is the correction for the floatability. The apparent weight of a sample in a gas is lower than the real mass of the sample due to force exerted by the gas on the sample. This correction follows the principle of Archimedes. Because the volume of the sample is high compared to the mass (very low density), the mass of the gas displaced pushing against the sample and making it ‘float’ in the gas, is an important fraction of the total mass of the sample. Hence the difference between the real and the apparent mass of the sample is equal to the mass of gas displaced, the floatability.
4.2.2 Volumetric method
On the concern of studying the adsorption of hydrogen on carbon samples as a function of pressure and temperature, the Department of Energy studied the adsorption of hydrogen on their samples thanks to a Sieverts apparatus shown on the figure below.
This method is very similar to the gas adsorption used for the characterisation of the materials. The operating principle is based on introducing a known amount of gas into a known volume containing an absorbing sample and measuring the pressure. By assuming an equation of state, usually the ideal gas law, the amount of absorbed gas can be calculated. In order to measure accurately the amount of adsorbed gas it is of primer importance to measure the temperature, volume and pressure of both the reference and the sample chambers to high accuracy. Helium gas is used to calibrate the sample volume including the dead volume of the sample itself.
Some careful calibration procedures must be observed in order to determine the reference and sample chamber volumes. A certain number of considerations have to be taken, such as the volume displaced by the sample itself and the effect of the temperature and pressure on the volume. These must be factored in the calibration and the adsorption calculations.
The maximum pressure rating for the set-up is 345 bars with an actual maximum pressure source of 172 bars. A vacuum system is installed that initially evacuates all the volumes of the system, and assists in the initial outgassing of the sample.

Chapter II Literature review on hydrogen storage and on the carbons used for hydrogen adsorption
48
Figure II-30 Schematic diagram of the Seiverts volumetric apparatus [64]
The pressures are constantly recorded in the two chambers and the system is completely automated through pneumatic valves. The advantage of such a technique is that both the adsorption and the desorption can be measured and that the conditions are similar to usage in a storage tank.
For a good accuracy and reliable results, this method requires typically specimen masses of 500 mg or more. Furthermore, any leakage or temperature instability can give rise to large experimental errors, as a decrease in the pressure is a manifest of the adsorption by the sample. It is thereby difficult to differentiate between adsorption and leak if no preliminary results have been done. This apparatus was developed when the production capacity of nanotubes became large enough for testing. Prior to this method another technique was used: temperature programmed desorption spectroscopy.
4.2.3 Temperature programmed desorption (TPD)
In this case, the adsorption of hydrogen on carbon soots [65,66] is probed thanks to a temperature programmed desorption spectroscopy in an ultra-high-vacuum chamber equipped with a liquid-nitrogen-cooled cryostat and a mass spectrometer. Samples of around 1 mg are placed in a packet formed from a 25 µm thick platinum foil and mounted at the bottom of a liquid nitrogen cooled cryostat. The packet is resistively heated with a programmable power supply. Some pinholes are made on the platinum foil in order to enable the diffusion of the gas into and out of the packet. An ion gauge and a capacitance manometer are employed to monitor the pressure. The gas exposures are controlled with a variable conductance leak valve and isolation gate valves separate the sample compartment during high-pressure gas exposures.
Figure II-31 Schematic representation of the temperature programmed desorption spectroscopy [67]

Chapter II Literature review on hydrogen storage and on the carbons used for hydrogen adsorption
49
A mass spectrometer measures species with an m/e up to 300 a.m.u (atomic mass unit) and insures that only hydrogen is involved in the adsorption and desorption cycles. The instrument can easily be calibrated by the thermal decomposition of known amount of CaH2. The amount of evolved hydrogen is linear with the weight of the decomposed CaH2, and the calibrations are performed with amounts of CaH2 that yield a TPD signal similar to that measured with SWNT samples. The TPD program can also be calibrated with Pd and Ti hydrides.
Prior to hydrogen adsorption studies SWNT samples are initially outgassed by heating in a vacuum of 10-7 mbar to 550-700°C at 1°C/s. The sample temperature is measured with a thin thermocouple spot-welded to the platinum packet. Room temperature H2 exposures for approximately one minute at pressures between 1.10-5 and 7.10-4 mbar saturate the hydrogen adsorption. Capacity determinations in the TPD are done by cooling the sample to -143°C in the presence of hydrogen at a pressure of 4.10-7 bar, prior to the evacuation of the chamber. The hydrogen gas is then evacuated from the chamber after the sample is cooled, and temperature-programmed desorption spectroscopy is performed in order to assess the hydrogen adsorption onto the sample. As the temperature is raised at a rate of one degree Celsius per second, hydrogen evolves from the sample and is analysed through the mass spectrometer. As a first approximation, it can be said that the shape of the temperature-programmed desorption spectrum is a map of the hydrogen density in the sample as a function of the temperature.
The advantage of such a technique is that it gives information on the localisation of the hydrogen in the sample. If a known amount of hydrogen is released at a specific temperature, it is possible to estimate the chemical location of the hydrogen in the sample thanks to the heat of adsorption and the energy required for the release of hydrogen. The disadvantage of this technique, is that with the energy exerted in the form of heat in the sample, the volume of hydrogen measured by this technique, is hydrogen that was either physisorbed or chemisorbed. In order to increase the sensitivity and the selectivity of the apparatus, it is possible to use deuterium loaded specimens.
4.2.4 Electrochemical measurements
It is possible to store hydrogen in a metal in order to form a metal hydride. These metal hydrides can be used to form electrodes for batteries, and these electrodes are characterized thanks to some electrochemical measurements. This original method measures the discharge capacity of the samples due to the desorption of the hydrogen electrochemically stored in the sample [68,69,70,71,74]. A correspondence is then made between the discharge capacity and the weight percent of hydrogen that can be stored in the material. This technique, widely used for metal hydrides, is now being used in carbon powders.
A three electrode cell is used for these measurements, as shown in the Figure II-32 below. The electrodes are produced by initially mixing and grinding the sample to be tested with a conductive nickel powder, which is corrosion resistant and has a high catalytic activity in alkaline conditions, and an organic binder of polytetrafluroetylene (PTFE). Gold or copper can also be used as a compacting powder to stabilize the electrode, as gold is noble and does not participate in the electrochemical reaction. The pellets made are then used as negative electrodes in a half cell with a counter electrode, and a reference electrode, which determines the cut-off potential and measures the potential change during each cycle.
The counter electrode generally used is made of nickel and the reference electrode generally used is Hg/HgO, but Ag/AgCl or a saturated calomel electrode [72] can also be used. The electrolyte most widely used is a solution of potassium hydroxide 6 M KOH or 1 M H2SO4.

Chapter II Literature review on hydrogen storage and on the carbons used for hydrogen adsorption
50
Figure II-32 Schematic diagram of a charge-discharge cycling apparatus [73]
The capacity of hydrogen storage is measured electrochemically through the electrolysis of water in the electrolyte. During the charge process, the water in the electrolyte dissociates at the work electrode - the sample being the negative electrode - into the adsorbed atomic hydrogen, and OH- ions remaining in the electrolyte. The adsorbed atomic hydrogen may intercalate in the electrode or recombine at the surface to molecular hydrogen and diffuse into the electrode.
During the discharge process, the hydrogen in the electrode recombines with the OH- ions in the electrolyte to form water molecules. This reaction of recombination is accompanied with a charge transfer and the amount of hydrogen desorbed from the electrode can be measured by measuring the electric charge, which is the product of the current and time in the galvanostatic set-up.
The charging/discharging experiments are conducted at a constant current until a specific capacity is attained. After a brief pause, the electrodes are discharged until the cut-off potential of 0.0 V versus the reference electrode is reached. This procedure is repeated as long as the discharge current is larger than 1 mA.g-1. The reversible storage capacity can then be calculated as the sum of the charges. The value of the adsorption capacity is determined from the duration time of the galvanostatic discharge of hydrogen, assuming that adsorption of 1 wt% of hydrogen corresponds to a charge of 273 mAh.g-1 [74].
44..33 CCllaassssiiccaall ppiittffaallllss oonn mmeeaassuurriinngg hhyyddrrooggeenn ssttoorraaggee
After presenting the various measuring techniques for hydrogen storage, it is important to note that even though these various techniques are made available for measuring the same characteristic of a material, they are different, and the results are not always comparable. Measuring the amount of hydrogen stored in a material is a complex problem and some classical pitfalls are resumed hereafter after collection from the literature [75].
One of the first classical pitfalls, is the gas itself, hydrogen. As described earlier, hydrogen is a non ideal gas with specific properties. It is extremely important to consider the compressibility factor of hydrogen during the measurements of hydrogen uptake in carbon materials. It is also important to take into account the chemical reactivity of the gas and to consider its ease for diffusion. A parameter that can also be studied concerning hydrogen is its purity, and one has to compare the hydrogen uptake of the same sample with two different gas purities.
Beyond the gas itself, the other classical pitfalls concern the experimental set-up and its surrounding: the sample, the pressure vessel, the measuring technique used and the experimental protocol.

Chapter II Literature review on hydrogen storage and on the carbons used for hydrogen adsorption
51
4.3.1 The sample
The sample should be as massive and pure as possible. Massive, in order to have as large a surface area as possible, thereby rendering the measurement easier, whatever the technique used, and pure so that any hydrogen uptake can be attributed to the appropriate part of the sample, not to diffusion into the catalyst particles or adsorption onto other carbon impurities present. Care should also be taken on the reproducibility of the sample production as it has already been observed that two as-prepared samples coming from a same batch revealed two different percentages of open tubes [116], that varied from 40% down to 15%. The greater the amount of material the smaller the errors generated during the measurement. If a sample adsorbs a certain amount of hydrogen then the greater the mass of material tested, the greater the absolute amount of hydrogen adsorbed and hence the lower the absolute and relative error done on the storage capacity. This is also to be considered for the volume of material. The greater the mass the lower the dead volume, reducing the errors. In order to produce a large amount of material and due to the low amount of material produced during a single run, several experimental runs are required, which is not a guarantee of the homogeneity of the sample tested due to a lack of reproducibility of the processes involved.
Purity is also an important aspect, as important phenomenons occur in the adsorption process, and the lower the number of variable parameters the better the understanding on the adsorption. It is important to bare in mind that the amount of hydrogen stored in a sample cannot be extended to a simple element in the sample unless it is pure. The various interactions in the sample due to the presence of metal catalysts and the carbon structures participate in the adsorption process and the final total amount of hydrogen stored. When announcing some experimental results, no extrapolation on the results should be done, as it is the sample that adsorbs and not just a nanotube or a nanofibre. In that sense it is important to test pure samples, or announce the composition of the sample in parallel to the results.
Beyond the idea of a pure sample, it is necessary to consider the reproducibility of the production process of the carbon, and to analyse the material structure with some detailed composition. With the small knowledge that the scientific community has on the storage of hydrogen on carbon materials, it is difficult to emit some hypothesis, without considering every structural characteristic of the material.
Care should also be taken in the image analysis of the samples tested as the photos presented in the literature show the most impressive areas of a sample which are not always representative of the entire sample. Once again a critical view is required when analysing the experimental results in the literature.
4.3.2 The pressure vessel
The pressure vessel is the core structure of any experimental set-up. It should be adapted to the volume and mass of the sample studied in order to minimise the size ratio between the vessel and the sample. Indeed, the smaller this ratio, the smaller the dead volume and hence the smaller the errors induced by the sample size with respect to the volume of the pressure vessel. Furthermore, the diffusion rates of hydrogen in some kinds of steel can rise by 9 orders of magnitude between room temperature and 600°C, which means that the pressure vessel does not react the same way at different temperatures.
The pressure vessel should be adapted to the experimental set-up used and to the amount of carbon to be tested. Whatever the vessel, no vessel is hydrogen leak proof under high pressure. To minimise the errors the pressure vessel should typically be tested under the used pressure and temperature at the same time, meaning that prior to testing at high temperature or pressure, the pressure vessel should be tested under the same conditions when it is empty of material. This is done in order to obtain a reference measurement that considers only the reaction of the vessel at the conditions under which the sample will be tested.
Generally, the leaks that appear in an experimental set-up are due to the periphery of the vessel itself. These elements should be adapted to the experimental set-up in terms of pressure (high pressure or vacuum pressure) and temperature. Also, it is quite frequent that the materials tested are in the form of powders and hence precaution should be taken against the risks of obstruction on various valves due

Chapter II Literature review on hydrogen storage and on the carbons used for hydrogen adsorption
52
to powder infiltration. Nanometric size particles can infiltrate anywhere possible. In order to prevent this, after every experiment the flow of an inert gas cleans the set-up and some filters should be placed in the vessel.
It is essential to understand what is being measured by the apparatus deployed in the experimental set-up, such as pressure transducers, that can either measure the absolute or the relative pressure. Also the pressure and/or temperature range should be adapted to the situation, as an inadequate transducer can give large errors in the measurement, and transducers are available with various accuracies.
4.3.3 Experimental protocol
The experimental protocol is used for the determination of the adsorption capacity of the carbon samples. In order to get an estimation of the adsorption capacity of some materials, an experimental protocol should be established that can then be optimised with some experience. Prior to any optimisation on the experimental protocol, it is of primer importance to establish one initially and stick to this protocol in order to compare results obtained on a similar experimental set-up.
There are various parameters in the experimental protocol that influence the final result, such as the outgassing protocol of the sample, the temperature and pressure of the experiments and other parameters such as the duration of the experiment, the adsorption time and the kinetics. Might it be during the adsorption or the desorption phase, depressurising the sample must be done carefully, especially considering that this greatly influences the temperature of the sample in the pressure vessel.
There are actually no real experimental protocol established neither for the outgassing of classical carbons or for the equilibrium time prior to desorption. Considering, for example, the outgassing of the sample there are three parameters that should be taken into account: the outgassing temperature, pressure and time. These parameters are defined by the experimenter and are generally established as a function of the apparatus available. Similarly, the equilibrium time for the adsorption processes is difficult to determine. Indeed, even though physisorption is not a long process, the diffusion of a gas into a disordered sample might be, and hence it is not an easy task to determine precisely this equilibrium time.
The determination of the dead volume is crucial for the final results of hydrogen storage, as every mole of hydrogen that is not due to the dead volume during adsorption or desorption is considered as being adsorbed by the carbon. If the storage capacity of the carbon material is low, a small deviation in the determination of the dead volume can bring important errors on the final result.
Whatever the experimental protocol for the testing of carbon material, it is essential to clearly establish the protocol in order to understand what has been measured and how it has been measured with the different steps on the measurement.
4.3.4 Measurement techniques
There are actually quite a number of measurement techniques available for measuring the amount of hydrogen stored in a material. These techniques have been explained previously, and can be divided into direct and indirect measurement techniques. The direct measurement technique is the gravimetric one. The indirect techniques are either quantitative or qualitative. Described as indirect quantitative techniques are the volumetric technique and the thermal desorption spectroscopy, whereas the indirect qualitative techniques concern analysis techniques such as diffraction studies, Raman spectroscopy and nuclear magnetic resonance (NMR).
It is important to understand the specificity of each technique as well as the sensitivity of every apparatus. It might be possible that each technique is sensitive to a specific form of hydrogen, and that measuring the adsorption on one sample through two different techniques might not necessarily give the same result depending if the hydrogen is atomic, di-atomic, protonic or molecular. It is still not clear whether every measuring technique measures the desorption or adsorption of hydrogen on the same sites or not.

Chapter II Literature review on hydrogen storage and on the carbons used for hydrogen adsorption
53
44..44 TThhee eexxppeerriimmeennttaall ccaalliibbrraattiioonn
There has been the last few years a certain number of publications concerning hydrogen storage on various types of materials using various different techniques, and it has been observed that the experimental results could vary drastically for a same type of material. In order to obtain some certainty on the experimental results, an experimental calibration of the set-up using the storage capacity of a well known material enables to relieve some uncertainties on the experimental set-up.
Various materials store a well known amount of hydrogen at a specific temperature and pressure, and one can easily obtain this material with the adsorption or desorption isotherms. The database with the storage capacities of metal hydrides [19] is accessible online, and can be used for this purpose.
The major upcoming issue is to set - by national and/or international institutes - some measuring standards on the calibration of an experimental set-up and on the experimental protocol. For the moment there are no obligations concerning an experimental set-up on the measuring conditions and on the calibration to be done, and no specificities either on the various protocols for outgassing etc. It is important for some standards to be established for the scientific community to start solving this problem on the panel of experimental results that have been made public over the last decade, without sufficient scientific consideration.
The next paragraph will set a state of the art on the experimental results on the various forms of carbons presented earlier published over the last few years. The total number of articles actually published on this subject is quite impressive and a selection has been made in order to state the articles that appeared to be the most interesting in hydrogen storage.
- $$
The state of the art will include the various results presented in the three families of carbon presented: the family of graphite, carbon black and activated carbons, another family with the nanofibrous carbons, and finally the carbon nanotubes will be considered.
55..11 GGrraapphhiittee,, ccaarrbboonn bbllaacckk aanndd aaccttiivvaatteedd ccaarrbboonnss
5.1.1 Preliminary results
The adsorption storage on activated carbons has the same known advantages as the compression storage, but fewer of its drawbacks. Figure II-33 below schematically compares gas storage density between adsorption and compression. It can be seen that at equivalent gas storage density adsorption requires a lower pressure, and at equivalent pressure more gas is stored through adsorption. This is economically a great advantage as it decreases the compression costs, but for the best storage possible, it might be required to decrease the temperature, implying an initial investment in cryogenic reservoirs.

Chapter II Literature review on hydrogen storage and on the carbons used for hydrogen adsorption
54
Figure II-33 Comparison of adsorption storage and compression Storage [76]
Considering some experimental results [77] at a temperature of 20°C, with an activated carbon sample, that revealed to be the sample with the highest micropore volume, a gain in pressure was observed. It was shown that adsorption is favourable compared to compression. In this case a pressure improvement up to 26% in the pressure during adsorption was observed compared to a system in pure compression, implying a reduction cost in case of use for industrial applications. Indeed, for a storage capacity of 19 kg.m-3 a pressure of 270 bars was required for compression whilst a pressure of 200 bars was required for a system with adsorption.
Hydrogen adsorption measurements have also been done on graphite samples, showing that there are two kinds of trapping for hydrogen in graphite materials [78]. The first trap being an interstitial cluster loop edge or a solitary dangling bond located in the crystallite with an energy of 4.4 eV and the other trap is a dangling bond located at the edge surface of a crystallite with an adsorption enthalpy of 2.6 eV. The latter trapping dominates hydrogen retention in a usual graphite sample and has a pressure dependence, while the first trap is not due to the high energy of adsorption. These different traps were illustrated using thermal desorption spectroscopy.
5.1.2 The influence of the experimental conditions
According to the thermodynamic law of Le Chatelier, for an exothermic reaction the efficiency is increased when the temperature is decreased, and for an endothermic reaction the efficiency is increased as the temperature is increased, therefore the adsorption is increased with decreasing temperature and increasing pressure. In Figure II-34, the considerable effect of temperature on the adsorption is observed.

Chapter II Literature review on hydrogen storage and on the carbons used for hydrogen adsorption
55
Figure II-34 Adsorption Isotherms of H2 on AX-21 at different temperatures [76]
At a pressure of 10 bars the activated carbon AX-21 adsorbs more than 5 times more at -196°C (77K) than at room temperature, and when compared to room temperature, the activated carbon is more efficient at –196°C than at –98°C (175 K). Indeed for a decrease from 25°C to –98°C (T=123 °C) at 50 bars, the adsorption is multiplied by two, whereas for a change in temperature from –98°C to –196°C (T=98°C) the adsorption at 50 bars is multiplied by three. This steady increase in the adsorption on AX-21 has also been observed at higher temperatures [79] with a storage of 0.5 wt% at 25°C and 60 bars and 0.89 wt% at -40°C. A 78% increase in storage capacity is observed at -40°C compared to 25°C whereas a 42% increase is observed at -20°C. These results show that activated carbon remain interesting materials compared to the new forms of nanostructured materials produced [80], because they are readily available with a high surface area and hydrogen is stored in the gaseous form, at the liquid nitrogen temperature (-196°C).
In order to estimate the efficiency of an adsorbent, the hydrogen uptake of the given adsorbent should be measured as a function of the pressure and temperature. The entire operational range consists of atmospheric pressure to 60 bars and room temperature to -196°C. These measurements are time consuming and usually based on standard gravimetric and volumetric techniques for the desired pressure and temperature range. Figure II-35 [81] shows a set of measurements of excess adsorption for the H2/AX-21 system using an automated experimental set-up based on the volumetric method.
Figure II-35 PVT surface of H2/AX-21 system [82]
The figure above is very representative of the operating conditions necessary for the most efficient adsorption of hydrogen. Adsorption on activated carbon is more efficient at low pressure (up to 10-20

Chapter II Literature review on hydrogen storage and on the carbons used for hydrogen adsorption
56
bars) but reaches a saturation limit quickly, and reversibly for the temperature: at high temperatures (27°C) the efficiency is low with a sudden increase around -73°C down to -196°C [83]. These are very interesting results as they show that adsorption on activated carbons is efficient under certain range of conditions (P=1 to 20 bars and T= -73°C to -196°C), but on the other hand these operating conditions for hydrogen storage are hardly usable for industrial applications. The ultimate goal for the most efficient adsorbent would be high adsorption storage capacities at reasonable operating conditions, closer to room temperature and low pressure.
Room temperature adsorption in activated carbons is more efficient in storing methane [84], the main constituent of natural gas, than hydrogen. The pore size distribution in activated carbons tends more towards the mesopores and macropores, which are more favourable to the storage of methane, a larger molecule than hydrogen.
Figure II-36 Excess adsorption isotherms of CH4 and H2 on AX-21 activated carbons [84]
The AX-21 type carbons are produced by the reaction of cokes with potassium hydroxides (KOH) and have a cage-like type of porosity in which pore filling occurs by the cooperative effect, thus giving them an unusually high surface area of the order of 2600 m2.g-1. A high surface area is clearly desirable in order to maximise adsorption per unit mass, but it is also critical to have an adsorbent with a high bulk density in order to minimize the volume of the storage system [76]. For example the AX-21 carbon has a surface area of 2600 m2.g-1 and a bulk density of 0.3 g.cm-3, while Calgon’s BPL carbon has a surface area of 1100 m2.g-1 with a bulk density of 0.47 g.cm-3. On a mass basis, AX-21 adsorbs 125% more than BPL (-196°C and 35 bars), but on a volume basis AX-21 will only store 25% more hydrogen than BPL (-196°C and 35 bars). The best suitable material should store the most efficiently possible in the mass and volume basis, as for mobile applications the volumetric storage capacity is an important issue as there is limited space.
Interesting results have shown that an activated carbon could store a maximum of 1.6 wt% at the temperature of 20°C and the pressure of 125 bars [85]. A theory has been put forward on hydrogen physisorption in activated carbon, with a proportionality between the weight percent of hydrogen stored and the specific surface area measured through BET [82,86,87]. Beyond the possibility of this proportionality, a surface area of more than 3000 m2/g has been measured for this activated carbon, which is impossible considering that the theoretical maximum surface area possible for a carbon sample is 2630 m2/g (refer to section 3.1).
5.1.3 Carbon treatment effect
In order to increase the volume of hydrogen stored it is always possible to increase the surface area, but this is mainly done at the detriment of the bulk density. It is also possible to increase the bulk density of the adsorbent by surface modification. For hydrogen for example a metal assisted modification of the surface of the activated carbon could lead to a 20% enhancement in the hydrogen

Chapter II Literature review on hydrogen storage and on the carbons used for hydrogen adsorption
57
uptake.
The solidification method consists of squeezing the voids out of the carbon without considerably reducing the specific adsorption. This had the effect of increasing the bulk density of AX-21 and increasing the H2 storage density, as seen in Figure II-37. In this type of situation it is important to find an appropriate balance between surface area and microporosity.
Figure II-37 Comparison of the H2 storage density at –196°C as a function of pressure [76]
The improvement between the as-received AX-21 and the solidified AX-21 of the volumetric storage capacity is 54% at around 17 bars, and 34% at around 35 bars. At 17 bars and -196°C, the storage capacity of the solidified adsorbent is more than 5 times greater than for pure compression in the same conditions. It is around 40% of the liquid hydrogen density and is equivalent to the density of compressed hydrogen at 90 bars and -196°C. At equivalent temperature and amount of hydrogen stored the solidified adsorbent has a pressure more than 4 times lower than for compression, which again implies a reduction in cost. At 35 bars and -196°C, the adsorption storage capacity is three times greater than for compression, and at equivalent storage density, a pressure of 110 bars is required for pure compression.
Activated carbons store hydrogen but are not very effective in hydrogen storage systems because only a small fraction of the pores in the typically wide pore-size distribution are small enough to interact strongly with gas phase hydrogen molecules. The pore size distribution of activated carbons tends more towards the meso and macropores, whereas for hydrogen storage, micropores are required. Nevertheless the results found with activated carbons are available for other adsorbents: it is essential to reduce temperature and increase the pressure for the most efficient conditions for adsorption, and surface treatment could improve the hydrogen storage in carbon adsorbents.
5.1.3.a Alkali modified graphite
Thermogravimetric measurements have been performed on Li and K intercalated graphite [88]. No evidence of absorption was observed in the Li-intercalated graphite, whereas a true hydrogen absorption was observed in the K-intercalated graphite at 1.3 wt% with a 0.2 wt% cyclable. These results were confirmed by an independent laboratory at 1 wt% with 0.3 wt% cyclable. This work revealed the problems with the impurities in the gases that were absorbed by the sample, and more particularly the water present. An increase in the weight percent was observed due to the formation of KOH or LiOH hydrates due to the presence of water, and/or the absorption of water by the graphite. These samples are extremely sensitive to the presence of water. This shows the limits of thermogravimetric measurements, as the weight increase does not distinguish the various impurities present during the experiment. This was confirmed on measurements performed on alkali doped carbon nanofibres and nanotubes [89].

Chapter II Literature review on hydrogen storage and on the carbons used for hydrogen adsorption
58
5.1.3.b Ball milling in activated carbon and graphite material
During ball-milling, the carbon materials get mechanically damaged when hit between balls or ball and bowl wall. Ball milling at room temperature in a hexane medium for various times has shown that the ball-milled graphite does not adsorb hydrogen at room temperature but adsorbs hydrogen at the liquid nitrogen temperature with a capacity of 0.6 wt% [90]. When mixed with nickel, the ball milled carbon adsorbed hydrogen more efficiently at -196°C at 0.63 wt% and then decreased again with a greater nickel content, as it is assumed that the addition of nickel can reduce the active part of the carbon that adsorbs. Initially, nickel acts as an activator as it helps in splitting the hydrogen molecule into hydrogen atoms which are adsorbed.
Ball milling in graphite carbon material showed that an optimal of 15 hours for milling enables an increase in the BET specific surface area with an increase in the internal and external surface area [91]. The increase of the internal surface area is the result of the creation of micropores that are formed through the agglomeration of nanosized disordered layers under ball impacts, hence a disordered and nanoporous carbon powder was created. Mechanical milling under an Argon or hydrogen atmosphere enables to reach the maximum of surface area [92]. The creation of defects in the graphite milled carbon under low hydrogen pressure could explain the increase in the chemisorbed hydrogen with decreasing hydrogen milling pressure [92,93,94,95]. A higher hydrogen pressure creates a more ordered structure that could be due to a high local temperature in the particle contact during milling, that is more favourable to physisorbed hydrogen.
On the contrary to graphite, mechanical milling on activated carbon might not alter the structure as much. It appeared that the hydrogen storage capacity of activated carbon increased with mechanical milling time up to 10 hours and samples milled with greater times showed little dependence on milling time [96], with a net hydrogen concentration of 1.7 wt%. Thanks to temperature desorption spectroscopy two different mechanisms were assumed for adsorption by activated carbon due to two different desorption peaks at 500°C and 800°C : hydrogen as a molecule may be trapped in the pores destroyed by mechanical milling and hydrogen as an atom may be combined with dangling bonds of carbon atoms as electronic structural defects [97].
The next experimental results presented will be those measured on carbon nanofibres.
55..22 CCaarrbboonn nnaannooffiibbrreess
A large amount of research has been done on carbon nanofibres, and the first controversies came after hydrogen storage measurements on carbon nanofibres were published but that have never been reproduced [98]. This created an increased interest in these materials for hydrogen storage. The general phenomenon envisaged for the adsorption of hydrogen in carbon nanofibres is that the hydrogen molecules adsorb between the graphene layers that form the various types of nanofibres available, even though the role of the catalysts with respect to the fibres has not yet been completely determined with respect to adsorption.
Figure II-38 Schematic representation of the structure of a graphite nanofibre and details of the hydrogen adsorption process [42]

Chapter II Literature review on hydrogen storage and on the carbons used for hydrogen adsorption
59
A comparison study of hydrogen adsorption on various forms of carbons [99] has been done, and revealed that the maximum storage capacity was typically less than 0.1 wt% at 90 bars and room temperature. The storage capacity could be increased at the same pressure and decreasing temperature, from room temperature to liquid nitrogen temperature, and a storage capacity of 1 wt% could be reached, while a storage of 5 wt% could be acquired for a Saran carbon, a pure, dense, porous material with a high surface area, formed by the pyrolysis of polyvinylidene chloride. This suggests that measured on a per atom basis the graphite nanofibre show adsorption beyond one could expect from a normal surface, and that the ratio of hydrogen coverage to surface area seems high for the graphite nanofibre: Saran has a specific area of 1600 m2/g and the nanofibres produced around 25m2/g. This was confirmed in a comparative study between intercalated and exfoliated carbon nanofibres and the AX-21 activated carbon [100]. The carbon nanofibres at room temperature and 105 bars showed a hydrogen adsorbed per unit surface a few orders of magnitude lower than the carbon exfoliated nanofibres.
The sorption capacities of nine different carbon materials at pressures up to 110 bars and temperatures ranging from -80°C to 500°C have been studied, showing very little hydrogen sorption, less than 0.1 wt% at room temperature [101]. The authors show a critical view of their experimental set-up, with the influence of the pressure drop and the temperature on the pressure reading, and how a small change in pressure can easily be taken for some hydrogen adsorption, whereas it is undisputedly a leak in the system. Considering the large range of material they have tested, the very low values obtained for storage capacity and the possible experimental deficiencies, they believe that the various claims of storage capacities greater than 1 wt% at room temperature are erroneous and due to experimental errors. As an example of such results, vapour-grown carbon nanofibres showed storage capacities varying from 10 wt% to 12.8 wt% [102] at a pressure of 110 bars and at room temperature.
5.2.1 Catalytic hydrogen transfer
A recent work studied the effect of hydrogen uptake under palladium catalysed carbon nanofibres of the herringbone type [103]. The carbon nanofibres obtained on Pd catalyst exhibit a catalysed hydrogen uptake with increasing Pd/C ratio in the sample up to a saturation value of 1.5% hydrogen at room temperature and a pressure of 100 bars. Measurements on the Pd sample after complete removal of the carbon by oxidation show similar absorption capacity than with pure Pd, and the hydrogen uptake by the carbon was calculated by subtracting the contributions of hydrogen absorption by pure palladium.
The increase of the palladium to carbon nanofibre ratio with the palladium to carbon ratio might be due to a possible modification of the carbon nanofibre surface by charge transfer between the carbon nanofibre and palladium. The hydrogen uptake in the presence of atomic H supplied by the Pd is similar to the electrochemical charging and the literature on the electrochemical charging of hydrogen show similar results as the ones presented in this work.
It is interesting to note that as oxidation or heat treatments exist on samples produced with catalysts to purify the sample in order to obtain the purest samples possible, some specifically chosen metal catalysts are used in order to increase the storage capacities of the carbon nanofibres. In this case, is the effect of the hydrogen uptake increased in the palladium hydride with the presence of the nanofibres or reversibly ? Nevertheless, the palladium to carbon ratio was increased by oxidation of the carbon resulting in a decrease of the carbon content and an increase in the palladium proportion.
5.2.2 High temperature heat treatment
Some nanofibres produced through the catalytic decomposition of methane using a mixture of Ni and MgO as catalyst were heat treated at 1200°C in an inert nitrogen atmosphere [104]. The heat treatment increased the storage capacities by 30 % from 1.1 wt% to 1.4 wt%. Two reasons are given for this evolution. Indeed, the change observed in the interlayer distance of the graphene sheets, in the (002) plane, could optimise the hydrogen intercalation, or it might be the annealing effect of the heat treatment that could have evaporated the organic compounds and impurities from the surface of the nanofibre. It was observed that the heat treatment had a positive effect on the hydrogen storage

Chapter II Literature review on hydrogen storage and on the carbons used for hydrogen adsorption
60
capacity, but the observed effect was not as positive as the one observed on nanotubes.
Other works reveal the importance of the (002) plane as compared to (h0l) or (hk0) planes [105,106]. As grown graphitic samples produced by thermal cracking of ethylene or acetylene with fine nickel and copper metal catalysts showing intensive (002) peaks in the XRD patterns revealed great storage capacities. It appeared that approximately 10 wt% of hydrogen was desorbed at 27°C and 120 bars. In addition to this, cycling of the sample appeared to increase the storage capacity from 10 to 15 wt% at the fifteenth cycle. XRD and TEM investigations suggest that hydrogen enters between the (00l) graphene layers, leading to a lateral expansion of the layers creating void and turning the planes curved and lengthened. The periphery of the void space may be suitable sites for adsorption of hydrogen molecules upon cycling.
Beyond the fact that the storage capacities are extremely high and doubtful, it is said that the experimental set-up has been calibrated with LaNi5, and the intercalation theory of the hydrogen in between the graphene layers appears plausible, even though the plastic deformation of these same layers seams less obvious.
The next experimental results presented will be those measured on carbon nanotubes.
55..33 CCaarrbboonn nnaannoottuubbeess
Pure graphite is not considered to be an excellent adsorbent. Being assimilated to a sheet made of carbone atoms, the potential attraction fields of graphite do not overcome, and does not favor hydrogen adsorption. Once such a sheet is curved to form a nanotube, the potential fields interact inside the tube, increasing the adsorption forces. On the other hand, outside the nanotubes, the curvature does not stimulate the interaction forces for adsorption.
The nanotubes represent interesting materials due to their nanometric size which represents extremely small pores, and the inside of the tube are potential adsorption sites for hydrogen. The interest in carbon nanotubes resides also in the fact that more adsorption sites are possible because of the arrangement of nanotubes between themselves in a carbon material, providing additional adsorption sites to the internal cylinder formed by the nanotubes [107], as seen in the next figure.
Grooves
Interstitialchannels
External nanotubes walls
Grooves
Interstitialchannels
External nanotubes walls
Figure II-39 Possible adsorption sites in a bundle of nanotubes schematically represented [75]
Hydrogen storage measurements on two different types of SWNTs showed that a random sample stored 0.68 wt% at 17°C and 100 bars whilst the aligned sample showed a higher adsorption in the same conditions of 2.4 wt% [108]. This difference in the storage capacity has been explained by the alignment degree of the tubes in the sample, and attributed to the effective uptake of hydrogen by the inter-nanotube space, that is, the micro interstitial channels between the aligned carbon nanotubes.
Gas adsorption studies on carbon nanotubes have shown that in the case of as grown SWNT, gases

Chapter II Literature review on hydrogen storage and on the carbons used for hydrogen adsorption
61
are adsorbed only in the interstitial channels as the SWNT bundles, most probably due to the fact that the tube ends are closed. On the other hand, in the heat treated SWNT, gases are adsorbed mostly in the inside surface of the nanotubes [109,110], due to the opening of the entry ports [111] - which appeared essential for gas adsorption - in the low adsorption volume range and then mostly in the interstitial channels in the high adsorption volume range. This suggests that the inside of the nanotubes is more stable for gas adsorption than the outside.
As for the carbon nanofibres, the interaction between the metal catalysts and the adsorption of hydrogen is not clear. Initial results have shown storage capacities around 5 wt%, and it appeared that it was actually a material containing 0.2 % nanotubes that stored 0.01 wt% hydrogen. By assuming that the only adsorbing element in the sample is the carbon nanotube and no adsorption occurs in the metal catalyst, a storage capacity of 5 wt% was established for carbon nanotubes. This is a classical error on the determination of the storage capacity of hydrogen, as it is the entire sample that should be taken into account. A similar reasoning has been done on nanotube rich samples containing TiAl0.1V0.04 [112,113], where the sample stored 6.5 wt% and by separating the catalyst and the carbon, the SWNT seemed to store 7.2 wt% !! More impressively, in a sample storing 6.1*10-3 wt% of hydrogen and containing around 1700 times more metal substrate than carbon nanotubes, it is said that the carbon nanotube stores at least 8.5 wt % [114].
5.3.1 Alkali-doped nanotubes
Measurement have been done on Li and K alkali doped carbon nanotubes. As for graphite, these measurements are extremely sensitive to moisture [88,89]. It drastically increased the weight gain by reactions of, or adsorption on, the alkali species due to the formation of alkali hydroxide or hydrates. However in dry hydrogen it appears that alkali-doped carbon nanotubes, single or multi-walled can still adsorb nearly 2 wt% hydrogen.
5.3.2 Purification by chemical and/or heat treatment
After a purification process on some bundles of nanotubes and peapods, measurements of hydrogen desorption through temperature programmed desorption before and after some NaOH pre-treatment revealed that this treatment was crucial for hydrogen storage [115]. In well-purified single walled carbon nanotubes this pre-treatment revealed to clean the inter-tube sites, which were the most favourable adsorption site in these materials. Similarly, large amounts of high purity SWNTs so-called HiPco SWNTs can be obtained commercially. The HiPco process is based upon the decomposition of Fe(CO)5 in continuously flowing CO at high pressure and elevated temperature. It was observed [116] that this oxidative treatment employed to remove the fullerene caps must be followed by an annealing procedure in order to remove the dangling functional groups at the entry ports to stabilize the carbon network.
A purification process [117] using altering steps of acid treatment and thermal oxidation in air of SWNTs from the products formed during the evaporation of the YNi2- or 3CO/Ni- graphite electrodes allowed to obtain open-ended nanotubes with a purity greater than 75 wt% compared to an initial soot with 10 wt% of nanotubes. At temperatures of -196°C with the highest pressure of 25 bars, hydrogen storage measurements showed a storage capacity of 2.4 wt% sensitive to the pressure, with the storage capacity decreasing with increasing temperatures to -130°C and reaching 0.2 to 0.4 wt% around room temperature and similar pressure, but appeared to be insensitive to pressure, meaning a saturation of hydrogen. Thermal desorption studies revealed the presence of weakly bonded physisorbed hydrogen (90%) and chemically bonded hydrogen (10%), and the latter was released at 470°C as a result of the breaking of the covalent C-H bonds. The work also shows that the SWNTs with larger diameter of 1.4 nm have greater storage capacities than SWNTs with a diameter of 1.2 nm and some [118] have shown that the storage capacity increases with the tube diameter and depends on the helicity of the SWNT. Another work [119] revealed that around 78 % of the hydrogen stored could be desorbed and the remaining 22 % was chemisorbed and required additional heating for release.
A study showed that the activation of the SWNT samples by mild oxidation in CO2, followed by a heat treatment in an inert atmosphere increases the hydrogen storage capacity of the SWNT sample by
Chapter II Literature review on hydrogen storage and on the carbons used for hydrogen adsorption
62
about a factor of 3 at 48 bars and 25°C, reaching 1.2 wt% [120]. Similarly, some chemical and chemical and heat treatment effects were studied on the storage capacities on single walled carbon nanotubes [121] at low pressure and a temperature of –196°C. It was shown that a selective oxidation at 350°C for 30 to 45 min in flowing air added to a chemical treatment with a reflux of HCl at 120°C for 6 hours was effective in increasing the storage capacity from 0.52 wt% up to 1.1 wt%. With a stronger vacuum anneal at 1000°C for 20 hours instead of 250°C for 12 hours prior to the adsorption measurements, the storage capacity would increase to 2 wt%, with an increase in the surface area up to 420 m2/g. Nevertheless, the storage capacity was even more increased with a chemical treatment in HNO3 that appeared even more aggressive than HCl and allowed to increase the storage capacity up to 6.4 wt%. The increase of the hydrogen storage capacity was not understood, and beyond the extremely high values, it appears that a selective oxidation and a reflux in 2.6 M HNO3 with a vacuum anneal at 1000°C for 20 hours was the most efficient chemical and heat treatment for an impressive increase in the storage capacity of the treated material. The vacuum treatment allowed to ‘heal’ the structural order of the nanotubes after the chemical treatment that seriously damaged these same nanotubes.
Upon removal of the catalyst particles thanks to a nitric acid attack at 160°C for 12 hours the storage capacity of an as received SWNT sample storing 0.2 wt% increased to 0.4 wt% at 27°C and 145 bars [122], indicating that the tube opening and catalyst particles removal is required. The surface was further cleaned with a mixture of HNO3 and H2O2 and the storage capacity increased again to 1.2 wt%. This treatment enabled to remove any carbonaceous material that blocked the tube entry to hydrogen. The same attack was performed on carbon nanofibres but the structure appeared too damaged resulting in a low storage capacity as no ‘healing’ was performed.
5.3.3 The sonication of nanotubes
A method of opening the tubes is to sonicate the nanotube for several hours in an acid bath. The sonication [123] was performed on 10 mg of carbon that was suspended in a solution of 100 mL of 5M HNO3. This suspension was sonicated with a TiAl6V4 probe with corresponding times between 1 and 24 hours with a power of 50 W/cm2. The samples were then analysed through electron microscopy, X-Ray diffraction, Raman spectroscopy and thermal desorption spectroscopy. It appeared that the increase of hydrogen storage in the sonicated material was due to the increase of the presence of titanium particles in the material. The total weight percent of hydrogen stored in the material was entirely due to the presence of the particles in the carbon [87].
Sonication was also performed [124] in some rope structured single walled nanotubes, and the isotherms show a sudden increase in hydrogen adsorption very similar to the isotherm of a metal hydrogen system which form a hydride phase. Unfortunately this increase was attributed to the carbon material, which lead to a high storage capacity of 8 wt%, whereas it should have been attributed to the metal particles that appeared during the sonication.
5.3.4 Multi Wall carbon nanotube
Two different types of multi wall carbon nanotubes (MWNT) have been synthesised, either with the seeded catalyst method (S_MWNT) or with the floating catalyst method (F_MWNT). The samples have been heat treated under an Argon atmosphere at various temperatures, varying from 1800°C up to 2200°C. The experimental results show that the F_MWNT have a better storage capacity than the S_MWNT and that heat treatment improves significantly the storage capacity of F_MWNT while it has little effect on the S_MWNT [125]. All the measurements have been made at 100 bars and room temperature, and the improvement for the F_MWNT goes from 1.3 wt% up to 4 wt% for a heat treated sample at 2200°C, whilst the storage capacity for the S_MWNT remained constant around 0.75 wt% whatever the heat treatment temperature. Beyond the fact that the hydrogen storage capacities measured seem extremely high and that no explanations are given on the measuring technique, it appears that the structure and crystallinity of the MWNT have an important effect on the hydrogen storage capacity. A proper crystallinity with some discontinuous graphene sheets and gaps may be propitious for hydrogen spreading into the MWNT, and a stable structure would be helpful for hydrogen reacting with the walls of the MWNTs.

Chapter II Literature review on hydrogen storage and on the carbons used for hydrogen adsorption
63
MWNTs samples produced using the floating catalyst method revealed significant storage capacities after purification and heat treatment at 1000°C under an argon atmosphere, with a storage capacity of 6.5 wt% at 148 bars and at room temperature, with an outer diameter of 5.1 nm [126]. The purified sample revealed to have an increased pore and more precisely micropore volume due to the removal of the tips of the tubes during the purification process, which provided additional access for hydrogen in the tube. Similarly, during the purification process, the removal of oxygen-containing functional groups from the surface of the MWNTs liberated the carbon surface providing adsorption sites for hydrogen. This was confirmed [122] with various acid treatment with HNO3 and H2O2 and heat treatment in order to remove the catalyst particles, open the tube tips, align the tubes and finally increase the packing density.
Some measurements were done on a MWNT sample with temperatures varying from –150°C to 37°C and pressures up to 123 bars [127]. The sample stored around 0.4 wt% at -150°C and 0.12 wt% at 37°C, and it was observed that for the sample measured at 37°C about 31 % of the adsorbed amount could not be released by only dropping the pressure down to atmospheric pressure. This suggests that the hydrogen is not only physisorbed in the sample but that some chemisorbed hydrogen is also present in the sample. The low temperature regime favours physical adsorption whereas the higher temperature regime the chemical adsorption. Hence, an appropriate temperature, suggested between -113°C and -93°C, should be chosen in order to ease the physical adsorption that is more appropriate for hydrogen adsorption.
A comparative study of hydrogen adsorption on superactivated carbon materials and multi-walled carbon nanotubes in the temperature range of -40°C to 25°C at pressures up to 110 bars revealed that the same shape of isotherms were observed suspecting a similar adsorption mechanism [79]. However, the amount of hydrogen adsorbed on MWNT appeared to be 3 to 5 times less than on activated carbon but the surface concentration on MWNT is 4 to 6 times higher than on activated carbon. The study also showed that the effect of temperature is much weaker on MWNT than on activated carbon and that the difference between the two samples decreased with increasing temperature, meaning that MWNT are more efficient at high temperature than activated carbons. Nevertheless, the article concluded that considering the much less quantity adsorbed, the much less heat of adsorption and the much smaller surface area, multi-walled carbon nanotubes seem not to be promising for hydrogen adsorption.
5.3.5 Electrochemical storage of hydrogen in carbon nanotubes
Even though the previous results presented are not always comparable because various techniques have been used to measure the adsorption capacity of the various samples, a separate paragraph is required for the measurements done with an electrochemical process. Indeed, a nanotube sample showing 0.01 wt% using a gas phase measurement technique, revealed to store 0.4 wt% using the electrochemical discharge process [70]. For samples purified with up to 80 % of nanotubes, the storage capacity revealed to be 2.9 wt % [72], most probably due to the fact that the opening of the nanotubes facilitate adsorption of hydrogen electrochemically.
Electrochemical storage measurements confirm the fact that partially aligned carbon nanotubes show higher hydrogen storage capacities than the random samples [128]. It was also found that the metal-doped carbon nanotubes [129] showed higher storage capacities than the undoped due to the hydrogen spillover to the carbon nanotube, and that the surface treatment, especially heat treatment, had significant effect on the electrochemical storage of hydrogen [130].
The enhancement of the reversible storage capacity through the electrochemical process can be interpreted by the electrolytic formation of nascent hydrogen, which is easily dispersed in the solution as well as in the form of adatoms, that easily penetrate in the carbon nanostructure, rather than being trapped by the surface functional groups. The electrochemical process of insertion of hydrogen can be repeated showing a reversibility without a significant loss during cycling. Further studies need to be performed in order to study more deeply the mechanism of the charge-discharge process, the cycle life as well as the evaluation of hydrogen diffusion in the carbon nanotubes.
Electrochemical storage of hydrogen also shows controversies. The majority of the literature shows
Chapter II Literature review on hydrogen storage and on the carbons used for hydrogen adsorption
64
the interest of hydrogen storage in carbon nanotubes measured electrochemically, might they be single or multi-walled. Low storage capacities have been found [131] (<0.5 wt%) for SWNT samples that do not enhance the gas phase measurements, while high storage capacities have been electrochemically found for activated carbons of 2 wt% and only 0.4 wt% at 0°C and 70 bars for the same material, which are less expensive and more readily available.
The following type of carbon material studied are fullerenes that will also be presented. These material absorb hydrogen chemically and are hence more limited in the storage of hydrogen than the previous samples.
55..44 TThhee cchheemmiiccaall aaddssoorrppttiioonn ooff hhyyddrrooggeenn iinn ffuulllleerreenneess
In the case of fullerenes the hydrogen storage is not done through adsorption but rather through hydrogenation, assimilated to chemisorption rather than physisorption. In Figure II-22, a6 represents a chemical double bond between two pentagons as explained earlier, and what chemically happens for hydrogen storage is that every double bond is replaced by a single bond and an atom of hydrogen. In this case, with hydrogenation and dehydrogenation for the desorption, the fullerenes could be classified as hydrides, as their structure is broken in order to absorb some hydrogen for storage and is then released and its structure retrieved.
Assuming that every double bond can be broken in order for a hydrogen to be stored, the theoretical maximum storage for C60 would be C60H60, one hydrogen for every double bond. Taking into account that the weight of hydrogen is 1 and the weight of carbon 12, the theoretical maximum for C60H60 is
wt%7.7100MM
MwtMaxCH
H % =⋅+
=
if suitable pressure and temperature is applied.
The rate of hydrogen release from a fullerene hydride can be represented by an Arrhenius form of equation:
( )kT
EC
CARate −= exp.max
where E is the activation energy. Both reactions of dehydrogenation and hydrogenation are thermally activated processes requiring heat. In order to increase hydrogenation and the amount of hydrogen stored, it is therefore necessary to heat the fullerene [132].
Fullerenes such as C60 can absorb large amount of hydrogen and previous experimental results showed that more than 6 wt% of hydrogen can be absorbed by fullerenes at 180°C under 23 to 27 bars, corresponding to C60H48. The greater the temperature the greater the amount of hydrogen stored, and at 200°C, 6 wt% hydrogen is obtained. Considering that the maximum will be reached for 7.7 wt% and that the temperature is already quite high, fullerenes on its own might not be interesting for storing the large amount of hydrogen required for applications such as a fuel cell.
The hydrogenation process of fullerenes involves the formation of a C-H bond and a H-H bond as a result of the breakage of a C=C bond from the fullerene. Although the hydrogenation reaction is exothermic, additional energy is required to break the bonds. In addition to the thermodynamic barrier of the reaction an energy barrier has to be overcome.

Chapter II Literature review on hydrogen storage and on the carbons used for hydrogen adsorption
65
Figure II-40 Activation energy of C60Hx⇔C60 transformation [133]
The figure above shows the conceptual model for hydrogenation and dehydrogenation for fullerenes. The activation energy for dehydrogenation (160 kJ.mol-1) is 60 kJ.mol-1 greater than the activation energy for hydrogenation. In the dehydrogenation reaction the C-H bond breaks and there is the creation of a C=C double bond and a H-H hydrogen bond. Reversibly for hydrogenation, a C=C double bond is broken at the same time as a hydrogen bond in order to form a C-H bond.
In order to decrease the temperature of reaction of dehydrogenation and hydrogenation some novel approaches have been realised such as using liquid catalysts, molten salts, changing electronic structure, doping fullerenes or structural fragmentation. The structural fragmentation is interesting as it is often generalised for all the nanostructured carbon materials. It has been observed that thanks to oxygen and CO2 treatment of the fullerene, a dramatic increase in surface area was observed from about 4 m².g-1 to almost 3000 m².g-1 while maintaining a narrow pore size distribution, between 2 and 20 Angstrom [133].
The oxygen and CO2 treated fullerene have the highest hydrogen storage capacity compared to the oxygen-treated fullerene or the non treated fullerene. Thanks to the oxygen and CO2 activation on these materials the amount of hydrogen stored in the material has increased from 0.08 wt% up to 0.61 wt% for a temperature of 27°C and a pressure around 69 bars. This activation process is very interesting for opening the nanotubes and any kind of nanostructured carbon, in order to make the closed porosity accessible to the hydrogen molecules.
0 .
Hydrogen storage techniques are currently available with the compression or liquefaction of hydrogen. With the new conformable tanks and the new available materials, it is now possible to store large amounts of hydrogen at high pressure in light weight and mechanical resistant tanks. Liquefied hydrogen is also possible thanks to new possible insulating materials and adapted tanks to liquid hydrogen. Even though the costs are still high, the availability of these tanks and these hydrogen storage technologies makes the development of fuel cells for automotive applications possible. This is presently visible with the public appearance of fuel cell vehicles or buses that are in progress in prototypes or in development and testing in European and international projects, such as the CUTE project [134].
Concerning the feasibility of storing hydrogen in carbon adsorbents, the discussion is still open, and the thematic widely studied. This is reflected by a constant increasing number of articles that are published, either submitted to journals or during international conferences, a certain number of review articles on the subject [135,136,137,138,139,140] and some journals have also already published special issues [141,142]. Many experimental results have been shown on the various types of carbons

Chapter II Literature review on hydrogen storage and on the carbons used for hydrogen adsorption
66
that have been tested either as produced or modulated using various chemical or heat treatment techniques.
There is a lot in stake on the hydrogen economy, and the results on hydrogen storage have been subject to extensive – and intensive – comments and arguments, either through the literature or during international conferences, where the view point of the industrial community is not always in agreement with the scientific community. Initially, a goal of 6.5 wt% has been set for hydrogen storage around the year 1996, starting date for extensive experimental results on various types of carbons.
0
2
4
6
8
10
12
14
16
18
20
1965 1970 1975 1980 1985 1990 1995 2000 2005
Year published
Wei
ght p
erce
nt h
ydro
gen
(wt%
) Nanofiber
Carbon black
Nanotube
Graphite
Figure II-41 The time evolution of the experimental results on the various forms of carbons
The figure above shows the experimental results taken from the literature. A selection of around 30 articles has been done, except for the extremely high results that have been presented in order to show the tremendous discrepancies observed. The results do not separate whether the material has been heat treated, chemically treated, ball-milled, intercalated, exfoliated, neither as a function of the catalyst used nor as the experimental technique used for producing or testing the material. It is a basket of all the experimental results from various works performed.
One can observe that apart from a few high results, the weight percent stored is less than 2 wt%, and after the high experimental results presented in 1999, the general tendency is for a decrease in the storage capacity. Is this due to the improvement of the material, an increase in the knowledge of the hydrogen storage phenomenon or a simple tendency of the scientific community that realised that measuring the hydrogen storage capacity of a carbon material is not a simple task and that much care and caution should be taken when performing some experimental measurements in this area ?
In order to observe a closer look to the evolution of the experimental results over the past few years, a zoom of the above figure has been done for the years between 1995 and today on the x-axis and a weight percent of hydrogen up to 2 wt%.

Chapter II Literature review on hydrogen storage and on the carbons used for hydrogen adsorption
67
0,0
0,2
0,4
0,6
0,8
1,0
1,2
1,4
1,6
1,8
2,0
1995 1996 1997 1998 1999 2000 2001 2002 2003 2004 2005
Year published
Wei
ght p
erce
nt h
ydro
gen
(wt%
)
Nanofiber
Carbon black
Nanotube
Graphite
Figure II-42 A zoom of the previous figure for weight percents up to 2 wt% and for the last decade
In Figure II-41 it appeared as the experimental results were below 2 wt%, and with a closer look, the results show a large scatter, but a stronger concentration of results lower than 1 wt% is seen, independently of the material tested. One can see that the circles, representing the nanotube type samples, are being intensively tested, followed by nanofibres and finally the carbon black, in which the results on activated carbons are included.
It seems as though the carbon blacks have been neglected for several years, and that they still appear to have competing results with respect to the other types of carbon tested. The performance of the various nanostructured materials are well below the expectations and the goal for an automotive application.
Instead of plotting the weight percent as a function of the published year, the same results of the same articles have been used and plotted as a function of temperature and / or pressure in the two figures below.
0
2
4
6
8
10
12
14
16
18
20
-273 -223 -173 -123 -73 -23 27 77 127 177 227
Temperature (°C)
Wei
ght p
erce
nt (w
t%)
NanofiberNanotubeCarbon blackGraphite
0
2
4
6
8
10
12
14
16
18
20
0 20 40 60 80 100 120 140 160 180 200
Pressure (bars)
Wei
ght p
erce
nt (w
t %)
Nanofibers
Nanotubes
Carbon Black
Graphite
Figure II-43 Same experimental results as previously but as a function of the temperature and pressure
The most important amount of results have been measured at room temperature with basically all the possible results varying from 0.01 wt% up to more than 14 wt%. A few results have been obtained at higher temperatures, but these are mostly measurements that have been done using temperature programmed desorption spectroscopy. Concerning the lower temperature, experimental results have been in the entire temperature range, except for the low temperature of liquid nitrogen where a greater amount of study has been done. The increasing amount of results at room temperature is most certainly due to the perspectives of using the storage system in reasonable conditions of temperature, in order to ease the feasibility of a technical application.
The pressure range observed for the experimental results, caries from below atmospheric pressure up to a pressure close to 200 bars. The greatest amount of measurements have nevertheless been done
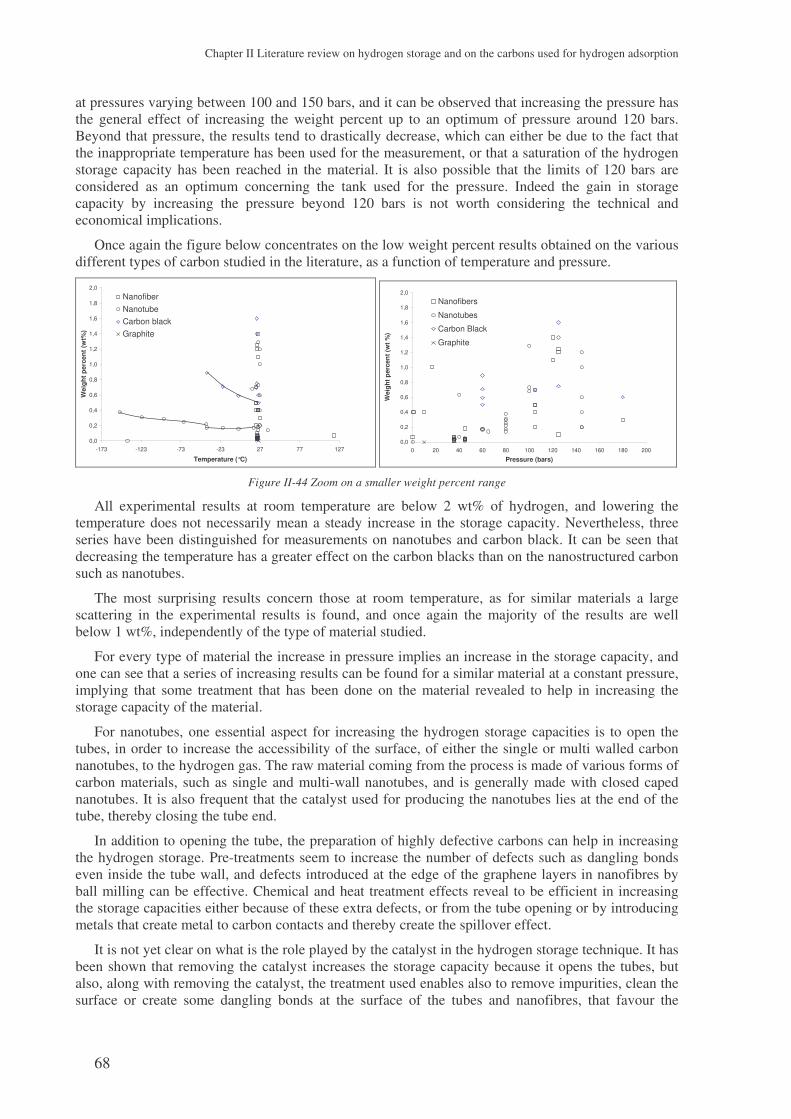
Chapter II Literature review on hydrogen storage and on the carbons used for hydrogen adsorption
68
at pressures varying between 100 and 150 bars, and it can be observed that increasing the pressure has the general effect of increasing the weight percent up to an optimum of pressure around 120 bars. Beyond that pressure, the results tend to drastically decrease, which can either be due to the fact that the inappropriate temperature has been used for the measurement, or that a saturation of the hydrogen storage capacity has been reached in the material. It is also possible that the limits of 120 bars are considered as an optimum concerning the tank used for the pressure. Indeed the gain in storage capacity by increasing the pressure beyond 120 bars is not worth considering the technical and economical implications.
Once again the figure below concentrates on the low weight percent results obtained on the various different types of carbon studied in the literature, as a function of temperature and pressure.
0,0
0,2
0,4
0,6
0,8
1,0
1,2
1,4
1,6
1,8
2,0
-173 -123 -73 -23 27 77 127
Temperature (°C)
Wei
ght p
erce
nt (w
t%)
NanofiberNanotubeCarbon blackGraphite
0,0
0,2
0,4
0,6
0,8
1,0
1,2
1,4
1,6
1,8
2,0
0 20 40 60 80 100 120 140 160 180 200
Pressure (bars)
Wei
ght p
erce
nt (w
t %)
Nanofibers
Nanotubes
Carbon Black
Graphite
Figure II-44 Zoom on a smaller weight percent range
All experimental results at room temperature are below 2 wt% of hydrogen, and lowering the temperature does not necessarily mean a steady increase in the storage capacity. Nevertheless, three series have been distinguished for measurements on nanotubes and carbon black. It can be seen that decreasing the temperature has a greater effect on the carbon blacks than on the nanostructured carbon such as nanotubes.
The most surprising results concern those at room temperature, as for similar materials a large scattering in the experimental results is found, and once again the majority of the results are well below 1 wt%, independently of the type of material studied.
For every type of material the increase in pressure implies an increase in the storage capacity, and one can see that a series of increasing results can be found for a similar material at a constant pressure, implying that some treatment that has been done on the material revealed to help in increasing the storage capacity of the material.
For nanotubes, one essential aspect for increasing the hydrogen storage capacities is to open the tubes, in order to increase the accessibility of the surface, of either the single or multi walled carbon nanotubes, to the hydrogen gas. The raw material coming from the process is made of various forms of carbon materials, such as single and multi-wall nanotubes, and is generally made with closed caped nanotubes. It is also frequent that the catalyst used for producing the nanotubes lies at the end of the tube, thereby closing the tube end.
In addition to opening the tube, the preparation of highly defective carbons can help in increasing the hydrogen storage. Pre-treatments seem to increase the number of defects such as dangling bonds even inside the tube wall, and defects introduced at the edge of the graphene layers in nanofibres by ball milling can be effective. Chemical and heat treatment effects reveal to be efficient in increasing the storage capacities either because of these extra defects, or from the tube opening or by introducing metals that create metal to carbon contacts and thereby create the spillover effect.
It is not yet clear on what is the role played by the catalyst in the hydrogen storage technique. It has been shown that removing the catalyst increases the storage capacity because it opens the tubes, but also, along with removing the catalyst, the treatment used enables also to remove impurities, clean the surface or create some dangling bonds at the surface of the tubes and nanofibres, that favour the

Chapter II Literature review on hydrogen storage and on the carbons used for hydrogen adsorption
69
storage of hydrogen. It is actually difficult to only remove the catalyst without affecting the entire structure of the material. The catalyst can also play the role of a charge transfer – or spillover – element, from the hydrogen molecule to the surface of the carbon. This has been observed with Ni0.4Mg0.6O during which the hydrogen dissociatively adsorbs onto active surface sites on the oxide and then migrates both to the interior of the catalyst and onto the graphite planes of the MWNT. Upon heating, the hydrogen recombines and desorbs directly from the lower energy sites on the carbon surface. While some people tend to dope their material with metals in order to increase the storage capacity using a charge transfer phenomenon, others try to purify to its maximum the raw material, in order to obtain the cleanest material possible. This charge transfer effect is only observed with specific metals and optimised metal to carbon contact thanks to an appropriate pre-treatment and heat treatment.
It could also be possible that the multi-walled carbon nanotubes have both the advantages of the carbon nanotubes with the interstitial and internal sites, and the nanofibres advantage with the possibility to optimise the interlayer distance between the subsequent nanotubes layers in the MWNT. In addition to this, with the use of the optimised metal treatment it is possible to enhance the spillover effect in these materials. In this case the three hydrogen uptakes are possible : physisorption, chemisorption and metal assisted uptake.
Hydrogen can be either physisorbed or chemisorbed. This has essentially been observed during temperature programmed desorption, or by a small hysteresis observed during room temperature measurements where some residual hydrogen was present in the carbon and extra heating was required to release it.
The comparisons between the activated carbons and the nanostructured carbons show that the storage capacity of the activated carbon is greater than the nanostructured carbon. With the large differences that exist in the surface area of the carbon materials, higher surface concentrations occur on nanostructured carbon than on activated carbons. This shows that the surface area is not the only parameter that is required for important storage capacities and that other elements play an important role such as the surface polarity or the pore size and total pore volume.
It has been frequently proposed that the weight percent of hydrogen stored be proportional to the BET surface area measured through nitrogen adsorption. A correlation has been found for electrochemical measurements at 25°C and for gas adsorption measurements at the liquid nitrogen temperature, where the correlation is of 1.5 wt% for a sample of 1000 m2/g. A correlation between the two supposes that the adsorption occurs through a monolayer of hydrogen molecules on the surface, which could be possible in the case of low temperature measurements, but considering the temperature of 25°C the adsorption is more probable to occur through a volume filling and multilayer adsorption, as thermal energy is available. Once again these results are controversed, as this relation is not always verified for all measurements on the various carbon samples tested.
An important issue on these nanostructured carbon materials used for hydrogen storage is the cost that is a major hindrance in their use for such applications [143]. These extreme costs are due to the fact that these materials are not yet produced in an industrial continuous process and a mass production of the carbon is not yet possible. As it has been observed, a post treatment is required in order to obtain interesting hydrogen storage capacities, increasing once again the total cost of the final material used for hydrogen storage.
A major concern in hydrogen storage is the establishment of some regulations by the ‘scientific community’. It has been seen in this literature review that the experimental results are extremely scattered and controversial for various reasons. Problems might come from the experimental set-up and leaks, from the material and the amount of material tested (or the ratio of the volume taken by the material compared to the volume of the sample holder) and finally from the calculations that transform the experimental data into the amount of hydrogen stored by an adsorbent.
International regulations on the storage capacity measurements could be established, that could for example require two different materials with well known storage capacities to be tested for a specific calibration, that a minimal mass of material is tested or a minimal ratio of the solid volume to the sample holder volume, at two different temperatures and pressures. The experimental results should

Chapter II Literature review on hydrogen storage and on the carbons used for hydrogen adsorption
70
also be presented with the error margin, and the outgassing clearly presented. The regulations would initially bring a certain number of constraints, but would at the end enable to compare the experimental results of the various laboratories that have been subjected to a specific regulation.
Even though no regulations has been established, the most recent articles appear to be more demanding than previously concerning the validity of their measurements, with much more frequent calibration measurements using metal hydrides, and leak tests or reproducibility measurements. Measurements with the empty sample cylinder are also more frequently presented in order to show the effect of the carbon in the experimental set-up. This can be done for example with the increase in the volume of hydrogen desorbed as compared to an empty cylinder, or the stronger pressure decrease in the volumetric experiments due to hydrogen adsorption by the carbon, or the shorter pressure equilibrium times. In certain cases, the entire calculations for the determination of the hydrogen storage capacities are shown. This is most certainly a consequence of the discrepancies shown in the experimental results and the lack of information on the calculations used.

Chapter II Literature review on hydrogen storage and on the carbons used for hydrogen adsorption
71

Chapter III Characterisation of hydrogen storage thanks to a volumetric method – experimental test bench developed
72
III CHARACTERISATION OF HYDROGEN STORAGE THANKS TO A VOLUMETRIC METHOD – EXPERIMENTAL
TEST BENCH DEVELOPED
The experimental test bench set-up and used at the Centre for Energy studies will be
presented. Explanations will be given on the choices made for the test bench on its limitations and dimensioning. The experimental errors and calibrations made for the proper, use of the
set-up will be presented to clearly explain what is being measured, why it has been measured in such a way and the cautions implied by such an experimental set-up.

Chapter III Characterisation of hydrogen storage thanks to a volumetric method – experimental test bench developed
73
1 Introduction ...................................................................................................................74
2 Presentation of the experimental set-up ......................................................................75
2.1 Presentation and instrumentation of the test bench ...................................................... 75 2.1.1 Presentation of the set-up ..................................................................................................... 75 2.1.2 Acquisition unit .................................................................................................................... 77
2.2 Measuring range ........................................................................................................... 78
2.3 Advantages of such a process....................................................................................... 79
3 Calculating the weight percent stored and the errors generated..............................81
3.1 The volumetric method................................................................................................. 81
3.2 Desorbing the empty pressure vessel............................................................................ 82 3.2.1 The determination of the equation for the empty pressure vessel......................................... 82 3.2.2 Calculating the volume of the pressure vessel...................................................................... 82
3.3 The gravimetric percentage – a comparison to pure compression................................ 84
3.4 Calculating the intrinsic gravimetric percentage of our materials ................................ 86 3.4.1 Configuration of the carbon in the vessel ............................................................................. 86 3.4.2 Defining the intrinsic weight percent ................................................................................... 87
3.5 Calculation of the errors ............................................................................................... 88 3.5.1 Wt% calculated compared to compression........................................................................... 88 3.5.2 The intrinsic weight percent ................................................................................................. 89
3.6 The limits of the test bench........................................................................................... 89
4 Experimental protocol and calibration of the experimental set-up..........................91
4.1 Experimental protocol .................................................................................................. 91 4.1.1 The outgassing of the sample ............................................................................................... 91 4.1.2 The pressurisation of the pressure vessel.............................................................................. 92 4.1.3 The desorption process ......................................................................................................... 93
4.2 Calibration of the measuring device............................................................................. 94 4.2.1 Leak proof tests .................................................................................................................... 94 4.2.2 Reproducibility of an empty measurement........................................................................... 95
4.3 Calibration with a non adsorbing material.................................................................... 96 4.3.1 Experimental protocol .......................................................................................................... 96 4.3.2 Measurements and errors...................................................................................................... 97 4.3.3 Conclusions on this measurement ........................................................................................ 98
4.4 Calibration with a metal hydride .................................................................................. 99
4.5 Testing our materials in a different laboratory ........................................................... 100
5 Conclusion ....................................................................................................................100

Chapter III Characterisation of hydrogen storage thanks to a volumetric method – experimental test bench developed
74
,
We have previously shown the importance of the measuring techniques on the determination of the hydrogen storage capacity of certain materials, as well as the importance of the protocol used for the measurements and the experimental calibration. The experimental calibration includes the calculation of the experimental errors generated during the experiment and the calculation of the hydrogen storage capacities of the material. The calibration has also to take into account the dimensioning of our experimental set-up and the choices made, such as the measurement of the volume of hydrogen desorbed from the carbon and the pressure vessel and all the difficulties that these choices may involve.
The choice of measuring the volume of hydrogen desorbed is based on the idea of an industrial application where the interesting volume of hydrogen is the hydrogen that can be recollected from the hydrogen filled reservoir. Initially, the reservoir is filled with compressed hydrogen at a specific pressure and the experimental set-up has been designed in order to measure the efficiency of the carbon adsorbent to deliver an extra amount of hydrogen. By doing this, the system is ‘operational’ in the sense that it is closely related to a real automobile application.
All these elements concerning the specific experimental set-up that has been built and the literature review on the difficulties on measuring the hydrogen storage capacity of carbon adsorbents will be taken into consideration in this chapter. All the calculations from transforming the experimental data from the experimental set-up into a value of the mass of hydrogen stored per unit mass of carbon adsorbent will be presented, as well as the calculations used to determine the experimental errors involved in such an experiment.

Chapter III Characterisation of hydrogen storage thanks to a volumetric method – experimental test bench developed
75
12
Various techniques are currently available for measuring the amount of hydrogen stored in a carbon material, and the most used ones have already been presented previously. The experimental set-up established at the Centre for Energy Studies is based on the principle of measuring the amount of hydrogen released from a pressure vessel, might it be filled with a material or empty. It is a direct measurement of the volume of hydrogen released from the pressure vessel.
22..11 PPrreesseennttaattiioonn aanndd iinnssttrruummeennttaattiioonn ooff tthhee tteesstt bbeenncchh
The final design of the set-up is presented, as well as its instrumentation and the safety elements installed in case of emergency. It should be noted that even if the concept remained the same during the entire project, the experimental set-up evolved in the equipment.
2.1.1 Presentation of the set-up
The experimental set-up has been designed as simply as possible. It essentially consists of a pressure vessel, surrounded by three units: the first unit consists of a bottle of hydrogen compressed at 200 bars, the second unit is the vacuum system that allows the outgassing in the pressure vessel and in the materials tested and finally the measuring unit with a gas flow meter that measures the volume of hydrogen released from the pressure vessel. These three elements are represented in the illustration below.
T0
P 1
Heat ing / Cooling liquid
Pressure vessel
T1
Heat ing / Cooling liquid
B ed of carbon nanoparticles
Q
Hydrogen
(0-200 bars)
P 0
Gas flow meter
Vacuum
P 1
T2 Drain
Drain
Filter
Outside
T0
P 1
Heat ing / Cooling liquid
Pressure vessel
T1
Heat ing / Cooling liquid
B ed of carbon nanoparticles
Q
HydrogenHydrogen
(0-200 bars)
P 0
Gas flow meter
Vacuum
P 1
T2 Drain
Drain
Filter
Outside
Figure III-1 Illustration of the experimental set-up for testing hydrogen storage
The entire structure of the test bench is rigid. The valves and tubes are fixed to the wall on a panel, the pressure vessel is fixed to a structured body in steel, itself fixed to a table fixed to the wall. This was done in order to eliminate any micro-leaks that could occur during the handling of the system, and the vibrations that would alter the measuring system of the gas flow meter, which is a very sensitive apparatus.

Chapter III Characterisation of hydrogen storage thanks to a volumetric method – experimental test bench developed
76
In addition to the schematic representation, a photography of the set-up has been taken:
Figure III-2 Photography of the experimental set-up
Two drains are available on the test bench. The two drain valves, the entrance and the exit valves, are ball valves [144] with a working temperature range of 10°C to 65°C and resist to pressures up to 206 bars. One of the drain valves is directly connected to the pressure vessel with a manometer and has been installed in case of emergency. If the tubes are obstructed by carbon particles and that it is not possible to depressurise the pressure vessel through the exit valves an emergency exit valve is present. Furthermore, the manometer installed can confirm the pressure given by the pressure transducer and hence a difference in pressure between the two reveals a problem in the experimental set-up. For security reasons, the pressure P1 in the pressure vessel is given at two different points.
The initial pressure transducer measuring P1 was a KellerTM model PA21-200 with a measuring range from Patm to 200 bars [145], and an accuracy of ± 0.5 % or ± 1 bar. In order to increase the precision of the measurement the pressure transducer has been replaced by the model PA31-100. This pressure transducer has a precision of ± 0.05% hence ± 0.05 bar and a measuring range from Patm to 100 bars. The pressure transducer measures the relative pressure, which is the pressure above the atmospheric pressure, and has been calibrated for an average atmospheric pressure of 1.013 bar.
To protect the entrance and the exit valves and the pressure transducer, a filter has been placed to capture the carbon particles that are extremely volatile and that could be tempted to flow out with the hydrogen and the pressure difference during desorption. Also directly connected to the pressure vessel a high pressure relief valve [144] that releases the pressure inside the pressure vessel when this one has reached a set pressure. This is for security and is installed in case of overpressure in the set-up. The temperature T1 is also measured on the pressure vessel, and the sensor is plunged in the carbon material. This probe is also connected to the cooling and heating device. All the temperature probes in the experimental set-up are platinum wired probes model Pt 100, three connections. They have a temperature range from -50°C to +200°C, with a precision of ± 0.5°C.
As seen on the diagram, the pressure vessel has a double envelope in which a fluid circulates to temperate the pressure vessel. The temperature in the pressure vessel is controlled by a refrigerating and heating circulator, model FP50-HD made by JulaboTM [146], named cryostat during the rest of the text. This device can heat and cool a fluid from -50°C up to 200°C and is used during the degassing of the samples and during the experiments to keep a constant temperature in the vessel. It has a temperature stability of ± 0.01°C.

Chapter III Characterisation of hydrogen storage thanks to a volumetric method – experimental test bench developed
77
The gas flow meter (RitterTM) measures the volume of hydrogen released from the pressure vessel. It actually works upon the principle of positive displacement. The sample gas stream rotates a measuring drum with a packing fluid, usually water. Coupled to the rotating drum, a needle-dial and counting mechanism records the volume of gas flow as it sequentially fills and empties from the drum’s rigid, fixed volume measuring chambers.
The gas flow meter measures the actual volume of gas flow. If the gas flow pressure and/or temperature vary from normal conditions (1013.15 mbars and 0°C) the actual volume is not the normal volume. In order to calculate the number of moles, a pressure transducer (P0) has been placed, as well as a temperature probe (T0). The measuring range in the case of our experimental set-up is a flow rate varying from 1 L/hr to 60 L/hr, with a measuring drum capacity of 0.5 L, a maximum gas inlet pressure of 50 mbar, and a minimum differential pressure of 0.4 mbar. The reading precision is 2 mL and the accuracy is ± 0.1 % of the value measured. One litre of gas corresponds to 400.4 counts.
Prior to the gas flow meter, a gas flow rate meter has been placed in order to keep the gas flow rate constant during the desorption process. This flow rate is a BrooksTM Sho-Rate series 1350 [147]. It has a precision of ± 10% with a full scale rate of 50.8 normal litres per hour. The regulation valve has been placed upstream of the flow rate and is a high pressure metering valve [144]. In order to protect these valves, a filter has been placed just at the exit of the pressure vessel. There are actually no suitable filters for such small particles, but the particles agglomerate on the filter, creating a new filter with a smaller filtering size.
Finally, the vacuum pump is a primary pump type RV3 from Boc Edwards [148]. It has a maximum vacuum with closed ballast of 10-4 mbar and a vacuum rate of 3.7 m3.h-1 equipped with an explosion proof engine.
None of these units operate by themselves and the experimental set-up is not automated. During a measurement, an experimenter should be present in order to regulate the gas flow rate thanks to the precision valves installed, control the temperature and pressure in the vessel.
2.1.2 Acquisition unit
Several data are captured and other visualised on the computer during an experiment. The Data Acquisition/Switch Unit model 34970 A with a 16 channel multiplexer card is made by Agilent Technologies and the data is transferred to the computer thanks to a PCI GP-IB card. A small program using VEE Pro version 6.01 allows to acquire the data in an Excel sheet and to visualise certain data during the experiment.

Chapter III Characterisation of hydrogen storage thanks to a volumetric method – experimental test bench developed
78
The figure below is a capture of the screen during the outgassing phase of the experiment, and is illustrated in order to explain the various data that are recorded and visualised during the experiment.
T0
T2
T1
P1P0
VH2
Time elapsedDate of start
T0
T2
T1
P1P0
VH2
Time elapsedDate of start
Figure III-3 Example of the data acquisition on the computer
The temperature in the pressure vessel (T1), the temperature in the gas flow meter (T0) and the temperature in the tubing (T2) are constantly recorded in the data file used for the calculation of the gravimetric percentage of hydrogen stored. T2 is a control temperature of the gas, as the valves only support certain conditions of pressure and temperature and hence it is important to keep these conditions in the operating range of the valves.
The reservoir pressure is the pressure in the vessel (P1) and the volumeter pressure is the pressure measured in the gas flow meter (P0). Just as the temperature, the pressures are constantly recorded in the data file, and the data will be used for the calculation of the gravimetric percentage. Finally, the exit volume is measured. The data recorded is actually a number of impulsions given by the device, and 400.4 impulsions are required in order to get a volume of 1 litre.
The date of the beginning of the experiment can be seen as well as the time elapsed since the beginning of the experiment. Three graphs can also be seen, two of them showing the evolution of the pressure and temperature with time in the pressure vessel. This allows a control and is an excellent indication in case of leak or overpressure. The last graph on the left hand side of the screen capture shows the evolution of the volume of hydrogen released as a function of the pressure in the vessel, yet indicating that no gas is flowing through the gas flow meter and the extremely small fluctuations are due to the electrical signal.
All these data and graphs have been chosen in order to perform the measurements in the best possible conditions for the experiment and for the security of the experimenter.
22..22 MMeeaassuurriinngg rraannggee
The pressure vessel was designed for withstanding temperatures varying from liquid nitrogen temperature up to 400°C, and pressures up to 200 bars with a safety factor of 1.75. The initial volume of the pressure vessel was of 300 cm3, which has been reduced by half using a new cover containing a dead volume. As so, it was estimated that the initial measurements could be done on a small volume of 138 cm3 prior they be done in a volume of 300 cm3.

Chapter III Characterisation of hydrogen storage thanks to a volumetric method – experimental test bench developed
79
The actual temperature range that can be used in our test bench depends on the temperature of the tempering system. The fluid temperature of the cryostat varies from -50°C up to 200°C, and with the temperature losses between the exit of the fluid of the cryostat, the temperature of the fluid in the double envelope and the actual temperature in the pressure vessel, the temperature range in the pressure vessel varies from -40°C to 180°C. This temperature range could be increased by improving the isolation system of the experimental set-up. At the moment, only the tubes bringing the fluid to the double envelope of the pressure vessel have a proper thermal insulation, whereas great thermal losses occur from the sides and the cover of the pressure vessel. Currently the envelope and the lid of the pressure vessel are covered with rock wool, which is not extremely practical, but has the advantage of adding some insulation. A proper insulation system should be envisaged on the pressure vessel itself and on the tubing and valves from the experimental set-up.
Initially the pressure transducer installed had a measuring range from Patm to 200 bars in relative pressure. Following the first measurement we realised that the desorption curve did not change after 100 bars and it was decided to change the pressure transducer to a Patm to 100 bars in relative pressure for more accurate measurements. The increase in accuracy revealed to be essential, especially when it came to calibrating the experimental set-up with a metal hydride. The pressure transducer in the gas flow meter measures the pressure of the gas in the gas flow meter, which is the atmospheric pressure. The absolute pressure in the pressure vessel is therefore the sum of P0 and P1.
Considering the volume V of the pressure vessel and the material with a volume Vmaterial then,
vesselpressure VdmV
material
materialmaterial =
with the volume of material being as close as possible to the volume of the pressure vessel in order to maximise the volume ratio of the sample to the vessel and thereby to minimise the errors and the dead volume during the measurements. The greater the material density the greater the mass that can be tested and reversibly. The influence of the mass of material used for the testing on the experimental errors will be explained later in this chapter.
22..33 AAddvvaannttaaggeess ooff ssuucchh aa pprroocceessss
The main advantage of our experimental set-up resides in its dimensioning. As we are not limited by the amount of carbon we produce, it was decided to establish a test bench that was able to measure the hydrogen storage capacity of a large amount of material. The pressure vessel has a volume of 138 cm3, including the tubing, the valves, the filter etc. and the sample holder a volume of 68 cm3. This means that depending on the apparent density of the carbon material a large amount of carbon can be tested. Considering that the maximum theoretical density of our carbon materials corresponds to the density of graphite, which is equal to 2.26 g.cm-3, a theoretical maximum of 147 grams can be tested in the pressure vessel. If we consider a density of 0.01 g.cm-3, only 680 milligram of material can be tested, which is still higher that the amount of material used in the various techniques available for measuring hydrogen storage.
The figure below shows the mass of carbon that can be tested as a function of the carbon bulk density and the volume ratio. The latter is defined as the ratio of the volume taken by the carbon over the volume of the sample holder. The volume ratio is extremely important as it determines the dead volume in the vessel, which should be as small as possible. The volume ratio should be as close as possible to one, in order to maximise the sites available for hydrogen storage and the total number of moles of hydrogen that are stored in the carbon tested. This will reduce the experimental errors.

Chapter III Characterisation of hydrogen storage thanks to a volumetric method – experimental test bench developed
80
0
20
40
60
80
100
0,0 0,2 0,4 0,6 0,8 1,0 1,2 1,4 1,6 1,8 2,0Density (g.cm-3)
Mas
s of
car
bon
(g)
Volume ratio of 1Volume ratio of 0.8Volume ratio of 0.6Volume ratio of 0.4
0
20
40
60
80
100
0,0 0,5 1,0 1,5 2,0Carbon Density (g.cm-3)
Vol
ume
of c
arbo
n (c
m3 )
0,0
0,2
0,4
0,6
0,8
1,0
Vol
ume
ratio
(n.u
)
Volume of carbonVolume ratio
mass of carbon : 10 g
mass of carbon : 20 g
Figure III-4 Relationship between carbon mass, carbon density and volume ratio in the vessel
For a constant volume ratio, the greater the material density, the higher the amount of carbon that can be tested, and the lower the volume ratio the less amount of carbon that can be tested. Similarly at constant carbon mass, the greater the density the lower the volume ratio and reversibly. The lower the density of the carbon material, the less amount of carbon that can be tested but the greater the volume ratio. Hence, when the carbon density is high, it is important to test a greater amount of carbon than in the case of a low carbon density, and a high density material allows to test a large amount of material.
The compaction of the carbon powders allows to test a larger amount of material. By applying some pressure on these carbon powders, the apparent carbon density is increased which allows to test a larger amount of carbon. In addition to this, the carbon powders can have an extremely low density, making them extremely volatile. Their volatility is a major problem concerning the obstruction in the tubing and the leaking of the valves. Moreover, the powder form makes the handling of the powders difficult, and pelletising the powders has the advantage of increasing the amount of carbon tested by increasing the apparent density and protecting the tubing, the valves and the experimental set-up which could generate leaks in the system.
The experimental set-up was designed as simply as possible and separated by three parts: the vacuum system, the measuring device with the gas flow meter and the pressure vessel with the thermostatic device. The design was based on the choice of a semi-industrial process with the idea of measuring the excess hydrogen released by an adsorbent filled reservoir with respect to the hydrogen released by the empty reservoir. The experimental set-up measures the hydrogen released by the carbon filled reservoir, which is the useable hydrogen for an application. The design of the set-up and the decision made to measure the excess hydrogen has another major advantage. In case of a hydrogen leak in the pressure vessel, the hydrogen loss is an amount of hydrogen that will not be measured thanks to the gas flow meter, and hence the gravimetric percentage of hydrogen stored in the material tested is underestimated as less hydrogen really stored in the carbon is flowing in the gas flow meter. During a volumetric measurement, during the adsorption phase for example, in case of leak in the experimental set-up, the pressure in the vessel decreases and this pressure decrease is associated to the adsorption of hydrogen by the material tested, which is a frequent source of overestimation of the storage capacity of the material tested. The measurement of the useable hydrogen in our set-up is a simple expression of the importance of an adsorbent for the storage of hydrogen compared to a reservoir with compressed hydrogen.
In parallel to the idea of a reservoir, the choices of the temperature and pressure range were decided as a function of the application. Temperatures varying from -50°C to 200°C are temperatures that are not adapted for a fundamental and theoretical study of the adsorption of hydrogen, as the extremes in temperature should be increased. However a temperature range of -50°C to 100°C is feasible for the automobile industry, as the proton exchange membrane fuel cell works around 100°C. A temperature of -50°C appears to be a possible low temperature for the automobile application as it is sometimes considered as the extreme low temperature range for certain regions of the world, with a margin with respect to the outside temperature.

Chapter III Characterisation of hydrogen storage thanks to a volumetric method – experimental test bench developed
81
.$% $$
The carbon materials to be tested for hydrogen storage are mainly activated carbons, graphite nanofibres, carbon nanotubes and fullerenes. These materials exhibit interesting structural properties for hydrogen storage either for hydrogen adsorption (graphite nanofibres, activated carbon and nanotubes) or through hydrogenation (fullerenes). As found in the literature review, all these materials have storage capabilities which are not yet completely optimised, but are possible materials for hydrogen storage.
33..11 TThhee vvoolluummeettrriicc mmeetthhoodd
The volumetric technique is an indirect quantitative measurement method. Once the volume released has been measured, it must be transformed into a number of moles.
The hydrogen is released from a pressure vessel at a pressure P1 and a temperature T1. The hydrogen that is being measured in the gas flow meter has a temperature T0 and a pressure P0 and is subject to the compressibility factor Z(P0,T0). If V is the volume of hydrogen released and measured by the gas flow meter during an experiment, then the number of moles n corresponding to the volume V released is defined with the relation of ideal gases extended to non-ideal gases thanks to the compressibility factor:
( ) 000
0
..,.
TRTPZVPn= equation III-1
where n is the number of moles expressed in mol, P0 is the absolute pressure expressed in Pa, V is the volume of gas expressed in m3, R is the gas constant, T0 is the temperature of the gas expressed in K and Z(P0,T0) is the compressibility factor of the gas at the temperature T0 and the pressure P0 and has no units.
The compressibility factor depends upon two different parameters, the pressure and the temperature of the gas. Unfortunately only tabulated data are available for the compressibility factor as a function of the temperature and the pressure of the gas. It has been decided to keep the temperature constant and to determine an equation as a function of the pressure of the gas. Two situations have to be considered, the compressibility factor for the hydrogen either in the pressure vessel or in the gas flow meter.
Concerning the absolute pressure in the vessel, all the measurements of hydrogen storage will be done at a temperature of 25°C and the pressure will vary from atmospheric pressure up to 100 bars and taking the data for the compressibility factor [149], the equation is:
( ) 1.0001.P10*5.906.P10*1.326K P,298Z 427 ++= −− equation III-2
where P is the absolute pressure in the pressure vessel (P0+P1) expressed in bars.
Concerning the compressibility factor in the gas flow meter, the pressure is the atmospheric pressure and the temperature is the room temperature, which varies from 15°C up to 30°C. Taking into account all these factors the equation for the compressibility factor in the gas flow meter is :
( ) 1P0.00061T,PZ 000 +⋅= equation III-3
where P0 is the atmospheric pressure in the gas flow meter expressed in bar. Thanks to the two equations above it is possible to calculate the number of moles of hydrogen using the ideal gas law extended to non-ideal gases.
The number of moles released and calculated can be transformed to a mass using the molar mass of hydrogen. This mass of hydrogen is important as it will be used to determine the weight percent of hydrogen stored in a material. The general definition of this weight percent is the ratio of the mass of hydrogen released over the mass of carbon tested multiplied by one hundred.

Chapter III Characterisation of hydrogen storage thanks to a volumetric method – experimental test bench developed
82
33..22 DDeessoorrbbiinngg tthhee eemmppttyy pprreessssuurree vveesssseell
A series of measurements have been made with an empty pressure vessel to determine the equation of the number of moles of hydrogen released as a function of the absolute pressure and the volume of the pressure vessel has been determined accurately.
3.2.1 The determination of the equation for the empty pressure vessel
For the determination of the storage capacity of the carbon material, the volume of hydrogen released with the empty pressure vessel is required, and the experimental protocol is the same as the one applied in paragraph 4.1.
The number of moles of hydrogen released by the pressure vessel when it is empty has an equation of the following type,
c P.b P.a nv ++= 2 equation III-4
where a, b and c are constants and P is the absolute pressure in the pressure vessel, thereby meaning P1+P0, expressed in bars. This equation, based on the virial equation of state, describes the number of moles of hydrogen released as a function of the pressure in the pressure vessel at the temperature of 25°C, because all our experiments will be held at that temperature. The repeatability of the experiment has been done in order to get an estimation of the errors in the equation. The calculated experimental error on this type of equation with the various parameters is:
( ) ( ) ( ) ( )( ) ( )2222222 ....2 cbaPPPbPanv ∆+∆+∆+∆+=∆ equation III-5
The various constant errors ∆P, ∆a, ∆b and ∆c that are being used in this equation can be found in appendix 2. The table below resumes the various experimental values found for the three parameters a, b and c in the different measurements, with their standard deviations [150], considering that the same trendline was imposed for every experiment.
1 2 3 4 5 6 7 8 9 10 AverageStandard deviation
a -3,62E-06 -3,73E-06 -3,65E-06 -3,52E-06 -3,55E-06 -3,68E-06 -3,58E-06 -3,69E-06 -3,53E-06 -3,55E-06 -3,609E-06 7,251E-08b 5,72E-03 5,77E-03 5,71E-03 5,72E-03 5,67E-03 5,71E-03 5,70E-03 5,75E-03 5,70E-03 5,74E-03 5,720E-03 2,745E-05c -8,84E-04 -8,93E-04 -1,31E-03 -6,64E-04 -2,33E-04 -1,30E-03 -4,83E-04 -1,03E-03 -1,08E-03 -7,83E-04 -8,647E-04 3,256E-04
Table III-1 a, b and c values for the determination of the compressibility factor
It can be seen that the standard deviation for the c parameter is quite large compared to the two other parameters. This is due to the fact that the experimental test bench is less precise at low than at high pressure due to the imprecision in the determination of the pressure.
The equation determining the number of moles of hydrogen released from the pressure vessel at a temperature of 25°C and pressures varying from the atmospheric pressure up to 100 bars is therefore
4326 10.647.8.10.720.5.10.609.3 −−− −+−= PPnv equation III-6
where P is the absolute pressure expressed in bars. Considering that the various parameters are known, it is possible to calculate the error on the number of moles. This error depends only on the various parameters which are constant and on the absolute pressure. Hence, the greater the pressure, the lower the relative experimental error on the number of moles of hydrogen. Now that the experimental equation for the number of moles of hydrogen released as a function of the pressure has been established, the volume of the pressure vessel can be calculated.
3.2.2 Calculating the volume of the pressure vessel
The volume of the pressure vessel can be calculated thanks to the knowledge of the volume of hydrogen released by the pressure vessel as a function of the pressure P in the pressure vessel. The volume of hydrogen released depends on the volume of the pressure vessel and of the pressure applied, and at every pressure P (P=P0+P1) and temperature T1 the number of moles of hydrogen in the

Chapter III Characterisation of hydrogen storage thanks to a volumetric method – experimental test bench developed
83
reactor obeys the equation below:
( ) 112 ..,
. TRTPZVPn r
reactorH = equation III-7
with Vr the volume of the pressure vessel, and as a recall the index 1 refers to the pressure vessel whereas the index 0 refers to the gas flow meter (c.f. Figure III-1).
We also know that the number of moles of hydrogen in the pressure vessel is equal to the number of moles of hydrogen released by the pressure vessel at a temperature T1 and pressure P1 (nH2) added to the number of moles of hydrogen in the pressure vessel at the atmospheric pressure P0 (n’H2).
222 HH 'nn n reactorH += equation III-8
The number of moles of hydrogen at the atmospheric pressure can be calculated thanks to the volume of the pressure vessel and the following relation:
( ) 110
02 T.R.T,PZ
V.P 'n rH = equation III-9
where P0 is the absolute pressure in the gas flow meter and the atmospheric pressure.
Considering that all the data are known and that nH2 is the number of moles of hydrogen released by the pressure vessel, by replacing equation III-7 and equation III-9 in equation III-8, a relation for the volume of the pressure vessel, Vr, can be established:
( ) ( )10
0
1
12
T,PZP T,PZ
PT.R.n V Hr
−= equation III-10
The calculated error generated by this relation is expressed as so:
( ) ( ) ( ) ( ) ( ) ( )( )
( )( ) ( )
( )
( )( )
22
2
22
2
22222
0
0
0
0
10
011
1
1
1
01
102
2
1
1
0
0
1
1
0
0
11
11
∆
∂∂
−+
∆
∂∂
−+∆+∆+∆+∆+∆=∆
PZP
PPZ.
PZ.PPZ.PPZ
PPPZ.
PZ.PPZ.PV
VTT
TT
PP
PP V
VH
Hr
r
where the error on the number of moles of hydrogen released (nH2) and on the compressibility factor has been expressed as a function of the errors on the various data recorded during an experiment. The various errors used such as ∆P0, ∆P1, ∆T0, ∆T1 and ∆VH2, are expressed in appendix 2. The details of the calculation of the experimental errors will be given in section 3.6.
A series of experiment have been done to determine the volume of the pressure vessel. From these measurements a statistical error through the standard deviation on the volume of the pressure has been evaluated. The calculated experimental error is a theoretical calculation, whereas the reproducibility of the measurement for the determination of the volume of the pressure vessel is more appropriate to determine the accuracy of the volume of the pressure vessel determined with the experimental set-up.

Chapter III Characterisation of hydrogen storage thanks to a volumetric method – experimental test bench developed
84
0,0E+00
2,0E-05
4,0E-05
6,0E-05
8,0E-05
1,0E-04
1,2E-04
1,4E-04
1,6E-04
1,8E-04
2,0E-04
0 10 20 30 40 50 60 70 80 90 100
Absolute Pressure (bars)
Vol
ume
of th
e re
acto
r (m
3 )
0,0
0,5
1,0
1,5
2,0
2,5
3,0
3,5
4,0
4,5
5,0
Rel
ativ
e er
ror
(%)
Calculated error : +/- 0.2 cm3
Figure III-5 The volume of the reactor as a function of the pressure
The figure above shows the variation of the volume of the pressure vessel as a function of the absolute pressure with the absolute and relative experimental errors. The errors are low at high pressure with a value of ± 0.5 cm3 and a relative error of 0.3 %. At low pressure the relative error increases due to the pressure transducer. With an error of ± 0.05 bar, at a pressure close to 5 bars the relative error increases to 1% which explains this steep increase.
From the figure above, the greater the pressure, the more precise the measurement of the volume of the pressure vessel. It has been decided that for every experiment the average value should be taken for pressures varying from 40 bars up to the maximum pressure, and once again the standard deviation has been calculated.
Experiment number 1 2 3 4 5 6 7 8 9 10 AVERAGE
Volume of the pressure vessel
138,79 140,41 138,03 139,84 137,64 138,24 138,77 139,56 138,33 138,98 138,86
Standard deviation 0,25 0,21 0,3 0,21 0,24 0,21 0,23 0,25 0,22 0,23 0,24 Table III-2 Volume of the pressure vessel experimentally measured
From the table above, the calculated volume of the pressure vessel is 138.86 ± 0.24 cm3.
This volume will be used for the determination of the intrinsic weight percent of hydrogen stored in the sample, and more precisely to determine the dead volume in the pressure vessel. When a carbon is present in the pressure vessel, the dead volume is the volume of the pressure vessel to which is subtracted the volume taken by the carbon particles.
Moreover, the determination of the volume of the pressure vessel is essential for the calibration of our experimental set-up and for the calculation of the determination of the storage capacity of a well known metal hydride material.
Measuring the mass of carbon is an easy task but measuring the total mass of hydrogen released from the pressure vessel when it is filled with carbon is slightly more complex. We have established two means of defining the weight percent stored in the carbon that will both be presented in the next paragraph. The first mean is to measure the difference of the mass of hydrogen released when the pressure vessel is filled with carbon and when the pressure vessel is empty, and the second mean is to determine specifically the mass of hydrogen desorbed from the carbon particles.
33..33 TThhee ggrraavviimmeettrriicc ppeerrcceennttaaggee –– aa ccoommppaarriissoonn ttoo ppuurree ccoommpprreessssiioonn
This first calculation is based on the determination of the excess amount of hydrogen released by the pressure vessel when the carbon is present compared to the amount of hydrogen released when the vessel is empty. This determines whether the presence of the carbon in the vessel is beneficial to the

Chapter III Characterisation of hydrogen storage thanks to a volumetric method – experimental test bench developed
85
total amount of hydrogen released from the pressure vessel, as shown in the figure below.
P
nH2
without carbon (nv)
with carbon (nc)
with carbon (nc)
P
nH2
without carbon (nv)
with carbon (nc)
with carbon (nc)
Figure III-6 A comparison to compression
The initial measurement is made with an empty pressure vessel, pressurised with hydrogen at a certain pressure P1 and temperature T1. The volume of hydrogen released is then measured and transformed into a number of moles released. The full line on the figure above shows the number of moles released as a function of the pressure in the vessel.
The same measurement is done in the same conditions of temperature and pressure, but this time, the carbon adsorbent material is present. Once again the volume of hydrogen released is measured and transformed in a number of moles. The dotted lines above show the curve of the evolution of the number of moles released as a function of the pressure in the vessel, and two possibilities occur: the curve lies either above or below the first curve, called without carbon.
In the case where the curve lies below, the carbon filled pressure vessel released a smaller amount of hydrogen than the empty vessel, making this material inefficient for storing an excess amount of hydrogen. It should be noted that the carbon adsorbs a certain amount of hydrogen, but not sufficiently to overcome the volume of hydrogen that could be stored in the volume taken by the carbon if it were not present. The hydrogen storage capacity of the material does not overcome its presence in the pressure vessel.
On the other hand, the higher curve shows an excess of hydrogen released by the pressure vessel with the carbon present than for an empty pressure vessel. This means that the carbon stores an amount of hydrogen sufficiently important to overcome the volume of hydrogen that it could be storing in the volume taken by the carbon and an extra amount in excess. In this case the hydrogen storage capacity of the carbon overcomes its presence in the pressure vessel and is a favourable material to be used for hydrogen adsorption.
The gravimetric weight percent stored in excess in the carbon is then defined as
( ) 100.. % 2
c
vcH
mnnMwt −= equation III-11
where MH2 is the molar mass of hydrogen expressed in g.mol-1, mc the mass of carbon used for the testing (g), nc is the number of moles of hydrogen released when the carbon is present and nv the number of moles of hydrogen released from the pressure vessel when it is free of carbon. All the values of moles are taken at the same pressure and temperature.
This value of the gravimetric percentage is not the maximum amount of hydrogen that can be stored in a carbon material, but solely the hydrogen that is released in excess to a system in pure compression without the carbon present. Now that this value has been properly defined we would like to define and set a calculation concerning the intrinsic gravimetric percentage of the material. In this

Chapter III Characterisation of hydrogen storage thanks to a volumetric method – experimental test bench developed
86
case, not only do we want to take into account the excess amount of hydrogen desorbed by the sample but also the amount of hydrogen that has been desorbed from the internal surface of the material.
33..44 CCaallccuullaattiinngg tthhee iinnttrriinnssiicc ggrraavviimmeettrriicc ppeerrcceennttaaggee ooff oouurr mmaatteerriiaallss
In the total amount of hydrogen released from the pressure filled with carbon, a certain amount of hydrogen has been compressed in the vessel and another amount adsorbed in the carbon. By measuring the total amount of hydrogen released, no differentiation is made. The aim of this measurement is to separate both of these in order to obtain the intrinsic value of hydrogen desorbed by the carbon.
3.4.1 Configuration of the carbon in the vessel
In order to do this, as the volume of the reactor has been calculated previously (c.f. paragraph 3.2.2), the volume taken by the carbon in the pressure vessel should be determined, or reversibly the dead volume in the pressure vessel, volume in which the gas is compressed and not adsorbed.
The figure below is a schematic representation of the pressure vessel with the carbon :
Vpressure vessel
Vdead volume
Vskeleton
Vbulk
Vpressure vessel
Vdead volume
Vskeleton
Vbulk
Figure III-7 Schematic representation of the pressure vessel with carbon particles
In the carbon two different densities can be described : the bulk density which is determined with mercury pycnometry and the skeleton density determined with helium pycnometry. The bulk density is the density of the material including the porosity and measured when the carbon is a monolith or a pelletised powder. The skeleton density is the density of the carbon skeleton without the porosity, and is always greater than the bulk density, as the mass is the same in both cases, but the volume taken by the bulk is greater than the volume taken by the carbon skeleton. If we consider a powder, the maximum theoretical density when the powder is compressed is the density of the skeleton, and up to that point only is the bulk density equal to the skeleton density.
The difference in density between the bulk and the skeleton is the total porosity which can either be inter or intra particle. In the simplest case of a carbon monolith, the dead volume in the pressure vessel is the volume of the monolith subtracted to the volume of the pressure vessel, and all the gas that does not come from the dead volume is considered to be adsorbed in the carbon monolith. In this case the dead volume is equal to:
bulk
carbonvesselpressurevolumedead dmVV −= equation III-12
In the case of a pelletised powder, the bulk density is the density of the compressed powder which varies depending on the pressure applied. The greater the pressure applied the greater the bulk density and the dead volume, making the dead volume a function of the pressure applied on the powder. The equation above is still valid, but the bulk density can be varied with the pressure used to pelletise.
If the bulk density in the equation above is replaced by the skeleton density, the dead volume considered is then the volume of the pressure vessel to which is subtracted the volume taken by the carbon particles and skeleton. The tortuosity and the chain established by the particles are the determining elements that define the porosity in the sample, but adsorption occurs on the mass of

Chapter III Characterisation of hydrogen storage thanks to a volumetric method – experimental test bench developed
87
material in a carbon sample.
In the sample, hydrogen can be adsorbed and compressed when the energy interactions due to the particles are strong enough to allow this. What we are interested in for the intrinsic weight percent is to obtain the amount of hydrogen that interacts with the carbon particles and that are hence adsorbed on the carbon skeleton. In order to do this, the ratio of the mass of carbon to the skeleton density will determine the effective volume taken by the carbon particles, and the voids and porosity will not be considered, as they will only be filled with hydrogen due to the energy interaction created by the carbon particles, as it is the solid material that is responsible for the hydrogen adsorption, and the void and porosity exist because of the arrangement of the matter in the sample.
When measuring the intrinsic weight percent, the dead volume is
skeletoncarbonvesselpressurevolumedead d
mVV −= equation III-13
and it is this volume that will be used when we are looking for the mass of hydrogen that can be stored by adsorption in a unit mass of carbon, and depends on the material and its nanostructure.
3.4.2 Defining the intrinsic weight percent
The total volume of hydrogen released from the pressure vessel when the carbon is present is
( ) ( )( ) 000
20
..,.
TRTPZPVP
PnH
c = equation III-14
where P is the absolute pressure in the pressure vessel (P0+P1) expressed in MPa and VH2(P) is the total volume of hydrogen released at the pressure P. This value is experimentally measured.
When calculating the intrinsic weight percent, the dead volume in the pressure vessel is the volume in the pressure vessel that is not occupied by carbon and using the non-ideal gas law and equation III-13, the number of moles of hydrogen released from the dead volume in the pressure vessel is :
( ) ( ) skeleton
cvvolumedeadd
mTRTPZ
PPnn ..., 11
−= equation III-15
where dskeleton is the density of the carbon skeleton, expressed in kg.m-3 and mc is the mass of carbon expressed in kg.
Hence the equation for the intrinsic weight percent of hydrogen stored in the carbon material is given by the following equation:
( ) 100m1nn.Mwt%
cvolumedeadcH2 ⋅⋅−= equation III-16
and replacing the two equations, the following expression is used to calculate the intrinsic weight percent of hydrogen stored in a carbon material in our experimental set-up
( ) ( )( ) ( ) ( ) 100
m1
dm
TRTPZPPn
.R.TT,PZP.VP.MPwt%
cskeleton
cvH
H000
20
2 ⋅⋅
−−= ..., 11
equation III-17
where VH2(P) is the volume of hydrogen released when the carbon is present at the pressure P, nv is the number of moles of hydrogen released when the pressure vessel is empty at the pressure P, and Z the compressibility factor of hydrogen at the specified pressure and temperature.
The two calculations established for our experimental set-up and for the determination of the hydrogen storage capacity of our materials have now been explained. Various different values, either physical or experimental have been used, and as for any experimental work the accuracy of the measurement is very important to evaluate.

Chapter III Characterisation of hydrogen storage thanks to a volumetric method – experimental test bench developed
88
33..55 CCaallccuullaattiioonn ooff tthhee eerrrroorrss
As for all experimental measurements, some errors occur. These errors come from the experimental protocol, from the accuracy of the various instruments used, from the experimenter and in our specific case from the storage capacities of our material. The greater the storage capacity the lesser the errors. All these errors will be taken into account in this paragraph in order to get an estimate of the precision of the test bench used.
The various constant errors introduced in the following calculations for the total error on the two weight percents defined above are detailed in appendix 2. These include instrumental errors from the temperature probe, the pressure transducer and the gas flow meter or calculated errors on the compressibility factor.
Mathematically, when a function y depends on various parameters xi the absolute error can be calculated thanks to the following equation :
( ) ( ) ∆⋅
∂∂=∆
ii
ix
xyy
22
2 equation III-18
where xi represents the absolute error of the parameter xi.
The errors made on the calculation are based on the previous explanations on the determination of the gravimetric percentage of hydrogen stored in our materials. The initial equation is as so:
100*carbon of mass
hydrogen of mass(wt%) percent weight = equation III-19
where the mass of hydrogen is defined in two different ways depending on the weight percent of hydrogen calculated, and the mass of carbon is the mass measured after the experiment, as a difference exists between the mass of carbon before and after the experiment because of the outgassing of the sample.
3.5.1 Wt% calculated compared to compression
Recalling equation III-11 expressing the weight percent of hydrogen stored in a carbon in comparison to a system in pure compression of hydrogen :
( ).100mnn.M %wt
c
vcH −= 2
and applying equation III-18 to get the equation of the errors made on the general equation of the weight percent of hydrogen stored in the carbon,
( ) ( ) ( ) ( )22
22
22
2
2
22
.%.%.%.% % vv
cc
HH
cc
nn
wtnn
wtMMwtm
mwtwt ∆
∂∂+∆
∂∂+∆
∂∂+∆
∂∂=∆ equation III-20
This calculation leads to an equation of the error made which can be written as so:
( ) ( ) ( ) ( )( )2
222
22
2 %
%vc
vc
HH
cc
nnnn
MM
mm
wtwt
−∆+∆+∆+∆=∆ equation III-21
Another important equation to consider is the equation of ideal gases extended to non ideal gas thanks to the compressibility factor. This equation expresses the number of moles as a function of the temperature, the pressure, the compressibility factor and the volume.
( ) TRnTPZVP ...,. = or ( ) TRTPZVPn ..,
.= equation III-22
Reapplying equation III-18 we get the following general expression for the error made on the

Chapter III Characterisation of hydrogen storage thanks to a volumetric method – experimental test bench developed
89
number of moles as a function of the errors of the various parameters:
( ) ( ) ( ) ( ) ( ) ( )222222
VV
RR
ZZ
TT
PP
nn ∆+∆+∆+∆+∆=∆ equation III-23
The compressibility factor is a function of the pressure and the temperature of the gas and has been calculated in section 3.1. The error on the gas constant is extremely small (R=8.4*10-6) compared to the other parameters and has therefore been eliminated. The equation above becomes therefore
( ) ( ) ( ) ( )222
22
2 11 VV
TTP
PZPZ
nn ∆+∆+∆
+⋅∂
∂=∆ equation III-24
where the temperature is expressed in K, the volume in m3, the pressure in MPa and the compressibility factor has no units.
The error made on the number of moles of hydrogen released when the pressure vessel is empty of carbon has been calculated experimentally in paragraph 3.2.1, recalling equation III-5 :
( ) ( ) ( ) ( )( ) ( )22222222 cba.P.PPb.a.Pnv ++++=
and hence the equation determined above will be used to determine the error made on the number of moles of hydrogen released when the carbon is present (nc).
3.5.2 The intrinsic weight percent
Recalling the equation III-16 established for the determination of the intrinsic weight percent of hydrogen stored in the carbon, we have
( ) 100m1nn.Mwt%
cvolumedeadcH2 ⋅⋅−=
From this equation the experimental error can be theoretically calculated
( ) ( ) ( ) ( )( )2
2
22
22
2
%%
volumedeadc
volumedeadc
HH
cc
nnnn
MM
mm
wtwt
−∆+∆+∆+∆=∆
where the error made on the number of moles of hydrogen released with the carbon present can be calculated thanks to equation III-24, and the experimental errors on the mass of carbon and on the molar mass of hydrogen can be found in the literature. The error on the number of moles of hydrogen released from the dead volume in the pressure vessel when the carbon is present can be calculated from the equation below:
( ) ( ) ( ) ( ) ( )222
22
11
22
11 P
PZPZ
TT
dd
mm
nn
bulkbulk
cc
volumedeadvolumedead ∆
+⋅∂
∂+∆+∆+∆=∆ equation III-25
Now that the experimental procedure with the various calculations for the determination of the weight percent hydrogen stored in our different carbon materials have been presented and the errors calculated, it is important to determine the limits of use of our experimental set-up and to perform a calibration of the set-up prior to any experimental testing on any sample.
33..66 TThhee lliimmiittss ooff tthhee tteesstt bbeenncchh
To minimise the errors made during the testing of our materials, we tried to optimise the mass of material to be used as a function of the storage capacity of the material.
Consider a sample storing a certain weight percent of hydrogen (variable) at a certain pressure (variable) with a certain mass m of carbon at a temperature of 25°C. The aim of this calculation is to

Chapter III Characterisation of hydrogen storage thanks to a volumetric method – experimental test bench developed
90
measure the impact of the mass of carbon tested on the experimental errors generated by the experiment.
Once the various variables have been defined, the number of moles released from the pressure vessel when empty (nv) is calculated thanks to the previous calculations and measurements. By using the weight percent of hydrogen stored and the mass mc of carbon, the number of moles of hydrogen released when the carbon is present in the pressure vessel (nc) can be calculated, as well as the respective errors nc and nv.
Using the following equation
( ) ( ) ( ) ( )( )2
222
22
2
%%
vc
vc
HH
cc
nnnn
MM
mm
wtwt
−∆+∆+∆+∆=∆
and the different values calculated, it is now possible to calculate the error made on the weight percent as a function of the mass of carbon tested and the weight percent of hydrogen stored by the carbon at a specified pressure and a temperature of 25°C.
The figure below shows a graph of the variation of the error on the weight percent as a function of the storage capacity of the material and the mass of carbon tested. The pressure used for the calculation is 60 bars.
0
10
20
30
40
50
60
70
80
90
100
0 5 10 15 20 25 30
Mass of carbon tested (g)
Rel
ativ
e er
ror o
n th
e w
t % (
%)
.3
4 % 5
% 5
% 5
% 5
4% 5
4% 5
4 % 5
increasing wt%
4% 5
Figure III-8 Influence of the mass and the weight percent on the calculated experimental errors at 60 bars
One can see on the figure that the greater the storage capacity of the material and the greater the mass of material tested, the smaller the errors. The error made decreases with the increasing weight percent of hydrogen stored for a constant mass of carbon tested. For example, testing 10 grams of carbon with a material that stores 0.05 wt% generates an error of 80%, which reduces to 40 % for a material that stores 0.1 wt% and down to 20 % for a material that stores 0.2 wt%.
The rectangular shape represents the typical zone of the carbon mass tested in the test bench, hence between 7 and 13 grams of carbon material, considering that for some materials, depending on the density, the mass of material tested can raise up to 30 grams. In order to minimise the error whatever the weight percent of hydrogen that can be stored in the carbon, a mass of 10 grams of material to be tested ensures an error around 40% for a material that stores 0.1 wt%.
The relative error on the weight percent is directly inversely proportional to the difference of moles released with or without the carbon, meaning that if nc-nv tends to zero then the error generated will reach infinity, and reversibly if the difference is high, a material that stores a large amount of hydrogen, the relative error will tend to zero. The same reasoning is true for the mass of material

Chapter III Characterisation of hydrogen storage thanks to a volumetric method – experimental test bench developed
91
tested. Moreover, for a constant amount of hydrogen stored, the greater the mass of carbon tested, the greater the total number of moles of hydrogen released and hence the greater the value nc. As the value nv is constant, at constant pressure and temperature, whatever the material tested, the difference nc – nv will be higher and hence the relative error reduced.
The experimental set-up has been designed for the testing of a large amount of material and for materials that store a high amount of hydrogen, in order to minimise the experimental errors. From the calculation above, it has been decided that a minimum of 10 grams of material should be tested for every measurement in order to minimise the experimental errors, whatever the storage capacity of the material.
622
As shown in the literature review, the calibration of the experimental set-up is of major importance for the determination of the storage capacity of carbon materials, as well as is a clear experimental protocol. We have already determined that a minimum mass of material is required for the measurements, and the aim of this paragraph is to show that the experimental protocol and the calculations established are appropriate in determining the storage capacities of our materials.
44..11 EExxppeerriimmeennttaall pprroottooccooll
The experimental procedure for the testing of a material is done is several steps. Prior to the testing of the material, a leak test is done, as well as a measurement on the amount of hydrogen released from the pressure vessel when the carbon material is not present. The entire experimental protocol with the security point is given in appendix 1.
4.1.1 The outgassing of the sample
The carbon is initially pelletised thanks to a hand made system. Once in a pellet form or in a denser form, the carbon is placed in the sample holder in the pressure vessel. Because of the outgassing of the sample during an experiment, the mass of carbon before and after the experiment can vary quite significantly. It has therefore been decided to measure the mass of adsorbent after the experiment, once the measurement has been done.
The aim of the outgassing of the adsorbent is to obtain a reproducible initial state of the adsorbent surface. A perfectly clean surface would require ultra high vacuum (less than 10-6 mbar) and high temperature (above 1000°C). Our aim is to eliminate most of the species physisorbed during the storage of sample, to avoid any changes due to ageing, or modification of functional groups and to reach a well defined, reproducible intermediate state suitable for the experiment.
The outgassing procedure in our experiment has been strictly applied prior to every experiment. The three stages are heating, heating and degassing, and degassing.

Chapter III Characterisation of hydrogen storage thanks to a volumetric method – experimental test bench developed
92
0
20
40
60
80
100
120
140
160
0,0 0,5 1,0 1,5 2,0 2,5 3,0 3,5 4,0Time (hr)
Tem
pera
ture
(°C
)
0,0
0,1
0,2
0,3
0,4
0,5
0,6
0,7
0,8
0,9
1,0
Pre
ssur
e (b
ar)
heating stage heating and vacuumstage
vacuum stage
Figure III-9 The three different stages with temperature and pressure during outgassing
For practical reasons the cryostat could not be left turning all night long without the survey of an experimenter, which means that the outgassing of the sample had to be done in multiple steps.
The initial stage is to bring the entire system to the degassing temperature, stage which lasts for a little bit more than an hour. In parallel to the increase of temperature, the pressure in the vessel increased due to the degassing of the carbon sample. Once the system is at temperature, the next stage is to keep the cryostat turning and activate the vacuum pump that starts pumping in the pressure vessel and in the sample. This heating and vacuum stage lasts for an hour.
During this stage the pressure drops from around 0.6 bar to 0 bar and a temperature decrease is observed in parallel. Unfortunately the pressure transducer in the pressure vessel does not measure the pressure under the atmospheric pressure, and hence the evolution of the pressure cannot be recorded during the outgassing. Nevertheless, the pressure is measured at the entrance of the vacuum pump, which is equal to the pressure in the vessel.
Once the vacuum pump has been switched on, the temperature in the pressure vessel starts to decrease so does the pressure. The temperature does not decrease continuously because of the cryostat which maintains the temperature in the pressure vessel above 150°C. After one hour of simultaneous heating and pumping in the pressure vessel, the cryostat is switched off and the vacuum pump continues to outgas the carbon in the pressure vessel. The temperature of the system drops continuously as the vacuum pump is left on for another fifteen hours. During this time the pressure obtained in the pressure vessel varies from 4.10-2 mbar to 8.10-3 mbar depending on the ease of the carbon material to outgas. It should be noted that this pressure is measured in the pressure vessel and is not necessarily the pressure on the carbon surface or in the pores of the carbon adsorbent.
The total time under which the sample is outgassed either by a temperature or by a vacuum treatment is close to 18 hours. This procedure is applied for every sample prior to pressurising the pressure vessel filled with the carbon adsorbent.
4.1.2 The pressurisation of the pressure vessel
Before pressurising the reactor to the experimental pressure required for the measurement, the pressure vessel is set in equilibrium with a volume of hydrogen at atmospheric pressure in order to get the pressure vessel filled with carbon at the atmospheric pressure, saturated with hydrogen. As we measure the hydrogen released from the pressure vessel, the final state of the entire system is the adsorbent in the pressure vessel saturated with hydrogen at the atmospheric pressure and it is therefore important that the final state be the same as the initial state. Once the initial state has been reached it is possible to pressurise the pressure vessel at the required pressure.
This stage of the experiment consists of bringing the pressure vessel, filled with the adsorbent or
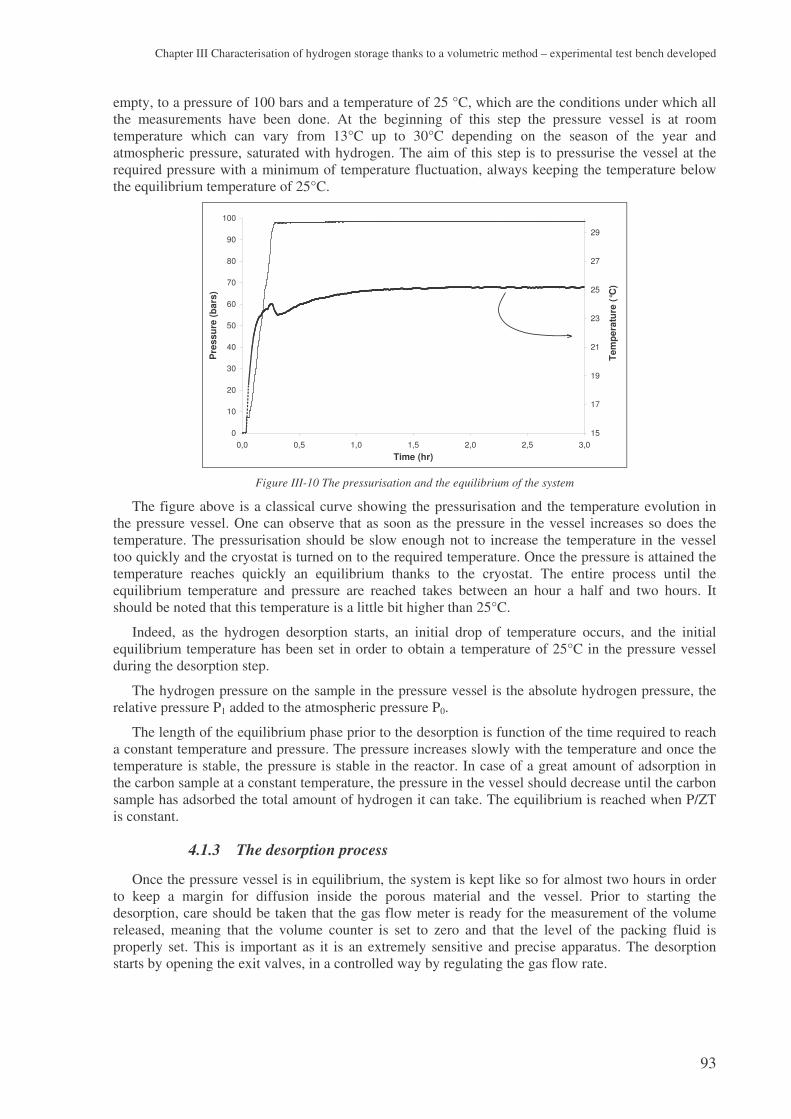
Chapter III Characterisation of hydrogen storage thanks to a volumetric method – experimental test bench developed
93
empty, to a pressure of 100 bars and a temperature of 25 °C, which are the conditions under which all the measurements have been done. At the beginning of this step the pressure vessel is at room temperature which can vary from 13°C up to 30°C depending on the season of the year and atmospheric pressure, saturated with hydrogen. The aim of this step is to pressurise the vessel at the required pressure with a minimum of temperature fluctuation, always keeping the temperature below the equilibrium temperature of 25°C.
0
10
20
30
40
50
60
70
80
90
100
0,0 0,5 1,0 1,5 2,0 2,5 3,0Time (hr)
Pre
ssur
e (b
ars)
15
17
19
21
23
25
27
29
Tem
pera
ture
(°C
)
Figure III-10 The pressurisation and the equilibrium of the system
The figure above is a classical curve showing the pressurisation and the temperature evolution in the pressure vessel. One can observe that as soon as the pressure in the vessel increases so does the temperature. The pressurisation should be slow enough not to increase the temperature in the vessel too quickly and the cryostat is turned on to the required temperature. Once the pressure is attained the temperature reaches quickly an equilibrium thanks to the cryostat. The entire process until the equilibrium temperature and pressure are reached takes between an hour a half and two hours. It should be noted that this temperature is a little bit higher than 25°C.
Indeed, as the hydrogen desorption starts, an initial drop of temperature occurs, and the initial equilibrium temperature has been set in order to obtain a temperature of 25°C in the pressure vessel during the desorption step.
The hydrogen pressure on the sample in the pressure vessel is the absolute hydrogen pressure, the relative pressure P1 added to the atmospheric pressure P0.
The length of the equilibrium phase prior to the desorption is function of the time required to reach a constant temperature and pressure. The pressure increases slowly with the temperature and once the temperature is stable, the pressure is stable in the reactor. In case of a great amount of adsorption in the carbon sample at a constant temperature, the pressure in the vessel should decrease until the carbon sample has adsorbed the total amount of hydrogen it can take. The equilibrium is reached when P/ZT is constant.
4.1.3 The desorption process
Once the pressure vessel is in equilibrium, the system is kept like so for almost two hours in order to keep a margin for diffusion inside the porous material and the vessel. Prior to starting the desorption, care should be taken that the gas flow meter is ready for the measurement of the volume released, meaning that the volume counter is set to zero and that the level of the packing fluid is properly set. This is important as it is an extremely sensitive and precise apparatus. The desorption starts by opening the exit valves, in a controlled way by regulating the gas flow rate.

Chapter III Characterisation of hydrogen storage thanks to a volumetric method – experimental test bench developed
94
0
10
20
30
40
50
60
70
80
90
100
4,8 5,0 5,2 5,4 5,6 5,8 6,0 6,2
Time (hr)
Pre
ssur
e (b
ar)
15
17
19
21
23
25
27
29
Tem
pera
ture
(°C
)
Figure III-11 A typical desorption curve for the temperature and pressure
The figure above shows a classical desorption curve obtained. The depressurisation rate is kept constant with time and the temperature in the pressure vessel is equally constant, with variations around ± 0.1°C. As explained earlier, a small drop in temperature can be seen with the initial pressure drop, but once this has occurred the temperature is constant all along the measurement, which is extremely important for such experiments.
The time required for the desorption is around an hour and a half, and the gas flow rate is controlled at 20 L.hr-1. The slight variations seen in the slope of the pressure curve are due to small changes in the gas flow rate. Indeed, as the rate is initially set, the pressure in the vessel is at its maximum of 99 bars. Once the desorption started the pressure decreases and the flow rate varies. It could only be kept constant if a pressure regulator was installed, but it appeared that these regulators were not precise, and more importantly they take a few minutes before finding their gas flow rate. This gas flow rate has been fixed to all the experiments in order to have the same experimental protocol for all the samples.
Once the desorption is finished the sample is taken out of the pressure vessel and the sample holder and is weighted. This sample mass will be used during the calculation of the gravimetric weight percent stored in the carbon material tested.
When the pressure vessel is entirely empty and the volume of hydrogen released measured, the next phase is the calculation of the amount of hydrogen desorbed by the carbon in comparison to compression and the intrinsic value of hydrogen stored.
The next step is the validation and the calibration of the experimental set-up.
44..22 CCaalliibbrraattiioonn ooff tthhee mmeeaassuurriinngg ddeevviiccee
The protocol for the calibration of our experimental set-up is to test the leakage of the pressure vessel and the reproducibility of an experiment with an empty pressure vessel. The next step would be to calculate the volume of a non adsorbing material and finally to calibrate the experimental set-up with a material that stores a well known amount of hydrogen at specific conditions of temperature and pressure and finally to compare the hydrogen storage results of two of our materials with another experimental set-up in an external laboratory in order to verify and test the reproducibility of the storage capacities of our material and our test bench.
4.2.1 Leak proof tests
The first step to the calibration of the experimental set-up is to verify that the pressure vessel is leak proof to hydrogen. In order to do this, the pressure vessel is pressurised with hydrogen to the pressure used for the experiments, and the entire system is left as so for a couple of hours. The data of pressure

Chapter III Characterisation of hydrogen storage thanks to a volumetric method – experimental test bench developed
95
and temperature are recorded all along the experiment.
If the system is left to itself for a couple of hours, the pressure and temperature in the vessel will fluctuate, with the same tendencies. If the temperature in the pressure vessel decreases so will the pressure, but the number of moles of hydrogen in the pressure vessel is constant, as the volume of the vessel is constant.
The number of moles in the pressure vessel is given by equation III-22. A leak proof pressure vessel is a vessel where the ratio of the pressure in the vessel to the compressibility factor and the temperature, P/ZT, is constant with time.
0,20
0,25
0,30
0,35
0,40
0,45
0 5 10 15 20 25 30 35 40 45
Time (hr)
P /
Z.T
calculated error : ± 0,0006
Figure III-12 Leak-proof test on the experimental set-up
The figure above is an example of a classical leak proof test, showing the evolution of the ratio with time. As observed, the ratio is constant with time, and included in the errors calculated. These errors are calculated thanks to the following equation
( ) ( ) ( )222 /
/ZZ
TT
PP
ZTPZTP ∆+∆+∆=∆ equation III-26
and the absolute errors are evaluated to be around 0.0006, which is extremely low and negligible. These leak proof tests are regularly performed during a series of experiments.
This test proves that the pressure vessel is leak proof to hydrogen and that no hydrogen is getting adsorbed on the surface of the pressure vessel, or in a negligible amount that is not significant compared to the time used for the test, approximately six hours, or to the volume of the pressure vessel.
4.2.2 Reproducibility of an empty measurement
Once the leak proof test has been done, the following step for the calibration of the pressure vessel is the reproducibility of the amount of hydrogen released for an the empty pressure vessel in the same conditions of temperature and pressure. This measurement, in addition to the calculation of the errors, will determine whether or not the same value is obtained depending on atmospheric conditions, and the experimental error will be measured in a series of measurement.

Chapter III Characterisation of hydrogen storage thanks to a volumetric method – experimental test bench developed
96
Figure III-13 Reproducibility of the experiment with an empty pressure vessel
On the right hand side of the figure above the graph is a zoom of the area of pressure between 45 and 75 bars. The thick solid lines above and below the data represent the calculated error on the average value of the number of moles of hydrogen released at every pressure. It can clearly be observed that all the series lie within the calculated error.
By comparing the value of the number of moles calculated thanks to the experimental data at the same pressure and temperature, the error measured can be calculated.
A series of ten experiments has been done in order to determine the reproducibility of the experiment and the data has been recollected on the table below.
Number of moles of hydrogen desorbed at
85 bars and 298 K0,4593 0,4618 0,4579 0,4605 0,4578 0,4586 0,4586 0,4612 0,4580 0,4611
The relative experimental error made will be the ratio of the calculated average value over the
standard deviation multiplied by 100, which gives and experimental error of 0.3%. The absolute error (i.e. the standard deviation) is equal to 1.5*10-3 mol whilst to the calculated experimental error is between three to four times greater. This means that the calculated experimental error is always greater that the true error measured using a series of measurement.
The following steps for the calibration of the experimental set-up consists of calibrating the set-up with a non adsorbing material and measuring its density and testing a material - frequently used as a reference material - that has a known storage capacity and desorption isotherm. Finally, some carbon materials produced at the centre for energy studies will be sent to another laboratory and tested using a different experimental technique.
44..33 CCaalliibbrraattiioonn wwiitthh aa nnoonn aaddssoorrbbiinngg mmaatteerriiaall
This first calibrating measurement was done with a non-adsorbing material. A metallic steel cylinder has been machined and placed in the pressure vessel.
4.3.1 Experimental protocol
Measuring the volume of the cylinder will be done by two different means. As the geometry is extremely simple, it can either be measured manually with a vernier calliper, or by using the experimental set-up. The difference in the volume of hydrogen released when the cylinder is in the pressure vessel and when the pressure vessel is empty corresponds to the volume taken by the cylinder in the pressure vessel.
0,000
0,050
0,100
0,150
0,200
0,250
0,300
0,350
0,400
0,450
0,500
0 10 20 30 40 50 60 70 80 90 100
Absolute pressure (MPa)
num
ber
of m
oles
of h
ydro
gen
(mol
)
0,250
0,270
0,290
0,310
0,330
0,350
0,370
0,390
45 50 55 60 65 70 75
Absolute pressure (MPa)
num
ber
of m
oles
of h
ydro
gen
(mol
)

Chapter III Characterisation of hydrogen storage thanks to a volumetric method – experimental test bench developed
97
d1d2
h
d1d2
h
Figure III-14 Geometry of the non-adsorbing metal cylinder placed used for the calibration
The two means will be compared to determine the accuracy of the experimental set-up in measuring the density of a non adsorbing material.
4.3.2 Measurements and errors
With the experimental set-up
The volume of the pressure vessel has been calculated previously and the dead volume in the pressure vessel when the cylinder is present is similar to the calculation for the volume of the pressure vessel and represented by the following equation :
( ) ( )10
0
1
12
, ,
..
TPZP
TPZP
TRnV Hcylinderwithdead
−= equation III-27
The volume of the cylinder can be easily calculated using the following equation :
cylinder the withdead vesselpressurecylinder V V V −=
As explained earlier, the difference in the volume of hydrogen released when the cylinder is present or not in the pressure vessel during a measurement determines the volume of the cylinder.
6,0E-05
7,0E-05
8,0E-05
9,0E-05
1,0E-04
1,1E-04
1,2E-04
1,3E-04
1,4E-04
1,5E-04
0 10 20 30 40 50 60 70 80 90 100
Absolute Pressure (bars)
Vol
ume
V (m
3 )
0,0
0,5
1,0
1,5
2,0
2,5
3,0
3,5
4,0
4,5
5,0R
elat
ive
Err
or (%
)This difference is the volume of the cylinder
Dead volume with the cylinder ± 0,2 cm3
Volume of the pressure vessel ± 0,2 cm3
Figure III-15 Volume of hydrogen released with or without the cylinder
The graph above shows the volume of hydrogen released with an empty pressure vessel (upper line) and the volume of hydrogen released with a cylinder filled pressure vessel (lower line) as a function of the pressure in the pressure vessel. Considering that the cylinder does not adsorb any hydrogen, the difference between the two lines represent the volume of the cylinder.
As for the volume of the pressure vessel, the same experiment has been repeated several times in order to observe the reproducibility of the experiment. The average value determined on the table below has been determined in the same pressure range, from the maximum pressure to 40 bars, as for

Chapter III Characterisation of hydrogen storage thanks to a volumetric method – experimental test bench developed
98
the value of the volume of the pressure vessel.
Experiment number 1 2 3 4 Average
Dead volume with cylinder
104,73 105,79 104,98 105,05 105,14
Standard deviation 0,2 0,57 0,17 0,26 0,24
The free volume in the pressure vessel when the cylinder is present is equal to 105,14 ± 0,24 cm3. Considering that the volume of the pressure vessel is 138,86 ± 0,24 cm3, the volume of the cylinder is Vcylinder = 33.72 ± 0.48 cm3, hence a relative error of 1.4%.
With the vernier calliper
Using the geometry of the cylinder, the volume is equal to
( )hddVcylinder .4 21
22 −= π equation III-28
and can be calculated by measuring the dimensions of the cylinder using a vernier calliper. Similarly to the experimental set-up, the error made on the volume of the cylinder measured with the calliper will be calculated.
The error made on the volume of the cylinder is equal to the equation below
( ) ( ) ( )22
22
2
2
21
2
1 hh
VddVdd
VVV cylindrecylindrecylindre
cylindre
cylindre ∆
∂∂+∆
∂∂+∆
∂∂=∆
equation III-29
and considering that all the measurements have been done with the same calliper, we have the following equality d1=d2=h. Considering that the vernier calliper has a precision of 0.02 mm and that the error made on this measurement responds to the following equation,
( )( ) h.
dddd
h VVcylinder
cylinder ∆
−++=∆
221
22
22
21
221 equation III-30
the volume of the cylinder and the error are equal to 33cylinder 0,07cm 33,79cm V ±= equation III-31
4.3.3 Conclusions on this measurement
The relative error done on the volume of the cylinder, between the volume measured with the experimental set-up or with the vernier calliper is equal to
( ) ( )( ) 100*caliper vernierV
caliper vernierV bench testV error relativecylinder
cylindercylinder −=
hence a relative error equal to 0.2 %.
On the basis of the measurements done with the experimental set-up and the cylinder, the experiment set-up is capable of measuring the volume of a non adsorbing material with an accuracy greater than 0.5%.
The accuracy of the measurement of the volume of the pressure vessel is greater experimentally than the one calculated, which is around 3%. The volume of the cylinder comes from the difference of two volumes, and as it can be seen on the Figure III-15, the sum of the two errors is 1 cm3 for a volume of cylinder of 33.72 cm3, and hence, the calculated error using the calculation established previously, gives a relative error around 3% for the volume of the cylinder, whereas experimentally, the relative error was found to be lower by a factor two. It should be noted that the experimental error determined by the reproducibility is the most representative error, and the previous calculation shows that our experimental set-up is reliable on measuring the dead volume in the pressure vessel.

Chapter III Characterisation of hydrogen storage thanks to a volumetric method – experimental test bench developed
99
The accuracy of the measurement of the volume is greater at high pressure than at low pressure. Whatever the accuracy of the pressure transducer, in this case ± 0.05 bar, it will always remain more precise at high than at low pressure. With the replacement of the former pressure transducer that had a precision of ± 1 bar with the present pressure transducer, the precision of the measurement increased by a factor close to 20.
44..44 CCaalliibbrraattiioonn wwiitthh aa mmeettaall hhyyddrriiddee
The next calibration for the experimental set-up is to measure the hydrogen storage capacity of a material that possesses a well known isotherm. The Rare-Earths Chemical Metallurgy Research Laboratory [151] member of the French National Centre for Scientific Research (CNRS), has acquired a strong experience in the determination of various isotherms of metal hydride material for the last 20 years. They provided us with the measured isotherms of 10 grams of the metal hydride LaNi5, extensively used metal hydride.
In order to ease the measurements, the material has been tested at 40°C in order to increase the kinetics and the amount of hydrogen stored in the hydride.
The adsorption and desorption isotherms are represented on the graph below, as well as the desorption curve obtained thanks to our experimental set-up. On the x-abscissa the ratio of the number of moles of hydrogen to the number of moles of LaNi5, and the absolute pressure on a logarithmic scale on the y-abscissa.
0,1
1
10
100
0 1 2 3 4 5 6 7
Concentration (mol H / mol LaNi5)
Abs
olut
e P
ress
ure
(bar
s)
Adsorption Thiais
Desorption Thiais
Figure III-16 Calibration curve for the metal hydride LaNi5
It is important to note that our measurements are only based on the amount of hydrogen desorbed from the sample, and that our measurements are done down to the atmospheric pressure. This means that to our experimental data we have added the molar concentration found by the external laboratory at pressures below the atmospheric pressure.
Taking into account the maximum concentration of hydrogen in the hydride, a difference close to 3% is to be observed between the two measurements. This is the value in which we are interested as we are working on carbon materials and not on metal hydrides, for which the entire isotherm is interesting for the determination of the various energies developed. The adsorption and desorption plateaus correspond to an important value concerning metal hydride, but the desorption isotherms for the carbon are of the more classical type.
For small hydrogen concentrations, a slight difference in the curvature can be observed at the end of the desorption plateau. This difference is due to the sensitivity of the pressure transducer. Our pressure transducer is precise between Patm and 100 bars with an accuracy of ± 0.05 bar, whereas for an exact determination of the desorption plateau of metal hydride materials, it is important to use adapted pressure transducers with the adequate pressure range when the pressure decreases : 0-5 bars,

Chapter III Characterisation of hydrogen storage thanks to a volumetric method – experimental test bench developed
100
0-10 bars, 0-20 bars with a high precision in each of these pressure range.
This calibration is conclusive concerning our experimental set-up especially considering that our interest reside in the maximum value of hydrogen desorbed by a sample more than the shape of the experimental curve. The next step is to compare the results obtained with our experimental set-up on a carbon produced in the laboratory with the results obtained on the same carbon in another external laboratory that measures the weight percent thanks to a different technique.
44..55 TTeessttiinngg oouurr mmaatteerriiaallss iinn aa ddiiffffeerreenntt llaabboorraattoorryy
Two carbon aerogels samples produced at the centre for Energy studies have been tested in an external laboratory [152] using a gravimetric approach for the measurement of hydrogen storage. The experiments have been held at 120 bars and a slight difference, in the temperature, of 3°C exists between the two approaches.
Gravimetric results (22°C and 120 bars)
CENERG results (25°C and 120 bars)
Aerogel 1 0,37 wt % 0,36 wt %
Aerogel 2 0,29 wt % 0,29 wt % Table III-3 Comparison of the hydrogen storage results on two different samples by two different means
A perfect consistency exists between the two results at the Centre for Energy Studies and at the external laboratory, IMRA-Europe in Sophia-Antipolis [152].
.
Our choices of experimental set-up and of measuring the volume of hydrogen released from a pressure vessel have been validated thanks to a series of experimental calibrations. The volumetric method is complex in the sense that a direct mass of hydrogen stored is not measured, and various considerations have to be taken into account, such as the temperature and the pressure of the gas in the measuring device, as well as the temperature and pressure of the gas in the pressure vessel.
Moreover, hydrogen is an extremely volatile gas, and leaks occur frequently and are a constant source of experimental error. The major advantage of our experimental set-up is that in case of leak in the system, the hydrogen storage capacity of our material is under estimated, whereas in most cases the reverse is true, which is a constant source of error.
Another advantage of our experimental set-up, which can also be a disadvantage, is that a large amount of material is required, and measuring the storage capacity of too small quantities of material generate huge experimental errors, implying too many uncertainties on the result found. This is also a disadvantage as it is not always easy to obtain large amounts of material. The raw material, coming from either processes at the Centre for Energy studies, can be obtained in such amount, but it is more complicated when post treatment on the material is required. As an example, thermally activating a material in order to obtain a minimum of 10 grams - the minimum mass required for our set-up - of a homogeneously treated material requires initially between two and two and half times more material depending on the conditions used for the thermal activation. If external laboratories want to test some material on our experimental set-up they should be able to furnish this amount of carbon.
A few sensitive points exist in the experimental set-up that could be evolved. The carbon powders that have been tested revealed to be extremely volatile, and thereby they can also be an important source of leak in the system. These particles easily stick in the ball valves creating micro-leaks that appear important when the entire system is under pressure at 100 bars. A flux of compressed air was frequently used to clean the tubings and the different valves of the experimental set-up as well as the filter. The joint used between the reactor lid and the pressure vessel is not extremely heat resistant, and should be changed every 8 to 10 experiments. As it has already been said, the thermal insulation of the entire pressure vessel, lid and side-walls, has to be changed and properly adapted to the temperature range used. This thermal insulation is important as it is a guarantee of a constant temperature in the

Chapter III Characterisation of hydrogen storage thanks to a volumetric method – experimental test bench developed
101
pressure vessel during the entire experiment.
Measuring the volume of hydrogen released from the pressure vessel revealed to be interesting and enabled to measure the intrinsic weight percent of hydrogen stored in a material. Nevertheless, the knowledge of the amount of hydrogen that has been introduced in the pressure vessel could bring a large amount of information on the hydrogen that is left in the carbon once it has been released. As seen in the literature, differences might exist in certain samples between the adsorption and the desorption, showing a hysteresis implying that some hydrogen has been chemisorbed and that extra energy is required in order to release it, giving information on the various sites for hydrogen.
Measuring the volume of hydrogen released is extremely efficient in estimating the effectiveness of a carbon to desorb an extra amount of hydrogen compared to a system in pure compression. This is the weight percent of hydrogen stored compared to compression. This enables also to classify the materials, independently of the type of material, in those that are suitable for improvement or not. Only the materials that have a certain weight percent compared to compression can be post treated to improve the storage capacity.
Nevertheless, a calculation for the intrinsic weight percent has also been done. It appeared extremely useful for the calibration of our experimental set-up, might it be for the calibration with the metal hydride or the results given for the comparison with an external laboratory. This intrinsic weight percent is important as improving it will necessarily improve the weight percent of hydrogen stored compared to compression.
It should be noticed that the errors calculated during the calibration are larger than the errors generated during the calculation of the storage capacities. The calibration with the metal hydride and with the external laboratory has shown that our calculated errors are overestimated, and that our results are representative of the real capacity of our material.
The major conclusion of this chapter is that the experimental set-up is calibrated even though some restrictions should be noted. The experimental set-up is operational in measuring the intrinsic weight percent of hydrogen in a material as well as the weight percent of hydrogen released in excess to compression for a temperature of 25°C, at a pressure of 100 bars – even though higher pressures can easily be done by changing the pressure transducer. A minimum of 10 grams of material should be tested, and can be pelletised in a sample holder of a volume around 68 cm3. In order to be completely rigorous, regular leak tests should be done as well as some measurements of the volume of the pressure vessel and the cylinder. This is in order to ensure that with time the pressure vessel does not degrade and is still completely operational in order to obtain undoubtful scientific results.

Chapter IV The nanostructured carbon materials elaborated and investigated
102
IV THE NANOSTRUCTURED CARBON MATERIALS ELABORATED AND INVESTIGATED
The various carbon nanostructured materials elaborated in the Centre for Energy Studies will
be presented. These materials are elaborated thanks to two different processes: a sol-gel process for the carbon aerogels and a plasma process for the new forms of carbon
nanostructured materials. The nanostructural characteristics of these materials will be given in order to understand why these materials are interesting for being tested as potential
materials for hydrogen storage.

Chapter IV The nanostructured carbon materials elaborated and investigated
103
1 Introduction .................................................................................................................104
2 Carbon aerogels ...........................................................................................................105
2.1 The elaboration process of Carbon aerogels............................................................... 105 2.1.1 The sol-gel reaction ............................................................................................................ 106 2.1.2 The CO2 supercritical drying.............................................................................................. 107 2.1.3 The pyrolysis ...................................................................................................................... 110 2.1.4 Experimental procedure...................................................................................................... 110
2.2 The influence of the chemistry on the microstructure ................................................ 112 2.2.1 Representation of a carbon aerogel .................................................................................... 112 2.2.2 The influence of the R/C ratio and the solid percent .......................................................... 113 2.2.3 The influence of the heat treatment: pyrolysis and activation ............................................ 114
1$$ *$
2.3 Properties and applications of carbon aerogels .......................................................... 116 2.3.1 Properties of carbon aerogels ............................................................................................. 116
/ 4$0 6 (
2.3.2 Applications of carbon aerogels ......................................................................................... 117 2.3.3 Hydrogen storage ............................................................................................................... 118
3 The high temperature plasma process.......................................................................119
3.1 Production of carbon blacks ....................................................................................... 119 3.1.1 Presentation of the initial technology ................................................................................. 119 3.1.2 The operating principle....................................................................................................... 120 3.1.3 Numerical modelling .......................................................................................................... 123
3.2 Adaptation of the plasma technology ......................................................................... 123 3.2.1 Production of carbon fullerenes.......................................................................................... 126 3.2.2 Production of carbon nanotubes ......................................................................................... 126
3.3 Advantages of the plasma process.............................................................................. 127
4 Conclusion ....................................................................................................................128

Chapter IV The nanostructured carbon materials elaborated and investigated
104
,
Now that the experimental set-up has been proven to be valid, the carbon materials that will be tested in the experimental set-up will be presented separately, as they are coming from two different processes: a sol-gel process for the carbon aerogels, and a high temperature process for the nanostructured carbon materials.
With these two families of material, a comparative study will be possible. These two families of carbon come from two different processes and have different general characteristics, with the two essential similarities that they are nanostructured carbon materials. This will enable to evaluate the effect of the nanostructure of the material on the application of hydrogen storage.
Aerogels are porous and high surface area carbon materials, with interconnected networks of particles and pores. The carbon particles themselves are porous and the material consists of a polymeric chain of particles. The tortuosity in the material and the complexity by which these particles are connected to each other make them interesting for the hydrogen storage application, as many adsorption sites are possible.
As observed in the literature review, it has been revealed that materials such as carbon blacks, activated carbons, single and multi walled carbon nanotubes, or carbon nanofibres are materials that are investigated for the application of hydrogen storage. Thanks to its flexibility, the high temperature plasma process enables the production of these materials and of original families of nanostructured carbon materials. These original materials produced may have interesting properties for hydrogen storage. The nanostructural aspect of the material creates an overlapping of the attraction forces required for adsorption, and the tube-like or graphite-like characteristics of these materials may add adsorption sites for hydrogen.
This elaboration process has another major interest for this application, in the sense that it is continuous and allows high production rates of the various families of carbon, thereby making it possible to test a large amount of homogeneous material.

Chapter IV The nanostructured carbon materials elaborated and investigated
105
.$
Aerogels are a unique class of material. They have initially been discovered in the 1930s and thought to have no industrial uses, but with the newly developed varieties, aerogels are beginning to prove their commercial potential. Different types of aerogels are produced these days, depending on whether they are organic or inorganic gels. The structure and properties of organic aerogels are analogous to their inorganic counterparts such as Silica. The materials have continuous porosity, an ultrafine cell/pore size (≤ 50 nm), high surface areas (400-1100 m2/g), and a solid matrix composed of interconnected colloidal-like particles or fibrous chains with characteristic diameters around 10 nm. This nanostructure is responsible for the unique thermal, acoustic, optical, electrical and mechanical properties of aerogels. These general characteristics of aerogels, and more precisely of carbon aerogels make them adequate candidate materials for hydrogen storage, as adsorbents for this application need interesting porosities as well as surface area, and a pore size distribution that tends more to the small size, as macroporosity does not contribute to the adsorption process.
The elaboration process of aerogels is being studied in various laboratories, and a large amount of literature exists on the research held on aerogels and the influence of the various parameters that intervene during the elaboration process.
22..11 TThhee eellaabboorraattiioonn pprroocceessss ooff CCaarrbboonn aaeerrooggeellss
The figure below is a schematic diagram of the various steps involved in the elaboration process of carbon aerogels derived from an organic aerogel. The hydrolysis and condensation of metal alkoxydes has been the traditional synthetic route for the formation of inorganic aerogels (e.g. silica, titania, alumina) [153], and in 1989 R.W. Pekala patented the first organic aerogel based upon the aqueous polycondensation of resorcinol with formaldehyde [154,155,156]. It is this synthetic route that has been used in the laboratory.
solvent : water
T~1323 K CO 2 supercritical conditions
solvent : water
T~1323 K CO 2 supercritical conditions
Figure IV-1 Schematic diagram of the different steps required for the formation of a carbon aerogel [157]
The elaboration occurs through three different steps : the initial sol-gel chemical reaction where the crosslinked polymer and the wet resorcinol-formaldehyde gel is formed, a solvent exchange can be required depending on the solvent used, the drying of the gel saturated with solvent and finally the pyrolysis of the organic gel to a carbon aerogel. Every step in the process influences the final structure of the material, and we shall briefly try to explain how these materials are made.

Chapter IV The nanostructured carbon materials elaborated and investigated
106
2.1.1 The sol-gel reaction
The aqueous polycondensation of resorcinol (1,3 dihydroxybenzene - R), with formaldehyde (F) under alkaline conditions proceeds through a sol-gel transition and results in the formation of highly crosslinked gels. In this work, the two initial precursors used are resorcinol and formaldehyde, but other precursors can be used, such as melamine and formaldehyde or phenol and furfural [158], to form organic aerogels. The major requirements for an organic aerogel reaction, and more precisely for the precursors, includes the presence of a multifunctional monomer and the ability to achieve a high crosslink density. The sol-gel polymerisation with the phenolic furfural reaction has the major advantage that it can be conducted in alcohol (such as 1-propanol), thereby eliminating the need for a solvent exchange (refer to section 2.1.2) prior to the supercritical drying from carbon dioxide.
The reaction of resorcinol with formaldehyde occurs with a molar ratio of 1:2 (1 mole of resorcinol for 2 moles of formaldehyde) and Sodium Carbonate (Na2CO3) is used as a base catalyst. Resorcinol serves as a trifunctional monomer capable of electrophilic aromatic substitution in the activated 2, 4 and 6 ring positions. Formaldehyde is difunctional and forms covalent bridges between the resorcinol rings leading to high crosslinking densities. The major reactions between resorcinol and formaldehyde include an addition reaction to form hydroxymethyl derivatives of resorcinol and a condensation reaction of the hydroxymethyl derivatives to form methylene and methylene ether bridges, as shown on the following figures below.
In the addition reaction, the catalyst sodium carbonate plays an important role as it promotes the formation of the resorcinol anion by hydrogen abstraction. At the beginning of the reaction, both uncharged resorcinol molecules and a small percentage of charged resorcinol anions exist.
Hydroxymethyl derivative
FormaldehydeResorcinol
2 CH2OH + Na2CO3
OH
OH
C
HH
+
OHO-
OH
CH2OH
OH
OHCH2OH
+ H+
Hydroxymethyl derivative
FormaldehydeResorcinol
2 CH2OH + Na2CO3
OH
OH
C
HH
+
OHO-
OH
CH2OH
OH
OHCH2OH
+ H+
Compared to the uncharged resorcinol molecules, resorcinol anions are more reactive towards the
addition of formaldehyde to form the hydroxymethyl derivatives, which are the critical monomers for further polymerisation. Upon the formation of the hydroxymethyl derivatives, the condensation reaction proceeds via the protonic hydrogen H+ that acts as a catalyst.
This condensation leads to surface functionalised polymer “clusters” with diameters of 7 to 10 nm depending on the amount of catalyst. The stabilisation of these “clusters” has been favoured by the solvent-polymer and ionic interactions.
Methylene bridge
Methylene ether bridge
∆
OH
OHCH2
+
CH2+
+
CH2OHOH
OHCH2OH
3
CH2OHOH
OHCH2OH
2
OH
CH2OH
OH OH
OH
CH2
CH2
CH2OH
O
CH2
OH
CH2OH
CH2OH
2 OH-+
Methylene bridge
Methylene ether bridgeMethylene ether bridge
∆
OH
OHCH2
+
CH2+
+
CH2OHOH
OHCH2OH
3
CH2OHOH
OHCH2OH
2
OH
CH2OH
OH OH
OH
CH2
CH2
CH2OH
O
CH2
OH
CH2OH
CH2OH
2 OH-+
In the presence of a proton, the hydroxymethyl derivatives of resorcinol lose their -OH group to
form a benzyl-type cation as seen on the figure above. This cation then undergoes an electrophilic reaction with the benzene ring of a resorcinol molecule with hydroxymethyl derivatives, to connect the two benzene rings with a methylene bridge. Pekala et al. [159] also proved that the cation can react

Chapter IV The nanostructured carbon materials elaborated and investigated
107
with a hydroxymethyl group of another molecule to form a methylene ether bridge.
These “clusters” crosslink to form gels through the condensation of surface functional groups, such as hydroxymethyl (-CH2OH) species, to form a three-dimensional cross-linked polymer.
Crosslinked polymer
OH
OH
OH
CH2
OH
O
CH2
OH
CH2
OH
CH2
OH
OH
CH2OH
CH2OH
CH2
OH
OH
CH2
OH
CH2
OHCH2
OH
O
OH
CH2
OH
O
CH2
∆
Crosslinked polymer
OH
OH
OH
CH2
OH
O
CH2
OH
CH2
OH
CH2
OH
OH
CH2OH
CH2OH
CH2
OH
OH
CH2
OH
CH2
OHCH2
OH
O
OH
CH2
OH
O
CH2
∆
The sodium carbonate as a base catalyst and the proton as a acid catalyst play important roles in the
addition and the condensation reactions. Varying the synthesis pH of the initial solution can affect the surface area, the pore volume and the structure of the organic gel and the carbon xerogel [160] due to the change in concentration of the protons in the solution. If the pH is too low precipitation occurs and if the pH is too high the condensation is hindered.
When the gelation reaction has finished the material becomes a resorcinol-formaldehyde gel (RF gel), consisting of a three-dimensional cross-linked polymer saturated with the water solvent [161].
2.1.2 The CO2 supercritical drying
At this point of the elaboration, the solvent in the wet gel is water. The following step for the elaboration of an organic gel is to dry the wet RF gel by extracting the solvent present in the gel, and preserving the gel structure. Various routes are possible in drying the wet RF gel: the conventional drying, cryo-drying or the supercritical drying. The last one seems the most appropriate in keeping the initial nanostructure.
Figure IV-2 Different drying techniques
If we consider the left hand side of the figure above, the conventional drying consists in leaving the solvent evaporate from the gel. This can be done in various conditions of temperature and under a specific gas flow, or can simply be done by the evaporation of the solvent in air in ambient conditions
LV : liquid-vapor surface tension
θγ cos2 LVRP −=∆
Solvent
Air
F∆ F∆
Solid skeleton
Solid skeleton
Fracture development
2.R
θ θ
LV : liquid-vapor surface tension
θγ cos2 LVRP −=∆
Solvent
Air
F∆ F∆
Solid skeleton
Solid skeleton
Fracture development
2.R
θ θ
θγ cos2 LVRP −=∆
Solvent
Air
F∆ F∆
Solid skeleton
Solid skeleton
Fracture development
2.R
θ θ
Solvent
Air
F∆ F∆
Solid skeleton
Solid skeleton
Fracture development
2.R
θθ θθ
SolventCritical Temperature
(°C)Critical Pressure
(bars)
Water 374 220
Methanol 240 79.3
Ethanol 243 63.6
Acetone 235 46.3
CO2 31 73.8

Chapter IV The nanostructured carbon materials elaborated and investigated
108
[160,162,163,164]. In the case of the conventional route, the final material is called a xerogel, and the main advantage of this drying technique is the cost, which is negligible compared to the supercritical drying that will be explained later. The xerogel has an internal structure which has changed from the initial gelation, as the evaporation of the gel produces internal cracks, disrupting the structure.
Generally [165], if the solvent is simply evaporated from the pores, large capillary forces are exerted and a collapsed structure is formed due to the solid-liquid interface between the solvent and the solid gel skeleton. The pressure induced by this interface created during the solvent evaporation is
( )cosR2P LV −= equation IV-1
where is the wetting angle, R the pore radius and LV the liquid-vapour surface tension. This pressure is all the more important that the pore radius is small, which explains the complexity of the drying process of nanostructured materials.
In order to preserve the gel skeleton and minimize shrinkage, the solvent has to be removed from the internal porosity without disrupting the internal structure of the gel. This is done in a two step process in order to perform the second drying route, the supercritical drying. The interest in the supercritical drying resides in the fact that the liquid-vapour surface tension does not exist anymore, and no more meniscus is formed between the two phases, and hence no more fractures appear in the dried material if the drying has been properly done, with no residual solvent remaining.
The issue in this case is to find a solvent other than water that is miscible with supercritical carbon dioxide. Supercritical CO2 is used for the drying of the wet RF gels as it has critical conditions that are the easiest and less extreme to reach. As seen on the right hand side of the Figure IV-2 the critical temperatures for various solvents are extremely high (around 230-380°C) while the critical conditions for CO2 are reasonable : a critical temperature of 31°C and a critical pressure of 73.8 bars.
Because water is poorly soluble in CO2 the drying time would be extremely long and not always efficient enough as there is danger that some water remains in the gel structure after the CO2 supercritical drying. Therefore, prior to the supercritical drying, the solvent in the wet RF gels is being exchanged with acetone which is very soluble in supercritical CO2. In order to do this, the RF gels are placed in an acetone rich bath for a week which is regularly replaced in order to keep the concentration of acetone in the bath greater than the concentration of acetone in the gel, such that the difference in concentration promotes the solvent exchange. The solvent exchange is done through diffusion of the acetone in the RF gel and the replacement of the water by acetone. To accelerate the diffusion of water in the gel the acetone can be heated. It is also possible to introduce a small amount of trifluoroacetic acid (~0.1%) in the first fresh acetone bath in order to promote further crosslinking of hydroxymethyl groups within the gel. The wet RF gels can also be produced directly in the solvent acetone, which modifies the materials structure [166,167], but eliminates the solvent exchange step, reducing the overall elaboration time.

Chapter IV The nanostructured carbon materials elaborated and investigated
109
The figure below shows the diagram of the experimental apparatus available in the laboratory for the CO2 supercritical drying of the wet RF gels.
Figure IV-3 Schematic diagram of the supercritical drying experimental set-up
The gels are placed in the 1 L pressure vessel, which is then sealed. In ambient conditions carbon dioxide is gaseous. It becomes supercritical when the temperature is greater than 31.06°C and the pressure above 73.8 bars. Initially the gaseous CO2 is at 15 bars. It then enters an air compressor that compresses the gas above the critical pressure and the gas is heated at the same time above the critical temperature, such that when it enters the pressure vessel in which the aerogels were previously placed, the carbon dioxide is supercritical. The processing conditions for the supercritical drying is about 80 bars and 35°C, in order to keep a certain margin with respect to the critical conditions for the gas.
The following work by Liang et al. [168] indicates that RF aerogels can be produced by supercritical acetone drying. A pre-pressure of initial nitrogen greatly improves the performance by preserving the texture of the organic gel during the drying process. The suitable temperature and pressure of supercritical acetone drying can avoid the collapse of the organic gel structure during the drying process, and the chemical composition and the morphology of the organic aerogel prepared by supercritical acetone drying are similar to those of the RF aerogel prepared by supercritical CO2 drying, but the pore/cell size is larger. The drying conditions for supercritical acetone drying are harsher with a temperature of 240°C and a pressure of 50 bars.
Tc
Solid phase
Liquid phase
Supercritical phase
Vapor phase
Temperature
Pressure
Pc
SC drying stage
Tc
Solid phase
Liquid phase
Supercritical phase
Vapor phase
Temperature
Pressure
Pc
SC drying stage
Figure IV-4 CO2 supercritical drying path

Chapter IV The nanostructured carbon materials elaborated and investigated
110
On the figure above, the graph shows the pressure and temperature of the gas and a typical experimental path taken by the temperature and pressure of the carbon dioxide in the pressure vessel filled with the gels. Once the carbon dioxide is supercritical the solvent is flushed from the gel and can be recovered. It is then possible to analyse the acetone recovery in order to study the drying process by determining the acetone concentration. The greatest amount of acetone is recovered in the early stages of the drying, and the last remaining volume of acetone is the hardest to recover as it is the acetone trapped in the smallest pores of the gel. The entire process of drying lasts for around 6 hours, depending on the gel structure that depends on the initial sol-gel reaction and the various concentrations in catalyst and precursor.
When it is considered that the entire volume of acetone is recovered, the system is slowly depressurised overnight at a constant temperature above the critical temperature in order to prevent the carbon dioxide in the pressure vessel to turn liquid. Once the atmospheric pressure has been reached the heating elements are switched off and the temperature decreases down to room temperature.
When the solvent has then been removed under CO2 supercritical conditions, the nanoporous material that results from this is an organic aerogel, in which the internal structure has been preserved from the wet RF gel. The following stage to the elaboration of the carbon aerogel is the pyrolysis of the organic aerogel.
2.1.3 The pyrolysis
Because resorcinol-formaldehyde aerogels consist of a highly crosslinked aromatic polymer, they can be pyrolysed in an inert atmosphere to form vitreous carbon monoliths. Once the gel has been dried under CO2 supercritical conditions, the carbon aerogels can be derived via the pyrolysis of the organic aerogel precursors. The morphology on the mesoscopic scale is conserved upon pyrolysis, and the resultant porous material is black in colour and no longer transparent, yet it retains the ultrafine cell size (<50 nm), high surface area (600-1100 m²/g), and the interconnected particle morphology of the organic precursor.
The pyrolysis is carried out in an inert atmosphere, generally nitrogen, at a high temperature, generally at 1050°C, with the final carbon aerogel being around 95% pure. The mass loss occurs in the temperature range of 300 to 1000°C and is caused by the emission of volatile decomposition products. Between temperatures of 30°C and 120°C the adsorbed molecules are eliminated and water evaporated, from 120°C up to 600°C the oxygenated and hydrogenated derivatives are eliminated (-OH, -CH2-O-CH2 etc.) and for temperatures greater than 600°C the CH2 bondings are eliminated [169]. Between the organic and the carbon stage the density of the material increases and can even double depending on the composition. The main difference between the organic precursor and the resulting carbon aerogel lies on the evolution of microstructures.
The internal properties of the carbon aerogels and xerogels primarily depend upon the polymerisation conditions and pyrolysis temperature. The materials properties are closely related to the experimental conditions of the elaboration of the aerogels and a comprehension of the chemistry of the elaboration of the aerogels is required in order to prepare the best required material for a specific application.
2.1.4 Experimental procedure
The aim of this paragraph is to allow the reader to reproduce the entire synthesis, which is based on the “Pekala method [161]” explained in section 2.1 and consists in four essential steps.
The first step being the polycondensation in sealed glass vials of the precursors in the presence of a base catalyst with a thermal activation: 85°C when the solvent used is water and 45°C when the solvent is acetone. Depending on the percentage of solid and catalyst, gelation time varies from several hours to days, and the thermal activation is prolonged for about one week in order to allow an easier manipulation of the gels.
The experimental protocol consists in preparing:

Chapter IV The nanostructured carbon materials elaborated and investigated
111
a precursor solution (S) based on Resorcinol (Labosi) and Formaldehyde (Labosi 35%) prepared with a molar ratio of 1:2
a solution with the catalyst (C) sodium carbonate (Na2CO3) solubilised in distilled water a solvent (water or acetone)
By mixing relative proportions of these three constituents we are able to prepare materials with:
a well defined molar ratio (R/C) which is the ratio of the number of moles of resorcinol (taken from solution S) over the number of moles of the catalyst taken from solution C.
a specific percentage of solid (% sol). This ratio is calculated by dividing the added masses of resorcinol, formaldehyde and the catalyst over the total mass of solvent (provided from the solution C, the solution S and the mass of solvent).
For example, for an aerogel with a molar ratio of R/C of 50 and a percentage of solid in the solution of 35% prepared with an aqueous solvent then:
The prepared solution S contains 140 grams of resorcinol diluted with 200 cm3 of formaldehyde. The solution C consists of the dilution of 2g of Na2CO3 in 20 cm3 of distilled water, given a molar concentration of the catalyst of 9.43*10-4 mol per cm3. In order to respect the molar ratio of resorcinol to catalyst (R/C) the volume of the solution C of known concentration of catalyst has to be determined and mixed with the solution S (resorcinol and formaldehyde). In this example, a volume of 13.1 cm3 of C has been mixed in 150 cm3 of the solution S. Once the ratio R/C has been properly established, the volume of solvent to be added has to be calculated in order to obtain the required percentage of solid in the solution (total mass = mresorcinol + mformaldehyde + mcatalyst). In our case a volume of 117 cm3 of solvent in a solution containing 150 cm3 of resorcinol and formaldehyde mixed with 13.1 cm3 of catalyst, enables to obtain a percentage of solid in solution of 35%. All the solutions have been properly agitated during the entire synthesis.
During the next step the obtained gels go through a solvent exchange, when the solvent is water but this step is avoided when acetone solvent is used. This consists of plunging the gels in a bath of an organic solvent (acetone) for several days. The actual solvent in the gels exchanges with the organic solvent by a simple diffusion process due to a difference in concentration between the two media. The concentration of the organic solvent in the bath is increased as the solvent exchange is performed.
The third step is the CO2 supercritical drying in order to extract from the pores the residues of the reaction as well as the solvent in order to end up with a porous dry material, an organic aerogel. This technique, as explained earlier, prevents the collapse of the internal structure of the gel that could be initiated due to the presence of flaws coming from the capillary forces. These capillary forces usually come from the liquid-vapour interface between the solvent and the atmosphere. The CO2 supercritical extraction takes place in a 1 L pressure vessel.
The final step of the process is the high temperature pyrolysis. Upon the pyrolysis, the carbon skeleton preserves the porous structure similar to the organic aerogel and is named a carbon aerogel. The organic aerogel is heated up to 1050°C under a constant nitrogen gas flow at 50 mL/min and with a specific cycle, shown in the figure below, which has been applied for every sample in our study.

Chapter IV The nanostructured carbon materials elaborated and investigated
112
0
200
400
600
800
1000
0 200 400 600 800 1000 1200 1400 1600 1800Time (min)
Tem
pera
ture
(°C
)heating slope 4°C/min
250
1050
heating slope 1°C/min
120 min
30 min
constant nitrogen flow : 50 mL/min
Figure IV-5 Typical time temperature curve for the pyrolysis of the organic gels
The initial temperature rise is done at a slope of 1°C per minute, until a temperature of 250°C is reached. The sample is kept at that temperature for 2 hours in order to keep the entire system in thermal equilibrium. The sample is then heated to 1050°C at a heating rate of 4°C/min and kept there for a pyrolysis time of 30 minutes. Once the pyrolysis is finished the heating module is switched off and the return to room temperature is done under the own thermal mass. Once the temperature in the furnace has reached 200°C, the nitrogen gas flow is stopped and the door of the furnace opened in order to increase the rate of return to the room temperature.
22..22 TThhee iinnfflluueennccee ooff tthhee cchheemmiissttrryy oonn tthhee mmiiccrroossttrruuccttuurree
As seen from the previous paragraphs, many parameters in the elaboration process of the carbon aerogels influence the final microstructure: the type of precursors, the catalyst, the solvent and the various proportions of every element, the solvent exchange process and finally the pyrolysis, with the pyrolysis temperature and time. All theses elements contribute to the elaboration process and to the final microstructure of the carbon aerogels.
2.2.1 Representation of a carbon aerogel
Carbon aerogel have been modelled [170] as a structure consisting of a highly porous three-dimensioning network made up of interconnected, roughly spherical carbon particles. The packing density of the particles determines the properties of these highly porous, up to 95%, materials.
Figure IV-6 below is a schematic representation of the microstructure of a carbon aerogel, for either a low or a high-density aerogel. The microstructure reveals important microstructural elements such as the mesopores that span the distance between chains of interconnected particles (a), the micropores sandwiched between particles which only appear in high density aerogel (b), the individual particles (c), the micropores within the particles (d) and finally the micropores between contiguous particles (e).

Chapter IV The nanostructured carbon materials elaborated and investigated
113
Figure IV-6 Schematic representation of the carbon aerogel microstructure [171]
As seen above, the material consists of interconnected chains of particles. The final properties of the material depend on the stacking and the distribution of these particles and chains. Particles that stick closer to each other create a larger amount of micropores as there is less space available. By comparing the low and the high density aerogel, due to the close packing of the particles in the high density aerogel a greater amount of micropores is present, especially those sandwiched between the particles. The other form of microporosity present is the one in the particles themselves, created during the sol-gel process, and dependent on the reaction kinetics. It should be noted that two types of porosity exist in the aerogel: the open and the closed microporosity. The closed microporosity is not accessible by any gas and this type of microporosity is generally created when the density of the material increases to a level where the particles stick so close to each other that they close the porosity. If the open porosity is measured through gas adsorption, the closed porosity is measured with the small angle X-ray scattering technique.
The structure of carbon aerogels has been investigated using SAXS [166,172], nitrogen sorption, Raman scattering, x-ray diffraction and various microscopy methods. All these methods have been widely used in order to study the influence of every parameter on the final structure of the carbon aerogel.
2.2.2 The influence of the R/C ratio and the solid percent
The arrangement of the particles and the packing density of these particles is decisive concerning the porosity, the pore size distribution and consequently the specific surface area of the carbon aerogel.
If we consider a study by Bock and co-workers [181] we can see that for a series of samples produced with the same R/C ratio, the greater the solid percent, the concentration of monomer, the denser the material. For a similar volume the greater the amount of solid material in the volume the denser it is. With the increase of the particle packing density comes a decrease in the maximum pore diameter. The Figure IV-7 below shows that at constant pyrolysis temperature (1050°C) and at a fixed R/C of 200, the size of the micropores and mesopores decreases with the increasing density, and increasing monomer concentration.

Chapter IV The nanostructured carbon materials elaborated and investigated
114
0,64
0,66
0,68
0,70
0,72
0,74
0,76
0,78
0 0,2 0,4 0,6 0,8 1
Aerogel bulk density (g.cm-3)
Avg
. Mic
ropo
re s
ize
(nm
)
0
5
10
15
20
25
30
Avg
. Mes
opor
e si
ze (n
m)
Micropore size (nm)Mesopore size (nm)
for R/C=200 and Tpyrolysis=1050°C
Figure IV-7 The pore size variation with the aerogel density [164,173]
The resorcinol/catalyst ratio is the dominant factor which affects the density, the particle size, the surface area, and the mechanical properties of both RF and carbon aerogels. Images through TEM have shown that these materials are composed of interconnected colloidal-like particles derived from the clusters formed during the sol-gel polymerisation.
By changing the molar ratio of resorcinol to catalyst (R/C), the microstructure can be varied [164,174]. Under high catalyst conditions (i.e. R/C=50), a polymeric carbon aerogel is observed, whereas a colloidal carbon aerogel is observed under low catalyst concentrations (i.e. R/C=200 and 300). Colloidal carbon aerogels consist of well-defined spherical particles which have diameters between approximately 12 nm and 15 nm containing loosely connected graphitic ribbons, while the polymeric carbon aerogel consists of smaller (7 to 9 nm in diameter) non-distinct particles in a well-connected configuration. Similar observations have been made in the literature for the organic resorcinol formaldehyde aerogels. Two types of disorder can be defined, either a mesoscopic disorder related to the granularity of the material, or the microscopic disorder related to the structural defects within the grain, such as dangling bonds. Polymeric carbon aerogels with high catalyst concentration are more disordered, in the two sense, than the colloidal carbon aerogel.
With increasing ratios of R/C it appeared that the pore size increased [173] and that the total contribution to the pore volume shifted towards the bigger pores for the carbon aerogel. In parallel to this, the particle size increased with increasing R/C ratios, for both the organic RF and the carbon aerogels. This is due to the fact that the polycondensation reaction begins only at a few sites within the solution, and these initial nuclei are able to grow until all monomer is consumed.
The amount of shrinkage after drying depends on the catalyst level used to prepare the RF aerogels. For a given formulation, greater shrinkage was experienced at the higher catalyst concentration (low R/C). This relationship suggests that there are differences in the size, distribution, interpenetration and chemical linking of the RF “clusters” depending upon reaction conditions [175].
Whilst the influence of the drying technique has been briefly explained, the next influencing step is the heat treatment on the organic gel and on the carbon aerogel, might it be the pyrolysis or the activation.
2.2.3 The influence of the heat treatment: pyrolysis and activation
2.2.3.a Pyrolysis of organic gels
The pyrolysis is a process done at high temperature in an inert atmosphere, usually under a nitrogen flow, that transforms the organic gel to a carbon aerogel in a specific cycle. Due to the burnout during pyrolysis (around 50% depending on the composition) a densification of the material occurs, and as a consequence of this, the average pore size diameter decreases, and this, whatever the temperature used. The pyrolysis creates micropores in the bigger particles which greatly contribute to the total surface area of the carbon aerogel. As observed through SAXS measurements [176], changes occur at
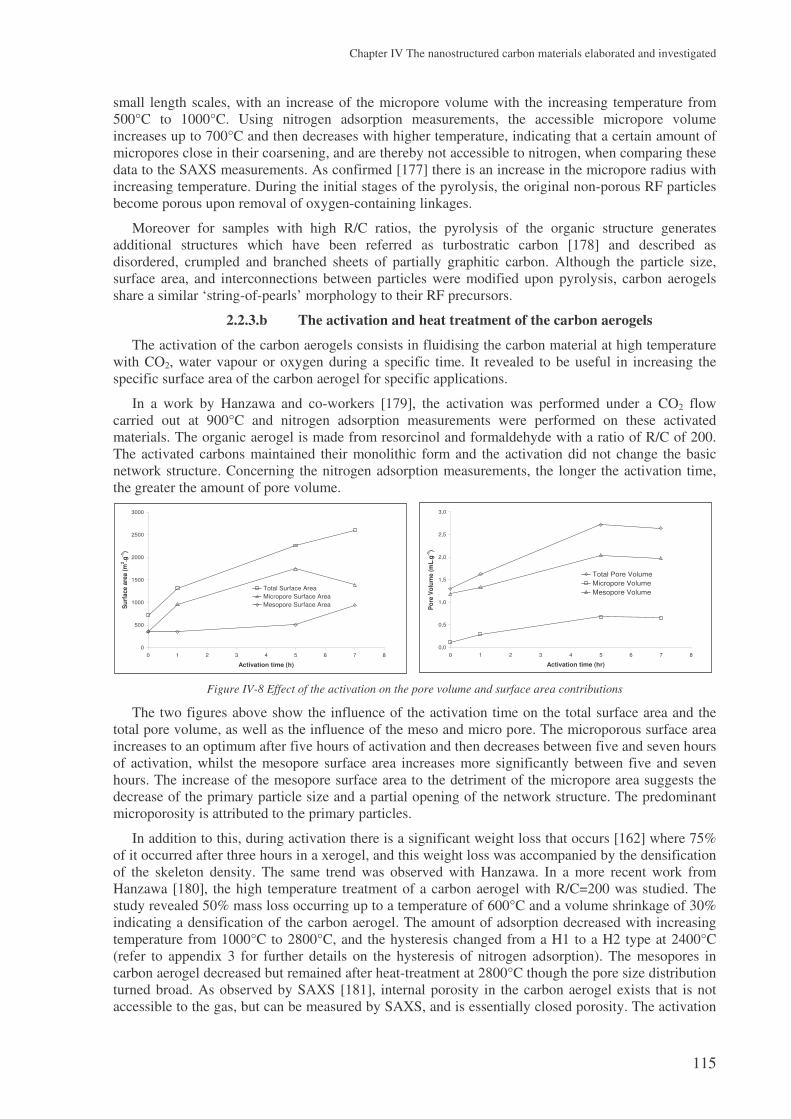
Chapter IV The nanostructured carbon materials elaborated and investigated
115
small length scales, with an increase of the micropore volume with the increasing temperature from 500°C to 1000°C. Using nitrogen adsorption measurements, the accessible micropore volume increases up to 700°C and then decreases with higher temperature, indicating that a certain amount of micropores close in their coarsening, and are thereby not accessible to nitrogen, when comparing these data to the SAXS measurements. As confirmed [177] there is an increase in the micropore radius with increasing temperature. During the initial stages of the pyrolysis, the original non-porous RF particles become porous upon removal of oxygen-containing linkages.
Moreover for samples with high R/C ratios, the pyrolysis of the organic structure generates additional structures which have been referred as turbostratic carbon [178] and described as disordered, crumpled and branched sheets of partially graphitic carbon. Although the particle size, surface area, and interconnections between particles were modified upon pyrolysis, carbon aerogels share a similar ‘string-of-pearls’ morphology to their RF precursors.
2.2.3.b The activation and heat treatment of the carbon aerogels
The activation of the carbon aerogels consists in fluidising the carbon material at high temperature with CO2, water vapour or oxygen during a specific time. It revealed to be useful in increasing the specific surface area of the carbon aerogel for specific applications.
In a work by Hanzawa and co-workers [179], the activation was performed under a CO2 flow carried out at 900°C and nitrogen adsorption measurements were performed on these activated materials. The organic aerogel is made from resorcinol and formaldehyde with a ratio of R/C of 200. The activated carbons maintained their monolithic form and the activation did not change the basic network structure. Concerning the nitrogen adsorption measurements, the longer the activation time, the greater the amount of pore volume.
Figure IV-8 Effect of the activation on the pore volume and surface area contributions
The two figures above show the influence of the activation time on the total surface area and the total pore volume, as well as the influence of the meso and micro pore. The microporous surface area increases to an optimum after five hours of activation and then decreases between five and seven hours of activation, whilst the mesopore surface area increases more significantly between five and seven hours. The increase of the mesopore surface area to the detriment of the micropore area suggests the decrease of the primary particle size and a partial opening of the network structure. The predominant microporosity is attributed to the primary particles.
In addition to this, during activation there is a significant weight loss that occurs [162] where 75% of it occurred after three hours in a xerogel, and this weight loss was accompanied by the densification of the skeleton density. The same trend was observed with Hanzawa. In a more recent work from Hanzawa [180], the high temperature treatment of a carbon aerogel with R/C=200 was studied. The study revealed 50% mass loss occurring up to a temperature of 600°C and a volume shrinkage of 30% indicating a densification of the carbon aerogel. The amount of adsorption decreased with increasing temperature from 1000°C to 2800°C, and the hysteresis changed from a H1 to a H2 type at 2400°C (refer to appendix 3 for further details on the hysteresis of nitrogen adsorption). The mesopores in carbon aerogel decreased but remained after heat-treatment at 2800°C though the pore size distribution turned broad. As observed by SAXS [181], internal porosity in the carbon aerogel exists that is not accessible to the gas, but can be measured by SAXS, and is essentially closed porosity. The activation
0,0
0,5
1,0
1,5
2,0
2,5
3,0
0 1 2 3 4 5 6 7 8
Activation time (hr)
Pore
Vol
ume
(mL.
g-1)
Total Pore VolumeMicropore VolumeMesopore Volume
0
500
1000
1500
2000
2500
3000
0 1 2 3 4 5 6 7 8
Activation time (h)
Surf
ace
area
(m2 .g
-1)
Total Surface AreaMicropore Surface AreaMesopore Surface Area

Chapter IV The nanostructured carbon materials elaborated and investigated
116
of the carbon aerogel can open this porosity which could contribute to the increase in the microporous volume.
0
500
1000
1500
2000
2500
3000
0 10 20 30 40 50 60
Burn-off (%)
Sur
face
are
a (m
2 /g)
BET
SAXS
inaccessible surface area by the gas
increasing activation time
RF Carbon Aerogel R/C=1500 and % Sol=30
Figure IV-9 Comparison of surface area using SAXS and BET versus burn-off [176]
The discrepancy in surface areas observed from nitrogen adsorption and SAXS that is evident after pyrolysis is diminishing after increasing burn-off, and for burn-offs greater than 50% both experimental techniques yield the same surface area. This can be explained by the increase in the skeleton density and by the pore opening due to the removal of less ordered carbon in initial stages, and at the same time, as observed by SAXS, new pores are generated. It should also be observed that only at high degrees of burn-off, obtained for high activation times or high temperatures, is there a degradation of the particle size affecting the mesostructures.
The activation of the carbon aerogels has a major effect on the porosity and surface area of the material, and is an additional step in the elaboration of the carbon aerogels that has to be taken into account in order to elaborate a material for a specific application.
22..33 PPrrooppeerrttiieess aanndd aapppplliiccaattiioonnss ooff ccaarrbboonn aaeerrooggeellss
Aerogels have a continuous porosity, an ultrafine sub-micron cell/pore size and a high, accessible surface area. The tenuous network is composed of spherical particles or platelets, responsible for their unique thermal, acoustic, optical, dielectric and mechanical properties. For aerogels with a conducting skeletal material like carbon, an additional electronic conductivity is established, which is the basis for many applications of carbon aerogels. Aerogels can be produced in almost arbitrary monolithic shape.
Also, property to structure relationships of carbon aerogels have been studied in detail, such as the thermal conductivity [182,183], the Young's modulus [155,181], the electrical conductivity [174] and the gas permeability. For electrochemical applications, such as electrodes for fuel cells [184], carbon aerogels make use of the high electrical conductivity and the large specific surface area. The large infrared optical absorption coefficient makes carbon aerogels promising materials for high temperature thermal insulation.
2.3.1 Properties of carbon aerogels
2.3.1.a Mechanical, thermal and gas transport properties
• The elastic modulus of cellular foams (e.g. expanded polystyrene (EPS) foams) scales with the second power of density, where the dominant deformation mechanism is bending of the beams or struts that represent the basic units of the skeleton. Aerogels which are structurally less efficient than foams show a considerably stronger variation of modulus with density
αρ∝E with α ≥ 2

Chapter IV The nanostructured carbon materials elaborated and investigated
117
• In monolithic aerogels, the total thermal conductivity can be described as the sum of the gaseous thermal conductivity λg, the solid thermal conductivity λs via phonons, the thermal conductivity via electrons λe and the radiative thermal conductivity λr :
resgtotal λλλλλ +++=
In such systems, coupling between the different heat transfer modes is negligible [183]. Convection of the gas within the pores is completely suppressed, and for aerogels with high mass specific infrared-optical extinction (e.g. carbon aerogels), the radiative thermal conductivity is negligible. Electronic contributions only have to be taken into account for aerogels with conducting backbone materials. The solid thermal conductivity of structurally equivalent aerogels scales with density
βρλ ∝s with β∼1.5
• At given porosity, aerogels are less permeable than other open cell foams because of the very fine pore channels. Many applications for aerogels deal with mass transport through or into the interconnected pores, a property which can be quantified by the diffusion coefficient or equivalently the permeability. In a zero order approximation the voids within the aerogels can be described in terms of a capillary model, i.e. independent, parallel tubes. The permeability P is then a function of the porosity, the capillary diameter, the viscosity of the fluid, and the average gas pressure at which the transport takes place.
In addition, the tortuosity τ accounts for the fact that the transport channels might not be parallel to the pressure gradient so that the molecules have to take detours compared to the shortest path L’ (τ=L/L’).
2.3.1.b Electrical and electrochemical properties
The exceptional high conductivity of carbon aerogels, in contrast to loosely bonded carbon powders or activated carbon fibre cloths, is due to its monolithic structure which is composed of covalently-bonded carbon particles. Electrical conductivity takes place by both the drift of delocalised charge carriers within the carbon particles and the transfer of carriers from one large conducting segment to another by hopping or tunnelling.
As expected, the electrical conductivity increases with density and it was shown that the electrical conductivity of aerogels σel shows the following scaling behaviour t
el k ρσ .= where ρ is the density
and the coefficient k depends on the particle interconnectivity. For constant density and room temperature the electrical conductivity decreases with the R/C ratio. Structurally this means that the conductivity depends on the interconnectivity and the volumetric fraction of the solid phase available for the charge transport.
A treatment at high temperature additionally increases the electrical conductivity. The increase in conductivity is attributed to the extension of the graphene layers and less inter-particle resistance at point contacts between graphitic structures. The electrical conductivity generally decreases with ambient temperature and drastically drops for temperatures below -173°C.
2.3.2 Applications of carbon aerogels
Carbon aerogels have specific applications concerning supercapacitors due to their unusual dielectric properties, such as low dielectric constants, low loss tangents, and controllable thermal expansion properties. They can also be used as electrodes in the capacitive deionisation process as they have excellent stability in harsh chemical conditions and a very high specific surface area. Due to their large specific surface area and their high electrical conductivity carbon aerogels are very promising materials for electrodes in electrochemical double layer capacitors (EDLC). These devices store charge at a polarized solid/electrolyte interface, resulting in the storage of energy in the space charge region. Carbon aerogels provide an ideal electrode material, because of their low electrical resistance, controllable pore size and high volumetric surface areas.

Chapter IV The nanostructured carbon materials elaborated and investigated
118
In contrast to electrodes made from compacted carbon powders, the activation energy for transport between carbon particles is relatively small in the carbon aerogels, resulting in super-capacitors with potentially high power densities. The effects of the organic RF precursor and processing conditions on electrochemical performance in aqueous and organic electrolytes have been examined by the Pekala group in 1995 at Lawrence Livermore National Laboratories. The specific capacitance of carbon aerogels in organic electrolyte in general shows a similar trend but the magnitude of the capacitance is by a factor of 0.3-0.5 lower. Thin monolithic carbon aerogels are considered promising electrodes in super-capacitors with power densities >10 kW/kg.
2.3.3 Hydrogen storage
Our main interest in aerogels resides in their interesting characteristics for hydrogen storage by adsorption, as these materials exhibit high surface areas, extreme porosities, and very low densities. In a report dated from August 1995, the Sandia National Laboratory in the United States made different experiments on carbon adsorbents and more precisely on carbon aerogels. They were able to adsorb hydrogen with a gravimetric density of 3.7 wt% at a pressure of 83 bars. The measurement or the elaboration conditions were not given and since this report, no other data on hydrogen adsorption on carbon aerogels has been found or made available. The table below resumes the results found on these materials:
Aerogel Composition
Bulk density (g.cm-3)
Pyrolysis temperature (°C)
Wt. % kg(H2)/m3
RF - Carbon 0.149 1050 5.87 9.3
RF - Carbon 0.284 1050 3.56 10.5
RF - Carbon 0.637 1050 3.19 21
PF - Carbon 0.422 1050 2.12 9.1
PF - Carbon 0.547 1050 2.25 12.6
PF - Carbon 0.742 1050 1.46 11
RF 0.106 - 16.75 21.3
RF 0.193 - 4.5 9.1
RF 0.411 - 4.4 19 Table IV-1 Results of hydrogen storage for organic RF and carbon aerogels [175]
Considering the results above and those presented in the literature review, the amount of hydrogen stored in these carbon aerogels seems extremely high. These results have been presented in 1995, date at which the enthusiasm on the hydrogen storage prevailed over the rigorous study of the experimental measurements. These results have never been confirmed nor further developed. It should be noted that even if no results have been published on the hydrogen storage in carbon aerogels, a few laboratories exist [185,186,187] that have two main thematic, hydrogen storage and carbon aerogels.

Chapter IV The nanostructured carbon materials elaborated and investigated
119
$
As described in the literature review, nanostructured carbon materials such as nanotubes and nanotube derived carbons, have been widely tested for hydrogen storage and extreme discrepancies exist on their ability to store hydrogen. It has already been shown that the experimental set-up elaborated at the Centre for Energy Studies is appropriate and valid in measuring the hydrogen storage capacities at 25°C and pressures up to 100 bars of carbon adsorbents, considering a large amount of material is available to be tested.
A new original high temperature plasma process has been developed at the Centre for Energy Studies [188,189], in collaboration with the CNRS and Erachem-Europe over the past ten years thanks to different partners and European projects. The purpose of the initial technology was to create an environmentally friendly plasma process for the production of new grades of carbon blacks, by replacing the incomplete combustion into a direct splitting of the hydrocarbon into carbon and hydrogen thanks to an external electrical supply.
Later, this technology was adapted to allow the injection of solid carbon particles, adapted for the production of fullerenes. Finally, by adding some appropriate metal catalysts to this carbon powder feedstock, it was demonstrated that new grades of nanostructured carbon materials could be produced.
The process is very flexible concerning the operating conditions, allowing the production of a wide range of high temperature carbon nanostructures ranging from carbon blacks to fullerenes over nanotubes.
Figure IV-10 Three families of nanostructured carbon materials (UCL – Louvain)
The elaboration principle of the different families of nanostructured carbon materials produced thanks to the high temperature three phase AC plasma process will be presented.
33..11 PPrroodduuccttiioonn ooff ccaarrbboonn bbllaacckkss
The principle of this new plasma process for the production of carbon black [190] is to replace the incomplete combustion by a direct splitting of the hydrocarbon into carbon black and hydrogen thanks to an external electric energy supply. The major objectives of the new process are a better use of the initial feedstock thanks to a total conversion of the hydrocarbon into carbon and hydrogen (100% carbon yield), the production of pure hydrogen as a valuable by-product and the production of new carbon grades thanks to reaction temperatures and specific enthalpies unreachable by the conventional combustion processes.
3.1.1 Presentation of the initial technology
The initial technology set-up for the production of carbon blacks is presented in the figure below, with the total height of the pilot plant close to 3 meters and an external diameter close to half a meter, without all the external devices :

Chapter IV The nanostructured carbon materials elaborated and investigated
120
3 PHASE AC POWER SUPPLY
Gas
Solid
Precursor Precursor
Carrying gas
Plasma gas Plasma gas
1
2
3
4
5
3 PHASE AC POWER SUPPLY
Gas
Solid
Precursor Precursor
Carrying gas
Plasma gas Plasma gas
1
2
3
4
5
Figure IV-11 Pilot plant for the production of carbon black [191]
The reactor is composed of a 3-phase AC plasma generator (label 1 above), a side injector for the hydrocarbon gas used as a feedstock (label 2), a 2 meter high reaction zone (label 3), a cooling and conveying zone (label 4) and finally a filter that separates the gases from the solid carbon particles produced (label 5).
The 3-phase AC power supply (three phase, 600 Hz, 0-400 A, 250 kW maximum power) supplies electricity to three graphite electrodes located at the top of the reactor, with every phase of the reactor connected to an electrode (label 1).
Under this plasma power supply the process contains a high temperature chamber with its upper part equipped with a graphite nozzle designed to optimise the mixing of the hydrocarbon precursor with the plasma flow, with the precursor injector being placed externally (label 2 and 3).
The system is terminated by a tail filter that enables the separation of the gaseous and the solid particulate products (label 5). The final product is collected in the filter with yields up to 100% conversion of the initial feedstock.
The external parts of the reactor are made in stainless steel, with a double envelope in order to allow water cooling. Inside the reactor, the plasma is confined in a graphitic wall thermally insulated from the reactor, and water and gas networks are developed to provide water cooling of the plasma torch and the process gases.
3.1.2 The operating principle
The process for the production of the carbon black can be decomposed into three stages. The first step being the initiation of the plasma in the reactor thanks to the plasma gas and the electric arc generated by the external supply, followed by the injection of the hydrocarbon feedstock in the high temperature reaction zone. The final step is the splitting of the hydrocarbon into carbon black and hydrogen gas separated in the tail filter.
Initially an inert or reducing plasma gas (nitrogen, argon, helium, carbon monoxide, hydrogen or a

Chapter IV The nanostructured carbon materials elaborated and investigated
121
mixture of these gases) is introduced in the upper part of the reactor, with an average flow rate of a few normal cubic meters per hour.
Using the external three phase electrical supply and the fact that each electrode is connected to one of the phases of the generator, an electric arc can be created in the reactor thanks to the contact of three graphitic electrodes. Once the electric arc is initiated, the three electrodes are separated and the plasma generated from the interaction of the plasma gas and the electric arcs. This plasma generated is made up with the three free electrical arcs that turn with the frequency of the generator, every electrode being at a turn cathode and anode.
The frequency of the generator varies from 50 to 650 Hz, with most experiments being done at 650 Hz for the stability of the plasma. The figure below shows the electrical power supply that supplies the plasma head located at the top end of the reactor and an axial projection of the plasma.
Figure IV-12 The three phase AC power supply and an axial projection of the plasma (CENERG – ENSMP)
In opposite to the existing industrial processes, the temperature in the plasma process - operating temperature range from 1000 to 10000°C - is not limited by chemical thermodynamics since the reaction enthalpy is supplied inside the reactor by an electric arc. Due to the absence of oxygen during the process, it is a zero emission process.
After an initial preheating phase, the hydrocarbon is introduced in the neighbourhood of the plasma. Different injection points are possible - axially by the top of the reactor or radially at various heights in the reactor corresponding to different openings - which allows a greater flexibility for a specific treatment required. The thermal decomposition reaction is then initiated, with the formation of carbon black and hydrogen.
The overall reaction for the production of carbon black is
22 H.m C.n energy HC mn +→+ equation IV-2
with the energy supplied being the heat converted from the electric energy.
The products of the reaction are then retrieved in a mixer where they are cooled thanks to a nitrogen flow. The inert mixture then reaches a temperature lower than 60°C thanks to a water cooling system. The final part of the process is a filtration system that separates the gas phase and the carbon black particles.
During an experiment, the temperature inside the reactor can be measured at four different points simultaneously along the axial positions. Temperature T1 is measured 70 cm from the top of the reactor by an optical pyrometer in the stream and temperatures T2, T3 and T4 are measured respectively at 1.18 m, 1.77 m and 2.5 m from the top of the reactor using various thermocouples type R and K.
The figure below shows the temperature variation along the axis of the reactor during an established regime for a typical experiment:

Chapter IV The nanostructured carbon materials elaborated and investigated
122
0
500
1000
1500
2000
2500
0 0,5 1 1,5 2 2,5
Reactor height from the axis (m)
Tem
pera
ture
(°C
)
12 Nm3.h-1 - N2 - 300 A - 220 V
Temperature extrapolation in the injection zone
T1
T2
T3
T4
Figure IV-13 Temperature distribution in the reactor in stationary regime for a typical experiment [190]
This figure shows, thanks to an extrapolation of the temperature in the reactor, that the temperature in the injection zone is around 2500°C and decreases linearly to the bottom of the reactor. This clearly shows that the temperature decreases along the reactor axis, and the highest temperature is reached close to the injection point for the decomposition of the hydrocarbon to occur.
The next figure represents the evolution in time of the measured temperatures previously defined at different points in the reactor for a typical experiment:
Figure IV-14 Temperature variation with time in the reactor (N2, 12 Nm3/h, 300 A) [190]
The preheating phase lasts between 1 and 3 hours. During the injection, the temperature evolution inside the reactor brings interesting information on the heat transfer. T1 increases while T2, T3 and T4 initially decrease until it increases again and stabilises to an equilibrium temperature. These characteristic evolutions result of the conjugated effect of the radiative heat transfer due to the presence of the particles, and the chemical energy consumed by the cracking reaction of the hydrocarbon. Prior to the injection of the hydrocarbon, the temperature probes are in a convective equilibrium with the gas and a radiative equilibrium with the reactor walls. As the wall temperatures are in general lower than the gas temperatures, the probes tend to underestimate the gas temperature.
The hydrocarbon being injected, a cloud of carbon particles surround the probes, limiting the radiative losses to the walls. The measured temperature is then close to the real temperature of the gas. Close to T1, this effect is reflected by a temperature increase due to the limitation of the loses to the low part of the reactor, clearly colder. At T2, T3 and T4, the thermocouples are sensitive at the same

Chapter IV The nanostructured carbon materials elaborated and investigated
123
time to an increase of the radiation coming from the top of the reactor and the decrease of the flow temperature due to the energy consumed by the cracking.
The various operating parameters that can be modulated are the type of plasma gas used and its flow rate, the hydrocarbon feedstock and its flow rate, and the injection type as the feedstock can be either radially or axially injected in the reactor. These parameters influence the particle residence time in the reactor, which strongly affects the particle formation mechanism [191].
3.1.3 Numerical modelling
Because various parameters, such as the plasma gas, the temperature in the injection zone, the type of precursor etc., have to be taken into account in the plasma process for the production of the nanostructured carbon materials, Computational Fluid Dynamics (CFD) of the reactor [192] are carried out. The main objectives of these studies are a better understanding of the heat and mass transfer in the reactor, the optimisation of the thermodynamic conditions for specific applications and to develop a tool that can be used during the phase of scaling-up of the process to an industrial size. Different aspects are used and taken into account, such as the simplified model of the arc-zone - already developed - the properties of the mixture of gas and carbon particles for varying carbon concentrations and temperature, the effect of the sublimation of the carbon particles on the mixture properties and the effect on the temperature field of the position of the injection of the precursor in the reactor [193].
33..22 AAddaappttaattiioonn ooff tthhee ppllaassmmaa tteecchhnnoollooggyy
In the case of the production of other forms of carbon nanostructures several changes to the original design were done in order to adapt the facility to the new requirements. Nevertheless, the principle of operation of the plasma is the same as for the production of the carbon blacks, and the heat and energy are supplied as stated above. As opposed to the main processes, the production of the carbon nanostructured powder is not limited to the erosion of the electrodes but is a continuous process.
For the production of new forms of nanostructured carbon materials the initial feedstock is a solid carbon and not a hydrocarbon anymore. The process takes place in a controlled inert atmosphere and it is possible to produce carbon nanostructures ranging from fullerenes [194] to nanotubes. Due to the absence of hydrogen during the process, the chemistry of the reaction is totally different than for the production of carbon blacks.
The synthesis consists in injecting a carbonated precursor, with or without the presence of a catalytic element, through the plasma in order to ensure its vaporisation - in the case of solid carbon - followed by its condensation and extraction up to a filtration system. This is performed under an inert atmosphere at atmospheric pressure.
In order to ensure the production of these new types of carbons, the initial technology for the production of carbon blacks was modified. The modified pilot plant is shown in the figure below :

Chapter IV The nanostructured carbon materials elaborated and investigated
124
Plasma Gas (8-15 Nm3/hr)
Vaporization Chamber
(wall) Circulation
Pump
Quenching Chamber
(ZR2)
Gas extraction
Powders Cooling System
Gas exit
Filtre
Flowing back
Three-phase power source
Powder Feeder (0-1 kg/hr)
1
5
4
3 2
Figure IV-15 The pilot plant for the plasma process with the various sampling points in the reactor[194]
Even though the general configuration of the reactor has been maintained, some modifications at three levels have been made. Firstly, new windows and passages have been added in the quenching chamber (reaction zone 2 - ZR2), allowing a wide range of possible measurements inside the quenching chamber and manipulations by means of the quenching/sampling system. Secondly, a water-cooled flange with three legs linking the upper and lower parts of the reactor and also supporting the reactor has been added, and finally, the lower part of the reactor (the former cooling and conveying zone in Figure IV-11) has been replaced by a simple disk, closing the reactor end.
The other modifications to the process are stated below :
• The internal geometry of the vaporization chamber (reaction zone 1 - ZR1) has been modified to improve the vaporisation conditions of the solid carbon particles thanks to a stronger confinement of the reactor flow.
• In order to adapt the technology to the production of these new nanostructured carbons, solid carbon powders have to be injected in place of a gaseous hydrocarbon gas, and therefore a powder injection system had to be installed. This system is employed to mix the solid feedstock powder with a suspending gas to transport the mixture inside the reactor. It basically consists of an injection device and a carbon black gas mixing unit.
• The final adaptation consists in a quenching/sampling system enabling the extraction, the cooling, the separation of the soots and the gas circulation in the entire reactor. The purpose of this system is to cool the reactor flow to the adapted conditions for the production of the carbon nanostructures and to extract the resulting product. The carbon vaporisation occurs in the upper part of the reactor close to the plasma, and the condensation step occurs during the quench that takes place when the flow is extracted from the reactor through the quenching system. The quench is a determining factor for the production of the new grades of nanostructured carbon. The cooling system consists of a standardised tube-flange-system allowing flexibility and easy assembly. The principal units of the system are the filter needed to collect the carbon nanoparticles and the centrifugal pump needed to force gas recirculation.
In order to test the various parameters during the production of the different types of nanostructured carbon materials, a certain number of sampling points have been placed in the experimental set-up. These samples are interesting for the analysis of the process as they indicate the evolution of the nanostructure of the carbon as a function of the historical path in the reactor. These sampling points are shown in the Figure IV-15 above. Index 1 are samples from the filter and index 2 are samples taken in the cooling system. Both samples above have been through the quench step of the

Chapter IV The nanostructured carbon materials elaborated and investigated
125
process. Index 3 are samples taken in the reaction zone 2 (ZR2) and have been subject to a quench but not an as violent one as for samples coming from the filter or the cooling system. On the other hand concerning index 4, samples from the wall have not been subject to any quench and remained during the entire process along the walls of the reactor at high temperatures. The samples taken from point 5 come from the graphite electrodes.
The general operating principle for the production of these new forms of nanostructured carbon consists in injecting a solid carbon feedstock that is vaporised thanks to the heat supplied by the plasma. This vaporisation provokes a modification and a reorganisation of the carbon structure, without the formation of any binary compounds as for the production of the carbon black as no hydrogen is present in the process. The reaction occurs in an inert atmosphere of argon, helium or nitrogen.
The figure below shows the evolution of the temperature on the upper part of the reactor down to the extraction point for a typical experiment. An experiment generally lasts between three and five hours, but experiments of more than ten hours have already been performed when a larger amount of material is necessary.
0
100
200
300
400
500
600
700
800
900
1000
0 2000 4000 6000 8000 10000 12000 14000Time (s)
Tem
pera
ture
(°C
)
First thermocouple in the quenching chamber.
First thermocouple at the outlet of the first cooling element.
N2
Heating Injection Cooling
I II III IVHe N2
0
100
200
300
400
500
600
700
800
900
1000
0 2000 4000 6000 8000 10000 12000 14000Time (s)
Tem
pera
ture
(°C
)
First thermocouple in the quenching chamber.
First thermocouple at the outlet of the first cooling element.
N2
Heating Injection CoolingHeating Injection Cooling
I II III IVHe N2
Figure IV-16 Temperature evolution with time in a typical experiment
In addition to the figure above, the figure below gives a view of the extraction point during the different phases.
Figure IV-17 View of the stream during the different stages at the gas extraction point
Phase I
Phase III Phase IV
Phase II
Phase I
Phase III Phase IV
Phase II

Chapter IV The nanostructured carbon materials elaborated and investigated
126
The phase I corresponds to the pre-heating phase generally performed with nitrogen and phase II corresponds to the final part of the heating phase with the change of gas from nitrogen to helium. The gas stream can be observed and the change of temperature in the stream is an indication of the change of gas. With the third phase starts the injection of the particles and the elaboration process, and the change in colour is due to the high temperatures reached by the carbon particles during the process. Phase IV is the cooling of the reactor, with a sudden decrease of the temperature with the return to a nitrogen flow. These isolated yellow/red streams come from the remaining carbon along the reactor that will not be collected in the filter.
The two following paragraphs will be presenting the process for the production of fullerene rich soots and nanotube rich soots, with the different operating conditions influencing the final structure. As opposed to the currently existing processes (arc, laser, solar etc.), the plasma process is the unique process for which the production of the nanostructured carbons is not solely limited to the erosion of the electrode, but the production is continuous with a high production yield of the soot.
3.2.1 Production of carbon fullerenes
For the production of carbon fullerenes the feedstock injected is a solid carbon powder, and the chemistry is different as no hydrogen is present neither.
The operating principle is based on the vaporisation and condensation of the carbon powder injected. Once the plasma is created in the reactor, the carbon precursor is injected, and the carbon gets vaporised in this high temperature zone (T > 4000 °C). The mixture of the carbon vapour and the plasma gas is then rapidly cooled down through the quenching system using the gas-flow-back system down to room temperature.
Two structural properties that distinguish the carbon black from the fullerene soot are the high abundance of curved carbon layers and of carbon pentagons in the fullerene soot. This tendency to form bent structures is a consequence of the special synthesis conditions [195]. They firstly energetically favour the curvature of the flat carbon sheets with the formation of pentagons that saturate the dangling bonds due to the unique presence of carbon atoms, and secondly, these metastable structures are conserved upon the quenching in the inert gas atmosphere. It is the formation of these pentagons during the vaporisation that imply the curvature of the carbon sheets, giving these fullerene structures.
In the plasma process, the processing parameters for the production of fullerene rich soots are the nature of the carbon precursor - graphite, various grades of carbon black or acetylene black - the nature of the plasma gas - helium, argon and nitrogen. The various flow rates of the carbon powder or the plasma gas also have an influence on the operating conditions and carbon yield. The injection point of the carbon can either be from the top (axially) or from the side of the reactor (radially). The quenching conditions can be modified by changing the location of the gas extraction, which also influences the residence time.
The plasma process is a continuous process where the production is not limited to the erosion of the electrodes, and with a process not fully optimised yet, the current yields obtained are typically of the order of 5%. At carbon flow rates of several hundred grams per hour, in extreme cases up to 1 kg/h, fullerene production rates of the order of 10 g/h can be realised. No other technology has been able to reach such high fullerene production rates on a continuous basis.
In the next chapter, the structure of the fullerene soot obtained through the plasma process will be presented as well as a comparison of the initial feedstock injected and the final soot obtained.
3.2.2 Production of carbon nanotubes
As for the production of the fullerene soots, for the production of nanotube type carbons, the feedstock injected is a carbon powder, which has this time been mixed with metal catalyst particles. The choices made for the metal catalyst are based on the literature, where a vast amount of research has been done on the formation of nanotubes, might they be single walled or multi walled. Various theories of the growth mechanisms of carbon nanotubes have been presented in chapter II, and based

Chapter IV The nanostructured carbon materials elaborated and investigated
127
on these models, a theory on the different steps in the formation mechanism of the nanotubes in the plasma process is given.
Once the particles are injected in the plasma, the vaporisation of the catalyst and the carbon precursor occurs, this last one being either vapour, liquid or solid. In order to vaporise the precursor, temperatures around 4000°C have to be obtained, and the sublimation leads to the formation of droplets containing a high concentration of carbon in the vapour phase. The next stage is the annealing one, corresponding to the gaseous phase charged with particles around the thermal gradient created by the plasma source, where the carbon diffuses in the metal catalyst until complete saturation. The final quenching step is essential to the formation of the nanotubes, and insures the violent segregation of the carbon to the surface of the nanometer sized particles composed of a carbon metal catalyst mixture. A favourable temperature for this to occur would be a temperature close to the eutectic temperature of the binary mixture carbon-metal.
The influencing parameters that can be modified during the various experiments concern different parts of the reactor. The powder feeder can be placed either radial or axial from the top of the reactor. The feedstock can be changed from various grades of carbon blacks or acetylene black to graphite and ethylene gas (C2H4), and the amount of feedstock injected can also be varied from typically 20 to 250 g/h with a maximum of 1 kg/h. In parallel to the carbon feedstock, the nature, the quantity and relative proportions, of the metal catalyst injected can also vary (Ni, Co, Y etc.), as well as the nature and the flow rate of the plasma gas (He, N2 etc.). The current in the plasma torch can also change from 200 to 400 A and the gas extraction point can be changed between three different positions.
As a maximum of three experiments can be taken a week, and considering the various parameters influencing the entire process, it is all the more important to perform some modelling of the reactor with the presence of the particles in order to optimise the experiments as a function of the various parameters to be tested (refer to section 3.1.3 in this chapter).
With the originality of the process, different types of nanotubes can be formed such as bamboo-like nanotubes, carbon nano-necklaces and carbon fibres. These carbons are formed under specific conditions in the plasma process, which will be detailed in the next chapter when the materials tested for hydrogen adsorption are presented.
33..33 AAddvvaannttaaggeess ooff tthhee ppllaassmmaa pprroocceessss
The process allows a large range of characteristics for the carbon black concerning their structures seen through Transmission Electron Microscopy, through the BET and DBP. For the production of carbon black, the yield is 100%, and environmentally friendly as it produces no CO2 nor NOX or SO2, which is unique, as the only by product being hydrogen. It also enables a high flexibility concerning the enthalpies reached thanks to the plasma. Any type of gaseous hydrocarbon precursor can be used without discrimination, favouring the recycling of hydrocarbons. It should also be noted that the process, even though it is still experimental, has been developed at a semi industrial scale, making its scaling up accessible.
The other advantages with the process are its flexibility on the type of precursor used, meaning that it can either be gaseous, liquid or solid, and mixed with a metal catalyst or a mixture of metal catalysts. Moreover, the flexibility of the process with the enthalpy and the extreme thermodynamic conditions reachable, allows the production of a new range of nanostructured carbon materials : the nanotubes of the necklace or bamboo type. All the more, as the process is continuous and not limited to the erosion of the electrodes, as most of the production techniques, considerable amounts of material can be produced, even if post treatment is required to the bulk product for a pure material.
The process has already shown many interesting properties either in the process itself but also on the type of nanostructured carbon materials that can be produced. Many parameters can still be explored such as the type of catalyst used, the quenching and the reduction of the pressure in the process in order to increase the purity in nanotube in the soots.
The reactor allows to process nanotubes and fullerene rich soots with a yield of 5% with an optimal carbon rate of 150 g/h, hence a production capacity of 7.5 g/h. The composition in C60 and C60+C70
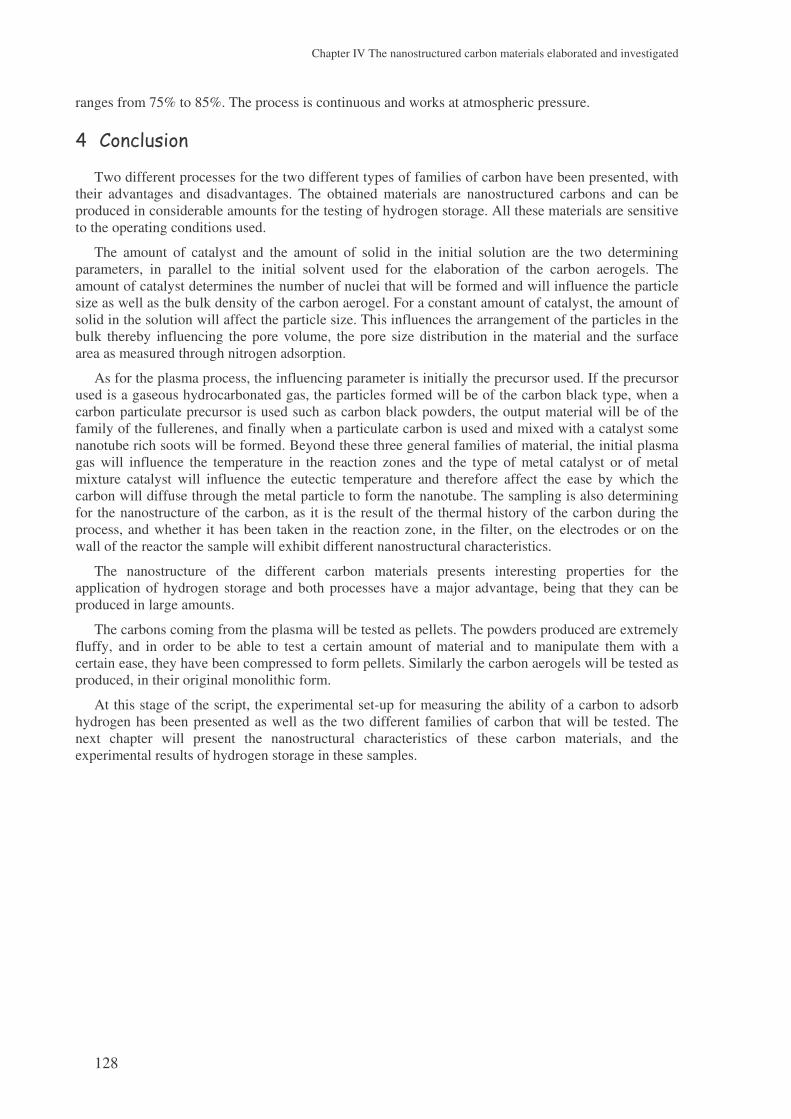
Chapter IV The nanostructured carbon materials elaborated and investigated
128
ranges from 75% to 85%. The process is continuous and works at atmospheric pressure.
.
Two different processes for the two different types of families of carbon have been presented, with their advantages and disadvantages. The obtained materials are nanostructured carbons and can be produced in considerable amounts for the testing of hydrogen storage. All these materials are sensitive to the operating conditions used.
The amount of catalyst and the amount of solid in the initial solution are the two determining parameters, in parallel to the initial solvent used for the elaboration of the carbon aerogels. The amount of catalyst determines the number of nuclei that will be formed and will influence the particle size as well as the bulk density of the carbon aerogel. For a constant amount of catalyst, the amount of solid in the solution will affect the particle size. This influences the arrangement of the particles in the bulk thereby influencing the pore volume, the pore size distribution in the material and the surface area as measured through nitrogen adsorption.
As for the plasma process, the influencing parameter is initially the precursor used. If the precursor used is a gaseous hydrocarbonated gas, the particles formed will be of the carbon black type, when a carbon particulate precursor is used such as carbon black powders, the output material will be of the family of the fullerenes, and finally when a particulate carbon is used and mixed with a catalyst some nanotube rich soots will be formed. Beyond these three general families of material, the initial plasma gas will influence the temperature in the reaction zones and the type of metal catalyst or of metal mixture catalyst will influence the eutectic temperature and therefore affect the ease by which the carbon will diffuse through the metal particle to form the nanotube. The sampling is also determining for the nanostructure of the carbon, as it is the result of the thermal history of the carbon during the process, and whether it has been taken in the reaction zone, in the filter, on the electrodes or on the wall of the reactor the sample will exhibit different nanostructural characteristics.
The nanostructure of the different carbon materials presents interesting properties for the application of hydrogen storage and both processes have a major advantage, being that they can be produced in large amounts.
The carbons coming from the plasma will be tested as pellets. The powders produced are extremely fluffy, and in order to be able to test a certain amount of material and to manipulate them with a certain ease, they have been compressed to form pellets. Similarly the carbon aerogels will be tested as produced, in their original monolithic form.
At this stage of the script, the experimental set-up for measuring the ability of a carbon to adsorb hydrogen has been presented as well as the two different families of carbon that will be tested. The next chapter will present the nanostructural characteristics of these carbon materials, and the experimental results of hydrogen storage in these samples.

Chapter IV The nanostructured carbon materials elaborated and investigated
129

Chapter V Characterisation and experimental results of hydrogen storage on the carbon materials elaborated
130
V CHARACTERISATION AND EXPERIMENTAL RESULTS OF HYDROGEN STORAGE ON THE CARBON MATERIALS
ELABORATED
A series of samples have been elaborated at the Centre for Energy Studies. Their structural characteristics will be presented as well as the parameters used for their elaboration. All the samples
have been tested for hydrogen storage using the same experimental protocol.

Chapter V Characterisation and experimental results of hydrogen storage on the carbon materials elaborated
131
1 Introduction .................................................................................................................132
2 Characterisation of the two families of samples .......................................................133
2.1 Characterisation of the carbon aerogels...................................................................... 133 2.1.1 Mercury pycnometry .......................................................................................................... 133 2.1.2 Elemental analysis .............................................................................................................. 134 2.1.3 Raman spectroscopy........................................................................................................... 134 2.1.4 Helium pycnometry ............................................................................................................ 135 2.1.5 TEM analysis...................................................................................................................... 136 2.1.6 Nitrogen adsorption............................................................................................................ 137 2.1.7 SAXS analysis.................................................................................................................... 142
2.2 The samples produced by the high temperature plasma process ................................ 145 2.2.1 Carbon black....................................................................................................................... 146
- $0 7'+ .
2.2.2 Fullerene rich soots ............................................................................................................ 150 2.2.3 Nanotube rich soots ............................................................................................................ 152
) .' . 0
2.2.4 Conclusion on the carbons from the plasma process.......................................................... 157
3 The experimental results with the carbon aerogels..................................................157
3.1 Presentation of the results........................................................................................... 157
3.2 Microstructural effect on the hydrogen storage.......................................................... 159 3.2.1 Influence of the specific surface area ................................................................................. 159 3.2.2 Influence of the porosity..................................................................................................... 160 3.2.3 The surface area.................................................................................................................. 164 3.2.4 The gaseous chord length and the particle size................................................................... 164 3.2.5 Conclusions ........................................................................................................................ 166
4 Results with the carbons coming from the plasma process .....................................167
4.1 Three families of carbons tested ................................................................................. 167
4.2 The problem of the intrinsic weight percent............................................................... 167 4.2.1 The skeleton density ........................................................................................................... 167 4.2.2 The weight percent of nanotubes........................................................................................ 168
4.3 Analysing the hydrogen weight percent compared to compression ........................... 169
5 Carbon nanofibres.......................................................................................................171
6 Conclusions ..................................................................................................................172

Chapter V Characterisation and experimental results of hydrogen storage on the carbon materials elaborated
132
,
The two families of samples have been presented previously. They come from two different processes that enable to obtain materials with various morphologies and nanostructural characteristics. These characteristics depend essentially on the experimental parameters that influence the final nanostructure of the carbon material to be tested for hydrogen storage.
The initial elaboration parameters concerning the materials coming from the plasma process have not been adapted or optimised for hydrogen storage, whereas the carbon aerogels materials have been elaborated for this application. The experimental parameters for the elaboration of the carbon aerogels have been chosen in order to obtain a variety of samples concerning their surface area, bulk density, pore volume and pore size distribution. On the other hand, the nanostructured materials coming from the plasma have initially been made for different applications, and due to their original structure, and the literature review on hydrogen storage in carbon nanotubes, it has been decided to test them for hydrogen storage, that could be a potential future application.
The materials that have been tested for hydrogen storage will now be presented. Concerning the carbon aerogels, the materials will be presented as a function of the experimental parameters, and some indications will be given on the nanostructural characteristics of these materials. For the carbon materials coming from the plasma process, the three families of carbon produced will be presented - carbon black, carbon fullerenes and carbon nanotubes - and some elements on the formation mechanism of three original structures will be given.
The purpose is to get some comprehension on the hydrogen adsorption phenomenon as a function of the various structural characteristics of the materials produced. Due to the strong diversity between the two families of carbon they can bring interesting information of the structural requirements to promote hydrogen storage.
The experimental test bench elaborated will be used in order to determine the hydrogen storage capacities of the carbon materials produced. All the materials will be tested with the same experimental protocol, in order to be able to compare the experimental results with the structural characteristics of the materials previously studied: ten grams of material will systematically be tested at 100 bars and 25°C. The hydrogen storage capacity compared to compression and the intrinsic weight percent of hydrogen will be calculated for all the samples, when the skeleton density is available.

Chapter V Characterisation and experimental results of hydrogen storage on the carbon materials elaborated
133
.%
The two families of materials have been characterised thanks to various experimental techniques, providing valuable interesting information on the internal structure of the sample.
22..11 CChhaarraacctteerriissaattiioonn ooff tthhee ccaarrbboonn aaeerrooggeellss
The carbon aerogels produced for this work have a few common characteristics in their elaboration technique. All the samples have been made by employing the two same precursors - resorcinol and formaldehyde -, have been dried in CO2 supercritical conditions and pyrolysed at 1050°C under a nitrogen flow with the same heating cycle. These parameters could be varied, but it was decided to limit the number of parameters. The three parameters that have been varied are the solvent, which can either be acetone or water, the molar ratio of resorcinol over catalyst (R/C) and finally the solid fraction in the solution (% sol).
Each experimental technique used for the characterisation provides different information for every type of material. The explanations of the various techniques used are given in appendix 3. The various techniques used are either quantitative or qualitative and some general characteristics can be attributed to the carbon aerogels independently of their chemical composition.
2.1.1 Mercury pycnometry
Mercury pycnometry is used to measure the bulk density of the as produced monolithic samples.
CD11 acetone 50 15 1,14
CD10 acetone 50 35 1,57
CD16 acetone 200 10 0,65
CD17 water 50 15 0,59
CD8 water 50 35 0,81
CD6 water 75 10 0,48
CD12 water 75 20 0,63
CD3 water 75 30 0,72
CD7 water 200 10 0,19
CD2 water 200 20 0,37
CD4 water 200 30 0,51
CD9 water 200 40 0,65
CD20 water 300 5 0,09
% Sol
Chemistry
Material Solvent R/CBulk
density (g.cm-3)
0,0
0,2
0,4
0,6
0,8
1,0
1,2
1,4
1,6
5 10 15 20 25 30 35 40
% Solid
Bul
k de
nsity
(g.
cm-3
)
water - R/C 75water - R/C 200water - R/C 50acetone - R/C 50
Table V-1 Carbon aerogels processed and effect on the bulk density
The table shows the various chemistry used for the different samples as well as the bulk density of the samples measured through mercury pycnometry. For a constant ratio of resorcinol to catalyst, the greater the amount of solid in the initial solution, the greater the bulk density of the monolith sample. At a constant volume, the amount of solid matter increases, implying an increase in the bulk density of the material.
Similarly, for a constant amount of solid in the initial solution a decrease in the amount of catalyst, hence an increase the R/C ratio, decreases the bulk density of the sample. As the amount of catalyst present increases, the polymerisation reaction begins on an increased number of sites within the solution, creating a larger number of nuclei that are able to grow until all the monomer is consumed, and thereby producing a denser material.

Chapter V Characterisation and experimental results of hydrogen storage on the carbon materials elaborated
134
For two similar compositions but two different solvents, the use of an acetone solvent densifies the sample. The presence of acetone in place of water allows the formation of a larger amount of nuclei enabling an increase in the density of the material. When using acetone as a solvent, a step less is required in the elaboration process but there is a modification in the gelation reaction. The anion from the resorcinol forms less easily, and the reaction is much slower. All the collisions do not produce chemical bonds, and the diffusion kinetics is not the limiting step anymore. The clusters have therefore more time to interpenetrate each other which leads to denser materials than when water is used as a solvent with smaller particles.
Beyond the external aspect of the material and its bulk density, the internal nanostructure of the material is extremely interesting, and few experimental techniques have been used to characterise the material.
2.1.2 Elemental analysis
An elemental analysis is a quantitative analysis of a substance to determine the relative amounts of the various elements that make it up. Different elemental analysis have been done on six different carbon aerogel samples, the CD series, and on three organic aerogels, the OD series.
%C %H %N %O %S %Na %Si TOTAL59,6 4,7 - 33,8 0,0 0,1 - 98,160,1 4,6 - 33,3 - - - 98,0
CD 6 92,1 - - 4,0 - - 3,9 96,1
CD 9 97,2 - - 2,8 - - - 100,0
65,0 5,3 - 32,0 0,2 0,6 - 103,164,2 5,3 - 31,7 - - - 101,2
63,4 4,7 - 32,3 0,4 0,3 - 101,263,2 4,9 - 32,9 - - - 101,0
CD 12 97,0 - - 3,0 - - - 100,0
99,6
99,8
95,6 0,3 0,4 2,2 0,6 0,2 - 99,3
0,3 1,0 -
95,4 0,3 0,4 2,5 0,3 0,6 -
97,2 0,3 0,1 0,9CD 10
OD 11
CD 11
OD 5
CD 5
OD 10
Table V-2 Elemental analysis for several organic and carbon aerogel samples (CNRS)
The table above shows the results of elemental analysis. Two different batches of samples were analysed at two different laboratories, which explains the differences in the elements analysed in the various samples.
The organic aerogels are essentially composed of carbon (~60%), oxygen (~33%), hydrogen (5%) and remaining impurities such as sulphur and sodium. These impurities most certainly come from the two organic precursors used during the elaboration process of the aerogels. For the same chemical composition, but looking at the carbon aerogel in place of the organic aerogel, one can see that after pyrolysis the respective amounts of oxygen and hydrogen are considerably reduced, whereas the mass percent of sulphur and sodium remains constant. It can also be observed that a small amount of nitrogen appeared in the elemental analysis. This is due to the fact that the carbon has been pyrolysed at 1050°C in an inert nitrogen atmosphere (presence of N), eliminating all the organic compounds (O) and most of the hydrogen.
It can be observed that the weight percent of carbon in the carbon aerogel varies from 92 to 97 %. The sample with 92 % shows the presence of silicon in the sample, which is certainly due to the contamination by some silica aerogels produced in our laboratory. Nevertheless, all the carbon aerogels samples are pure in carbon and show little amounts of impurities.
2.1.3 Raman spectroscopy
Raman spectroscopy measurements were done on three different samples. The measurements were
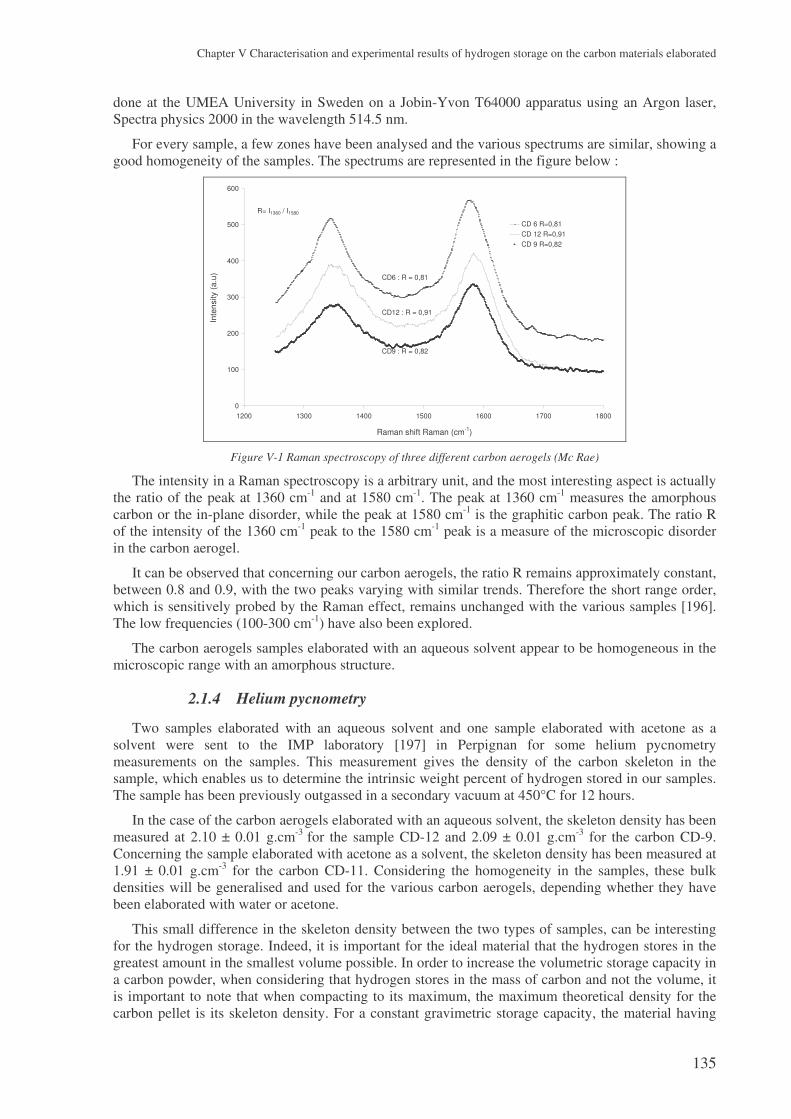
Chapter V Characterisation and experimental results of hydrogen storage on the carbon materials elaborated
135
done at the UMEA University in Sweden on a Jobin-Yvon T64000 apparatus using an Argon laser, Spectra physics 2000 in the wavelength 514.5 nm.
For every sample, a few zones have been analysed and the various spectrums are similar, showing a good homogeneity of the samples. The spectrums are represented in the figure below :
0
100
200
300
400
500
600
1200 1300 1400 1500 1600 1700 1800
Raman shift Raman (cm-1)
Inte
nsity
(a.u
)CD 6 R=0,81CD 12 R=0,91CD 9 R=0,82
R= I1360 / I1580
CD6 : R = 0,81
CD12 : R = 0,91
CD9 : R = 0,82
Figure V-1 Raman spectroscopy of three different carbon aerogels (Mc Rae)
The intensity in a Raman spectroscopy is a arbitrary unit, and the most interesting aspect is actually the ratio of the peak at 1360 cm-1 and at 1580 cm-1. The peak at 1360 cm-1 measures the amorphous carbon or the in-plane disorder, while the peak at 1580 cm-1 is the graphitic carbon peak. The ratio R of the intensity of the 1360 cm-1 peak to the 1580 cm-1 peak is a measure of the microscopic disorder in the carbon aerogel.
It can be observed that concerning our carbon aerogels, the ratio R remains approximately constant, between 0.8 and 0.9, with the two peaks varying with similar trends. Therefore the short range order, which is sensitively probed by the Raman effect, remains unchanged with the various samples [196]. The low frequencies (100-300 cm-1) have also been explored.
The carbon aerogels samples elaborated with an aqueous solvent appear to be homogeneous in the microscopic range with an amorphous structure.
2.1.4 Helium pycnometry
Two samples elaborated with an aqueous solvent and one sample elaborated with acetone as a solvent were sent to the IMP laboratory [197] in Perpignan for some helium pycnometry measurements on the samples. This measurement gives the density of the carbon skeleton in the sample, which enables us to determine the intrinsic weight percent of hydrogen stored in our samples. The sample has been previously outgassed in a secondary vacuum at 450°C for 12 hours.
In the case of the carbon aerogels elaborated with an aqueous solvent, the skeleton density has been measured at 2.10 ± 0.01 g.cm-3 for the sample CD-12 and 2.09 ± 0.01 g.cm-3 for the carbon CD-9. Concerning the sample elaborated with acetone as a solvent, the skeleton density has been measured at 1.91 ± 0.01 g.cm-3 for the carbon CD-11. Considering the homogeneity in the samples, these bulk densities will be generalised and used for the various carbon aerogels, depending whether they have been elaborated with water or acetone.
This small difference in the skeleton density between the two types of samples, can be interesting for the hydrogen storage. Indeed, it is important for the ideal material that the hydrogen stores in the greatest amount in the smallest volume possible. In order to increase the volumetric storage capacity in a carbon powder, when considering that hydrogen stores in the mass of carbon and not the volume, it is important to note that when compacting to its maximum, the maximum theoretical density for the carbon pellet is its skeleton density. For a constant gravimetric storage capacity, the material having

Chapter V Characterisation and experimental results of hydrogen storage on the carbon materials elaborated
136
the highest bulk density will be the material with the highest volumetric hydrogen density.
2.1.5 TEM analysis
Two microscopes were used for making the TEM photos at the LCSM [198] in Nancy : a Zeiss 902 and a Philips CM20, with a voltage of 80 kV. This low voltage is adapted to the observation of carbonaceous materials as good contrasts can be obtained. Different photos will be shown exhibiting the slight differences observable on the different samples. One should keep in mind that these photos have been deliberately chosen because they are considered as being representative of the sample.
The CD-6 and CD-12 samples shown below, are two samples with the same ratio of resorcinol to catalyst but two different solid percent in the initial solution, with a slight increase between the CD-6 and CD-12.
Figure V-2 TEM photos of the carbon aerogels CD-6 (left) and CD-12 (right) showing the effect of the addition of solid (E. McRae – CNRS Nancy)
The figure above shows that the particles are well interconnected and that the two samples are very homogeneous. The particle size can be estimated to be around 5-20 nm for both samples. The CD-12 sample has a more close packed structure with smaller particles more tightly bound to each other than in the CD-6 sample, and thereby exhibiting a higher density, in accordance to the densities measured.
The two following photos show the influence of the solvent. Two samples have been chosen with the same composition, but sample CD-16 (on the left on the figure below) was elaborated with acetone as a solvent, whereas sample CD-7 (on the right on the figure below) has been elaborated with water as solvent.
Figure V-3 TEM photos of the carbon aerogels CD-16 (left) and CD-7 (right) showing the effect of the solvent (E. McRae – CNRS Nancy)
The sample CD-16 appears denser than the CD-7 sample with a closer packing and connection between the particles, that also appear smaller than for the CD-7 sample [199]. The solvent has the effect of decreasing the particle size and hence of increasing the bulk density, with the major disadvantage that the structure appears less open and the particles are more fused than in the case of carbon elaborated with water.

Chapter V Characterisation and experimental results of hydrogen storage on the carbon materials elaborated
137
All samples show the same general structure and only small differences can be observed through TEM. High resolution TEM should probably reveal more noticeable differences.
2.1.6 Nitrogen adsorption
Nitrogen adsorption measurements at -196°C have been performed on all the samples using a Micromeritics ASAP 2010 apparatus at the SCPI [200] laboratory in Centre for Energy Studies in Paris. These measurements enable to quantify the specific surface area as well as the pore volume.
Nitrogen adsorption also gives information at the mesoscale on the pore size distribution present in the material to the limits of the technique (diameters from 2 nm and above 50 nm), as well as the pore size distribution to the porous volume. This means that we know the pore size distribution, and also the contribution of each pore size to the total volume adsorbed. In the case of the presence of micro or macropores some indices are visible on the isotherms.
The general tendencies for the carbon aerogels as a function of the elaboration parameters are a decrease of the porous volume and of the mean pore size with an increase in the weight percent of solid in the solution, all along with an increase of the bulk density of the monolithic material. Concerning the BET surface area, an optimum (minimum or maximum) can be observed but no general tendencies can be distinguished which could be due to the presence of a closed structure in the material that is not taken into account in the BET surface area as it is calculated using nitrogen adsorption. This is illustrated on the table below showing the BET characteristics of the samples measured through nitrogen adsorption at -196°C.
CD11 acetone 50 15 1,14 120 0,11 6,6 3,6 0,02
CD10 acetone 50 35 1,57 - - - - -
CD16 acetone 200 10 0,65 603 0,91 5 - 12 6,0 0,10
CD17 water 50 15 0,59 635 1,26 14 7,9 0,07
CD8 water 50 35 0,81 644 0,67 5,4 4,2 0,07
CD6 water 75 10 0,48 602 2,46 13 - 70 16,3 0,22
CD12 water 75 20 0,63 700 1,31 10 7,5 0,09
CD3 water 75 30 0,72 643 0,98 8,8 6,1 0,08
CD7 water 200 10 0,19 968 3,48 73 14,4 0,26
CD2 water 200 20 0,37 566 2,26 30 15,9 0,09
CD4 water 200 30 0,51 554 1,65 17 11,9 0,07
CD9 water 200 40 0,65 863 1,68 10,2 7,8 0,14
CD20 water 300 5 0,09 705 0,85 18 - > 100 4,8 0,17
R/CBulk
density (g.cm-3)
mean pore D (4.Vp/SBET)
(nm)% Sol
Chemistry
Material SolventV
microporous (cm3/g)
mean meso D
(nm)
Vp
(cm3/g)
Nitrogen Adsorption at -196°C
SBET
(m2/g)
Table V-3 Characterisation of the carbon aerogels measured by nitrogen adsorption and BET characterisation
The bulk density was measured through mercury pycnometry, there are two values for the mean meso diameter : one taken from the plot of the pore volume versus the pore size, and the other one calculated using the equation 4.Vp/SBET, the porous and microporous volume were taken from the data report of the measurement, as well as the BET surface area. More explanations on the determination of the various values used in this table are available in the appendix 3.
For all the samples, the nitrogen adsorption/desorption isotherms were measured with the volume of gas adsorbed at the standard conditions of temperature and pressure as a function of the partial pressure, and the figure below represents the adsorption isotherms for three carbon aerogels samples.

Chapter V Characterisation and experimental results of hydrogen storage on the carbon materials elaborated
138
0
200
400
600
800
1000
1200
0 0,2 0,4 0,6 0,8 1
Relative pressure (P/P°)
Ads
orbe
d vo
lum
e (c
m3 .g
-1 S
TP)
0
1000
2000
3000
4000
5000
CD 9 - 200 / 40
CD 8 - 50 / 35
CD 7 - 200 / 10
H2
H1
Figure V-4 Three nitrogen isotherms at -196°C
These three samples are quite representative of the various carbons in the sense that all the samples show an hysteresis, and correspond to the type IV of the physisorption of gases in the IUPAC classification. As explained in appendix 3, this hysteresis is due to the capillary condensation of the nitrogen in the pores causing an adsorption or a desorption of the nitrogen at different partial pressures during the filling and emptying of the mesopores. The presence of a hysteresis loop is representative of essentially mesoporous samples.
Two recurring hysteresis loops are observed in our carbon aerogels, commonly designated as H1 and H2 in accordance with the IUPAC classification.
The H1 hysteresis loop for the sample CD-7 is characterised by a narrow pore size distribution of pores of uniform size, whereas the sample CD-9 and CD-8 are represented by a H2 hysteresis, which is characteristic of a complex pore structure with interconnected networks of pores with different size and shape. It is often observed that carbon aerogels are samples with a bi-modal pore size distribution.
In all cases small mesopores are observed with diameters ranging between 2 and 3 nm. Depending on the operating conditions, more or less large mesopores can be observed with mean diameters varying from 6-10 nm up to 10-14 nm. For some samples extremely big mesopores (30 nm in diameter) or small macropores (70 nm which reaches the limit of the technique) are observed. This diversity explains the general trends observed for the nitrogen isotherms, with an hysteresis of the type H2, that can reach a type H1 hysteresis when one type of pore contributes specifically to the total volume of gas adsorbed.
The adsorption isotherms for the carbon aerogels CD-16 and CD-7 are presented in the figure below. The two samples have the same elaboration parameters, except for the solvent : an acetone solvent was used for the CD-16 sample, and a water solvent was used for CD 7.

Chapter V Characterisation and experimental results of hydrogen storage on the carbon materials elaborated
139
0
100
200
300
400
500
600
700
0,0 0,2 0,4 0,6 0,8 1,0
Relative pressure (P/P°)
Ads
orbe
d vo
lum
e (c
m3 .g
-1 S
TP)
0
1000
2000
3000
4000
5000
CD 16 - acetone - 200 / 10
CD 7 - water - 200 / 10
Figure V-5 Adsorption isotherms for two carbon aerogels elaborated with water and acetone
One can see through the Table V-3 and with the nitrogen adsorption isotherm that using the acetone as a solvent rather than water, implies an increase in the bulk density with a steep decrease of the porous volume and the specific surface area.
A big difference in the total pore volume is observed. Around 3.5 cm3/g for the carbon CD 7 while 0.9 cm3/g is reached for CD 16. The shape of the isotherm and the hysteresis are different, with a quasi mono-modal contribution for the CD 7 and the CD 16 shows a more extended isotherm for relative pressure varying from 0.6 to 0.9.
This difference can be seen in the figure below with the incremental pore volume as a function of the mean pore diameter, keeping in mind that the highest partial pressure corresponds to the highest pore size in the pore size distribution. The scale for the carbon CD 7 is on the right y-axis, in order to ease the reading of the graph.
0,00
0,04
0,08
0,12
0,16
0,20
1 10 100
Mean pore diameter (nm)
Incr
emen
tatio
n po
re v
olum
e (c
m3 /g
)
0,0
0,5
1,0
1,5
2,0
2,5
3,0
3,5
4,0
CD-16 - acetone 200/10
CD-7 - water 200/10
2 nm - validity limit
Figure V-6 Pore size contribution on the pore volume as a function of the solvent used
The porous contribution is downshifted to smaller pore size when an acetone solvent is used, and a bi-modal contribution is observed compared to the CD 7 sample, where the porosity is solely attributed to large mesopores and small macropores with diameters varying from 40 to 100 nm. The acetone samples are dense and seem not to be extremely porous samples, with an extremely closed structure as it has been observed with the TEM analysis.
The nitrogen adsorption and desorption isotherms for the CD 10 sample could not be determined, as the carbon responded like a non-porous material. Comparing the bulk (1.57 g.cm-3) and the skeleton

Chapter V Characterisation and experimental results of hydrogen storage on the carbon materials elaborated
140
density (1.91 g.cm-3) of the sample some porosity is present in the sample which is not accessible to the nitrogen gas, but that could be for smaller gases such as hydrogen. It is also possible that the porosity can either be open or closed, and in the latter case it cannot be measured with nitrogen adsorption. This shows the limits of the characterisation of the sample using a gas adsorption technique, as it only measures what is “visible” to the gas. In order to get more information on the sample, some small angle X-Ray scattering has been done on the carbon (refer to section 2.1.7), in order to obtain some response of the solid material present in the carbon.
The figure below shows the nitrogen isotherm with the normalised adsorbed volume (Vads/Vtotal) as a function of the partial pressure for the four samples with the same amount of catalyst and with an increasing solid weight percent. It also shows the pore size contribution to the pore volume for these samples.
0,0
0,2
0,4
0,6
0,8
1,0
0,0 0,2 0,4 0,6 0,8 1,0
Relative pressure (P/P°)
Nor
mal
ised
ads
orbe
d vo
lum
e
CD-9 200 / 40CD-4 200 / 30CD-2 200 / 20CD-7 200 / 10
constant R / C = 200increasing solid percent
0,0
0,2
0,4
0,6
0,8
1,0
1,2
1,4
1 10 100Mean pore diameter (nm)
Incr
emen
tal p
ore
volu
me
(cm
3 /g)
0,0
0,5
1,0
1,5
2,0
2,5
3,0
3,5
4,0
D 9 - 200 / 40D 4 - 200 / 30D 2 - 200 / 20D 7 - 200 / 10
2 nm - validity limit
increasing solid weight percent
Figure V-7 Influence of the chemistry on the isotherm and mean pore size contribution
It can be observed that the hysteresis loop shifts to lower partial pressures and higher normalised volume, which is due to a decrease in the total pore volume as can be seen on the right part of the figure above when the solid percent in the material increases. When properly observed, one can see that the hysteresis loop gets larger with increasing weight percent (except for sample CD4) with a slow transformation from the H1 type hysteresis to the H2 type hysteresis.
This observation is confirmed with the pore size distribution. With the increasing solid percent, one can observe that the unique intense peak observed for the sample CD-7 (around 80 nm) slowly decreases to two peaks, an intense one at 30 nm and a smaller just distinguishable one at 18 nm. When further increasing the solid percent, the intense peak is at 17 nm and the just about distinguishable peak at 9 nm. Finally, with a solid percent reaching 40%, the two peaks are visible, with the intense one at 15 nm and the second peak appears at the same diameter, around 9 nm, but is more intense. This wide pore size distribution is characteristic of the type H2 hysteresis observed on the left hand side of the figure above.
The following figure shows the pore size contribution to the pore volume for three different samples each elaborated with the same weight percent of solid but with different amount of catalysts.
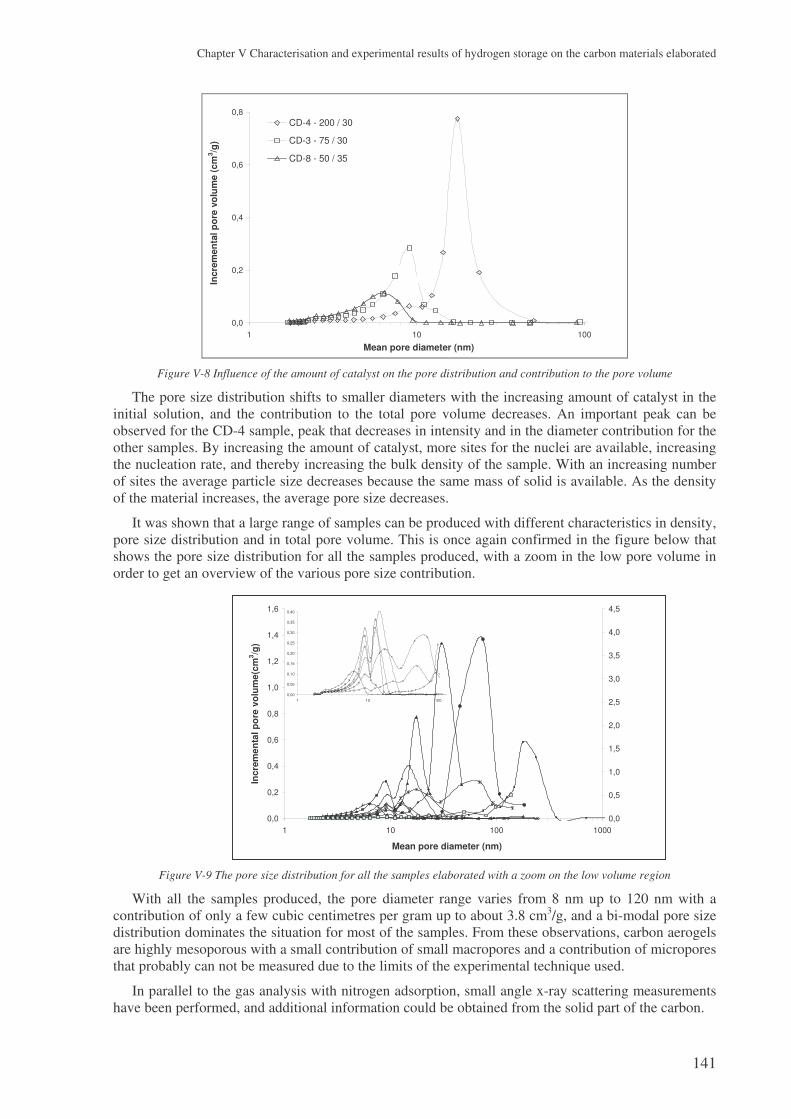
Chapter V Characterisation and experimental results of hydrogen storage on the carbon materials elaborated
141
0,0
0,2
0,4
0,6
0,8
1 10 100
Mean pore diameter (nm)
Incr
emen
tal p
ore
volu
me
(cm
3 /g)
CD-4 - 200 / 30
CD-3 - 75 / 30
CD-8 - 50 / 35
Figure V-8 Influence of the amount of catalyst on the pore distribution and contribution to the pore volume
The pore size distribution shifts to smaller diameters with the increasing amount of catalyst in the initial solution, and the contribution to the total pore volume decreases. An important peak can be observed for the CD-4 sample, peak that decreases in intensity and in the diameter contribution for the other samples. By increasing the amount of catalyst, more sites for the nuclei are available, increasing the nucleation rate, and thereby increasing the bulk density of the sample. With an increasing number of sites the average particle size decreases because the same mass of solid is available. As the density of the material increases, the average pore size decreases.
It was shown that a large range of samples can be produced with different characteristics in density, pore size distribution and in total pore volume. This is once again confirmed in the figure below that shows the pore size distribution for all the samples produced, with a zoom in the low pore volume in order to get an overview of the various pore size contribution.
Figure V-9 The pore size distribution for all the samples elaborated with a zoom on the low volume region
With all the samples produced, the pore diameter range varies from 8 nm up to 120 nm with a contribution of only a few cubic centimetres per gram up to about 3.8 cm3/g, and a bi-modal pore size distribution dominates the situation for most of the samples. From these observations, carbon aerogels are highly mesoporous with a small contribution of small macropores and a contribution of micropores that probably can not be measured due to the limits of the experimental technique used.
In parallel to the gas analysis with nitrogen adsorption, small angle x-ray scattering measurements have been performed, and additional information could be obtained from the solid part of the carbon.
0,00
0,05
0,10
0,15
0,20
0,25
0,30
0,35
0,40
1 10 100
0,0
0,2
0,4
0,6
0,8
1,0
1,2
1,4
1,6
1 10 100 1000
Mean pore diameter (nm)
Incr
emen
tal p
ore
volu
me(
cm3 /g
)
0,0
0,5
1,0
1,5
2,0
2,5
3,0
3,5
4,0
4,5

Chapter V Characterisation and experimental results of hydrogen storage on the carbon materials elaborated
142
2.1.7 SAXS analysis
Small Angle X-Ray Scattering measurements were performed at the French CRG beamline D2AM at the European Synchrotron Radiation Facility [201] (ESRF), Grenoble in France. Explanations on the theory of the SAXS are given in appendix 3, as well as the calculations that provide the various informations on the carbon.
The figure below represents a typical curve of the intensity scattered as a function of the wave vector. The intensity scattered is a arbitrary unit, and q the wave vector of the incident wave. As a recall, the high wave vectors describe the scattering by small particles in the carbon and the small wave vectors describe the large particles and elements in the carbon.
Figure V-10 SAXS curves of an organic and carbon aerogel
The figure shows two curves for a sample done in an aqueous solvent with the lower curve corresponding to the organic aerogel, and the top curve corresponding to the carbon aerogel one.
One can observe a few differences in the two curves in the various q domains. The curvature for q values around 0.05 Å -1 is due to the Guinier regime which corresponds to the particles in the cluster. Decreasing the q value shows a plateau in the intensity that corresponds to the response of a homogeneous phase. The sudden change in slope is due to the appearance of a new fractality in the sample, with larger particles. One can observe that between the organic and the carbon aerogels, the change in slope and the curvature is better defined in the carbon than in the organic aerogel. This is due to the breakout of the bondings of the heteroatoms, the reorganisation of the carbon and the elimination of the various oxygen derivatives, implying a specific scattering from the carbon. The greater the pyrolysis temperature the greater the structural reorganisation.
In the higher q domain, a change in slope is observed between 0.1 and 0.2 Å-1 due to the Porod regime in an extremely small q domain almost not distinguishable. This change of slope is not observed in the organic aerogel because it is a distinctive sign of the creation of the small primary particles during the pyrolysis of the organic aerogel in a carbon aerogel.
In order to determine the specific surface area of the carbon aerogel by X-Ray scattering, a region of the scattering spectrum is required where Porod scattering is present, where the intensity varies as q-4. For our samples, and this is seen on the figure above, the observed slope is only around –2.5. Owing to the small scale disorder in the carbon material this region at high q domain contains an additional signal, as can be observed when WAXS measurements are performed [199]. It may be assumed that this background signal is constant and the total intensity is then:
bqKqI += −4. )( equation V-1
1,0E-04
1,0E-03
1,0E-02
1,0E-01
1,0E+00
1,0E+01
1,0E+02
1,0E+03
0,001 0,01 0,1 1
q (A°-1)
I (a.
u)
Carbon aerogel
Organic aerogel
Guinier regime
slope ~ -3,8
slope ~ -2,5
Porod regimeslope = -4
new fractality

Chapter V Characterisation and experimental results of hydrogen storage on the carbon materials elaborated
143
or, as one is looking to calculate the surface area of the carbon, 44 .).( qbKqqI += equation V-2
The invariant Q used for measuring the specific surface area
( )Q
K....VA.S
aerogelaerogelX
φφπρρ
−== 111 equation V-3
is then equal to
∞
−=0
2.).)(( dqqbqIQ equation V-4
where φ is the ratio of the density of the aerogel over the density of the carbon skeleton. The values K and b are respectively the intercept at q=0 and the slope of the least square line fit to the equation V-1 to the data, and the ratio A/V is the area per unit volume of the sample.
The specific surface area, the particle and cluster size have been calculated using the Guinier and the Porod law, whereas the primary particle size and the pore size have been calculated using the two phase media model, and resumed in the Table V-4. Once again a complete description of the SAXS technique is presented in the appendix 3.
The figure below shows the effect of the solvent on the SAXS curve, with the scattering curves of two carbon aerogels with the same proportions of precursors and catalysts using two different solvents: water and acetone.
Figure V-11 SAXS curves showing the effect of the solvent
The differences between the two are visible with the intensity curves. The Guinier shift occurs at larger q-values for the acetone based carbon aerogel, meaning that the particles are essentially smaller. When plotting q-4 versus the wave vector, the maximum and minimum used for the determination of the particle size could not be observed for these q values. In this case only a limit in the maximum size can then be determined, which is already smaller than the particle size obtained for water based carbon aerogels. The mean cluster size is also smaller.
The Guinier plateau does not exist in the acetone based sample, which reveals inhomogeneities in the sample, and the slope in the low q domain reveals that the fractality in the acetone based samples is due to smaller particles. For similar chemical composition the acetone samples show a more close packed structure than the water based samples
The table below resumes all the nanostructural characteristics of the carbon aerogels measured and
1,0E-04
1,0E-03
1,0E-02
1,0E-01
1,0E+00
1,0E+01
1,0E+02
1,0E+03
0,001 0,01 0,1 1q (Å-1)
I (a.
u)
Acetone based carbon aerogel
Water based carbon aerogel

Chapter V Characterisation and experimental results of hydrogen storage on the carbon materials elaborated
144
calculated using the various experimental techniques described previously. CO2
adsorption at O°C
CD11 acetone 50 15 1,14 120 0,11 6,6 3,6 0,02 - - - - 1248 1,2 1,6 1,2
CD10 acetone 50 35 1,57 - - - - - - - - - 745 0,7 2,7 2,0
CD16 acetone 200 10 0,65 603 0,91 5 - 12 6,0 0,10 - - - - 1830 2,3 1,1 0,8
CD17 water 50 15 0,59 635 1,26 14 7,9 0,07 - - - - - - - -
CD8 water 50 35 0,81 644 0,67 5,4 4,2 0,07 0,26 6,5 7,2 2,8 1024 2,9 2,0 1,5
CD6 water 75 10 0,48 602 2,46 13 - 70 16,3 0,22 0,22 9,8 13,8 5,3 726 8,7 2,8 2,1
CD12 water 75 20 0,63 700 1,31 10 7,5 0,09 - 7,8 10,1 3,9 879 4,9 2,3 1,7
CD3 water 75 30 0,72 643 0,98 8,8 6,1 0,08 0,17 7,9 8,8 3,4 928 3,8 2,2 1,6
CD7 water 200 10 0,19 968 3,48 73 14,4 0,26 0,26 9,8 17,0 6,6 802 23,8 2,5 1,9
CD2 water 200 20 0,37 566 2,26 30 15,9 0,09 0,28 9,6 13,2 5,1 816 10,8 2,5 1,8
CD4 water 200 30 0,51 554 1,65 17 11,9 0,07 0,25 9,5 12,9 5,0 1006 5,8 2,0 1,5
CD9 water 200 40 0,65 863 1,68 10,2 7,8 0,14 0,25 9,4 12,1 4,7 921 4,5 2,2 1,6
CD20 water 300 5 0,09 705 0,85 18 - > 100 4,8 0,17 - - - - - - - -
R/Cdc
(nm)lg
(nm)ls
(nm)d
(nm)
Bulk density (g.cm-3)
mean pore D (4.Vp/SBET)
(nm)
Ssp
(m2/g)% Sol
Chemistry
Material Solvent
SAXS
V microporous
(cm3/g)
mean meso D
(nm)
Rg (nm)
Vp
(cm3/g)
Nitrogen Adsorption at -196°C
dp (nm)
SBET
(m2/g)
V microporous
(cm3/g)
Table V-4 Characterisation results of the carbon aerogels produced
The various legends are : SBET is the specific surface area measured through BET, Vp is the porous volume calculated with BET, mean meso D is the mean mesopore diameter measured in the desorption isotherm, mean pore D is calculated using BET and assuming spherical pores, dp is the particle size in the cluster measured in the Porod domain, dc is the cluster size calculated with the Guinier radius (Rg) assuming spherical particles. Ssp is the specific surface area measured through SAXS, lg and ls are the gaseous and solid chords in the two phase media model, and d is the mean particle size calculated using simple geometrical considerations and assuming a monodisperse distribution of the particle size.
The mean mesoporous diameter has been calculated using the pore size contribution to the pore volume of each sample, whereas the mean pore diameter has been calculated using the volume and the surface measured through nitrogen adsorption and BET. This latter technique has a major assumption that the pores are spherical with a monomodal distribution in the mesometric scale, and the difference between the two values of the mean mesopore size and the mean pore size can be attributed to this assumption. These two values are generally close and of the same order of magnitude, but some large differences can be observed for various samples, such as the CD-7, the CD-2 or the CD-20.
The gas chord length, which corresponds to the average pore size, is smaller when measured through SAXS. This is once again due to the fact that SAXS measurements are based on the scattering of the solid particles, and that small micropores are not taken into account in the estimation of the mean pore size, as determined through nitrogen adsorption.
The microporous volume determined through the BET model is subject to controversies, as the technique is generally considered to be limited to pore size of dimension around 2 nm, which is the upper end of the micropore size. We have been able to perform some CO2 adsorption measurements at 0°C on several samples and the microporous volume was determined for these samples. Compared to nitrogen, carbon dioxide tends to adsorb solely on the high energy sites, and these more energetically favourable sites are assimilated to the contact surfaces between the contiguous particles and to a microporous volume. The experimental temperature used for the adsorption of CO2 (0°C) being higher than for nitrogen (-196°C), the thermal energy (kT, with T in degree Kelvin) is much higher for the CO2 than for N2, which enables the CO2 molecule to overcome these energy barriers to diffuse to the smallest sites.
Comparing the two values of micropore volume obtained by BET and by CO2, one can see that differences exist, and the microporous volume determined by the adsorption of CO2 is always significantly larger than the micropore volume determined by BET, and is a more representative value

Chapter V Characterisation and experimental results of hydrogen storage on the carbon materials elaborated
145
of the microporous volume in the sample.
When similar values are found between the two, for samples CD 6 or CD 7 for example, a similar order of magnitude for the specific surface area is observed when measured through SAXS or BET, meaning that the internal structure of the material is quite open and the pore structure accessible to the gas, might it be nitrogen, carbon dioxide and hopefully hydrogen. All these samples have a low amount of solid, and thereby a low density and a high pore volume. They consist essentially of homogeneous structures of relatively large particles and cluster size, with the gaseous chord length calculated in the two phase media model that is quite important.
On the other hand, when large differences are observed between the two values, such as samples CD-8, CD-3, CD-2, CD-4, CD-9, it can be observed that the specific surface area measured through the SAXS is much larger than the specific surface area measured through BET. These samples all contain larger amounts of solid in the initial chemistry, with an increasing density and a decreasing pore volume.
The difference in pore volume is due to the fact that nitrogen does not penetrate the smallest pores that are considered as micropores whereas the CO2 at 0°C can. It is therefore most probable that this volume is accessible to hydrogen.
As for the specific surface area, the difference is either due to the open microporous surface that is not accessible to nitrogen and therefore not calculated in the total surface area through BET or to a certain amount of closed structures that are not measured with gas adsorption but with the scattering of the solid particles. Nevertheless, the greater the microporous volume measured through CO2 adsorption the lesser the structure is closed and inaccessible to gas. CO2 adsorption measures the volume of smaller gaseous internal structures in the material, which are also included in the specific surface area measured through SAXS.
One can see using the SAXS data that the particle size (dp), and more significantly the cluster size (dc), decreases with an increasing amount of solid when the amount of catalyst is kept constant. With a larger amount of matter available, a larger number of sites are created with a smaller particle and cluster size. The two entities are close in size to each other, and with the observation that the Porod regime lies in less than a decade in wave vector it could be possible that the primary particles that constitute the cluster are measured using the two phase media model (d or ls) and that dp and dc actually represent the same physical solid matter. It could also be possible that the assumption of spherical particles is not valid, which could be confirmed by the BET concerning the pores, and therefore the Guinier radius conversion to the particle size is not valid. The particle size would then be in the range of 1.5 and 2.1 nm for the water based carbons and between 0.8 and 2 nm for the acetone based samples, which confirms that the particles in the acetone based samples are smaller than those in the water based samples.
22..22 TThhee ssaammpplleess pprroodduucceedd bbyy tthhee hhiigghh tteemmppeerraattuurree ppllaassmmaa pprroocceessss
Three main families of carbon have been synthesised: carbon black, nanotube and fullerene rich soots under various conditions of temperature, catalyst, etc. The operating conditions have been chosen for the production of specific types of carbons, and the products have been tested for hydrogen storage in the experimental test bench. The samples will first be compared with their experimental conditions.
The analysis of these carbons has been inspired from the final report of the Plasmacarb project, entitled “Production of carbon nanoparticles, ranging from fullerenes over nanotubes to carbon black and graphite, using a plasma technology and their evaluation in different domains” under the contract number GRD1-1999-10617, and various articles and conference presentations [202,203,204,205]. The partners involved in this three year project are Armines (France), CNRS-IMP (France), UCL – Louvain (Belgium), DIK a German institute on the elastomer technology, Sintef - the Norwegian institute for scientific and industrial research, Premix (Finland), IECB a European institute on chemistry and biology (France) and Erachem-europe (Belgium) which were the project coordinator. This project was funded by the European Community either under the 'IMT/SMT' Programmes (1994-

Chapter V Characterisation and experimental results of hydrogen storage on the carbon materials elaborated
146
1998) or under the 'Competitive and Sustainable Growth' Programme (1998-2002).
It should be pointed out that Erachem-europe has been developing the process in partnership with Armines for the past ten years, and have been playing an important role on its development.
2.2.1 Carbon black
Five different carbon black samples have been selected amongst hundred different samples and taken in the filter, using four different precursors: ethylene (C2H4), a rapeseed oil (colza), methane and styrene.
CB01 N2 C2H4 Low Filter 84
CB02 N2 Colza oil Low Filter 79
CB03 N2 Colza oil Low Filter 74
CB04 N2 CH4 Low Filter 64
CB05 N2 Styrene Low Filter 24
SampleExperimental Conditions BET
Surface area (m²/g)Extraction
pointOrigin
Plasma Gas
Precursor
Table V-5 Carbon black samples produced
For one precursor, two different gas flow rates have been used in order to see if it affected the structure and the hydrogen storage capacities. One can see that concerning the BET surface area the same value is found around 75 m2.g-1 for the first four samples, whereas a smaller surface area of 24 m2/g is observed for the styrene sample. This surface area is considered to be low for this type of experimental conditions, where typically, the lowest specific surface areas obtained is around 50 m2/g. The low surface area of these carbon blacks is due to the fact that no oxygen is present during the plasma process, which implies that the carbon particles and the final material are not porous.
2.2.1.a High resolution electron microscopy analysis
Four plasma carbon black samples have been analysed by either SEM or HRTEM: CB-01, CB-02, CB-03 and CB-04.
The analysis reveals that the samples consist of sub-micron to micron size aggregates obtained by the fusion of elementary particles, showing typical acetylene black structures. No significant differences between the samples concerning the dimensions of aggregate and particle is observed and the main distinction consists in the crystallinity of the carbons and in the internal structure of the particles. The current particles have a concentric shape, while the best grades present a hollow shape. The carbon crystallinity is evaluated on the size and the perfection of the graphene layers.
The figure below shows an SEM photo of the sample CB-01 obtained by the decomposition of ethylene. The texture of the carbon black is characterised by the fineness of the particles that it is constituted. The aggregates are sub-micron in size, extremely fine when they can be analysed separately. They are generally linear with a small amount of ramifications.

Chapter V Characterisation and experimental results of hydrogen storage on the carbon materials elaborated
147
Figure V-12: Isolated carbon aggregate observed by SEM of CB-01 (X. Bourrat LCT-CNRS)
TEM observations of the sample CB-01 are shown below, giving an indication of the internal structure of the carbon black.
Figure V-13 CB-O1 sample showing (left) large high crystalline layers forming hollow shells and (right) single layers and
small stacking (X. Bourrat LCT-CNRS)
The CB-01 sample presents a homogeneous structure having the best fractions observed in acetylene blacks. It is a very crystallised carbon black forming hollow particles. The structure is not the structure of a graphite, but that of a giant multi-layered fullerene. This carbon is extremely homogeneous.
It is important to note the abundance of a carbon having a remarkable graphene quality. These particles present an over-abundant nucleation with a structure consisting of a single or a few layers.
SEM analysis of the samples CB-02 and CB-03 show two homogeneous structured samples with

Chapter V Characterisation and experimental results of hydrogen storage on the carbon materials elaborated
148
fine aggregates and particles. As expected, no differences can be observed between the two samples made with a rapeseed oil, but their internal structure, which can be observed through TEM and HRTEM, consists of concentric graphene layers of the acetylene type.
Figure V-14 Samples CB-02 and CB-03 at two different scales (SEM – UCL Louvain)
No TEM analysis of the CB-04 sample is available, but the following sample shows a carbon made with the same experimental conditions as CB-04.
Figure V-15 : Same experimental conditions as CB-04 with an over-abundant nucleation and limited growth (X. Bourrat
LCT-CNRS)
The CB-04 sample presents the structure of standard acetylene black. It is characterised by a large variation of structures. The most important part of the particles have more or less crystallised hollow structures, and the rest consists in large layers of polyhedral concentric particles and low quality small concentric structures.
The large range of the quality of these samples shows the evidence of the high flexibility of the plasma process. It gives the possibility of producing homogeneously all varieties of conducting carbons, especially structures never obtained in terms of quality of the homogeneity and crystallinity as CB-01.
2.2.1.b Formation mechanism of the carbon black particles
The mechanism of formation of the carbon particles in presence or not of oxygen have already been

Chapter V Characterisation and experimental results of hydrogen storage on the carbon materials elaborated
149
studied by a certain number of authors and a complete state of the art can be found [206].
A few theories exist, and for the formation of classical carbon blacks, the formation mechanism implies three distinctive steps:
1. nucleation or cluster formation 2. aggregation of particles due to the collision of a great number of clusters with characteristic
lengths between 1 and 2 nm 3. agglomeration of those spherical particles in long chains.
For the high temperature carbon blacks, acetylene type, the growth mechanism can slightly differ from this mechanism [206].
The nucleation stage is probably the most complex and less understood in the elaboration process, as it implies the association of primary molecular species, including free radicals, ions and clusters. For this nucleation stage, various theories have been suggested: the theory of the polycondensation of the aromatics, the acetylene theory and the condensation theory of C2.
The formation mechanism depends essentially on the type of precursor used (hydrocarbon), the operating conditions and the choice of the temperature. The role played by the chemical precursors such as C1, C2, C3, C2H, C2H2, C2H4, C2H6 etc. has its importance in the chemical process engaged in the formation of the carbon black particles:
Hudson theory
Abrahamson theory formation of the aromaticcycles
Molar fraction
Gaydontheories
Hudson theory
Abrahamson theory formation of the aromaticcycles
Molar fraction
Gaydontheories
Figure V-16 Correlation between the thermodynamic equilibrium diagram and the three main theories for the formation of carbon black [207,208]
From various works on carbon black, three distinguishable domains in the equilibrium diagram can be observed.
A. for temperatures ranging from 400°C up to 1400°C, the mechanisms are based on the poly-condensation of the aromatic cycles with the Abrahamson theory [209],
B. in the temperature range of 1400°C up to 3200°C, the formation mechanism is the acetylene theory with the Hudson and Porter theory [210],
C. for temperatures greater than 3200°C the mechanism of the carbon black particles formation is based on the atomic or polyatomic carbon.
The domain A is for the low temperature processes during which the theory is based on a polycondensation of the aromatic cycles with the formation of large polyaromatic molecules [209]. The predominant species at these temperatures are ethylene (C2H4), benzene (C6H6), methane (CH4) acetylene (C2H2) and hydrogen. Aromatic cycles and structures form from the benzene which leads to a molecular growth. This growth results in the formation of polycyclic aromatic hydrocarbons (PAHs) and the stabilisation of the radicals by the addition of these aromatic radicals to the unsaturated aliphatics such as the acetylene species present.

Chapter V Characterisation and experimental results of hydrogen storage on the carbon materials elaborated
150
In the case of the plasma process, the temperature reached inside the reactor is higher and the acetylene theory is the most appropriate one. As observed in the thermodynamic equilibrium diagram above, there is a strong concentration of acetylene and hydrogen. With the absence of oxygen in the process there is a complete conversion of the hydrocarbon into carbon, and hydrogen is produced as a valuable by-product and no CO2 or CO is produced making the process very advantageous.
Acetylene is considered as the main building block, and intermediate, in the formation of the carbon solid particles. Acetylene black was formed by the simultaneous polymerisation and dehydrogenation of the acetylene through the following mechanism [38] :
C + C2H2
H
C
H
C
H
C
H
C C C
H
C + C2H2
H
C
H
C
H
C
H
C C C
H The particles in the acetylene black are flat, sometimes hollow and resemble to crinkled paper
material made up of graphite sheets, as observed in Figure V-13.
Various precursors have been injected in the reactor with gas flows of up to a few kilograms per hour : methane, ethylene, styrene and different oils, including mineral and vegetable oils. These injections occurred at temperatures up to 3000°C. The carbons obtained with 100% efficiency exhibit amazing structures in homogeneity and crystallinity [189] and the production rate is of a few kilograms per hour.
2.2.1.c Conclusions
Generally, the carbon blacks studied are obtained by the growth of a fullerene-like carbon. This structure is hexagonal and exclusively formed of carbon atoms. Most of the aggregates analysed are formed of a carbon having abundant defects, and except for typical crystallographic defects (disclinations, dislocations, gaps, etc.), this process produces structures which are clearly in the giant fullerene family.
Independently of the specific enthalpy of the feedstock (the cracking temperature is controlled by the plasma energy input), different types of carbon blacks could be obtained, having large possibilities of technical applications. The quality of certain samples is comparable or superior to commercial acetylene blacks available on the market. The above mentioned plasma blacks show in comparison with the large volume reinforcing furnace blacks a too high graphitic structure. This higher graphitic state results from the higher specific energy input, and a reduction of the energy input would result into less graphitic carbon blacks.
2.2.2 Fullerene rich soots
In the case of the production of fullerene rich soots, the precursor injected in the process is a powdered carbon black sample and not a hydrocarbon anymore, which means that the chemistry is totally different than for the production of carbon black samples as no hydrogen is present during the process. The plasma gas used was helium and the low extraction point was used.
F-01 He Y50A Low Filter 78
F-02 He Y50A Low Wall 78
SampleExperimental Conditions BET
Surface area (m²/g)Extraction
pointOrigin
Plasma Gas
Precursor
Table V-6 Fullerene rich soot samples produced
As for the carbon black samples, two samples amongst hundreds were selected with specific operating conditions. The carbon precursor Y50A is an acetylene black, with a specific surface area of 70 m2.g-1 and an average particle size around 35 nm. For both samples the yield in fullerene is in the range of 1 to 5 % of C60+C70 in the soot.
The figure below presents the initial carbon feedstock acetylene black Y50A prior to the injection

Chapter V Characterisation and experimental results of hydrogen storage on the carbon materials elaborated
151
in the plasma process, and the fullerene soot after the injection showing the effect of the vaporisation and condensation of the initial feedstock.
100nm100nm
20nm20nm
BEFORE INJECTION
AFTER INJECTION
100nm100nm
20nm20nm
BEFORE INJECTION
AFTER INJECTION
100nm100nm
20nm20nm
BEFORE INJECTION
AFTER INJECTION
100nm100nm
20nm20nm
BEFORE INJECTION
AFTER INJECTION
Figure V-17 TEM of the carbon before and after the injection. On the left is the acetylene black Y50A - the feedstock - and on
the right is the fullerene rich soot F-01 (X. Bourrat LCT – CNRS)
Before injection, where the carbon feedstock is an acetylene black, the product corresponds to a highly organized turbostratic arrangement made of ramified aggregates. As opposed to furnace black where aggregates are made of a set of spherical particles, the particles in the acetylene black are flat, sometimes hollow and resemble to crinkled paper material. As for high temperature grades, the BET surface area is low and varies in the range of 40 to 70 m2.g-1.
After the injection, the structure of the fullerene soot appears different and amorphous, with no turbostratic or graphitic arrangements observed and the aggregates present a characteristic round shape. The fullerene soots obtained by the plasma are similar to those obtained by the different processes (arc, laser) [211,212]. As observed, the carbonaceous structure of the fullerene soot produced through the plasma process is globular and irregular. The fullerene soot has been described [213] as made up of small particles, coagulated with each other forming chains, and even though the appearance of the particles is disordered, an underlying graphitic structure can be observed through X Ray diffraction, which is consistent with the structure observed above.
This particular type of structure for the fullerene soot comes from the synthesis process, that energetically favours the curvature of the flat carbon sheets with the formation of pentagons, saturating the dangling bonds. This structure is preserved during the quench under an inert atmosphere [195,212,214].
Prior to the curvature of these carbon sheets, the most stable form of carbon radicals at high temperature in a carbon vapour is most likely to be a linear chain [212]. Once a certain number of carbons has been reached (from 30 to 40), these radical chains take the form of polycyclic aromatic rings, assimilated to these carbon sheets, that then curve to close the structure by saturating the dangling bonds.
Two important influencing parameters for a high yield in fullerene soots are the plasma gas and the carbon feedstock. The plasma gas used can either be nitrogen, argon and helium. In agreement with results obtained with the arc process and the experimental results with the plasma process, no traces of fullerenes were observed with nitrogen [194], which could be due to the formation of stable binary species at high temperature, such as CN, stopping the production of carbon clusters. Similarly, yields obtained with helium were greater than with argon. The thermal conductivity difference between helium and argon may be an explanation as the gas thermal conductivity plays a major role in the plasma to particle heat transfer, and a more efficient vaporisation of the particles may be obtained with

Chapter V Characterisation and experimental results of hydrogen storage on the carbon materials elaborated
152
helium than with argon.
Using nanometer sized particles showed a complete vaporisation of the carbon feedstock in the plasma, while in the case of larger particles such as cokes and graphite, only the external layers of the particles were affected by the plasma treatment [194]. This has been verified experimentally with the use of acetylene black grades and synthetic graphite powder corresponding to the smallest particle size for fullerene formation.
2.2.3 Nanotube rich soots
Various nanotube rich soots samples have been produced in different conditions of precursor, precursor flow rate, catalyst, extraction point and from two different origins in the reactor: the filter or the wall.
Three different experimental conditions have been chosen amongst a large variety and the choice has been based on the different structures that have been produced with these conditions.
NT 13 He Y50 + Ni powder ZR2 Wall 103
NT 16 He C2H4 Co/Ni Low Filter 73
NT 17 He C2H4 Co/Ni Low Wall 23
NT 18 N2 Y50 Co/Ni Low Filter 23
NT 19 N2 Y50 Co/Ni Low Wall 13
SampleExperimental Conditions
BET Surface area (m²/g)Extraction
pointOriginPlasma Gas Precursor
Table V-7 Nanotube rich soot samples produced
Three different structures will be presented, two of which have been produced with solid carbon particles mixed with some metal catalyst (NT-13, NT-18 and NT-19) and another type of structure has been produced using a mixture of ethylene gas and a metal catalyst as feedstock (NT-16 and NT-17).
In the first case, the synthesis of two nanostructures can be modified by changing the nature of the plasma gas in the reactor: when helium is used as plasma gas mainly carbon nanotubes of the bamboo type [53] are produced, whereas carbon nano-necklaces are produced when nitrogen is being used. The growth mechanisms of these two structures presented have been taken in a recent article by H. Okuno [215].
On the other hand, the presence of hydrogen in the ethylene gas when it is used as the initial feedstock changes the structure and carbon fibres are produced.
2.2.3.a Bamboo type carbon nanotubes
The sample NT-13 reveals a high presence of nanotubes, which could be expected when using an helium plasma gas, embedded in the carbon black used as the carbon source in the plasma technique. From the SEM observations, conical terminations are visible, as well as opened nanotubes displaying their cylindrical shape.

Chapter V Characterisation and experimental results of hydrogen storage on the carbon materials elaborated
153
Figure V-18 SEM of carbon nanotubes embedded into carbon black, as synthesised by the plasma process (Okuno – [215])
The diameter of the nanostructure ranges from 50 to 100 nm with a length in the order of a few microns, and although the SEM observations show no visible differences from the conventional carbon nanotubes, TEM and HRTEM images - Figure V-19 below - reveal a stacked-up structure consisting of a series of long hollow conical compartments instead of long cylinders.
Figure V-19 TEM of the bamboo-like structure with the catalyst particle observed at the end of the tube (left) and HRTEM
image (right) (Okuno – [215])
The graphene layers are not parallel to the axis, but parallel to the surface of the catalyst, and the conical angle is often close to 30°. These structures have already been observed and referred to as herring-bone. The graphitic sheets do not connect and surround a hollow core, and the end of the tube is often capped by the metal catalyst particle. This could imply a tip-like growth in analogy to the graphite nanofibres.
These carbon nanotubes are produced when helium is used as the plasma gas, in which case the temperature of the reactor walls is medium (1000 to 1300°C). This is due to the influence of the plasma gas on the arc-voltage of the plasma generator which modifies the power input and thereby the temperature prevailing in the system.

Chapter V Characterisation and experimental results of hydrogen storage on the carbon materials elaborated
154
A growth model for the bamboo tube has been proposed by Saïto [53] and illustrations by Okuno and Saïto are shown in the figure below.
Figure V-20 Schematic representation of the proposed growth mechanism for bamboo like nanotubes (left Saïto [53] and
right Okuno [215])
Considering the article by Okuno [215], at these medium temperatures the catalytic particles are still solid, although very close to the melting temperature of the Ni-C binary eutectic system (1311°C). The carbon nanotubes are suggested to form through the diffusion of carbon at the particle heated surface, which promotes its precipitation into graphite layers at the bottom and the sides of the nickel catalyst. Saïto [53] suggests that it is not clear whether the nickel particle at the tip was solid or liquid during the growth of the bamboo like tube, whereas Chen et al. [216], suggest that the movement of the metal catalyst is explained by the fact that the metal particles are in the quasi-liquid state.
As the carbon grow, nanotubes grow further and the metal particle is pushed upward, forming a metal cap which stabilises the dangling bond at the edge of the tube by saturating them. The motive force for pushing out the catalyst could be the stress accumulated in the graphitic sheath due to the carbon segregation from the inside.
The nanotube growth is stopped when the catalytic particle is completely solidified and encapsulated by graphene layers. This growth mechanism could explain the stacking of graphitic cones observed along one surface direction of the catalytic particle.
In the case of the presence of hydrogen in the process, such as in a hydrogen DC arc-discharge process, it was suggested [217] that the further growth was promoted by the decomposition of polycyclic aromatic hydrocarbons, created by interactions between the arc-generated carbon clusters and the atomic hydrogen, at the surface of the metal catalyst tip.
2.2.3.b Carbon nano-necklaces
Samples 18 and 19 reveal a third family of nanostructured carbon produced which are carbon nano-necklaces. On the contrary to the bamboo like nanotubes that have already been observed, these carbon nano-necklaces are unique structures that have not yet been reported in the literature.
When nitrogen is used as the plasma gas, the temperature in the reactor walls is higher (1700°C-2400°C) than with helium and carbon necklaces are formed, which is a typical structure formed when nitrogen is being used as the plasma gas.
Figure V-21 SEM analysis of sample NT 19 sample, BET=13m2/g (UCL – Louvain)

Chapter V Characterisation and experimental results of hydrogen storage on the carbon materials elaborated
155
Unlike the straight nanotubes carbon nano-necklaces usually curve smoothly and entangle together. The successfully joined segments are clearly seen.
TEM observations illustrate the repetition of an elementary unit looking like a nano-bell sometimes filled with the catalytic particles. These particle filled segments are observed as segments with dark core in Figure V-22. The joined segments in the carbon nano-necklaces are actually short variable-diameter compartments with one end sealed and the other one open. The number of graphitic layers can vary between the top of the nano-bell and its end as observed on the right of the figure below.
300 nm 50 nm
300 nm 50 nm
Figure V-22 TEM image (left) and HRTEM analysis (right) of the carbon necklace micro-structures (Okuno –[215])
The formation mechanism of these carbon necklaces is based on the vapour-liquid-solid model and is due to the fact that at these temperatures (1700-2400°C) the catalytic particles are in the liquid state. The formation of the carbon necklaces proceeds via solvation of carbon vapour into metal particles, diffusion through the bulk, followed by the precipitation of carbon in excess at the surface of the particles. A proposed growth mechanism is presented in Figure V-23.
When the catalytic particle is formed by condensation of metal plasma/vapour in the reactor, carbonaceous structures are preferentially adsorbed at its surface and dissolved in the liquid metal phase, leading to a carbon saturation. During the synthesis, the catalytic particle is able to incorporate a large amount of carbon (30 to 50 at%) depending on the local temperature and on its size.
Upon cooling, the solubility limit of carbon decreases and carbon starts to segregate. This effect increases as the temperature decreases and the segregation force is maximum close to the solidification temperature. Below this point, there is at equilibrium a complete segregation between metal and carbon. After complete solidification of the catalytic particles, no carbon is present in the metal, and once expulsed, the carbon crystallises at the surface of the metal particles forming graphitic sheets around the droplet (label 1 below).

Chapter V Characterisation and experimental results of hydrogen storage on the carbon materials elaborated
156
Figure V-23 Schematic representation of proposed growth mechanisms for carbon nano-necklaces. The black lines and
curves represent the graphitic layers and the catalytic particle is illustrated in light grey. The small black arrows represent the pressure on the catalytic particle while the big arrow shows the direction of the motion of the catalytic particle during the
growth process (Okuno - [215])
The formation of the first graphitic layers defines a volume for the particle, and after the formation of these layers the catalytic particle is trapped inside this volume. As the confinement increases, the particle elongates (label 2 in Figure V-23), allowing the formation of a longer graphitic layer explaining the thinning down observed.
When the compression is too high, the metal particle is expulsed from the bell-like graphitic structure and the process starts again (label 3). It can happen that the metal particle is not completely expelled explaining the catalyst entrapment in certain cavities of the necklaces.
A stronger concentration of necklace type carbons has been observed in sample NT-19 than in sample NT-18. As the sample NT-19 has been taken on the walls of the reactor the sample has been kept at high temperature longer and the catalytic particle has been in the liquid state longer which could explain the stronger concentration of necklaces.
2.2.3.c Carbon nanofibres
The final nanostructure commonly found under certain operating conditions, are the carbon fibres, observed in samples NT-16 and NT-17, with sample NT-16 taken in the filter (BET=73 m2.g-1) and sample NT-17 (BET=23 m2.g-1) taken on the walls of the reactor.
Figure V-24 SEM and TEM pictures of carbon fibres - sample NT-17 (H. Okuno : UCL – Louvain)
The growth of these fibres is the result of the thermal decomposition of the hydrocarbon in

Chapter V Characterisation and experimental results of hydrogen storage on the carbon materials elaborated
157
presence of catalysts, which is a typical structure obtained at low temperature (< 1300°C) with hydrogen. The diameters of these carbon fibres are in the range of 20 to 50 nm with a length of a few microns.
The structure consists in fibres with a low degree of internal organisation and these fibres are also strongly entangled between one another. The black spots observed are the metal catalyst that are imprisoned in the fibre. The growth mechanism is closely similar than for the two previous carbon structures with the carbon diffusion in the metal catalyst followed by its repulsion along the catalyst. The shape of the fibre is dictated by the movement of the metal catalyst. The originality of the structure being that the graphite layers do not form around the metal catalyst particle, and the structure appears more like an axial stacking of carbon layers with a low degree of organisation forming the fibre. As for the ‘classical’ graphitic nanofibres, the core of the fibre is not hollow. This is a typical structure obtained in the plasma process in the presence of hydrogen.
The lower BET surface area for sample NT-17 is explained by the fact that it has been taken on the wall of the reactor. Due to a long residential time of the carbon at high temperatures on the wall, graphitisation occurs along the surface of the fibre, enveloping the fibre and thereby reducing the surface area accessible to the nitrogen during the adsorption measurements.
2.2.4 Conclusion on the carbons from the plasma process
Through the presentation of the various types of carbons produced, this original plasma process is highly flexible. It can produce a wide range of carbon materials, from carbon blacks to fullerenes over nanotubes, and new exotic forms of nanostructure, such as fibres, necklaces with nanobells and bamboo type nanostructures.
The BET measurements allow a good image of the type of product to be expected from the plasma process (SWNT, fibre, necklace) as a function of the operating conditions, and correlations can be made between the type of plasma gas used (helium or nitrogen), the sampling point (the wall or the filter) and the BET. Quantitative evaluation of the products can hardly be correlated to the operating conditions and can only be evaluated by a toluene extraction measurement for the fullerene rich soots and an imaging analysis, which is not always trust worthy as it depends on the selected imaging area.
Due to the large flexibility and controllability in terms of residence time and quenching rates, the plasma process shows a great potential for further developments and improvements on the carbon yield in the final soot. The efforts in trying to correlate operating conditions to the obtained products, with the final aim of understanding the carbon formation process inside the plasma system, show very promising characteristics and seem to be an indication that this process is capable of producing any kind of nanostructure, even novel structures not observed before by any other process.
2% $
33..11 PPrreesseennttaattiioonn ooff tthhee rreessuullttss
All the carbon aerogels samples have been tested as monolithic blocks, except for sample CD6 which was in powder, at a pressure of 100 bars and a temperature of 25°C.
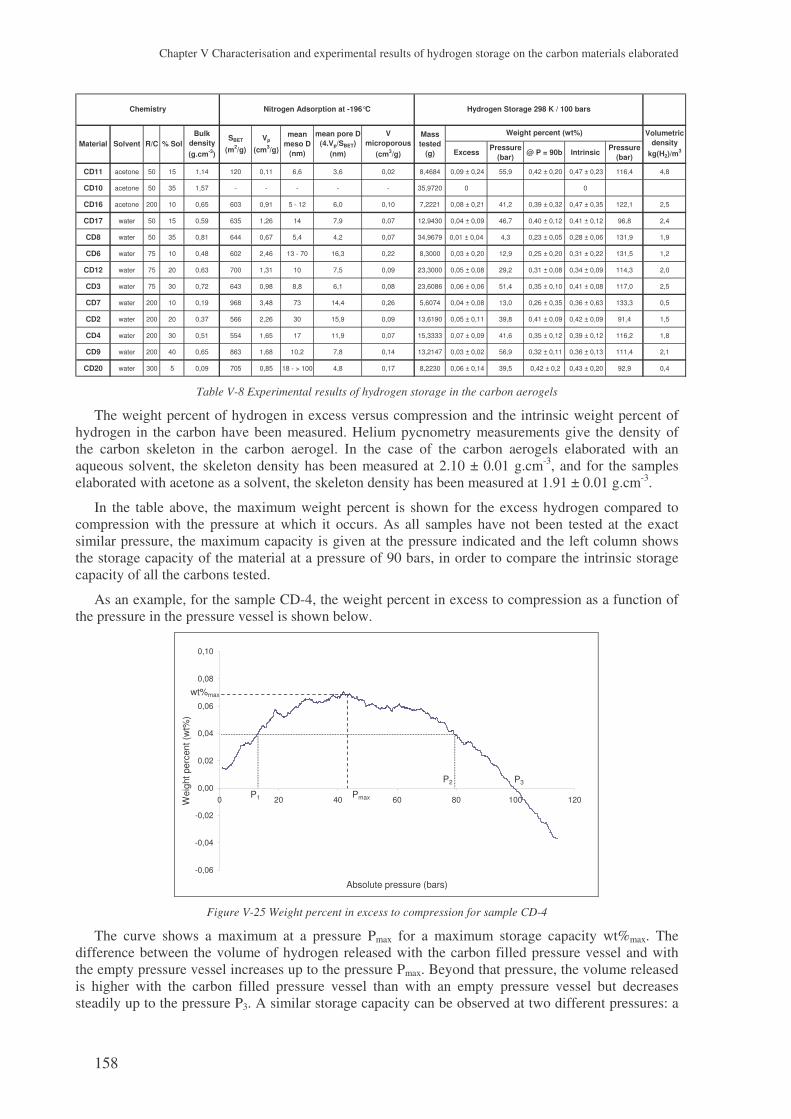
Chapter V Characterisation and experimental results of hydrogen storage on the carbon materials elaborated
158
Excess Pressure
(bar)@ P = 90b Intrinsic
Pressure (bar)
CD11 acetone 50 15 1,14 120 0,11 6,6 3,6 0,02 8,4684 0,09 ± 0,24 55,9 0,42 ± 0,20 0,47 ± 0,23 116,4 4,8
CD10 acetone 50 35 1,57 - - - - - 35,9720 0 0
CD16 acetone 200 10 0,65 603 0,91 5 - 12 6,0 0,10 7,2221 0,08 ± 0,21 41,2 0,39 ± 0,32 0,47 ± 0,35 122,1 2,5
CD17 water 50 15 0,59 635 1,26 14 7,9 0,07 12,9430 0,04 ± 0,09 46,7 0,40 ± 0,12 0,41 ± 0,12 96,8 2,4
CD8 water 50 35 0,81 644 0,67 5,4 4,2 0,07 34,9679 0,01 ± 0,04 4,3 0,23 ± 0,05 0,28 ± 0,06 131,9 1,9
CD6 water 75 10 0,48 602 2,46 13 - 70 16,3 0,22 8,3000 0,03 ± 0,20 12,9 0,25 ± 0,20 0,31 ± 0,22 131,5 1,2
CD12 water 75 20 0,63 700 1,31 10 7,5 0,09 23,3000 0,05 ± 0,08 29,2 0,31 ± 0,08 0,34 ± 0,09 114,3 2,0
CD3 water 75 30 0,72 643 0,98 8,8 6,1 0,08 23,6086 0,06 ± 0,06 51,4 0,35 ± 0,10 0,41 ± 0,08 117,0 2,5
CD7 water 200 10 0,19 968 3,48 73 14,4 0,26 5,6074 0,04 ± 0,08 13,0 0,26 ± 0,35 0,36 ± 0,63 133,3 0,5
CD2 water 200 20 0,37 566 2,26 30 15,9 0,09 13,6190 0,05 ± 0,11 39,8 0,41 ± 0,09 0,42 ± 0,09 91,4 1,5
CD4 water 200 30 0,51 554 1,65 17 11,9 0,07 15,3333 0,07 ± 0,09 41,6 0,35 ± 0,12 0,39 ± 0,12 116,2 1,8
CD9 water 200 40 0,65 863 1,68 10,2 7,8 0,14 13,2147 0,03 ± 0,02 56,9 0,32 ± 0,11 0,36 ± 0,13 111,4 2,1
CD20 water 300 5 0,09 705 0,85 18 - > 100 4,8 0,17 8,2230 0,06 ± 0,14 39,5 0,42 ± 0,2 0,43 ± 0,20 92,9 0,4
Vp
(cm3/g)
Nitrogen Adsorption at -196°C
SBET
(m2/g)
Hydrogen Storage 298 K / 100 bars
% Sol
Chemistry
Material SolventV
microporous (cm3/g)
mean meso D
(nm)R/C
Weight percent (wt%)Mass tested
(g)
Volumetric density
kg(H2)/m3
Bulk density (g.cm-3)
mean pore D (4.Vp/SBET)
(nm)
Table V-8 Experimental results of hydrogen storage in the carbon aerogels
The weight percent of hydrogen in excess versus compression and the intrinsic weight percent of hydrogen in the carbon have been measured. Helium pycnometry measurements give the density of the carbon skeleton in the carbon aerogel. In the case of the carbon aerogels elaborated with an aqueous solvent, the skeleton density has been measured at 2.10 ± 0.01 g.cm-3, and for the samples elaborated with acetone as a solvent, the skeleton density has been measured at 1.91 ± 0.01 g.cm-3.
In the table above, the maximum weight percent is shown for the excess hydrogen compared to compression with the pressure at which it occurs. As all samples have not been tested at the exact similar pressure, the maximum capacity is given at the pressure indicated and the left column shows the storage capacity of the material at a pressure of 90 bars, in order to compare the intrinsic storage capacity of all the carbons tested.
As an example, for the sample CD-4, the weight percent in excess to compression as a function of the pressure in the pressure vessel is shown below.
-0,06
-0,04
-0,02
0,00
0,02
0,04
0,06
0,08
0,10
0 20 40 60 80 100 120
Absolute pressure (bars)
Wei
ght p
erce
nt (w
t%)
Pmax
wt%max
P1
P2 P3
Figure V-25 Weight percent in excess to compression for sample CD-4
The curve shows a maximum at a pressure Pmax for a maximum storage capacity wt%max. The difference between the volume of hydrogen released with the carbon filled pressure vessel and with the empty pressure vessel increases up to the pressure Pmax. Beyond that pressure, the volume released is higher with the carbon filled pressure vessel than with an empty pressure vessel but decreases steadily up to the pressure P3. A similar storage capacity can be observed at two different pressures: a

Chapter V Characterisation and experimental results of hydrogen storage on the carbon materials elaborated
159
weight percent of 0.04 wt% can be obtained for a pressure P1 or a pressure P2, and as P1 < P2 the first pressure will be used as it implies lower costs. Nevertheless, the most suitable conditions in this case are a pressure of Pmax for which the maximum weight percent in excess as compared to a system in pure compression is obtained.
The presence of the carbon in the pressure vessel has a positive effect up to the pressure P3. Beyond that pressure, the volume of hydrogen released with the carbon in the pressure vessel is lower than the volume of hydrogen released in an empty pressure vessel, making it useless at pressures greater than P3.
When looking at the intrinsic weight percent of hydrogen stored in the same material as above, the following curve is obtained :
0,00
0,05
0,10
0,15
0,20
0,25
0,30
0,35
0,40
0,45
0 20 40 60 80 100 120
Absolute pressure (bars)
Intr
insi
c w
eigh
t per
cent
(wt%
) error = +/- 0.12 wt%
90
Figure V-26 Intrinsic weight percent of hydrogen for sample CD-4
The curve shows a constant increase up to the maximum pressure of test, with a change in slope all along due to the saturation of the carbon in hydrogen. One could expect the intrinsic weight percent to increase with pressure, until a horizontal asymptote is reached meaning that the maximum storage capacity is obtained, and that all the adsorption sites in the carbon are filled with hydrogen.
33..22 MMiiccrroossttrruuccttuurraall eeffffeecctt oonn tthhee hhyyddrrooggeenn ssttoorraaggee
The results obtained through hydrogen storage measurements will be compared to the structural characteristics of the carbon aerogels. The weight percent of hydrogen used during this study is the intrinsic weight percent of hydrogen measured at 90 bars for all the carbon aerogel samples, in order to compare results obtained in the same conditions of pressure and temperature.
3.2.1 Influence of the specific surface area
The specific surface area has been measured through two experimental techniques: Small Angle X-Ray Scattering (SAXS) and nitrogen adsorption. Nitrogen adsorption measures the surface area of the pores that are open and accessible to the gas, whereas the SAXS measures the surface area of the pores that are open and closed, including the small micropores which are not measured through the nitrogen adsorption. Even though they both measure a surface area, they have been obtained through different techniques, and a difference on the correlation between storage capacity and surface area can be observed.
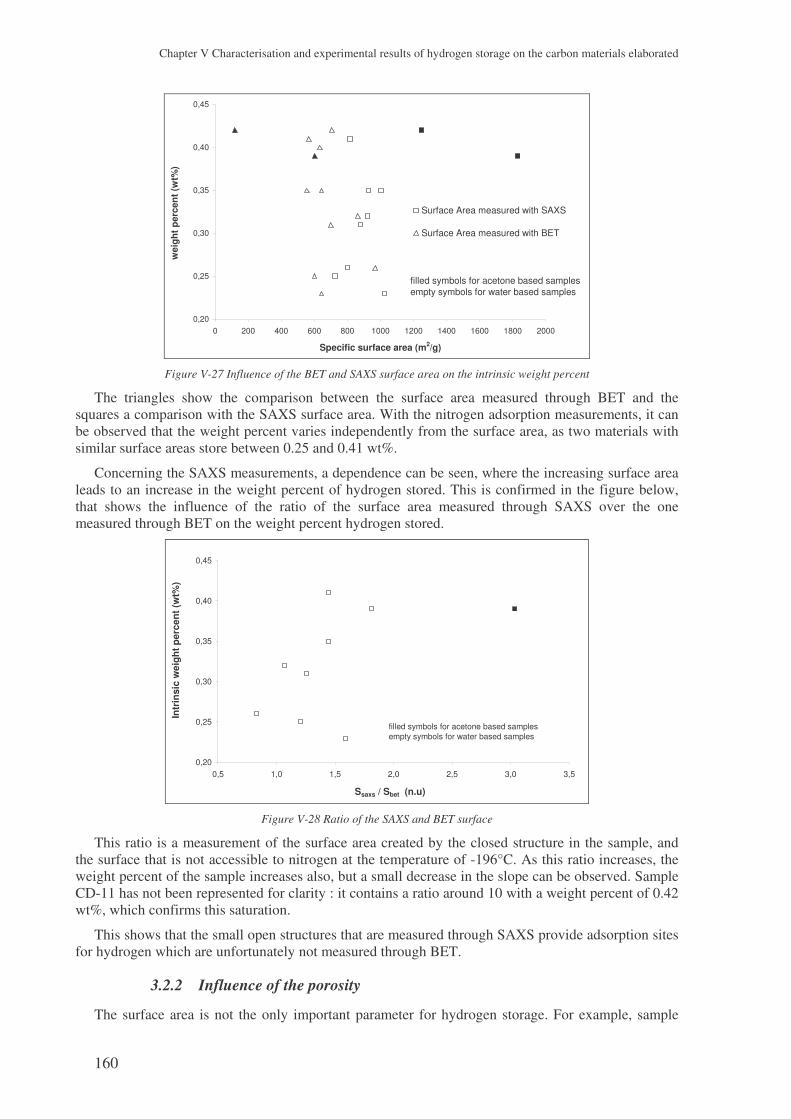
Chapter V Characterisation and experimental results of hydrogen storage on the carbon materials elaborated
160
0,20
0,25
0,30
0,35
0,40
0,45
0 200 400 600 800 1000 1200 1400 1600 1800 2000
Specific surface area (m2/g)
wei
ght p
erce
nt (w
t%)
Surface Area measured with SAXS
Surface Area measured with BET
filled symbols for acetone based samplesempty symbols for water based samples
Figure V-27 Influence of the BET and SAXS surface area on the intrinsic weight percent
The triangles show the comparison between the surface area measured through BET and the squares a comparison with the SAXS surface area. With the nitrogen adsorption measurements, it can be observed that the weight percent varies independently from the surface area, as two materials with similar surface areas store between 0.25 and 0.41 wt%.
Concerning the SAXS measurements, a dependence can be seen, where the increasing surface area leads to an increase in the weight percent of hydrogen stored. This is confirmed in the figure below, that shows the influence of the ratio of the surface area measured through SAXS over the one measured through BET on the weight percent hydrogen stored.
0,20
0,25
0,30
0,35
0,40
0,45
0,5 1,0 1,5 2,0 2,5 3,0 3,5
Ssaxs / Sbet (n.u)
Intr
insi
c w
eigh
t per
cent
(wt%
)
filled symbols for acetone based samplesempty symbols for water based samples
Figure V-28 Ratio of the SAXS and BET surface
This ratio is a measurement of the surface area created by the closed structure in the sample, and the surface that is not accessible to nitrogen at the temperature of -196°C. As this ratio increases, the weight percent of the sample increases also, but a small decrease in the slope can be observed. Sample CD-11 has not been represented for clarity : it contains a ratio around 10 with a weight percent of 0.42 wt%, which confirms this saturation.
This shows that the small open structures that are measured through SAXS provide adsorption sites for hydrogen which are unfortunately not measured through BET.
3.2.2 Influence of the porosity
The surface area is not the only important parameter for hydrogen storage. For example, sample

Chapter V Characterisation and experimental results of hydrogen storage on the carbon materials elaborated
161
CD-10 with a surface area measured through SAXS of 745 m2.g-1, did not adsorb any hydrogen. It did not respond to any nitrogen adsorption at -196°C, meaning it had no porosity accessible to nitrogen. On the other hand, the difference between the bulk and the skeleton density suggests that this sample has a certain amount of closed porosity and surface area that is currently not accessible for hydrogen. It can be concluded that the porosity in a sample is important for hydrogen adsorption, and that this sample could be thermally treated in order for the closed porosity present to provide accessible sites for hydrogen.
The porosity is characterised by the total pore volume in the sample and the pore size distribution in the sample. The figure below shows the influence of the pore and micropore volume, given thanks to the nitrogen adsorption data, on the weight percent hydrogen stored (left) and the various pore contribution on the weight percent, as well as the ratio of the surface area measured through SAXS and through BET (right).
0,20
0,25
0,30
0,35
0,40
0,45
0,0 0,5 1,0 1,5 2,0 2,5 3,0
Porous Volume (cm3/g)
Wei
ght p
erce
nt (w
t%)
porous volume
Microporous volume
0
10
20
30
40
50
60
70
80
90
100
0,20 0,25 0,30 0,35 0,40 0,45
Weight percent stored (wt%)
Rel
ativ
e vo
lum
e co
ntri
butio
n (%
)
0
2
4
6
8
10
12
Rat
io S
sax
s / S
bet
Pores less than 10 nmPores between 10 and 50 nmPores larger than 50 nmS saxs / S bet
lowmedium
high
Figure V-29 Influence of the pore volume and pore size on the weight percent hydrogen
For every sample, the relative contribution to the pore volume has been calculated for three pore size domains: for pores smaller than 10 nm, for pores with a diameter in the 10 to 50 nm range and pores larger than 50 nm. Only a small amount of data is available for the micropores, and therefore it was decided to include in the micropores, the small mesopores. The relative volume contribution of the various pore domains has been calculated, and for every sample, these relative contributions were shown as a function of the weight percent hydrogen stored. The ratio of the surface area measured through SAXS over the surface measured through nitrogen adsorption has also been shown in order to show the effect of the closed surface in parallel to the pore size on the weight percent hydrogen.
The graph on the left hand side shows that a highly porous volume is not necessarily a guarantee of a high storage of hydrogen, and samples with a small pore volume can store as much, and as little, as a sample with a high pore volume. This could mean that beyond the pore volume in the sample, the important parameter is the specific contribution of the various pore sizes to the total pore volume in the sample.
Concerning the microporosity in the sample, a small decrease in the weight percent is observed, but with a large scattering in the data it is difficult to conclude on the fact that the microporous volume is essential in the storage of hydrogen. Considering our samples that contain some closed structure, or inaccessible to nitrogen, the microporous volume measured through nitrogen adsorption is not always an appropriate indicator of the total microporous volume. Micropores can be measured either through CO2 adsorption for the accessible pores or by SAXS measurements that measure the entirely closed pores and the small micropores.
From the right graph on the figure above no general conclusions can be taken, and it has been decided to separate three areas of weight percent: the low, the medium and the high weight percents.

Chapter V Characterisation and experimental results of hydrogen storage on the carbon materials elaborated
162
0
10
20
30
40
50
60
70
80
90
100
0,22 0,23 0,24 0,25 0,26 0,27
Weight percent stored (wt%)
Rel
ativ
e vo
lum
e co
ntri
butio
n (%
)
0,5
0,7
0,9
1,1
1,3
1,5
1,7
1,9
Rat
io S
sax
s / S
bet
Pores less than 10 nmPores between 10 and 50 nmPores larger than 50 nmS saxs / S bet
CD-8
CD-6CD-7
Figure V-30 Pore size contribution to the weight percent of hydrogen stored
Starting with the low weight percents of hydrogen stored, it is observed that a sample solely composed of pores less than 10 nm is not sufficient for storing hydrogen, and when no small pores are present in the sample, mesopores are required. The extremely high small pore contribution can probably be due to the high surface ratio of 1.5 (SSAXS/SBET), that reveals a closed structure, which explains the low mesopore contribution in the sample.
The increase in the weight percent is accompanied by an increase in the contribution of the macropores, with a 30 % contribution of the mesopores and a small contribution of the small pores. The surface areas measured through SAXS and BET are similar, indicating that no closed structure is present in the carbon aerogel, and thereby does not contribute to the small weight percent.
The samples that show contributions of the three ranges of pores in the total pore volume do not exhibit high storage capacities, and mesopores are required for storing hydrogen.
For medium storage capacities, mesopores are still present while no macropores are observed. The common fact in the figure below, is that the macropores do not contribute at any stage to the storage of hydrogen. A decrease in the contribution of the micropores accompanied with an increase in the contribution of the mesopore volume leads to an increase in the weight percent, meaning that the mesoporous contribution is the most important for promoting hydrogen storage, accompanied with a small presence of micropores.
0
10
20
30
40
50
60
70
80
90
100
0,30 0,31 0,32 0,33 0,34 0,35 0,36
Weight percent stored (wt%)
Rel
ativ
e vo
lum
e co
ntri
butio
n (%
)
0,0
0,2
0,4
0,6
0,8
1,0
1,2
1,4
1,6
1,8
2,0
Rat
io S
sax
s / S
bet
Pores less than 10 nmPores between 10 and 50 nmPores larger than 50 nmS saxs / S bet
CD-12CD-9
CD-4
CD-3
Figure V-31 Pore size contribution to the weight percent of hydrogen stored
On the other hand, two samples store 0.35 wt% hydrogen with two opposite pore contributions: a

Chapter V Characterisation and experimental results of hydrogen storage on the carbon materials elaborated
163
sample has a high mesoporous and a small microporous contribution and reversibly for the other one, but both samples have a high surface ratio. This essentially means that the samples contain a large proportion of closed structure and pores that are inaccessible to nitrogen but to hydrogen, altering the pore contribution measured through SAXS.
Finally, the high range of hydrogen stored is shown below. In this case, the sample that stores the largest amount of hydrogen is the sample (CD-20) with the highest macropore contribution to its pore volume. This sample has 55% macropores, 28% mesopores and 17% micropores. As compared to a sample in Figure V-30 (sample CD-7) with a high concentration of macropores, the contribution of the micropores seems to participate in the total amount of hydrogen stored in the sample.
0
10
20
30
40
50
60
70
80
90
100
0,38 0,39 0,40 0,41 0,42 0,43
Weight percent stored (wt%)
Rel
ativ
e vo
lum
e co
ntri
butio
n (%
)
0,0
0,2
0,4
0,6
0,8
1,0
1,2
1,4
1,6
1,8
2,0
Rat
io S
sax
s / S
bet
Pores less than 10 nmPores between 10 and 50 nmPores larger than 50 nmS saxs / S bet acetone based
samples
CD-16
CD-17
CD-2CD-20
CD-11
Figure V-32 Pore size contribution to the weight percent of hydrogen stored
The high storage capacity of the acetone sample could still be increased by opening the structure. This samples has an extremely high ratio of specific surfaces, implying that a large amount of the structure is closed or inaccessible to nitrogen.
Once again, the contribution of the pore size ranging from 10 to 50 nm appears important for the storage of hydrogen with a contribution of the pores smaller than 10 nm.
All the results above have been compared for all the samples together. The next step is to compare samples with similar ratios of resorcinol to catalyst, and the various contributions to the total pore volume.
0
10
20
30
40
50
60
70
80
90
100
0,22 0,24 0,26 0,28 0,30 0,32 0,34 0,36 0,38
Weight percent stored (wt%)
Rel
ativ
e vo
lum
e co
ntri
butio
n (%
)
1,15
1,20
1,25
1,30
1,35
1,40
1,45
1,50
Rat
io S
sax
s / S
bet
Pores smaller than 10 nm
Pores between 10 and 50 nm
Pores larger than 50 nm
S saxs / S bet
0
10
20
30
40
50
60
70
80
90
100
0,30 0,32 0,34 0,36 0,38 0,40 0,42
Weight percent stored (wt%)
Rel
ativ
e vo
lum
e co
ntri
butio
n (%
)
0,0
0,2
0,4
0,6
0,8
1,0
1,2
1,4
1,6
1,8
2,0
Rat
io S
sax
s / S
bet
Pores smaller than 10 nm Pores between 10 and 50 nmPores larger than 50 nmS saxs / S bet
Figure V-33 Pore size contribution to the weight percent stored for samples with a ratio R/C=75 (left) and R/C=200 (right)
Two different observations for these two series of sample. In the first case, for a high amount of catalyst, a stronger contribution of the small pores with respect to the mesopores appears to contribute in a favourable way to the storage of hydrogen. The reverse is true when small amounts of catalysts are being used for the elaboration of the carbon aerogels.
A greater amount of catalysts favours a structure with a large amount of small particles which in

Chapter V Characterisation and experimental results of hydrogen storage on the carbon materials elaborated
164
turn promotes the formation of small pores. A small amount of catalyst on the other hand increases the pore size up to a size that reveals appropriate for hydrogen storage.
3.2.3 The surface area
The relative contributions of the pore size to the volume confirms the fact that the small pores contribute less to the total pore volume than the mesopores or macropores. It was also observed that the mesopores are important in the storage of hydrogen, but always accompanied with a certain amount of microporosity. On the other hand, small pores contribute more in the surface area of the sample than do larger pores such as mesopores and macropores.
This is confirmed when looking at the pore size contribution to the total specific surface area in a sample compared with the weight percent of hydrogen stored.
0
10
20
30
40
50
60
70
80
90
100
0,20 0,25 0,30 0,35 0,40 0,45
Weight percent stored (wt%)
Rel
ativ
e su
rfac
e co
ntri
butio
n (%
)
0
2
4
6
8
10
12
Rat
io S
sax
s / S
bet
Pores less than 10 nmPores between 10 and 50 nmPores greater than 50 nmS saxs / S bet
Figure V-34 Percentage contribution of the pore size on the total BET surface area
When observing the general tendencies of this graph thanks to the specific lines shown, the greater the contribution of the small pores to the specific surface area, the greater the weight percent of hydrogen stored, but for every sample some mesoporosity is required. For example, the samples storing only 0.23 wt% hydrogen shows a total microporosity contribution, which is ideal, but the weight percent is weak because no mesoporosity is present.
When comparing the results in this graph to the previous discussion, the presence of the micropores in the samples are essential as they provide the specific surface necessary for hydrogen storage. It could be possible that the meso- and macro- porosity are required for the diffusion of the gas in the sample, such that the sample could physically adsorb on the surface area created by the smaller pores, with dimensions smaller than 10 nm.
Once again, as for any chemical or physical process, an optimum and a compromise should be done between the surface area created by the small pores for the adsorption of hydrogen on the surface and the mesopore volume created by the other pores for the diffusion of the gas in the internal structure of the carbon aerogel.
3.2.4 The gaseous chord length and the particle size
After developing the contribution of various pore domains to the weight percent of hydrogen stored, the influence of the size of the gaseous chord length measured from the two phase media model has been estimated on the weight percent.

Chapter V Characterisation and experimental results of hydrogen storage on the carbon materials elaborated
165
0,20
0,25
0,30
0,35
0,40
0,45
0 5 10 15 20 25
Dimension (nm)
Wei
ght p
erce
nt (w
t%)
Figure V-35 Gas chord length variation with the weight percent hydrogen
The tendency with this parameter is that the greater the gaseous chord length the smaller the weight percent hydrogen, and a gaseous chord length smaller than 5 nm appears to promote hydrogen storage in the carbon aerogel. A small gaseous chord length indicates a high packing density of the carbon particles, and most probably a small particle size.
There is no straight relationship between the particle size and the weight percent, but there is an indirect relationship when considering the influence of the diameter of the particle on the relative contribution of the pore size to the total volume.
0
20
40
60
80
100
6 8 10 12 14 16 18Particle diameter (nm)
Rel
ativ
e vo
lum
e co
ntri
butio
n (%
)
Pores smaller than 10 nmPores between 10 and 50 nmPores larger than 50 nm
Figure V-36 Evolution of the pore size contribution with the particle diameter
The figure above shows the evolution of the pore size contribution with the diameter of the particle calculated using the SAXS data. When the diameter of the particle increases the contribution of the pores in the range of 10 to 50 nm increases as does the pores of diameter greater than 50 nm. Moreover, the amount of pores smaller than 10 nm decreases, which is the evolution expected. Small particles pack more densely and the interparticle distance is smaller and so are the pores. For larger particles, the interparticle distance increases and larger pores are created, explaining the evolution of the contribution of the meso and macro pores in the material. The diameter of the particle thereby influences the relative contributions of the various pore size, might they be micro, meso or macroporous, and as observed previously, this relative percentage influences the weight percent of hydrogen stored in the material.

Chapter V Characterisation and experimental results of hydrogen storage on the carbon materials elaborated
166
3.2.5 Conclusions
All the carbon aerogel samples are porous materials with a relatively important surface area, and the aim of this study was to determine if the various pore contributions had an influence on the weight percent of hydrogen stored. In the two figures below, we tried to summarise the influence of the pore size contribution on the specific surface area and on the pore volume measured through nitrogen adsorption at -196°C, and the influence on the weight percent of hydrogen stored in our carbon aerogel samples.
0
10
20
30
40
50
60
70
80
90
100
500 550 600 650 700 750 800 850 900 950 1000
BET Surface area (m2/g)
Por
e si
ze c
ontr
ibut
ion
(%)
0,20
0,25
0,30
0,35
0,40
0,45
Wei
ght p
erce
nt h
ydro
gen
(wt%
)
Pores smaller than 10 nmPores between 10 and 50 nmPores larger than 50 nmWeight percent hydrogen
0
10
20
30
40
50
60
70
80
90
100
0,20 0,70 1,20 1,70 2,20 2,70 3,20
Pore volume (cm3/g)
Por
e si
ze c
ontr
ibut
ion
(%)
0,20
0,25
0,30
0,35
0,40
0,45
Wei
ght
per
cent
hyd
roge
n (w
t%)
Pores smaller than 10 nmPores between 10 and 50 nmPores larger than 50 nmWeight percent hydrogen
Figure V-37 Relationship between the pore size contribution, the specific surface area (left), the pore volume (right) and the
weight percent hydrogen stored in the carbon aerogel samples
The crosses indicate the weight percent of hydrogen stored in the sample on the secondary y-axis, and the primary y-axis is the pore size contribution of the various pore diameter in the sample. The x-axis is the BET surface area on the left hand side of the figure above and the pore volume on the right hand side.
On the left hand side, it can be seen that the greater the micropore size contribution to the surface area, the greater the weight percent of hydrogen stored and the smaller the pores between 10 and 50 nm contribute to the surface area.
It should be noted that the decision of extending the micropore range to pores smaller than 10 nm was done after a close observation of the pore size diagram originally obtained from the Micromeritics ASAP 2010 apparatus. The carbon aerogels generally show a bi-modal pore distribution and it appeared that the peak around 10 nm was always present with a peak at larger pore sizes, and therefore, in order to separate both peaks it was decided to include the pores of 10 nm in length in the micropores, and decrease the pore range of the mesopores to pores with diameters between 10 and 50 nm.
On the other hand, on the right hand side, the increase of the mesopore contribution to the pore volume shows an increase in the weight percent of hydrogen stored in the material, with a decreasing contribution of the pores smaller than 10 nm to the pore volume.
A bi-modal pore size distribution is required, with some pores in the range of 10 to 50 nm and a pore contribution in pores smaller than 10 nm. We have observed that various pore configurations are possible for hydrogen storage, but they always imply various proportions of the two as mentioned pore size.
A sample solely composed of pores smaller than 10 nm, or solely composed of pores with size between 10 and 50 nm, does not adsorb a large amount of hydrogen compared to a sample with the contribution of both pores. The mesopores, between 10 and 50 nm, have a larger contribution to the pore volume whereas the micropores, pores smaller than 10 nm, contribute more to the surface area.
The mesopores are essential as they bring the pore volume required for the diffusion of hydrogen in the sample, and the micropores provide the necessary adsorption sites for the hydrogen.
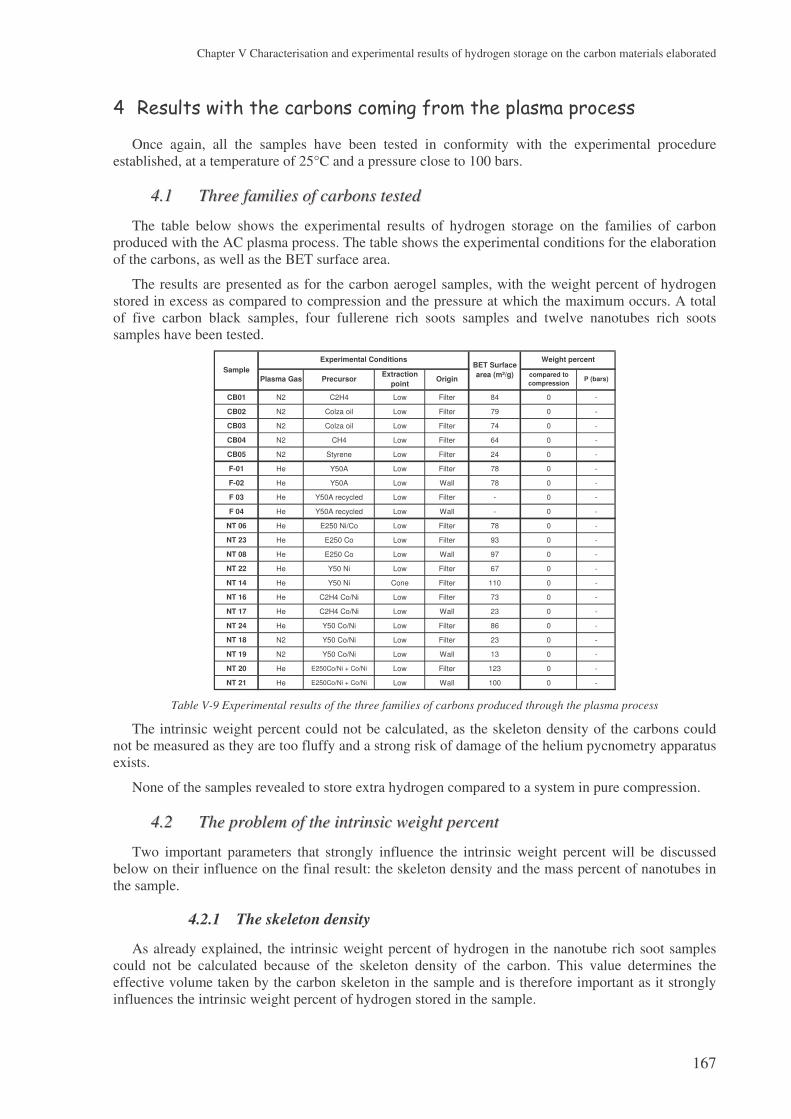
Chapter V Characterisation and experimental results of hydrogen storage on the carbon materials elaborated
167
% $
Once again, all the samples have been tested in conformity with the experimental procedure established, at a temperature of 25°C and a pressure close to 100 bars.
44..11 TThhrreeee ffaammiilliieess ooff ccaarrbboonnss tteesstteedd
The table below shows the experimental results of hydrogen storage on the families of carbon produced with the AC plasma process. The table shows the experimental conditions for the elaboration of the carbons, as well as the BET surface area.
The results are presented as for the carbon aerogel samples, with the weight percent of hydrogen stored in excess as compared to compression and the pressure at which the maximum occurs. A total of five carbon black samples, four fullerene rich soots samples and twelve nanotubes rich soots samples have been tested.
CB01 N2 C2H4 Low Filter 84 0 -
CB02 N2 Colza oil Low Filter 79 0 -
CB03 N2 Colza oil Low Filter 74 0 -
CB04 N2 CH4 Low Filter 64 0 -
CB05 N2 Styrene Low Filter 24 0 -
F-01 He Y50A Low Filter 78 0 -
F-02 He Y50A Low Wall 78 0 -
F 03 He Y50A recycled Low Filter - 0 -
F 04 He Y50A recycled Low Wall - 0 -
NT 06 He E250 Ni/Co Low Filter 78 0 -
NT 23 He E250 Co Low Filter 93 0 -
NT 08 He E250 Co Low Wall 97 0 -
NT 22 He Y50 Ni Low Filter 67 0 -
NT 14 He Y50 Ni Cone Filter 110 0 -
NT 16 He C2H4 Co/Ni Low Filter 73 0 -
NT 17 He C2H4 Co/Ni Low Wall 23 0 -
NT 24 He Y50 Co/Ni Low Filter 86 0 -
NT 18 N2 Y50 Co/Ni Low Filter 23 0 -
NT 19 N2 Y50 Co/Ni Low Wall 13 0 -
NT 20 He E250Co/Ni + Co/Ni Low Filter 123 0 -
NT 21 He E250Co/Ni + Co/Ni Low Wall 100 0 -
compared to compression
Weight percent
P (bars)Sample
Experimental ConditionsBET Surface area (m²/g)Extraction
pointOriginPlasma Gas Precursor
Table V-9 Experimental results of the three families of carbons produced through the plasma process
The intrinsic weight percent could not be calculated, as the skeleton density of the carbons could not be measured as they are too fluffy and a strong risk of damage of the helium pycnometry apparatus exists.
None of the samples revealed to store extra hydrogen compared to a system in pure compression.
44..22 TThhee pprroobblleemm ooff tthhee iinnttrriinnssiicc wweeiigghhtt ppeerrcceenntt
Two important parameters that strongly influence the intrinsic weight percent will be discussed below on their influence on the final result: the skeleton density and the mass percent of nanotubes in the sample.
4.2.1 The skeleton density
As already explained, the intrinsic weight percent of hydrogen in the nanotube rich soot samples could not be calculated because of the skeleton density of the carbon. This value determines the effective volume taken by the carbon skeleton in the sample and is therefore important as it strongly influences the intrinsic weight percent of hydrogen stored in the sample.

Chapter V Characterisation and experimental results of hydrogen storage on the carbon materials elaborated
168
This figure shows for a nanotube rich soot the influence of the skeleton density used in calculating the intrinsic weight percent of hydrogen. The highest skeleton density used was the density of pure graphite estimated to be 2.26 g.cm-3.
0,0
0,2
0,4
0,6
0,8
1,0
1,2
0 10 20 30 40 50 60 70 80 90 100
Absolute pressure (bars)
Intr
insi
c w
eigh
t per
cent
hyd
roge
n (w
t%)
d = 0.5 g.cm-3
d = 2.26 g.cm-3
d = 2 g.cm-3
d = 1.5 g.cm-3
d = 1 g.cm-3
decreasing skeleton density
Figure V-38 Influence of the skeleton density on the weight percent hydrogen stored
The smaller the density, the higher the intrinsic weight percent hydrogen stored in the sample. At 90 bars, dividing the skeleton density by two from 2 g.cm-3 to 1 g.cm-3, multiplies the intrinsic weight percent by a factor close to five. The mass of sample being constant, the volume taken by the carbon skeleton is higher thereby reducing the dead volume in the pressure vessel and increasing the volume of hydrogen adsorbed by the carbon and not compressed in the dead volume.
The skeleton density has a strong influence on the intrinsic weight percent of hydrogen stored in the carbon, and as no measured value can be obtained experimentally and as the materials are made of various different structures, no extrapolations will be done on the intrinsic weight percent of hydrogen stored in the carbons coming from the plasma process.
4.2.2 The weight percent of nanotubes
The next important influencing parameter is the weight percent of nanotubes in the sample, and the errors in the calculations that can be generated, especially when it is considered that the only contribution to the storage of hydrogen is the mass of nanotubes present in the sample.
Considering a specific mass percent of nanotubes - mass % NT - in a sample storing a certain weight percent of hydrogen - wt% - with a skeleton density equal to 1.5 g.cm-3, if the nanotubes are the only contribution to the storage of hydrogen, then the weight percent of hydrogen stored in the nanotubes is equal to
100* he sampletubes in tnt of nanomass perce
sampledrogen in cent of hyweight per nanotubes drogen in cent of hyweight per =
This weight percent has been calculated for a nanotube rich sample by assuming various weight percent of nanotubes.
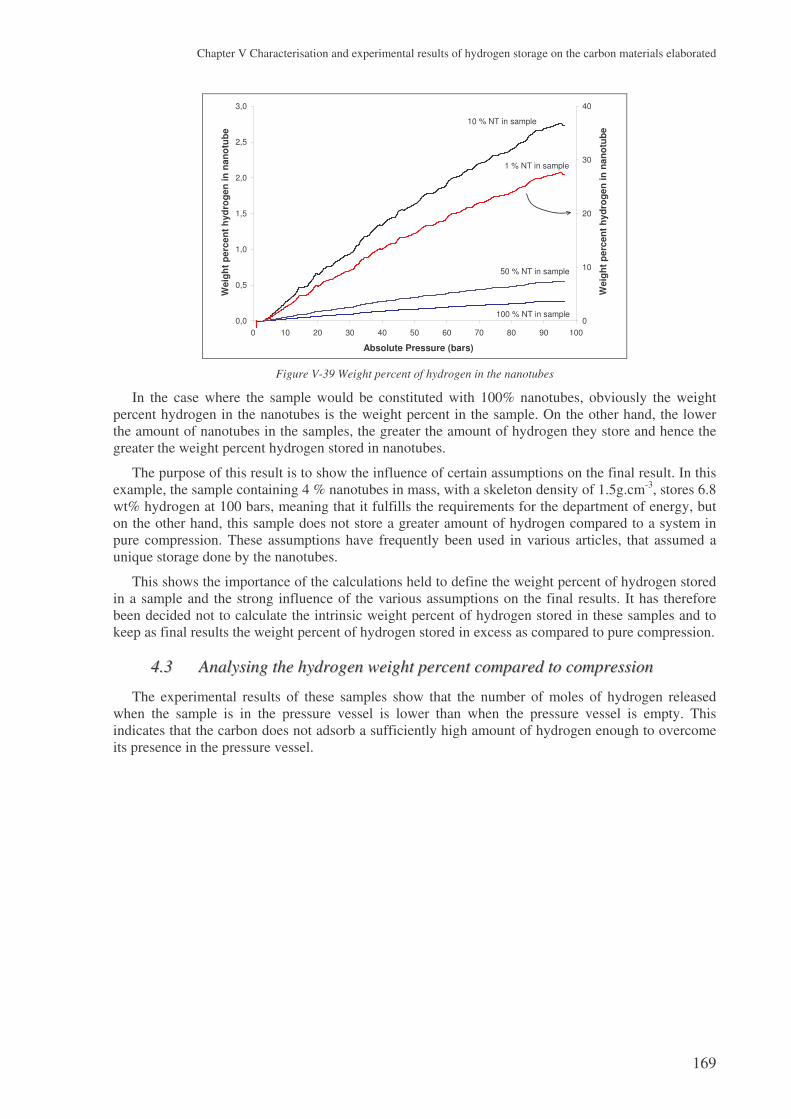
Chapter V Characterisation and experimental results of hydrogen storage on the carbon materials elaborated
169
0,0
0,5
1,0
1,5
2,0
2,5
3,0
0 10 20 30 40 50 60 70 80 90 100
Absolute Pressure (bars)
Wei
ght p
erce
nt h
ydro
gen
in n
anot
ube
0
10
20
30
40
Wei
ght p
erce
nt h
ydro
gen
in n
anot
ube
1 % NT in sample
100 % NT in sample
50 % NT in sample
10 % NT in sample
Figure V-39 Weight percent of hydrogen in the nanotubes
In the case where the sample would be constituted with 100% nanotubes, obviously the weight percent hydrogen in the nanotubes is the weight percent in the sample. On the other hand, the lower the amount of nanotubes in the samples, the greater the amount of hydrogen they store and hence the greater the weight percent hydrogen stored in nanotubes.
The purpose of this result is to show the influence of certain assumptions on the final result. In this example, the sample containing 4 % nanotubes in mass, with a skeleton density of 1.5g.cm-3, stores 6.8 wt% hydrogen at 100 bars, meaning that it fulfills the requirements for the department of energy, but on the other hand, this sample does not store a greater amount of hydrogen compared to a system in pure compression. These assumptions have frequently been used in various articles, that assumed a unique storage done by the nanotubes.
This shows the importance of the calculations held to define the weight percent of hydrogen stored in a sample and the strong influence of the various assumptions on the final results. It has therefore been decided not to calculate the intrinsic weight percent of hydrogen stored in these samples and to keep as final results the weight percent of hydrogen stored in excess as compared to pure compression.
44..33 AAnnaallyyssiinngg tthhee hhyyddrrooggeenn wweeiigghhtt ppeerrcceenntt ccoommppaarreedd ttoo ccoommpprreessssiioonn
The experimental results of these samples show that the number of moles of hydrogen released when the sample is in the pressure vessel is lower than when the pressure vessel is empty. This indicates that the carbon does not adsorb a sufficiently high amount of hydrogen enough to overcome its presence in the pressure vessel.

Chapter V Characterisation and experimental results of hydrogen storage on the carbon materials elaborated
170
0,00
0,05
0,10
0,15
0,20
0,25
0,30
0,35
0,40
0,45
0,50
0 10 20 30 40 50 60 70 80 90 100
Absolute Pressure (bars)
Num
ber
of m
oles
des
orbe
d (m
oles
)
Empty pressure vessel
With the carbon
Figure V-40 Number of moles of hydrogen released with or without the carbon in the pressure vessel
The gap between the two curves is extremely small at low pressure and increases when the pressure of hydrogen in the pressure vessel increases. The dead volume being constant in the pressure vessel, if the carbon does not adsorb any hydrogen, a smaller volume of hydrogen is released when the carbon is present in the pressure vessel due to the volume taken by the carbon, which explains this gap.
In the case of an adsorbing sample, the curve overlaps at low pressure until it crosses the curve for the hydrogen released with the empty pressure vessel. With increasing pressure the difference between the two curves increases as the adsorbing sample is saturated with hydrogen and can not take any more.
When the weight percent of hydrogen in excess as compared to a system in pure compression is calculated in the case of the figure above the following curve is obtained.
-0,4
-0,3
-0,2
-0,1
0,0
0,1
0 10 20 30 40 50 60 70 80 90
Absolute Pressure (bars)
Wei
ght p
erce
nt h
ydro
gen
(wt%
)
Figure V-41 Weight percent of hydrogen in excess as compared to compression for a nanotubes rich soot sample (NT 06)
As the weight percent of hydrogen is proportional to the difference in the number of moles of hydrogen released with and the carbon, the weight percent is negative, with a constant slope and this difference increases with the increasing pressure in the pressure vessel.
It appears as though these samples do not store any hydrogen and are impermeable to the gas. The nanostructure of these materials could be adapted to the storage of hydrogen but a post treatment is certainly required, in order to purify the material by taking the metal catalysts away, and creating the accession of the hydrogen to the adsorption sites. The structure is actually impervious to the gas and activating the materials under a flow of CO2 or O2 at a relatively high temperature would probably

Chapter V Characterisation and experimental results of hydrogen storage on the carbon materials elaborated
171
open the structure, creating some surface area and adsorption sites as well as hydrogen gas access to the nanostructure of the material.
.
Two samples of nanofibres produced with a solar process approach have been tested. They have been produced by the decomposition of ethylene on non supported catalysts. The catalysts consist in a mixture of nickel and copper (98:2), and the samples are produced at the same temperature of 580°C, the same pressure of 400 mbar and two different gas flow rates. For sample NF-15 the gas flow rates were 47.25 mmol/min for ethylene and 11.25 mmol/min for hydrogen, and for sample NF-7 the gas flow rates were respectively 15 mmol/min and 3.75 mmol/min.
An SEM photo of each sample is shown below.
Figure V-42 SEM of the samples NF 07 and NF 15 (David Luxembourg – PROMES/IMP-CNRS)
The two SEM photos are extremely similar in appearance with a high concentration of fibres in the sample. The sample NF-15 exhibits larger diameter fibres than the sample NF-07, which can be due to the choice of the photos. The fibres appear relatively long and strongly entangled. Nevertheless a large diversity in the diameter of the fibres is observed for both samples.
Some nitrogen adsorption has been done on the samples and they both show similar isotherms.
Figure V-43 Nitrogen adsorption isotherm plot for the sample NF 15 (J-F. Hochepied – ENSMP Paris)

Chapter V Characterisation and experimental results of hydrogen storage on the carbon materials elaborated
172
The isotherm reveals a type H3 hysteresis, which is usually given by adsorbents containing slit-shaped pores, and no plateau is observed at high partial pressures. The fact that the hysteresis extends on a large domain of partial pressures may suggest that the pore size distribution is wide, with no predominance of any pore size.
The experimental procedure for hydrogen storage is the same as for the samples produced with the plasma process, in the sense that the powder has been pelletised. The testing temperature and pressure are the same as for the previous samples and the results are exposed below:
IMP NF07 96 0 - 0,24 ± 0,19 0,25 ± 0,13 98,4
IMP NF15 112 0,01 ± 0,02 5 0,24 ± 0,16 0,25 ± 0,18 94,4
compared to compression
intrinsic if dbulk
2g/cm3P (bars) @ 90 bars
Weight percent
P (bars)Sample
BET Surface area (m²/g)
Table V-10 Experimental results on two nanofibre samples
The skeleton density of the sample has been estimated at 2 g.cm-3, and thereby the intrinsic weight percent could be calculated, with the experimental errors. This value has also be confirmed by the laboratory in Perpignan at a temperature of 20°C.
As for the nanostructured carbon issued from the plasma process, the materials do not store any hydrogen in excess as compared to a system in pure compression.
On the other hand, as for the carbon aerogel samples, the nanofibres have an intrinsic weight percent of hydrogen, and the shape of the curves are similar for both materials. The small difference being that in the nanofibre sample a change in curvature is observed at low pressure.
0,00
0,05
0,10
0,15
0,20
0,25
0 10 20 30 40 50 60 70 80 90 100
Pressure (bars)
wei
ght p
erce
nt (w
t%)
NF 15
NF 07
Figure V-44 Weight percent change for the nanofibres
The two samples show the same evolution of the curve up to the maximum pressure used for the measurement, which appears reasonable as their characteristics are similar in the surface area, nitrogen adsorption isotherm and in the SEM observations.
The experimental protocol used for the elaboration of these materials is extremely close to the experimental protocol used in the literature [218] which revealed storage capacities of 15 wt% of hydrogen at a temperature of 27°C and a pressure of 60 bars. In comparison with these results, the materials tested in the same conditions of temperature and pressure, show a storage capacity of 0.15 wt%, two orders of magnitude smaller than presented in the article !!
0 .
A large diversity of samples have been tested and all experiments have been held in the same conditions of temperature and pressure using the same purity in the hydrogen gas, and the same

Chapter V Characterisation and experimental results of hydrogen storage on the carbon materials elaborated
173
experimental protocol, as previously defined. The fluffy samples of nanofibres and the ones coming from the plasma process have been pelletised with the same experimental protocol in the same press, whereas the carbon aerogels samples have been tested as monoliths.
Similar calculations have been applied for all the results, except for the carbons coming from the plasma process, where the skeleton density could not be determined, and therefore only the weight percent of hydrogen in excess as compared to compression could be calculated.
Concerning the results compared to compression, the carbon aerogels show a maximum in weight percent and the shape of the curve is completely different than for the other samples.
-0,15
-0,10
-0,05
0,00
0,05
0,10
0 10 20 30 40 50 60 70 80 90 100
Absolute pressure (bars)
Wei
ght p
erce
nt h
ydro
gen
com
pare
d to
co
mpr
essi
on (w
t %)
D11 - acetone based carbon aerogel
D3 - water based carbon aerogel
NF 15 - nanofiber
NT 17 - nanotube rich soot
CB 01 - carbon blackerror = +/- 0.10 wt%
Figure V-45 Weight percent of hydrogen in excess as compared to compression for the three series of samples
The major difference being that the curve initially increases until it reaches a maximum and then decreases again, whereas for the other samples, the curve decreases in all the pressure range. For example, for the nanofibre sample, the storage occurs at a pressure below 10 bars, while the nanotube rich and the carbon black samples do not exhibit any extra storage.
The as received samples of nanotube and fullerene rich soots do not store any hydrogen beyond compression at a temperature of 25°C and a pressure up to 100 bars, which is a result that corresponds to the literature review. Even if the skeleton density of the samples were known, the intrinsic storage capacities would be below 0.1 wt% of hydrogen stored, which is the highest storage capacity observed when estimating the skeleton density of these samples to be 2 g.cm-3.
When turning these results into the intrinsic weight percent of hydrogen, the shape of the curve is similar for all the samples, the difference between the samples reside in their comparative ability to store hydrogen.

Chapter V Characterisation and experimental results of hydrogen storage on the carbon materials elaborated
174
0,00
0,05
0,10
0,15
0,20
0,25
0,30
0,35
0,40
0,45
0 20 40 60 80 100
Absolute pressure (bars)
Intr
insi
c w
eigh
t per
cent
hyd
roge
n (w
t%)
D11 - acetone based carbon aerogel
D3 - water based carbon aerogel
NF 15 - nanofiber
error = +/- 0.40 wt%
Figure V-46 Intrinsic weight percent hydrogen for three different samples
The carbon aerogel samples store intrinsically the largest amount of hydrogen compared to the nanofibre samples, but can not be compared to the samples coming from the plasma process, as the skeleton density is not known. The slope of the curve changes with increasing hydrogen pressure in the system, until the curve becomes flat, synonym of the saturation of the sample in hydrogen.
The calculated error is shown on the graph. It is quite high, but considering the experimental results obtained during the calibration of the experimental set-up, it can be considered that this calculated experimental error is higher than the real error generated in the experiment.
The carbon plasma samples need a post treatment. They have this advantage of having an extremely original nanostructure with completely exotic structures. Unfortunately, these structures are not accessible to the gas for the moment, and thereby it is important to activate them. This will have the double effect of creating an internal porosity in the sample, which is for the moment non-porous, purifying the sample of the metal catalyst and of the amorphous carbon in order to obtain a final nanostructure solely composed of the carbon in its exotic form, accessible to the gas.
From the observations through SEM and TEM, these plasma samples have a strong potential because of the surface curvature, the exotic structures produced and their homogeneity. The amount of material produced is also quite considerable, making it possible to activate a large amount of material, and still obtaining a high amount of material available for the measurement of hydrogen storage.
Concerning the carbon aerogels samples, the importance of both the meso- and microporosity has been shown. The first one provides the volume necessary for the diffusion of the gas while the latter provides the adsorption sites for hydrogen. The carbon aerogels possess a closed porosity that could improve the hydrogen storage capacity if it were opened.
Activation in the carbon aerogel samples is a critical parameter as it could have controversial effects. Activating a carbon material contributes in increasing the porosity and the surface area of the mesoporosity and the microporosity, but an optimum is observed in the respective contribution of the pore size distribution as a function of the activation time and temperature of the samples.

Chapter V Characterisation and experimental results of hydrogen storage on the carbon materials elaborated
175

Chapter VI General conclusions and perspectives
176
VI GENERAL CONCLUSIONS AND PERSPECTIVES

Chapter VI General conclusions and perspectives
177
The conclusion of this work deals with the experimental set-up that has been built and calibrated, with the interesting materials elaborated and the experimental results on hydrogen storage and finally, some elements of comprehension will be given on hydrogen stoage, as well as some prespectives.
• The literature review and the experimental set-up
In the literature review a large amount of experimental results have been given on nanotube rich samples, graphite nanofibres, carbon black and activated carbon blacks. We have been able to show that large discrepancies exist on these results that were essentially due to the experimental technique used, to the amount and purity of material tested and to the interpretation of the results, which recovers the before mentioned errors. Indeed, storage of hydrogen would be solely attributed to the presence of nanotubes without considering the bulk of the sample, which lead to extremely high results on these samples, even though in a massic percent, the sample contained more impurities and catalyst or amorphous carbon than nanotubes. Ideally, a 100% pure nanotube sample, with a monomodal nanotube diameter distribution, which is the sample considered in theoretical calculations, could give reliable results on the effect of the tube diameter on the capacity of the nanotubes to store hydrogen. Unfortunately this sample does not exist.
Being at the stage of testing less than one gram of sample, considering the production costs, brings the possible use of original structures far from a potential industrial application, keeping these studies to fundamental research. Presently it is not anymore the problem of finding an appropriate material that will give the future solution for hydrogen storage through adsorption but it is more to contribute to the understanding of hydrogen adsorption and to the structural features in a material that promotes the hydrogen storage capacities.
As only small amounts of materials are tested and as the hydrogen storage capacities are low, it is even more important to have a reliable experimental set-up in order to minimise the experimental errors made on the final result. A major part of this work has been done in order to work with a reliable experimental set-up, in specific conditions.
Currently, the experimental set-up established has been proved to be efficient in measuring the hydrogen storage capacity of samples for pressures up to 100 bars and at a temperature of 25°C. The major advantage of the process being that the measurements are done on large amounts of material, with a minimum of 10 grams required for reliable results. The design of this set-up is more advanced than the laboratory experiment, as the sizing of the system is quite large. The pressure vessel consists in a volume of 138 cm3 and the measurement is based on the available volume of hydrogen released by the pressure vessel. It is a direct method calculation based on the difference of the volume of hydrogen released when the pressure vessel is filled with carbon and when it is empty.
The experimental set-up has been subject to various calibration measurements. The density of a non adsorbing material has been measured experimentally, the hydrogen storage capacity of a classical metal hydride whose isotherm is well known has been measured and compared to the standard, and some experimental results on different materials performed on our test bench have been confirmed with an external laboratory. These experiments are essential in order to obtain reliable results and to confirm that the experimental set-up is adapted to our measurements and to the initial choices that have been made and appropriate to the samples produced in the laboratory.
• The carbon materials produced and the experimental results
The carbon aerogels samples produced have interesting properties. On the opposite to the carbons from the plasma process, these samples have an extremely similar nanostructure, with a network of interconnected carbon particles. The conformation of this network determines the porosity, the percentage of open and closed structure as well as the surface area present in the sample. Beyond the inter-particle porosity, carbon aerogels possess an intra-particle porosity.
The samples produced showed a diversity in the pore size distribution, which has been shown to be bi-modal with the essential contribution being micro and mesoporous, with a small macroporous contribution. The interesting aspect of this type of sample, is that the contribution to the pore volume comes essentially from the meso and macroporosity while the main contribution to the specific surface

Chapter VI General conclusions and perspectives
178
area measured through nitrogen adsorption comes from the micro and mesoporosity. Other important features of the carbon aerogels is that these samples are entirely composed of carbon material, with no impurities present in the sample and that they possess a large internal closed structure that could reveal to be interesting for hydrogen storage.
The hydrogen storage results on these samples has shown two essential important facts necessary in the adsorption process : the accessibility of hydrogen to the physical adsorption sites in the carbon thanks to the presence of mesoporosity, and the microporous surface area in the carbon which is necessary as it provides the adsorption sites for hydrogen in the carbon. The as-received samples produced show preliminary promising results for improvement in the future as they have shown that they can adsorb a small amount of hydrogen.
The essential conclusion on the experimental results concerning the materials issued from the plasma process is that at a temperature of 25°C and a pressure of 100 bars the as-received samples do not store any hydrogen in these conditions. As compared to the literature review these results are actually expected, as the fullerene soots, for example, need some high temperature in order for the hydrogen to diffuse into the carbon network of the fullerene.
The plasma process has a major advantage in the sense that no oxygen is present in the process during the elaboration of the carbon materials and their original structure. A consequence to this is that the samples have no porosity, as it is the oxygen present in the process that creates the porosity for the carbon black samples. The structure of the samples revealed to be closed with no access to the possible adsorption sites that are the fibres of the original structures such as the bamboo or necklaces. The specific surface area of the samples, even though it is not the unique parameter responsible for the adsorption of hydrogen it is necessary, are extremely low. This is once again due to the lack of porosity in the sample.
The experimental results on the nanotube samples have shown that the as-received soots do not store any hydrogen, which is in line with the literature review. The literature review showed that a large amount of reliable results revealed storage capacities lower than 1 wt% with an even stronger concentration of results lower than 0.4 wt%, which are the corresponding experimental results in our samples if the skeleton density could have been measured.
• Perspectives
The perspectives for this work are essentially based on the post-treatment of the investigated materials for further testing. The exotic nanostructures observed for the materials coming from the plasma process could be potential sites for the adsorption of hydrogen. Unfortunately these structures, as observed through TEM and BET are not accessible to the gas, and high temperature activation through CO2, could be beneficial for hydrogen adsorption. These samples should also be purified, in order to eliminate the amorphous carbon as well as the metal catalyst in the sample. The literature review has shown that beyond the high results, a beneficial effect of the chemical purification of these materials was observed, which should be done prior to the thermal treatment.
For the carbon aerogels, SAXS measurements have shown that a closed porosity and structure are present in the material. Once again a thermal activation of these materials could enable the opening of the structure in terms of porosity and thereby the activation could create a supplementary adsorption surface available for hydrogen. Unfortunately, this process is double-edged. Indeed it can either be extremely efficient in creating mesopority and a microporous surface, or if the process is not optimised, it can disrupt the structure creating a strong contribution of the macroporosity in the sample, which is detrimental to the adsorption of hydrogen.
Improvements could also be done on the experimental set-up and procedure for testing the materials at a lower temperature of -30°C. This would increase the storage capacity of the material with the possibility of capillary condensation of the gas, thereby showing a stronger influence of the structure on hydrogen adsorption and reducing the experimental errors.

Chapter VI General conclusions and perspectives
179

Chapter VII Résumé de la thèse en français
180
VII RESUME DE LA THESE EN FRANÇAIS

Chapter VII Résumé de la thèse en français
181
,$88
L’énergie et l’environnement constituent deux enjeux majeurs pour nos sociétés modernes. En effet, l’épuisement proche des ressources d’énergies fossiles d’une part, et d’autre part, l’effet de serre dû en grande partie à l’augmentation continue des émissions de dioxyde de carbone, conduisent à un nouveau défi pour la science, celui de trouver des nouvelles ressources énergétiques compatibles avec les énergies renouvelables.
Dans cette optique, l’hydrogène est étudié en tant que nouveau vecteur d’énergie et la pile à combustible en constitue l’application potentielle la plus intéressante. L’objectif est de produire de l’énergie électrique par un procédé électrochimique grâce à la réaction entre l’oxygène et l’hydrogène. Cette réaction présente l’intérêt écologique de ne rejeter que de l’eau.
Les exigences actuelles en terme de performance de la pile à combustible pour une application automobile se situent à 2,9 kg d’hydrogène embarqué pour une autonomie de 500 km. A la température et pression ambiantes, dans un volume équivalent au réservoir d’essence, cela revient à stocker 32000 L d’hydrogène dans un volume de 60 L… Tel est le défi du stockage d’hydrogène ! En augmentant la pression et en diminuant la température, la densification du gaz permet d’augmenter son stockage physique. Parallèlement, il est possible d’augmenter considérablement les quantités d’hydrogène stocké en ajoutant un adsorbant dans le réservoir (stockage physico-chimique) : cette problématique du stockage d’hydrogène par adsorption fait l’objet de cette thèse.
Le centre d’énergétique de l’Ecole des Mines de Paris à Sophia-Antipolis travaille depuis de nombreuses années sur deux familles de carbones nanostructurés et leurs applications, ainsi que sur la thématique de la pile à combustible. Ces deux domaines de recherche ont été recoupés afin de tester les carbones produits pour le stockage d’hydrogène par adsorption.
Le but de ce travail est de concevoir et calibrer un banc d’essais expérimental pour l’étude du stockage d’hydrogène, de produire des carbones nanostructurés issus des deux procédés de synthèse, et de caractériser et tester ces carbones afin d’apporter des éléments de compréhension sur le phénomène d’adsorption d’hydrogène sur les carbones.
Le manuscrit est divisé en quatre chapitres. Le premier chapitre s’attache à l’étude bibliographique des travaux déjà entrepris sur ce sujet. Le deuxième chapitre présente le banc d’essais ainsi que tout le travail d’étalonnage de celui-ci. L’exposition des deux procédés d’élaboration des carbones nanostructurés fait l’objet du troisième chapitre. Le dernier chapitre expose les résultats sur l’étude du stockage d’hydrogène dans les carbones produits au centre d’énergétique.
L’étude bibliographique présente les propriétés de l’hydrogène ainsi que les différentes techniques disponibles pour le stocker, chimiquement ou physiquement. Sont également exposées les différentes familles de carbone utilisées pour le stockage d’hydrogène et les techniques expérimentales de mesure disponibles, avec leurs avantages et inconvénients. Trois points ressortent de l’analyse de la littérature : la difficulté de quantifier le stockage d’hydrogène dans les carbones, la controverse des résultats publiés et l’impossibilité de conclure sur la théorie du stockage d’hydrogène par adsorption.
Le banc d’essais présenté dans le chapitre deux a été calibré grâce à trois techniques différentes, et des calculs d’erreurs ont été effectués. Deux calculs sont développés : le pourcentage gravimétrique en comparaison avec la compression et le pourcentage gravimétrique intrinsèque. Un protocole expérimental a été élaboré afin de tester tous les matériaux dans des conditions similaires.
Le troisième chapitre présente les deux procédés d’élaboration des carbones nanostructurés, avec les caractéristiques des familles de carbones produits. La différence entre les deux procédés d’élaboration permet de produire des carbones dont les propriétés et la structure sont différentes et originales.
Le dernier chapitre présente les résultats de stockage d’hydrogène dans les matériaux carbonés. L’interprétation des résultats, mise en parallèle avec les études morphologiques et structurales des matériaux, permet de donner quelques éléments de compréhension dans la problématique du stockage d’hydrogène, malgré des matériaux dont les capacités de stockage ne dépassent pas 0,5 % en masse.

Chapter VII Résumé de la thèse en français
182
6$'$9$:
8
Cette étude bibliographique présente les différents moyens disponibles pour stocker l’hydrogène, les techniques expérimentales utilisées pour quantifier le stockage d’hydrogène, ainsi que les carbones étudiés pour le stockage d’hydrogène. Les résultats publiés dans la littérature sur cette thématique seront discutés ainsi que les problèmes rencontrés lors des différentes mesures.
• L’hydrogène et son stockage L’hydrogène est un gaz dans les conditions atmosphériques ambiantes, avec une masse volumique
de 0,09 kg.m-3, un liquide à pression ambiante et à –253°C avec une masse volumique de 70,8 kg.m-3 et un solide à –262°C avec une masse volumique de 70,6 kg.m-3. Son point triple est à –259,1°C et 0,07 bar et son point critique à –239,8°C et 13 bars, ce qui signifie qu’à n’importe quelle température supérieure à –240°C et quelle que soit la pression appliquée, l’hydrogène ne pourra pas devenir liquide. Pour le liquéfier il faut descendre à une température inférieure à –240°C.
L’hydrogène est un gaz non-idéal, et par conséquent la loi des gaz parfaits ne s’applique qu’avec un facteur de compressibilité qui dépend de la température et de la pression du gaz.
De par sa volatilité et sa faible densité, il est extrêmement difficile de stocker l’hydrogène. Il existe actuellement deux techniques physiques de stockage, la compression et la liquéfaction, et des stockages chimiques sur les hydrures métalliques, les complexes ou les zéolites.
Le stockage physique par compression existe déjà depuis de nombreuses décennies, et les progrès se font soit sur le matériau utilisé pour le réservoir, soit sur la forme du réservoir lui-même. Les nouveaux matériaux utilisés sont plus légers tout en étant plus résistants. Plus légers, ces matériaux permettent de diminuer le poids du réservoir et de ce fait, d’augmenter la densité massique d’hydrogène stocké ; plus résistants, ils permettent d’augmenter la pression du gaz dans le réservoir. Par ailleurs la forme des réservoirs est passée du cylindre à des réservoirs de type ‘conformable’ à plusieurs cellules, qui optimisent l’espace disponible.
La seconde technique physique de stockage est la liquéfaction de l’hydrogène. Une fois liquéfié, l’hydrogène doit être maintenu à une température inférieure à –240°C. Cela complexifie la conception du réservoir qui requiert une super isolation thermique afin de limiter les déperditions et les risques de ‘boil-off’. Ce mode de stockage existe mais demeure encore extrêmement coûteux en énergie du fait de la liquéfaction de l’hydrogène.
Lorsque certains métaux sont exposés à l’hydrogène, une réaction chimique a lieu entre l’hydrogène et l’alliage. Celui-ci absorbe alors une certaine quantité d’hydrogène et forme un composé solide appelé un hydrure métallique. L’hydrogène est relargué en tant que gaz et l’alliage retrouve sa structure initiale. Ce moyen de stocker l’hydrogène est chimique car le réseau cristallin se transforme afin d’incorporer l’hydrogène dans les défauts de l’alliage. Les composés employés pour le stockage sont des composés intermétalliques de type AxBy dans lequel A est une terre rare ou un métal de transition (Ti, Zr, Mg, La, etc.) et B un métal de transition (Ni, Fe, Cr, Mn, etc.). Certains hydrures métalliques sont utilisés pour stocker une faible quantité d’hydrogène à des températures élevées mais ils restent encore assez lourds et coûteux.
Au-delà des hydrures métalliques, il existe des hydrures complexes qui sont des composés mixtes ioniques/covalents et décrits par la formule M(M’H4)n, où M est un métal et M’ un métal trivalent. Certains sont commercialisés tels que le NaAlH4 et le NaBH4. Les zéolites et les micro sphères de verre sont deux autres moyens chimiques de stockage d’hydrogène.
Toutes ces techniques de stockage sont disponibles mais restent encore assez coûteuses et ne satisfont pas les critères de sécurité et les exigences de volume d’hydrogène stocké pour une application embarquée. Reste donc la dernière technique : le stockage d’hydrogène par adsorption.
L’adsorption d’hydrogène sur les carbones est un phénomène physique où un équilibre thermodynamique des forces d’attraction et de répulsion se crée entre la molécule de gaz et la surface

Chapter VII Résumé de la thèse en français
183
de l’adsorbant. L’adsorption consiste en l’enrichissement de gaz à l’interface entre le gaz et le solide. Pour adsorber l’hydrogène, l’adsorbant doit posséder une certaine surface (sur laquelle le gaz s’adsorbe) qui doit être accessible au gaz à travers sa porosité. Ce sont les deux critères importants pour un adsorbant : posséder une surface développée importante ainsi qu’une porosité permettant au gaz de diffuser jusqu’à la surface interne du matériau.
• Les matériaux carbonés utilisés pour le stockage d’hydrogène Trois familles de carbones ont été particulièrement étudiées pour le stockage d’hydrogène : les
carbones graphitiques, les noirs de carbone, les noirs de carbone activés, et, plus récemment les carbones nanostructurés tels que les nanotubes de carbone, les nanofibres et les nanostructures fullerèniques.
Le carbone graphite est la forme stable du graphite à des températures et des pressions faibles. Il consiste en un réseau de carbone cristallin formant des plans de graphène superposés, lesquels sont distants de 3,54 Å. Les liaisons entre les atomes sont covalentes et distantes de 1,54 Å. La surface maximale développée par le graphite est de 2630 m2.g-1, ce qui pourrait le rendre intéressant dans la problématique du stockage d’hydrogène. Cependant, la surface développée par le graphite est plane, ce qui limite les forces d’attraction pour adsorber l’hydrogène, comparativement à des surfaces courbées où l’importante interaction des forces favorise l’adsorption.
Le noir de carbone est constitué de carbone finement divisé plus ou moins structuré. Différents niveaux de structures sont visibles. Le premier niveau est formé de particules primaires de carbone généralement sphériques, dont le diamètre varie de quelques dizaines à quelques centaines de nanomètres. A un deuxième niveau, ces particules se combinent et forment des agrégats qui peuvent à leur tour former des agglomérats. Les deux premiers niveaux de structures sont liés par des liaisons covalentes tandis que l’organisation en agglomérats se fait à travers des liaisons van der Waals. Les noirs de carbone dépendent fortement du procédé de fabrication utilisé (combustion incomplète ou décomposition thermique).
Les carbones activés sont des carbones ayant subi une activation chimique à haute température. Cette technique permet d’éliminer l’oxygène et les composés aromatiques présents, et d’ouvrir la porosité initialement fermée.
Enfin, les nanofibres et les nanotubes de carbone composent une autre famille de carbones nanostructurés. Les nanofibres de carbone sont produits avec des procédés de décomposition catalytique de certains hydrocarbures sur des particules de métal catalyseurs à des températures variant de 400°C à 800°C. Les nanofibres consistent en un empilement de plaques de graphite orientées parallèlement, perpendiculairement ou à un certain angle, par rapport à l’axe de la fibre. Les fibres peuvent avoir des longueurs de 5 à 100 microns pour des diamètres allant de 5 à 100 nanomètres. Les nanofibres de carbone ont des surfaces spécifiques variant de 400 à 700 m2.g-1.
Les nanotubes de carbone peuvent être représentés par une feuille de graphène enroulée sur elle-même pour former un cylindre dont l’extrémité est généralement fermée. Il existe deux types de nanotubes, les mono-paroi et les multi-parois qui sont des mono-paroi empilés dont le diamètre augmente avec le nombre de couches successives. Actuellement, aucun procédé ne permet la production de nanostubes à l’échelle industrielles.
• Les techniques disponibles pour quantifier le stockage d’hydrogène La quantité d’hydrogène stockée dans un matériau est définie par son pourcentage gravimétrique
ou par son pourcentage volumétrique. Le premier est le rapport entre la masse d’hydrogène stocké dans le carbone et la masse totale du système (hydrogène + carbone) tandis que le second est la masse d’hydrogène divisée par le volume total pris par le système (hydrogène + carbone). Des interrogations existent concernant le système. En effet, faut-il tenir compte dans le système de la masse du réservoir dans lequel est stocké le carbone ? Le plus fondamental est de bien définir au préalable le pourcentage gravimétrique utilisé.
Au-delà de la définition du pourcentage gravimétrique, plusieurs techniques existent actuellement pour quantifier le stockage d’hydrogène : la méthode gravimétrique, la méthode volumétrique, la

Chapter VII Résumé de la thèse en français
184
désorption par spectroscopie et la mesure électrochimique.
La méthode gravimétrique mesure l’augmentation de la masse de carbone en présence d’hydrogène, ce qui constitue une mesure directe du stockage d’hydrogène. Cette technique nécessite un appareillage de mesure extrêmement précis, sensible à la prise de masse du carbone due à la présence de l’hydrogène.
La méthode volumétrique est une méthode indirecte, qui calcule l’adsorption de l’hydrogène grâce à un équilibre de pression entre le volume de référence et le volume contenant l’adsorbant. Elle est largement utilisée et requiert un étalonnage assidu de l’ensemble avec une attention spéciale sur les fuites dans le système qui peuvent engendrer des erreurs importantes sur le résultat final.
La spectroscopie de désorption est également une méthode indirecte. Elle consiste à saturer le matériau en hydrogène à une température basse. En appliquant un cycle de température approprié, l’hydrogène se désorbe du matériau et le spectromètre de masse placé en série quantifie l’hydrogène en fonction de la température. Cela permet d’estimer la localisation chimique de l’hydrogène sur certains sites grâce à la connaissance de l’énergie d’interaction calculée.
La dernière méthode utilisée est électrochimique. La capacité de stockage d’hydrogène est mesurée électrochimiquement à travers l’électrolyse de l’eau. Durant la charge, l’eau présente dans l’électrolyte se dissocie en de l’hydrogène atomique et des ions OH-. Durant la phase de décharge, le procédé inverse a lieu, et s’accompagne d’un transfert de charge. La quantité d’hydrogène désorbé par l’électrode de carbone est quantifiée en mesurant la charge électrique. La correspondance entre la charge et l’adsorption est de 1 wt% pour une charge de 273 mAh.g-1.
Les quelques techniques présentées ci-dessus ont montré leurs limites. D’une manière générale, lors de la mesure de la quantité d’hydrogène adsorbé dans un matériau, certains pièges existent, qui se répartissent entre l’échantillon, le réservoir utilisé pour la mesure, le protocole expérimental, la technique en elle-même et l’étalonnage du banc d’essais.
Il est en effet important de connaître la morphologie de l’échantillon, de le choisir aussi pur que possible afin de diminuer l’influence des paramètres morphologiques du matériau, et de tester la plus grande quantité de matière possible afin de minimiser les erreurs lors de la mesure.
Le réservoir de mesure doit avoir un volume approprié à la quantité de matière testée afin de minimiser le volume mort du réservoir, difficile à quantifier et générateur d’erreurs. L’étanchéité du réservoir ainsi que celle de tous les éléments extérieurs tels que la tuyauterie et les vannes doit être régulièrement vérifiée.
Le protocole expérimental est très important puisque chaque étape peut fortement influer sur la mesure finale. Il doit être établi au préalable et suivi rigoureusement pour tous les échantillons afin de garder tous les paramètres de mesure constants. Les paramètres influents peuvent être la température et la dépression de dégazage, les conditions de test de l’échantillon, le temps estimé pour l’équilibre et les conditions d’adsorption et de désorption.
Au vu des fortes divergences dans les résultats obtenus sur des matériaux similaires, l’étalonnage apparaît primordial. Il existe actuellement une base de données sur les hydrures métalliques dont les courbes d’adsorption et de désorption sont connues et peuvent servir d’étalon. Par ailleurs, des mesures comparatives d’un même échantillon entre bancs d’essais de laboratoires différents peuvent être faites afin de tester la concordance des résultats. Cela permet d’étalonner le banc d’essais et de minimiser les erreurs sur les mesures.
• Résultats expérimentaux sur le stockage d’hydrogène et conclusion Les résultats expérimentaux sur l’étude du stockage d’hydrogène sont controversés et difficiles à
exploiter. En effet, les différentes familles de matériaux utilisées, les choix des conditions de température et de pression et les différentes techniques de mesure pratiquées, rendent difficile la comparaison pertinente des résultats d’une publication à une autre.
Les problèmes concernant les calculs sont fréquemment liés à une sur-interprétation des résultats qui oblitère l’influence réciproque des deux phases - le carbone et le métal catalyseur - sur le stockage

Chapter VII Résumé de la thèse en français
185
d’hydrogène. L’hypothèse selon laquelle seul le carbone stockerait, sans tenir compte de l’effet de transfert de charge catalytique entre le métal et le carbone, est récurrente, et constitue une erreur préjudiciable pour la recherche.
Il existe actuellement une très forte disparité sur les résultats de stockage d’hydrogène, avec des résultats pouvant aller jusque 67 wt% d’hydrogène en masse ! Ce résultat est maintenant considéré comme non valide. A la suite des premiers résultats impressionnants des années 1998 à 2001, l’enthousiasme de la communauté scientifique laisse place à une prise de conscience de la difficulté de mesurer la quantité d’hydrogène stocké dans un matériau, et des exigences draconiennes à avoir quant à la fiabilité des résultats. Actuellement, la concentration la plus importante des résultats se trouve majoritairement sous la barre des 1 wt% d’hydrogène en masse.
Néanmoins, même si les résultats sont souvent surestimés et les calculs pas toujours complétés par une estimation des erreurs, il a été montré qu’il était possible d’augmenter les capacités de stockage des matériaux grâce à différentes techniques.
Une première méthode pour augmenter les capacités de stockage est la purification de l’échantillon afin d’éliminer les catalyseurs présents et d’ouvrir la structure interne du matériau. Cela peut se faire à travers un traitement thermique ou chimique.
Le traitement thermique se fait sous atmosphère inerte ou oxydante et permet d’éliminer certains composés organiques présents et de relarguer les contraintes résiduelles dans les plans de graphène. De la même façon que le traitement thermique, le traitement chimique permet d’ouvrir les nanotubes, d’éliminer les impuretés présentes peuvant bloquer l’accès aux nanotubes ou à l’espace inter-tubes. Le traitement chimique au HNO3 ou HCl, suivi d’un post-traitement thermique afin de relâcher les contraintes créées lors du traitement chimique, semblerait assez efficace pour augmenter les capacités de stockage.
Un autre moyen d’augmenter la capacité de stockage des carbones est d’ajouter des défauts dans la structure afin de créer des sites à forte densité énergétique, favorables pour le stockage d’hydrogène. Cette technique consiste à broyer les nanotubes, les carbones graphitiques ou les nanofibres, et permet d’augmenter la surface spécifique, d’ouvrir la porosité présente et de créer des défauts au niveau des plans de graphène.
.8'$9$:$;<8
*8=98*8
Seront présentés dans ce chapitre du manuscrit le banc d’essais expérimental mis en place et utilisé au Centre d’Energétique, ainsi que les choix justifiant son dimensionnement et ses limitations. Le calcul d’erreurs sur les mesures et l’étalonnage du banc d’essais y seront également étudiés.
• Présentation du banc d’essais Le banc d’essais a été conçu pour l’étude de la quantité d’hydrogène relargué par le réacteur
lorsque celui-ci est rempli de carbone et lorsque celui-ci est vide, ce qui permet de calculer la quantité d’hydrogène utilisable pour une application. C’est une mesure volumétrique de la désorption d’hydrogène.
Le banc d’essais comporte trois parties autour du réacteur : une partie permet le dégazage de l’échantillon, une deuxième partie comporte la bouteille d’hydrogène à 200 bars et dans la troisième, le volumètre mesure le volume d’hydrogène relargué par le réacteur. Plusieurs points de mesure sont disposés dans le réacteur : P1 et T1 sont la pression et la température du gaz dans le réacteur, tandis que P0 et T0 mesurent la pression et la température du gaz dans le volumètre. Ces données – récupérées dans un fichier par une boite d’acquisition - sont importantes pour la détermination du nombre de moles d’hydrogène désorbé par le réacteur.
Le réacteur est muni d’une double enveloppe permettant de réguler la température de -40°C à + 180°C (limitations du bain thermostaté). Le banc d’essais résiste à des températures variant de -196°C à +400°C et des pressions allant jusqu’à 200 bars. Le volume du réacteur est de l’ordre de 138 cm3, ce

Chapter VII Résumé de la thèse en français
186
qui permet de tester une grande quantité de matière en fonction de la masse volumique apparente du matériau testé. Cela marque en grande partie l’originalité du banc d’essais.
Les choix des gammes de température et de pression ont été basés sur les conditions de stockage techniquement possibles pour une application automobile, avec des températures allant de -40°C à 180°C (température utilisée lors du dégazage de l’échantillon).
• Présentation des calculs de pourcentage gravimétrique et ses erreurs Deux calculs ont été mis en place pour la détermination de la masse d’hydrogène stocké dans les
échantillons. La masse d’hydrogène est calculée à partir du nombre de moles d’hydrogène relargué, lui-même calculé à partir de la loi des gaz parfaits étendue au gaz non-idéal grâce au facteur de compressibilité selon l’équation :
( ) 00 ..,.
TRTPZVPn =
où V est le volume d’hydrogène mesuré par le volumètre à la pression P et à la température T0 du réacteur et Z, le facteur de compressibilité dans les mêmes conditions.
Dans un premier temps, le volume du réacteur est calculé lors d’une mesure à la température de 25°C et une pression de 100 bars. Le volume d’hydrogène relargué par le réacteur dans ces conditions de température et de pression dépend du volume du réacteur (Vr) et est calculé en fonction du nombre de moles relargué à la pression absolue P = P1 + P0 et à la température T1 :
( ) ( )10
0
1
12
T,PZP T,PZ
PT.R.n V Hr
−=
où Z(P,T1) représente le facteur de compressibilité dans les conditions de pression et de température P et T1, nH2 le nombre de moles d’hydrogène relargué à la pression P et à la température T1, R la constante des gaz parfaits et P0 la pression dans le volumètre.
L’erreur sur cette mesure est fonction des différents paramètres de l’équation ci-dessus, et le volume du réacteur calculé est égal à 138,86 ± 0,24 cm3.
Le premier calcul détermine le pourcentage gravimétrique d’hydrogène stocké dans le carbone en comparaison avec un système en compression tandis que le deuxième calcul évalue le pourcentage gravimétrique intrinsèque d’hydrogène dans le matériau.
Le pourcentage gravimétrique en comparaison à la compression et ses erreurs Ce calcul quantifie l’excédant d’hydrogène relargué par le réacteur lorsque celui-ci est rempli de
carbone par rapport au volume d’hydrogène relargué lorsque le réacteur est vide, dans les mêmes conditions de température et de pression :
( ) 100. % 2 *m
nnMwtc
vcH −=
où nc est le nombre de moles d’hydrogène relargué lorsque le carbone est présent, nv le nombre de moles d’hydrogène relargué lorsque le réacteur est vide, mc la masse de carbone testé et MH2 est la masse molaire de l’hydrogène.
Le nombre de moles d’hydrogène nv est déterminé au préalable pour toutes les mesures tandis que le nombre de moles nc est calculé pour chaque échantillon en fonction du volume d’hydrogène relargué et de la pression absolue P. L’erreur est également calculée en fonction des différents paramètres.
Tous les échantillons sont testés à 25°C et 100 bars et ce calcul est appliqué avec le calcul d’erreur, qui permet de valider le résultat et de connaître l’incertitude finale.
Il est possible que le pourcentage gravimétrique en comparaison à la compression soit négatif, ce qui signifie que le carbone délivre moins d’hydrogène qu’un réservoir sous pression d’hydrogène.

Chapter VII Résumé de la thèse en français
187
Néanmoins, le carbone stocke tout de même une faible quantité d’hydrogène qui correspond à l’hydrogène comprimé dans le volume équivalent de carbone lorsque le réacteur est vide de carbone. Cela correspond au deuxième calcul, le pourcentage gravimétrique intrinsèque d’hydrogène stocké dans le carbone.
Le pourcentage gravimétrique intrinsèque et ses erreurs Dans le cas des carbones nanostructurés, l’adsorption de l’hydrogène se fait sur le squelette formé
par le réseau de particules de carbone, et il est donc essentiel de connaître le volume pris par ces particules. Tel que nous le définissons, le pourcentage gravimétrique intrinsèque de notre matériau s’exprime de la façon suivante :
( ) 100*m
nnMwtc
vsccH −= .% 2int
où nvsc représente le nombre de moles d’hydrogène libéré par le volume mort du réacteur, soit Vréacteur - Vsquelette, où Vsquelette est le volume pris par le squelette carboné dans le réacteur.
Initialement, nc - le nombre de moles d’hydrogène libéré par le réacteur lorsque le carbone est présent - est calculé grâce au volume d’hydrogène passé dans le compteur de gaz volumétrique à la pression et la température du volumètre.
A ce nombre de moles d’hydrogène doit être soustrait le nombre de moles d’hydrogène provenant du volume mort du réacteur, c’est à dire, le volume dans le réacteur où seule la compression a lieu et non l’adsorption. Ce volume mort dans le réacteur est :
squeletteréacteurmort VVV −= soit squelette
carboneréacteurmort dmVV −=
ce qui donne un pourcentage gravimétrique intrinsèque pour notre matériau égal à :
( ) ( ) 100*m1*
.R.TT,PZd
mVP
.R.TT,PZ.VP.Mwt%
c
squelettre
cr.HH
111
1
000
202
−
−=
où dsquelette représente la densité du squelette carboné de notre matériau. L’erreur sur cette donnée est également calculée.
Les limites du banc d’essais Afin de connaître les limites d’utilisation de notre banc d’essais pour obtenir une précision
optimale dans le calcul, nous avons estimé un matériau de masse m qui stocke un pourcentage gravimétrique de X wt% à une température T et une pression P.
Grâce à la définition du pourcentage gravimétrique intrinsèque, nous pouvons quantifier le nombre de moles d’hydrogène libéré lorsque le réacteur est vide à la température T et la pression P, ainsi que le nombre de moles d’hydrogène libéré lorsque le réacteur est rempli de carbone. Nous pouvons ainsi calculer, grâce à l’équation sur le calcul de l’erreur relative du pourcentage gravimétrique, l’erreur théorique commise sur notre banc d’essais pour une certaine mesure.
Nous avons pu constater que l’erreur relative du pourcentage gravimétrique sur une mesure est fonction de la masse de carbone testée ainsi que du pourcentage gravimétrique du matériau. A masse de matière testée constante, plus le matériau possède des capacités de stockage importantes, plus l’erreur relative sera minime. De même, pour un matériau qui stocke une certaine quantité d’hydrogène, plus la quantité de matière testée est importante plus l’erreur relative sera faible.
Dans le cas du banc d’essais mis en place au Centre d’Energétique, ce calcul nous permet de constater que quelle que soit la capacité de stockage de notre matériau, il est important, pour minimiser les erreurs finales, de tester la plus grande quantité de matière possible avec au minimum une masse de 10 grammes de matière.

Chapter VII Résumé de la thèse en français
188
• Protocole expérimental et étalonnage du banc d’essais Une série de mesures a été faite sur le banc d’essais afin de tester l’étanchéité du réacteur, la
reproductibilité d’une mesure à vide, et d’étalonner le banc d’essais sur les mesures de stockage d’hydrogène à 25°C.
Etanchéité du réacteur et reproductibilité d’une mesure L’étanchéité du réacteur est testée en laissant pendant un temps donné le réacteur sous pression
d’hydrogène sans régulation de température. Si le réacteur est étanche, le nombre de moles d’hydrogène reste constant tout au long de la mesure. En effet, d’après la loi des gaz parfaits, le nombre de moles est proportionnel au rapport P/ZT. Si celui-ci reste constant, la quantité d’hydrogène dans le réacteur l’est également. Un graphique montrant l’évolution du rapport P/ZT en fonction du temps permet donc de contrôler l’étanchéité.
La reproductibilité de la mesure à vide a également été testée grâce à une série de plusieurs mesures. Il a été possible de constater que l’écart entre les différentes mesures est de l’ordre de 0,3%. Cet écart extrêmement faible permet de confirmer que les mesures sont reproductibles lorsque le réservoir est vide de carbone.
Etalonnage avec un matériau non-adsorbant Le but de cette mesure est de calculer le volume d’un matériau non adsorbant avec une géométrie
simple : un cylindre creux. Ce volume a d’abord été mesuré avec un pied à coulisse, puis il a été calculé avec le banc d’essais. Enfin, les deux résultats ont été comparés.
Le volume du cylindre mesuré avec le pied à coulisse est de Vcylindre= 33,79 cm3 ± 0,07 cm3, alors que le volume calculé avec le banc d’essais est Vcylindre= 33,72 ± 0,48 cm3. On obtient alors une erreur relative de mesure du banc d’essais de 0,2 %.
Le banc d’essais est donc capable de mesurer le volume d’un matériau non adsorbant avec une précision supérieure à 0,5%.
Etalonnage avec un hydrure métallique La suite de l’étalonnage a été faite sur un échantillon de 10 grammes de l’hydrure métallique
LaNi5, fourni avec sa courbe d’étalonnage par le laboratoire du CNRS de Thiais. Le matériau a été testé sur le banc d’essais du Centre d’Energétique afin de comparer les deux courbes. Seules les courbes de désorption ont pu être comparées dans la mesure où l’adsorption n’est pas quantifiée dans notre banc d’essais. On a pu ainsi constater une bonne concordance entre les deux courbes.
Cette mesure constitue un des piliers de l’étalonnage de notre banc d’essais. Il montre que le banc d’essais est précis pour mesurer le stockage d’hydrogène dans des matériaux servant de références dans le stockage d’hydrogène.
Comparaison de nos résultats avec un laboratoire externe Deux aérogels de carbone - dont le procédé de synthèse est développé dans le chapitre suivant -
testés avec notre banc d’essais ont été envoyés dans un laboratoire externe effectuant des mesures gravimétriques. La concordance est parfaite pour le premier carbone - 0,29 wt% à une température de 25°C et 120 bars pour les deux mesures - et quasi parfaite pour le deuxième carbone - 0,37 wt% pour la mesure gravimétrique et 0,36 wt% pour la mesure sur notre banc d’essais, toujours à une température de 25°C et 120 bars.
• Conclusion D’après les dernières mesures effectuées ci-dessus, il est possible de dire que le banc d’essais est
calibré pour des mesures de stockage d’hydrogène en désorption sur des matériaux carbonés à la température de 25°C. Les mesures doivent être faites selon le même protocole opératoire. Il est actuellement possible de calculer le pourcentage gravimétrique intrinsèque lorsque la densité du squelette est connue, et le pourcentage gravimétrique par rapport à la compression, quel que soit le type de matériaux.

Chapter VII Résumé de la thèse en français
189
Du fait de la faible capacité actuelle des matériaux testés pour stocker l’hydrogène, les mesures doivent être réalisées avec une quantité minimale de 10 grammes de matière. Dans ces conditions, toutes ces mesures et ces tests nous ont permis d’atteindre des valeurs de stockage fiables et de conforter la validation de notre appareillage.
Au vu des résultats obtenus, tant sur les deux échantillons d’aérogel de carbone que sur l’hydrure métallique, on peut affirmer que le banc d’essais est précis et que le calcul d’erreur mis en place indique l’erreur maximale de la valeur. Cette erreur est le résultat de la somme de termes dont un prédomine. Le terme dominant est inversement proportionnel à la différence du nombre de moles relargué avec le carbone et sans le carbone, c’est à dire que plus la capacité de stockage d’un matériau est faible, plus l’erreur sera grande, et inversement.
8888'$
9$:
Vont être présentés dans ce chapitre les différents carbones nanostructurés produits dans le laboratoire. Deux procédés de synthèse différents permettent la production des matériaux carbonés : un procédé sol-gel pour la synthèse des aérogels de carbone, et un procédé de synthèse à haute température pour la production de trois autres familles de carbone : les noirs de carbone, les nanotubes et les noirs fullerèniques.
• Les aérogels de carbone Le procédé sol-gel est un procédé en trois étapes. La première étape consiste en la polymérisation
de deux précurseurs, suivie par une gélification. La gélification est suivie d’une étape de séchage, c’est à dire d’extraction du solvant du gel organique obtenu après la gélification, afin d’obtenir un aérogel organique sec. Enfin, celui-ci sera pyrolysé sous un flux d’azote pour obtenir un aérogel de carbone.
La première étape pour la formation de l’aérogel de carbone est une polymérisation aqueuse de deux précurseurs, le résorcinol (1,3 dihydroxybenzene, R) et le formaldéhyde (F). La réaction se fait dans des conditions alcalines à travers une transition sol-gel et résulte en la formation d’un polymère fortement réticulé. La réaction du résorcinol avec le formaldéhyde se fait avec une fraction molaire de 1:2, et le bicarbonate de sodium (Na2CO3) est utilisé comme catalyseur. Dans cette réaction, le résorcinol est un monomère trifonctionnel capable d’une substitution aromatique dans les positions 2,4 et 6 de son groupement benzénique. Le formaldéhyde est di-fonctionnel et forme des ponts covalents entre les anneaux du résorcinol impliquant une forte réticulation. Les réactions principales impliquées sont la formation des dérivées hydroxyméthyl (-CH2OH) du résorcinol, ainsi que la condensation des dérivés hydroxyméthyl pour former des composés de méthylène et méthylène-ether.
La gélification conduit à un gel organique formé d’un réseau de chaînes de particules en 3 dimensions. A ce stade du procédé, le solvant contenu dans les pores du gel organique et des pores ouverts est de l’eau. La gélification est activée à une température de 85°C pendant plusieurs jours afin d’obtenir une tenue mécanique du gel suffisante pour le manipuler.
Une fois le gel organique formé, il faut le sécher en enlevant le solvant des pores afin d’obtenir un aérogel organique. Le solvant peut être retiré soit de façon naturelle grâce à un séchage conventionnel à l’air libre, soit au moyen d’un séchage supercritique.
Lors d’un séchage conventionnel, le solvant présent dans le gel est simplement évaporé des pores du gel, qui forme alors un xérogel. Lors de cette évaporation, il se crée des forces capillaires à l’interface solide/liquide dues aux tensions superficielles liquide-vapeur : apparaissent alors des fissures. Afin de préserver la structure du gel créée lors de la gélification, il est important d’enlever le solvant du gel sans créer ces tensions superficielles : pour cela le solvant est extrait du gel dans des conditions de séchage sous CO2 supercritique.
Pour obtenir des conditions de séchage à l’état supercritique plus douces, et du fait de la solubilité entre l’acétone, l’eau et le CO2, nous procédons à un échange de solvant entre l’eau et l’acétone.
L’échange de solvant entre l’eau et l’acétone s’effectue hors de l’autoclave utilisé pour le séchage

Chapter VII Résumé de la thèse en français
190
supercritique, en immergeant les gels dans des bains d’acétone régulièrement renouvelés. Par équilibre de concentration entre l’eau présente dans les pores et l’acétone dans le bain, on élimine l’eau des pores grâce à la diffusion de l’acétone du bain vers les pores, et de l’eau des pores vers le bain. L’échange entre l’acétone et le CO2 se passe dans l’autoclave. Cet échange, et le séchage dans un flux de CO2 à l’état supercritique, s’effectuent en une même étape par l’entrée. La purge se fait en continu avec du CO2 à l’état supercritique.
Dans les conditions atmosphériques, le dioxyde de carbone est gazeux et devient supercritique lorsque la température atteint 31,05°C et la pression 72,3 bars. Initialement, le CO2 gazeux est à 15 bars. Il entre dans un compresseur d’air qui comprime le gaz au-delà de sa pression critique et celui-ci est simultanément chauffé au-dessus de sa température critique. C’est ainsi que le gaz entrant dans le réacteur où se trouve le gel organique devient supercritique. Les conditions pour le séchage supercritique sont de l’ordre de 82 bars et 35°C, afin de garder une marge de sécurité par rapport aux conditions supercritiques du CO2, pendant environ neuf heures.
Une fois le gel séché dans des conditions de CO2 supercritique et tout le solvant extrait, l’aérogel de carbone est obtenu à l’aide d’une pyrolyse des précurseurs organiques sous gaz neutre. Les aérogels de résorcinol-formaldéhyde sont constitués de chaînes de polymère à base aromatique très fortement réticulées, et par conséquent, peuvent être pyrolysés dans une atmosphère inerte pour former un carbone monolithique vitreux. La morphologie à une échelle mésoscopique est conservée à la suite de la pyrolyse, et le matériau résultant est de couleur noire. Il conserve néanmoins une taille de cellule ultra fine (<50 nm), une grande surface spécifique (600-800 m2.g-1), et la morphologie de l’interconnexion des particules du précurseur organique. La pyrolyse sous gaz inerte (azote) est habituellement menée à haute température (T>1000°C), et le carbone final est pur à environ 95 %. La perte de masse a lieu dans une gamme de température allant de 300 à 1000°C et provient de la décomposition et de l’émission des composés volatiles. Entre le stade de l’aérogel organique et celui de l’aérogel de carbone, la densité du matériau augmente en fonction de sa composition initiale.
• Les carbones issus du procédé plasma Le procédé plasma est basé sur une technologie originale développée conjointement par ARMINES
et le CNRS. Il permet l’obtention de très hautes températures et se caractérise par une grande flexibilité au niveau des conditions opératoires, ce qui favorise la synthèse d’une large gamme de carbones nanostructurés : noirs de carbone, nanostructures fullerèniques, nanotubes etc.
Les noirs de carbone Le principe du procédé consiste à effectuer le craquage thermique d’un hydrocarbure en carbone et
hydrogène en l’absence totale d’oxygène, l’énergie de décomposition étant apportée sous forme de plasma d’arc. Ce procédé a fait l’objet de plusieurs brevets internationaux (1993, 1997, 2000).
Le réacteur pilote se compose d'une tête triphasée supportant trois électrodes en graphite situées sur la partie supérieure du réacteur et alimentée par une source électrique à courant alternatif, d'une chambre réactionnelle - isolée thermiquement d'environ 2 mètres de haut - et d'un filtre de queue permettant la séparation du carbone et des gaz et la récupération des produits.
Les parties externes du réacteur sont en acier inoxydable à doubles parois refroidies par eau ce qui permet la réalisation de bilans calorimétriques. A l’intérieur du réacteur, le plasma est confiné dans une tuyère en graphite isolée thermiquement du réacteur.
Le principe de fonctionnement est le suivant : un gaz plasmagène neutre ou réducteur (azote, argon, hélium, monoxyde de carbone, hydrogène ou un mélange de ces gaz) est introduit dans la partie haute du réacteur. Un arc électrique est établi entre les trois électrodes en graphite, et chaque électrode est alimentée par une des phases du générateur. Le plasma ainsi généré est constitué d’arcs électriques libres qui tournent avec la fréquence du courant.
Après une phase de préchauffage, l'hydrocarbure est introduit au voisinage du plasma à partir de différents points d'injection, ce qui permet une grande flexibilité dans le traitement recherché. La réaction de décomposition thermique est alors initiée : il y a formation de noir de carbone et d'hydrogène. Les produits de réaction sont ensuite entraînés dans un mélangeur où ils sont refroidis par

Chapter VII Résumé de la thèse en français
191
injection d'azote. Le mélange ainsi ‘inerté’ atteint ensuite un système refroidi par circulation d'eau où il est amené à une température inférieure à 60°C. Enfin, un dispositif de filtration sépare les gaz produits et les particules de noir de carbone.
Nanostructures fullerèniques
L’installation est basée sur la technologie initialement développée pour la production des noirs de carbone, laquelle a été modifiée et enrichie de deux composants supplémentaires : un dispositif permettant l’injection du carbone pulvérulent sous forme d’aérosol avec le gaz plasma, et un dispositif pour l’extraction, le refroidissement, la séparation des suies et la recirculation des gaz.
Pour chaque expérimentation, des échantillons sont systématiquement prélevés dans cinq zones, et chaque zone de prélèvement correspond à des produits ayant subi des ‘histoires’ thermiques très différentes : le filtre, le système de trempe, le cendrier, la tuyère en graphite et les électrodes.
Pour ce qui est de la formation des carbones fullerèniques, le précurseur est solide, et le principe de fonctionnement consiste en la vaporisation et la condensation de la poudre de carbone injectée. Dès lors que le plasma est créé, le précurseur est injecté et le carbone vaporisé dans la zone de haute température (> 4000°C). Le mélange de vapeur de carbone et du gaz plasma est rapidement refroidi grâce à un système de trempe. Les deux propriétés structurales qui distinguent les noirs de carbone et les suies de fullerènes sont l’abondance de couches de carbones courbées et de pentagones.
Les nanotubes de carbone
En ce qui concerne les nanotubes de carbone, le précurseur injecté est une poudre de carbone mélangée avec un catalyseur métallique. Une fois le précurseur injecté, le catalyseur et le carbone se vaporisent à des températures élevées (> 4000°C). Cette sublimation entraîne la formation de gouttes contenant une forte concentration de carbone vapeur. L’étape suivante se déroule en phase gazeuse et consiste en la diffusion du carbone dans le métal jusqu’à saturation complète. Lorsque le catalyseur est saturé en carbone, une trempe a lieu, phase durant laquelle se forment les nanotubes par ségrégation du carbone à la surface du catalyseur.
L’originalité du procédé tient dans la diversité des structures formées : les noirs de carbone, les nanotubes de carbones et les carbones fullerèniques. Par ailleurs, le procédé plasma produit des nanostructures de carbone en continu. Enfin, réalisé en l’absence d’oxygène, les matériaux produits présentent une faible surface spécifique et une porosité quasi nulle. Il est à souligner que ce procédé n’émet pas de composés oxygénés (dioxyde de carbone, oxyde d’azote ou soufre).
• Conclusion La diversité des structures produites est particulièrement intéressante dans la problématique du
stockage d’hydrogène. Les aérogels de carbone consistent en des chaînes de particules de carbone, dont l’arrangement et la tortuosité créent une importante porosité et une importante surface spécifique, deux caractéristiques structurales favorisant le stockage d’hydrogène. Les nanostructures de carbone produits avec le procédé plasma ont des formes exotiques originales où l’arrangement des particules de carbone et des plans de graphène laisse supposer d’importantes interactions des forces d’attractions, favorables pour l’adsorption de gaz.
Les deux procédés produisent des quantités importantes de matière, essentielles pour les mesures de stockage d’hydrogène avec notre banc d’essais. La bibliographie a en effet montré que les traitements post-procédés sur les matériaux améliorent leurs capacités de stockage d’hydrogène. Or lors de ces traitements, une quantité importante de matière est consommée, ce qui implique d’en produire au préalable une forte quantité.
Les carbones issus du procédé plasma ont été testés sous forme de pastilles, ce qui a l’avantage de faciliter la manipulation de ces poudres extrêmement pulvérulentes.

Chapter VII Résumé de la thèse en français
192
.8828282
'$9$:
Plusieurs échantillons ont été synthétisés avec les procédés décrits précédemment. Avant d’être testés sur le banc d’essais selon le protocole opératoire bien défini à une température de 25°C et une pression de 100 bars, les échantillons sont préalablement caractérisés morphologiquement.
• Caractérisation morphologique des matériaux testés
Les aérogels de carbone Les aérogels de carbone ont été caractérisés par de la pycnométrie hélium et mercure, par une
mesure d’adsorption d’azote à -196°C, par analyse SAXS et par du MET. Treize échantillons ont été synthétisés dont trois seulement à partir d’acétone comme solvant, et ils ont tous été séchés dans des conditions de CO2 supercritique et pyrolysés à 1050°C sous un flux d’azote. Chaque échantillon synthétisé avec de l’acétone a son homologue en solvant aqueux au niveau du pourcentage de solide en solution et de la quantité de catalyseur. Les conditions de synthèse ont été choisies avec des rapports de résorcinol sur catalyseur variant de 50 à 300, et des pourcentages de solide en solution croissant entre 10 et 40.
La densité apparente, mesurée avec de la pycnométrie mercure, varie de 0,19 à 0,81 g.cm-3 pour les aérogels élaborés à partir d’eau, et de 0,65 à 1,57 g.cm-3 pour les aérogels synthétisés à partir d’acétone. Pour une composition chimique similaire, les aérogels synthétisés avec de l’acétone sont deux fois plus denses que leurs homologues synthétisés à l’eau. Pour un rapport de résorcinol sur catalyseur constant, la densité apparente augmente avec le pourcentage de solide en solution.
La densité du squelette a été mesurée avec de la pycnométrie à l’hélium. Plusieurs échantillons ont été testés pour les aérogels conçus avec de l’eau. La densité du squelette carboné pour cette famille de carbone est de 2,10 ± 0,01 g.cm-3, et de 1,91 ± 0,01 g.cm-3 pour les aérogels de carbone conçus avec le solvant acétone.
L’analyse élémentaire et l’imagerie par microscopie électronique montrent que les aérogels de carbone sont à plus de 95% purs en carbone, le résidu étant essentiellement de l’oxygène. Ils sont formés d’un réseau homogène de particules de carbone dont la taille varie de 5 à 20 nm. L’arrangement des particules forme la porosité de l’aérogel de carbone ainsi que la surface spécifique, qui sont étudiées par adsorption d’azote à -196°C et par SAXS.
La première de ces techniques permet d’évaluer la distribution de la taille des pores présents dans l’échantillon, ainsi que la porosité et la surface spécifique dans l’aérogel de carbone. Contrairement à la diffusion des rayons X (SAXS - Small Angle X-Ray Scattering) qui se base sur les particules solides, l’adsorption d’azote détermine la porosité et la surface spécifique accessible au gaz. C’est à dire que pour chaque échantillon d’aérogel de carbone, une courbe montre la distribution de la taille des pores entre 2 et 100 nm, ainsi que la contribution de la taille des pores au volume poreux.
Nous constatons que la taille moyenne des pores a tendance à diminuer avec l’augmentation de la masse volumique, tout comme le volume poreux. Les aérogels de carbone ont généralement une distribution bi-modale de la taille des pores dans le domaine des mésopores, avec des hystérèses de type H1 et H2. Le premier type se manifeste pour des matériaux poreux ayant une distribution de pores de tailles similaires, tandis que le second type est caractéristique des matériaux ayant un réseau complexe de pores de dimensions différentes.
L’adsorption d’azote détermine également la surface spécifique accessible au gaz, tandis que la diffraction des rayons-X détermine la surface spécifique accessible ou non au gaz. On peut constater un rapport entre les deux surfaces variant de 1 à 10 avec une moyenne de l’ordre de deux. Cela signifie qu’il existe un important réseau de pores fermés dans l’échantillon, soit un important potentiel de sites d’adsorption pour l’hydrogène. Les mesures SAXS montrent également que la taille des particules primaires pour les aérogels à base d’acétone (0,8 à 2 nm) est plus petite que pour les aérogels à base d’eau (1,5 à 2,1 nm).

Chapter VII Résumé de la thèse en français
193
Les carbones issus du procédé plasma Trois familles de carbone ont été produites avec le procédé plasma : les noirs de carbone, les
nanotubes de carbone et les noirs fullerèniques.
Les noirs de carbone
Cinq échantillons de noirs de carbone ont été produits à partir de quatre précurseurs différents, gazeux ou liquides : acétylène, huile de colza, méthane ou styrène. L’analyse révèle que les échantillons présentent des caractéristiques similaires, et sont formés d’agrégats de type noir d’acétylène.
Les mécanismes de formation des noirs de carbone en présence ou en absence d’oxygène ont déjà été largement étudiés et plusieurs théories ont été avancées. En ce qui concerne les noirs de carbone classiques obtenus par combustion, la formation implique trois étapes successives : nucléation ou formation de clusters, agrégation de particules issues de collisions entre un grand nombre de clusters de l’ordre de 1 à 2 nm et finalement agglomération de ces particules sphériques en longues chaînes.
Pour les noirs de carbone haute température de type acétylène tels que ceux obtenus dans le procédé plasma, le processus de croissance diffère sensiblement de ce schéma. Au vu des hautes températures atteintes dans le procédé et du précurseur utilisé, les noirs de carbone sont produits selon la théorie de l’acétylène, et non plus la théorie de la polycondensation aromatique.
Cette structure est hexagonale et uniquement composée de carbone. La plupart des agrégats sont formés de carbone avec une abondance de défauts. La surface spécifique des noirs de carbone est faible du fait de l’absence d’oxygène dans le procédé, ce qui implique que les particules de carbone et le matériau final ont une porosité quasi-nulle.
Il existe très peu de différences entre les échantillons obtenus - malgré le précurseur utilisé - concernant la taille des agrégats ou des particules, et la principale différence se situe au niveau de la cristallinité du carbone ou de la structure interne des particules.
Les noirs fullerèniques
Quatre échantillons de noirs fullerèniques ont été produits. Dans le cadre de la production de noirs fullerèniques, le précurseur injecté est solide, et consiste en du carbone de type noir d’acétylène.
Avant l’injection, le précurseur est caractérisé par un arrangement turbostratique fortement organisé et d’agrégats ramifiés dont les particules sont plates, parfois creuses, et ressemblent à du papier fripé. A nouveau, la surface spécifique de ces matériaux est faible, de l’ordre de 40 à 70 m2.g-1.
Après l’injection, la structure des suies de fullerènes apparaît différente et amorphe, et l’arrangement graphitique et turbostratique a disparu. Les agrégats présentent des formes rondes caractéristiques. La suie est formée de petites particules, coagulées entre elles et formant des chaînes. Au-delà de l’aspect désordonné des particules, une structure graphitique sous-jacente peut être observée.
Cette structure observée est due au procédé qui favorise énergétiquement la courbure des plans de graphène, avec la formation de pentagones pour saturer les liaisons insaturées en absence d’hydrogène. La trempe en atmosphère inerte permet de conserver cette structure.
Les nanotubes de carbone
Un total de 12 échantillons de suies riches en nanotubes ont été produits grâce à des précurseurs différents. Il est possible de distinguer trois familles de carbones produits.
o les nanotubes de type bambou
Cette structure est obtenue lorsque l’hélium est utilisé comme gaz plasma et que les particules de carbone sont injectées avec un catalyseur métallique. Lors d’une observation au microscope électronique à balayage, aucune différence n’est constatée par rapport aux nanotubes monoparois conventionnellement produits. Le diamètre des tubes est de 50 à 100 nm pour des longueurs de l’ordre du micron. Les observations au microscope à transmission à haute résolution ont mis en avant une

Chapter VII Résumé de la thèse en français
194
structure constituée d’une longue série de cônes creux incorporés dans le tube.
Les feuilles de graphène sont orientées à un angle d’environ 30° par rapport à l’axe du tube et sont parallèles à la surface du catalyseur. Ces structures ont déjà été observées et référencées sous l’appellation herring-bone. Les feuilles de graphène ne se connectent pas et entourent les structures coniques creuses. Le tube est généralement fermé à son extrémité par la particule de catalyseur, ce qui laisse supposer une croissance par la pointe du catalyseur.
De par l’utilisation de l’hélium en tant que gaz plasma, les températures atteintes dans les parois du réacteur sont moyennes, aux alentours de 1000°C à 1300°C. A ces températures, les particules de catalyseur sont solides, bien que la température soit proche de la température eutectique du système binaire. Les nanotubes se forment par la diffusion du carbone à la surface chaude de la particule du catalyseur, ce qui favorise la précipitation en feuilles de graphène à la surface de la particule métallique.
Au fur et à mesure que le tube croît, la particule de catalyseur est poussée vers l’avant et la croissance du tube s’arrête lorsque le catalyseur est totalement encapsulé par les feuilles de graphène.
o les nanotubes de type ‘collier de perles’
A l’opposé des nanotubes de carbone de type bambou, déjà observés dans d’autres procédés, les nanotubes de type ‘collier de perles’ ont uniquement été obtenus par le procédé plasma. Les observations au microscope électronique montrent la répétition d’un élément de base semblable à une mini-cloche pouvant éventuellement être remplie par une particule catalytique. Ces éléments de base sont des petits compartiments de diamètre variable dont l’une des extrémités est scellée. Le nombre de couches graphitiques varie entre les deux extrémités.
Lorsque l’azote est utilisé en tant que gaz plasma, la température dans le réacteur est beaucoup plus élevée, variant de 1700°C à 2400°C. A cette température, les particules métalliques sont liquides, et le mécanisme de formation de ces tubes est basé sur un modèle de type vapeur-liquide-solide.
Les nanotubes collier de perles se forment grâce à la solvatation du carbone vapeur dans les particules métalliques, sa diffusion à travers le volume, suivie par une précipitation de l’excès de carbone à la surface de la particule.
o les nanofibres de carbone
Les nanofibres de carbone sont produits lorsque le précurseur gazeux éthylène est utilisé en présence de particules métalliques servant de catalyseur. La croissance de ces fibres est le résultat de la décomposition catalytique de l’hydrocarbure en présence de catalyseurs à une température inférieure à 1300°C. Le diamètre des fibres est de l’ordre de 20 à 50 nm pour une longueur de quelques microns.
La structure consiste en fibres avec un faible degré d’organisation interne, fortement enchevêtrées les unes dans les autres. La particule de catalyseur est emprisonnée dans la fibre. Le mécanisme de croissance est fortement similaire aux deux structures précédentes, avec la diffusion du carbone dans la particule métallique, suivie de sa répulsion le long du catalyseur. La forme de la fibre est dictée par le déplacement de la particule métallique.
L’originalité est que les feuilles de graphite ne se forment pas autour de la particule de catalyseur : la structure apparaît plus comme un empilement axial de couches de carbone, avec un faible degré d’organisation formant la fibre. Cette structure est typiquement obtenue dans le procédé plasma lorsque le précurseur est gazeux et en présence d’hydrogène.
Le procédé plasma est flexible, et permet de produire des formes originales de carbones nanostructurés. Ce procédé produit des noirs de carbone de grande qualité, des suies de carbone riches en fullerènes, ainsi que des nanotubes de carbone originaux tels que les nanotubes de type bambou et ‘collier de perles’.

Chapter VII Résumé de la thèse en français
195
• Les résultats de stockage d’hydrogène pour les aérogels de carbone
Présentation des résultats Grâce aux mesures de pycnométrie hélium effectuées sur les matériaux, il est possible de calculer
le pourcentage gravimétrique intrinsèque, en plus du pourcentage gravimétrique en comparaison à la compression.
La courbe du pourcentage gravimétrique par rapport à la compression en fonction de la pression atteint un maximum à la pression Pmax. La courbe décroît ensuite lorsque la pression augmente, jusqu’à devenir négative au-delà d’une certaine pression limite. A partir de cette pression, le carbone n’est plus efficace et ne permet plus de désorber une quantité supérieure d’hydrogène au volume d’hydrogène désorbé lorsque le réservoir est vide. La pression maximale, qui donne le pourcentage gravimétrique maximal par rapport à la compression, correspond à la pression optimale d’utilisation du carbone. Ainsi, baisser la pression diminue la quantité d’hydrogène désorbable, tandis que l’augmenter augmenterait le coût de compression pour une quantité d’hydrogène similaire à celle désorbable à une pression plus faible.
En ce qui concerne la courbe du pourcentage gravimétrique intrinsèque, une croissance continue est observée, avec une pente plus importante au départ. Cette pente diminue avec l’augmentation de la pression, du fait de la saturation des sites d’adsorption de l’hydrogène dans le matériau.
Influence de la nanostructure sur les résultats Influence de la surface spécifique
La surface spécifique des matériaux a été mesurée grâce à deux techniques complémentaires : l’adsorption d’azote à -196°C et la diffraction des rayons-X aux petits angles. La première mesure donne la surface spécifique mesurée par l’adsorption de gaz tandis que la deuxième donne la surface spécifique mesurée par la diffraction des particules. Cette dernière mesure permet de connaître la surface spécifique accessible ou non au gaz, et révèle l’existence d’une structure fermée, incluant des pores et de la surface. De plus la mesure SAXS tient compte de toutes les tailles de pores qui ne sont pas nécessairement prises en compte lors de la mesure BET.
A l’opposé de certains articles, nos résultats ne présentent aucun rapport de proportionnalité entre la surface spécifique et le pourcentage d’hydrogène stocké dans le carbone, que ce soit pour la mesure BET ou la mesure SAXS. On constate néanmoins que l’augmentation du rapport des deux surfaces spécifiques (SAXS et BET) entraîne une augmentation du pourcentage gravimétrique intrinsèque. Cela s’explique par l’influence des petits pores présents dans l’échantillon, accessibles à l’hydrogène et pas nécessairement à l’azote à -196°C.
Contribution surfacique et volumique des pores
Le premier constat concernant la porosité est que l’unique matériau ne stockant pas d’hydrogène est un matériau sans porosité ni surface spécifique. Par conséquent, la porosité et le volume poreux sont nécessaires pour le stockage d’hydrogène gazeux.
On a également pu constater que les volumes poreux et microporeux mesurés par l’adsorption d’azote n’influencent pas de manière apparente le pourcentage gravimétrique : une augmentation de ces volumes n’entraîne pas une augmentation du pourcentage gravimétrique.
Afin de connaître l’influence de la taille des pores et du volume poreux, il a été décidé d’étudier l’influence de la contribution volumique et surfacique de la taille des pores sur le pourcentage gravimétrique. Pour cela, nous avons calculé la contribution des pores de diamètre inférieur à 10 nm, des pores dont la taille est comprise entre 10 et 50 nm et des pores de diamètre supérieur à 50 nm, sur le volume poreux total et sur la surface spécifique.
Du point de vue de la porosité, il a été constaté qu’une diminution de la contribution microporeuse, accompagnée d’une augmentation de la contribution mésoporeuse, entraînent une augmentation du pourcentage gravimétrique. La présence de mésopores est un des facteurs les plus importants pour le stockage d’hydrogène, mais se doit d’être accompagnée d’une faible présence de micropores. Un

Chapter VII Résumé de la thèse en français
196
échantillon dont seuls les micropores contribuent au volume poreux, stocke une faible quantité d’hydrogène, tandis que l’augmentation de la contribution mésoporeuse augmente le pourcentage gravimétrique. Il est intéressant de noter également que la présence de macropores ne favorise pas le stockage d’hydrogène.
En ce qui concerne la surface spécifique, les pores de petite taille contribuent davantage à la surface spécifique que les pores de plus grosse taille, tels que les méso et macropores. Il a été constaté qu’en présence de mésopores, plus la contribution des micropores à la surface spécifique est importante, plus le pourcentage gravimétrique augmente.
La présence des micropores est essentielle dans la mesure où elle apporte la surface spécifique nécessaire pour le stockage d’hydrogène. Les mésopores sont nécessaires pour apporter le volume poreux utile à la diffusion du gaz dans le matériau jusqu’aux sites d’adsorption, produits par la surface spécifique des micropores.
La taille des particules
Il n’y a aucun lien direct entre la taille des particules et le pourcentage gravimétrique de nos échantillons. Néanmoins, la taille des particules influence fortement le stockage d’hydrogène, dans la mesure où elle conditionne la distribution de la taille des pores dans le matériau.
Grâce aux données calculées par SAXS, nous avons pu déterminer la taille des particules. Pour une faible taille de particules de l’ordre de 2,5 nm, les micropores sont majoritairement présents et les macropores absents. Lorsque la taille de particules augmente, la contribution microporeuse diminue et la contribution mésoporeuse augmente. Pour une taille de particules de l’ordre de 4,5 à 5 nm, la contribution macroporeuse augmente, ce qui implique une diminution de la contribution mésoporeuse et une constante diminution au niveau des micropores. Cela s’explique par l’empilement optimal des petites particules par rapport à l’empilement des grosses particules, où la distance inter-particulaire plus grande implique une taille moyenne de pores plus importante.
• Les résultats de stockage d’hydrogène pour les carbones issus du procédé plasma Tous les échantillons des trois familles de carbone ont été testés sur le banc d’essais sous forme de
pastilles à une température de 25°C et une pression de 100 bars. Dans la mesure où la densité du squelette carboné n’est pas connue, seul le pourcentage gravimétrique par rapport à la compression a été calculé. Les résultats montrent qu’aucun échantillon ne stocke de l’hydrogène en excès par rapport à un système en compression.
Le choix de ne pas calculer le pourcentage gravimétrique intrinsèque est fondé sur le manque d’information concernant la densité du squelette et la forte influence de cette donnée sur le résultat final. Plus la densité du squelette est faible, plus le pourcentage gravimétrique intrinsèque du matériau est élevé. En effet, la masse de matière étant constante, le volume pris par le squelette carboné augmente, ce qui réduit le volume mort dans le réacteur. Par conséquent, le volume d’hydrogène adsorbé par le carbone augmente tandis que la quantité d’hydrogène comprimé dans le volume mort diminue.
Le bilan de l’étude bibliographique nous a mis en garde face à certains problèmes sur l’interprétation des résultats. C’est pourquoi il a été décidé de prendre uniquement en compte le matériau brut, au lieu de chercher à calculer le pourcentage gravimétrique intrinsèque en utilisant une densité théorique du squelette. Tout comme la densité du squelette, le pourcentage de nanotubes présents dans le carbone est également un facteur influençant fortement le pourcentage gravimétrique intrinsèque.
En effet, si l’on considère que l’hydrogène est uniquement adsorbé dans les nanotubes, et si l’on estime le pourcentage de nanotubes présents dans l’échantillon, il est possible de déterminer le volume d’hydrogène stocké dans les nanotubes. Cette erreur d’interprétation a souvent été rencontrée dans la littérature, et est la cause de publications de résultats impressionnants, mais erronés, de stockage d’hydrogène dans les nanotubes.
C’est pourquoi, afin d’éviter des interprétations hasardeuses et d’accumuler les erreurs, seul le

Chapter VII Résumé de la thèse en français
197
pourcentage gravimétrique par rapport à la compression pour les carbones issus du procédé plasma a été calculé. La courbe de pourcentage gravimétrique par rapport à la compression est négative avec une pente négative en fonction de la pression. Le volume d’hydrogène relargué avec le carbone présent dans le réacteur est donc inférieur au volume d’hydrogène relargué lorsque le réacteur est vide.
• Les nanofibres de carbone Deux échantillons de nanofibres de carbone, produits par le laboratoire PROMES-CNRS de
Perpignan, ont également été testés sur notre banc d’essais. L’adsorption d’azote sur les échantillons révèle une hystérèse de type H3, caractéristique des échantillons contenant des pores de type fente.
Les échantillons ne stockent pas d’hydrogène par rapport à la compression et révèlent un pourcentage gravimétrique intrinsèque de 0,24 wt% à 90 bars, avec des courbes similaires. Le protocole expérimental mis en place pour l’élaboration d’un des matériaux a été tiré d’un article qui révélait des capacités de stockage de l’ordre de 15 wt% à une température de 27°C et une pression de 60 bars. La mesure du Centre d’Energétique montre qu’à 60 bars l’échantillon stocke 0,15 wt%, soit cent fois moins que le résultat annoncé dans l’article !
• Conclusion Dans le cadre du calcul du pourcentage gravimétrique par rapport à la compression, on peut
constater que la forme des courbes varie en fonction du carbone.
Une forme très classique est obtenue pour les aérogels de carbone - synthétisés avec de l’acétone ou de l’eau - et les nanofibres. Il existe une augmentation de la capacité de stockage, jusqu’à ce qu’un maximum soit atteint. On constate ensuite une diminution de cette capacité de stockage. La pression optimale d’utilisation de ce carbone se situe au niveau de son maximum, où l’échantillon stocke la plus grande quantité d’hydrogène par rapport à une simple compression d’hydrogène dans un réservoir.
En ce qui concerne les échantillons de nanoparticules plasma de carbone, les échantillons ne stockent pas d’hydrogène en excés par rapport à un système en compression, à une température de 25°C et une pression de 100 bars.
Dans l’étude des résultats de pourcentage gravimétrique intrinsèque, on constate tout d’abord que la forme des courbes est très similaire, avec une augmentation constante du pourcentage gravimétrique, lequel atteint son maximum à la pression maximale de mesure. L’aérogel de carbone produit à base d’acétone révèle la capacité de stockage la plus importante de tout l’échantillonnage. L’aérogel de carbone produit avec de l’eau et l’échantillon de nanofibres de carbone ont une courbe similaire de stockage. L’erreur calculée apparaît importante par rapport aux données de stockage, mais en considérant les résultats de l’étalonnage du banc d’essais, l’erreur réelle reste plus faible que l’erreur calculée.
Les aérogels de carbone stockent intrinsèquement une plus grande quantité d’hydrogène que les nanofibres de carbone. La pente de la courbe évolue avec la pression dans le système, jusqu’à ce que celle-ci s’approche de l’horizontale, correspondant à la saturation en hydrogène de l’échantillon. Les aérogels de carbone ne peuvent être comparés aux échantillons venant du procédé plasma, dans la mesure où la densité du squelette n’est pas connue.
Même si cette densité était connue, le pourcentage gravimétrique intrinsèque serait de l’ordre de 0,1 à 0,2 wt% avec une densité de squelette de l’ordre de 2 g.cm-3. Afin d’exploiter les échantillons provenant du procédé plasma, un traitement thermique sous un flux oxydant permettrait d’ouvrir la structure et de créer une porosité dans le matériau - les matériaux n’étant pas poreux du fait de l’absence d’oxygène dans le procédé.

Chapter VII Résumé de la thèse en français
198
.$88*
Les conclusions de ce travail portent sur le banc d’essais expérimental qui a été élaboré et calibré, les matériaux synthétisés pour l’application et les résultats obtenus concernant l’adsorption de l’hydrogène sur les carbones.
• La bibliographie et le banc d’essais
La bibliographie donne une quantité importante de résultats expérimentaux sur des carbones nanostructurés tels que les nanotubes, les nanofibres et les fullerènes. Nous avons réussi à montrer de fortes variations dans les résultats expérimentaux, essentiellement liées aux techniques expérimentales de mesure, à la quantité et la pureté des matériaux testés, et à l’interprétation des résultats.
Considérant les quantités de matière produites et testées, et leur coût de production, il ne s’agit plus actuellement de trouver le matériau capable de fournir la solution de l’avenir - tel qu’il avait été imaginé pour les nanotubes de carbone il y a quelques années - mais de chercher à contribuer à la compréhension d’une part, du phénomène d’adsorption de l’hydrogène sur les carbones nanostructurés, et d’autre part, des caractéristiques structurales nécessaires pour améliorer le stockage d’hydrogène.
Au vu des quantités limitées de matière testées et des faibles capacités de stockage d’hydrogène, il apparaît d’autant plus indispensable de fiabiliser le banc d’essais afin de minimiser les erreurs faites sur le résultat final. Une grande partie des travaux a été menée dans cet objectif.
Actuellement, le banc d’essais mis en place au Centre d’Energétique s’avère efficace pour l’étude du stockage d’hydrogène sur nos échantillons à une température de 25°C et une pression de 100 bars. Le principal avantage de ce banc d’essais réside dans la possibilité de tester une quantité importante de matière, avec un minimum de 10 grammes, ce qui a pour effet de minimiser les erreurs. Par ailleurs, le dimensionnement du banc d’essais - conçu volontairement au dessus de l’échelle laboratoire - est transposable à l’échelle industrielle.
Le banc d’essais a été soumis à trois tests d’étalonnage. Tout d’abord, la densité d’un matériau non adsorbant a été calculée expérimentalement. Ensuite, la capacité de stockage d’hydrogène d’un hydrure métallique classique - dont l’isotherme d’adsorption est connue - a été mesurée et comparée à l’isotherme standard. Enfin, nos mesures sur deux matériaux produits au laboratoire ont été comparées à des mesures effectuées sur les mêmes échantillons dans un laboratoire externe. Tous ces tests d’étalonnage sont essentiels pour obtenir des résultats fiables et permettent d’affirmer que le banc d’essais est précis et adapté à nos mesures.
• Les matériaux carbonés et les résultats expérimentaux
Contrairement aux carbones issus du procédé plasma, les aérogels de carbone se caractérisent par des structures très similaires constituées d’un réseau de particules de carbone. La conformation de ce réseau détermine la porosité de l’échantillon, le rapport entre la structure ouverte et fermée et la surface spécifique présente. Les aérogels de carbone possèdent une porosité inter et intra particulaire.
Les échantillons sont entièrement composés de carbone, sans impuretés métalliques. Ils possèdent une large structure fermée, favorable pour le stockage d’hydrogène, et présentent une diversité intéressante dans la distribution de la taille des pores. On a pu constater à partir des mesures d’adsorption d’azote à –196°C et des mesures SAXS, que la contribution au volume poreux est essentiellement méso et macro poreuse, tandis que la participation à la surface spécifique provient des micro et mésoporosités.
L’étude du stockage d’hydrogène dans ces matériaux a permis de mettre en évidence deux aspects essentiels dans le procédé d’adsorption de l’hydrogène. D’une part, la mésoporosité présente dans l’échantillon favorise l’accessibilité de l’hydrogène aux sites d’adsorption. D’autre part, la surface spécifique provenant de la micro porosité fournit les sites d’adsorption physique pour l’hydrogène. Les échantillons produits donnent des résultats préliminaires intéressants malgré une faible capacité de stockage d’hydrogène.

Chapter VII Résumé de la thèse en français
199
Les mesures sur les matériaux issus du procédé plasma montrent qu’à une température de 25°C et une pression de 100 bars, les échantillons ne stockent pas d’hydrogène en excès par rapport à un système en compression. Ces résultats étaient attendus si l’on se réfère à la littérature où les mesures récentes les plus fiables font état de capacités de stockage inférieures à 0,5 wt%.
Le procédé plasma, qui présente l’avantage de ne pas émettre de dioxyde de carbone, révèle néanmoins un inconvénient majeur dans le cadre de notre application. En effet, du fait de l’absence d’oxygène dans le procédé, aucune porosité n’est présente dans les matériaux. La structure s’avère fermée et inaccessible à l’hydrogène, si bien que les sites d’adsorption tels que les nanotubes de type bambou ou collier de perles, n’ont pu adsorber l’hydrogène. De même que pour la porosité, la surface spécifique de l’échantillon est faible. Or ces deux éléments, porosité et surface spécifique, sont nécessaires pour l’adsorption d’hydrogène.
• Perspectives
Les perspectives de ce travail mettent l’accent sur le traitement thermique du matériau brut. Les formes exotiques de carbone provenant du procédé plasma contiennent des sites potentiels pour l’hydrogène qui ne sont actuellement pas accessibles au gaz. Une activation thermique de ces matériaux permettrait d’ouvrir la structure afin d’améliorer le stockage d’hydrogène. Les échantillons devraient également subir un traitement afin d’éliminer les impuretés, telles que les métaux servant de catalyseurs.
Concernant les aérogels de carbone, l’analyse SAXS a révélé une structure fermée - caractérisée par de la porosité et de la surface spécifique - intéressante pour le stockage de l’hydrogène. Cette structure pourrait également être accessible après une activation thermique contrôlée, afin d’augmenter les capacités d’adsorption du gaz.

Chapter VIII Appendices
200
VIII APPENDICES

Chapter VIII Appendices
201
1 Appendix 1 : The experimental protocol for hydrogen storage measurements and security issues........................................................................................................................202
2 Appendix 2 : The estimation of the experimental technical errors.........................206
3 Appendix 3 : Experimental techniques for the characterisation of materials .......208
3.1 Nitrogen adsorption .................................................................................................... 208
3.2 Small Angle X-Ray Scattering ................................................................................... 213
3.3 Mercury pycnometry .................................................................................................. 218
3.4 Helium pycnometry .................................................................................................... 219
3.5 Elemental analysis ...................................................................................................... 220
3.6 Raman Spectroscopy .................................................................................................. 220
3.7 Electron microscopy ................................................................................................... 221

Chapter VIII Appendices
202
& 2> 2$$
Experiments that deal with hydrogen are systematically security wise scanned in order to minimise the risks for explosion. Using pressurised hydrogen in a laboratory does not necessarily mean increasing risks as long as the experimenter is conscious of the various factors implied. More
importantly, the experiment is held in a laboratory where other experimenters are not always aware of the various risky elements that can happen. It was therefore decided to establish an experimental
protocol that has been strictly respected and some panels have been fixed on the wall and around the experiment in order to inform that hydrogen is being and therefore some caution should be taken.
Being informed is the best way to prevent accidents…
The experimental protocol has been explained in chapter III, and it has been established in order for all the experiments to be held in the same conditions. In a more practical point of view there are certain security points and steps that have to be taken in a certain order. The importance of theses steps will be shown below as they as the importance of the order of event.
Prior to any experiment check that :
- all valves in contact with the hydrogen bottle are closed - the hydrogen bottle is closed and fixed to the wall - the valve of the 200 bar hydrogen pressure regulator is closed - the gas pipe is not under pressure - the pressure vessel is not under pressure - the vacuum pump is OFF - the evacuation tube of the vacuum pump is oriented outside - the thermostatic bath is set OFF - the ventilation is on in the lab
Initial set-up - weight the sample - place the sample in the sample holder and in the pressure vessel and close the vessel in ‘cross’ - place the insulation around the pressure vessel - close the gas entrance valve of the pressure vessel.
1st step : the outgassing of the sample
- initiate the thermostatic bath at 165°C : check that the tubes are properly place on the pressure vessel and that there is no leak - DANGER OF GETTING BURNT : VERY HOT OIL IN THE THERMOSTATIC BATH
- initiate the computer and the data acquisition unit.
The temperature in the pressure vessel should increase up to at least 150°C before switching the vacuum pump ON. The entire heating cycle takes approximately 30 to 40 minutes up to the time where the temperature in the pressure vessel is 150°C. Once the temperature is reached, the vacuum pump can be switched ON and the thermostatic bath can run with the vacuum pump for 1 hour. For security reasons the entire outgassing cannot be held with the thermostatic bath and the vacuum on as an experimenter should be present when the thermostatic bath is on. Prior to the initiation of the vacuum pump, check that :
- the valves are properly closed and that the gas tube is properly place on the vacuum pump and on the pressure vessel in order to prevent any leak
- the evacuation tube of the vacuum pump is oriented outside: BREATHLESSNESS AND

Chapter VIII Appendices
203
ASPHYXIATION RISKS - the pump has enough oil in its system - switch the vacuum pump to ON - the pressure should rapidly reach 10-1 mbar in the pressure vessel otherwise there is a probable
important charge loss in the ‘vacuum chain‘ : check for any possible leaks - after one hour of outgassing at 150°C, switch the thermostatic bath to OFF in order to prevent
it to run at night when no experimenter is present in case of emergency. - keep pumping overnight - close the entrance valve of the pressure vessel and switch the vacuum pump to OFF
At this stage the outgassing is done and the pressure vessel with the carbon is in a vacuum around 5.10-2 and 10-3 mbar and at room temperature. The next step is to introduce the hydrogen in the pressure vessel isothermally.
2nd step : adsorption – presence of an experimenter compulsory
- The pressure vessel should normally be isolated, if not close the entrance valve - set the thermostatic bath at the temperature required for the test: regularly check for any leak
in the tubes and the liquid gauge level in the thermostatic bath - check that the 200 bar hydrogen gas regulator is closed - open the hydrogen gas bottle to its maximum - open the gas entrance valve of the pressure vessel - open the valve of the hydrogen gas pressure regulator as delicately as possible in order to
increase the hydrogen pressure in the pressure vessel as gently as possible to keep the pressure vessel at constant temperature
- once the required testing pressure is attained, close the entrance valve in order to isolate the pressure vessel
- close the hydrogen gas bottle - close the hydrogen gas pressure regulator valve - empty the gas pipe of any hydrogen gas present thanks to the evacuation valve placed
and oriented outside - reopen the hydrogen gas pressure regulator to evacuate the gas blocked in between the
hydrogen valve and the hydrogen gas pressure regulator - once the pressure regulator is emptied of gas close the valve - close the evacuation valve - check that there is no leak present in the pressure vessel: wait until the stabilisation of the
temperature and pressure in the pressure vessel
At this stage, the sample is in equilibrium with the hydrogen gas at the temperature and pressure required for the measurement. All the data of the different phases are recorded on a data sheet in the computer. The next step is the desorption of the pressure vessel filled with the carbon.
3rd step : desorption - presence of an experimenter compulsory - isolate the system for a minimum of three hours until the pressure and temperature are stable
in the pressure vessel - Reset the gas flow meter counter to zero and check that the water level is correct. If not add
distilled water to regulate the water level. - check that the gas flow meter exit is properly oriented towards the exit (outside) - verify that the two regulating valves are closed - open the exit valve gently in order to start the desorption of the hydrogen present in the
pressure vessel, and regulate the gas flow thanks to the two fine regulation valves. The gas flow rate should be kept constant in the range of 1 to 60 L.h-1. At the same time, the volume of hydrogen released, the temperature and pressure in the pressure vessel and in the gas flow meter are measured continuously.
- at the end of the experiment the sample holder with the sample is weighted in order to get the mass of material subject to the hydrogen, as the weight before and after outgassing is not the

Chapter VIII Appendices
204
same. The sample holder is cleaned, and any residue of carbon is cleaned from the pressure vessel and the sample holder.
- the whole system should be cleaned with acetone and compressed air BEFORE LEAVING THE LAB CHECK THAT:
- the hydrogen bottle is closed and properly fixed to the wall - the valve of the pressure regulator is closed - the pressure vessel is not pressurised - the gas pipe is at atmospheric pressure - the vacuum pump is switched OFF except during the outgassing phase - the thermostatic bath is set to OFF
During the entire experimental phase of the hydrogen storage test an experimenter has to be present in the laboratory in order to be able to react quickly in case of emergency, such as a leak in the pressure vessel or coming from the bottle.
All the data captured can be instantly visualised thanks to a transmission to the computer. It is important to keep an eye on various parameters such as:
- the temperature in the pressure vessel in order for it to remain constant - the pressure in the pressure vessel : the first indicator in case of leak - the gas flow rate has to be in the acceptable range for the gas flow meter - the gas temperature in the gas flow meter
The action to have in case of a hydrogen leak, is to close all the valves in contact with the gas, turn the light OFF, increase the natural ventilation in the lab, depressurise all the pressurised parts of the set-up thanks to the evacuation valves.
Other risks during an experiment :
- hydrogen leak in the pressure vessel or joint failure : hydrogen leaks in the lab. The maximum volume of hydrogen at 150 bars and room temperature is around 30 dm3. Considering that the total volume of the lab is of 87500 dm3, the volumetric percentage of hydrogen in the lab in case of leak of the hydrogen is of 0.034 % of hydrogen, which is less than the inferior limit of explosibility for hydrogen (13 to 65 volume percent in air and the flammability limits between 4 and 75 volume percent in air). It should be noted that the pressure in the pressure vessel is constantly recorded and visible from the experimental set-up and therefore, an infinite leak can be seen and the experimenter can act as quickly as possible.
- Hydrogen leak from the bottle or the gas pipe: in this case the bottle empties itself in the lab with a maximum volume of 3.5 m3, which represents 4% of hydrogen in the lab which is inferior to the limit of explosibility. In case of an important leak coming from the bottle, the experimenter can hear it and act very quickly.
- Simultaneous presence in the lab of a lit cigarette and a hydrogen leak: explosion guaranteed smoking forbidden sign in the lab.
- A major danger in case of a hydrogen leak - might it come from the vessel or from the bottle - comes from the fact that hydrogen is a very light gas and goes immediately to the ceiling. The explosion could come from some hydrogen in contact with an electrical current.
The access to the lab is strictly forbidden to non-authorized persons. Various panels are sticked on the walls indicating the use of hydrogen in the lab.

Chapter VIII Appendices
205
Procedure for the handling of the various carbon powders :
Whatever the powders used for the testing on hydrogen storage, it is important to protect itself with respect to the various impurities in the powders. Certain powders may contain noble metals or inorganic molecules which are not inert for the human body. It is therefore highly recommended to use rubber gloves, a mask and to wear a lab coat.

Chapter VIII Appendices
206
& 2 > 2
The calculation on the experimental errors has shown some recurrent errors based on some measuring devices in the experimental set-up. All theses errors are constant along the procedure for calculating the experimental errors. These constants used are presented below as values that are introduced in the calculation.
These constant errors are for the pressures in the gas flow meter and in the pressure vessel, the various temperatures measured, the volume of hydrogen measured with the gas flow meter and the constants such as the molar mass and the ideal gas constant. The values and the explanations are given below:
- P0 [bar]: the pressure measured in the gas flow meter is actually the atmospheric pressure in
the laboratory and depends on the weather and the altitude, knowing that the average pressure at the level of the sea is 1013.5 mbars. This pressure transducer has a measuring range from 0 to 3000 mbars and a scale that has been centered from 800 to 1200 mbar. The accuracy of the pressure transducer is ± 0.05% of the full scale, hence
P0 (bar) = 0.0015
- P1 [bar]: the pressure in the pressure vessel is made by a pressure transducer measuring the relative pressure in a scale length of 0 to 100 bars. The accuracy of the pressure transducer is of ± 0.05% of the full scale:
P1 (bar) = 0.05
- P = P0 + P1 [bar]: is the absolute pressure in the pressure vessel and hence the error is the addition of the two previous ones:
P (bar) = 0.0515
- T0, T1 and T2 [°C]: These temperatures are the temperatures in the gas flow meter, in the pressure vessel and in the tube. The accuracy of these values is
T0 = T1 = T2 (°C or K) = 0.5
- V [L]: initially the volume of hydrogen is measured in pulses and the conversion is simple, 400.4 pulses correspond to 1 L. The error on the volume is 0.2 percent of the volume measured plus 2 pulses corresponding to the start and stop of the experiment, hence:
V (L) = 0.02*V + 2/400.4 - Z(P,25°C) [n.u]: The equation of the compressibility factor at any pressure and at a
temperature of 25°C has been given in the chapter presenting the experimental set-up and the error made is determined through the following equation by a derivation with respect to P the equation:
Z (P,25°C) [n.u] = 2.652*10-7*P + 5.906*10-4 where P is expressed in bars. - Z(P0,T0) [n.u]: Similarly as above the errors made on the compressibility factor at a
temperature T0 and a pressure P0 is the derivation with respect to P0 of the equation established previously:
Z (P0,T0) [n.u] = 0.00061 - mc [g]: the mass of the sample is measured thanks to a precision balance, up to the milligram.
The mass of the sample is measured after the experiment, as prior to the experiment the sample contains a certain amount of humidity and impurities that will not be present during the experiment anymore as the sample is outgassed prior to the experiment. Nevertheless, by

Chapter VIII Appendices
207
the time the sample is taken out of the pressure vessel and brought to the balance it has already taken some weight back due to the humidity. Referring to some studies on carbon black materials, it is estimated that the mass increase due to humidity is around 3% of the total mass of the sample. As a consequence:
mc (g) = 0.0001 + 0.03*mc
- R [J/mol.K]: the ideal gas constant has a value of 8.31451 and, as found in the literature, the
accuracy of the value is R=8.4*10-6 J/mol.K
- M(H2) [g.mol-1]: The molar mass of hydrogen is equal to 2.015 g.mol-1 but values in the
literature vary between 2.014 and 2.016 g.mol-1. Hence the accuracy of the value of the molar mass of hydrogen is
M(H2) = 0.001 g.mol-1
These parameters can evolve with the equipment, and have already evolved. Initially the pressure transducer used for the relative pressure in the pressure vessel had a full scale of 0-200 bars and an accuracy of 0.5 %, meaning a precision of ± 1 bar, which is too high considering the set-up. The pressure measured in the gas flow meter was initially set to 1.013 bar, which could bring errors in the final calculation. Additional precision can be made concerning the various parameters thanks to the reproducibility of an experiment.
It should be noted that the calculated error is a theoretical maximum error possible, and for a specific value, its accuracy can be increased by considering a series of measurements and calculating the standard deviation of the value in the experimental series. As it was observed for the series of measurements done with the empty pressure vessel, the accuracy of the repeated experiment was greater than the calculated error.

Chapter VIII Appendices
208
& 2>62
Various experimental techniques have been used to characterise our carbon materials, which is not always an easy task as they are nanostructured. Important factors such as specific surface area, porosity, bulk and skeleton density, particle size or cluster size, amount of nanotubes, interlayer distance between graphene layers, amount of catalyst, homogeneity of the sample etc. help in defining the material and observing the influence of the experimental conditions on the final nanostructure of the carbon.
33..11 NNiittrrooggeenn aaddssoorrppttiioonn
This technique is widely used for the characterisation of the internal structure of any porous material. It consists in measuring the amount of nitrogen adsorbed and desorbed on a sample as a function of the partial pressure of nitrogen during the experiment. Depending on various hypothesis and experimental conditions, it is possible to obtain information’s such as the pore size distribution, the specific surface area of the material and the various porous contribution in the sample.
Liquid nitrogen is used for adsorption as it will not alter the internal structure of the material under investigation. Other gases such as argon or CO2 can also be used for adsorption, but the experience has established nitrogen as a standard. The adsorption of nitrogen is done at -196°C, boiling temperature of liquid nitrogen under atmospheric pressure, and the molecular area of the adsorbate is equal to =16.2Å2, estimated through the average distance of molecules in liquid nitrogen.
3.1.1 Classification of the isotherms
During adsorption, depending on the internal structure of the material, different isotherms might appear, which have been classified in five different types by Brunauer in 1940 and a sixth isotherm appeared a couple of years later. Figure VIII-1 summarises the different isotherms available. Each graph represents the amount of gas adsorbed and desorbed as a function of the nitrogen partial pressure at the temperature of liquid nitrogen.
Figure VIII-1 The classification of the different adsorption isotherms [219]
The type I isotherm is characterised by a constant radius of curvature and rises sharply at low relative pressures and reaches a plateau. A decrease in the micropore width results in an increase in the adsorption energy and hence a decrease of the relative pressure for micropore filling. The narrow range of relative pressure necessary to attain the plateau is an indication of a limited range of pore
BB
III III
IV V VI
BB
III III
IV V VI

Chapter VIII Appendices
209
size, and the appearance of a nearly horizontal plateau indicates a saturation of the monolayer and a very small external surface area. This type of isotherm is found during physisorption in micropores.
The initial steep increase of the amount adsorbed at low partial pressures is an indication of micropore adsorption as illustrated on the figure below:
0.001
0.35 nm
1 nm
2 nm
0.01-0.05 p/p0
Secondary filling
Primary fillingInaccessible part
0.001
0.35 nm
1 nm
2 nm
0.01-0.050.01-0.05 p/p0
Secondary filling
Primary fillingInaccessible part
Figure VIII-2 Successive filling of the micropores during nitrogen adsorption at –196°C
There is inevitably an inaccessible part at extremely low partial pressure as the size of the molecule is too high for the pore size. For pores between 0.35 and 1 nm a primary filling by the molecules occur, and as the partial pressure increases up to 0.05 a secondary filling occurs for the micropores up to 2 nm and a monolayer starts to form on the surface of the pores.
The type II isotherm is characterised by an initial knee (point B) followed by a change in curvature, and finally a vertical asymptote corresponding to the formation of the liquid when the pressure reached is the saturating vapour pressure. The asymptote is due to the formation of the multilayer whose thickness can increase indefinitely. The smooth non-step wise character is often associated with energetic heterogeneity in the adsorbent-adsorbate interactions, and the absence of a clear point B as for type I isotherms, is a sign of the overlap of the monolayer and multilayer adsorption. The first change of curvature shows the moment when the first layer (monolayer) is almost complete although the following layers have already started to built up. This type of isotherm often exhibits a type H3 hysteresis loop (c.f. next page) and is observed for plane materials with non porous, macroporous or even, to a limited extent, microporous surfaces.
The type III isotherm can only be distinguished from the type II by their difference of curvature which is oriented to the top in this type of isotherm. A type III isotherm concerns multilayer adsorption on a non porous surface. Compared to type II isotherms where the attraction adsorbent-adsorbed is high enough to built up the monolayer. On a type III isotherm the interaction between adsorbent and adsorbed is lower than the interaction adsorbed-adsorbed that helps to built up the monolayer. This type of isotherm is quite rare: water or alkanes on polymer deprived of any functions on the surface (PTFE, PE, PAN etc.).
The next type of isotherm, type IV, has a very similar initial region in the low partial pressures as for a type II isotherm, and tends to level off at high relative pressures. It exhibits an hysteresis loop, the lower branch representing the measurements with the progressive addition of adsorbent and the upper branch by the progressive withdrawal. The hysteresis loop is usually associated with the filling and emptying of the mesopores by capillary condensation. The type IV isotherms are quite common but the form of the hysteresis loop varies from the various types presented in the Figure VIII-3 below. This type of isotherm is most valid for mesoporous materials.
As for the type V isotherm they are very similar to type III isotherm again because the interaction adsorbed-adsorbent is weaker than the adsorbed-adsorbed interaction. The isotherm finishes just like a type I and type IV, depending if the structures contain micropores or mesopores, and often exhibits an hysteresis loop, associated with the mechanism of pore filling and emptying. This type of isotherm is quite rare.
The final type of isotherm is characterised by different vertical steps with a maximum of three. As for type III and V, it corresponds to an energy of interaction adsorbed-adsorbent lower than the energy of interaction adsorbed-adsorbed, and a uniform surface energy. This last characteristic can only be

Chapter VIII Appendices
210
found with a certain type of lamellar crystals (graphite, metals, etc.) where adsorption is done on dense surfaces, with a certain mobility. This isotherm is rarely found in practice, mostly in the case of adsorption with Krypton at -196°C and the unique application is the measurement of an index of graphitisation by the comparison of the height of the first and second plateau of the adsorption isotherm of Krypton on carbon at -196°C.
As stated earlier, an hysteresis loops appear on various types of isotherms. Very common on the isotherms IV and V a hysteresis cycle can also be observed on type II isotherms. A hysteresis loop is characterised by a lower and an upper branch of the adsorption and desorption isotherm, and another common feature is that for a given adsorptive, at a particular temperature, the steep region of the desorption branch joins the adsorption branch at a limit in partial pressure. This lower limit is dependent on the adsorptive and the temperature but not on the adsorbent, and in the case of the nitrogen adsorption at -196°C the lower closing point is at a partial pressure of 0.42. Apparently, the presence of different particle size and porosity produces capillary condensation in the pores, which explains the hysteresis loops. De Boer in 1958 tried to link the shape of the pores to the shape of the hysteresis cycle as shown in Figure VIII-3.
Figure VIII-3 The different forms of hysteresis curves
The type H1 is found with a narrow distribution of uniform pores, which explains this fairly narrow loop with very steep and nearly parallel adsorption and desorption branches. The H2 hysteresis is found with a large diversity of pore size with complex materials made up of interconnected networks of pore of different size and shape, which explains this broad shape with a long plateau and a steep desorption branch. Types H3 and H4 do not terminate in a plateau at high partial pressures and the limiting desorption curve is difficult to determine. H3 loops are found with slit shaped pores and H4 with a certain number of microporous materials, and both types are less frequently observed than the first two types of loops.
After the figure of the micropore filling, the figure below shows the mesopore filling as a function of the partial pressure and the pore size.
0.1
0.35 nm1 nm
2 nm
0.42-0.5 p/p0
Secondary filling
Primary fillingInaccessible part
4 nm
7 nm
Multilayer
Capillarycondensation
Meniscus
Statisticalmonolayer
0.42
0.1
0.35 nm1 nm
2 nm
0.42-0.5 p/p0
Secondary filling
Primary fillingInaccessible part
4 nm
7 nm
Multilayer
Capillarycondensation
Meniscus
Statisticalmonolayer
0.42
Figure VIII-4 Mesopore filling during nitrogen adsorption at -196°C
The figure shows that at a partial pressure of 0.1, the filling occurs of pore sizes greater than 2 nm, which concerns mesopores. If a material is made up of uniform pore size, for a very narrow range of partial pressures, the volume adsorbed will increase for that pore size distribution. The monolayer starts to form on pore sizes greater than 4 nm. As the partial pressure increases a meniscus starts to form and moves to the entrance of the pore.
Evaporation proceeds in the reverse direction but involves the same elemental steps and the entire

Chapter VIII Appendices
211
system is reversible. The hysteresis loops, which appear in the multilayer range of physisorption, during the desorption, are associated with capillary condensation, explaining this plateau at high partial pressure and this steep desorption curve closing the hysteresis.
Once the experiment of nitrogen adsorption has been made and the type of isotherm determined, different phases of interpretation are available, depending on the relative pressure. Three different phases are possible: one for the determination of the volume of micropores, another phase for the specific surface area and the final one for the fractal dimension of the sample, and at each phase corresponds a specific model. If we consider an isotherm with the amount of gas adsorbed as a function of the relative pressure p/p0 varying from 0 to 1, for partial pressures below 0.05 the validity domain is for the Dubinin-Radushkevich model, for pressures between 0.05 and 0.35 the valid model is the BET model (Brunauer, Emmett and Teller) and for pressures greater than 0.35 the valid model is the Frenkel-Halsey-Hill.
3.1.2 The BET treatment
3.1.2.a The BET surface area
The BET treatment is based on a kinetic model of the adsorption process in which the surface of the solid was regarded as an array of adsorption sites. A state of dynamic equilibrium was postulated in which the rate at which molecules arriving from the gas phase and condensing on to the bare sites is equal to the rate at which molecules evaporate from occupied sites. Using this equilibrium the Langmuir equation can be derived for the case of adsorption confined to a monolayer:
BpBp n
nm += 1 equation VIII-1
n is the amount of gas adsorbed, nm the monolayer capacity, B is an empirical constant and p the pressure. During his research Langmuir referred to the possibility of the evaporation-condensation mechanism that could also apply to the second and higher molecular layers, but the equation derived was too complex with very little use. With the same mechanism as Langmuir but by introducing several simplifying assumptions, Brunauer, Emmett and Teller were able, in 1938, to establish their relationship for multilayer adsorption.
( )
−+
−=
00
0
111ppC.
pp
pp.C.V
Vml
ads equation VIII-2
Vads and Vml are the amount adsorbed per mass (in cm3(STP)/g) at a relative pressure p/p0 and the monolayer capacity, respectively. The parameter C depends on the difference of interaction of the adsorbed gas in the first monolayer and the higher ones:
−= RTEEexp.k C L1 equation VIII-3
where E1-EL is the net molar energy of adsorption, E1 being the average heat of adsorption of the less active part of the adsorbing surface and EL is the liquefaction energy of the adsorptive.
The linear transformed BET equation was based on the assumption that the rate of condensation of the molecules from the gas phase on to the molecules already adsorbed in the nth layer shall be equal to the rate of evaporation from the n+1 layer, and by considering x=p/p0 and rearranging the equation above we get
xCV
CCVxV
xmlmlads
1 1 )1(
−+=− equation VIII-4
By plotting , versus)1(
xxadsV
x− C and Vml can easily be calculated using the slope and the ordinate at
Chapter VIII Appendices
212
the origin, originat ordinate slope1
+=mlV and originat ordinateslope1+=C .
Once the value of C is taken as experimentally acceptable, if one knows the value of the projected area (σ) covered by each molecule adsorbed in the monolayer (Vml), the specific surface area of the adsorbent can be calculated by using the Avogadro’s constant:
σ.. amlBET NVS = equation VIII-5
where Na=6.02*1023 molecules.mol-1, σ in m2.molecule-1, Vml in mol.kg-1 and SBET in m2.kg-1.
The validity domain for the BET theory is for partial pressures of 0.05 to 0.35, and the various hypothesis for the theory are given:
• the molecules of the last layer adsorbed are in equilibrium with the vapour phase • there are no lateral interactions between the adsorbed molecules • there is only one type of adsorption site • the ratio ai/bi is constant for every layer i>1, where ai and bi are the adsorption and
desorption constant for every layer I • E1 is the adsorption energy for the first layer, and Ei = El for every i>1, EL being the
liquefaction energy of nitrogen at –196°C.
3.1.3 Pore size distribution
The pore size distribution is evaluated using the BJH theory. The Barrett-Joyner-Halenda method for calculating pore size distributions is based on a model of the adsorbent as a collection of cylindrical pores. The theory accounts for capillary condensation in the pores using the classical Kelvin equation, which in turn assumes a hemispherical liquid-vapour meniscus and a well-defined surface tension. The BJH theory incorporates thinning of the adsorbed layer through the use of a reference isotherm. The Kelvin equation is only applied to the “core” fluid.
The evaluation of the pore size distribution is based on the step by step analysis of the desorption branch. For every partial pressure, the desorbed gas comes from :
o on the one hand from the desorption of the nitrogen condensed by capillarity in a certain range of pore size (the smaller the pressure, the smaller the pore size). The desorbed volume is the internal capillary volume of the pores with the Kelvin radius rkn corresponding to the pore radius rpn and the thickness t such as
trr knpn += equation VIII-6
o and on the other hand from the decreasing thickness of the adsorbed layer in the greater pore size previously emptied of their condensed gas.
The Kelvin radius can be expressed by the Kelvin law which is derived from the mechanical equilibrium condition of the Laplace equation and the physicochemical equilibrium with the equality of the liquid and gaseous chemical potentials. The Kelvin law is written as follow:
( )0ln.2
ppRTVr
lmkn
γ−= equation VIII-7
where γ and lmV are respectively the surface tension and the molar volume of the liquid adsorptive. Applying this law to nitrogen at the temperature of -196°C, the following relation is found between the Kelvin radius and the partial pressure
( )0ln415.0
ppknr −= equation VIII-8
It is now important in order to obtain the pore size distribution to get a law giving the thickness as a function of the partial pressure. The classical Micromeritics machine used for the BET study of our

Chapter VIII Appendices
213
materials chose the Harkins-Jura law for the desorption branch
( ) ( )5.0
0Å log
−=
ppBAt equation VIII-9
and the Halsey empirical relation for the adsorption branch
( ) ( )31
0Å log
5*54.3
−=pp
t equation VIII-10
with classically the two empirical values A=13.99 and B=0.034 established for the nitrogen adsorption. Considering that with the nitrogen adsorption measurements we have the volume of nitrogen adsorbed/desorbed as a function of the partial pressure, it is possible to obtain the pore volume as a function of the pore size and hence the pore size distribution of the material.
In a practical point of view, this calculation for the pore size distribution is valid in the partial pressure range where the hysteresis is, hence always above 0.42 and the calculation is generally done on the desorption curve.
3.1.3.a The microporous volume
In order to determine the microporous volume using the apparatus and the nitrogen isotherm the t-method is frequently used. In this method, the thickness t of the adsorbed layer is plotted versus the adsorbed volume. This method is limited to the nitrogen adsorption and the thickness t is given by Harkins-Jura law, given above.
Practically, for every partial pressure, to a value of the number of moles adsorbed (na) corresponds a thickness t of the layer adsorbed. t and na are normalised respectively by the thickness of a monolayer of nitrogen, hence 3.54 angstroms, and by the number of moles adsorbed in a monolayer, giving the following equation
( )m
a
nnt
=54.3Å equation VIII-11
and the shape of the curve na as a function of t indicates the presence or not of micropores and mesopores.
It is quite frequent to use a combination of different available techniques and to use the results of each technique in order to evaluate in the best possible way the surface area and the porosity. The use of the SAXS technique is getting largely spread and a great amount of literature is available on the characterisation of aerogels using the SAXS technique [220,221,222]. A greater study on the SAXS measurement methods will ultimately be made in order to get a greater understanding on the technique and the information that it gives. It is a complementary technique to the nitrogen adsorption, as it enables to determine the surface area of the material, it can evaluate the particle size and the porosity, with this major advantage that it takes into account the closed porosity of the material, and the diffusion of the X-rays by the solid matter in the material rather than the porous part of the material.
33..22 SSmmaallll AAnnggllee XX--RRaayy SSccaatttteerriinngg
3.2.1 Basic principles of X-Ray scattering
3.2.1.a Theory
X-rays, just like light, is an electromagnetic radiation characterised by its wavelength which is very different than for light. The wavelength for X-Rays is close to a few Angstroms, whereas the wavelength for the visible light is comprised between 5000 and 8000 Angstroms. A representation of the scattering experiment is shown below. The specimen is irradiated by X-Rays (or neutrons) which are transmitted through the sample. The scattered intensity is then measured thanks to a detector as a function of the scattered angle.

Chapter VIII Appendices
214
Figure VIII-5 Schematic representation of a scattering experiment and diffusion in the q direction by two diffusing centres distant from each other by r [223]
The scattered intensity depends on various parameters, such as the size and the concentration of the scattering entities, the atomic composition of the sample and the type of radiation used. The intensity measured is I(q) where q is the scattering vector with q=k’-k. If the structure is considered as statistically isotropic, the scattered intensity depends on the absolute value of the scattering vector:
)2sin(4 θλπ=q equation VIII-12
For any type of radiation it is possible to define the differential section dσ/dΩ that characterises the interaction between the radiation and the matter. The diffused intensity in the q direction and in the solid angle dΩ is proportional to:
ΩΩΦ≈ ddddI σ
0 equation VIII-13
where Φ0 represents the incident flow on the solid volume of matter considered.
For materials such as aerogels, which consist in a network of particles, the scattered intensity can be written as
( ) ( ) −=V
e dViqxxAI exp)( 2 γq equation VIII-14
where Ae represents the radiation by X-Rays, V is the irradiated volume, γ is the auto-correlation function representing the summation in the irradiated volume of the variations of the electronic density in the medium and iqx is the dephasing function and x=r-r’.
The interference figure obtained is an average of all the orientations possible for the scattered intensity and hence
( ) ( ) Φ= dIqI .q and ( ) ( ) Φ= dx .xγγ equation VIII-15
giving the following equations that will be used to interpret the curves of the scattered intensity with the scattering angle:
( ) ( ) ( )∞
∝0
0sin4 dx
qxqxxqI πγ equation VIII-16
with ( ) ( )0
0=
=x
xxγγγ and ( )== dqqIq
Aex
2220 2
1πγ equation VIII-17
The equation above shows that ( ) dqqIq2 is a constant of the system and called the invariant. In
the case of a medium consisting of two phases with a volumique fraction Φ1 and Φ2 without any correlation between the two diffusion particles, the invariant Q can be written as so:
( ) ( ) ( )112
21222 12 Φ−Φ−== ρρπ eAdqqIqQ equation VIII-18
source
photons /neutrons
sample
detector
source
photons /neutrons
sample
detector

Chapter VIII Appendices
215
where (ρ1-ρ2)2, is the electronic contrast between the two phases. The invariant is a measure of the amount of scattering material that is seen by the beam, and changes in the invariant can be useful for monitoring the crystallization process in polymer materials.
The equation above, used with some simplifying hypothesis, is used for the interpretation of the scattering curves.
3.2.1.b The scattering curves
The different characteristics of the scattering pattern can be related to the different structural features on the respective length scale as can be seen in the figure below:
!"
!"
∝#$
∝#$#%
!"
!"
∝#$
∝#$#%
Figure VIII-6 Typical small angle scattering intensity of a particle network such as aerogels [224]
As seen on the figure above representing a typical SAXS intensity curve, three distinct regions can be observed. At smallest q-values, the scattered intensity is constant because at the corresponding large length scales scattering does not allow the resolution of inhomogeneities in the sample. This constant intensity is observed at small values of q, consistent with a uniform long-range structure, i.e. the aerogels are uniform at length scales greater than 50 nm [225]. The intermediate dependence can be explained in terms of fractals, considering the branched, self-similar appearance of the aggregates, and the power law behaviour at high scattering angles can be ascribed to the surface morphology of the particles.
In a porous material, the position of the break in I(q) in the Guinier regime (that corresponds to small q values) provides a measure of the correlation length, , which approximates to the mean pore radius. In the Porod regime (i.e. intermediate and high q values), the SAXS curve continues to decrease monotonically. In this regime, dimensions that are larger than chemical bond distances but smaller than the mean pore size are probed. For each of these domains, a special analysis can be made for the exploitation of the curves recollected from SAXS measurements.
3.2.2 The Porod regime
At high scattering vectors the commonly domain considered is called the Porod regime and identifies the small particles present in the material, which is the matter that diffuses at those scattering vectors. At these limits it is possible to have a Mc Laurin development of the equation VIII-16.
The auto-correlation function can then be written as so
( ) ( ) ....410
21
2,100 +
ΦΦ−= x
VA
x γγ equation VIII-19
where V is the diffusing volume, A1,2 is the separating surface between the two phases and Φ1 and Φ2 are the volumique fraction of the two phases 1 and 2. The scattered intensity in the Porod regime is

Chapter VIII Appendices
216
then
( ) ( ) 42,1221
2 2 −∞→ −∝ q
VA
AqI eq πρρ equation VIII-20
This Porod law is observable if the interface is smooth, well defined and where the electronic density is clear, which is the case for carbon aerogels.
At these high angles, the shape of the curve is useful in obtaining information on the dimensions of our scattering particles. For a system of relatively identical and well defined particles, we might be able to see broad peaks that would also give us information on the shape of the particles. The scattered intensity is then as so
( ) ( )qPqSqI ∝)( equation VIII-21
where P(q) is the particle scattering function and S(q) is the interparticle structure factor – it describes how the subunits are mutually arranged. It is generally not possible to separate the influence of S and P as the exact equation of P is unknown, except in the case of spherical particles.
In the case of a monodisperse system, oscillations in the Porod regime will appear corresponding to the various zeros of the equation for P(q). The size of the particles can be determined by plotting I(q)*q4 as a function of q, which enables to show the oscillations, and the position of the first maximum and minimum are related by the size of the particles d by
( ) 74.221max =dq and ( ) 49.4
21min =dq equation VIII-22
3.2.3 The Guinier regime
For small scattering vectors the diffusion comes from the large entities present in the material. This domain is commonly called the Guinier domain. The scattered intensity is then constant because at the corresponding large length scales, scattering does not allow the resolution of inhomogeneities of the sample.
In this regime the expression of the scattered intensity can be written as follow:
( )
−= 31.0)(2
2 gRqIqI equation
VIII-23
where Rg is the radius of gyration or the Guinier radius of the diffusing particles.
This radius of gyration is introduced as a characteristic length for the particles of any shape. It is a non dimensional constant that measures the geometry of the particles and is used when the geometry of the particles is not known. It enables to establish equations and a theory based on matter independently of the geometry of the particles. Once the equations are established and if the form of the particles is well known it is always possible to correlate the radius of gyration to the dominant parameter and a correspondence can be made between the radius of gyration and various forms of the particles. For example, for spherical particles of radius R the link between the two is established
thanks to this equation: 2253RRg = .
The right hand-side of the equation above is the first approximation of Mac-Laurin of the function )3exp( 22 gRq− as the product qRg is very small compared to unity in the Guinier domain. The equation
of the scattered intensity in the Guiner regime is thereby written as:
−= 30
22 gRqexp)(I )q(I equation VIII-24
The intermediate dependence can be explained in terms of fractals, considering the branched, self-similar appearance of the aggregates.
Chapter VIII Appendices
217
3.2.4 Fractal diffusion
The diffusion by a fractal object leads to a diffused intensity that has the form of a power law:
• in the case of a mass fractal:
( ) mDq qI −∝ with 1 Dm 3 equation VIII-25
in which Dm is the fractal dimension of the aggregate or of the cluster.
• in the case of a surface fractal:
36 ≤≤∝ −− s
)Ds( D 2 withq )q(I equation VIII-26
in which Ds is the surface fractal dimension. In the limiting case of Ds=2, which corresponds to a smooth surface, the Porod law is retrieved with I proportional to q-4.
Carbon aerogels materials do not exhibit this behaviour over any extended range of q, compared to silica aerogels that have been shown to be mass fractals over more than a decade of q space.
3.2.5 Calculating the specific surface area
It is possible, in the case of a medium containing two phases separated by a clear interface (such as the skeleton of a aerogel and the pores it contains), to determine the specific surface area of the diffusing particles from the domain where the scattered intensity follows the Porod regime. In this domain, the diffused scattered intensity is proportional to the interface A1,2 separating the two phases. The surface per unit volume of solid is then given by the equation:
( )Q
K.*VA
S ,VS
ϕπϕ
−== 110321 equation VIII-27
where K=lim(I(q)×q4) when q tends to infinity, the factor 103 enables to obtain Svs in m2/cm3,when K/Q is expressed in nm-1, and ϕ is the volumique fraction of the solid.
SVS is the surface per unit volume of solid, and by dividing it with the density of the skeleton, ρS, it is possible to obtain the specific surface area of the carbon aerogel:
s
vssp
SSρ
= equation VIII-28
The parameter K is determined by corresponding I(q) with a power law to q-4 on the scattering intensity curve.
3.2.6 The two phase media model
This concept is a very useful tool for the evaluation of the small angle scattering patterns as no geometrical presumptions are necessary to obtain structural information. In the model, the porous aerogel body consists of two phases of different mass densities, which are constant within each phase. It is schematically shown on the figure below:

Chapter VIII Appendices
218
ls
lg
gas
solid
Using the surface of the diffusing interface per unit volume of the aggregate one can estimate the
average solid chord length with the following equation:
vsc
Sl 4= equation VIII-29
and sgc lll += where ls is the solid chord length and lg the gaseous chord length. If one considers that ϕ
is the solid fraction in the material then cs l.l ϕ= and therefore ( ) cg l.l ϕ−= 1 . As a first approximation, lg can be assimilated to the mean pore diameter in the aggregates and ls to the mean size of the primary particles. This mean size can be approached differently when one supposes a monodisperse particle distribution by using the following equation for the mean particle radius size:
vsS.r ϕ3= equation VIII-30
33..33 MMeerrccuurryy ppyyccnnoommeettrryy
The density of a sample is defined by the ratio of the mass of the sample to the external volume. This volume can be measured by a pycnometer containing mercury. Mercury is being used as it doesn’t penetrate in the pores of the sample.
The experimental procedure is as follows :
• The total mass (mt) of the pycnometer filled with mercury up to the reference level is measured.
• The sample of mass mc is then introduced in the empty pycnometer
• The pycnometer is then filled with mercury up to the same reference level as previously done. The mass m of the system is then measured.
Figure VIII-7 Diagram of the pycnometer
Reference level for mercury
mercury
sample
Upper part
Lower part

Chapter VIII Appendices
219
The mass difference between the mass of the pycnometer with the sample and the mass of the sample corresponds to the total mass of the mercury in the pycnometer when the sample is present. Subtracting this mass to the total mass of mercury when no sample is present represents the mass taken by the volume of the sample, if the volume of the sample was occupied by mercury.
Considering that the density of mercury is known (13,53 g.cm-3), and dividing this mass difference by the density of mercury, the volume taken by the sample is calculated. Dividing the mass of the sample by the volume of the sample measured thanks to the pycnometer gives the density of the sample.
The volume Vs of the sample is calculated using the following equation :
( )Hg
sts
mmmVρ
−−= equation VIII-31
and hence, for the density s of the sample
( )st
Hgss
mmmm
−−=
ρρ . equation VIII-32
The error on the measurement of the mass is ± 0.5 mg, and the error on the reference level is ± 0.5 mm (which represents the diameter of the capillary), giving an error on the volume of ± 4.10-4 cm3. Considering a sample with a mass greater than 100 mg, the maximum error on the density of the sample is of ± 0.5 %.
In order to avoid experimental errors during the manipulation of mercury, a few cautions should be taken: samples composed of monolithic blocks lower than 1 mm should not be used in order to prevent them to enter the capillary, and to avoid creating dead volume inaccessible to mercury, and verify that no air bubble gets imprisoned in the pycnometer during a measurement.
The value of the density for a few samples having simple geometries has been measured using a vernier calliper, and the values obtained differ by 5%, which is an acceptable value for a density.
33..44 HHeelliiuumm ppyyccnnoommeettrryy
The principal is the same as for the mercury pycnometry, except that helium pycnometry is used to obtain information on the true density of solids. Helium, which can enter even the smallest voids or pores, is used to measure the volume per unit weight of a material, and the final result is referred to as the skeletal density.
The skeleton density, or the structural or solid density, is defined as the mass of a unit volume of the solid skeleton, inaccessible to helium. In this method helium is assumed to enter the smallest pores present, without being adsorbed. Helium is usually used as its small dimensions assure penetration into crevices and pores approaching one Angstrom (Å) in dimension. Its behaviour as an ideal gas is also desirable as the instrument uses the ideal gas equation P.V=n.R.T to measure the volume occupied by the sample.
The skeleton density being the ratio of the mass to the volume occupied by that mass, the contributions to the volume made by pores or internal voids are excluded. The skeleton density is also often termed as the true density.
The bulk density, measured by mercury pycnometry, is defined as the volume occupied by the solid, including the pores and interparticle voids, divided by the solid mass. It is also known as the apparent density and is always less than the skeleton density. On the basis of the skeleton density and the bulk density the total pore volume of a material can be calculated.
Helium pycnometry is a method that provides a rapid and accurate measurement of the true density. Ceramics, metals, slurries, pastes, pigments, plastics, mineral matter, building materials, and other materials can be examined by this method, which has a density resolution of 0.0001 g.cm-3. Helium, under precisely-known pressure, is used to fill small voids within a specimen. The volume change of

Chapter VIII Appendices
220
helium in a constant volume chamber allows the determination of the solid volume. The ratio of sample mass to its true solid volume gives its true density.
About 1.0 g of sample material is needed for this experiment, and sample volumes up to 100 cm3 can be examined and the data collected in minutes through a RS-232 computer interface.
33..55 EElleemmeennttaall aannaallyyssiiss
Elemental analysis is an experiment that determines the amount (typically a weight percent) of an element in a compound. Just as there are many different elements, there are many different experiments for determining elemental composition. The most common type of elemental analysis is for carbon, hydrogen, and nitrogen (CHN analysis). This type of analysis is especially useful for organic compounds (compounds containing carbon-carbon bonds).
The sample to be analysed is weighed accurately to one millionth of a gram inside a small tin capsule. This capsule is introduced to the analyser's furnace (combustion tube), which is at a temperature of 950°C. At this temperature the tin capsule combusts in a high oxygen environment to form tin oxide. This combustion elevates the temperature to well above 1800°C. At this temperature, the sample is vaporised and then undergoes complete combustion, to form CO2, N2, NxOy, H2O and other by-products. Undesirable by products such as halogens, sulphur, phosphorus, etc. are removed by scrubbing chemicals inside the combustion tube.
After combustion, the sample gases flow through a reduction tube which removes any unused oxygen, and converts oxides of nitrogen to N2. These gases are then homogenised at a precise temperature, pressure and volume in the mixing area. A small portion of this mixture, from the sample volume, then flows through a series of thermal conductivity cells (the detector), where the quantity of each gas, CO2, H2O, N2 and He carrier gas, is recorded. From these readings, and the weight of sample used it is possible to calculate %C, %H, %N.
The presence of other elements is determined by other methods which will not be specified here. There is no direct method to determine the amount of oxygen in a sample; this is usually done by subtracting the percent compositions of all other elements from 100%.
Analysis of the elements present in chemical compounds is an essential aspect of chemical characterization in natural products, materials science, organic and inorganic synthesis, pharmaceutical products, etc. The elemental analysis of a compound is particularly useful in determining the empirical formula of the compound. The empirical formula is the formula for a compound that contains the smallest set integer ratios for the elements in the compound that gives the correct elemental composition by mass.
33..66 RRaammaann SSppeeccttrroossccooppyy
Inelastic scattering of light is sometimes called the Raman effect, named after its discoverer, the Indian scientist Sir C.V. Raman, which won the Nobel Prize in Physics in 1930. The Raman effect was accomplished using filtered sunlight as a monochromatic source of photons, a colored filter as a monochromator, and a human eye as detector. The technique became widely used after the invention of the laser.
• Theory
Raman spectroscopy is a spectroscopic technique used in condensed matter physics and chemistry to study vibrational, rotational, and other low-frequency modes in a system. It relies on inelastic scattering, or Raman scattering of monochromatic light, usually from a laser in the visible, near infrared, or near ultraviolet range.
When electromagnetic radiation is scattered by a molecule or by a crystal, one photon of the incident radiation is annihilated and one photon of the scattered radiation is created. The scattering mechanisms can be classified depending on the difference between the energies of the incident and scattered photons:
Chapter VIII Appendices
221
• If the energy of the incident photon is equal to that of the scattered one, the process is called Rayleigh scattering.
• If the energy of the incident photon is different to that of the scattered one, the process is called Raman scattering.
Phonons or other excitations in the system are absorbed or emitted by the laser light, resulting in the energy of the laser photons being shifted up or down. The shift in energy gives information about the phonon modes in the system.
The energy difference between the incident light (Ei) and the Raman scattered light (Es) is equal to the energy involved in changing the molecule's vibrational state, getting the molecule to vibrate, Ev. This energy difference is called the Raman shift.
Ev = Ei - Es equation VIII-33
Several different Raman shifted signals will often be observed, each being associated with different vibrational or rotational motions of molecules in the sample. The particular molecule and its environment will determine what Raman signals will be observed.
Typically, a sample is illuminated with a laser beam. Light from the illuminated spot is collected with a lens and sent through a monochromator. Wavelengths close to the laser line, due to elastic Rayleigh scattering, are filtered out and those in a certain spectral window away from the laser line are dispersed onto a detector.
Spontaneous Raman scattering is typically very weak, and as a result the main difficulty of Raman spectroscopy is separating the weak inelastically scattered light from the intense Rayleigh scattered laser light. Raman spectrometers typically use holographic diffraction gratings and multiple dispersion stages to achieve a high degree of laser rejection. A photon-counting photomultiplier tube (PMT) or, more commonly, a CCD camera is used to detect the Raman scattered light.
The most common light source in Raman spectroscopy is an Ar-ion laser. Resonance Raman spectroscopy requires tuneable radiation and sources are Ar-ion-laser-pumped dye lasers, or high-repetition-rate exciter-laser-pumped pulsed dye lasers. Because Raman scattering is a weak process, a key requirement to obtain Raman spectra is that the spectrometer provide a high rejection of scattered laser light. New methods such as very narrow rejection filters and Fourier-transform techniques are becoming more widespread.
33..77 EElleeccttrroonn mmiiccrroossccooppyy
Two types of electron microscopy have been used to characterise our materials: the secondary electron microscopy (SEM) and the transmission electron microscopy (TEM). The specimen is bombarded with a high energy electron beam and electrons can either be transmitted or back scattered and depending on the mode used, the various specified electrons are captured and a magnified image of the area bombarded by the electrons is collected. Various different radiations emitted from the specimen may be collected, c.f. figure below, using the appropriate detectors and used to obtain structural, chemical and electronic information of the specimen.

Chapter VIII Appendices
222
Figure VIII-8 The radiations emitted by a specimen bombarded by a high energy electron beam
In the secondary electron imaging mode, the secondary electrons have a very low energy and therefore the signal collected is within 5 nm of the surface only. In the case of a small angle between the tangent to the surface and the electron beam, a short interaction distance occurs and a small signal is transmitted that appears pale/dark. In the case of large angles a long interaction lengths occurs and therefore a large signal and a bright spot area is observed.
The back scattered electrons are the high energy electrons. In the back scattered electron imaging mode the electrons from the incident beam are mostly elastically scattered by the nuclei in the specimen.
X-rays can also be emitted by the specimen. The incident electron excites an atom and an inner shell of electrons is knocked out to an outer shell. The atom relaxes and an outer shell of electrons drop in the inner shell. The difference in energy between the outer and inner shell is emitted as an X-Ray. These X-Rays enable two types of analysis: energy dispersive analysis (EDX) or wavelength dispersive analysis (WDX) from which qualitative and quantitative microanalysis can be performed.
The beam of electron can also transmit through the specimen. In this case the beam of electrons is either transmitted, inelastically or elastically scattered by the atoms in the crystal. The inelastically scattered electrons lose their energy and thereby change the wave length of the transmitted beam. In transmission electron microscopy, two different phase contrast mechanisms are possible:
• the phase contrast which is used for details smaller than 1 nm and a resolution better than 0.2 nm • the diffraction contrast which is used for details greater than 1 nm and a resolution better
than 0.3 nm.
Three different modes can be used for the transmission electron microscopy:
1. the bright field imaging mode: the regions of the crystal which are diffracting look dark 2. the lower resolution dark field mode: the diffracted region of the crystal appears bright 3. the high resolution dark field mode: the image is formed with Bragg diffraction beam
from the precipitate. The precipitates diffract strongly and appear bright.
Concerning our carbonaceous materials, the secondary electron microscopy gives a resolution varying from 2 microns down to 500 nm, while the transmission electron microscope and the high resolution transmission electron microscopy can give resolutions down to 10 nm.

Chapter VIII Appendices
223

Chapter IX References
224
IX REFERENCES

Chapter IX References
225
1 Rapport d’Avancement de projet du réseau PACo au titre de la convention de recherche n°01 74 042 entre
l’ADEME et ALPHEA, 2002; 2 Gas Encyclopeadia, Elsevier / Air Liquide, 1976; 3 P. Krawczak : Réservoirs haute pression en composites, in Techniques de l’ingénieur, AM 5 530, May 2002; 4 R. K. Kunz, R.P. Golde and B.R. McQuivey : high pressure conformable hydrogen storage for fuel cell
vehicles, in the 10th annual U.S. Hydrogen meeting, pp. 383-393, 1999; 5 D. Tiller, N. Newhouse and J. Eihusen : Development of an all composite tank for high pressure hydrogen
storage, in proceedings of the 14th World Hydrogen Energy Conference, Montreal 2002; 6 P. Harcouët and J. Demoment : Comment stocker l’hydrogène sûrement et efficacement ?, in Clefs CEA,
n°44, 2000-2001; 7 http://www.dynetek.com 8 http://www.qtww.com/home.shtml 9 A. Haaland –Thiokol Propulsion : High-Pressure Conformable Hydrogen Storage for Fuel Cell Vehicles,
in Proceedings of the 2000 hydrogen Program Review; 10 “Composite Conformable pressure vessel” U.S. Patent No. 6,095,367, Nov. 26, 1996; 11 W.A. Amos : Costs of storing and transporting hydrogen, in Report of the National Renewable Energy
Laboratory for the DOE, contract n°DE-AC36-83CH10093 (1998); 12 S. Kim and B.H. Kang : Thermal design analysis of a liquid nitrogen vessel, in International Journal of
Hydrogen Energy, Vol. 25, pp. 133-141, 2000; 13 K. Pehr, P. Sauermann, O. Traeger and M. Bracha : Liquid Hydrogen for motor vehicles – the world’s
first public LH2 filling station, in International Journal of Hydrogen Energy, Vol. 26, pp. 777-782, 2001; 14 http://www.linde.com 15 T. Sakai, M. Matsuoka and C. Iwakura, in K.A. Gschneider Jr. and L. Eyring, Ed., Handbook on the physics
and chemistry of Rare Earths, Vol.21, 99. 133-178. Elsevier Science B.V. 1995; 16 W. Zhang, S. Srinivasan and H.J. Plohen in Journal of the Electrochemical Society, Vol. 143, pp. 4039-4046,
1996; 17 Mischmetal, a natural mixture of rare earth metals such as Ce, La, Nd, Pr or Sm 18 G. Sandrock : A panoramic overview of hydrogen storage alloys from a gas reaction point of view in
Journal of Alloys and compounds, Vol. 293-295, pp. 877-888, 1999; 19 http://hydpark.ca.sandia.gov, Metal hydride Internet database, made by DOE, International Energy Agency
(IEA), and Sandia National Laboratories; 20 K. Jang, D. Kim and J. Lee : A Review on the Development of AB2-Type Zr-Based Laves Phase
Hydrogen Storage Alloys for NiMH Rechargeable Batteries in the Korea Advanced Institute of Science and Technology, in Journal of alloys and Compounds, Vol. 293-295, pp. 583-592, 1999;
21 http://www.millenniumcell.com/solutions/index.html 22 N. Kuriyama, J. Chen et al. : Hydrogen storage property of Li-Al compounds, inProceedings of the 14th
world hydrogen energy conference, Montreal 2002; 23 A. Züttel, P. Wenger et al. : Hydrogen desorption from lithiumtetrahydroboride, in Proceedings of the
14th world hydrogen energy conference, Montreal 2002; 24 B. Bogdanovic and M. Schwickardi, Ti-doped alkali metal aluminium hydrides as potential novel
reversible hydrogen storage materials, in Journal of Alloys and Compounds, Vol. 253, pp. 1-9, 1997; 25 G. Thomas : Complex hydrides for hydrogen storage, in Hydrogen Storage Workshop, Argonne, 2002; 26 K. Gross and E. Majzoub : New reversible complex hydrides for practical hydrogen storage, in
Proceedings of the 14th world hydrogen energy conference, Montreal, 2002; 27 http://www.bza.org/zeolites.html 28 C. Catlow : Zeolites: Structure, Synthesis and Properties – An Introduction. in Modeling of Structure and
Reactivity in Zeolites, Ed. Catlow, Academic Press, UK 1992; 29 S. Ernst, M. Fritz and J. Weitkamp : Zeolites as Media for Hydrogen Storage, in International Journal of
Hydrogen Eneryg, Vol. 20, No. 12, pp. 967-970, 1995; 30 G. Eklund, O. von Krusenstierna : Storage and Transportation of Merchant Hydrogen, in International
Journal of Hydrogen Energy, Vol. 8, pp. 463-470, 1983; 31 S.M. Aceves, G.D. Berry, G.D. Rambach : Insulated pressure vessels for hydrogen storage on vehicles, in
International Journal of Hydrogen Energy, Vol. 23, n°7, pp. 583-591, 1998; 32 S.J. Gregg and K.S.W. Sing, in Adsorption, Surface Area and Porosity, Second edition, 1976; 33 Chapter 10 in Sciences of Carbon Materials by Harry Marsh and F. Rodriguez-Reinoso, Publicaciones
Universidad de Alicante, 2000; 34 J.C.Anderson, K.D. Leaver, R.D. Rawlings and J.M. Alexander in Materials Science, Chapman & Hall, 1990; 35 A.J. Kidnay, M.J. Hiza in Advanced Cryogenic Engineering, Vol. 12, pp. 730, 1967;
Chapter IX References
226
36 F.P. Bundy : Pressure-Temperature phase diagram of elemental carbon, in Physica A, Vol. 156, pp. 169-
178, 1989; 37 Chapter 1 in Sciences of Carbon Materials by Harry Marsh and F. Rodriguez-Reinoso, Publicaciones
Universidad de Alicante, 2000; 38 J-B. Donnet, R.C. Bansal and M-J. Wang, in Carbon Black : Science and Technology, Second Edition,
revised and Expanded, ed. Marcel Dekker, 1993; 39 N.M. Rodriguez : A review of catalytically grown carbon nanofibers, in Journal of Materials Research,
Vol. 8, Iss. 12, pp. 3233-3250, 1993; 40 A. Chambers, C. Park, R. Terry, K. Baker and N.M. Rodriguez: Hydrogen Storage in Graphite Nanofibers,
in the Journal of Physical Chemistry B, Vol. 102, No. 22, 1998; 41 http://itri.loyola.edu/nano/us_r_n_d/09_03.htm; 42 R.T.K. Baker : Synthesis, properties and applications of graphite nanofibers, January 1998; 43 R.T. Yang and J.P. Chen : Mechanism of carbon filament growth on metal catalysts, Journal of Catalysis,
Vol. 115, pp. 52-64, 1989; 44 M.S. Kim, N.M. Rodriguez and R.T.K. Baker : The role of interfacial phenomena in the structure of
carbon deposits, in Journal of Catalysis, Vol. 134, pp. 253-268, 1992; 45 N.M. Rodriguez, A. Chambers and T.K. Baker : Catalytic engineering of carbon nanostructures, in
Langmuir, Vol. 11, pp. 3862-3866, 1995; 46 N.M. Rodriguez, M.S. Kim and R.T.K. Baker : Deactivation of Copper-Nickel catalysts due to changes in
surface composition, in Journal of catalysis, Vol. 140, pp. 16-29, 1993; 47 M.S. Dresselhaus, G. Dresselhaus and P.C. Eklund, in Science of Fullerenes and Carbon Nanotubes,
Academic Press, 1996; 48 P.J.F. Harris : Carbon Nanotubes and Related Structures, Cambridge University Press, 1999; 49 C. Journet, P. Bernier et al. : Large-scale production of single-walled carbon nanotubes by the electric-
arc technique, in Nature, Vol. 388, pp. 756-758, 21 August 1997; 50 C. Liu et al. : Semi-continuous synthesis of single-walled carbon nanotubes by a hydrogen arc discharge
method, in Carbon, Vol. 37, pp. 1865-1868, 1999; 51 D. Laplaze et al : Carbon nanotubes : the solar approach, in Carbon, Vol. 36, pp. 685-688, 1998 ; 52 D. Laplaze, L. Alvarez, T. Guillard, J.M. Badie and G. Flamant : Carbon nanotubes : dynamics of
synthesis processes, in Carbon, Vol. 40, pp. 1621-1634, 2002; 53 Y. Saïto : Nanoparticles and filled nanocapsules, in Carbon, Vol. 33, pp.979-988,1995; 54 H. Gorbunov, C. Lenski and A. Ding : Solid-liquid-solid growth mechanism of SWNT, in Carbon, Vol.40,
pp. 113-118, 2002; 55 H. Kanzow and A. Ding : Formation mechanism of SWNT on liquid-metal particles, in Physical Review,
Vol.B60, 1999; 56 V.D. Blank and I.G. Gorlova : The structure of nanotubes fabricated by carbon evaporation at high gas
pressure, in Carbon, Vol. 38, pp.1217-1240, 2000; 57 Merci à Maryline Moreno pour le support bibliographique. 58 D. Nishide, H. Kataura an S. Suzuki : High-yield production of SWNT in nitrogen gas, in Chemical
Physics Letters, Vol. 372, pp. 45-50, 2003; 59 C. Journet, La production de Nanotubes de Carbone, Thèse de l’Université de Montpellier II, 1998; 60 W.K. Maser, E. Munoz : Study of parameters important for the growth of SWNTs, in Optical Materials,
Vol. 17, pp. 331-334, 2001; 61 O. Smiljanic and B.L. Stansfield : Gas-phase synthesis of SWNT by an atmospheric pressure plasma jet,
in Chemcial Physics Letters, Vol. 356, pp. 189-193, 2002; 62 S. Hynek, W. Fuller and J. Bentley : Hydrogen Storage by Carbon Sorption, in International Journal of
Hydrogen Energy, Vol.22, No.6, pp.601-610, 1996; 63 PhD work Ingrid Stepanek : ‘Contribution à l’étude du stockage de l’hydrogène dans les nanotubes de
carbone’, 29 June 2001, Université de Montpellier II; 64 A.C. Dillon, M.J. Heben et al. : Carbon Nanotube Materials for hydrogen storage, in the Proceedings of
the 2001 DOE Hydrogen program review; 65 A.C. Dillon, M.J. Heben et al. : Carbon nanotube materials for hydrogen storage, in Proceedings of the
U.S. DOE Hydrogen Program Review, Coral Gables, FL, p. 521, 1995 and Proceedings of the Hydrogen program review from 1998-2001;
66 A.C. Dillon, M.J. Heben et al. : Storage of hydrogen in single-walled carbon nanotubes, in Nature, Vol. 386, pp. 377-379, 1997;
67 N. Mommer, M. Hirscher, F. Cuevas and H. Kronmüller : Influence of the microstructure on the desorption kinetics of single- and multiphase LaNiFe alloys, in Journal of Alloys and Compounds, Vol. 266, pp. 255-259, 1998;

Chapter IX References
227
68 A. Züttel, P. Sudan, Ph. Mauron, T. Kiyobayashi, Ch. Emmenegger, L. Schlapbach : Hydrogen storage in
carbon nanostructures, in International Journal of Hydrogen Energy, Vol. 27, pp. 203-212, 2002; 69 A. Züttel, Ch. Nützenadel, P. Sudan, Ph. Mauron, Ch. Emmenegger, S. Rentsch, L. Schlapbach, A.
Weidenkaff, T. Kiyobayashi: Hydrogen sorption by carbon nanotubes and other carbon nanostructures, in Journal of Alloys and Compounds, Vol. 330-332, pp. 676-682, 2002;
70 C. Nützenadel, A. Züttel, D. Chartouni and L. Schlapbach : Electrochemical Storage of hydrogen in Nanotube Materials, in Electrochemical and Solid State Letters, Vol 2, Iss. 1, pp.30-32, 1999;
71 H.S. Youn, H. Ryu et al. : Purity enhancement and electrochemical hydrogen storage property of carbon nanofibers at low temperature, in International Journal of Hydrogen Energy, Vol. 27, pp. 937-940, 2002;
72 N. Rajalakshmi, K.S. Dhathathreyan et al. : Electrochemical investigatioin of single-walled carbon nanotubes for hydrogen storage, in Electrochimica Acta, Vol. 45, pp. 4511-4515, 2000;
73 S.M. Lee, K.S. Park et al. : Hydrogen adsorption and storage in carbon nanotubes, in Synthetic Metals, Vol. 113, pp. 209-216, 2000;
74 K. Jurewicz, E. Frackowiak, F. Béguin : Electrochemical storage of hydrogen in activated carbons, in Fuel Processing Technology, Vol. 77-78, pp. 415-421, 2002;
75 E. McRae : Determining hydrogen uptake in carbonaceous materials : problems, pitfalls and protocols, in lecture notes of the one-day workshop « Hydrogen Storage in Carbon Nanotubes : state of the art », October 2002;
76 R. Chahine and T.K. Bose : Low Pressure adsorption storage of Hydrogen, in International Journal of Hydrogen Energy, Vol. 19, No.2, pp.161-164, 1993;
77 M.A. de la Casa-Lillo, F. Lamari-Darkrim et al. : Hydrogen Storage in activated carbons and activated carbon fibers, in Journal of Physical Chemistry B, Vol. 106, pp. 10930-10934, 2002;
78 H. Atsumi and K. Tauchi : Hydrogen absorption and transport in graphite materials, in Journal of Alloys and Compounds, Vol. 356-357, pp. 705-709, 2003;
79 L. Zhou, Y. Zhou and Y. Sun : A comparative study of hydrogen adsorption on superactivated carbon versus carbon nanotubes, in International Journal of hydrogen Energy, Vol. 29, pp. 475-479, 2004;
80 L. Zhou, Y. Zhou and Y. Sun : Enhanced storage of hydrogen at the temperature of liquid nitrogen, in International Journal of hydrogen Energy, Vol. 29, pp. 319-322, 2004;
81 Y. Zhou and L. Zhou : Experimental study on high pressure adsorption of hydrogen on activated carbon, in Science in China (Series B), Vol. 39, n°. 6, pp. 598-607, 1996;
82 R. Chahine and T.K. Bose : Characterisation and optimisation of adsorbents for hydrogen storage, in Hydrogen Energy Progress XI, Proceedings of the 11th World Hydrogen Energy Conference, Stuttgart 1996;
83 K.A.G. Amankwah, J.S. Noh and J.A. Schwarz : Hydrogen storage on superactivated carbon at refrigeration temperatures, in International Journal of Hydrogen Energy, Vol. 14, n°. 7, pp. 437-447, 1989;
84 A.M. Rubel and J.M. Stencel : CH4 storage on compressed carbons, in Fuel, Vol. 79, pp. 1095-1100, 2000; 85 R. Ströbel, L. Jörissen et al. : Hydrogen adsorption on carbon materials, in Journal of Power Sources, Vol.
84, pp. 221-224, 1999; 86 M. Rzepka, P. Lamp and M.A. de la Casa-Lillo : Physisorption of hydrogen on microporous carbon and
carbon nanotubes, in Journal of Physical Chemistry B, Vol. 102, pp. 10894-10898, 1998; 87 Y. Ye, C.C. Ahn, J. Liu, R.E. Smalley et al. : Hydrogen adsorption and cohesive energy of single-walled
carbon nanotubes, in Applied Physics Letters, Vol. 74, n°. 16, pp. 2307-2309, 1999; 88 F.E. Pinkerton, B.G. Wicke et al. : Thermogravimetric measurement of hydrogne absorption in alkali-
modified carbon materials, in Journal of Physical Chemistry B, Vol. 104, pp. 9460-9467, 2000; 89 R.T. Yang : Hydrogen storage by alkali-doped carbon nanotubes – revisited, in Carbon, Vol. 38, pp. 623-
626, 2000; 90 K. Awasthi, R. Kamalakaran, A.K. Singh and O.N. Srivastava : Ball-milled carbon and hydrogen storage,
in International Journal of Hydrogen Energy, Vol. 27, pp. 425-432, 2002; 91 Y. Chen, J.F. Gerald, L.T. Chadderton and L. Chaffron : Nanoporous carbon produced by ball milling, in
Applied Physcis Letters, Vol. 74, n°. 19, pp. 2782-2784, 1999; 92 D.M. Chen, T. Ichikawa et al. : Unusual hydrogen absorption properties in graphite mechanically milled
under various hydrogen pressures up to 6 MPa, in Journal of Alloys and Compounds, Vol. 354, pp. L5-L9, 2003;
93 T. Fukunaga, K. Nagano et al. : Structural change of graphite subjected to mechanical milling, in Journal of non-crystalline solids, Vol. 232-234, pp. 416-420, 1998;
94 H. Hermann, Th. Schubert, W. Gruner and N. Mattern : Structure and chemical reactivity of ball-milled graphite, in Nanostructured Materials, Vol. 8, n°. 2, pp. 215-229, 1997;
95 H. Imamura, M. Kusuhara et al. : Carbon nanocomposites synthesised by high energy mechanical milling of graphite and magnesium for hydrogen storage, in Acta Materialia, Vol. 51, pp. 6407-6414, 2003;

Chapter IX References
228
96 K. Shinfo, T. Kondo; M. Arakawa and Y. Sakurai : Hydrogen adsorption/desorption properties of
mechanically milled activated carbon, in Journal of Alloys and Compounds, Vol. 359, pp. 267-271, 2003; 97 G. Majer, E. Stanik and S. Orimo : NMR studies of hydrogen motion in nanostructured hydrogen-
graphite systems, in Journal of Alloys and Compounds, Vol. 356-357, pp. 617-621, 2003; 98 A. Chambers, C. Park, R. Terry, K. Baker and N.M. Rodriguez : Hydrogen Storage in Graphite
Nanofibers, in the Journal of Physical Chemistry B, Vol. 102, No. 22, 1998; 99 C.C. Ahn, Y. Ye et al. : Hydrogen desorption and adsorption measurements on graphite nanofibers, in
Applied Physics Letters, Vol. 73, n° 23, pp.3378-3380, 1998; 100 E. Poirier, R. Chahine and T.K. Bose : Hydrogen adsorption in carbon nanostructures, in International
Journal of Hydrogen Energy, Vol. 26, pp. 831-835, 2001; 101 G.G. Tibbetts, G.P. Meisner and C.H. Olk : Hydrogen storage capacity of carbon nanotubesn filaments,
and vapor-grown fibers, in Carbon, Vol. 39, pp. 2291-2301, 2001; 102 Y-Y. Fan, B. Liao et al. : Hydrogen uptake in vapor-grown carbon nanofibers, in Carbon, Vol. 37, pp.
1649-1652, 1999; 103 D. Lupu, A.R. Biris et al. : Hydrogen uptake by carbon nanofibers catalyzed by palladium, in
International Journal of Hydrogen energy, Vol. 29, pp. 97-102, 2004; 104 J.Y. Hwang et al. : Synthesis and hydrogen storage of carbon nanofibers, in Synthetic Metals¸Vol. 126,
pp. 81-85, 2002; 105 B.K. Gupta and O.N. Srivastava : Synthesis and hydrogenation behaviour of graphitic nanofibers, in
International Journal of Hydrogen Energy, Vol. 25, pp. 825-830, 2000; 106 B.K. Gupta and O.N. Srivastava : Further studies on microstructural characterizaiton and
hydrogenation behaviour of graphitic nanofibers, in International Journal of Hydrogen Energy, Vol. 26, pp. 857-862, 2001;
107 M. Muris, N. Dupont-Pavlosky, M. Bienfait and P. Zeppenfeld : Where are the molecules adsorbed on single-walled nanotubes ? in Surface Science, Vol. 492, pp. 67-74, 2001;
108 A. Cao, H. Zhu et al. : Hydrogen storage of dense-aligned carbon nanotubes, in Chemical physics letters, Vol. 342, pp. 510-514, 2001;
109 A. Fujiwara, K. Ishii et al. : Gas adsorption in the inside and outside of singl-walled carbon nanotubes, in Chemical Physics Letters, Vol. 336, pp. 205-211, 2001;
110 A. Kuznetsova, R.E. Smalley et al. : Enhancement of adsorption inside of single walled nanotubes : opening the entry ports, in Chemical Physcis Letters, Vol. 321, pp. 292-296, 2000;
111 M. Hirscher, M. Becher, I. Stepanek et al. : Hydrogen storage in carbon nanostructure, in Journal of Alloys and Compounds, Vol. 330-332, pp. 654-658, 2002;
112 A.C. Dillon, T. Gennett M.J. Heben et al. : Optimization of Single-Wall nanotube synthesis for hydrogen storage, in IEA Task 12 : Metal Hydrides and Carbon for hydrogen storage, 2001;
113 A.C. Dillon, MJ. Heben et al. : Hydrogen storage in carbon single wall nanotubes, in Proceedings of the 2002 U.S. DOE Hydrogen Program review, 2002;
114 S. Yamanaka, M. Fujikane et al. : Hydrogen content and desorption of carbon nano-structures, in Journal of Alloys and compounds, Vol. 366, pp. 264-268, 2004;
115 M. Shiraishi and T. Takenobu et al. : Hydrogen storage in single-walled carbon nanotubes bundles and peapods, in Chemical Physics Letters, Vol. 358, pp. 213-218, 2002;
116 W. Du et al. : Investigation of the pore structure of As-prepared and purified HiPco Single-Walled Carbon Nanotubes by N2/Ar adsorption - Implication for H2 storage, in Nanoletters, Vol. 2, Iss. 4, pp.343-346, 2002;
117 B.P. Tarasov, J.P. Maehlen et al. : Hydrogen sorption properties of arc generated single-wall carbon nanotubes, in Journal of Alloys and Compounds, Vol. 356-357, pp. 510-514, 2003;
118 Y. Ma, Y. Xia, M. Zhao and M. Ying : Hydrogen storage capacity in single-walled carbon nanotubes, in Physical Review B, Vol. 65, pp. 155430-1 to 155430-6, 2002;
119 C. Liu, Y.Y. Fan, M. Liu, H.T. Cong, H.M. Cheng and M.S. Dresselhaus : Hydrogen storae in single-walled carbon nanotubes at toom temperature, in Science, Vol. 286, pp. 1127-1129, 1999;
120 M.R. Smith, B.C. Bockrath, E.W. Bittner et al. : Chemical activation of single-walled carbon nanotubes for hydrogen adsorption, in Journal of Physical Chemistry B, Vol. 107, pp. 3752-3760, 2003;
121 B.K. Pradhan et al. : Large cryogenic storage of hydrogen in carbon nanotubes at low pressures, in Journal of Materials Research, Vol. 17, n°. 9, pp. 2209-2215, 2002;
122 G. Gundiah, A. Govindaraj, N. Rajalakshmi et al. : Hydrogen storage in carbon nanotubes and related materials, in Journal of Materials Chemistry, Vol. 13, pp. 209-213, 2003;
123 M. Hirscher, U. Dettlaff-Weglikowska, I. Stepanek et al. : Hydrogen storage in sonicated carbon materials, in Applied Physcis A, Invited paper, 2001;
124 Y.Ye, G. Rinzler et al. : Hydrogen adsorption and cohesive energy of single-walled carbon nanotubes,

Chapter IX References
229
in Applied Physics Letters, Vol. 74, n° 16, April 1999;
125 X. Li, H. Zhu et al. : Hydrogen uptake by graphitized multi-walled carbon nanotubes under moderate pressure and at room temperature, in Carbon, Vol. 39, pp. 2077-2088, 2001;
126 P. Hou, Q. Yang, H. Cheng et al. : Bulk storage capacity of hydrogen in purified multiwalled carbon nanotubes, in Journal of Physical Chemistry B, Vol. 106, pp. 963-966, 2002;
127 Q. Zheng, A. Gu, X. Lu and W. Lin : Temperature-dependent state of hydrogen molecules within the nanopore of multi-walled carbon nanotubes, in International Journal of Hydrogen Energy, Vol. 29, pp. 481-489, 2004;
128 X. Chen, Y. Zhang et al. : Electrochemical hydrogen storage of carbon nanotubes and carbon nanofibers, in International Journal of Hydrogen Energy, Vol. 29, pp. 743-748, 2004;
129 A.K.M. Fazle Kibria, Y.H. Mo et al. : Electrochemical hydrogen storage behaviors of CVD, AD and LA grown carbon nanotubes in KOH medium, in International Journal of hydrogen energy, Vol. 26, pp. 823-829, 2001;
130 G.P. Dai M. Liu et al. : Electrochemical charge-discharge capacity of purified single-walled carbon nanotubes, in Electrochemical and solid state letters, Vol. 5, n°. 4, pp. E13-E15, 2002;
131 E. Frackowiak and F. Béguin : Electrochemical storage of energy in carbon nanotubes and nanostructured carbons, in Carbon, Vol. 40, pp. 1775-1787, 2002;
132 J.C. Wang, R.W. Murphy, F.C. Chen, R.O. Loutfy, E. Veksler and W. Li : Hydrogen Storage in Fullerenes and in an organic hydride, in Proceedings of the 1998 U.S. DOE Hydrogen Program Review;
133 R.O. Loutfy and E.M. Wexler : Feasibility of Fullerene hydride as a high capacity hydrogen storage material, in the Proceedings of the 2001 DOE Hydrogen Program Review;
134 http://www.fuel-cell-bus-club.com 135 F. Lamari Darkrim, P. Malbrunot and G.P. Tartaglia : Review of hydrogen storage by adsorption in
carbon nanotubes, in International Journal of Hydrogen Energy, Vol. 27, pp. 193-202, 2002; 136 M. Becher, M. Hirscher et al. : Hydrogen Storage in Carbon Nanotubes, in Comptes Rendus Physique,
2003; 137 D.V. Schur, B.P. Tarasov et al. : The prospects for using of carbon nanomaterials as hydrogen storage
systems, in International Journal of Hydrogen Energy, Vol. 27, pp. 1063-1069, 2002; 138 M. Hirscher, M. Becher et al. : Are carbon nanostructures an efficient hydrogen storage medium ?, in
Journal of Alloys and Compounds, Vol. 356-357, pp. 433-437, 2003; 139 A.C. Dillon and M.J. Heben : Hydrogen storage using carbon adsorbents : past, present and futures, in
Applied Physics A, Vol. 72, pp. 133-142, 2001; 140 S. Orimo, A. Züttel, L. Schlapnach et al. : Hydrogen interaction with carbon nanostructures : current
situation and future prospects, in Journal of Alloys and Compounds, Vol. 356-357, pp. 716-719, 2003; 141 Special issue : hydrogen storage in nanoscale carbon and metals, in Applied Physics A, Vol. 72, n°. 2,
February 2001; 142 Hydrogen storage, in MRS Bulletin, Vol. 27, n°. 9, September 2002; 143 U. Bünger and W. Zittel : Hydrogen storage in carbon nanostructures – still a long road from science to
commerce ?, in Applied Physcis A, Vol. 72, pp. 147-151, 2001; 144 http://www.swagelok.com 145 http://www.keller-druck.ch/french/homef/hmprodf.html 146 http://www.julabo.de 147 http://www.emersonprocess.com/brooks/sp210/SP210-contents.html 148 http://www.edwards.boc.com/ 149 Gas Encyclopeadia, Elsevier/Air Liquide, 1976 ; 150 The standard deviation is a quantity calculated to indicate the extent of deviation for a group as a whole
( ( )=
−=n
1i
2xix
n1σ )
151 http://ulysse.glvt-cnrs.fr/lcmtr/index.html 152 http://www.imra-europe.com/rd_activity/ee_fuelcell.html 153 J. Fricke, ed., Aerogels (Springer, New York, 1986); 154 R.W. Pekala, ‘Low density, resorcinol-formaldehyde aerogels’, US patent #4,873,218 (10 October 1989);
US patent #4,997,804 (issued 5 March 1991); 155 R. W. Pekala et F. M. Kong : A synthetic route to organic aerogels – mechanism, structure and
properties, in Revue de Physique appliquée, Colloque C4, Supplément au n°4, Tome 24, 1989; 156 R.W. Pekala : Organic aerogels from the polycondensation of resorcinol with formaldehyde, in Journal
of Materials Science, Vol.24, pp. 3221-3227, 1989 ; 157 http://www.ep2.physik.uni-wuerzburg.de/ag_fricke/graphic/start_js.htm 158 R.W. Pekala, C.T. Alviso, X. Lu, J. Gross and J. Fricke : New organic aerogels based upon a phenolic-

Chapter IX References
230
furfural reaction in Journal of non-crystalline solids, Vol. 188, pp.34-40, 1995;
159 R.W. Pekala, C.T. Alviso and J.D. Lemay : in Chemical Processing of advanced materials, ed. L.L. Hench and J.K West, John Wiley and sons, Inc., New York, 1992 ;
160 C. Lin and J.A. Ritter : Effect of synthesis Ph on the structure of carbon xerogels, in Carbon, Vol. 35, n° 9, pp.1271-1278, 1997;
161 R. W. Pekala et F. M. Kong : Resorcinol-formaldehyde aerogels and their carbonized derivative, in Polymer preprints, Vol. 30, Iss. 1,pp. 221-223, 1989;
162 C. Lin and J.A. Ritter : Carbonization and activation of sol-gel derived carbon xerogels, in Carbon, Vol. 38, pp.849-861, 2000 ;
163 T. Yamamoto, T. Nishimura, T. Suzuki and H. Tamon : Effect of drying conditions on mesoporosity of carbon precursors prepared by sol-gel polycondensation and freeze drying, in Carbon, Vol. 39, pp. 2374-2376, 2001;
164 R.W. Pekala and C.T. Alviso : Carbon Aerogels and Xerogels, in Materials Research Society Symposium Proceedings, Vol. 270, 1992; National Laboratory, 1992;
165 N. Job, R. Pirard, J. Marien and J-P. Pirard : Porous carbon xerogels with texture tailored by pH control during sol–gel process, in Carbon, Vol. 42, pp. 619-628, 2004 ; 166 O. Barbieri, F. Ehrburger-Dolle et al. : Small-angle X-Ray scattering of a new series of organic aerogels,
in Journal of non-crystalline solids, Vol. 285, Iss. 1-3, pp. 109-115, 2001; 167 S. Berthon O. Barbieri F. Ehrburger-Dolle et al. : DLS and SAXS investigations of organic gels and
aerogels, in Journal of non-crystalline solids, Vol. 285, Iss. 1-3, pp. 154-161, 2001; 168 C. Liang, G. Sha and S. Guo : Resorcinol-formaldehyd aerogels prepared by supercritical acetone
drying, in Journal of non-crystalline solids, Vol. 271, pp.167-170, 2000; 169 J. Kuhn, R. Brandt, H. Mehling, R. Petricevic and J. Fricke : In situ observation of the pyrolysis process
of carbon aerogels, in Jouranl of non-crystalline solids, Vol. 225, pp. 58-63, 1998; 170 S. Gavalda, K. Kaneko, K.T. Thomson and K.E. Gubbins : Molecular modeling of carbon aerogels, in
Colloids and Surfaces A, Vol. 187-188, pp. 531-538, 2001; 171 M.S. Dresselhaus, G. Dresselhaus and P.C. Eklund : Science of Fullerenes and Carbon Nanotubes,
Academic Press, 1996; 172 V. Bock, A. Emmerling, R. Saliger and J. Fricke : Structural investigation of resorcinol formaldehyde
and carbon aerogels using SAXS and BET, in Journal of porous Materials, Vol.4, pp.287-294, 1997; 173 S.S. Hulsey, C.T. Alviso, F.M. Kong and R.W. Pekala : The effect of Pyrolysis Temperature and
Formulation on Pore Size Distribution and Surface Area of Carbon Aerogels, in Preprint of Lawrence Livermore National Laboratory, 1992;
174 G.A.M. Reynolds, A.W.P. Fung, Z.H. Wanf, M.S. Dresselhaus and R.W. Pekala : The effects of external conditions on the internal structure of carbon aerogels, in Journal of non-crystalline solids, Vol.188, pp. 27-33, 1995;
175 R.W. Pekala, P.R. Coronado and D.F. Calef : Synthesis, characterisation and modeling of hydrogen storage in Carbon aerogels, in The Proceedings of the Hydrogen Program Review 1995;
176 R. Saliger, G. Reichenauer and J. Fricke : Evolution of microporosity upon CO2 activation of carbon aerogels, in Studies in Surface Science and Catalysis, Vol. 128, pp.381-390, 2000;
177 G. Reichenauer, A. Emmerling, J. Fricke and R.W. Pekala : Microporosity in carbon aerogels, in Journal of non-crystalline solids, Vol. 225, pp.210-215, 1998;
178 D.W. Schaefer, R. Pekala and G. Beaucage : Origin of porosity in resorcinol-formaldehyde aerogels, in Journal of non-crystalline solids, Vol. 186, pp.159-167, 1995;
179 Y. Hanzawa, K. Kaneko, R.W. Pekala and M.S. Dresselhaus : Activated Carbon Aerogels, in Langmuir, Vol. 12, N°26, pp. 6167-6169, December 25, 1996;
180 Y. Hanzawa, H. Hatori, N. Yoshizawa and Y. Yamada : Structural changes in carbon aerogels with high temperature treatment, in Carbon, Vol. 40, pp. 575-581, 2002 ;
181 V. Bock, A. Emmerling and J. Fricke : Influence of monomer and catalyst concentration on RF and carbon aerogel structure, in Journal of non-crystalline Solids, Vol. 225, pp. 69-73, 1998;
182 V. Bock, O. Nilsson, J. Blumm and J. Fricke : Thermal properties of carbon aerogels, in Journal of non-crystalline solids, Vol. 185, pp. 233-239, 1995;
183 X. Lu, R. Caps, J. Fricke, C.T. Alviso and R.W. Pekala : Correlation between structure and thermal conductivity of organic aerogels, in Journal of non-crystalline solids, Vol. 188,pp.226-234,1995;
184 J. Marie, S. Berthon-Fabry, P. Achard and M. Chatelet et al. : Highly dispersed platinum on carbon aerogels as electrocatalysts for PEM fuel cell electrode: comparison of different synthesis paths, oral presentation at the 7th International Symposium on Aerogel, Alexandria, Virginia, USA, November 2-5 2003,
185 http://crmd.cnrs-orleans.fr/ 186 http://www.inrs-ener.uquebec.ca/matener.html

Chapter IX References
231
187 http://www-cms.llnl.gov/ 188 B. Ravary, L. Fulcheri, G. Flamant, F. Fabry : Analysis of a 3-phase AC plasma process, in Journal of
high temperature material processes, Vol. 2, pp. 245-260, 1998; 189 L. Fulcheri, Y. Schwob and G. Flamant : Comparison between new carbon nanostructures produced by
plasma with industrial carbon black grades, in J Phys III, France 1997, Vol. 7 pp. 491-503; 190 L. Fulcheri, N. Probst, G. Flamant, F. Fabry, E. Grivei and X. Bourrat : Plasma processing: a step towards
the production of new grades of carbon black, in Carbon, Vol.40, pp.169-176, 2002; 191 F. Fabry, G. Flamant and L. Fulcheri : Carbon black processing by thermal plasma. Analysisof the
particle formation mechanism, in Chemical Engineering Science, Vol. 56, pp. 2123-2132, 2001; 192 B. Ravary : Modélisation thermique et hydrodynamique d'un réacteur plasma triphasé. Contribution
à la mise au point d'un procédé industriel pour la fabrication de noir de carbone, Thèse de l’Ecole des Mines de Paris, 1998;
193 I. Dème : Contribution à la modélisation de l'ecoulement dans un réacteur plasma pour la fabrication de noirs de carbone. Influence du rayonnement des particules de carbone, Thèse de l’Ecole des Mines de Paris, 2002;.
194 L. Fulcheri, Y. Schwob, F. Fabry, G. Flamant, L.F.P. Chibante and D. Laplaze : Fullerene production in a 3-phase AC plasma process, in Carbon, Vol. 38, pp. 797-803, 2000;
195 M. Kanowski et al. : The structure of fullerene black and the incorporation of C60 investigated by 13C NMR, in Carbon, Vol. 35, n°. 5, pp. 685-695, 1997;
196 G.A.M. Reynolds, A.W.P. Fung et al. : The effects of external conditions on the internal structure of carbon aerogels, in Journal of non-crystalline solids, Vol. 188, pp. 27-33, 1995;
197 Institut de Science et de Génie des Matériaux et Procédés, IMP-CNRS UPR 8521, http://www.imp.cnrs.fr 198 Laboratoire de Chimie du Solide Minéral, LCSM-CNRS UMR 7555, http://www.lcsm.uhp-nancy.fr/ 199 S. Berthon-Fabry, D. Langohr, P. Achard, D. Charrier, D. Djurado, F. Ehrburger-Dolle : Anisotropic high
surface area carbon aerogels, in Journal of non-crystalline solids, Vol. 350, pp. 136-144, 2004; 200 Laboratoire des Systèmes Colloïdaux dans les Procédés Industriels, LSCPI,
http://www.ensmp.fr/Fr/CENERG/SCPI/Accueil.htm 201 http://www.esrf.fr 202 T. M. Gruenberger, J. Gonzalez-Aguilar, F. Fabry, L. Fulcheri, E. Grivei, N. Probst, G. Flamant, H. Okuno,
and J-C. Charlier : Production of carbon nanotubes and other nanostructures via continuous 3-phase AC plasma processing, in Fullerenes, Nanotubes, and Carbon Nanostructures, Vol. 12, n° 3, pp. 571-581, 2004;
203 T. M. Gruenberger, J. Gonzalez-Aguilar, L. Fulcheri, F. Fabry, E. Grivei, N. Probst, G. Flamant, and J-C. Charlier : Continuous production of fullerenes and other carbon nanomaterials on a semi-industrial scale using plasma technology, in Structural and Electronic Properties of Molecular Nanostructures, Kuzmany et al. (eds.), AIP Conference Proceedings, 2002 ;
204 F. Fabry, T. M. Gruenberger, J. Gonzalez-Aguilar, H. Okuno, E. Grivei, N. Probst, L. Fulcheri, G. Flamant, and J-C. Charlier : Continuous mass production of carbon nanotubes by 3-phase AC plasma processing, Nanotech 2004, Boston;
205 L. Fulcheri, G. Flamant, F. Fabry, T. M. Gruenberger, J. Gonzalez-Aguilar, N. Probst, E. Grivei, J.-C. Charlier, and H. Okuno : Production of carbon nanostructures ranging from carbon black over fullerenes to nanotubes by thermal plasma, in 16th International Symposium on Plasma Chemistry (ISPC 16), Taormina, Italy, 2003;
206 X. Bourrat : Contribution à l’étude de la croissance du carbone en phase vapeur, Thèse de Doctorat d’Etat de l’Université de Pau, 1987;
207 K. Shakourzadeh Bolouri : Conception d’un procédé de fabrication du noir d’acétylène dans un réacteur à plasma, Thèse de Doctorat de l’Université Paris 6, 1984;
208 K.S. Bolouri and J. Amouroux : Analyse des processus de formation de noir de carbone : une corrélation entre le mécanisme de formation du noir de carbone et les calculs des équilibres chimiques hydrogène-carbon, in Bulletin de la société chimique de France, n° 5-6, 1983;
209 J. Abrahamson : Saturated platelets are new intermediates in hydrocarbon pyrolysis and carbon formation, in Nature, Vol. 266, pp.323-327, 1997;
210 J.L. Hudson and J. Heicklen : Theory of carbon formation in vapor-phase pyrolysis-I. Constant concentration of active species, in Carbon, Vol. 6, pp. 405-418, 1968;
211 W. Zhu, D. Miser et al. :Characterisation of combustion fullerene soot, C60, and mixed fullerene, in Carbon, Vol. 42, pp. 1463-1471, 2004;
212 R.E. Haufler, L.P.F. Chibante, R.E. Smalley et al. : Carbon arc generation of C60, in Materials Research Society Symposium Proceedings, Vol. 206, pp. 627-637, 1991;
213 D. Ugarte : High-Temperature behaviour of « fullerene black », in Carbon, Vol.32, n°. 7, pp. 1245-1248,
Chapter IX References
232
1994;
214 D. Ugarte : Onion like graphitic particles, in Carbon, Vol. 33, n°. 7, pp. 989-993, 1993; 215 H. Okuno, E. Grivei, F. Fabry, T. M. Gruenberger, J. Gonzalez-Aguilar, A. Palnichenko, L. Fulcheri, N.
Probst and J-C Charlier : Synthesis of carbon nanotubes and nano-necklaces by thermal plasma process, in Carbon, Vol. 42, pp. 2543-2549, 2004;
216 J. Chen, Y. Li et al. : Formation of bamboo-shaped carbon filaments and dependence of their morphology on catalyst composition and reactions conditions, in Carbon, Vol. 39, pp. 1467-1475, 2001;
217 H. Kajiura, H. Huang et al. : High-purity fibrous carbon deposit on the anode surface in hydrogen DC arc-discharge, in Carbon, Vol. 40, pp. 2423-2428, 2002;
218 B. Gupta and O.N. Srivastava : Further studies on microsctructural characterisation and hydrogenation behaviour of graphitic nanofibres, in International Journal of Hydrogen Eneergy, Vol. 26, Iss. 8, pp. 857-862, 2001
219 F. Rouquerol, J. Rouquerol and K. Sing : Adsorption by powders and porous solids, Academic Press 1999;
220 V. Bock, A. Emmerling, R. Saliger and J. Fricke : Structural investigation of Resorcinol Formaldehyde and Carbon Aerogels Using SAXS and BET, in Journal of Porous Materials, Vol. 4, pp. 287-294, 1997;
221 Ph. Dieudonné, P. Delord and J. Phalippou : Small angle X-Ray scattering of aerogel densification, in Journal of Non-Crystalline solids, Vol. 225, pp.220-225, 1998;
222 G. Reichenauer, A. Emmerling, J. Fricke and R.W. Pekala : Micoporosity in carbon aerogels, in Journal of Non-crystlline solids, Vol. 225, pp.210-214, 1998;
223 D. Espinat : Application des techniques de diffusion de la lumière, des ryons X et des neutrons à l’étude des systèmes colloïdaux, in Revue de l’Institut français du pétrole, Vol.45, n° 6, Nov.-Dec 1990;
224 A. Emmerling and J. Fricke : Small angle scattering and the structure of aerogels, in Journal of non-crystalline solids, Vol.145, pp. 113-120, 1992;
225 R.W. Pekala and C.T. Alviso : Carbon Aerogels and Xerogels, in Materials Research Society Symposium Proceedings, Vol. 270, 1992; National Laboratory, 1992;