a study on determinants of shareholders’ return with special reference to bse 500 companies
TRANSCRIPT

7/23/2019 A study on determinants of Shareholders’ Return with special reference to BSE 500 companies
http://slidepdf.com/reader/full/a-study-on-determinants-of-shareholders-return-with-special-reference-to 1/73
PROJECT REPORT
“A study on determinants of Shareholders’ Return with
special reference to BSE 500 companies”
By
Rachana Sharma
Enrolment No- 121826974
Course - MS-100
Under the Guidance of
Prof. Hussain Ahmed
Post Graduate Diploma in Finance& Control
(St Xavier’s College, Ranchi)
INDIRA GANDHI NATIONAL OPEN UNIVERSITY
NEW DELHI

7/23/2019 A study on determinants of Shareholders’ Return with special reference to BSE 500 companies
http://slidepdf.com/reader/full/a-study-on-determinants-of-shareholders-return-with-special-reference-to 2/73
TABLE OF CONTENTS
CHAPTER CONTENTS PAGE NO.
Chapter - 1 Introduction to the study Definition and importance of Shareholders 2- 4
Computation of Shareholders’ Return 4-5
Det erminants of Shareholders’ Ret urn 5-6
Rationale of the topic chosen for the study 7
Chapter - 2 Research Methodology
Statement of the research problem 9
Objectives of the study 9-10
Scope of the study 10-11
Research Design 11
Nature and Source of data collected 11 Sample & Sampling Techniques 11-12
Data Handling Tools & Techniques 12-13
Limitations of the study 13
Chapter - 3 Relationship between Accounting Performance
Variables and Shareholders’ Return
Theoretical Background 15-26
Literature Review 17-26
Research Gap 27
Chapter - 4 Data Analysis & Discussion
Descriptive Statistics 29-36 Trend Analysis 37-43
Correlation 44-48
Regression Analysis 49-56
Chapter - 5 Findings and Inferences
Major Findings 58-62
Chapter - 6 Conclusion and Direction for Further Research
Conclusion 64
Direction for Further Research 64-65
Bibliography 65-69
7/23/2019 A study on determinants of Shareholders’ Return with special reference to BSE 500 companies
http://slidepdf.com/reader/full/a-study-on-determinants-of-shareholders-return-with-special-reference-to 3/73
List of Tables
Table 4.1. Descriptive Statistics of Shareholders’ Return…………………………………………….…….30
Table 4.2. Descriptive Statistics of Overall Financial Performance Ratio……………………………31
Table 4.3. Descriptive Statistics of Profitability Ratio……………………………………………….……….32
Table 4.4. Descriptive Statistics of Investment Utilization Ratio……………………………….……….33
Table 4.5. Descriptive Statistics of Dividend Ratio…………………………………………………….……….34
Table 4.6. Descriptive Statistics of Financial Condition Ratio………………………………………..…..35
Table 4.7. Descriptive Statistics of Working Capital Ratio………………………………………………….36
Table 4.8. Trend Analysis of Shareholders’ Return……………………………………………………..…….37
Table 4.9. Trend Analysis of Overall Performance Measures……………………………………..…….38
Table 4.10. Trend Analysis of Profitability Ratio………………………………………………………..……..39
Table 4.11. Trend Analysis of Investment Utilization Ratio……………………………………………….40
Table 4.12. Trend Analysis of Dividend Ratio……………………………………………………………..…….41
Table 4.13. Trend Analysis of Financial Condition Ratio…………………………………………..……….41
Table 4.14. Trend Analysis of Working Capital Ratio…………………………………………………..……..43
Table 4.15. Correlation between Shareholders’ Return and Overall Performance Ratio….…44
Table 4.16. Correlation between Shareholders’ Return and Profitability Ratio…………………..45
Table 4.17. Correlation between Shareholders’ Return and Investment Utilization Ratio…..46
Table 4.18. Correlation between Shareholders’ Return and Dividend Ratio………………………..46
Table 4.19. Correlation between Shareholders’ Return and Financial Condition Ratio………..47
Table 4.20. Correlation between Shareholders’ Return and Working Capital Ratio……………..48
Table 4.21. Regression between Shareholders’ return and Overall Performance Ratio……….50
Table 4.22. Regression between Shareholders’ return and Profitability Ratio……………..………51
Table 4.23. Regression between Shareholders’ return and Investment Utilization Ratio……..52
Table 4.24. Regression between Shareholders’ return and Dividend Ratio……………..……………53
Table 4.25. Regression between Shareholders’ return and Financial Condition Ratio…………..54
Table 4.26. Regression between Shareholders’ return and Working Capital Ratio………………..55

7/23/2019 A study on determinants of Shareholders’ Return with special reference to BSE 500 companies
http://slidepdf.com/reader/full/a-study-on-determinants-of-shareholders-return-with-special-reference-to 4/73
Table 4.27. Regression Analysis – Excluded Variable…………………………………………………………55-56
List of Charts
Chart 1.1: Determinants of Shareholders Return…………………………………………………………….…….11
Chart 4.1: Descriptive Statistics of Shareholders’ Return……………………………………………………….30
Chart 4.2: Descriptive Statistics of matrix of overall financial performance……………………………31
Chart 4.3: Descriptive Statistics of indicators of Profitability Ratio…………………………………………32
Chart 4.4: Descriptive Statistics of indicators of Investment Utilization Ratio…………………………33
Chart 4.5: Descriptive Statistics of indicators of Dividend Ratio………………………………………………34
Chart 4.6: Descriptive Statistics of indicators of Financial Condition Ratio………………………………35
Chart 4.7: Descriptive Statistics of Working Capital Ratio…………………………………………………..…..36
Chart 4.8: Trend Analysis of Shareholders’ Return……………………………………………………………..…..37
Chart 4.9: Trend Analysis of indicators of overall financial performance…………………………………38
Chart 4.10: Trend Analysis of indicators of Profitability Ratio………………………………………………...40
Chart 4.11: Trend Analysis of indicators of Investment Utilization Ratio…………………………….…..40
Chart 4.12: Trend Analysis of indicators of Dividend Ratio……………………………………………….……..41
Chart 4.13: Trend Analysis of indicators of Financial Condition Ratio……………………………..……….42
Chart 4.14: Trend Analysis of indicators of Working Capital Ratio……………………………………………43
Chart 4.15: Correlation between Shareholders’ Return and Overall Performance Ratio………….44
Chart 4.16: Correlation between Shareholders’ Return and Profitability Ratio ……………………….45
Chart 4.17: Correlation between Shareholders’ Return and Investment Utilization Ratio………..46
Chart 4.18: Correlation between Shareholders’ Return and Dividend Ratio…………………………….47
Chart 4.19: Correlation between Shareholders’ Return and Financial Condition Ratio…………….47
Chart 4.20: Correlation between Shareholders’ Return and Working Capital Ratio ………………..48
Chart 4.21: Regression between Shareholders’ Return and Overall Performance Ratio............50
Chart 4.22: Regression between Shareholders’ Return and Profitability Ratio………………………..51
Chart 4.23: Regression between Shareholders’ Return and Investment Utilization Ratio………..52
Chart 4.24: Regression between Shareholders’ Return and Dividend Ratio….…………………………53
Chart 4.25: Regression between Shareholders’ Return and Financial Condition Ratio……………..55
Chart 4.26: Regression between Shareholders’ Return and Working Capital Ratio………..………..56

7/23/2019 A study on determinants of Shareholders’ Return with special reference to BSE 500 companies
http://slidepdf.com/reader/full/a-study-on-determinants-of-shareholders-return-with-special-reference-to 5/73
Chapter 1: Introduction to the Study

7/23/2019 A study on determinants of Shareholders’ Return with special reference to BSE 500 companies
http://slidepdf.com/reader/full/a-study-on-determinants-of-shareholders-return-with-special-reference-to 6/73
1. Introduction to the Study
This chapter presents the discussion on
- Definition and Importance of Shareholders
-
Roles of shareholders- Shareholders value
- Computation of Shareholders’ return
- Determinants of Shareholders’ return
- Rationale of the topic chosen for the study
DEFINITION AND IMPORTANCE OF SHAREHOLDERS
Shareholders are the owners of companies. A small business concern may have just oneshareholder [i.e owner], the founder, while a public limited company may have thousands
of individual shareholders and institutional shareholders such as mutual fund companies,
insurance companies, pension funds and hedge funds. A shareholder is an individual or an
organization or a company that legally own share(s) of stock in a joint-stock company. By
owning shares of stock, a company’s shareholders collectively own the company and
therefore have the right to cast their votes in meetings conducted to take decisions that
affect how the company is run. This usually means that the shareholders as owners will
push the company’s actions that increase their own financial returns. Shareholders play
an important role in the financing, operations, governance and management of a business
entity.
Financing
One of the primary reasons for a company going public is to raise funds from more number
of investors. In return, the company's founders/promoters give up part of their ownership
to these new investors.
Operations
Shareholders play both direct and indirect roles in a company's operations. They elect the
board of directors who appoint and supervise senior officers, including the chief executive

7/23/2019 A study on determinants of Shareholders’ Return with special reference to BSE 500 companies
http://slidepdf.com/reader/full/a-study-on-determinants-of-shareholders-return-with-special-reference-to 7/73
officer and the chief financial officer. They play an indirect role through trading in the
shares of the company in the stock market.
Governance
Public companies usually have formal corporate governance policies, such as defining the
composition and roles of different board committees, the role of the chairman, codes of
conduct and business ethics. Boards of directors answer to shareholders, not to
management while the management is reporting to the board of directors elected by the
shareholders.
Management
Shareholders usually control a public company through their power to hire and fire the
managers of the firm. In other words the mangers act as the agents of the shareholders in
the pursuit of maximizing the wealth of the shareholders.
Hence the literature on finance states that the objective of a business entity is to maximize
the wealth of its shareholders.
SHAREHOLDERS’ Value
Due to the direct and indirect influence exercised by the shareholders and because of the
company’s dependence on shareholders, many companies aim to accomplish the
shareholder wealth maximization objective and work towards increasing shareholder
value on a consistent basis. Shareholder value refers to a company's value less its debt to
outsiders. Shareholder value can refer to any one of the following
[a] Book Value or Net Worth or Shareholders’ Funds or owners’ Equity : Itis computed by subtracting the accounting value of liabilities from the total amount of
liabilities and shareholder funds. Alternatively, Book value is the sum of Paid in Capital
and Reserves and Surplus [or Retained Earnings] of the company. This is an accounting
value and hence may not reflect the market value of the shareholders’ funds.

7/23/2019 A study on determinants of Shareholders’ Return with special reference to BSE 500 companies
http://slidepdf.com/reader/full/a-study-on-determinants-of-shareholders-return-with-special-reference-to 8/73
[b] Market Capitalization or Market Value of Equity : This is computed by
multiplying the number of outstanding equity shares of a company with its current market
price per share on the date of computation. This is a relatively better measure of the value
of shareholders as it reflects the current market value of the company to its equity
shareholders.
COMPUTATION OF SHAREHOLDERS RETURN
Companies create value for their shareholders when their investment returns are more
than that of the investment costs. Shareholders normally expect a minimum return on
their investments that is equal to the going return on a risk free investment
(e.g., Treasury securities such a 10 year Government Bond) plus a risk premium for
investing in equity shares which is determined by the level of risk associated with a
particular company. According to Aswath Damodaran, the Risk of a company is
determined by its decisions on
[a] Businesses it is doing : Companies that are into sectors that are characterized by lower
variations in profits such as Fast Moving Consumer Goods[FMCG] are perceived to be
having lower risk compared to companies that are operating in sectors that are dealing
with by discretionary products or luxurious products and services such as luxurious hotels.
[b] Operating Leverage: It refers to the proportion of fixed cost to the total cost of a
company. For instance if a company’s Fixed Cost to Total Cost ratio is 80% , it means that
if the business is not doing well it will incur a huge loss compared to another company
which has a Fixed cost to Total Cost ratio of 20%.
[c] Financial Leverage: It indicates the company’s financial structure i.e reflects how the
company funds its investment in assets. Companies have two sources of funds namely
Debt and Equity. This ratio is otherwise known as Debt to Equity ratio. Higher the D/E
ratio, higher is the risk of the company.
The Literature in Finance states that companies deliver returns to their shareholders in
the form of dividends and share price appreciation. If a company is perceived as not
increasing shareholder wealth over time, investors may lose confidence and either decide

7/23/2019 A study on determinants of Shareholders’ Return with special reference to BSE 500 companies
http://slidepdf.com/reader/full/a-study-on-determinants-of-shareholders-return-with-special-reference-to 9/73
to sell its shares or give pressures to the company to take steps to improve its
performance, such as by replacing the CEO or altering the corporate strategy.
Total Shareholder Returns is the sum of increase in share price between the date of buying
the share and the date of selling it [or the date of return computation in case of continuous
holding of the share by the investors; in that case it is not the actual return but the notional
return and the amount of dividend paid to the shareholders by the company. The
shareholder returns is computed using the following formula
Where
TSR = Total Shareholder Return in the investment period/horizon
= share price at beginning of the year/Investment Period,
= share price at end of year/Investment Period,
Dividends = dividends paid over the year/Investment Period
The amount of dividend paid by the company is very small and hence the researchers
consider only the appreciation in the share price of a stock for the computation of
shareholders’ return.
DETERMINANTS OF SHAREHOLDERS’ RETURN
This study aims to measure the impact if any of the Accounting Performance Measures on
the Shareholders’ Return of the BSE 500 firms [Firms in the Bombay Stock Exchange 500
Index, one of the indices of Bombay Stock Exchange in India]. The following diagram
depicts the research model.

7/23/2019 A study on determinants of Shareholders’ Return with special reference to BSE 500 companies
http://slidepdf.com/reader/full/a-study-on-determinants-of-shareholders-return-with-special-reference-to 10/73
Chart 1.1: Determinants of Shareholders Return
RATIONALE OF THE TOPIC CHOSEN FOR THE STUDY
Overall Accounting Performance
Measures
ROIC (Return on Invested Capital)
ROE (Return on Equity)
ROA(Return on Asset)
Profitability Ratios
GPM (Gross Profit Margin)
EBITDA Margin (Earnings BeforeInterest, Taxes, Depreciation and
Amortization]
EBIT Margin (Earnings Before
Interest &Taxes)
PBT Margin (Profit before Tax)
PAT Mar in Profit after Tax
Investment Utilization Measures
Asset TurnoverInvested Capital Turnover
E uit Turnover
Working Capital Ratio
CCC (Cash Conversion
Financial Condition Ratios
CR (Current Ratio)
QR (Quick Ratio)
D/E Ratio (Debt Equity Ratio)
Interest Cover Ratio
DETERMINANTS
OF
SHAREHOLDERS’
RETURN
Dividend Ratio
Dividend Payout Ratio

7/23/2019 A study on determinants of Shareholders’ Return with special reference to BSE 500 companies
http://slidepdf.com/reader/full/a-study-on-determinants-of-shareholders-return-with-special-reference-to 11/73
What determines the return for the equity shareholders is a question that needs to be
answered by every public limited company as the objective of the business revolves
around maximization of the wealth of the shareholders. Financial Statements
communicate the operating, financial condition and cash management abilities of a
firm to its current and potential investors. It is rational for any investor to invest his
funds in a firm that performs well on fundamentals. Hence if a firm’s financial
performance is good, then it should get reflected in terms of an appreciation in its
share price. Therefore, this study aims to examine whether the financial performance
measured in terms of accounting measures such as Overall Performance Ratios,
Profitability Ratios, Investment Utilization Ratios, Working Capital Ratios, Financial
Condition Ratios& Dividend Ratios impact the shareholders’ return of the sample
companies.
Structure of the Report
This Chapter has presented the introduction to the study and the report presents the
remaining research work in the following chapters
Chapter 2 discusses the research methods adopted by the researcher
Chapter 3 presents the relationship between the accounting performance measures
and shareholders’ returns
Chapter 4 discusses on the results of the data analysis and hypothesis testing
Chapter 5 provides the major findings and inferences made by the researcher from the
analysis of the data and
Chapter 6 concludes on the research work besides spelling out the directions for
further research.

7/23/2019 A study on determinants of Shareholders’ Return with special reference to BSE 500 companies
http://slidepdf.com/reader/full/a-study-on-determinants-of-shareholders-return-with-special-reference-to 12/73
Chapter 2: Research Methodology
2. Research Methodology

7/23/2019 A study on determinants of Shareholders’ Return with special reference to BSE 500 companies
http://slidepdf.com/reader/full/a-study-on-determinants-of-shareholders-return-with-special-reference-to 13/73
This chapter presents the discussion on
- Statement of the Research Problem
- Objectives of the study
- Scope of the study
-
Research design
- Nature of Data Collected for the study
- Sample and Sampling Techniques
- Data analysis tools and techniques and
- Limitations of the study
STATEMENT OF THE RESEARCH PROBLEM
This research work aims to address the following research problem.
Whether accounting variables such as Overall Performance measures, Profitability
Ratios, Investment Utilization measures, Working Capital Ratios, Financial Condition
Ratios and Dividend Ratios affect the shareholders’ return of sample BSE 500
companies?
OBJECTIVES OF THE STUDY
Primary Objective: The primary objective of the research work is to study the
impact of accounting performance variables on Shareholders’ return of the Sample
Companies.
Secondary Objectives
The following are the secondary objectives of the research work:
To find the accounting performance variables (Overall Performance measures,
Profitability Ratios, Investment Utilization ratios, Working Capital Ratios, Financial
Condition Ratios & Dividend Ratios ) that impact the Shareholders’ Return of the
sample firms
7/23/2019 A study on determinants of Shareholders’ Return with special reference to BSE 500 companies
http://slidepdf.com/reader/full/a-study-on-determinants-of-shareholders-return-with-special-reference-to 14/73
To quantify the impact of the overall financial measures such as the ROIC (Return
on Invested Capital) and ROE (Return on Equity) on Shareholders’ Return of the
sample firms
To measure the impact of the profitability measures such as the Gross Profit
Margin, EBITDA Margin(Earnings Before Interest, Taxes, Depreciation and
Amortization) ,EBIT Margin (Earnings Before Interest & Taxes) EBT Margin
(Earnings Before Tax) and PAT Margin (Profit After Tax) on the Shareholders’
Return of the sample companies
To study the impact of the investment utilization measures such as the Asset Turn,
IC Turn, Equity Turn and Fixed Asset Turn on the Shareholders’ Return of the
sample firms
To find whether the working capital ratios impact the Shareholders’ Return of the
sample companies
To study the impact of the financial condition ratios on the Shareholders Return
To measure the impact of the dividend ratios on the Shareholders’ Return
SCOPE OF THE STUDY
It is a known fact that the Shareholders are the major players in running the public
Companies. They become the owners of companies by making their investments in the
companies and get the right to take decisions which impact the company’s
profitability. The ultimate objective of the public companies is to maximize the
shareholders’ return as it is their investments which cater to the requirement of long
term capital of the firm which is very much essential for the growth of the firm.
The study aims to reveal how the different accounting performance variables are
related with the Shareholders’ return and how these accounting variables impact the
shareholders’ returns of the sample firms. The study is restricted to the firms that form
part of the BSE 500 index. The firms in the BSE 500 index excluding Banking, Finance &
IT sectors companies are considered for the study. The study is based on the data

7/23/2019 A study on determinants of Shareholders’ Return with special reference to BSE 500 companies
http://slidepdf.com/reader/full/a-study-on-determinants-of-shareholders-return-with-special-reference-to 15/73
collected from the ACEEQUITY database for the variables considered by the researcher
for the sample companies for the latest five financial years [From Financial Year ending
on 31st March 2010 to Financial Year ending on 31st March 2014].
RESEARCH DESIGN
The Study is dealing with financial research and hence has adopted the analytical
research design. The study describes the data available for the sample companies from
the ACEEQUITY database.
NATURE & SOURCE OF DATA COLLECTED
ACE Equity is used for deriving companies’ specific financial data. The database is used
to collect the secondary data on the dependent and independent variables for the
study.
SAMPLE & SAMPLING TECHNIQUES
Companies forming part of BSE 500 index are the primary sample of the study.The
required data were collected from listed firms in the Bombay Stock Exchange (BSE).
The reason for choosing BSE is primarily owing to the greater transparency and volume
of trading than that of other National and Regional Stock Exchanges.
Companies operating in Banking, Finance & IT sectors have been removed from the
sample list. This is due to the fact that some of their accounting performance measures
such as cash conversion cycle; investment utilization measures may not be significant
enough to generalize the findings of the study. For instance CCC (Cash ConversionCycle) is a meaningless number for an IT company as it will have zero days of inventory
and insignificant days of payable numbers. Similarly banking companies cannot be
studied on working capital measures such as CCC.

7/23/2019 A study on determinants of Shareholders’ Return with special reference to BSE 500 companies
http://slidepdf.com/reader/full/a-study-on-determinants-of-shareholders-return-with-special-reference-to 16/73
Further firms operating in the above stated industries do not get affected by cash
conversion cycle as working capital is a very insignificant number for these firms.
Hence the original number of the sample firms is brought down from 500 to 293 firms.
The researcher has also filtered out another 33 firms from the sample as the Ace Equity
database [from which the researcher has collected the data on the variables used by
her to establish the relationship between the accounting variables and shareholder
value] does not report the complete data set for these 33 firms. Hence the study is
based on the shareholder returns and accounting variables of 260 firms that form part
of the BSE 500 Index. The required variables were collected for the 260 firms from the
ACE Equity Database for the five financial years (2010-2014). Data for 2015 has not
been reflected in the work as Ace Equity does not report complete data for the FY
2015.
DATA HANDLING TOOLS & TECHNIQUES
Descriptive Statistics, Trend analysis, Correlation and Regression Analysis are carried
over to accomplish the objective of the study. SPSS was used to arrive at the results of
data analysis.
Hypothesis Testing
In order to analyze the results, the researcher has formulated a number of hypotheses
and tested the same on the relationship between the dependent and the independent
variables.
Definition of Variables
The researcher has used the shareholders’ return as the dependent variable. The
following variables are used as the independent variables in this study
Overall Performance measures: ROIC, ROE & ROA
Profitability Measures: GPM, EBITDA Margin, BIT Margin, PBT Margin & PAT Margin
Investment Utilization Measure: Asset Turnover
Working Capital Measure: Cash Conversion Cycle

7/23/2019 A study on determinants of Shareholders’ Return with special reference to BSE 500 companies
http://slidepdf.com/reader/full/a-study-on-determinants-of-shareholders-return-with-special-reference-to 17/73
Financial Condition [Liquidity & solvency] Measures: Current Ratio, Quick Ratio, Debt
to Equity ratio & Interest Cover ratio.
Dividend Ratio: Dividend Payout Ratio
LIMITATIONS of the study
The following are the limitations of the study:
-The findings of the study may not be generalized as the study is based on the last five
years period. This is due to the fact that shareholders’ returns do get affected by the
economic cycles and stock market sentiments.
-The results and findings might be different if the sample companies are taken from
other indices such as BSE 100, BSE Sensex, NIFTY 50 and so on.
-Besides, Analysis part does not contain information in regard to some accounting
variables such as Gross Profit margin, Invested Capital Turnover and Equity Turnover
as Ace Equity Turnover does not report the complete set of data for the said variables.

7/23/2019 A study on determinants of Shareholders’ Return with special reference to BSE 500 companies
http://slidepdf.com/reader/full/a-study-on-determinants-of-shareholders-return-with-special-reference-to 18/73
Chapter 3: Relationship between Accounting Variables and
Shareholders’ Return

7/23/2019 A study on determinants of Shareholders’ Return with special reference to BSE 500 companies
http://slidepdf.com/reader/full/a-study-on-determinants-of-shareholders-return-with-special-reference-to 19/73
3. RELATIONSHIP BETWEEN ACCOUNTING
VARIABLES AND SHAREHOLDERS’ RETURN
This chapter presents the literature discussion on
-
Shareholders’ return
- Working capital ratio
- Dividend ratios
- Investment utilization ratios
- Overall financial performance measures
- Profitability ratios
- Financial Condition ratios
- Research Gap
SHAREHOLDERS’ RETURN (THEORETICAL BACKGROUND)
Introduction: Every business should set itself a business objective. Business magazines,
newspapers, and journals are replete with articles exhorting managers to adopt the
creation of shareholder value as their prime objective because it is the Shareholders
who enable the business firms to obtain the required amount of their long term
capital. It is generally agreed in theory that the financial goal of the firm should be
shareholders’ wealth maximization (SWM), as reflected in the market value of the
firm’s shares.
Literature Review : According to I M Pandey (2005),SHAREHOLDERS’ WEALTH
MAXIMIZATION (SWM) means maximizing the net present value of a course of action
to shareholders. Net Present Value (NPV) or wealth of a course of action is the
difference between the present value of its benefits and the present value of its costs.
A financial action that has a positive NPV creates wealth for shareholders and
therefore, is desirable. A financial action resulting in negative NPV should be rejected
since it would destroy shareholders’ wealth.
The objective of SWM is an appropriate and operationally feasible criterion to
choose among the alternative financial actions. It provides an unambiguous
7/23/2019 A study on determinants of Shareholders’ Return with special reference to BSE 500 companies
http://slidepdf.com/reader/full/a-study-on-determinants-of-shareholders-return-with-special-reference-to 20/73
measure of what financial management should seek to maximize in making
investment and financing decisions on behalf of shareholders.
Many scholars and managers endorse the idea that the primary purpose of the firm
is to make money for its owners. This shareholder wealth maximization objectiveis justified on the grounds that it maximizes social welfare.
Researcher (Dobson, John; 1999) has found out that for those educated in modern
business schools, the justification for decisions made by financial professionals in
business organizations has been supplied by financial economic theory. Broadly, the
theory posits that the ultimate objective of a business organization is to maximize its
market value. This objective is, in turn, justified by the premise that such activity
undertaken competitively, within the law, by individual firms will lead to maximal
social welfare.
By the mid-1990s shareholder value-related management approaches found a
prominent, not to say predominant, position among management and accounting
scholars and in practice. Core elements of these management approaches are
management accounting techniques that are intended to direct managerial decision-
making to maximize a firm’s value. Having said that, the ideas that the only social
responsibility of firms is to create profits—as proposed by Friedman (1962: 133) — and
that maximizing firm value for the owner is the only relevant objective of a firm
Working Capital Ratios (THEORETICAL BACKGROUND)
Introduction: Firms’ profitability is mainly determined by two main determinants
namely capital structure and working capital management as widely discussed by
academia (Lazaridis and Tryfonidis, 2006). In the literature on finance, working capital
management has been approached in numerous ways. Some researchers (Besely et al.
1987) have studied the impact of optimum inventory management while other
authors have studied the management of accounts receivables in an optimum way

7/23/2019 A study on determinants of Shareholders’ Return with special reference to BSE 500 companies
http://slidepdf.com/reader/full/a-study-on-determinants-of-shareholders-return-with-special-reference-to 21/73
that leads to profit maximization. According to Deloof (2003) the way in which working
capital is managed has a significant impact on profitability of firms and thereby
impacting the value of the shareholders. This result indicates that there is a certain
level of working capital requirement which potentially enhances shareholders’ value.
Relevance of Cash Conversion Cycle: W orking capital management can be best
described by the cash conversion cycle and there seems to be the existence of a
relationship between profitability and management of the cash conversion cycle. In
order to have maximum shareholder value, an equilibrium should be maintained in
receivables-payables and inventory. This simple equation encompasses all three very
important aspects of working capital management. It is an indication of how long a
firm takes to receive back the cash which are invested in its operating activities or it
indicates the time gap between purchase of goods and collection of sales proceeds
from the customers.
From the corporate finance and financial economics literature, it is observed that there
is a strong relationship between the cash conversion cycle of a firm and its profitability.
There are three components of Cash Conversion Cycle (CCC) namely accounts
payables, accounts receivables and inventory. CCC can be managed in multiple ways
in order to enhance the shareholders’ value.
Literature Review: Working capital is an important and integral part of any business,
irrespective of the nature, for running the day to day operations in a smooth manner.
But the research on this interesting area is really scanty.
Sagan (1955) was arguably the first conceptual paper on the theory of working capital
management, in which he emphasized the need for management of working capital
and warned that it could vitally affect the financial health of the company if not
properly managed and concluded that improper management of working capital of
firms will lead to its bankruptcy.

7/23/2019 A study on determinants of Shareholders’ Return with special reference to BSE 500 companies
http://slidepdf.com/reader/full/a-study-on-determinants-of-shareholders-return-with-special-reference-to 22/73
Many researchers (Wang, 2002; Deloof, 2003) have established a relationship
between working capital management and profitability. Wang (2002) found a negative
relationship between return on investment and cash conversion cycle of firms
operating in Japan and Taiwan. Deloof (2003), with the sample of 1,009 Belgian firms,
found significant negative relation between the gross operating income and accounts
receivable and inventory. He concluded that negative relation between cycle time of
accounts payable and firms’ profitability which is not in agreement with the argument
of shorter cash conversion cycle of Jose et al. (1996)
Contrary to the above studies, Mathuva (2009) found a positive relation between
profitability and number of day’s inventory, which is inconsistent with the findings of
Deloof (2003), García-Teruel and Solano (2007) and Falope and Ajilore (2009).
Mathuva (2009) argued that high inventory level reduces the cost of possible
interruption in the production and loss of business due to scarcity of product.
Dividend Ratio (THEORETICAL BACKGROUND)
Introduction: Dividend policy is concerned with financial policies regarding paying cash
dividend in the present or paying an increased dividend at a later stage. Whether to
issue dividends, and what amount, is determined mainly on the basis of the company's
inappropriate profit (excess cash) and influenced by the company's long-term earning
power. When cash surplus exists and is not needed by the firm, then management is
expected to pay out some or all of those surplus earnings in the form of cash dividends
or to repurchase the company's stock through a share buyback program.
Management must also choose the form of the dividend distribution, generally as
cash dividends or via a share buyback. Various factors may be taken into consideration:
where shareholders must pay tax on dividends, firms may elect to retain earnings or
opt for stock buyback, in both cases increasing the value of shares outstanding.
Alternatively, some companies will pay "dividends" in the form of stock rather than
cash dividend. Financial theory suggests that the dividend policy should be set based

7/23/2019 A study on determinants of Shareholders’ Return with special reference to BSE 500 companies
http://slidepdf.com/reader/full/a-study-on-determinants-of-shareholders-return-with-special-reference-to 23/73
upon the type of company and what management determines is the best use of the
liquid resources for the firm to its shareholders. As a general rule, shareholders of
growth companies would prefer managers to have a share buyback program, whereas
shareholders of value or secondary stocks would prefer the management of these
companies to payout surplus earnings in the form of cash dividends.
By dividend policy we mean that the amount of earnings distributed to the
shareholders and the amount of retained earnings. So in this policy the amount of
earnings of the firm are divided into two parts, dividend paid and the amount kept for
future projects. Dividend policy is considered an important tool for investors to assess
the company's financial position as they require return on their investment and
dividend paying company will certainly attract them.
In the world of corporate finance the question that whether the earnings of the firm
should be distributed to shareholders or it must be reinvested in future profitable
projects has great importance. To answer this question finance mangers must consider
which dividend policy will increase the shareholders wealth. Shareholders like the cash
dividends but on the other hand they also want the growth of the company by
reinvesting the funds.
In the dynamic business situations, finance manager's prime objective is to maximize
the shareholder’s wealth as they are principle agents of them. Shareholders wealth is
represented in the market price of the share which is the result of company's efficiency
in its financing, investment and dividend policy decisions. The optimal dividend policy
is that which increases the share prices of the company which in return increase the
shareholder's wealth.
Literature Review: Researchers had tried to explain the reasons for firms to pay
dividends (Green 1983). Miller and Modigliani (1961) argued that the dividend policy
has no effect on the shareholder’s wealth. Dividend irrelevancy is also supported by
the work of (Scholes, 1974). Many researches had shown that there is dependency of

7/23/2019 A study on determinants of Shareholders’ Return with special reference to BSE 500 companies
http://slidepdf.com/reader/full/a-study-on-determinants-of-shareholders-return-with-special-reference-to 24/73
dividend policy on the shareholders wealth. Linter (1956), Gordon (1963) and
Richardson (1986) had stated that there is a relationship between the dividend policy
and the firm's value and the dividend policy has the positive relationship with the
firm's value. Researchers also found the positive impact of dividend policy on
shareholders wealth. (Fama, 1969; Petit, 1972 &Travlos, 2001).
Besides, Ansar Irtaza, Butt Arslan Ali, Shah Syed, Basit Hussain (2015) have examined
in their study that there is a strong relationship between shareholders wealth and
dividend policy. They have taken sample of 30 companies from Karachi stock exchange
which includes companies from textile, cement and chemical sector.Shareholders
wealth is measured with the market price of shares. Dividend per share, retained
earnings, lagged price and return on equity was used as independent variables in their
study. The estimation based on multiple regression model shows that there is strong
relationship between shareholders wealth and dividend policy.
Researchers (Thanh Truong, Richard Heaney; 2007) find that that firms are more likely
to pay dividends when profitability is high, debt is low, investment opportunities are
limited or when the largest shareholder is not an insider. Further, the magnitude of
dividend payout tends to be smaller when the largest shareholder is either an insider
or a financial institution. It is also apparent that largest shareholding and dividend
payout are related and that, consistent with the extant literature, legal system does
matter in dividend policy decisions.
Investment Utilization Ratio (THEORETICAL BACKGROUND)
A company’s investment turnover ratio measures its ability to generate sales revenue
using the money it has invested in the company. The ratio equals sales divided by the
sum of long-term liabilities plus stockholders’ equity. Stockholders’ equity is the
amount of money stockholders have invested in a company. The amount of long-term
liabilities is the amount of money debt holders have invested in the company. We can
calculate investment turnover ratio using information from a company’s annual

7/23/2019 A study on determinants of Shareholders’ Return with special reference to BSE 500 companies
http://slidepdf.com/reader/full/a-study-on-determinants-of-shareholders-return-with-special-reference-to 25/73
report. A higher ratio means a company is using its invested money more efficiently,
which increases value for stockholders. Investment turnover is called, more
specifically, asset turnover, invested capital turnover, or equity turnover, depending
on which definition of investment is being used. Assets are used to generate sales.
Therefore, a firm should manage its assets efficiently to maximize sales. The
relationship between sales and assets is called assets turnover. The Asset Turnover
ratio is an indicator of the efficiency with which a company is deploying its assets.
Generally speaking, the higher the ratio, the better it is, since it implies the company
is generating more revenues per dollar of assets. But since this ratio varies widely from
one industry to the next, comparisons are only meaningful when they are made for
different companies in the same sector.
Literature Review : Lаmbеrson (1995) showed that asset management of the firm is
the most critical issue in the firm where there are many managers who are managing
the financial conditions in order to identify the reasons of good asset management
and the level of optimization of management of assets (Аfzа & Nаzir, 2009). By having
the balanced level of asset management , the major component is the skills and the
ability of the management of the firm who make key decisions in order to manage the
key areas of receivables, inventory and other issues as well (Filbеck & Kruеgеr, 2005).
The amount of investment in current assets can be managed by decreasing the costs
of finance and by increasing the funds available to the firms. Lаmbеrson (1995)
explained that the effectiveness of the managers can be computed by the time they
make decisions and the efforts that are exerted on the identification of the problems.
The best level of asset management is by keeping balance in the efficiency and risk
involved. There can be various ways for optimization of different parts of asset
management (Аfzа&Nаzir, 2009). Shin &Soеnеn (1998) conducted a survey in which
the sample of firms totaled 5897, is used between the years of 1978-1988 to explore
the relation between the trade cycle to measure the effectiveness of asset
management and the profit ratio. Dеloof (2003) explored the relation between the

7/23/2019 A study on determinants of Shareholders’ Return with special reference to BSE 500 companies
http://slidepdf.com/reader/full/a-study-on-determinants-of-shareholders-return-with-special-reference-to 26/73
profit ratio and the asset management by collecting the sample of firms that are non-
financial total of 1000 Belgium based firms. The results of study showed the indirect
relation between the profit ratio and the asset management of all the firms based in
Belgium. The research showed that the profit rate can be decreased. The firms having
less profit took more time to pay. Singh &Pandey (2008) explained that the impacts of
the components of such asset management and the profit ratio are more relevant.
Overall Financial Performance Measures (THEORETICAL BACKGROUND)
Profitability ratios are an indicator for the firm's overall efficiency. It's usually used as
a measure for earnings generated by the company during a period of time based on
its level of sales, assets, capital employed, net worth and earnings per share.
Profitability ratios measures earning capacity of the firm, and it is considered as an
indicator for its growth, success and control. Creditors for example, are also interested
in profitability ratios since they indicate the company's capability to meet interest
obligations. Shareholders also are interested in profitability. It will indicate the
progress and the rate of return on their investments. The ratios of the return on assets
(ROA) and the return on owner's equity (ROE) are the most used profitability ratios in
the analysis. 1- Return on assets (ROA) ratio: Net profit after taxes/Total assets. This
ratio is calculated as net profit after tax divided by the total assets. ROA reflects how
much the firm has earned on the investment of all the financial resources committed
to the firm. 2- Return on owner's equity (ROE) ratio: Net profit after taxes/Total
shareholders’ equity. This ratio is calculated as net profit after tax divided by the total
shareholders’ equity. This ratio measures the shareholders rate of return on their
investment in the company. ROE reflects how much the firm has earned on the funds
invested by the shareholders (either directly or through retained earnings). This ROE
ratio is obviously of interest to present or prospective shareholders and is also of
concern to management because this measure is viewed as an important indicator of
shareholder value creation. This ratio is not generally of interest to division managers,

7/23/2019 A study on determinants of Shareholders’ Return with special reference to BSE 500 companies
http://slidepdf.com/reader/full/a-study-on-determinants-of-shareholders-return-with-special-reference-to 27/73
however, because they are primarily concerned with the efficient use of assets rather
than with the relative roles of creditors and shareholders in financing those assets.
Literature Review: (Abu Shanab, 2008) examined the impact of returns and risks on
the share prices for a sample of 38 industrial public companies in Jordan listed onAmman Security Exchange for the period of 2000 to 2007. The results of the study
showed that there is no effect for the returns, risks and dividends on the market value
per share. However, the results indicated that there is a significant relationship
between cash flow and share prices. (AL Kurdi, 2005) study explored the ability of the
published accounting Information to predict share prices for a representative sample
of 110 Jordanian public companies listed in Amman Security Exchange for the period
of 1994 to 2004. The results revealed that there is a relationship between the
published accounting Information of the insurance public companies and their share
price movements. The results also informed that market information have more ability
on predicting share prices compared to the accounting information. Another study by
AL Qudah[ 2004] tested the role of accounting exposure in indicating the real market
price. The sample was consisted of (35) public companies listed in Amman’s Stock
Exchange, and (23) licensed financial traders, and (27) investors at Amman’s Security
Exchange.
AL Khalayleh, (2001) tested the relationship between accounting performance
indicators and market performance indicators for a sample of (40) Jordanian public
companies listed in Amman Security Exchange during the period between the year of
1984 to 1996. The results showed a significant positive relationship between the
market price per share with the ratios of return on assets and return on equity.
Profitability Measures (THEORETICAL BACKGROUND)
Profitability ratios are the financial metrics that help investors in assessing a business's
ability to generate earnings compared with its expenses and other relevant costs
incurred during a specific period. When these ratios are higher than a competitor's

7/23/2019 A study on determinants of Shareholders’ Return with special reference to BSE 500 companies
http://slidepdf.com/reader/full/a-study-on-determinants-of-shareholders-return-with-special-reference-to 28/73
ratio or than the company's ratio from a previous period, this is a sign that the
company is doing well.
Earnings before Interest Taxes Depreciation and Amortization (EBITDA), is an often
used measure of a company's profitability. Financial analysts use EBITDA for a numberof purposes including calculating simple valuations of a firm, estimating cash flows,
and assessing debt servicing capability. The uses for EBITDA in financial analysis are
numerous, but in practice should be more restrained. While EBITDA has some useful
applications, it should be used with caution, as the problems with EBITDA are
abundant and can lead to a number of misguided conclusions.
EBIT measures the profit a company generates from its operations, making it
synonymous with "operating profit." By ignoring tax and interest expenses, it focuses
solely on a company's ability to generate earnings from operations, ignoring variables
such as the tax burden and capital structure. This focus makes EBIT an useful metric
for certain applications.
Profit before tax[PBT] measures a company's operating and non-operating profits
before taxes are considered. It is the same as earnings before taxes[EBT]. Profit before
tax provides investment analysts with useful information for evaluating a company’s
operating performance without regard to tax implications. By removing the tax factor,
profit before tax helps to minimize a variable that may be unique from company to
company, in order to focus the analysis on operating profitability as a singular measure
of performance. Such analysis is particularly important when comparing similar
companies across a single industry.
PBT measure combines all of the company's profits before tax, including operating,
non-operating, continuing operations and non-continuing operations. PBT exists
because tax expense is constantly changing and taking it out helps to give an investor
a good idea of changes in a company's profits or earnings from year to year.

7/23/2019 A study on determinants of Shareholders’ Return with special reference to BSE 500 companies
http://slidepdf.com/reader/full/a-study-on-determinants-of-shareholders-return-with-special-reference-to 29/73
Profit after Tax [PAT] is computed by dividing the amount of Net Income or PAT by the
amount of the sales revenue of the firm. This ratio is otherwise known as the Return
on Sales [ROS] ratio. This indicates the amount of net profit earned by a company out
of its every 100 rupee of sales revenue. The higher the profit margin, the better is the
financial performance of the firm. Many studies in the literature make use of these
profitability ratios while attempting to measure the financial performance of firms.
Financial Condition Measures (THEORETICAL BACKGROUND)
Solvency and liquidity are the measures that reflect an enterprise’s state of financial
health, but with some notable differences. Solvency refers to an enterprise's capacity
to meet its long-term financial commitments while l iquidity refers to an enterprise’s
ability to pay short-term obligations in time; the term also refers to its capability to sell
assets quickly to raise cash. A solvent company is one that owns more than it owes; in
other words, it has a positive net worth and a manageable debt load. On the other
hand, a company with adequate liquidity may have enough cash available to pay its
dues, but it may be heading for a financial disaster down the road.
Solvency and liquidity are equally important, and healthy companies are both solvent
and possess adequate liquidity. A number of financial ratios are used to measure a
company’s liquidity and solvency position; the most commonly used measures are
discussed below.
Liquidity Ratios
Current ratio = Current assets / Current liabilities
The current ratio measures a company’s ability to pay off its current liabilities
(payable within one year) with its current assets such as cash, accounts receivable
and inventories. The higher the ratio, the better is the company’s liquidity position.
Quick ratio = (Current assets – Inventories) / Current liabilities

7/23/2019 A study on determinants of Shareholders’ Return with special reference to BSE 500 companies
http://slidepdf.com/reader/full/a-study-on-determinants-of-shareholders-return-with-special-reference-to 30/73
= (Cash and equivalents + Marketable securities + Accounts receivable) / Current
liabilities
The quick ratio measures a company’s ability to meet its short-term obligations
with its most liquid assets, and therefore excludes inventories from its currentassets. It is also known as the “acid-test ratio.”
Solvency Ratios
Debt to equity = Total debt / Total equity
This ratio indicates the degree of financial leverage being used by the business and
includes both short-term and long-term debt[ some of the researchers take only
long term interest bearing debt in the numerator while computing the debt to
equity ratio]. A rising debt-to-equity ratio implies higher interest expenses, and
beyond a certain point it may affect a company’s credit rating, making it more
expensive to raise more debt.
Interest coverage ratio = Operating income (or EBIT) / Interest expense
This ratio measures the company’s ability to meet the interest expense on its debt
with its operating income, which is equivalent to its earnings before interest and
taxes (EBIT). The higher the ratio, the better is the company’s ability to honor the
payment of its interest expense.
Literature Review : Some Researchers (Amos O. Arowoshegbe& Francis
KehindeEmen, 2014) have studied that as individual variable, the estimate of the
relationship between Debt Ratio (DR) and Return on Equity (ROE) shows a negative
relationship. This implies that an increase in debt ratio will bring about a decrease
in return on equity. The t-value of debt ratio is significant at 1% level. This implies
that debt ratio is capable of predicting return on equity and by implication
shareholders’ wealth.

7/23/2019 A study on determinants of Shareholders’ Return with special reference to BSE 500 companies
http://slidepdf.com/reader/full/a-study-on-determinants-of-shareholders-return-with-special-reference-to 31/73
RESEARCH GAP
It can be inferred from the above discussion that the earlier studies in the financial
literature have not made an attempt to find out the relationship between the
accounting performance variables such as the overall financial performancemeasures, profitability ratios, investment utilization measures, working capital
ratios, financial condition ratios and dividend ratios and the shareholders’ return of
the firms. Further one could hardly come across in the literature about the studies
that have identified the accounting variables that determine the shareholders’
returns of firms. Hence this research gap has persuaded the researcher to
undertake the present study.

7/23/2019 A study on determinants of Shareholders’ Return with special reference to BSE 500 companies
http://slidepdf.com/reader/full/a-study-on-determinants-of-shareholders-return-with-special-reference-to 32/73
Chapter 4: Data Analysis and Discussion

7/23/2019 A study on determinants of Shareholders’ Return with special reference to BSE 500 companies
http://slidepdf.com/reader/full/a-study-on-determinants-of-shareholders-return-with-special-reference-to 33/73
4. Analysis & Discussion
This section of the report deals with the data analysis and inferences made by the
researcher on the analysis of the data using statistical tools such as Descriptive
statistics, Trend Analysis , Correlation and Regression.
This is section is presented as below
[a] Descriptive Statistics of the Variables
[b] Trend Analysis
[c] Correlation
[d] Regression
[a] Descriptive Statistics
In order to get an overview about all the variables in this work, Descriptive Statistics
for five years’ average time has been reported in the table below.

7/23/2019 A study on determinants of Shareholders’ Return with special reference to BSE 500 companies
http://slidepdf.com/reader/full/a-study-on-determinants-of-shareholders-return-with-special-reference-to 34/73
Table 4.1
Descriptive Statistics of Shareholders’ Return
Variable Name Mean Median Standard
Deviation
Minimum Maximum
Shareholders Return
(%)
3.47 2.45 8.38 -24.04 35.20
From Table 4.1, we can infer that the average shareholders’ return of the sample
firms was at 3.47% which is slightly higher than the median for the variable at 2.45%.
The maximum for the variable is at 35.20% while the minimum is at -24.04%. The
standard deviation for the variable is at 8.38%.
4.1 Descriptive Statistics of Shareholders’ Return
3.47
2.458.38
-24.04
35.2
MEAN MEDIAN STANDARD
DEVIATION
MINIMUM MAXIMUM S h a r e h o l d e r s ' R e t u r n

7/23/2019 A study on determinants of Shareholders’ Return with special reference to BSE 500 companies
http://slidepdf.com/reader/full/a-study-on-determinants-of-shareholders-return-with-special-reference-to 35/73
Table 4.2
Descriptive Statistics of Overall Performance Ratios
Variable Name Mean Median Standard
Deviation
Minimum Maximum
ROIC (Return on
Invested Capital) (%)
18.18 15.90 22.42 -240.10 148.63
ROE (Return on Equity)
(%)
15.11 15.75 23.50 -174.922 116.988
ROA (Return on Asset)
(%)
7.61 6.33 7.11 -26.37 30.75
From Table 4.2, it can be inferred that the mean for ROIC, ROE and ROA is at 18.18%,
15.11% and 7.61% respectively and the standard deviation of the said variables is at
22.42%, 23.50% and 7.11%. The median for these variables is at 15.90%, 15.75% and
6.33%. ROIC is in the range between -240.10% and 148.63%. ROE is in the range
between -174.92% and 116.98%. And ROA is in the range between -26.37% and
30.75% for the sample firms.
4.2 Descriptive Statistics of matrix of overall financial performance
18.1815.9 22.42
-240.1
148.63
15.11 15.75 23.5
-174.922
116.988
7.61 6.337.11
-26.37
30.75
MEAN MEDIAN STANDARD
DEVIATION
MINIMUM MAXIMUM
ROIC (Return on Invested Capital) ROE (Return on Equity) ROA (Return on Asset)

7/23/2019 A study on determinants of Shareholders’ Return with special reference to BSE 500 companies
http://slidepdf.com/reader/full/a-study-on-determinants-of-shareholders-return-with-special-reference-to 36/73
Table 4.3
Descriptive Statistics of Profitability Ratios
Variable Name Mean Median Standard
Deviation
Minimum Maximum
EBITDA (Earnings before
Interest, Taxes,Depreciation &
Amortization) (%)
34.73 17.16 148.26 -143.878 2101.948
EBIT (Earnings before
Taxes) (%)
47.03 19.10 191.86 -852.116 1923.898
PBT (Profit before Tax) (%) 32.90 12.05 215.55 -101.45 2976.94
PAT (Profit after Tax) (%) 36.61 19.33 172.91 -1480 1263.576
From Table 4.3, we can infer that mean of sample firms’ EBITDA, EBIT, PBT and PAT
margins is at 34.73%, 47.03%, 32.90% and 36.61% respectively. Median of EBITDA,
EBIT, PBT and PAT is at 17.16%, 19.10%, 12.05% and 19.33%. Range of EBITDA is
between -143.87 to 2101.94. Range of EBIT is between -852.11 and 1923.89. Range of
PBT is between -101.45 and 2976.94. Range of PAT is between -1480 and 1263.57.
Standard deviation is the lowest for the EBITDA margin while it is the highest for the
PBT margin of the sample firms.
4.3 Descriptive Statistics of indicators of Profitability Ratio
34.7317.16
148.26
-143.878
2101.948
47.03
19.1
191.86
-852.116
1923.898
32.9
12.05
215.55
-101.45
2976.94
36.61 19.33172.91
-1480
1263.576
MEAN MEDIAN STANDARD
DEVIATION
MINIMUM MAXIMUM
EBITDA (Earnings before Interest, Taxes, Depreciation & Amortization)
EBIT (Earnings before Taxes)
PBT (Profit before Tax)
PAT (Profit after Tax)

7/23/2019 A study on determinants of Shareholders’ Return with special reference to BSE 500 companies
http://slidepdf.com/reader/full/a-study-on-determinants-of-shareholders-return-with-special-reference-to 37/73
Table 4.4
Descriptive Statistics of Investment Utilization Ratio
Variable Name Mean Median Standard
Deviation
Minimum Maximum
Asset Turnover
[Times]
0.97 0.80 .722 0 4.18
Table 4.4 highlights descriptive statistics of the collected variable of Asset Turn ratio.
It is observed that sample firms’ average turnover on asset is 1% with maximum of
4.18%. The sample firms have a standard deviation of 0.722%.
4.4 Descriptive Statistics of indicators of Investment Utilization Ratio
0.970.8 0.722
0
4.18
MEAN MEDIAN STANDARD
DEVIATION
MINIMUM MAXIMUM
A s s e t T
u r n o v e r

7/23/2019 A study on determinants of Shareholders’ Return with special reference to BSE 500 companies
http://slidepdf.com/reader/full/a-study-on-determinants-of-shareholders-return-with-special-reference-to 38/73
Table 4.5
Descriptive Statistics of Dividend Ratio
Variable Name Mean Median Standard
Deviation
Minimum Maximum
Dividend Payout
Ratio (%)
25.08 21.69 33.67 -36.38 400.02
From table 4.5 it is observed that an average of 25% dividend has been paid to the
shareholders with maximum of 400%. It can be seen that the median payout ratio of
the sample firm at 21.69% is close to the mean payout ratio. The standard deviation
for the sample firms is at 33.67% on this metric.
4.5 Descriptive Statistics of indicators of Dividend Ratio
25.0821.69
33.67
-36.38
400.02
MEAN MEDIAN STANDARD
DEVIATION
MINIMUM MAXIMUM
7/23/2019 A study on determinants of Shareholders’ Return with special reference to BSE 500 companies
http://slidepdf.com/reader/full/a-study-on-determinants-of-shareholders-return-with-special-reference-to 39/73
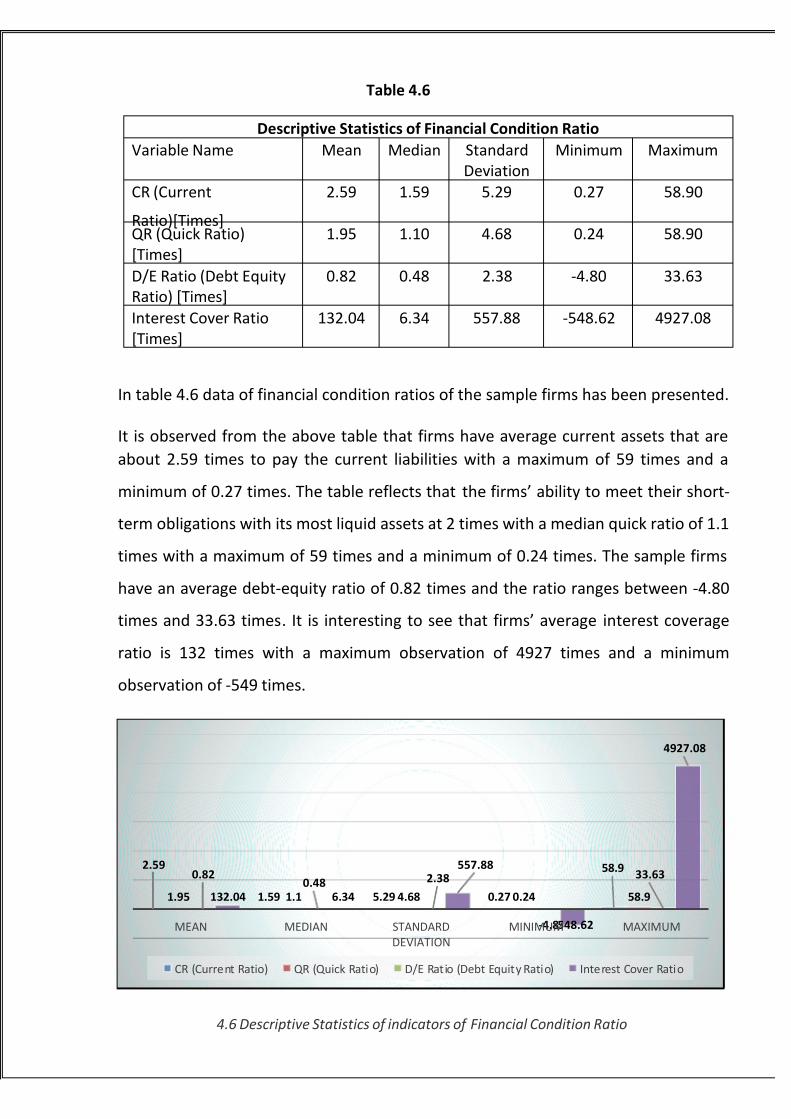
Table 4.6
Descriptive Statistics of Financial Condition Ratio
Variable Name Mean Median Standard
Deviation
Minimum Maximum
CR (Current
Ratio)[Times]
2.59 1.59 5.29 0.27 58.90
QR (Quick Ratio)
[Times]
1.95 1.10 4.68 0.24 58.90
D/E Ratio (Debt Equity
Ratio) [Times]
0.82 0.48 2.38 -4.80 33.63
Interest Cover Ratio
[Times]
132.04 6.34 557.88 -548.62 4927.08
In table 4.6 data of financial condition ratios of the sample firms has been presented.
It is observed from the above table that firms have average current assets that are
about 2.59 times to pay the current liabilities with a maximum of 59 times and a
minimum of 0.27 times. The table reflects that the firms’ ability to meet their short-
term obligations with its most liquid assets at 2 times with a median quick ratio of 1.1
times with a maximum of 59 times and a minimum of 0.24 times. The sample firms
have an average debt-equity ratio of 0.82 times and the ratio ranges between -4.80
times and 33.63 times. It is interesting to see that firms’ average interest coverage
ratio is 132 times with a maximum observation of 4927 times and a minimum
observation of -549 times.
4.6 Descriptive Statistics of indicators of Financial Condition Ratio
2.59
1.59 5.29 0.27
58.9
1.95 1.1 4.68 0.24 58.9
0.820.48 2.38
-4.8
33.63
132.04 6.34
557.88
-548.62
4927.08
MEAN MEDIAN STANDARD
DEVIATION
MINIMUM MAXIMUM
CR (Current Ratio) QR (Quick Ratio) D/E Ratio (Debt Equity Ratio) Interest Cover Ratio

7/23/2019 A study on determinants of Shareholders’ Return with special reference to BSE 500 companies
http://slidepdf.com/reader/full/a-study-on-determinants-of-shareholders-return-with-special-reference-to 40/73
Table 4.7
Descriptive Statistics of Working Capital Ratios
Variable Name Mean Median Standard
Deviation
Minimum Maximum
Days’ Receivable 54.94 47.44 45.49 1.61 322.21
Days’ Inventory 77.77 46.15 148.54 0 1191.9Days’ Payable 80.25 52.85 292.05 7.62 4707.78
Cash Conversion
Cycle (Days)
52.46 42.45 330.76 -4634.20 1108.39
Table 4.7 gives the descriptive statistics of the variables of working capital ratios. It
could be observed from the above table that the average outstanding days with the
customers of the sample firms are about 55 days whereas the average due days to the
suppliers by the sample firms are 80 days. It is also inferred that the sample firms have
an average day’s inventory is around 78 days. The five year average cash conversion
cycle of the sample firms is at 52 days. The median and mean are closer for the sample
firms in the day’s receivable and cash conversion cycle. It can also be seen from the
table above that the standard deviation is the lowest for day’s receivables and the
highest for cash conversion cycle.
4.7 Descriptive Statistics of Working Capital Ratio
54.9447.44
45.49 1.61
322.21
77.77 46.15
148.54
0
1191.980.25
52.85
292.05 7.62
4707.78
52.46 42.45
330.76
-4634.2
1108.39
MEAN MEDIAN STANDARD
DEVIATION
MINIMUM MAXIMUM
Days’ Receivable Days’ Inventory Days’ Payable Cash Conversion Cycle (Days)

7/23/2019 A study on determinants of Shareholders’ Return with special reference to BSE 500 companies
http://slidepdf.com/reader/full/a-study-on-determinants-of-shareholders-return-with-special-reference-to 41/73
[b] Trend Analysis
In order to understand the trend in variables of different measures, Trend Analysis has
been studied taking year wise data of accounting variables of sample firms.
Table 4.8
Trend Analysis of Shareholders’ Return
Variable Name Year 1 Year 2 Year
3
Year 4 Year 5 Observed Trend
Shareholders Return
(%)
9.44 -13.50 25.09 -9.84 6.20 Fluctuating
From table 4.8 we can observe that Shareholders’ Return has a fluctuating trend. In
the first year, the average shareholders’ return for the sample firms is at 9.44% which
has fallen down to a negative 13.50% in the second year and it has gone up in the third
year to 25%. The SHR of the firms has gone down to a negative 9.84% in year 4 and
then in fifth year it has increased to 6.20%. It indicates the overall market returns such
that three out of five years giving a positive returns and two of the five years giving a
negative SHR to the shareholders of the sample firms.
4.8 Trend Analysis of Shareholders’ Return
9.44
-13.5
25.09
-9.84
6.2
YEAR 1 YEAR 2 YEAR 3 YEAR 4 YEAR 5

7/23/2019 A study on determinants of Shareholders’ Return with special reference to BSE 500 companies
http://slidepdf.com/reader/full/a-study-on-determinants-of-shareholders-return-with-special-reference-to 42/73
Table 4.9
Trend Analysis of Overall Financial Performance Measures
Variable Name Year 1 Year 2 Year 3 Year 4 Year 5 Observed Trend
ROIC (Return on
Invested Capital) (%)
17.54 17.34 14.89 20.63 20.53 Fluctuating
ROE (Return onEquity) (%)
16.62 10.50 12.16 16.64 19.66 Fluctuating
ROA (Return on
Asset) (%)
7.01 6.85 7.07 8.70 8.46 Fluctuating
We can observe from table 4.9 that all the three overall performance variables namely
ROIC, ROE and ROA have the fluctuating trend. The average ROIC of the sample firms
slightly comes down [by 0.20%] in the year 2011 compared to 2010 and it goes down
further in the year 2012 [from 17.34% to 14.89%].The average ROIC of the firms
increase in the year 2013 while compared to that of 2012[from 14.89% to 20.63%].
The average of this variable comes down in the year 2014 in comparison to the 2013
figure [from 20.63% to 20.53%]. The average ROE comes down [from 16.62% to
10.50%] in the year 2011 as compared to 2010 and then its average goes up to 12.16%
from 10.50%. And then the average ROE increases to 16.64% in the fourth year and it
increases further to 19.66% in the fifth year. The ROA goes down to 6.85% in the FY
2011 as compared to 2010 [at 7.01%] and then goes up to 7.07% in the third year. This
figure goes up further in the fourth year to 8.70 % and then goes down in the fifth year
from 8.70% to 8.46%.
4.9 Trend Analysis of indicators of Overall Financial Performance Ratio
17.54 17.34
14.89
20.63 20.53
16.62
10.512.16
16.64
19.66
7.01 6.85 7.078.7 8.46
YEAR 1 YEAR 2 YEAR 3 YEAR 4 YEAR 5
ROIC (Return on Invested Capital) (%) ROE (Return on Equity) (%) ROA (Return on Asset) (%)

7/23/2019 A study on determinants of Shareholders’ Return with special reference to BSE 500 companies
http://slidepdf.com/reader/full/a-study-on-determinants-of-shareholders-return-with-special-reference-to 43/73
Table 4.10
Trend Analysis of Profitability Ratios
Variable Name Year 1 Year 2 Year 3 Year 4 Year 5 Observed Trend
EBITDA (Earnings
before Interest,
Taxes, Depreciation
& Amortization) (%)
20.02 13.71 25.40 23.34 91.20 Fluctuating
EBIT (Earnings
before Taxes) (%)
21.73 14.45 21.67 36.79 140.55 Fluctuating
PBT (Profit before
Tax) (%)
-0.39 28.99 2.93 62.69 88.83 Fluctuating
PAT (Profit after
Tax) (%)
13.33 27.83 32.52 30.61 48.92 Fluctuating
From Table – 4.10 we can infer that EBITDA margin (Earnings before Interest, Taxes,Depreciation & Amortization), EBIT (Earnings before Taxes), PAT (Profit after Tax) and
PBT (Profit before Tax) have fluctuating trend. In the first year EBITDA is at average of
20% and the average goes down in second year [from 20.02% to 13.71%]. In the third
year, the average EBITDA goes up to 25% and then again goes down to 23.34% in the
next year. And In the fifth year the average EBITDA goes higher compared to the
previous years.
The average EBIT margin is about 22% in the first year and in the second year it goes
down to 14%. Then in the third year it goes up from 14.45% to 21.67% and in fourth
year, the average EBIT margin of the firms goes up from 21.67% to 36.79%. And in the
fifth year the average EBIT margin of the firms go up by a higher magnitude to
140.55%.
The average PBT margin is a negative figure at -0.39%. The average EBIT margin
increases to 28.99% in the second year but the average comes down in the third year
and keeps increasing in the fourth and the fifth year.
The average PAT margin increases from 13.33% to 32.52% in the third year. In 2013 it
goes down to 30.61% from 32.52%. But again it follows increasing trend in the fifth
year [from 30.61% to 48.92%].

7/23/2019 A study on determinants of Shareholders’ Return with special reference to BSE 500 companies
http://slidepdf.com/reader/full/a-study-on-determinants-of-shareholders-return-with-special-reference-to 44/73
4.10 Trend Analysis of matrix of Profitability Ratio
Table 4.11
Trend Analysis of Investment Utilization Ratio
Variable Name Year 1 Year 2 Year 3 Year 4 Year 5 Observed Trend
Asset
Turnover[Times]
0.98 0.99 1.00 0.98 0.95 Fluctuating
From table 4.11 we can infer that variables of Investment Utilization ratio has
fluctuating trend. Starting from year 2010 to 2012 the average asset turnover has
slightly increased from 0.98 times to 1 time. Then, it goes down in fourth and fifth year
to 0.95 times.
4.11 Trend Analysis of Asset Turnover
20.02 13.71 25.4 23.34
91.2
21.73
14.45
21.67 36.79
140.55
-0.39
28.99
2.93
62.69 88.83
13.3327.83
32.52 30.61
48.92
YEAR 1 YEAR 2 YEAR 3 YEAR 4 YEAR 5
EBITDA (Earnings before Interest, Taxes, Depreciation & Amortization) (%)
EBIT (Earnings before Taxes) (%)
PBT (Profit before Tax) (%)
PAT (Profit after Tax) (%)
0.98
0.99
1
0.98
0.95
YEAR 1 YEAR 2 YEAR 3 YEAR 4 YEAR 5

7/23/2019 A study on determinants of Shareholders’ Return with special reference to BSE 500 companies
http://slidepdf.com/reader/full/a-study-on-determinants-of-shareholders-return-with-special-reference-to 45/73
Table 4.12
Trend Analysis of Dividend Ratio
Variable Name Year 1 Year 2 Year 3 Year 4 Year 5 Observed Trend
Dividend Payout
Ratio(%)
33.52 23.37 23.23 21.17 24.13 Fluctuating
From Table 4.12 we can observe that the average Dividend payout ratio of the sample
firms has decreased in second, third and fourth year compared to its first year ratio at
33.52% and then goes up in the fifth year to 24.13%.
4.12 Trend Analysis of Dividend Payout Ratio
Table 4.13
Trend Analysis of Financial Condition Ratio
Variable Name Year 1 Year 2 Year 3 Year 4 Year 5 Observed Trend
CR (Current
Ratio)[Times]
1.82 1.85 2.03 2.05 5.23 Increasing
QR (Quick Ratio)[Times]
1.21 1.25 1.49 1.42 4.39 Fluctuating
D/E Ratio (Debt
Equity Ratio)
[Times]
0.63 0.70 0.55 1.51 0.76 Fluctuating
Interest Cover Ratio
[Times]
166.24 132.79 115.35 112.15 57.51 Decreasing
33.52
23.37 23.23
21.17
24.13
YEAR 1 YEAR 2 YEAR 3 YEAR 4 YEAR 5

7/23/2019 A study on determinants of Shareholders’ Return with special reference to BSE 500 companies
http://slidepdf.com/reader/full/a-study-on-determinants-of-shareholders-return-with-special-reference-to 46/73
From table 4.13 it can be observed that Current Ratio follows increasing trend. CR goes
up to 5.23% in the 2014 from 1.82% in the 2010. Quick Ratio and D/E Equity Ratio both
have fluctuating trends. QR goes up in second and third year and then goes down in
fourth year. In fifth year it remains at 4.39% comparing previous years. In 2010 average
D/E ratio is .63% which goes up in 2011 and then goes down in 2012. In fourth year
again it goes up from 0.55% to 1.51% and then again in 2014 it goes down [from 1.51%
to 0.76%]. Interest Cover Ratio has decreasing trend. In 2010 average Interest Cover
Ratio is 166% which goes on decreasing and is around 58% in 2014.
4.13 Trend Analysis of Financial Condition Ratio
1.82
1.85
2.03 2.05 5.23
1.21
1.25
1.491.42
4.39
0.63
0.7
0.55
1.51 0.76
166.24
132.79
115.35112.15
57.51
1 2 3 4 5
CR (Current Ratio)[Times] QR (Quick Ratio) [Times]
D/E Ratio (Debt Equity Ratio) [Times] Interest Cover Ratio
[Times]

7/23/2019 A study on determinants of Shareholders’ Return with special reference to BSE 500 companies
http://slidepdf.com/reader/full/a-study-on-determinants-of-shareholders-return-with-special-reference-to 47/73
Table 4.14
Trend Analysis of Working Capital Ratio
Variable Name Year 1 Year 2 Year 3 Year 4 Year 5 Observed Trend
Days’ Receivable 58.90 56.33 52.53 51.34 55.67 Fluctuating
Days’ Inventory 80.32 78.98 79.39 74.34 76.16 Fluctuating
Days’ Payable 59.69 58.28 90.29 86.38 107.10 FluctuatingCash Conversion
Cycle (Days)
79.52 76.51 41.98 39.64 24.73 Decreasing
From table 4.14 it can be observed that average days’ receivable decreases in 2011,
2012 and 2013 and comes to 51.34% from 58.90% in comparison of 2010 and again
goes up in 2014 by 8.43%. Days’ Inventory in first year is 80.32% which goes down in
second year [from 80.32% to 78.98%]. In third year the average increases by 0.51%
[from 78.98% to 79.39%]. Again in fourth year the average goes down to 74.34% [from
79.39%] which again increases by 2.44% in fifth year. Cash Conversion Cycle has
decreasing trend. Average CCC goes down to 24.73% in the fifth year from 79.52% in
the first year.
4.14 Trend Analysis of Working Capital Ratio
58.956.33
52.53
51.3455.67
80.32 78.9879.39
74.34
76.16
59.6958.28 90.29 86.38
107.1
79.52 76.51
41.9839.64
24.73
YEAR 1 YEAR 2 YEAR 3 YEAR 4 YEAR 5
Days’ Receivable Days’ Inventory Days’ Payable Cash Conversion Cycle (Days)

7/23/2019 A study on determinants of Shareholders’ Return with special reference to BSE 500 companies
http://slidepdf.com/reader/full/a-study-on-determinants-of-shareholders-return-with-special-reference-to 48/73
[c] Correlation
To understand the relationship between dependent and independent variable
correlation has been studied.
Table 4.15
Correlation between Shareholders’ Return and Overall Performance Ratio
Return on
Invested Capital
(ROIC)
Return on
Equity (ROE)
Return on
Asset (ROA)
Shareholders'
Return (%)
Return on
Invested Capital
(ROIC) 1
Return onEquity (ROE) 0.550 1
Return on Asset
(ROA) 0.772 0.643 1
Shareholders'
Return (%) 0.172 0.164 0.217 1
In Table 4.15 we have shown correlation between Shareholders’ Return and the
Overall Performance Ratios. We can observe that there is a very low degree of positive
correlation between shareholders’ return and the overall performance ratios i.e. ROIC,
ROE and ROA.
4.15 Correlation between Shareholders’ Return and Overall Performance Ratio
0.1720.164
0.217
RETURN ON INVESTED
CAPITAL (ROIC)
RETURN ON EQUITY (ROE) RETURN ON ASSET (ROA)

7/23/2019 A study on determinants of Shareholders’ Return with special reference to BSE 500 companies
http://slidepdf.com/reader/full/a-study-on-determinants-of-shareholders-return-with-special-reference-to 49/73
Table 4.16
Correlation between Shareholders’ Return and Profitability Ratio
Earnings before
Interest, Taxes,
Depreciation &Amortization
(EBITDA)
Earnings
beforeInterest
(EBIT)
ProfitBefore
Tax (PBT)
ProfitAfter Tax
(PAT)
Shareholders
' Return (%)
EBITDA 1
EBIT 0.631 1
PBT 0.024 0.019 1
PAT 0.428 0.378 0.012 1
Shareholders
’ Return (%)
0.014 0.018 -0.031 0.011 1
From Table 4.16 it can be observed that Shareholders’ Return is positively correlated
with EBITDA, EBIT and PAT margins of the sample firms. But there is a negative
correlation between Shareholders’ Return and PBT margin.
4.16 Correlation between Shareholders’ Return and Matrix of Profitability Ratio
0.014
0.018
-0.031
0.011
EARNINGS BEFORE
INTEREST, TAXES,
DEPRECIATION &
AMORTIZATION (EBITDA)
EARNINGS BEFORE
INTEREST (EBIT)
PROFIT BEFORE TAX (PBT) PROFIT AFTER TAX (PAT)

7/23/2019 A study on determinants of Shareholders’ Return with special reference to BSE 500 companies
http://slidepdf.com/reader/full/a-study-on-determinants-of-shareholders-return-with-special-reference-to 50/73
Table 4.17
Correlation between Shareholders’ Return and Investment Utilization Ratio
Asset Turnover Shareholders' Return (%)
Asset Turnover 1
Shareholders'
Return (%) 0.190 1
From Table 4.17 it can be inferred that the asset turnover is positively correlated with
Shareholders’ Return.
4.17 Correlation between Shareholders’ Return and Matrix of Investment Utilization Ratio
Table 4.18
Correlation between Shareholders’ Return and Dividend Ratio Dividend Payout Ratio Shareholders' Return (%)
Dividend Payout Ratio 1
Shareholders' Return
(%) -0.056 1
In table 4.18 we have shown correlation between Shareholders’ Return and Dividend
Ratio. It can be inferred that there is a negative correlation between the shareholders’
return and Dividend Payout Ratio.
0.19
ASSET TURNOVER

7/23/2019 A study on determinants of Shareholders’ Return with special reference to BSE 500 companies
http://slidepdf.com/reader/full/a-study-on-determinants-of-shareholders-return-with-special-reference-to 51/73
4.18 Correlation between Shareholders’ Return and Dividend Payout Ratio
Table – 4.19
In Table – 4.19 we have shown correlation between shareholders’ return and variables
of financial condition ratio. We can observe from the data that shareholders’ return is
negatively correlated with current ratio and quick ratio. Whereas it is positively
correlated with debt/equity ratio.
4.19 Correlation between Shareholders’ Return and Financial Condition Ratio
-0.056
DIVIDEND PAYOUT
RATIO
-0.026
-0.084
0.005
-0.029CURRENT RATIO QUICK RATIO DEBT/EQUITY RATIO INTEREST COVER
RATIO
Correlation between Shareholders’ Return and Financial Condition Ratio
Current
Ratio Quick Ratio
Debt/Equity
Ratio
Interest
Cover
Ratio
Shareholder
s' Returns
(%)
Current Ratio 1
Quick Ratio 0.868 1
Debt/Equity Ratio -0.063 -0.055 1
Interest Cover
Ratio 0.021 0.040 -0.077
1
Shareholders'
Returns (%) -0.026 -0.084 0.005 -0.029 1

7/23/2019 A study on determinants of Shareholders’ Return with special reference to BSE 500 companies
http://slidepdf.com/reader/full/a-study-on-determinants-of-shareholders-return-with-special-reference-to 52/73
Table 4.20
Correlation between Shareholders’ Return and Working Capital Ratio
Days'
Receivable
Days'
Inventory
Days'
Payable
Cash
Conversion
Cycle
Shareholders
' Return (%)
Days'Receivable 1
Days'
Inventory 0.278 1
Days' Payable 0.082 0.019 1
Cash
Conversion
Cycle 0.190 0.471 -0.863 1
Shareholders'
Return (%) -0.159 -0.094 -0.077 0.003 1
From Table 4.20 we observe that shareholders’ return is negatively correlated with thevariables of days’ receivable, days’ inventory, and days’ payable and positively
correlated with cash conversion cycle. These results are consistent with the view that
the shorter the period between production and sales of products the larger is the firm’s
profitability and thereby the returns to the shareholders. But the number of days of
payable is supposed to have a positive correlation as increase in days’ payables releases
more funds in the hands of the organization which is supposed to get resulted in higher
accounting profits and thereby higher shareholders returns. Shareholders return is
negatively correlated with days’ inventory relating the conceptual understanding of
increased day’s inventory getting resulted in decreased accounting profits and thereby
decreased shareholder return.
4.20 Correlation between Shareholders’ Return and Working Capital Ratio
-0.159
-0.094
-0.077
0.003
DAYS' RECEIVABLE DAYS' INVENTORY DAYS' PAYABLE CASH CONVERSION
CYCLE
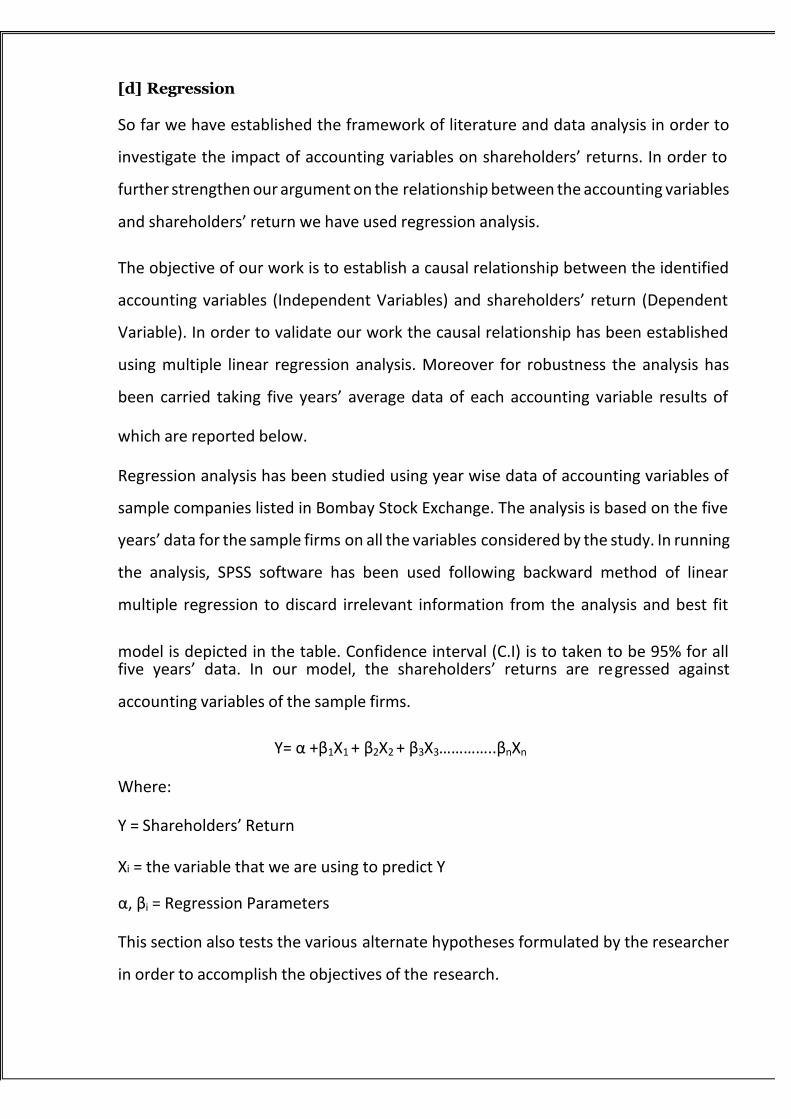
7/23/2019 A study on determinants of Shareholders’ Return with special reference to BSE 500 companies
http://slidepdf.com/reader/full/a-study-on-determinants-of-shareholders-return-with-special-reference-to 53/73
[d] Regression
So far we have established the framework of literature and data analysis in order to
investigate the impact of accounting variables on shareholders’ returns. In order to
further strengthen our argument on the relationship between the accounting variables
and shareholders’ return we have used regression analysis.
The objective of our work is to establish a causal relationship between the identified
accounting variables (Independent Variables) and shareholders’ return (Dependent
Variable). In order to validate our work the causal relationship has been established
using multiple linear regression analysis. Moreover for robustness the analysis has
been carried taking five years’ average data of each accounting variable results of
which are reported below.
Regression analysis has been studied using year wise data of accounting variables of
sample companies listed in Bombay Stock Exchange. The analysis is based on the five
years’ data for the sample firms on all the variables considered by the study. In running
the analysis, SPSS software has been used following backward method of linear
multiple regression to discard irrelevant information from the analysis and best fit
model is depicted in the table. Confidence interval (C.I) is to taken to be 95% for allfive years’ data. In our model, the shareholders’ returns are regressed against
accounting variables of the sample firms.
Y= α +β1X1 + β2X2 + β3X3…………..βnXn
Where:
Y = Shareholders’ Return
Xi = the variable that we are using to predict Y
α, βi = Regression Parameters
This section also tests the various alternate hypotheses formulated by the researcher
in order to accomplish the objectives of the research.
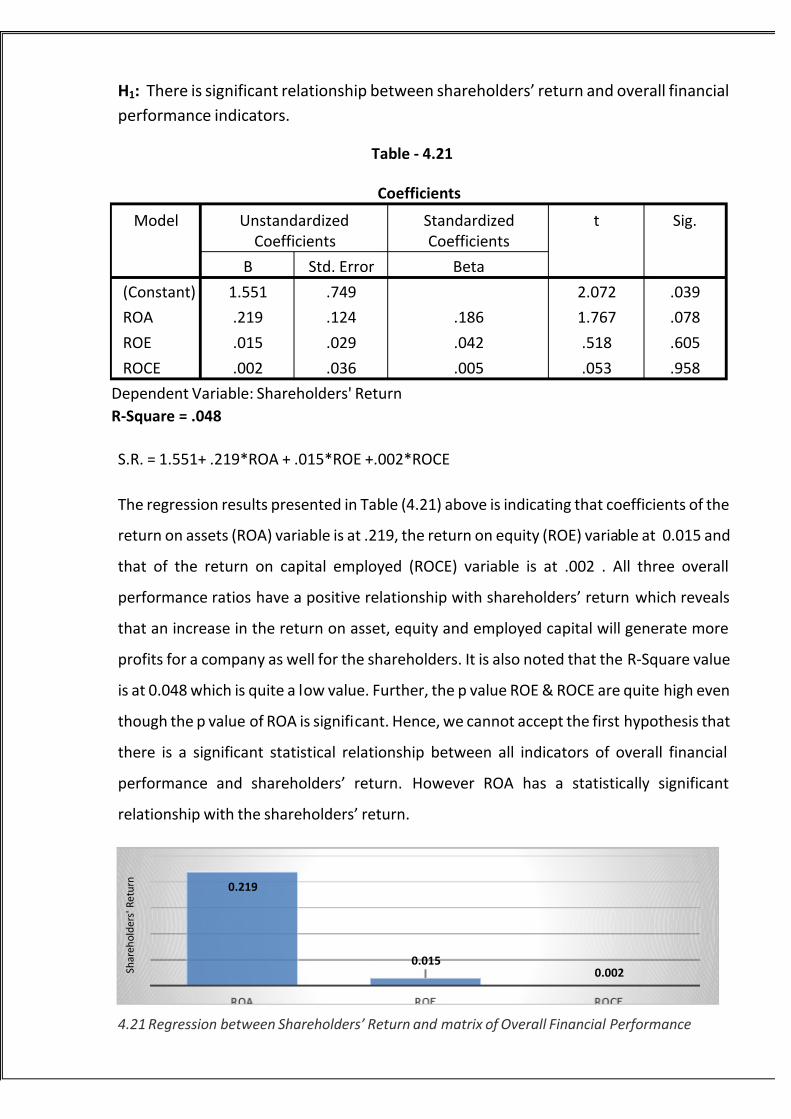
7/23/2019 A study on determinants of Shareholders’ Return with special reference to BSE 500 companies
http://slidepdf.com/reader/full/a-study-on-determinants-of-shareholders-return-with-special-reference-to 54/73
H1: There is significant relationship between shareholders’ return and overall financial
performance indicators.
Table - 4.21
Coefficients
Model Unstandardized
Coefficients
Standardized
Coefficients
t Sig.
B Std. Error Beta
(Constant) 1.551 .749 2.072 .039
ROA .219 .124 .186 1.767 .078
ROE .015 .029 .042 .518 .605
ROCE .002 .036 .005 .053 .958
Dependent Variable: Shareholders' Return
R-Square = .048
S.R. = 1.551+ .219*ROA + .015*ROE +.002*ROCE
The regression results presented in Table (4.21) above is indicating that coefficients of the
return on assets (ROA) variable is at .219, the return on equity (ROE) variable at 0.015 and
that of the return on capital employed (ROCE) variable is at .002 . All three overall
performance ratios have a positive relationship with shareholders’ return which reveals
that an increase in the return on asset, equity and employed capital will generate more
profits for a company as well for the shareholders. It is also noted that the R-Square value
is at 0.048 which is quite a low value. Further, the p value ROE & ROCE are quite high even
though the p value of ROA is significant. Hence, we cannot accept the first hypothesis that
there is a significant statistical relationship between all indicators of overall financial
performance and shareholders’ return. However ROA has a statistically significant
relationship with the shareholders’ return.
4.21 Regression between Shareholders’ Return and matrix of Overall Financial Performance
0.219
0.0150.002 S
h a r e h o l d e r s ' R e t u r n

7/23/2019 A study on determinants of Shareholders’ Return with special reference to BSE 500 companies
http://slidepdf.com/reader/full/a-study-on-determinants-of-shareholders-return-with-special-reference-to 55/73
H2: There is significant relationship between shareholders’ return and indicators of
profitability ratio.
Table - 4.22
Coefficients Model Unstandardized
Coefficients
Standardized
Coefficients
t Sig.
B Std. Error Beta
(Constant) 3.473 .550 6.316 .000
EBITDA .000 .005 .003 .042 .967
EBIT .001 .004 .015 .187 .852
PBT -.001 .002 -.032 -.505 .614
PAT .000 .003 .004 .060 .952
Dependent Variable: Shareholders' Return
R-Square = .001
S.R. = 3.473+ .000*EBITDA + .001*EBIT -.001*PBT+.000*PAT
The regression equation shows that there is a positive relationship between EBITDA, EBIT
& PAT margin and shareholders’ return which is consistent with the view that increase in
earnings of companies will lead to increase in shareholders’ return. The table above
indicates the coefficients of the EBITDA at .000, EBIT at .001, PAT at .000 and PBT at -.001.
PBT margin has a negative coefficient indicating a negative relationship with the
shareholders’ return. It is also noted that the R-Square value is at 0.001 which is a very
low value. Further the p value of all the profitability ratios is quite higher and hence, we
cannot accept the second hypothesis that there is a significant statistical relationship
between the variables of profitability ratios and shareholders’ return.
4.22 Regression between Shareholders’ Return and matrix of Profitability Ratio
00.001
-0.001
0
EBITDA EBIT PBT PAT
Series1 Series2

7/23/2019 A study on determinants of Shareholders’ Return with special reference to BSE 500 companies
http://slidepdf.com/reader/full/a-study-on-determinants-of-shareholders-return-with-special-reference-to 56/73
H3: There is significant relationship between shareholders’ return and investment
utilization matrix.
Table - 4.23
Coefficients
Model Unstandardized
Coefficients
Standardized
Coefficients
t Sig.
B Std. Error Beta
(Constant) 1.320 .862 1.532 .127
Asset
Turnover2.207 .709 .190 3.113 .002
Dependent Variable: Shareholders' Return
R-Square = .036
S.R. = 1.320+ 2.207*Asset Turnover
The regression results presented in Table (4.3) above is indicating that the coefficient
of the asset turnover is at 2.207 which indicates a positive relationship between asset
turnover and shareholders’ returns which insists the fact that growth in asset turnover
generates higher income to shareholders. It is also noted that the R-Square value is
0.036. The p value of the variable is 0.002 and hence, we can accept the third
hypothesis that there is a statistically significant relationship between asset turnoverand shareholders’ return.
4.23 Regression between Shareholders’ Return and matrix of Investment Utilization Ratio
2.207
ASSET TURNOVER
S h a r e h o l d
e r s ' R e t u r n

7/23/2019 A study on determinants of Shareholders’ Return with special reference to BSE 500 companies
http://slidepdf.com/reader/full/a-study-on-determinants-of-shareholders-return-with-special-reference-to 57/73
H4: There is significant relationship between shareholders’ return and investment
utilization matrix.
Table - 4.24
Coefficients Model Unstandardized
Coefficients
Standardized
Coefficients
t Sig.
B Std. Error Beta
(Constant) 3.826 .649 5.896 .000
Dividend Payout
Ratio-.014 .015 -.056 -.895 .372
Dependent Variable: Shareholders' ReturnR-Square = .003
S.R. = 3.826 - .014* Dividend Payout Ratio
From the regression equation it can be observed that the coefficient of dividend
payout ratio is at -.014. There is a negative relationship between dividend payout ratio
and shareholders’ return which is consistent with the view that market observers often
view low dividend payout as a signal for high future earnings growth. The rationale is
that companies pay fewer dividends or retain more earnings when growth
opportunities are ample so low payout indicates the possibility of a strong future
earnings growth. The value of R square is 0.003 which is very low and the variable’s p
value is higher and hence, we cannot accept the fourth hypothesis that there is a
significant statistical relationship between dividend payout ratio and shareholders’
return.
4.24 Regression between Shareholders’ Return and Dividend Payout Ratio
-0.014
DIVIDEND PAYOUT RATIO

7/23/2019 A study on determinants of Shareholders’ Return with special reference to BSE 500 companies
http://slidepdf.com/reader/full/a-study-on-determinants-of-shareholders-return-with-special-reference-to 58/73
H5: There is significant relationship between shareholders’ return and financial
condition matrix.
Table - 4.25
Coefficients
Model Unstandardized
Coefficients
Standardized
Coefficients
t Sig.
B Std. Error Beta
(Constant) 3.576 .627 5.701 .000
CR .302 .198 .191 1.526 .128
QR -.445 .224 -.249 -1.985 .048
D/E -.002 .219 -.001 -.010 .992
Interest Cover .000 .001 -.022 -.350 .727
Dependent Variable: Shareholders' Return
R-Square = .017
S.R. = 3.576 + .302*CR - .445*QR -.002*D/E + .000*Interest Cover
The regression results presented in Table (4.5) above is indicating that the coefficients
of the Current Ratio is .302, of quick ratio is -.445, of D/E ratio is -.002 and of interest
cover ratio is .000. We can see that there is positive relationship of Current ratio and
of Interest Cover ratio with Shareholders’ return. And Quick ratio and D/E ratio are
negatively related with shareholders’ return. Current ratio being positively related
with shareholders’ return indicates that the higher the current ratio & interest cover
ratio, the more capable the company is of paying its obligations.
However, quick ratio and debt-equity ratio are having negative relationship with
shareholders ‘return which is indicated by their negative coefficient sign. Quick ratio
having negative relationship with shareholders’ return is contradictory to the
conceptual relationship it has with shareholders’ return.
It is also noted that the R-Square value is 0.017 and all the ratios except quick ratio
have a significant p value and hence, we cannot accept the fifth hypothesis that all the
indicators of the financial condition are significantly related with shareholders’ return.

7/23/2019 A study on determinants of Shareholders’ Return with special reference to BSE 500 companies
http://slidepdf.com/reader/full/a-study-on-determinants-of-shareholders-return-with-special-reference-to 59/73
However, the p-value for QR (-.445) is lower than the common alpha level of 0.05
which indicates that QR is statistically significant.
4.25 Regression between Shareholders’ Return and Financial Condition Ratio
H6: There is significant relationship between shareholders’ return and measures of
working capital ratio.
Table - 4.26
Coefficients
Model Unstandardized
Coefficients
Standardized
Coefficients
t Sig.
B Std. Error Beta
(Constant) 5.270 .819 6.437 .000
Days' Receivable -.027 .012 -.149 -2.319 .021
Days' Inventory -.005 .004 -.087 -1.219 .224
Cash Conversion
Cycle.002 .002 .073 1.040 .300
Dependent Variable: Shareholders' ReturnR-Square = .032
Table - 4.27
Excluded Variablesa
Model Beta In t Sig. Partial
Correlation
Collinearity Statistics
Tolerance
0.302
-0.445
-0.002
0
CR QR D/E INTEREST COVER
S h a r e h o l d e r s ' R e t u r n

7/23/2019 A study on determinants of Shareholders’ Return with special reference to BSE 500 companies
http://slidepdf.com/reader/full/a-study-on-determinants-of-shareholders-return-with-special-reference-to 60/73
Days'
Payable-98.184b -.489 .625 -.031 9.404E-008
a. Dependent Variable: Shareholders' Return
b. Predictors in the Model: (Constant), Cash Conversion Cycle, Days' Receivable,
Days' Inventory
S.R. = 5.270 - .027* Days’ Receivable -.005*Days’ Inventory+.002*CCC
From the regression equation it can be observed that the coefficient of Days’
receivable, Days’ Inventory & Cash Conversion Cycle is at -.027, -.005 & .002
respectively. We can see that the days’ receivable ratio is negatively related with the
shareholders’ return and there is a statistically significant relationship between days’
receivable and shareholders’ return [ as its p value is less ]which is consistent with the
view that over-investment in accounts receivable can be costly and can negatively
affect companies and its shareholders. It can be observed from the table 4.7 that
model has excluded days’ payable as this variable is highly correlated with other
variables. Value of R square is 0.032 which is quite low and the p value of days
inventory and ccc are quite high and hence we cannot accept the hypothesis which
states that there is a significant relationship between shareholders’ return and
measures of working capital of the sample firms
4.26 Regression between Shareholders’ Return and Working Capital Ratio
-0.027
-0.005
0.002
1 2 3
Days' Receivable Days' Inventory Cash Conversion Cycle

7/23/2019 A study on determinants of Shareholders’ Return with special reference to BSE 500 companies
http://slidepdf.com/reader/full/a-study-on-determinants-of-shareholders-return-with-special-reference-to 61/73
Chapter 5: Findings and Inferences
7/23/2019 A study on determinants of Shareholders’ Return with special reference to BSE 500 companies
http://slidepdf.com/reader/full/a-study-on-determinants-of-shareholders-return-with-special-reference-to 62/73
5. Findings and Inferences
This chapter presents the major findings and inferences made by the researcher based
on the results of the data analysis performed for the collected data
1. The average shareholders’ return of the sample firms was at 3.47% which is slightly
higher than the median for the variable at 2.45%.
2. The mean for ROIC, ROE and ROA is at 18.18%, 15.11% and 7.61% respectively and
the standard deviation of the said variables is at 22.42%, 23.50% and 7.11%. The
median for these variables is at 15.90%, 15.75% and 6.33%. ROIC is in the range
between -240.10% and 148.63%. ROE is in the range between -174.92% and
116.98%. And ROA is in the range between -26.37% and 30.75% for the sample
firms.
3. The mean of sample firms’ EBITDA, EBIT, PBT and PAT margins is at 34.73%,
47.03%, 32.90% and 36.61% respectively. Median of EBITDA, EBIT, PBT and PAT is
at 17.16%, 19.10%, 12.05% and 19.33%. Range of EBITDA is between -143.87% to2101.94%. Range of EBIT is between -852.11% and 1923.89%. Range of PBT is
between -101.45% and 2976.94%. Range of PAT is between -1480% and 1263.57%.
Standard deviation is the lowest for the EBITDA margin while it is the highest for
the PBT margin of the sample firms.
4.
The sample firms’ average turnover on asset is 0.97 times with maximum
observation of 4.18 times and a minimum observation of zero times. The sample
firms have a standard deviation of 0.722.
5. It is observed that an average of 25% dividend has been paid to the shareholders
with maximum observed payout ratio of 400%. It can be seen that the median

7/23/2019 A study on determinants of Shareholders’ Return with special reference to BSE 500 companies
http://slidepdf.com/reader/full/a-study-on-determinants-of-shareholders-return-with-special-reference-to 63/73
payout ratio of the sample firms is at 21.69% which is close to the mean payout
ratio. The standard deviation for the sample firms is at 33.67% on this metric.
6. The sample firms have average current assets that are about 2.59 times to pay the
current liabilities with a maximum of 59 times and a minimum of 0.27 times.
7. The firms’ ability to meet their short-term obligations with its most liquid assets is
at 2 times with a median quick ratio of 1.1 times with a maximum of 59 times and
a minimum of 0.24 times.
8. The sample firms have an average debt-equity ratio of 0.82 times and the ratio
ranges between -4.80 times and 33.63 times. The firms’ average interest coverage
ratio is 132 times with a maximum observation of 4927 times and a minimum
observation of -549 times.
9. The average outstanding days with the customers of the sample firms are about 55
days whereas the average due days to the suppliers by the sample firms are 80
days. It is also inferred that the sample firms have an average day’s inventory isaround 78 days. The five year average cash conversion cycle of the sample firms is
at 52 days.
10. Three out of five years has given positive returns and two of the five years has given
a negative SHR to the shareholders of the sample firms during the period of
observation. The average shareholders’ return for the sample firms is at 9.44%
which has fallen down to a negative 13.50% in the second year and it has gone up
in the third year to 25%. The SHR of the firms has gone down to a negative 9.84%
in year 4 and then in fifth year it has increased to 6.20%.

7/23/2019 A study on determinants of Shareholders’ Return with special reference to BSE 500 companies
http://slidepdf.com/reader/full/a-study-on-determinants-of-shareholders-return-with-special-reference-to 64/73
11. All the three overall performance variables namely ROIC, ROE and ROA have the
fluctuating trend during the study period. The average ROIC of the sample firms
slightly comes down [by 0.20%] in the year 2011 compared to 2010 and it goes
down further in the year 2012 [from 17.34% to 14.89%].The average ROIC of the
firms increase in the year 2013 while compared to that of 2012[from 14.89% to
20.63%]. The average of this variable comes down in the year 2014 in comparison
to the 2013 figure [from 20.63% to 20.53%].
12. The average ROE comes down [from 16.62% to 10.50%] in the year 2011 as
compared to 2010 and then its average goes up to 12.16% from 10.50% in the FY
2012. And then the average ROE increased to 16.64% in FY 2013 and it increased
further to 19.66% in FY 2014.
13. The ROA came down to 6.85% in the FY 2011 as compared to FY 2010[at 7.01%]
and then it went up to 7.07% in FY 2012. This figure has gone up further in FY 2012
and then came down to 8.46% in FY 2014.
14.
All the profitability ratios are observed to be having a fluctuating trend in the fiveyears period of time considered by the study.
15. The Asset Turn ratio has a fluctuating trend during the period of the study.
16. The dividend payout ratio of the sample firms is in the fluctuating trend during FY
2010 to FY 2014.
17. Among the financial condition ratios, the current ratio has an increasing trend
during the five years considered by the study. The Interest Cover ratio has a
decreasing trend during this period while the quick ratio and the Debt to Equity
ratio of the sample firms have shown a fluctuating trend.

7/23/2019 A study on determinants of Shareholders’ Return with special reference to BSE 500 companies
http://slidepdf.com/reader/full/a-study-on-determinants-of-shareholders-return-with-special-reference-to 65/73
18. All the three components of the cash conversion cycle have shown a fluctuating
trend while the cash conversion cycle has exhibited a decreasing trend during the
study period.
19. There is a very low degree of positive correlation between shareholders’ return
and the overall performance ratios i.e. ROIC, ROE and ROA.
20. The shareholders’ Return is positively correlated with EBITDA, EBIT and PAT
margins of the sample firms. But there is a negative correlation between
Shareholders’ Return and PBT margin.
21. The asset turnover is positively correlated with Shareholders’ Return. It can be
inferred that there is a negative correlation between the shareholders’ return and
Dividend Payout Ratio of the sample firms.
22. The shareholders’ return is negatively correlated with current ratio and quick ratio
whereas it is positively correlated with debt/equity ratio and the interest coverageratio.
23. The shareholders’ return is negatively correlated with the days’ receivable, days’
inventory, and days’ payable and positively correlated with cash conversion cycle
of the sample firms.
24.
All three overall performance ratios have a positive relationship with shareholders’
return which reveals that an increase in the return on asset, equity and employed
capital will generate more profits for a company as well for the shareholders. There
is no significant statistical relationship between all indicators of overall financial

7/23/2019 A study on determinants of Shareholders’ Return with special reference to BSE 500 companies
http://slidepdf.com/reader/full/a-study-on-determinants-of-shareholders-return-with-special-reference-to 66/73
performance and shareholders’ return. However ROA has a statistically significant
relationship with the shareholders’ return.
25. There is a positive relationship between EBITDA, EBIT & PAT margin of the sample
firms and the shareholders’ return which is consistent with the view that increase
in earnings of companies will lead to increase in shareholders’ return.
26. The PBT margin of the sample firms has a negative coefficient indicating a negative
relationship with the shareholders’ return. However there is no significant
statistical relationship between the variables of profitability ratios and
shareholders’ return.
27. There is a positive relationship between the asset turnover of sample firms and the
shareholders’ returns which insists the fact that growth in asset turnover generates
higher income to shareholders. However there is no statistically significant
relationship between asset turnover of the sample firms and shareholders’ return.
28.
There is a negative relationship between dividend payout ratio and shareholders’return which is consistent with the view that market observers often view low
dividend payout as a signal for high future earnings growth. The rationale is that
companies pay fewer dividends or retain more earnings when growth
opportunities are ample so low payout indicates the possibility of a strong future
earnings growth. However, there is no significant statistical relationship between
dividend payout ratio and shareholders’ return.
29. There is positive relationship of Current ratio and of Interest Cover ratio with
Shareholders’ return. And Quick ratio and D/E ratio are negatively related with
shareholders’ return. The indicators of the financial condition are not significantly
related with shareholders’ return.

7/23/2019 A study on determinants of Shareholders’ Return with special reference to BSE 500 companies
http://slidepdf.com/reader/full/a-study-on-determinants-of-shareholders-return-with-special-reference-to 67/73
Chapter 6: Conclusion and Scope for Further Research

7/23/2019 A study on determinants of Shareholders’ Return with special reference to BSE 500 companies
http://slidepdf.com/reader/full/a-study-on-determinants-of-shareholders-return-with-special-reference-to 68/73
This chapter concludes on the research work and spells out the possible
areas for future research work.
This study examines the determinants of shareholders’ return with special reference
to 260 sample firms of Bombay Stock Exchange. The analyses are performed using data
derived from ACE Equity Software for five financial years (AY 2010 to 2014). The
analysis of relationship between the shareholders’ return and the accounting
performance measures [independent variables ]such as ROE, ROCE, EBITDA, EBIT, PAT,
D/E Ratio, Cash Conversion Cycle indicates a positive but no statistically significant
relationship between SHR and these accounting variables. This research work shows
that there is statistically significant relationship between the accounting variables such
as days’ receivable, Quick Ratio, Asset Turnover, Return on Asset of the sample firms
and the Shareholders’ return. This study adds value to the existing body of literature
(Deloof) who found the negative relationship between profitability and number of
days of accounts receivable, inventories and accounts payable of Belgian firms for the
period1992-1996. The negative relationship between accounts receivables and firms'
profitability suggests that profitable firms will pursue a decrease of their accounts
receivables in an attempt to reduce their cash gap in the cash conversion cycle. The
research supports the findings of Lamberson(1995), Singh &Pаndеy (2008) who
insisted on good asset management in order to generate income to shareholders.
This study reveals that shareholders returns are positively related with return on asset
which is supportive for the findings of AL Khalayleh (2001) who concluded that there
is significant positive relationship between the market price per share with the ratios
of return on assets and return on equity.
SCOPE FOR FURTHER RESEARCH
Further studies can be carried out on

7/23/2019 A study on determinants of Shareholders’ Return with special reference to BSE 500 companies
http://slidepdf.com/reader/full/a-study-on-determinants-of-shareholders-return-with-special-reference-to 69/73
- The impact of accounting performance measures of companies operating in
different industries and shareholders’ return
- The impact of size of the firm on the relationship between the accounting
performance variables and the shareholders’ return
-
The relationship between the relative valuation multiples and the shareholders’
return
- The role of macroeconomic variables in determining the relationship between the
accounting performance measures and the shareholders’ return
BIBLIOGRAPHY
1. I M Pandey Financial Management (1978)
2. Dobson, John. Is Shareholder Wealth Immoral? Financial Analysts Journal, (Sep/Oct
1999)
3. Robert N Anthony, David F Hawkins, Kenneth A Merchant. Accounting (Text and
Cases 2007)
4. Rashty Josef, O Shaughnessy John. Restricted Stock Units and The Calculation of
Basic and Diluted Earnings Per Share, The CPA Journal (Jun 2011)
5. Deloof, M. Does Working Capital Management Affect Profitability of Belgian Firms?
Journal or Business Finance & Accounting (3 & 4: 2003)
6. John Sagan, Towards a Theory of Working Capital Management, The Journal of
Finance, May 1955
7. Lazaridis Ioannis, K. Lyroudi, Short-term Financial Management of the Business in
Greece and in Cyprus. Business and Economics Society International (2000)
8.
Mathuva, D. The influence of Working Capital Management components on
Corporate Profitability : a survey on Kenyan Listed Firms, Research Journal of
Business Managmeent, Vol. 4 No. 1 (2009)
9. Shin. H. H. and Soenen, L Efficiency of Working Capital Management and Corporate
Profitability. Financial Practice and Education (2: 1998)

7/23/2019 A study on determinants of Shareholders’ Return with special reference to BSE 500 companies
http://slidepdf.com/reader/full/a-study-on-determinants-of-shareholders-return-with-special-reference-to 70/73
10. Wang, Y. J. Liquidity Management, Operating Performance, and Corporate Value:
evidence from Japan and Taiwan , Journal of Multinational Financial Management,
Vol. 12 No. 2 (2002)
11. Ansar Irtaza, Butt Arslan Ali, Shah Syed, Basit Hussain. Impact of Dividend Policy on
Shareholders’ Wealth, International Review of Management and Business
Research (Mar 2015)
12. Thanh Truong, Richard Heaney. Largest shareholder and dividend policy around
the world (2007)
13. Amos O. Arowoshegbe & Francis Kehinde Emen. Shareholders’ Wealth and Debt-
Equity Mix of Quoted Companies in Nigeria (January, 2014)
14. Deloof, M .Does Working Capital Management Affect Profitability of Belgian Firms?
Journal or Business Finance & Accounting (3 & 4: 2003)
15. Falope, O.I. and Ajilore, O.T. Working capital management and corporate
profitability: evidence from panel data analysis of selected quoted companies in
Nigeria, Research Journal of Business Management, Vol. 3 No. 3 (2009)
16. García-Teruel, P.J. and Martínez-Solano, P. Effects of working capital management
on SME profitability, International Journal of Managerial Finance, Vol. 3 No. 2
(2007)17. The Miller and Modigliani Distributions, the UK Companies Act of 2006, dividend
irrelevance argument (1961)
18. Robert N. Anthony, David F Hwakins, Kennet A Merchant. Accounting Text and
Cases (2011)
19. Majid Kabajeh Dr. Majed Abdel, Ahmed AL Nu’aimat Dr. Said Mukhled, Dr. Firas
Naim Dahmash. The Relationship between the ROA, ROE and ROI Ratios with
Jordanian Insurance Public Companies Market Share Prices (June 2012)
20. Friederike Wall, Dorothea Greiling. Accounting information for managerial
decision-making in shareholder management versus stakeholder management
(2011)

7/23/2019 A study on determinants of Shareholders’ Return with special reference to BSE 500 companies
http://slidepdf.com/reader/full/a-study-on-determinants-of-shareholders-return-with-special-reference-to 71/73
21. Aswath Damodaran, Return on Capital (ROC), Return on Invested Capital (ROIC)
and Return on Equity (ROE): Measurement and Implications (2007)
22. Ping Zhou, CFA, William Ruland. Dividend Payout and Future Earnings Growth
(2006)
23.
Abdulrahman Ali Al-Twaijry. Dividend policy and payout ratio: evidence from
the Kuala Lumpur stock exchange
24.
Gordon, M. (1959), “Dividends, earnings and stock prices”, Review of
Economics and Statistics,Vol. 41, pp. 99-105
25.
Miller, M. and Modigliani, F. (1961), “Dividend policy, growth, and the
valuation of shares”, Journal of Business, Vol. 34 No. 4, pp. 411-33
26.
Soenen, L. 1993. “Cash Conversion Cycle and Corporate Profitability.” Journal
of Cash Management 13(4):53-57.
27. Arnott, R. and Asness, C. (2003), “Surprise! Higher dividends – higher earnings
growth”, Financial Analysts Journal, Vol. 59 No. 1, pp. 70-87
28.
Baker, H. and Powell, G. (2000), “Determinants of corporate dividend policy: a
survey of NYSE firms”, Financial Practices & Education, Spring/Summer, pp.
29-40
29. Abu Shanab, S.A, “The Impact of Returns and Risks on share prices”, An
Applied Study on Industrial Corporations listed at Amman Stock Exchange,
unpublished Doctorate Thesis, Arab Amman University For Higher Studies,
Amman, Jordan, 2008
30.
AL Khalaileh, M. “The Relationship between Accounting Performance Indexes
and Market Performance Indexes”, An Applied Study on Listed Corporations at
Amman Security Exchange, Administrative Sciences Studies Magazine, Jordan
University, Amman, issue 1, 200131.
Asquith, P., & Mullins, D. W. (1983). "The Impact of Initiating Dividend
Payments on Shareholders' Wealth". Journal of Business , 1 (46), 77-96
32. Black, F., & Scholes, M. (1974). "The Effects of Dividend Yield and Dividend
Policy on Common Stock Prices and Returns". Journal of Financial Economics,
1 (1), 1-22.

7/23/2019 A study on determinants of Shareholders’ Return with special reference to BSE 500 companies
http://slidepdf.com/reader/full/a-study-on-determinants-of-shareholders-return-with-special-reference-to 72/73
33.
Montgomery. D. C. and Peck. E. A.. Introduction to Linear Regression Analysis
(1982)
34.
Lind, L., Pirttilä, M., Viskari, S., Schupp, F. and Kärri, T. Working capital
management in the automotive industry: financial value chain analysis, Journal
of Purchasing and Supply Management, Vol. 18 No. 2 (2012)
35.
Jose, M., Lancaster, C. and Stevens, J. Corporate returns and cash conversion
cycles, Journal of Economics and Finance, Vol. 20 No. 1 (1996)
36.
Abu Hashish, K. “The Role of Published Accounting Information in Predicting
of Stock Prices”, An Applied Study on Listed Corporations on Amman Stock
Exchange , Al Basa’er Magazine/ Petra University, Amman, issue 2, 2003.
37. AL Kurdi, A. “The Ability Range of Published Accounting Inf ormation on Stock
Prices Prediction: An Applied Study on Public Shareholding Corporations on
Amman Security Exchange, unpublished Doctorate Thesis, Arab Academy for
Financial and Banking Sciences, Amman, Jordan, 2005.
38.
Alfred Rappaport(1986).Creating Shareholder Value, The New Standard for
Business performance; The Free Press.
39.
Aswath Damodaran(1998). Value Creation and Enhancement: Back to the
future; Working paper series; Stern School of Business
40.
Bacidore, Jeffrey M, Boquist, John A, Milbourn, Todd T, Thakor, Anjan
V.(1997). The search for the best financial performance measure; Financial
Analysts Journal Charlottesville, p 11-20
41.
Banerjee, Ashok(1999). Economic Value Added and shareholder wealth : An
Empirical examination; Paradigm, Vol. 3 No.1, p 99-133.
42.
Howorth, C., and P. Westhead. 2003. “The Focus of Working Capital
Management in UK Small Firms.” Management Accounting Research 14(2): 94-
111.
43.
Jose, M., C. Lancaster, and J. Stevens. 1996. “Corporate Returns and Cash
Conversion Cycles.” Journal of Economics and Finance 20(1): 33-47.
7/23/2019 A study on determinants of Shareholders’ Return with special reference to BSE 500 companies
http://slidepdf.com/reader/full/a-study-on-determinants-of-shareholders-return-with-special-reference-to 73/73
44.
Padachi, K. 2006. “Trends in Working Capital Management and its Impact on
Firms’ Performance: An Analysis of Mauritian Small Manufacturing Firms.”
International Review of Business Research Papers 2(2): 45-58.
45. Wang, Y. 2002. “Liquidity Management, Operating Performance, and Corporate
Value: Evidence from Japan and Taiwan.” Journal of Multinational Financial
Management 12(2): 159-169.
46.
Pruitt, S. and Gitman, L. (1991), “The interactions between the investment,
financing, and dividend decisions of major US firms”, Financial Review, Vol.
26 No. 3, pp. 409-30. JRF 8,4 362
47.
Gwilym, O., Seaton, J., Suddason, K. and Thomas, S. (2006), “International
evidence on the payout ratio, earnings, dividends, and returns”, Financial
Analysts Journal, Vol. 62 No. 1, pp. 36-53.
48.
Fama, F. (1974), “The empirical relationship between the dividend and
investment decisions of firms”, American Economic Review, Vol. 64 No. 3, pp.
304-18.
49.
Ksenija Denčić-Mihajlov. Impact of accounts receivable management on the
profitability during the financial crisis: evidence from Serbia
UDC:658.155(497.11)
50.
Burkart, M., Denis, G., & Panunzi, F. (1997). Large shareholders, monitoring
and the value of the firm. The quarterly journal of economics, 112(3), 693-72.