a study on customers perception towards online trading...
TRANSCRIPT
Vol-3 Issue-6 2017 IJARIIE-ISSN(O)-2395-4396
6939 www.ijariie.com 246
A STUDY ON CUSTOMERS PERCEPTION
TOWARDS ONLINE TRADING IN RETAIL
BROKERAGE ,CHENNAI.
1V.PAVITHRAS,MBA, Student,Saveetha School of Management.
2Mr.WILLIAM ROBERT,Asst.prof,Saveetha School of Management.
ABSTRACT
The study entitles Customers Perception towards online trading in Retail Brokerage . The objective is to study the
impact of the Customers perception towards online trading. To study the influence of stock and investment strategies
in Retail Brokerage . To study the influence of demographic profile on investors perception on online trading.
Primary data is collected from structured questionnaire with 100 respondents. Descriptive research design is used
in this study. Primary data is collected from convince sampling technique. The collected data is been classified and
tabulated and analyzed using tools such as percentage analysis, H -test (Kruskal-wallis) (Mann Whitney U test).
From this study customer perception of Online Trading, its inferred that in gender level of investors, 60% belongs to
male. Occupation of investors are been classified as private sector 70%,.Education qualification of customers is
UG-70%. There is no significant difference between the Gender with respect to preference of attributes of share
trading company. There is no significant difference among the Occupations, Educational qualification with respect
to preference of attributes of share trading company. Customers invest in mutual funds as its risk is low and returns
are more rather than bonds and shares. Online trading is been preferred by customers rather than Offline trading.
Major reason for customers to invest in online trading is its conveyance and user friendly.
KEY WORDS: CUSTOMERS PERCEPTION, ONLINE TRADING.
INTRODUCTION
Conceptually the mechanism of stock market is very simple. People who are exposed to the same risk come together
and agree that if anyone of the person suffers a loss the other will share the loss and make good to the person who
lost. We also here observe the Customer’s Perception towards Online Trading and its related procedures. The Initial
part of the project focuses on the sales of types of the products of the company, Further the project tells us about the
profile of the company ( RETAIL BROKERAGE ). It provides knowledge about the company’s history, mission,
vision and customer base and about the company in detail and management of the company. Also it gives special
emphasis on the selling of products and management of the company. This project will help the people in getting lot
of their answers related to investment options and the ways to analysis the market. The data in the project can also
help the company in making the strategy for potential investor’s.
OBJECTIVE OF STUDY
To study the customers perception towards online trading in Retail Brokerage ltd, Chennai.
To study the investor’s awareness in the ONLINE trading.
To study the influence of stock and investment strategies in RETAIL BROKERAGE .
To study the influence of demographic profile on investors awareness on stock market in RETAIL
BROKERAGE .

Vol-3 Issue-6 2017 IJARIIE-ISSN(O)-2395-4396
6939 www.ijariie.com 247
REVIEW OF LITERATURE
Laforet, S., & Li, X. (2005). Consumers’ attitudes towards online and mobile banking in China. International journal
of bank marketing, 23(5), 362-380. The aim of this study is to investigate the market status for online/mobile
banking in China. With the recent and forecasted high growth of Chinese electronic banking, it has the
potential to develop into a world‐scale internet economy and requires examination.
Ha, H. Y. (2004). Factors influencing consumer perceptions of brand trust online. Journal of Product & Brand
Management, 13(5), 329-342. Unlike the traditional bricks‐and‐mortar marketplace, the online envi ronment
includes several distinct factors that influence brand trust. As consumers become more savvy about the
Internet, the author contends they will insist on doing business with Web companies they trust. This study
examines how brand trust is affected by the following Web purchase‐related factors: security, privacy, brand
name, word‐of‐mouth, good online experience, and quality of information. The author argues that not all e‐
trust building programs guarantee success in building brand trust. In addition to the mechanism depending o n
a program, building e‐brand trust requires a systematic relationship between a consumer and a particular Web
brand. The findings show that brand trust is not built on one or two components but is established by the
interrelationships between complex components. By carefully investigating these variables in formulating
marketing strategies, marketers can cultivate brand loyalty and gain a formidable competitive edge.
Carlos Roca, J., José García, J., & José de la Vega, J. (2009). The importance of perceived trust, security and
privacy in online trading systems. Information Management & Computer Security, 17(2), 96-113. The purpose of
this paper is to test an augmented technology acceptance model (TAM) in the online financial trading context.
This research aims to investigate how e‐investors are influenced by perceived trust, security, and privacy
jointly with traditional TAM constructs.
Hassanein, K., & Head, M. (2007). Manipulating perceived social presence through the web interface and its impact
on attitude towards online shopping. International Journal of Human-Computer Studies, 65(8), 689-708. Electronic
commerce typically lacks human warmth and sociability, since it is more impersonal, anonymous and automated
than traditional face-to-face commerce. This paper explores how human warmth and sociability can be integrated
through the web interface to positively impact consumer attitudes towards online shopping. An empirical study was
undertaken to investigate the impact of various levels of socially rich text and picture design elements on the
perception of online social presence and its subsequent effect on antecedents of attitudes towards websites. Higher
levels of perceived social presence are shown to positively impact the perceived usefulness, trust and enjoyment of
shopping websites, leading to more favorable consumer attitudes. Implications of these finding for practitioners and
future research are outlined.
Lee, S., Lee, S., & Park, Y. (2007). A prediction model for success of services in e-commerce using decision tree: E-
customer’s attitude towards online service. Expert Systems with Applications, 33(3), 572-581. This research
attempts to identify some characteristics of services which encourage customers to buy online and to develop a
prediction model for success based on customer recognitions of service offerings in e-commerce. For the purpose, a
survey was conducted on potential e-customers for their understandings of service offerings extracted from Portal
Sites. Collected data were used to develop a prediction model using decision tree which showed superior prediction
accuracy to conventional techniques. The results will help predict online success judging from customer acceptance
and afford a better understanding of how to facilitate future adoption of services in e-commerce.
Lee, M. C. (2009). Factors influencing the adoption of internet banking: An integration of TAM and TPB with
perceived risk and perceived benefit. Electronic commerce research and applications, 8(3), 130-141. Online banking
(Internet banking) has emerged as one of the most profitable e-commerce applications over the last decade.
Although several prior research projects have focused on the factors that impact on the adoption of information
technology or Internet, there is limited empirical work which simultaneously captures the success factors (positive
factors) and resistance factors (negative factors) that help customers to adopt online banking. This paper explores
and integrates the various advantages of online banking to form a positive factor named perceived benefit. In
addition, drawing from perceived risk theory, five specific risk facets – financial, security/privacy, performance,
social and time risk – are synthesized with perceived benefit as well as integrated with the technology acceptance
model (TAM) and theory of planned behavior (TPB) model to propose a theoretical model to explain customers’
intention to use online banking. The results indicated that the intention to use online banking is adversely affected
mainly by the security/privacy risk, as well as financial risk and is positively affected mainly by perceived benefit,
Vol-3 Issue-6 2017 IJARIIE-ISSN(O)-2395-4396
6939 www.ijariie.com 248
attitude and perceived usefulness. The implications of integrating perceived benefit and perceived risk into the
proposed online banking adoption model are discussed.
Lee, M. C. (2009). Factors influencing the adoption of internet banking: An integration of TAM and TPB with
perceived risk and perceived benefit. Electronic commerce research and applications, 8(3), 130-141. This study
investigates how stock investors perceive and adopt online trading in Taiwan. We developed a research model which
integrates perceived risk, perceived benefit and trust, together with technology acceptance model (TAM) and theory
of planned behavior (TPB) perspectives to predict and explain investors' intention to use online trading. The model
is examined through an empirical study involving 338 subjects using structural equation modeling techniques. The
results provide support for the proposed research model and confirm its robustness in predicting investors' intentions
to adopt online trading. In addition, this study provides some useful suggestions and/or implications for the
academician and practitioners in the area of online trading.
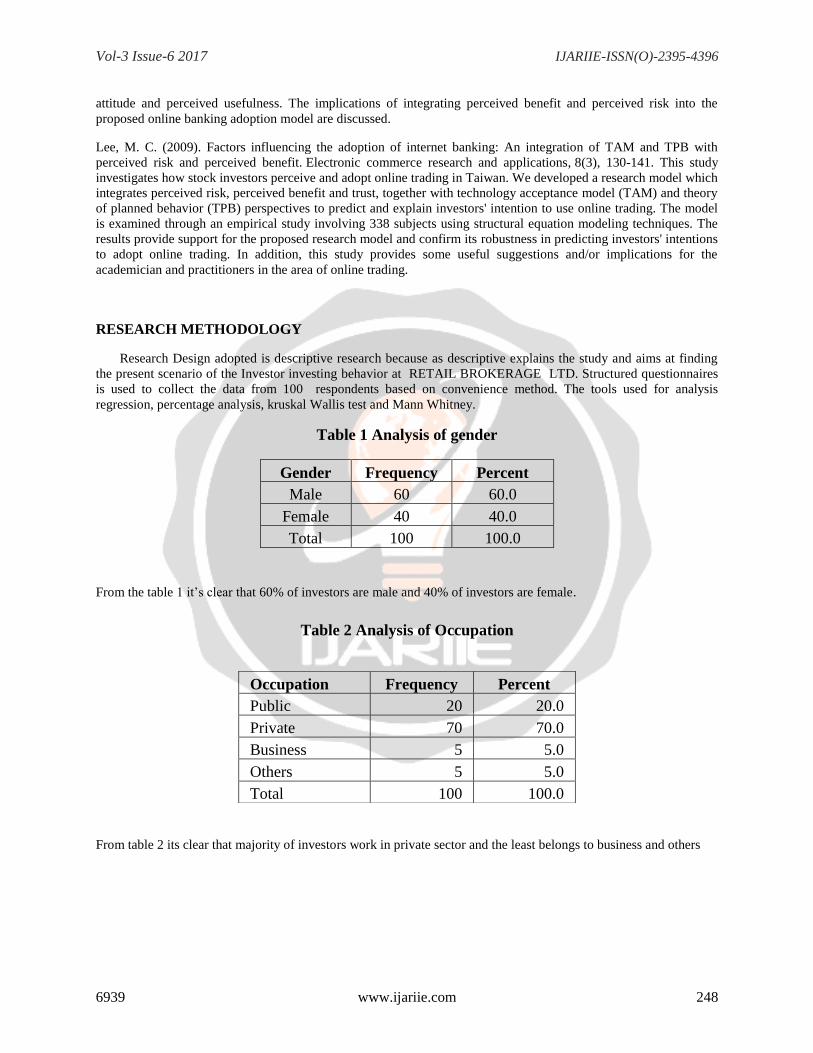
RESEARCH METHODOLOGY
Research Design adopted is descriptive research because as descriptive explains the study and aims at finding
the present scenario of the Investor investing behavior at RETAIL BROKERAGE LTD. Structured questionnaires
is used to collect the data from 100 respondents based on convenience method. The tools used for analysis
regression, percentage analysis, kruskal Wallis test and Mann Whitney.
Table 1 Analysis of gender
Gender Frequency Percent
Male 60 60.0
Female 40 40.0
Total 100 100.0
From the table 1 it’s clear that 60% of investors are male and 40% of investors are female.
Table 2 Analysis of Occupation
From table 2 its clear that majority of investors work in private sector and the least belongs to business and others
Occupation Frequency Percent
Public 20 20.0
Private 70 70.0
Business 5 5.0
Others 5 5.0
Total 100 100.0

Vol-3 Issue-6 2017 IJARIIE-ISSN(O)-2395-4396
6939 www.ijariie.com 249
Table 3 Analysis of Education Qualification of Investor
From the table 3 it is clear that 70% of investors have perceived UG as their education and least belong to
Professional Degree.
Table 4 Analysis of Financial Instrument
From the table 4 its clear that customers invest mostly in mutual funds as its risk level is less. and business people
prefer shares.
Table 5 Analysis on Type of Trading Of Investor
From the table 5 it’s clear that investors prefer online trading than offline trading
Educational
Qualification
Frequency Percent
School 5 5.0
UG 70 70.0
PG 18 18.0
0thers 6 6.0
Professional
1 1.0
Total 100 100.0
Financial Instrument Frequency Percent
SHARES 31 31.0
MUTUAL FUNDS 59 59.0
BONDS 5 5.0
OTHERS 5 5.0
Total 100 100.0
Trading Type Frequency Percent
Online 70 70.0
Offline 20 20.0
Not applicable 10 10.0
Total 100 100.0
Vol-3 Issue-6 2017 IJARIIE-ISSN(O)-2395-4396
6939 www.ijariie.com 250
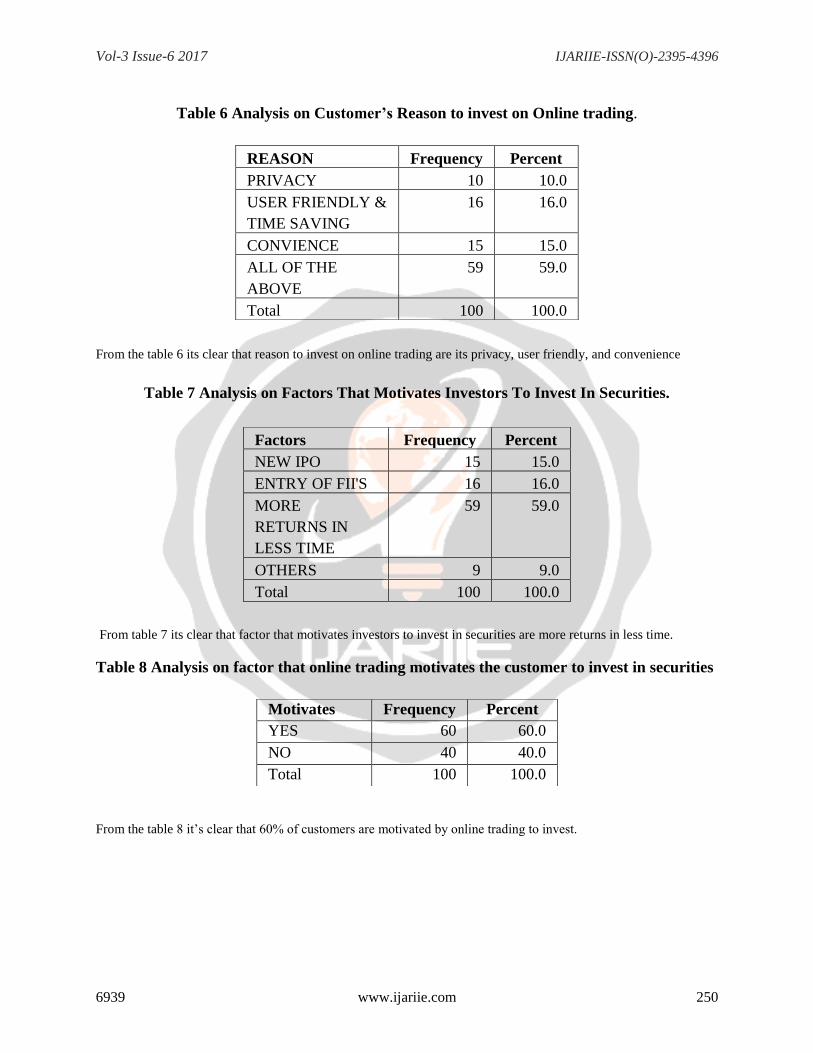
Table 6 Analysis on Customer’s Reason to invest on Online trading.
From the table 6 its clear that reason to invest on online trading are its privacy, user friendly, and convenience
Table 7 Analysis on Factors That Motivates Investors To Invest In Securities.
From table 7 its clear that factor that motivates investors to invest in securities are more returns in less time.
Table 8 Analysis on factor that online trading motivates the customer to invest in securities
From the table 8 it’s clear that 60% of customers are motivated by online trading to invest.
REASON Frequency Percent
PRIVACY 10 10.0
USER FRIENDLY &
TIME SAVING
16 16.0
CONVIENCE 15 15.0
ALL OF THE
ABOVE
59 59.0
Total 100 100.0
Factors Frequency Percent
NEW IPO 15 15.0
ENTRY OF FII'S 16 16.0
MORE
RETURNS IN
LESS TIME
59 59.0
OTHERS 9 9.0
Total 100 100.0
Motivates Frequency Percent
YES 60 60.0
NO 40 40.0
Total 100 100.0

Vol-3 Issue-6 2017 IJARIIE-ISSN(O)-2395-4396
6939 www.ijariie.com 251
Table 9 Analysis of awareness about Retail Brokerage
From the table 9 it’s clear that 68% of customers have heard about Retail Brokerage and 32% of customers have not
heard about it.
Table 10 Analysis on Preference of Brokerage firm
From the table 10 it is clear that 59% customers prefer to invest in Retail Brokerage 10% in ICICI another 10% in
kotak and the rest in others.
Table 11 Analyses on Factor Differentiates Of Share Trading Company
Awareness Frequency Percent
YES 68 68.0
NO 32 32.0
Total 100 100.0
Preference of
brokerage
Frequency Percent
A 10 10.0
B 59 59.0
C 9 9.0
D 10 10.0
E 7 7.0
ANYOTHER 5 5.0
Total 100 100.0
Factor Frequency Percent
BROKERAGE 68 68.0
RESEARCH
EXPOSURE
3 3.0
DIAL UP
TRADE
FACILITY
10 10.0
MAGAZINE 4 4.0
EXPOSURE 5 5.0
ACCOUNT
OPENING
CHARGES
10 10.0
Total 100 100.0
Vol-3 Issue-6 2017 IJARIIE-ISSN(O)-2395-4396
6939 www.ijariie.com 252
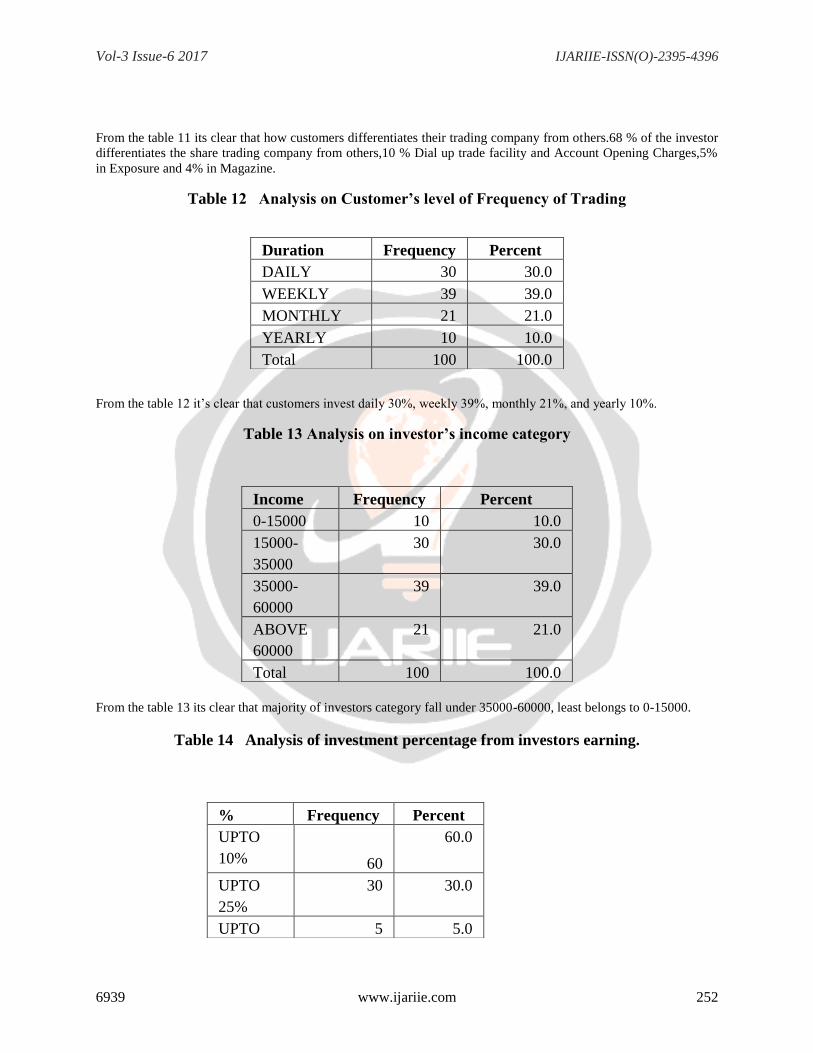
From the table 11 its clear that how customers differentiates their trading company from others.68 % of the investor
differentiates the share trading company from others,10 % Dial up trade facility and Account Opening Charges,5%
in Exposure and 4% in Magazine.
Table 12 Analysis on Customer’s level of Frequency of Trading
From the table 12 it’s clear that customers invest daily 30%, weekly 39%, monthly 21%, and yearly 10%.
Table 13 Analysis on investor’s income category
From the table 13 its clear that majority of investors category fall under 35000-60000, least belongs to 0-15000.
Table 14 Analysis of investment percentage from investors earning.
Duration Frequency Percent
DAILY 30 30.0
WEEKLY 39 39.0
MONTHLY 21 21.0
YEARLY 10 10.0
Total 100 100.0
Income Frequency Percent
0-15000 10 10.0
15000-
35000
30 30.0
35000-
60000
39 39.0
ABOVE
60000
21 21.0
Total 100 100.0
% Frequency Percent
UPTO
10%
60
60.0
UPTO
25%
30 30.0
UPTO 5 5.0
Vol-3 Issue-6 2017 IJARIIE-ISSN(O)-2395-4396
6939 www.ijariie.com 253
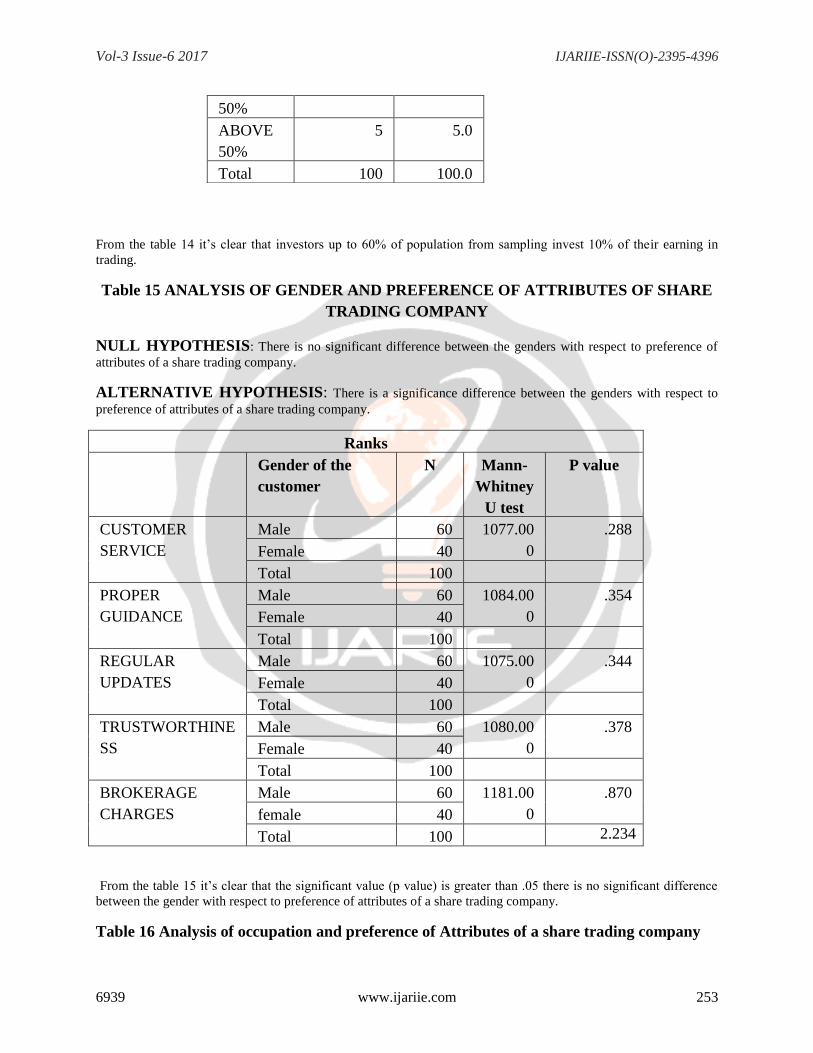
From the table 14 it’s clear that investors up to 60% of population from sampling invest 10% of their earning in
trading.
Table 15 ANALYSIS OF GENDER AND PREFERENCE OF ATTRIBUTES OF SHARE
TRADING COMPANY
NULL HYPOTHESIS: There is no significant difference between the genders with respect to preference of
attributes of a share trading company.
ALTERNATIVE HYPOTHESIS: There is a significance difference between the genders with respect to
preference of attributes of a share trading company.
Ranks
Gender of the
customer
N Mann-
Whitney
U test
P value
CUSTOMER
SERVICE
Male 60 1077.00
0
.288
Female 40
Total 100
PROPER
GUIDANCE
Male 60 1084.00
0
.354
Female 40
Total 100
REGULAR
UPDATES
Male 60 1075.00
0
.344
Female 40
Total 100
TRUSTWORTHINE
SS
Male 60 1080.00
0
.378
Female 40
Total 100
BROKERAGE
CHARGES
Male 60 1181.00
0
.870
female 40
Total 100 2.234
From the table 15 it’s clear that the significant value (p value) is greater than .05 there is no significant difference
between the gender with respect to preference of attributes of a share trading company.
Table 16 Analysis of occupation and preference of Attributes of a share trading company
50%
ABOVE
50%
5 5.0
Total 100 100.0

Vol-3 Issue-6 2017 IJARIIE-ISSN(O)-2395-4396
6939 www.ijariie.com 254
NULLHYPOTHESIS: There is no significant difference among the occupation with respect to preference of
attributes of a share trading company
ALTERNATIVE: There is a significant difference among the occupation with respect to preference of
attributes of a share trading company.
Ranks
Occupation of the
investor
N H-
TEST
P-VALUE
CUSTOMER
SERVICE
Public 20 48.000 .863
Others 5
Total 25
PROPER
GUIDANCE
Public 20 42.500 .552
Others 5
Total 25
REGULAR
UPDATES
Public 20 47.500 .858
Others 5
Total 25
TRUSTWORTHIN
ESS
Public 20 37.500 .385
Others 5
Total 25
BROKERAGE
CHARGES
Public 20 36.500 .283
Others 5
Total 25 2.915
From the table 16 it’s clear that the significant value (.05) is greater than .05 there is no significant difference among
the occupation with respect to preference of attributes of a share trading company
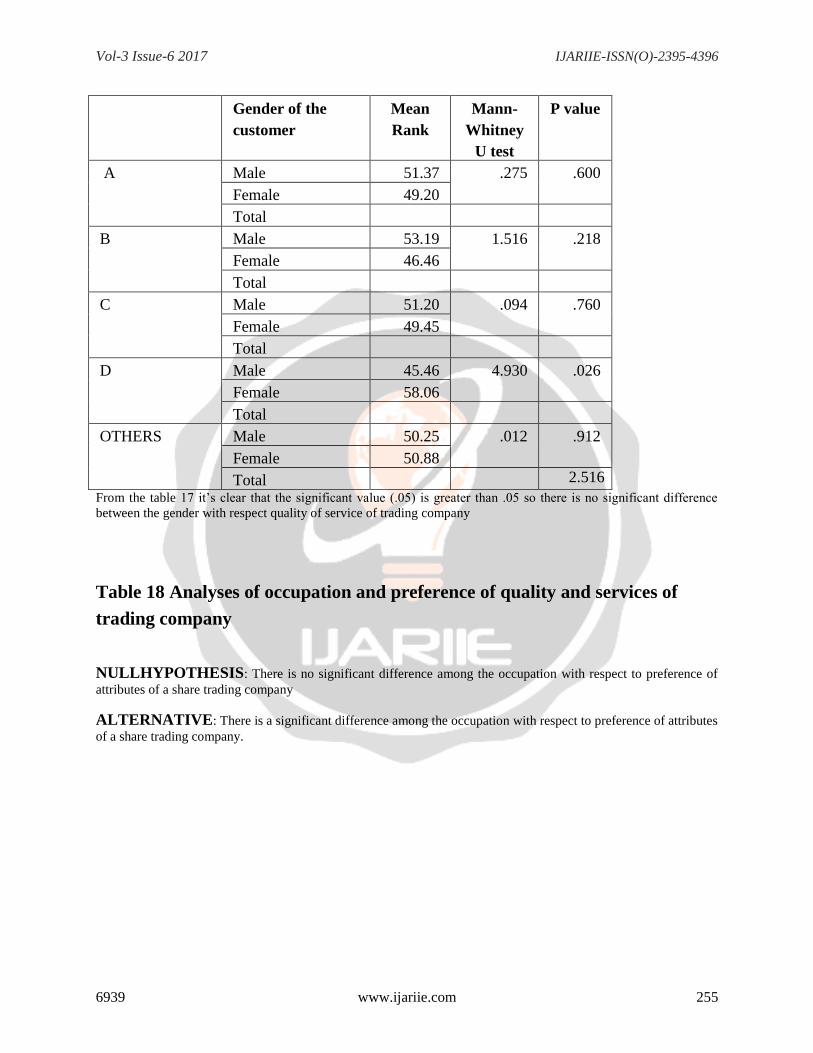
Tables 17 Analyses of gender and preference of quality of service of Trading company
NULL HYPOTHESIS: There is no significant difference between the gender with respect to preference of
attributes of a share trading company
ALTERNATIVE HYPOTHESIS: There is a significance difference between the gender with respect to
preference of attributes of a share trading company
Vol-3 Issue-6 2017 IJARIIE-ISSN(O)-2395-4396
6939 www.ijariie.com 255
Gender of the
customer
Mean
Rank
Mann-
Whitney
U test
P value
A Male 51.37 .275 .600
Female 49.20
Total
B Male 53.19 1.516 .218
Female 46.46
Total
C Male 51.20 .094 .760
Female 49.45
Total
D Male 45.46 4.930 .026
Female 58.06
Total
OTHERS Male 50.25 .012 .912
Female 50.88
Total 2.516
From the table 17 it’s clear that the significant value (.05) is greater than .05 so there is no significant difference
between the gender with respect quality of service of trading company
Table 18 Analyses of occupation and preference of quality and services of
trading company
NULLHYPOTHESIS: There is no significant difference among the occupation with respect to preference of
attributes of a share trading company
ALTERNATIVE: There is a significant difference among the occupation with respect to preference of attributes
of a share trading company.
Vol-3 Issue-6 2017 IJARIIE-ISSN(O)-2395-4396
6939 www.ijariie.com 256
occupation of the
investor
Mean
Rank
H-
TEST
P value
A Public 48.53 3.142 .370
Private 50.94
Business 40.50
Others 62.30
Total
B Public 57.55 5.441 .142
Private 47.64
Business 42.30
Others 70.50
Total
C Public 55.28 .841 .840
Private 49.39
Business 51.70
Others 45.80
Total
D Public 55.88 1.057 .788
Private 49.25
Business 51.50
Others 45.50
Total
OTHERS Public 52.00 .933 .818
Private 50.46
Business 40.00
Others 55.50
Total 2.958
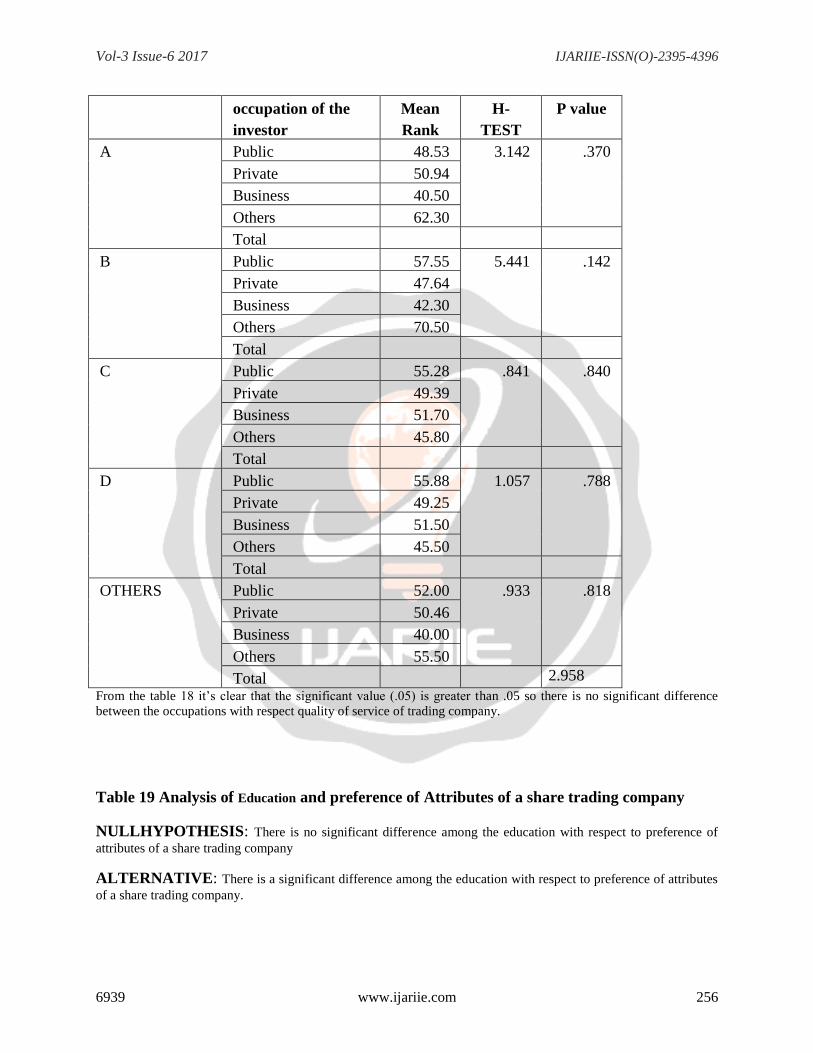
From the table 18 it’s clear that the significant value (.05) is greater than .05 so there is no significant difference
between the occupations with respect quality of service of trading company.
Table 19 Analysis of Education and preference of Attributes of a share trading company
NULLHYPOTHESIS: There is no significant difference among the education with respect to preference of
attributes of a share trading company
ALTERNATIVE: There is a significant difference among the education with respect to preference of attributes
of a share trading company.
Vol-3 Issue-6 2017 IJARIIE-ISSN(O)-2395-4396
6939 www.ijariie.com 257
Ranks
Education
qualification of
investor
N Mean
rank
H-TEST P
VALUE
CUSTOMER SERVICE SCHOOL 5 55.60 1.520 .678
UG 70 48.41
PG 18 51.72
OTHERS 6 58.67
TOTAL 99
PROPER GUIDANCE SCHOOL 5 75.10 5.326 .149
UG 70 48.78
PG 18 47.47
OTHERS 6 50.92
TOTAL 99
REGULAR UPDATES SCHOOL 5 38.50 5.326 .585
UG 70 49.04
PG 18 55.17
OTHERS 6 55.33
TOTAL 99
TRUSTWORTHINESS SCHOOL 5 42.60 1.741 .628
UG 70 52.29
PG 18 44.11
OTHERS 6 47.08
TOTAL 99
BROKERAGE
CHARGES
SCHOOL 5 64.90 5.764 .124
UG 70 46.66
PG 18 54.89
OTHERS 6 61.92
TOTAL 99
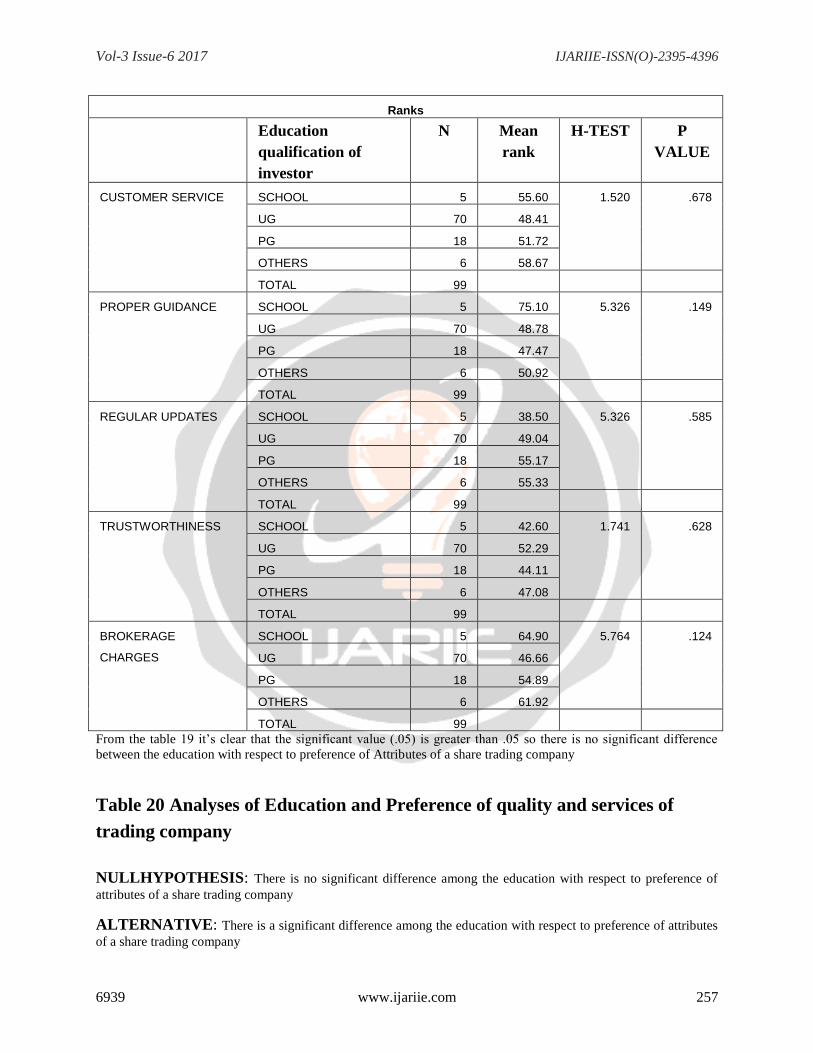
From the table 19 it’s clear that the significant value (.05) is greater than .05 so there is no significant difference
between the education with respect to preference of Attributes of a share trading company
Table 20 Analyses of Education and Preference of quality and services of
trading company
NULLHYPOTHESIS: There is no significant difference among the education with respect to preference of
attributes of a share trading company
ALTERNATIVE: There is a significant difference among the education with respect to preference of attributes
of a share trading company

Vol-3 Issue-6 2017 IJARIIE-ISSN(O)-2395-4396
6939 www.ijariie.com 258
Ranks
Education
Qualification of
Investor
N Mean
Rank
H-TEST P VALUE
A SCHOOL 5 59.30 3.878 .275
UG 70 51.29
PG 18 42.47
OTHERS 6 49.75
TOTAL 99
B SCHOOL 5 52.70 3.595 .309
UG 70 48.09
PG 18 50.25
OTHERS 6 69.25
TOTAL 99
C SCHOOL 5 49.70 1.968 .579
UG 70 48.48
PG 18 51.03
OTHERS 6 64.92
TOTAL 99
D SCHOOL 5 32.80 7.533 .057
UG 70 52.66
PG 18 39.03
OTHERS 6 66.17
TOTAL 99
OTHERS SCHOOL 5 55.00 2.063 .559
UG 70 51.85
PG 18 45.25
OTHERS 6 38.50
TOTAL 99
From the table 20 it’s clear that the significant value (.05) is greater than .05 so there is no significant difference
between the educations with respect quality of service of trading company.
SUGGESTIONS:
In online terminal, investor can’t get customized expert advice, whereas in offline the broker gives suggestions
according to investor’s strategy. Brokerage is high compared to offline. So brokerage can be reduced. Privacy is less
due to hacking scandals. So strong security must b provided. The customer’s occupation level availing the online
trading are private compare to other business and other group. The company has to target the other groups. The
customers predominantly investing in mutual fund compare to other financial instrument. The company has to
emphasize and provide the awareness to the investor for other financial instrument. Awareness of stock market and
online trading must be provided among customers whose education qualifications are School and Professional
Degree. Promotional activities must be taken to promote bonds and shares.
Vol-3 Issue-6 2017 IJARIIE-ISSN(O)-2395-4396
6939 www.ijariie.com 259
CONCLUSION:
The company deals with online trading in India. It offers a broad range of financial products and services including
securities, brokerage, mutual fund distribution , loan against share, ESOP financing, IPO financing and wealth
management. From this study customer perception of Online Trading, its inferred that in gender level of investors,
60% belongs to male. Occupation of investors are been classified as private sector 70%,.Education qualification of
customers is UG-70%. There is no significant difference between the Gender with respect to preference of attributes
of share trading company. There is no significant difference among the Occupations, Educational qualification with
respect to preference of attributes of share trading company. Customers invest in mutual funds as its risk is low and
returns are more rather than bonds and shares. Online trading is been preferred by customers rather than Offline
trading. Major reason for customers to invest in online trading is its conveyance and user friendly.
BIBILIOGRAPHY:
1. Laforet, S., & Li, X. (2005). Consumers’ attitudes towards online and mobile banking in
China. International journal of bank marketing, 23(5), 362-380.
2. Ha, H. Y. (2004). Factors influencing consumer perceptions of brand trust online. Journal of Product &
Brand Management, 13(5), 329-342.
3. Carlos Roca, J., José García, J., & José de la Vega, J. (2009). The importance of perceived trust, security
and privacy in online trading systems. Information Management & Computer Security, 17(2), 96-113.
4. Hassanein, K., & Head, M. (2007). Manipulating perceived social presence through the web interface and
its impact on attitude towards online shopping. International Journal of Human-Computer Studies, 65(8), 689-708.
5. Lee, S., Lee, S., & Park, Y. (2007). A prediction model for success of services in e-commerce using
decision tree: E-customer’s attitude towards online service. Expert Systems with Applications, 33(3), 572-581.
6. Lee, M. C. (2009). Factors influencing the adoption of internet banking: An integration of TAM and TPB
with perceived risk and perceived benefit. Electronic commerce research and applications, 8(3), 130-141.
7. Lee, M. C. (2009). Factors influencing the adoption of internet banking: An integration of TAM and TPB
with perceived risk and perceived benefit. Electronic commerce research and applications, 8(3), 130-141.
8. Yen, C. H., & Lu, H. P. (2008). Effects of e-service quality on loyalty intention: an empirical study in
online auction. Managing Service Quality: An International Journal, 18(2), 127-146.
9. Chong, B., Yang, Z., & Wong, M. (2003, September). Asymmetrical impact of trustworthiness attributes
on trust, perceived value and purchase intention: a conceptual framework for cross-cultural study on consumer
perception of online auction In Proceedings of the 5th international conference on Electronic commerce (pp. 213-
219).
10. Lee, S., & Park, Y. (2009). The classification and strategic management of services in e-commerce:
Development of service taxonomy based on customer perception. Expert Systems with Applications, 36(6), 9618-
9624.
11. Stone, R. N., & Grønhaug, K. (1993). Perceived risk: Further considerations for the marketing
discipline. European Journal of marketing, 27(3), 39-50.
12. Kolsaker, A., & Payne, C. (2002). Engendering trust in e-commerce: a study of gender-based
concerns. Marketing Intelligence & Planning, 20(4), 206-214.