a study on convective modes associated with tornadoes in central new york and northeast pennsylvania...
Post on 19-Dec-2015
213 views
TRANSCRIPT
A Study on Convective Modes Associated with Tornadoes in Central New York and Northeast
Pennsylvania
Timothy W. Humphrey1
Michael Evans2
1Department of Atmospheric and Environmental Sciences, University at Albany
State University of New York, Albany, New York 2NOAA/NWS, Weather Forecast Office, Binghamton, New York

Outline
• Motivation• Climatology• Storm Environments• Null Events• Radar Study• Conclusions
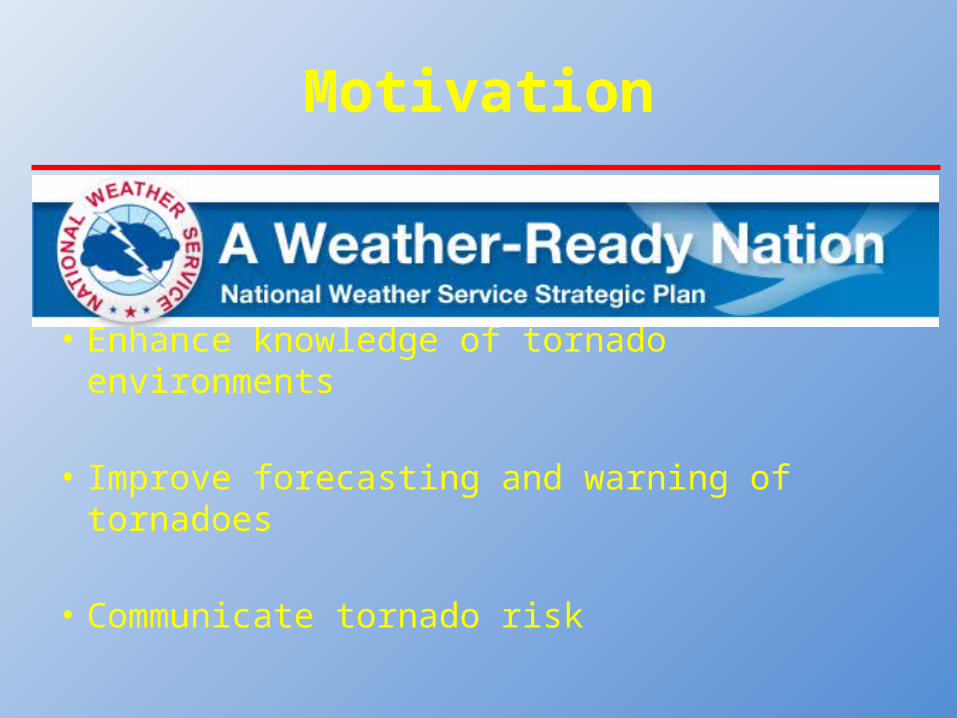
Motivation
• Enhance knowledge of tornado environments
• Improve forecasting and warning of tornadoes
• Communicate tornado risk
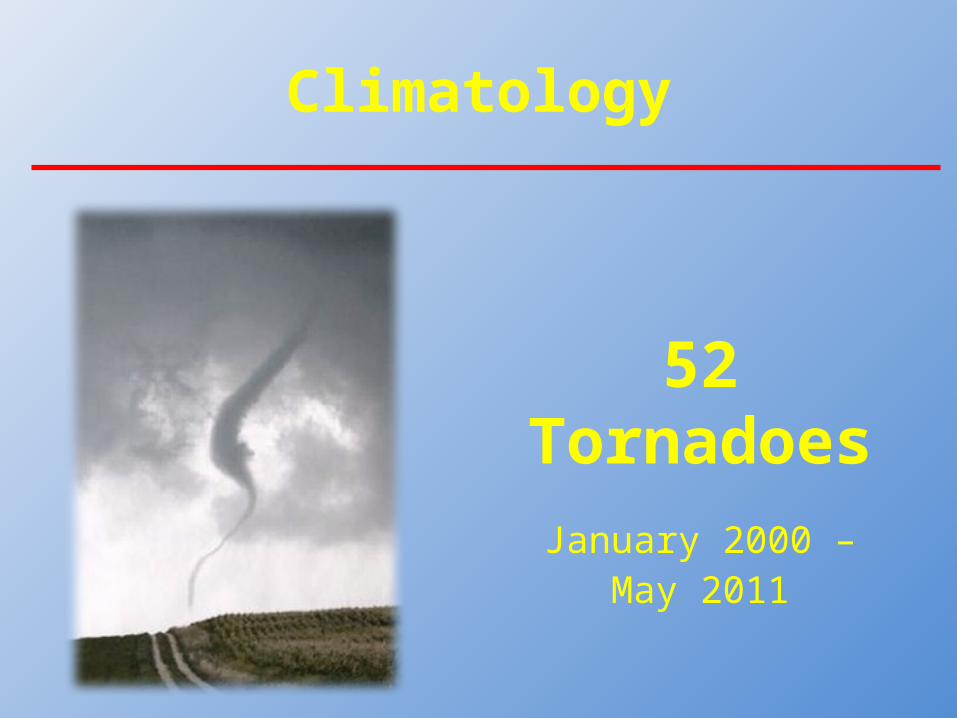
Climatology
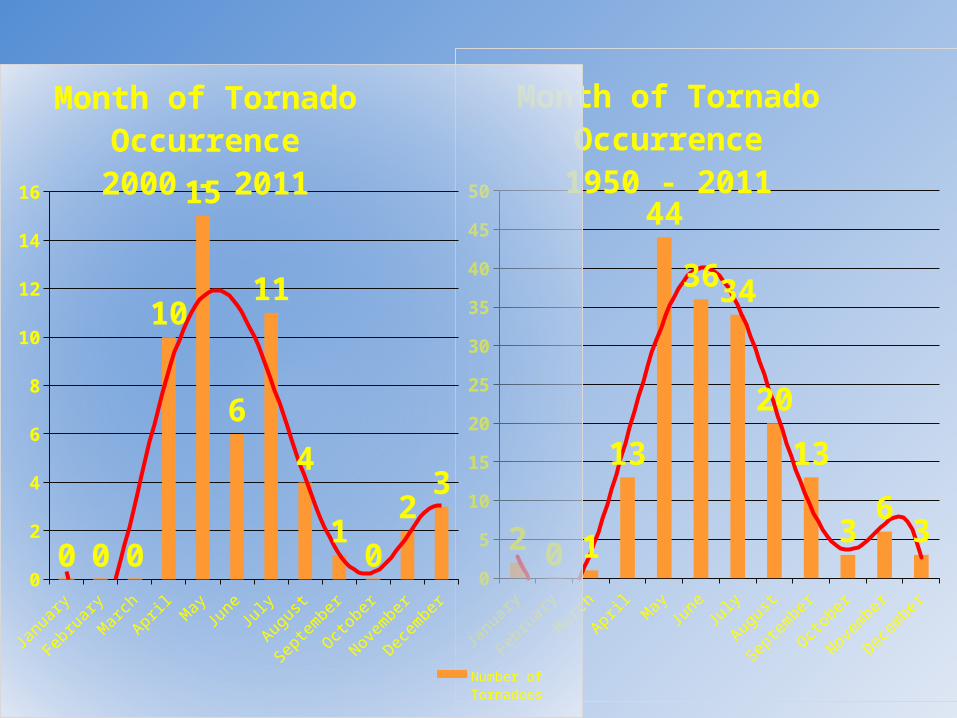
52 TornadoesJanuary 2000 – May 2011
January
Febru
ary
March April
May
JuneJuly
August
September
October
November
December
0
5
10
15
20
25
30
35
40
45
50
2 0 1
13
44
36 34
20
13
36
3
Month of Tornado Occurrence1950 - 2011
January
Febru
ary
March April
May
JuneJuly
August
September
October
November
December
0
2
4
6
8
10
12
14
16
0 0 0
10
15
6
11
4
10
23
Month of Tornado Occurrence2000 - 2011
Number of Tornadoes
Polynomial (Number of Tornadoes)

00:00 UTC
01:00 UTC
02:00 UTC
03:00 UTC
04:00 UTC
05:00 UTC
06:00 UTC
07:00 UTC
08:00 UTC
09:00 UTC
10:00 UTC
11:00 UTC
12:00 UTC
13:00 UTC
14:00 UTC
15:00 UTC
16:00 UTC
17:00 UTC
18:00 UTC
19:00 UTC
20:00 UTC
21:00 UTC
22:00 UTC
23:00 UTC
0
2
4
6
8
10
12
21 1 1
01 1
2 2
01
0 0 0 0 01
2 23
11
8
67
Time of Tornado Occurrence2000 - 2011
00:00 UTC
01:00 UTC
02:00 UTC
03:00 UTC
04:00 UTC
05:00 UTC
06:00 UTC
07:00 UTC
08:00 UTC
09:00 UTC
10:00 UTC
11:00 UTC
12:00 UTC
13:00 UTC
14:00 UTC
15:00 UTC
16:00 UTC
17:00 UTC
18:00 UTC
19:00 UTC
20:00 UTC
21:00 UTC
22:00 UTC
23:00 UTC
0
5
10
15
20
25
30
23
8 86
0 1 14 3
1 1 0 0 1 14
26
11 11
2427
22
15
1950 - 2011

7
Supercell QLCS
Multicell Cellular
24 Jun 2004 28 Apr 2011
29 Jul 2006 17 May 2008

Tornadoes by Convective Mode2000 - 2011
54%
31%
10% 6%
Supercell
QLCS
Multicell
Cellular
(28)
(16)
(5)
(3)
N = 52
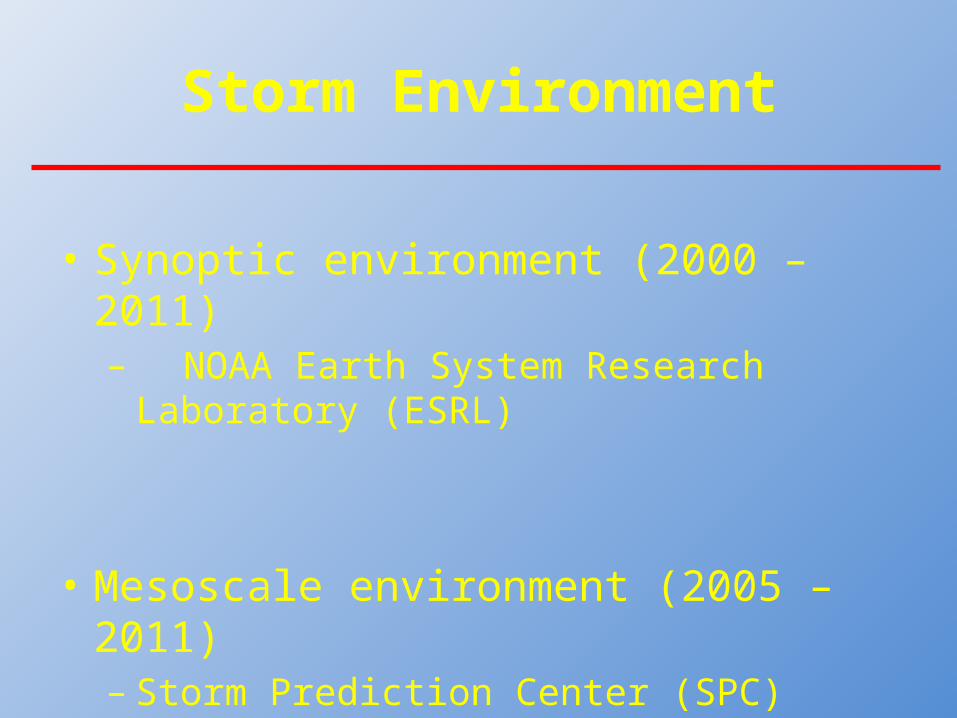
Storm Environment
• Synoptic environment (2000 – 2011)– NOAA Earth System Research Laboratory
(ESRL)
• Mesoscale environment (2005 – 2011)– Storm Prediction Center (SPC) Mesoanalysis
Archive
10
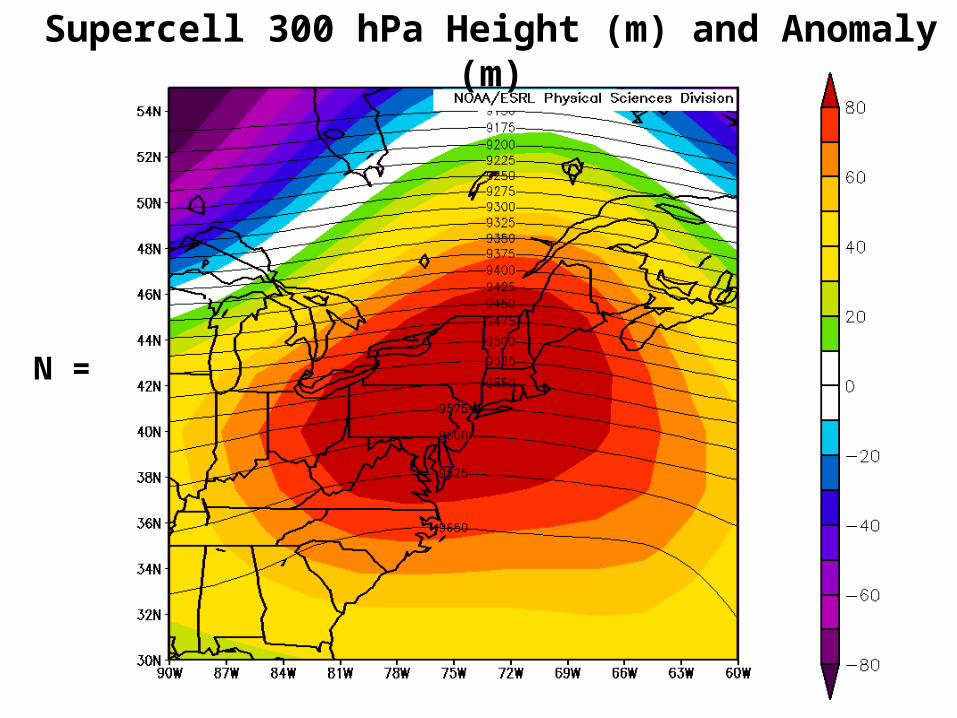
Supercell 300 hPa Height (m) and Anomaly (m)
N =

11
QLCS 300hPa Height (m) and Anomaly (m)
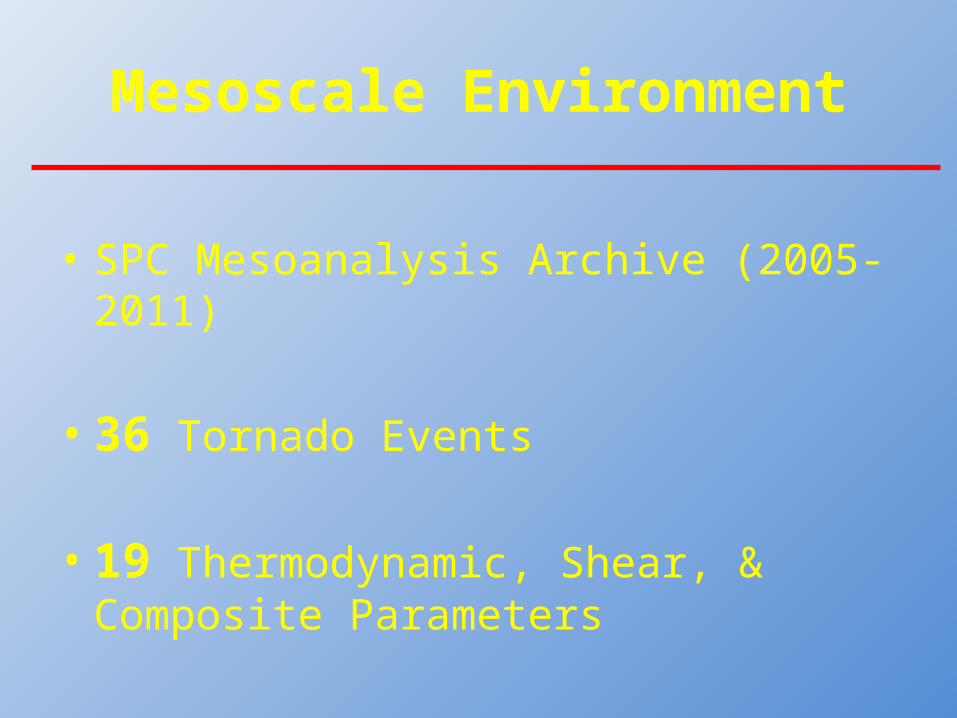
Mesoscale Environment
• SPC Mesoanalysis Archive (2005-2011)
• 36 Tornado Events
• 19 Thermodynamic, Shear, & Composite Parameters

Supercell QLCS Multicell0
500
1000
1500
2000
2500Surface Based CAPE By Convective Mode
Median
Min
Max
Joul
es/k
ilogr
am (J
/kg)

Supercell QLCS Multicell0
10
20
30
40
50
60
70
80
90
100
0 – 6 km Bulk Shear
Median
Min
MaxKnot
s (k
t)

Supercell QLCS Multicell0
1
2
3
4
5
6
7
80 – 3km Energy-Helicity Index (EHI)
Median
Min
Max
EHI
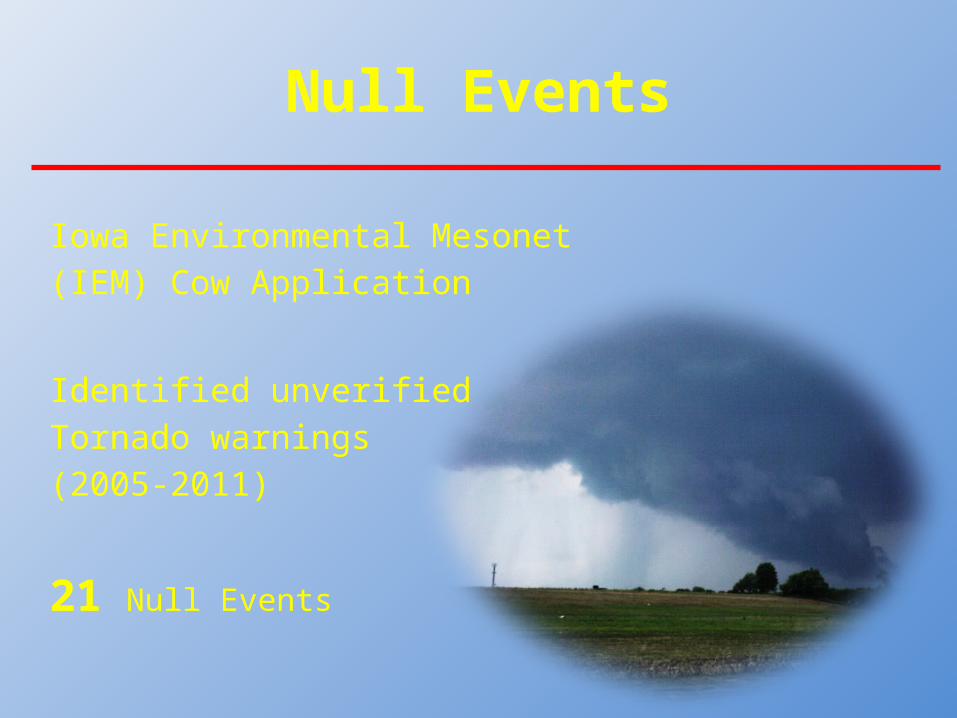
Null Events
Iowa Environmental Mesonet(IEM) Cow Application
Identified unverified Tornado warnings (2005-2011)
21 Null Events

Verified Null0
100
200
300
400
500
600
Supercell 0 – 1 km SRH
Median
Min
Max
Met
ers
^ 2/
Sec
onds
^ 2
(m^2
/s^2
)

Radar Study
Rotational Velocity (Vr)
Shear
Spectrum Width
Normalized Rotation(NROT)
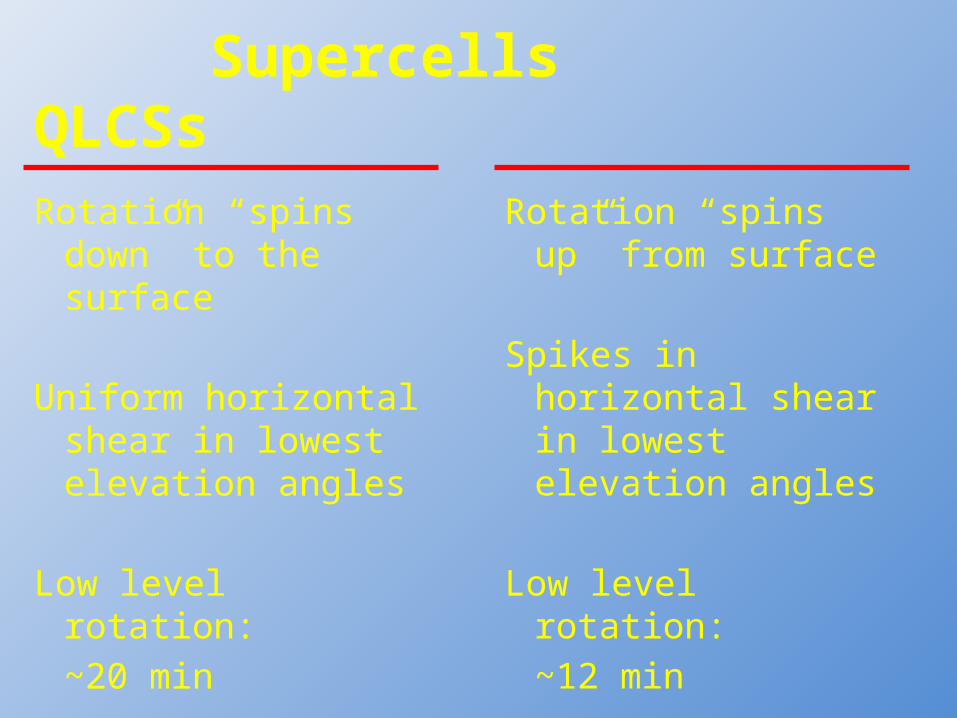
Supercells QLCSs
Rotation “spins down” to the surface
Uniform horizontal shear in lowest elevation angles
Low level rotation:~20 min
Rotation “spins up” from surface
Spikes in horizontal shear in lowest elevation angles
Low level rotation:~12 min
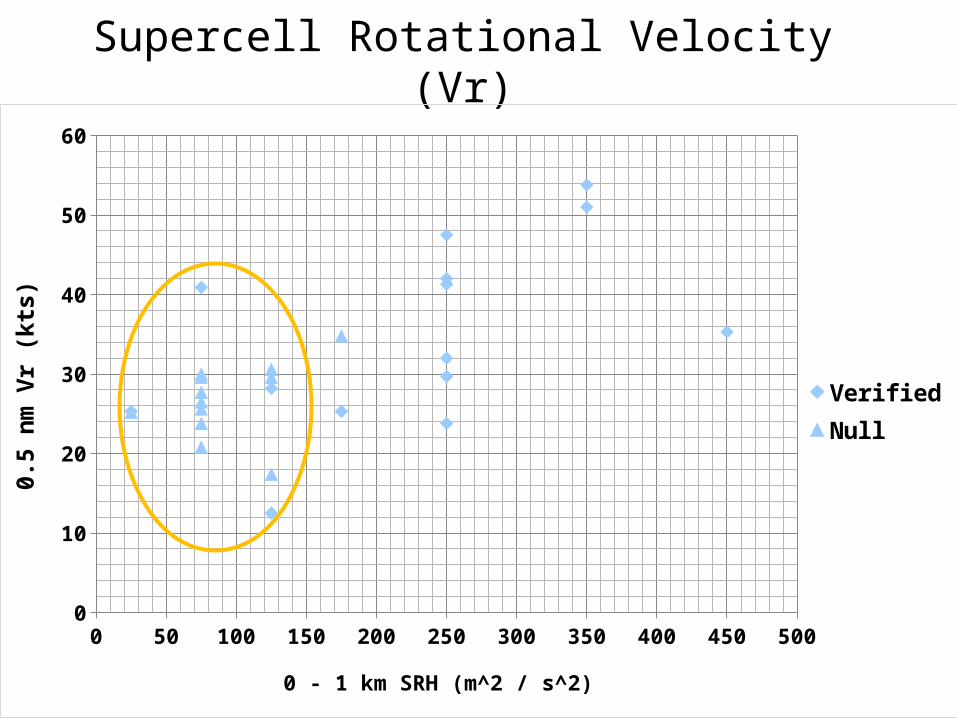
Supercell Rotational Velocity (Vr)
0 50 100 150 200 250 300 350 400 450 5000
10
20
30
40
50
60
VerifiedNull
0 - 1 km SRH (m^2 / s^2)
0.5
nm V
r (kt
s)

QLCS Rotational Velocity (Vr)
100 150 200 250 300 350 400 450 500 550 6000
2
4
6
8
10
12
VerifiedNull
0 - 1 km SRH (m^2 / s^2)
0.5
nm V
r (kt
s)

0 100 200 300 400 500 600 7000
5
10
15
20
25
30
35
40
VerifiedNull
0 - 1 km SRH (m^2 / s^2)
0.5
nm V
r (kt
s)Supercell/QLCS Vr

Conclusions
• Majority of tornadoes associated with supercells
• Supercell tornadoes appeared dependent on low level helicity and bulk shear
• QLCSs had little difference in mesoscale conditions
• Low level helicity a potential discriminator between verified and null events
Acknowledgments:
Hollings Scholarship Program
Michael Evans
NWS Binghamton Staff
Brook Taber, NWS Burlington
References:Thompson, R.L., R Edwards, J.A. Hart, K.L. Elmore, and
P. Markowski, 2003: Close proximity soundings within supercell environments obtained from the Rapid Update Cycle. Wea. Forecasting, 18, 1243-1261.
Trapp, R.J., S. A. Tessendorf, E. S. Godfrey, and H. E. Brooks, 2005: Tornadoes from squall lines and bow echoes. Part I: Climatological distribution. Wea. Forecasting, 20, 23–34.
http://www.erh.noaa.gov/bgm/research.shtml