a study of the rheological properties of some of …
TRANSCRIPT

University of Rhode Island University of Rhode Island
DigitalCommons@URI DigitalCommons@URI
Open Access Master's Theses
1998
A STUDY OF THE RHEOLOGICAL PROPERTIES OF SOME OF THE A STUDY OF THE RHEOLOGICAL PROPERTIES OF SOME OF THE
GELS COMMONLY USED IN THE PHARMACEUTICAL, FOOD AND GELS COMMONLY USED IN THE PHARMACEUTICAL, FOOD AND
COSMETIC INDUSTRIES AND THEIR INFLUENCE ON MICROBIAL COSMETIC INDUSTRIES AND THEIR INFLUENCE ON MICROBIAL
GROWTH GROWTH
Jorge A. Mendoza University of Rhode Island
Follow this and additional works at: https://digitalcommons.uri.edu/theses
Recommended Citation Recommended Citation Mendoza, Jorge A., "A STUDY OF THE RHEOLOGICAL PROPERTIES OF SOME OF THE GELS COMMONLY USED IN THE PHARMACEUTICAL, FOOD AND COSMETIC INDUSTRIES AND THEIR INFLUENCE ON MICROBIAL GROWTH" (1998). Open Access Master's Theses. Paper 268. https://digitalcommons.uri.edu/theses/268
This Thesis is brought to you for free and open access by DigitalCommons@URI. It has been accepted for inclusion in Open Access Master's Theses by an authorized administrator of DigitalCommons@URI. For more information, please contact [email protected].

(
(
A STUDY OF THE RHEOLOGICAL PROPERTIES OF SOME OF THE GELS
COMMONLY USED IN THE PHARMACEUTICAL, FOOD AND COSMETIC
INDUSTRIES AND THEIR INFLUENCE ON MICROBIAL GROWTH
BY
JORGE A. MENDOZA
A THESIS SUBMITIED IN PARTIAL FULFILLMENT OF THE
REQUIREMENTS FOR THE DEGREE OF
MASTER OF SCIENCE
IN
PHARMACEUTICS
UNIVERSITY OF RHODE ISLAND
1998
I

(
(
APPROVED
MA.STERS OF SCIENCE THESIS
OF
JORGE ALFONSO MENDOZA
Thesis committee
Major Professor
DEAN OF GRADUATE SCHOOL
UNJ VERSITY OF RHODE ISLAND
l998

( ABSTRACT
In the first paper of this work, lambda and kappa carrageenan, guar gum, Water
Locks A-100 and DD-223 and Carbopol 971 were selected based on their rheological
properties to study of the effects of gel concentration, osmotic pressure and rheological
properties as determined by oscillatory viscometry on the growth rate of Pseudomonas
aeruginosa, Escherichia coli, Staphylococcus aureus and Candida albicans. The object
of this study was to determine the contributions of gel rheology on the growth of
microorganisms that commonly contaminate such gels, and assess the influence of the
rheology on their self-preserving properties. The rheological properties of the gels were
determined by oscillatory viscometry at a stress range of 0 - 100 Pa and a frequency of
0.05 Hz using a 1 mm gap. Their viscoelastic properties were determined by applying a
stress range of 0 - lOOPa and deformation of the gels were observed until the elasticity
dissipated. The rheological parameters measured were the elastic modulus (G'), the
viscous modulus (G"), the complex viscosity (ri*) and the phase angle (a). The
parameters used to determine any influence of the rheological properties on the microbial
growth rate were G' and G" at the critical region, the critical stress ( a'c) at G' and G", the
time to reach crc at G' and G". The microbial growth rates were determined by following
division during a 24 hour period taking measurements at 0, 6, 12 and 24 hours. By the
use of multiple regression analysis, the growth rates were correlated with the
aforementioned parameters. The growth rates of S. aureus and E. coli were found to be
influenced by the rheological parameters described earlier, whereas a trend was visible for
II

( the growth rate of P. aeruginosa. The growth rate of C. albicans was not affected by \
these parameters.
In the second paper, the rheological properties of nine different gels, namely
carrageenan, guar gum, pectin, sodium carboxymethylcellulose, methylcellulose,
hydroxypropyl methyl cellulose, Carbopol 971, Water Lock and bentonite were studied.
Oscillatory viscometry was used to study the elastic modulus, viscous modulus and the
phase angle in the linear and critical regions at a stress range of 0 - 100 Pa and a frequency
of 0.05 Hz. The gel macrostructures included long linear chains of the cellulose
derivatives; natural gels forming helix and ribbon structures such as carrageenans, guar
gum and pectin; cross-linked gels such as Carbopol 971; grafted ones like Water Locks
and suspended particles like bentonite. Their flow behavior followed either shear thinning
or thickening properties. Five concentration ranges used varied from 0.3% to 7.0% with
no less than a 3 fold increment in the concentration range. The critical stress ( crc), where
the elasticity of the gel begins to dissipate was also determined with the intention of using
it as a parameter to describe the gel strength. Within the concentration ranges studied, the
critical stress was found to be a linear function of the concentration within 95%
confidence. The model proposed is applicable to gels of different chemical structure,
molecular weight, molecular weight distribution, chain structure and viscosity types. It is
also considered as a universal model to describe gel strength and offers a practical and
simple description useful for the formulation scientists. In addition, "concentration
sensitivity", another parameter described, may enable formulators to replace one gel with
another to make necessary concentration-gel strength adjustments to food, cosmetics and
pharmaceuticals.
111

( ACKNOWLEDGEMENTS
I would like to express my deep appreciation to Dr. M. Serpil Kislalioglu for
acting as my major professor. Without her, the road would have been a different one. She
guided me through my path not only as a student but also as a friend. To her I owe my
newfound abilities, my newfound knowledge and my newfound hunger for the sciences.
I would like to thank the company CHEMEXC, Tegucigalpa, Hondur~, who
supported me financially throughout my residence in the United States of America. I
would like to thank Dr. Denisse Suazo (Laboratorios El Planetario, Honduras) for sharing
her knowledge and expertise in the microbiological area with me.
I would like to thank Dr. T. Needham (Department of Applied Pharmaceutical
Sciences, URI), Dr. J. Wang (Department oflndustrial Engineering, URI) and Dr. C. Lee
(Department of Food Science and Nutrition, URI) for serving : !1 my thesis committee.
My special thanks to Dr. J. Sperry (Department of Microbiology, URI) for allowing me to
consult with him through most of the final stages of my preparation. I would also like to
extend my gratitude to Ms. Kathleen Hayes (Secretary, Department of Applied
Pharmaceutical Sciences) who was always present when I needed her and always made
everything seem easier. I extend my special thanks to Ann West, Director of the
International Students Office at URI, who gave me her unconditional support during every
step of my way.
To God; to my father Jorge Sr. and my mother Mercy, the greatest influences in
my life, whose love, sacrifice and care pushed me to excel in every aspect, to my brother
and sister and the rest of my family, and to my friends everywhere, thank you. I am a
reflection of you all.
IV

(
(
PREFACE
This work was prepared in the manuscript format option for thesis preparation, as
outlined in section 11-3 of the Graduate Manual of the University of Rhode Island.
Contained within is a body divided into three sections.
Included in section I is an introduction, which introduces the reader to the subject
of the thesis and the specific objectives of the research. Section II is comprised of two
manuscripts, containing the findings of the research made throughout this thesis. These
two manuscripts are presented in the format required by the journals to which they will be
submitted. Section III contains appendices, ancillary data (information essential to, but
not usually publishable in the manuscripts) and any other details pertinent to the well
understru...Jing of the work presented in Section II. A final presentation of the complete
listings of the works cited in this thesis, arranged in alphabetical order by the author's last
name follows at the end of this section and closes this thesis.
v

TABLE OF CONTENTS
ABSTRACT
ACKNOWLEDGEMENTS
PREFACE
LIST OF TABLES
LIST OF FIGURES
SECTION I
INTRODUCTION
SECTION II
MANUSCRIPT I
Appendix to Manuscript 1
MANUSCRIPT II
Appendix to Manuscript 2
SECTION III
APPENDIX
BIBLIOGRAPHY
vi
Page
ii
iv
v
vii
viii
1
1
6
6
36
57
106
173
173
187

( LIST OF TABLES
Page
SECTION II
MANUSCRIPT I
Table I 13
Table II 18
Table Ill 26
Table IV 27
Table V 29
Table VI 32
(
MANUSCRIPT II
Table I 68
Table II 74
Table III 96
Table IV 103
VII

(
SECTION II
MANUSCRIPT I
Figure 1
Figure 2
Figure 3
MANUSCRIPT II
Figure 1
Figure 2
Figure 3
Figure 4
Figure 5
Figure 6
Figure 7
Figure 8
Figure 9
Figure 10
Figure 11
Figure 12
Figure 13
LIST OF FIGURES
VIII
20
21
24
61
63
66
77
81
83
87
91
97
98
99
100
101

Section I
Introduction
This thesis consists of two papers. The first paper dealt with the effects of the
rheological properties, primarily, the viscous and elastic moduli in their linear critical
regions, the time at which the viscous and elastic modulus at their critical region is
presented, and the concentration and the osmotic pressure of lamda and kappa
carrageenans, guar gum, Water Locks A-100 and DD-223 and Carbopol 971 on the
growth rates of Pseudomonas aeruginosa, Staphylococcus aureus, Escherichia coli and
Candida a/bicans. Among factors such as pH, water activity and osmotic pressure,
macromolecules have also been known to affect microbial growth. The growth of
microorganisms is highly dependent on the availability of water and nutritional sources
(Schlegel, 1993), which are readily available in many natural gels.
If the microorganisms can cleave and use the carbon, oxygen and water sources of
the growth media, the chemical structure may be a factor affecting the growth of
microorganisms. Yanagi and Onishi ( 1971) using myristic and adipic acid esters,
reported a decrease in microbial growth rate with increasing branching of the compounds.
Guiselly ( 1989) discussed the importance of the gel structure of alginate as well as iota
and kappa carrageenans. It was noted that diffusion of the nutrients and toxic by
products produced by the microorganisms may be hindered by solid macromolecular
structures. Therefore, this study may suggest a possible relationship between the gel
strength and initial the growth of microorganisms rates.
The influence of the viscosity of the growth medium as a factor affecting
microbial growth was also of interest to some authors. Stecchini et al. (1998) while
working with Bacillus cereus using an agar medium with polyvinyl pyrrholidone to

modify the viscosity, found out that the colony size decreased with increased viscosity in
the range of 1 - 40cP. Lawrence et al. (1992), on the other hand, reported no changes in
the growth rates of Vibrio parahaemolyticus while comparing viscous environments of
up to 200cP. Other authors like Ferrero and Lee (1987) have studied cell motility in
relation to increased viscosity. They found significant changes in the cell motility while
studying C. jejiju in viscosity ranges of 1 OcP and more.
There have been no studies in the literature that examined the effects of varying
viscosity types and different degrees of viscosities, from free flowing to highly elastic
gels. The studies outlined in the first paper explore the contributions of gel
concentration, rheological properties and osmotic pressure on the growth rates of P.
aeruginosa, S. aureus, E. coli and C. albicans, all of which are commonly found in the
pharmaceutical, food and cosmetics industries.
The second paper, dealt with the effects of the rheological and physical chemical
properties of various gels on the viscoelastic properties of carrageenan, guar gum, pectin,
sodium carboxy methyl cellulose, methyl cellulose, hydroxypropyl methyl cellulose,
Carbopol 971, Water Lock and bentonite, which are used in the pharmaceutical,
cosmetics and food industries. A new parameter, which characterizes gels and directly
relates to the concentration regardless of the gel strength and concentration differences,
was introduced.
The rheology of the polymer solutions may depend upon the combination of
factors such as the molecular weight, molecular weight distribution, monomer and
segment distribution, the presence of hydrophobic and hydrophilic functional groups and
macrostructure of the chains (McCormick, 1991). Oscillatory rheometry is one of the
2

( suitable methods to study the gel properties because it provides information on the
internal structure without breaking it, unlike rotational viscometry. It offers a variety of
geometrical combination-;, which enables us to study of the least structured and the most
structured gels.
Davis (1971 , a, b) described the viscoelastic properties of pharmaceutical
semisolids using both destructive and non-destructive oscillatory testing. In destructive
oscillatory testing, the system is sheared until the elasticity breaks. In non-destructive
oscillatory testing, the viscous and elastic responses of a gel body are studied at
increasing frequencies in the stress range where these moduli remains constant. Among
many other authors who lrnve studied polymer rheology, Ferry (1974) was one of the first
to characterize polymer rheology by the use oscillatory viscometry.
Parameters like i- he complex viscosity (11*), the phase angle (a), the viscous
modulus (G') and the ela~.tic modulus (G") have been traditionally determined and used to
characterize the viscoela~ ;tic properties of polymer solutions (Chereminisoff, 1993) The
critical stress ( crc) is a calculated parameter which describes the stress at which the
polymer solution's struc;:ure starts to dissipate . Giboreau et al. (1994) working with
locust bean gum, xanthan gum and a modified starch (Col-Flo) described this point as the
point where a "catastrorhic" destruction of the system occurs. Therefore, the overall
internal gel structure may be characterized by the use of the critical stress.
3

f References
Davis, S., Viscoelastic properties of pharmaceutical semisolids III : Destructive
oscillatory testing, Journal of Pharmaceutical Sciences, 60:1357 - 1360, (197lb)
Davis, S., Viscoelastic properties of pharmaceutical semisolids III: Non-destructive
oscillatory testing, Journal of Pharmaceutical Sciences, 60: 1351 - 1355, (197la)
Feery, J. , Viscoelastic properties of polymers, 3rd ed., Wiley and Sons, NY, 1980
Giboreau, A. , Cuvelier, G. and launay, B., Rheological behavior of three
biopolymer/water systems, with emphasis on yield stress and viscoelastic properties,
Journal a/Texture Studies, 25:119-137 (1994)
McCormic, C. Structural design of water soluble polymers, in Water-Soluble Polymers,
Synthesis, Solution Properties and Applications (S. Shalaby, C. MacCormick, G.
Butler, eds.) pp. 2- 24, ACS, Washington, (1991)
Ferrero, R.L. and Lee, A. , Motility of Campylobacter jejuni in viscous environments:
comparison with rod shaped bacteria, Journal of General Microbiology, 134:53 - 59,
(1988)
Guiselly, K.B. , Chemical and physical properties of algal polysaccharides used for cell
immobilization, Enzyme Microbial Technology, 11:706- 716, (1989)
Lawrence, J.R., Korber, D.R. and Caldwell, D.E., Behavioral analysis of Vibrio
parahaemolyticus variants in high and low viscosity microenvironments by use of
digital image processing, Journal of Bacteriology, 174:5732 - 5739, (1992)
Schlegel, H., General microbiology, 2nd ed. , Cambridge University Press, 1993
Stecchini, M.L. , Torre, M., Sorais, I., Soro, 0., Messina, M. and Maltini, E., Influence of
structural properties and kinetic constraints on Bacillus cereus growth, Applied and
Environmental Microbiology, 64:1075 - 1078, (1998)
4

( Yanagi and Onishi G., Assimilation of selected cosmetic ingredients by microorganisms, I
Journal of the Society o/Cosmetic Chemists. 22:851, (1971)
5

( Section II
Paper I
"The effects of gel concentration, osmotic pressure and rheological properties on the
growth rate Pseudomonas aeruginosa, Escherichia coli, Staphylococcus aureus and
Candida albicans."
6

( Summary
The effects of rheology, gel concentration and osmotic pressure of lambda and
kappa carrageenans, guar gum, Water Locks A-100 and DD-223 and Carbopol 971 on the
growth rate of Pseudomonas aeruginosa, Escherichia coli, Staphylococcus aureus and
Candida a/bicans were studied. The rheological properties of the gels were determined
by the use of oscillatory viscometry at a stress range of 0 - 100 Pa, a frequency of 0.05
Hz and a strain range of 0.00075 to 15 mm using a 1 mm gap. Their viscoelastic
properties were determined using destructive oscillatory measurements. The rheological
parameters measured were the elastic modulus (G'), the viscous modulus (G"), the
complex viscosity (11*) and the phase angle (a). The parameters used to determine the
influence of the rheological properties on the microbial growth rate were G' and G" in the
critical region, the critical stress (crc) at G' and G", the time to reach crc at G' and G".
Microbial growth rates were determined by following division during a 24 hour period
taking measurements at 0, 6, 12 and 24 hours. Multiple regression analysis was used to
correlate the growth rates with the aforementioned parameters. The growth rates of S.
aureus and E. coli were found to be influenced by the rheological parameters described
earlier, whereas a trend was visible for the growth rate of P. aeruginosa. The growth rate
of C. albicans was not affected by these parameters. The deviations of the growth rates
of the latter two microorganisms were explained by the strong metabolizing ability of P.
aeruginosa and extremely large size of C. albicans.
7

r Introduction Macromolecules, especially natural gums like tragacanth, have been known to
affect the microbial growth, since they provide a nutritious, structurally suitable
environment. Y anogi and Onishi (Dec. 1971) found that the microorganisms could easily
utilize materials like liquid paraffin, oleyl alcohol, stearyl alcohol, propylene glycol,
isopropyl myristate and stearic acid. Natural gels, because of their polysaccharide
structure, can provide an optimum carbon source that the bacteria can use as a nutrient to
folly grow and develop (Schlegel, 1993). Some of the synthetic and semisynthetic gels
may provide nitrogen sources. The growth of microorganisms is dependent on water
availability because the substances which they utilize are usually dissolved in water.
They can break down almost all organic matters (Schelegel, 1993).
Chemical structure is also important for the growth of microorganisms. Generally
it is agreed that for any given carbon number, the degradation of a compound becomes
slower with increased branching. Yanagi and Onishi (Dec. , 1971) reported that the
growth rate of microorganisms in myristic and adipic acid esters and in glycerol esters
decreased by increasing branching of the compounds. Furthermore, Guiselly ( 1989)
reviewed the chemical and physical properties of algal polysaccharides such as agar,
algin and carrageenan used for cell immobilization, and stated that the diffusion of
nutrients is hindered by the complex molecular structures of algin and carrageenan. The
gel would further affect the accumulation of toxic by-products of the microorganisms,
and thus their growth.
In addition, these molecules, due to their large structures and related surface
activity, can also interact with the preservatives, minimizing preservative efficacy.
Esiman et al. (1957) found that the presence of gum tragacanth in the pharmaceutical
8

formulations neutralized the effect of chlorobutanol, p-hydroxybenzoate and quaternary
ammonium compounds. McCarthy et al. (1974) further studied the deactivation of
preservatives by gum tragacanth.
pH plays an important role in bacterial growth sometimes hindering their growth.
In a range of 5.5 - 7.0, pH has very little effect on the growth rate; but most
pharmaceutical and topical preparations are formulated at a pH range of 5.5 - 8.0, which
is optimal for most bacterial growth (Schlegel, 1993).
Besides pH and chemical structure of the polymer, an increase in the osmotic
pressure of the solution also influences microbial growth, since microorganisms are
tolerant to higher osmotic stress (Csonka 1989). The effects of physical factors on the
growth of Staphylococcus aureus were discussed by Ballesteros et al. (1993). They
found that the water activity, regardless of the nature of the ions used, influenced the cell
growth.
Water activity is expressed as:
Aw=P/Po ...................... . ................ . . .. .... . ............ . . .. ....... . .... . ............. (1)
And can be related to the osmotic pressure for ideal solutions through Van Hoff's
equation,
n=RTN*Ln(Po/P) ............. . ........ . ..... . ... .. ......... . ..... ... ..................... . .... . .. (2)
where Po is the vapor pressure of the pure solvent, Pis the vapor pressure of the solution,
R is the ideal gas constant, T is the absolute temperature and V is the volume of the
solution.
Osmotic pressure also has a direct effect in reducing the water activity of a
solution. Theoretically water activity changes from 0 to 1. The lowest water activity
9

tolerated by many bacteria is 0.90, whereas at a water activity of0.85 the growth of many
yeasts is inhibited. Fungi can endure water activities as low as 0.80 (Schelegel, 1993).
Ketz et al (1996), working with sucrose, glycerol and poly(ethylene)glycol of molecular
weights of 200, 400 and 4,000 and using Pseudomonas putida as the test microorganism
found that minimal decreases in the water activities from 0.99 to 0.9875 and 0.9800
ceased the growth of microorganisms.
Stecchini et al. (1998) found correlations between the microbial growth of
Bacillus cereus and the viscosity of agar. She reported a decrease in the colony size as
the viscosity of agar was increased from 1 cP to 40cP using different concentrations of
polyvinyl pyrrholidone (PVP), without mentioning the effect PVP may have had on the
water activity and osmotic pressure of agar. However, Ballesteros et al. (1993) argued
that sucrose had the highest increase on the viscosity of the media when comparing water
activities, but had the least inhibitory effect on the growth of S. aureus when compared to
sodium chloride, propylene glycol, butylene glycol and various polyethylene glycols.
Lawrence et al. (1992) found no changes in the growth rate of Vibrio
parahaemolyticus, a flagellated bacteria, when comparing the upper and lower ends of
low viscosity environments up to 200cP during the first 6 hours of growth. Ferrero and
Lee ( 1987) have noted the relationship between the cell motility and apparent viscosity
using a flow viscometer. They observed an increase in the mean velocity of C. jejuji at
the 1 - 1 OcP range, which decreased rapidly at viscosities higher than 1 OcP. Atsumi et al.
(1996) also noted that the speed of lateral flagellated V a/gininolyticus increased from
20µm/s at lcP to 40µm/s at 5cP and then decreased as the viscosity was increased.
Greenberg and Canole-Parola, (1997), working with V parahaemolyticus and Lawrence
10

et al. (1992), working with E. coli found that the mean immobilizing viscosity for these
bacteria were of 60cP and 1,000 cP respectively. However, all of the studies mentioned
above used low Newtonian viscosity media. The studies discussed above show
relationships between viscosity, cell motility, nutrient diffusion and growth rate. There
are no studies in the literature which determine the effect of rheological behavior on the
microbial growth in high viscosity environments.
In order to test the effect of rheology on the growth of microorganisms,
oscillatory viscometry was utilized. Two natural gels, carrageenan and guar gum, a
semisynthetic, Water Lock and a synthetic polymer, Carbopol 971, were used to
investigate the effects of rheology on the growth of microorganisms rate. The
microbiological experiments were carried out using one Gram (+) bacteria,
Staphylococcus aureus, two Gram (-) bacteria, Escherichia coli and Pseudomonas
aeruginosa, and a yeast, Candida albicans, as model microorganisms, since they are the
most representative of those commonly found in the raw materials and the finished
products.
S. aureus is a spherical, non-motile prokariotic bacteria (Cohn, 1972). P.
aeruginosa is a rod, straight or curved, 4µm in length, motile with one or more polar
flagella and containing pilli or fimbrae (Richmond, 1975). E. coli is also a flagellated rod
containing fimbriae with which they transfer genetic material and act as adherent factors
when colonizing other organisms and solid materials. These three bacteria have a cell
size of about 5 µm (Niedhart, 1987). Candida albicans is a yeast, that is a fungi with
unicellular mode of development. Candidas are eukariotic cells that multiply by the
production of buds from blastophores. Its size greatly varies from the bacteria studied in
11

( that they about 500µm in diameter and their buds can be elongated several times more
(Odds, 1988).
Materials and Methods
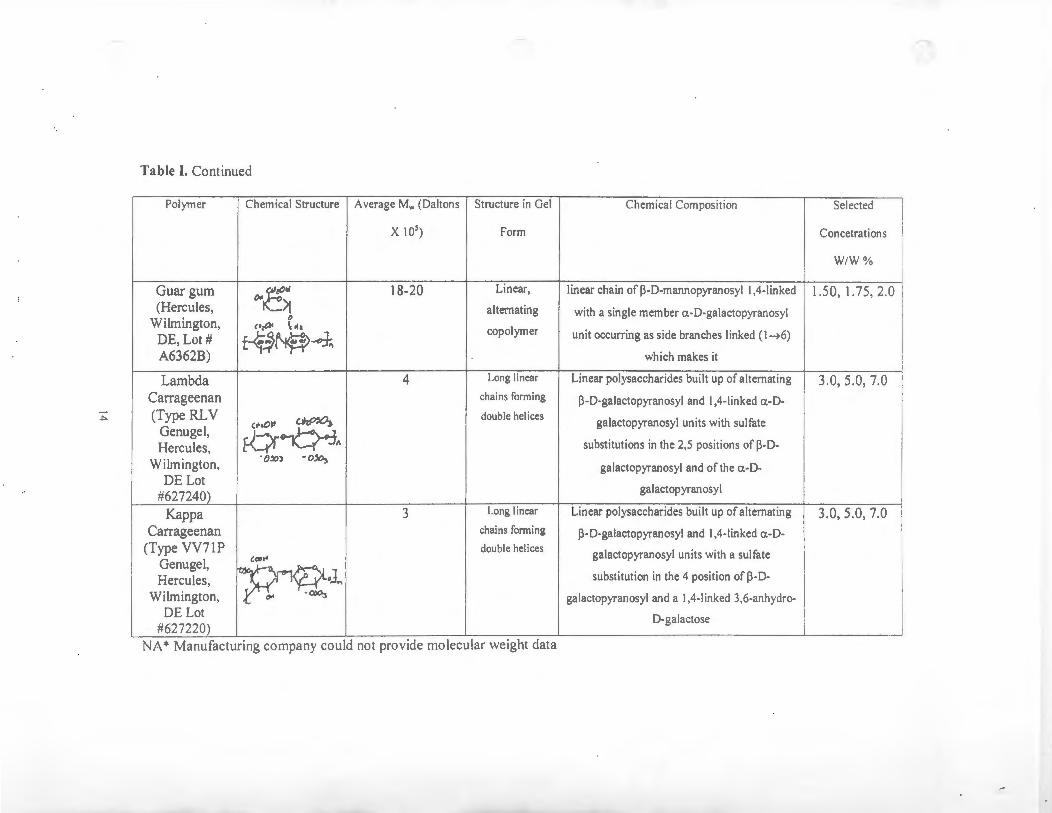
The chemical structures, molecular weights and nature of the gels studied are given in
Table I. Carbopol 971 is a cross linked poly(acrylic)acid with wide applications in the
pharmaceutical and cosmetics industry. It is also a suspension/emulsion stabilizing agent. It
is highly hydrophilic in nature and highly swellable in water and other polar solvents.
Carrageenans are the water extracts from various members of the Solicracae families of red
sea weed. The different types of carrageenans vary on the degree of sulfation in their
repeating unit. Their viscous properties depend mainly on their unbranched, linear
macromolecular structure and highly electrolytic nature. They are widely used in the
pharmaceutical, cosmetics and food industries. Guar gum is a carbohydrate polymer, which is
useful as a thickening agent for water. Water Locks are long chained semisynthetic polymers
obtained from wheat proteins. They are used as skin conditioners and water fixing agents.
They are able to bind large quantities of water at low concentrations.
Carbopol 971 NF, Carrageenan RLV and VV71P, Guar Gwn U-NF and Water
Lock A-100 and DD-223 were used to form gels and mucilages. Gelose Nutritive
(Diagnostics Pasteur) was included in the culture broth as a nutrient in aid of preparation
of the microorganism suspensions. The culture broth contained 1 gram of meat extract, 2
grams of yeast extract, 5 grams of peptone, 5 grams of sodium chloride and 15 grams of
agar per liter of distilled water as described by the manufacturer. Candida albicans
(ATCC 10231), Escherichia coli (ATCC 8739), Pseudomonas aeruginosa (ATCC 9027)
and Staphylococcus aureus (ATCC 6538) were provided by the Universidad Nacional
Autonoma de Honduras, College of Microbiology.
12

~
Table I. Chemical Structures, Molecular Weights and Nature of the Gels Studied.
Polymer Chemical Structure Average Mw (Daltons Structure · n Gel Chemical Composition Selected
x 105) Form Concetrations
W/W%
Carbopol 971 10-40 at 2% Highly poly(acrylic)acid cross linked with ally! 0.5. 2.0, 4.0 (BF Goodrich, {Cl!,, - Ol 1 ] crusslinkcd sucrose I Cleveland, OH, c-oJ -1 /, l/y I chains Lot # AJO 1066) I
OH JUL~O~
Water Lock A- NA* Grafl a starch backbone and grafted side chains of 0.3. 0.5. 0.7
l,J
100 (Grain ~,.. t * copolymer poly (2-propenamide-co-2-propenoic acid)
Processing Co., ir-<Pi[lM.c.t1J; ~l~ (branched) ... , I I
Muscatine, IA :J 'I <'.411 I. l4rix>
Lot #9613001) Water Lock NA* Graft a starch backbone and grafted side chains of 0.7, 1.0, 1.3
DD-223 (Grain °"~ ~ll1Cl+Jil+ic~
copolymer poly (2-propenamide-co-2-propenoic acid) Processing Co., (branched) ~I I Muscatine, IA ..,c~ M.c.P
Lot #W9501401)
---..
Table I. Continued
Polymer Chemical Structure Average Mw (Daltons Structure in Gel Chemical Composition Selected
x 105) Form Concetrations
WIW %
Guar gum l_"°w 18-20 Linear, linear chain of P-D-mannopyranosyl 1,4-linked 1.50, 1.75. 2.0 (Hercules, °" ~>I alternating with a single member a-D-galactopyranosyl
Wilmington, {)
c•,,a< ~·h copolymer unit occurring as side branches linked ( l-t6) DE, Lot# M7.7~-l A6362B) which makes it
Lambda 4 Long linear Linear polysaccharides built up of alternating 3.0, 5.0, 7.0 Carrageenan chains forming P-D-galactopyranosyl and 1,4-linked a-D-
A (Type RLV <~•Olt (.iii,~
double helices galactopyranosyl units with sulfate Genugel, EO~~ Hercules, substitutions in the 2,5 positions of P-D-
Wilmington, . o:rn -o~
galactopyranosyl and of the a-D-DE Lot
galactopyranosyl #627240)
Kappa 3 Long linear Linear polysaccharides built up of alternating 3.0, 5.0, 7.0 Carrageenan chains forming P-D-galactopyranosyl and 1,4-linked a-D-
(Type VV71P double helices galactopyranosyl units with a sulfate Genugel, {<Dr'
~"n~-1 substitution in the 4 position of P-D-Hercules, Wilmington, galactopyranosyl and a 1,4-linked 3,6-anhydro-
DE Lot D-galactose #627220)
NA* Manufacturing company could not provide molecular weight data

( Preparation of the gels
After screening fourteen different polymer solutions, six were selected based on
their flow behavior and rheological strength. They either exhibited similar flow behavior
with different rheological strength or had similar rheological strength with different flow
behavior. The concentrations shown in Table I provided similar rheological behavior
within the measuring limits of the instrument used.
The gels were prepared by adding sterilized distilled water to the polymer powder
to obtain the pre-selected gel concentration in w/w. The mixtures were left to swell for
24 hr. and then homogenized using a Fisher Scientific (Pittsburgh, PA) model Dyna-mix
stirrer at 1000 rpm for 1 hr. The pH was measured using a Fisher Scientific (Pittsburgh,
PA) model Accumet 20 pH meter. Except for Carbopol 971 , no pH adjustments were
made. The pH of carbopol 971 was adjusted to the pH range of 5.1 using a IN NaOH
solution.
Characterization of the Physical-Chemical Properties of the Gels.
Water activity and osmotic pressure: Using an Aqualab Model CX-2 instrument, the
water activities of the gels were measured at each concentration. This instrument
measures the vapor pressure of water and the gel solution which were observed as
different degrees of condensation on a calibrated mirror. It calculates the water activity
value from equation (1). The osmotic pressure of the gels was measured at each
concentration using an Osmette 'A" Automatic Osmometer (Precision systems Inc.,
Matick, MA).
Rheological properties: The rheological behavior of the gels was characterized at each
concentration using a Bohlin Instruments Rheometer Model CVO (Cranbury, NY).
15

Elastic modulus (G'), viscous modulus (G"), complex viscosity (ri*),complex modulus
(G*), the strain (y) and phase angle (a) were measured using a stainless steel, plate and
plate spindle number 4, a strain range of 0.00075 - 15 mm, a frequency of 0.05 Hz, a 1
mm gap and at a constant temperature of 25 °C. Results such as the critical stress ( crc) at
G' and G '', and the time to reach these crc were further tabulated.
Microbiological Studies.
Inoculation of the gels: The gels were prepared at each pre-determined concentration by
preparing a 90 g which is the amount of water that would be equal to the amount in the
inoculating suspension. A 9g sample was taken from this gel and I mL of the microorganism
suspension containing lx107 microorganisms/ml was added to it. The inoculated gel was
then homogenized and kept at 22 °C. The microorganism concentration was measured at 434
nm using a Siemens BX4 microbiological spectrophotometer.
Preparation of the calibration curves. The calibration curves were prepared using the
McFarland scale. Each different gel at its respective concentrations was inoculated with
the test microorganisms at the Mcfarland scale of 2, 4, 8 and 10 which corresponded to
6.0x10⁸
, l.2x109, 2.4x10
9, and 3.0x10
9 microorganisms/ml respectively. Their
absorbance was then measured at 434 nm. These measurements were used to construct
the calibration curves.
Determination of the bacterial growth rate: The changes in the microorganism density
of the inoculated gels were measured at 0, 6, 12 and 24 hours. Each sample was prepared
in quadruplicate. The rate of microorganism growth was determined by means of
calculating the inverse of the slope using a linear regression as described by Orth (1980).
16

A mean growth rate for each gel concentration is defined as the mean growth rate of all
the growth rates of the bacteria used. This value was used in rheological property
correlations. The growth obtained after 24 hours, these are the values obtained on the 2°d,
3rd and 4th days were not used because the bacteria had visibly modified the rheological
properties of the gels after this period.
Statistical Evaluation
The microorganism growth rate was statistically evaluated using the Pearson
correlation parameter. The relationship between the growth rate and the parameters of
interest (G' and G" at the linear region, critical stress at (G' and G"), time at these critical
stresses, osmotic pressure and concentration) was studied with Minitab v. 8.01 software.
Multiple regression analysis was performed to study the significance of all the variables. The
contribution of the significant variables was further tested by best subset and stepwise
regression analysis in order to deduce any statistical significance and the relationship
between growth the rate and the aforementioned variables.
Results and Discussion
Water activity and Osmotic Pressure of the gels: Since the microorganisms used in
this study can grow in substances with water activities of 0.95 and more, all of the gels
could provide suitable growth environments for the test microorganisms used. They all
had similar affinities for water molecules (see Table II), making them extremely suitable
for microbial growth.
Since the water activity measured in our systems provided a narrow range
between 0.987 to 0.998, Table II, while the osmotic pressure varied from 2.75 to 416.5
m-Osm, the osmotic pressure provided a more sensitive parameter than the water activity
to be used in microbial growth evaluations.
17

00
Table II. Rheological Parameters taken at 0.05 Hz, the gel pHs, Osmotic Pressures, Water Activities and the Mean Growth ratesat the Different Gel Concentrations Used.
Gel Concentration Critical Critical PH Osmotic Water Mean Time at c~ Time at G' G'' at the G'atthe Stress at G" Stress at G' Pressure Activity Bacteria I Critical Critical Linear Linear
(f'R) (PR ) (mOsm) Growth Stress Stress Region Re gion Rate (seconds) ( seconds)
(Hours/I log increastl_
Kappa 3.0% I 78 6.05 6.8 18 .75 0.992 39.7 442.5 563 .1 31.9 222.4 Carrageena n
(\ 'V71 I' ) 5.0 % 20.57 30.94 7.3 37.75 0.992 45 .7 683.7 723 .9 319.3 2,832 .9 7 0% 48.43 69.52 7.4 53 .0 0.991 71.9 723 .9 764 . I I. 164 2 7.671 7
Water Luc k A- 0.3 % 0.07 0.11 7.9 2.75 0.995 31 .6 80.5 120.7 27 . I 70 .7 1110
0 5 % 0.23 0.50 7.9 7.0 0.994 26.2 201 .2 280.8 89.1 196.5 0.7% 2.35 3.45 7.9 I 1.5 0.993 26.0 442 .5 482 .7 I I 2.7 582 .7
Water Loc k 0.7% 4.85 I 5.23 6.9 9.75 0.995 16. 8 524 .6 645 . I 14 .25 90 8 00-223
10% 7.1 I 23.3 6.9 20.5 0.994 19.6 563 . I 683 .6 39.9 461 6 1.3 % 23.3 47.8 7.0 25.5 0.993 30.5 683 .6 764 .2 44 .9 496 6
Car bo pol 97 1 0.5 % 0.89 7.05 5.1 15 .25 0.994 53 .2 28 1.5 522.8 4.86 49 29
2.0 % 9.27 24 95 5.1 36.25 0.993 92 .6 403 .8 564 .8 I I .42 123 3
4.0 % 33 .99 63 .87 5.2 70.5 0.990 I 75 .8 482 .5 643 .3 24 7 188 4
La mbda 3.0% 0.29 0.23 5.6 I 70.75 0.992 48.8 201 .0 20 I 0 6.6 29 3 Carragecnan
(lll.V ) 5.0 % 0.34 0.49 5.4 298.0 0.990 40.6 241.3 281.5 I 5.84 56.1 7.0 % 1.05 1.05 6.8 4 16.5 0.987 28.9 362 .0 362 .0 16 .1 65 4
Guar gum 1.5% 0.3 5.46 7.4 I 3.5 0.998 143 .8 160 .9 482.9 4.67 19
I 75 % O.R9 I I .29 7.5 20.0 0.997 41.7 281.5 563 .0 14 .6 I I 8 1 ()OU 785 .1.1 57 77 40.0 01)% 40.0 52.1 I (>X .1 7 29 (> 24 I
......

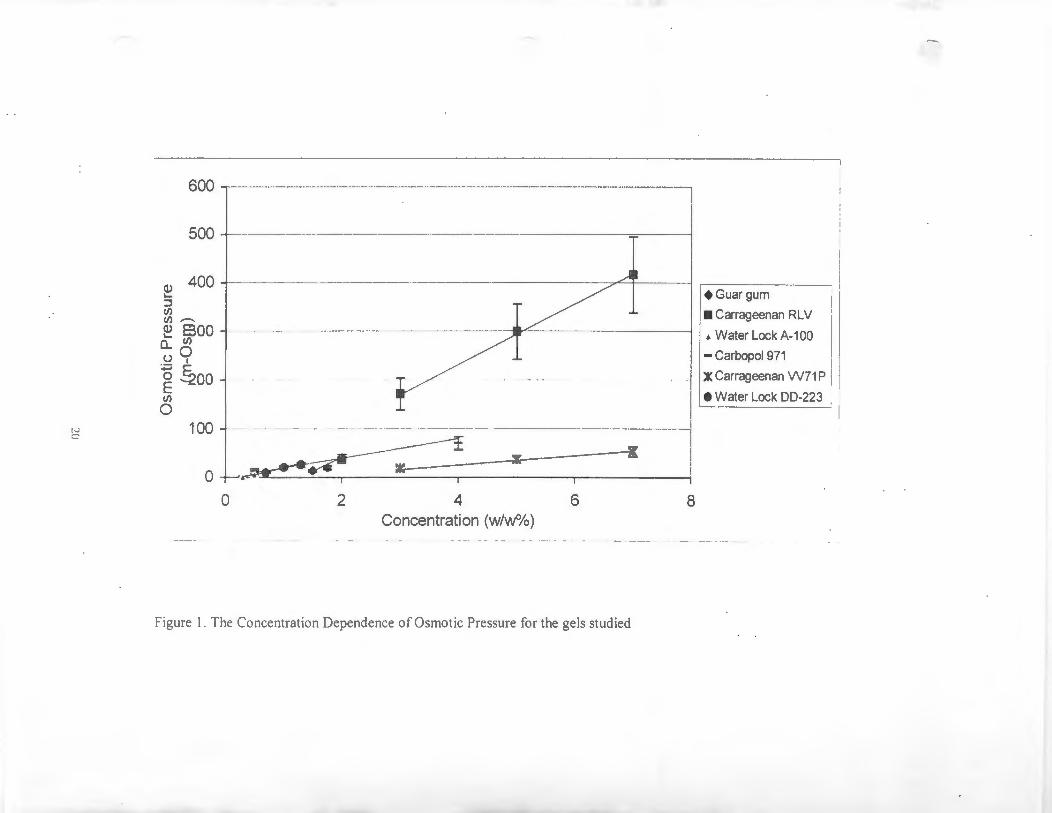
The osmotic pressure data showed significant differences between the gels. The
highest osmotic pressures were obtained with Carrageenan type RL V, having 171.8,
298.0 and 416.5 m-Osm at 3.0%, 5.0% and 7.0% concentrations respectively. The lowest
osmotic pressure was provided by Water Lock A-100, having 2.8, 7.0 and 11.5 m-Osm at
0.3%, 0.5% and 0.7% concentrations respectively. Except Water Lock DD-223, all of the
gels demonstrated a linear dependence of the osmotic pressure on the concentration,
regardless of their physical-chemical differences (Figure I). When the osmotic pressure
differences of Carrageenan VV7 l P and RL V are compared, it is seen that the latter has an
osmotic pressure IO times higher than Carrageenan VV71P (Table II). The reason can be
explained by the higher ionization potential of Carrageenan RL V. It has more (-OS03)
groups than Carrageenan VV7 l P.
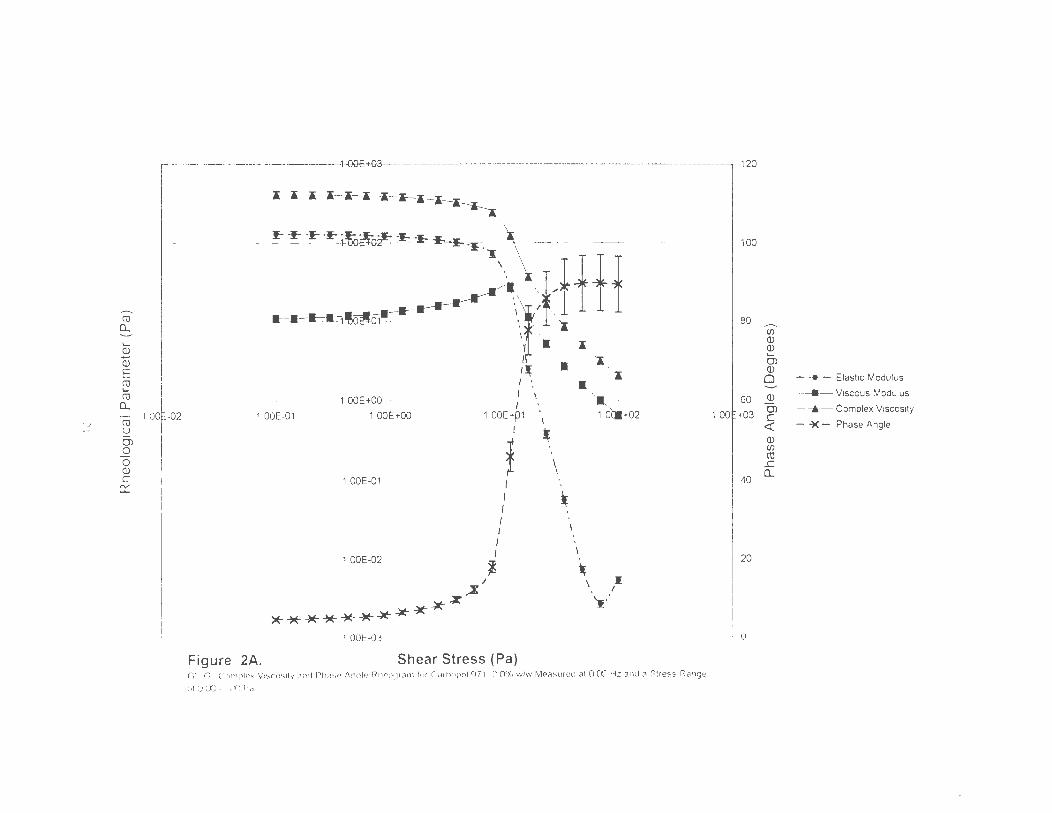
Rheological Characteristics of the gels. Figures 2A and B are representative of the
rheological behavior of the gels studied. They can be classified in two groups. Figure
2A is an example of the rheological profiles of the first group, where the viscous modulus
(G") increases with increasing stress. Carrageenan VV71P and RLV, Carbopol 971 and
Water Lock DD-223 demonstrated the same behavior and were included in this group.
Figure 2B illustrates rheological behavior of the second group, which included guar gum
and Water Lock A-100. The viscous modulus (G") of those gels decreased with
increasing stress. Their rheological profiles indicate a shear thinning behavior within
0.05-100 Pascal stress range.
In the first group of gels, there is an increase in the G" with increasing stress,
whereas G" of the second group of gels decreases with increasing stress (Figure 2B). In
the first group the critical stress (crc), the point where the elastic modulus (G') starts to
19
~
600 - ·---· ·----·-·-·---·---·---·-···---··--···-·-··· ----- ·· ----·----·-·-·-·----·--------·---------- ---·--·----
500 ~-·---
Q) 400 -t----· 1-::::i If) If) ,,......_
~ soo -lt---
0... If)
u9 ~ ~00 E If)
0 100 -----------·--------
0 -~ y 1K
r-- ~ . I
0 2 4 Concentration (w/vv%)
6 8
Figure I . The Concentration Dependence of Osmot ic Pressure fo r the gels st ud ied
•Guar gum
• Carrageenan RLV 1 ~Water Lock A-100 I - Carbopol 971
1 1
:.lK Carrageenan W71 p I I
•Water Lock 00-223
------.
('\J
0... ~
'-Ql (i) E ('\J '-('\J
0...
Iv ro 1 OOl:-02
u (J) 0 0 Ql .L 0:::
---'+1-+.0 .... 0E+03---·-·------·------------------- ··- ·-----------·-- - ---- 120
I X-X----1-~~~~~
I ----1100 ~ -~ -~ -~ 1toe:!-02!! -:1- -:I- ..... ·:1----t: "'\
- 1.00E+OO· -
1 OOE-01 1 OOE+OO
1.00E-01
1.00E-02 '
********-)(-.x-~
±f_ffj \ '/ I I~ I
I . 'I
1.00E+p1
,XI
I
f I I I I I I I .,,
\
~
·., •
\
~
'x
II..
'I, 'a
·- ~+~2
- I \ I
~:
80 Cf)
Ql Ql '-Ol Ql 0 ~
60 Ql
1 OOE+03 Ol c <( Ql Cf) ('\J .L
40 0...
20
·· 1 OOE-03 - ' 0
Figure 2A. Shear Stress (Pa) G ·. G. Cornplex V1scos1ty and Pl1<ise Angle Rl1eoor<i111 for C<i1 IJopol 971 2 0% w/w Measured <ii 0 Cl'.) Hz anct a Stress Range
of OCO . !CO Pa
.....
- ·• - Elastic Modulus
--- Viscous Modulus
-..- Complex Viscos ity
- ~ - Phase Angle

,..-..,.
ro 0... ..._... CJ) I.... Q) ....., Q)
E ro I....
ro 0...
N ro l.J u O') 0 0 Q) ..c a:
--- -+-OGE+G-3,--------- 100
,I+ 90
I I I 80
I--~~1 ! ~}ootor:~ I:: -I:: ·i--1-~i ___ ~f I 70
t-t:=~r-r+i t fy.i~ ;:.it.' ,)'' \ 60 i r 1 ·r~·~' OJ f +f ~f-f-f-~o~of'-f-f-f-f-f~r-f . . ,\ '\ so ;
I <i::
1 00~-02 1.00E-01
1.00E+OO •
1.00E+OO 1.00E+01
· ---- ·---··-----· ·------·----1.0GE-Ol------·-- · - . ----·---.....
Figure 28. Shear Stress (Pa)
40
30
1 . ~0f~ !
10
0
G", G' , Complex Viscosity and Phase Angle Rheogram for Guar gum 2.0%w/w Measured at 0.05 Hz and a Stress Range of 0.00 - 100 Pa
(lJ (/)
cu .!: Q_
~
- -• - Elastic Modulus
--- Viscous Modu lus --A-·- Complex Viscosity
- ~- Phase Angle

( dissipate, coincides with the maximum structural buildup in the viscous modulus
(G"). Such behavior may indicate an increased entanglement of the molecules, resulting
in rigid centers, which in turn may cause eventual breakage.
Table II also includes the critical stresses ( crc) at which the elastic and the viscous
moduli begin to diminish, indicating destruction of the microenvironment,
disentanglement of the chains and breakage of the weak intermolecular bonds. The
critical stresses for G' and G" are time dependant.
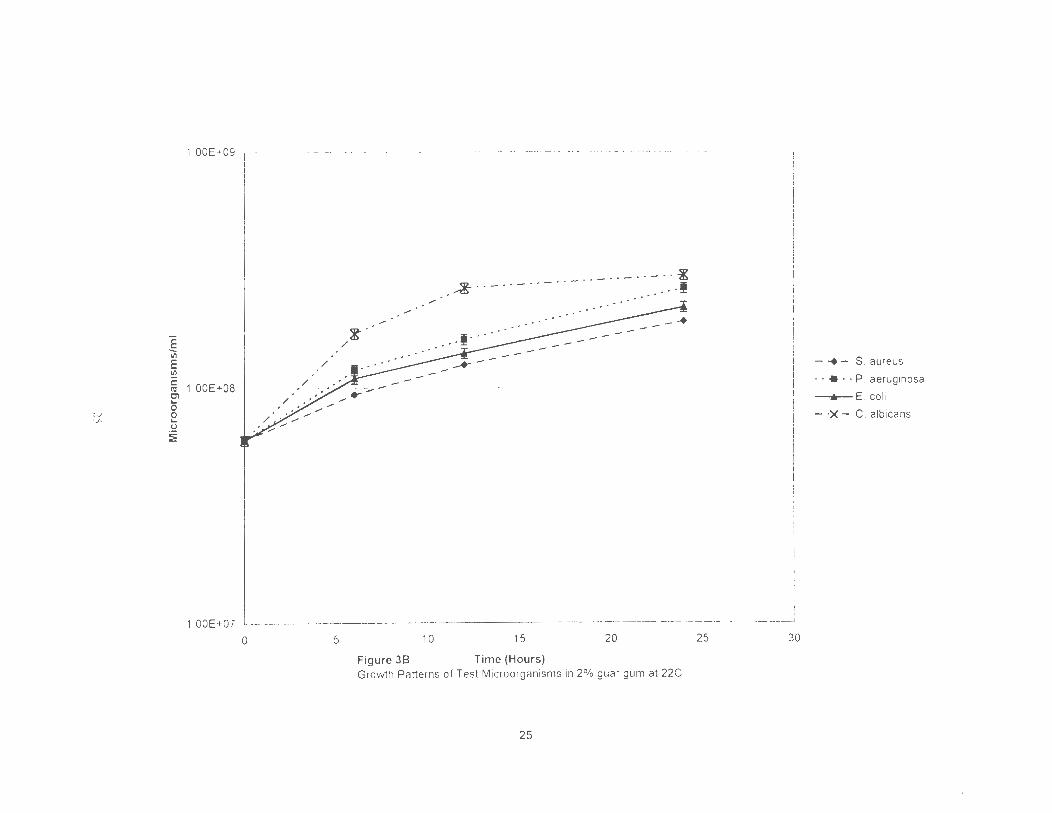
Microorganism growth observed. Figures 3A and B demonstrate the growth pattern of
the test microorganisms in Carbopol 971 and guar gum. The growth rates were
calculated from the slopes of the profiles and are shown in Table III.
No information was available as to whether or how the selected microorganisms
utilized the gels as a nutritional source. The availability of the functional groups that
could be metabolized by the microorganisms was not known. Therefore, this fact could
not be quantified and included in the statistical analysis.
Multiple regression analysis was used to seek the significance of the relationship
of the growth rate with each variable shown in Table II. These variables were G" and G"
at the linear region, the critical stress at G" and G', the time at the critical stress at G" and
G', the concentration and the osmotic pressure. Table IV demonstrates the relationship
between the growth rate of each microorganism in all of the gels studied.
For S. aureus R2=0.861, adjusted R
2=0.737 and P=0.004, and for E. coli R2=0.84,
adjusted R2=0.698 and P=0.008. T~1ere is a significant influence of all the variables
studied, including the rheological parameters.
23

1.00E+09 ----------- --·- -··
1.00E+08
. ~· ~. :_.:.. --= --= :_· :.: :.. ·:_ ·:_ --= :_· :_·:...:.. t ·-· .:-·..:... ·..=. ·-= :...: :-·
E Vi E
.. - .. - .. -.. -··- ··---------1 Ill
t: ro C1 ... 0
h J 0 A ...
.S1 ~
1.00E+07
1 OOE+06
0 5 10 15 20
Figure 3A Time (Hours) Growth Patterns of Test Microorganisms in 2% Carbopol 971 at 22C
25 30
~---......
- -.- S aureus
· · • - · P . aeruginosa
---..- E. coli
- ·X - C . albicans
Iv 'J •
1 OOE+09 ·· -·· •· -... ---··· · ··· --· · -- -·· - ------- --·- --------···-···-··---··· -·-·· -···- ---- - ..... - ·--···-··. ··1
E Vi E I/)
~ 1.00E+OB · en ... 0 0 ... u ~
1.00E+07
0
/
/
5
..... .....
..... ~·
~- · - . . - .. --· -·· - --- . ·-. ·~ .. ··' ...
I I I
I I
I I
j I
I I
I -----__ ___J
10 15 20 25 30
Figure 38 Time (Hours) Growth Patterns of Test Microorganisms in 2% guar gum at 22C
25
- ... - S. aureus
· · • · · P. aerug1nosa
----.-- E. co li
- ·>< - C. albicans
'

( Table Ill. Growth Rates of the Test Microorgani sms (hours I I log increase) at Three Different
Gel Concentrations. Higher Values of Growth Rate Indicate Slower Growth. Gel Microorganism Growth Rate (Hours / 1 Log increase) at
Carbopol 971 each specific concentration Type cJ 0.50% 2.00% 4.00% growth•
Candida albicans (X) 89.3 161 .2 22.1
Escherichia coli (- ) 21 .5 97.1 370.4
Pseudomonas aeruginosa (+) 73.5 52.6 24.9
Staphyloccoccus aureus (- ) 28.3 59.5 285.7
Mean Growth Rate (- ) 53.2 92.6 175.8
Wat.er Lock DD-223 0.70% 1.00% 1.30%
Candida albicans (- ) 14.1 17.8 46.9
Escherichia coli (X) 14.3 24.9 24.9
Pseudomonas aeruginosa (X) 17.7 16.8 27.1
Staphyloccoccus aureus (X) 21 .0 18.7 23.3
Mean Growth Rate (- ) 16.8 19.6 30.5
Guargum 1.50% 1.75% 2.00%
Candida albicans (+) 74.6 55.9 26.7
Escherichia coli (- ) 17.1 40.9 45.0
Pseudomonas aeruginosa (X) 434.8 34.1 39.4
Staphyloccoccus aureus (X) 48.8 35.7 49.0
Mean Growth Rate (+) 143.8 41 .7 40.0
Wat.er Lock A-100 0.30% 0.50% 0.70%
Candida albicans (X) 34.7 23.4 34.7
Escherichia coli (X) 31 .0 30.4 35.7
Pseudomonas aeruginosa (+) 34.6 20.7 14.0
Staphy1occoccus aureus (X) 26.0 30.2 19.5
Mean Growth Rate (X) 31 .6 26.2 26.0
Lambda Carrageenan 3.00% 5.00% 7.00%
(RLV) Candida albicans (+) 71 .4 55.6 34.2
Escherichia coli (+) n .5 31 .9 27.7
Pseudomonas aeruginosa (- ) 22.3 24.7 27.6
Staphy1occoccus aureus (X) 23.9 50.3 25.8
Mean Growth Rate (X) 48.8 40.7 28 9
Kappa Carrageenan 3.00% 5.00% 7.00%
(W71P) Candida albicans (X) 42.7 54.4 39.8
Escherichia coli (- ) 24.2 43.2 53.5
Pseudomonas aeruginosa (X) 69.0 41 .2 166.7
Staphyloccoccus aureus (X) 22.9 44.1 27 6
Mean Growth Rate (- ) 39.7 45.7 71 9
*(+)indicates increasing growth rate with increasing concentration,(-) indicates decreasing growth rate with increasing concentration, (X) denotes no pattern of growth with concentration.
26

( Table IV. Statistical evaluation between the microorganism growth rate and the selected
variables through multiple regression analysis (n=8).
Predictor S. aureus E.coli P. aeruginosa C. albicans
Coeff. p Coe ff. p Coe ff. p Coe ff. p
Constant 35.08 0.35 67.63 0.22 5.1 0.96 73.12 0.16
Concentration 2309 0.07 3191 0.08 -518 0.88 363 0.82
Time at G"crc -0.17 0.19 -0.09 0.61 -1.01 0.02 -0.17 0.30
Time at G'crc 0.05 0.71 -0.10 0.62 0.91 0.04 0.06 0.72
G" linear 0.22 0.49 0.33 0.47 -0.26 0.78 -0.41 0.34
G' linear -0.08 0.14 -0.11 0.16 0.06 0.69 0.07 0.36
crc at G" 8.69 0.08 10.20 0.13 7.60 0.55 -1.99 0.74
crc at G' -1.43 0.57 -1.01 0.77 -4.67 0.52 1.09 0.74
Osmotic -0.30 0.16 -0.46 0.13 0.19 0.73 -0.04 0.87
pressure
p 0.004 0.008 0.274 0.921
R~ 0.861 0.840 0.574 0.239
Adjusted R2 0.737 0.698 0.195 0.000
27

P. aeruginosa, R2=0.574, adjusted R2=0.195 and P=0.274, as well as C. albicans,
R2=0.239, adjusted R2=0.000 and P=0.921 demonstrated a poor model.
In order to determine the degree of contribution of the variables, two more
statistical analysis were applied on the systems. Best subset analysis provided key
information as to which subset of variables may provide the best correlating model.
Stepwise regression analysis was also used to include or discard variables in the model
according to their influence. First the 95% confidence level (P=0.05) was accepted, and
the models were selected based on their adjusted R2.
An example of the selection and use of the statistical method is show for E. coli.
In Table V.A the use of all the variables to explain the growth was found significant
(P=0.008). The significance was improved further by the use of a stepwise regression
analysis (P=0.000, R2=0.754, adjusted R2=0.701), Table V.B. 3ut the best subset
analysis allowed us to further improve the model with an R2 of0.835, adjusted R2=0.744
and P=0.001 (Table V.C), therefore, because of the improvement of the statistical
parameters, the model selected by the best subset analysis was accepted.
For all the microorganisms used the three tests were used as detailed in Table VA,
B, and C. Additional data is given in Appendix 2. The following models best describe
the contributions of the factors studied (Table II) on the growth rate of S. aureus, E. coli
and P. aeruginosa. No model was found suitable to represent C. albicans.
(S. aureus) GR = 54.1 + 2188*C - 0.171 *G"T - 0.0451 *G'L + 6.36*G"C -
0.2792*0P ........................................................................................... (3)
R2=0.85, adjusted R2=0.788, P=0.000
28

( Table V Selection of the best model to represent the growth rate of E. coli
Table V.A Regression Analysis using all variables for E. coli
The regression equation is Growth rate= 67.6 + 3191 Concent - 0.088 Time GG - 0.099 Time G + - -0.333 GG lin
- 0 .115 G lin + 10.2 GG crit - 1. 01 G crit - 0.464 Osm_pres
Predictor Coef StDev T p
Constant 67. 63 51. 01 1. 33 0.218 Concent 3191 1627 1.96 0.081 Time GG -0.0883 0.1677 -0.53 o. 611 Time G -0.0993 0.1906 -0.52 0.615 GG lin 0.3326 0.4425 0.75 0. 471 G lin -0.11474 0.07487 -1. 53 0.160 GG crit 10.201 6.149 1. 66 0 .131 G crit -1. 011 3.465 -0.29 0.777 Osm_pres -0.4641 0.2778 -1. 67 0.129
s = 44.60 R-Sq 84.0% R-Sq(adj) = 69.8%
Analysis of Variance
Source DF SS MS F p
Regression 8 94080 11760 5.91 0.008 Residual C..:ror 9 17899 1989 Total 17 111987
Table V.B Regression Analysis using stepwise regresion analysis for E. coli
The regression equation is Growth rate 101 - 0.252 Time GG - 0.281 GG lin + 9.63 GG crit
Predictor Coef St Dev T p
Constant 101.31 28.51 3.55 0.003 Time GG -0.25158 0.08201 -3.07 0.008 GG lin -0.28070 0.05986 -4.69 0.000 GG crit 9.631 1. 492 6.46 0.000
s = 44.40 R-Sq 75.4% R-Sq(adj) = 70.1%
Analysis of Variance
Source DF SS MS F p
Regression 3 84380 28127 14 .27 0.000 Residual Error 14 27599 1971 Total 17 111979
29

( Table V.C Regression Analysis using best subset analysis for E. coli
The regression equation is Growth rate= 74.7 + 3516 Concent - 0.193 Ti me G + 0.363 GG lin - 0.119 G lin
+ 8.25 GG crit - 0.531 Osm_pres
Predictor Coef St Dev T p
Constant 74.75 41. 48 1. 80 0.099 Concent 3516 1397 2.52 0.029 Time G -0.19307 0.07949 -2.43 0.033 GG lin 0.3629 0.3615 1. 00 0.337 G lin -0 .11880 0. 05729 -2.07 0.062 GG crit 8.247 1. 454 5.67 0.000 Osm_pres -0.5308 0.2276 -2.33 0.040
s = 41.05 R-Sq 83.5% R-Sq (adj) = 74.4 %
Analysis of Variance
Source OF SS MS F p
Regression 6 93448 15575 9.24 0.001 Residual Error 11 18532 1685 Total 17 111980
30

( (E. coli) GR= 74.7 + 3516*C - 0.193*G'T + 0.363*G"L + O.l 19*G'L + 8.24*G"C -
0.53*0P .............................................................................................. (4)
R2=0.835, adjusted R2=0.744, P=0.001
(P. aerugunosa) GR 48.0 0.859*G"T + 0.655*G'T +
0.0323*G'L ......................................................................................... (5)
R2=0.52, adjusted R2=0.417, P=0.014
Where GR is the growth rate of the respective microorganism, C is the concentration of
the gel, G"L is G" at the linear region, G'L is G' at the linear region, G"C is the critical
stress at G", G'C is the critical stress at G', G"T is the time of the critical stress at G", G'T
is the time of the critical stress at G' and OP is the osmotic pressure of the gel at the given
concentration.
Table VI further summarizes the contributions of each variable studied. Except
for C. albicans the elasticity of the gels appears to be the commonly shared characteristic
that affects the growth rate of the microorganisms studied, S. aureus, E. coli and P.
aeruginosa. The viscosity of the system at critical shear appears to be a significant
factor, so does the time at G"crc and time at G'crc. The elastic strength of the gels (G'crc)
is not considered to be any influence on the growth rate models. Although not as
influential as the concentration of the gels, the osmotic pressure appears to be a
significant factor.
31

~
Table VI. Statistical Test of the Significance of the Variables in the Models Used to Relate the Rheological Parameters and Bacterial
Growth Rate.
Gel Property
Bacterial Growth Coneentrati Time at G" Time at G' G" at the G' at the G" ere G' ere (Pa) Osmotic
Rate on (w/wo/o) ere (sec.) ere (sec.) Linear Linear Pressure
(Pa)
Region (Pa) Region (Pa) (m-Osm)
C. albicans (NS) (NS) (NS) (NS) (NS) (NS) (NS) (NS)
E. coli (Eq. 3) 0.029(2"d) (NS) 0.033(3'd) 0.337(NS) 0.062(NS) 0.000(J SI) (NS) 0.040(41h) <.,; Iv
0.006(2nd) 0.020(3'd) P. aeruginosa (NS) 0.002(1 st) (NS) (NS) (NS) (NS)
(Eq. 4) 0.007(3'd) 0.000(2"d) 0.073 (NSl S. aureus 0.030(41h) (NS) (NS) 0.000(1 st) (NS)
(Eq. 5)

( The negative and positive dependence on the growth rate by the concentration
was also analyzed statistically. The cases where the growth rate decreased with
increasing concentration seemed to fit the models with great significance (R2=0.837,
P=0.000). On the other hand, the cases where the growth rate increases with increasing
concentration do not fit the proposed models (R2=0.357, P=0.748). The mean growth
rates observed in Table III show that the gels with more solid properties such as Carbopol
971, Water Lock DD-223 and Carrageenan VV71P provided decreasing growth rates at
increasing concentrations. This observation verifies the effect of elasticity. The reason
why P. aeruginosa and C. albicans have not demonstrated rheology-dependent growth
rate may be explained by the strong metabolizing ability of P. aeruginosa, which can
even metabolize aromatic carbohydrates, and the extremely large size of C. albicans
(more than 100 times larger than the rest of the microorganisms).
Overall, this study demonstrated that the rheological properties have some
influence on the growth rate of some microorganisms, regardless of the chemical
structure, nature and varying concentration of the gels studied.
33

( References
Atsumi, T., Maekawa, Y., Yamada, T., Kawagishi, I., Inae, Y. and Hamma, M., Effect of
viscosity on swimming by the lateral and polar flagella of Vibrio alginoliticus,
Journal of Bacteriology, 178:5024 - 5026, (1996)
Ballesteros, S.A., Chirife, J. and Bozzini, J., Specific solute effects on Staphylococcus
aureus cells subjected to reduced water activity, International Journal of Food
Microbiology, 20:51 - 66, (1993)
Clarke, P. and Richmond, C., Genetics and biochemistry of Pseudomonas, John Wiley
and Sons, NY, 197 5
Cohn, J., The Staphylococci, Wiley Interscience, NY, 1972
Csonka, L.N., Physiological and genetic responses of bacteria to osmotic stress,
Microbiological Reviews, 53:121 - 147, (1989)
D.S. Orth, Establishing cosmetic preservative efficacy by use ofD-values, Journal of the
Society of Cosmetic Chemists. 31: 165-172, ( 1980)
Eisman, P., Cooper, J. and Jaconia, P., Influence of gum tragacanth on the bacteria
activity of preservatives, Journal of The American Pharmaceutical Association,
46: 144 - 147, ( 1957)
Ferrero, R.L. and Lee, A., Motility of Campylobacter jejuni in viscous environments:
comparison with rod shaped bacteria, Journal of General Microbiology, 134:53 - 59,
(1988)
Greenberg, E.P., Canale-Parola, E., Relationship between cell coiling and motility of
spirochetes in viscous environments, Journal of Bacteriology, 131:960 - 969, (1977)
34

Guiselly, K.B., Chemical and physical properties of algal polysaccharides used for cell
immobilization, Enzyme Microbial Technology, 11 :706 - 716, (1989)
Kets, E.P., de Bont, J.A.M. and Heipieper, H., Physiological responses of Pseudomonas
putida 512 subjected to reduced water activity, Microbiology Letters, 139: 133 - 137,
(1996)
Lawrence, J.R., Korber, D.R. and Caldwell D.E., Behavioral analysis of Vibrio
parahaemolyticus variants in high and low viscosity microenvironments by use of
digital image processing, Journal of Bacteriology, 174:5732 - 5739, (1992)
McCarthy, T.J. and Myburgh, J.A., The effect of tragacanth gel on preservative activity,
Pharmaceutisch Weekhlad, 109:265 - 268, (1974)
McFarland, J., The Nephelometer, Journal of the American Medical Association,
49:1176, 1907
Niedhart, F., E.coli and Salmonella typimurin, cellular and molecular biology, American
Society for Microbiology, Washington, 1987
Odds, F.C., Candida and Candidiosis, 2nd ed. Bailliere Tindall, Toronto, Ca., 1988
Schlegel, H., General microbiology, 2nd ed., Cambridge University Press, 1993
Stecchini, M.L., Torre, M., Sorais, I., Soro, 0., Messina, M. and Maltini, E., Influence of
structural properties and kinetic constraints on Bacillus cereus growth, Applied and
Environmental Microbiology, 64:1075 - 1078, (1998)
Yanagi and Onishi G., Assimilation of selected cosmetic ingredients by microorganisms,
Journal of the Society of Cosmetic Chemists. 22:851, (1971)
35

( Appendix 1 (Growth Rate Curves)
36

(
(
6.00E+08 _,
5.00E+08 E --(/) E 4.00E+08 .le c
3.00E+08 C'll
~ 0 2.00E+08 0 u ~ 1.00E+08
O.OOE+OO
a)
1.85E+09
1.65E+09 _J
145E+09 .§ (/) 1.25E+09 E (/) 1.05E+09 -c co
8.50E+08 Cl
0 6.50E+08 e
(.)
4.50E+08 ~ 2.50E+08
5.00E+07
b)
Staphylococcus aureus in Carbopol 971 NF Growth Rate Curve
0 6 12 24
Time (Hours)
Staphylococcus aureus in Water Lock DD-223 Growth Rate Curve
0 6 12 24
Time (Hours )
1~4.00%
1- oCJ - 2.00%
)-A -o.so% I
l -0--1 .30% ! i- .a - 1.00% I :-A-070% 11 ~------j
I
Figure Al.I Bacterial growth rate observed for S. aureus in a) Carbopol 971, b) Water Lock DD-223
37

(
4.00E+08
_J 3.50E+08 E -- 3.00E+08 (/)
E .!!1 2.50E+08 c C1l e> 2.00E+08 0 0 1.50E+08 '-(.)
~ 1.00E+08
5.00E+07
a)
Staphylococcus aureus in Guar gum Growth Rate Curve
-I----~
0 6 12 24
Time ( Hours )
Staphylococcus aureus in Water Lock A-100 Growth Rate Curve
6 12 24
Time ( Hours )
I
. I j-0--2.00% 11
!- "° - 1.75% ! I I '
,--6-1.50% 11
,-o--0.70% ,I 1. <l - 0.50% r' I · 1
l-.6 -0.30% i I
Figure A 1.2 Bacterial growth rate observed for S. aureus in a) Guar gum, b) Water Lock A-1 00
38

a)
ii I
b)
8.50E+08
_J 7.50E+08 -E 6.50E+08 --"' E 5.50E+08 "' ·c
4 .50E+08 co Cl 0 3.50E+08 0 ..... 2.50E+08 <.)
~ 1.50E+08
5.00E+07
Staphylococcus aureus in Carrageenan RLV Growth Rate Curve
- - 0
0 6 12 24
Time (Hours )
~7.00% 1 1
- o(] - 5.oo% I I I -ll.-3.00% J
Staphylococcus aureus in Carrageenan VV71 P Growth Rate Curve
1.00E+09 _J
~ 8.00E+08 E .~ 6.00E+08 c
"' ~ 4.00E+08 e ~ 2.00E+08
O.OOE+OO
---- -+ _ L
_____ ,,zL
0 6 12 24
Time ( Hours )
· ~7.00%
- (J - 5.00%
-ll. -3.00% '
Figure A 1.3 Bacterial growth rate observed for S. aureus in a) Carrageenan RL V, b) Carrageenan VV7 l P
39
( ------------------ --- -
a)
b)
_J 6.00E+08 ~ 5.00E+08 ~ 4.00E+08 ~ 3.00E+08 g 2.00E+08
Escherichia coli in Carbopol 971 NF Growth Rate Curve
-~ 1 . 0 0 E + 0 8 -+---...._,_- --f'"..,_....--..-, 1--- -"--- ---l
~ O.OOE+OO --+-----------111.a---i
0 6 12 24
Time ( Hours )
Escherichia coli in Water Lock DD-223 GrONth Rate Curve
_J
.€ 8.50E+08 +------------------l (/)
E (/) 6.50E+08 ....------------~~_., ·c: cu ~ 4.50E+08 +---------~----1 0 0 u 2.50E+08 -1------,/ -<nnoo----------1
~
5.00E+O?
0 6 12 24
Time ( Hours )
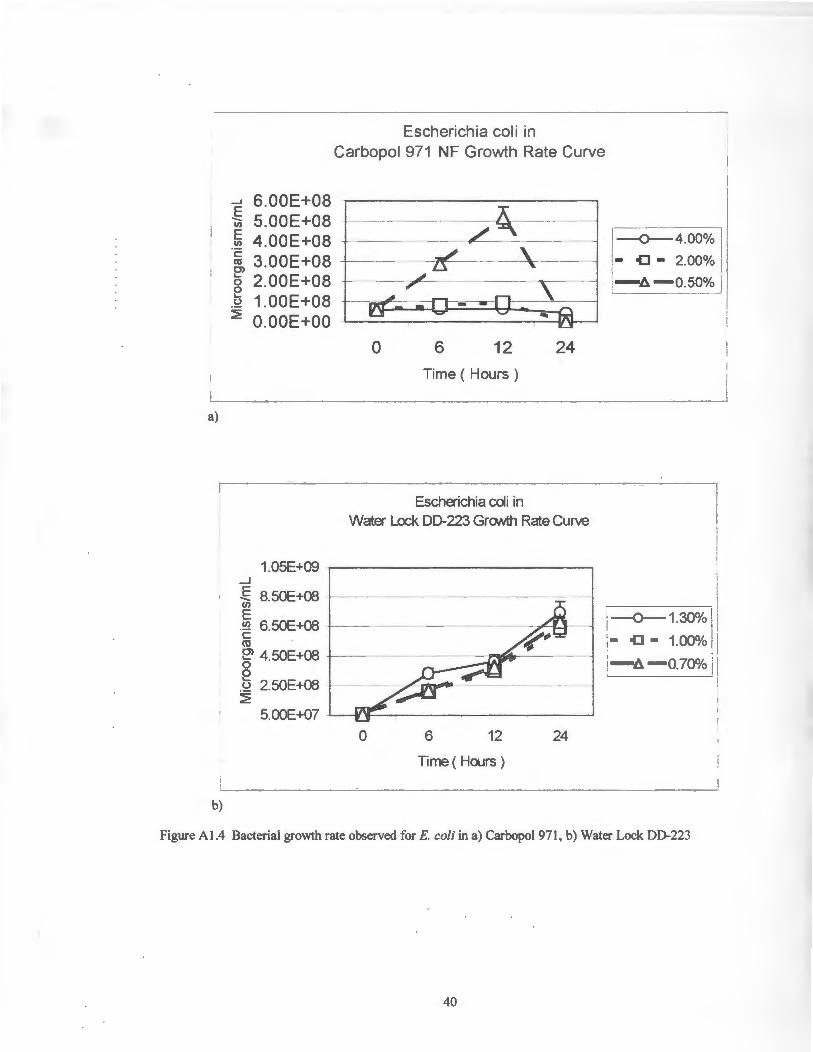
j--o---4.00% I - (] - 2 .00% I
l-b.-0.50% j
I I I I I
i I I 1
~----~! \---0--1 .30% ! i 1- <J - 1.00% !1 !-b.-0.70% 11
Figure Al.4 Bacterial growth rate observed for E.coli in a) Carbopol 971 , b) Water Lock DD-223
40
I I
I
(
a)
b)
Escherichia coli in Guar gum Growth Rate Curve
3.05E+09 ~---------------_J
E 2.55E +09 +----------------J~-1 (;; E 2.05E+09 -1-------------"""----~ (/) ·c: ro ~ 0 e (.)
~
_J
E --(/) E (/)
c: ro O> '-0 0 '-.2 ~
5.50E+08
4.50E+08
3.50E+08
2.50E+08
1.50E+08
5.00E+07
0 6 12 24
Time (Hours)
Escherichia coli in Water Lock A-100 Growth Rate Curve
0 6 12 24
Time ( Hours )
---O-Series1 I - 0 - Series2 I -a -series3 !
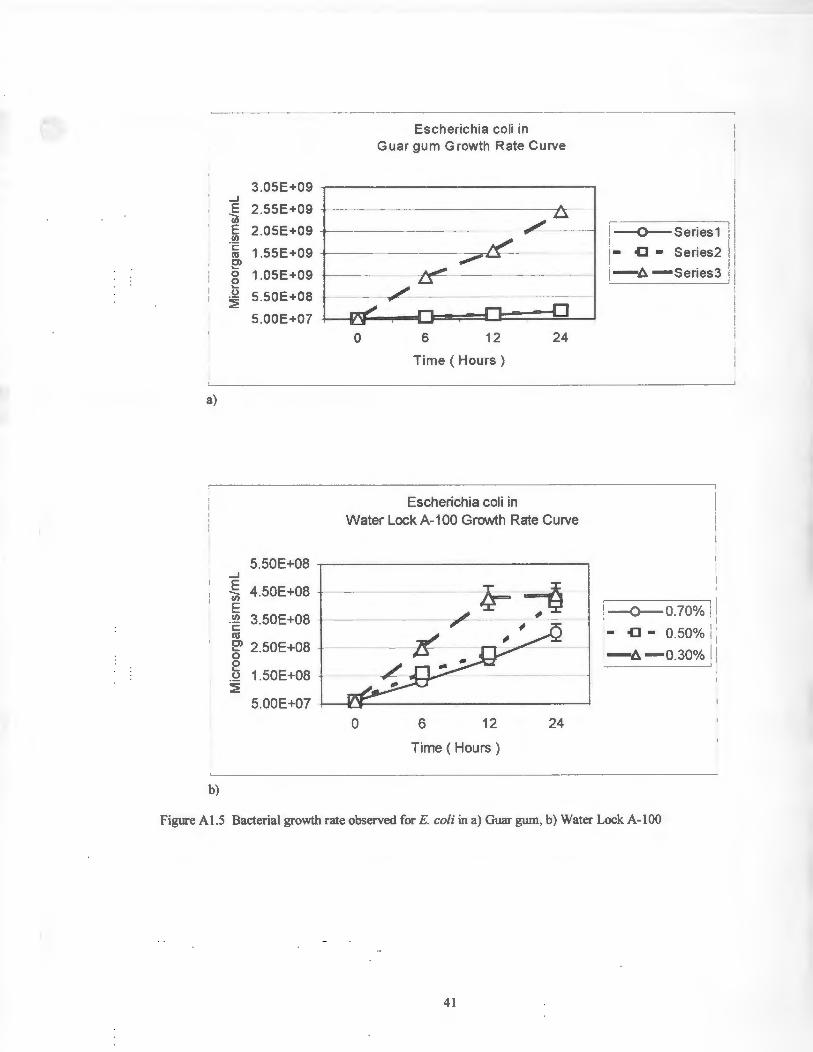
------~1 1~0.70% 11 ! I
'. - o{] - 0.50% i I
!-ti. -0.30% ii
Figure Al.5 Bacterial growth rate observed for E.coli in a) Guar gum, b) Water Lock A-100
41
(
a)
b)
_, E --!/)
E !/)
·c: ctl C) '-0 0 '-.2 ~
_J
6.50E+08
5.50E+08
4.50E+08 -
3.50E+08 -
2.50E+08
1.50E+08 -
5.00E+07
Escherichia coli in Carrageenan RLV Growth Rate Curve
0 6 12 24
Time ( Hours )
Escherichia coli in
Carrageenan W71 P GrONth Rate Curve
1.00E+09 ----------------
.§ 8.00E+08 +---------------1 (/)
E (/) 6.00E+08 ~------------.,,,,__:.=---1 c ctl
~ 4.00E+Q8 +------------.iuu"---o---t 0 ~ u 2.00E+08 _,_ __ _ ~
0 6 12 24
Time ( Hours )
I
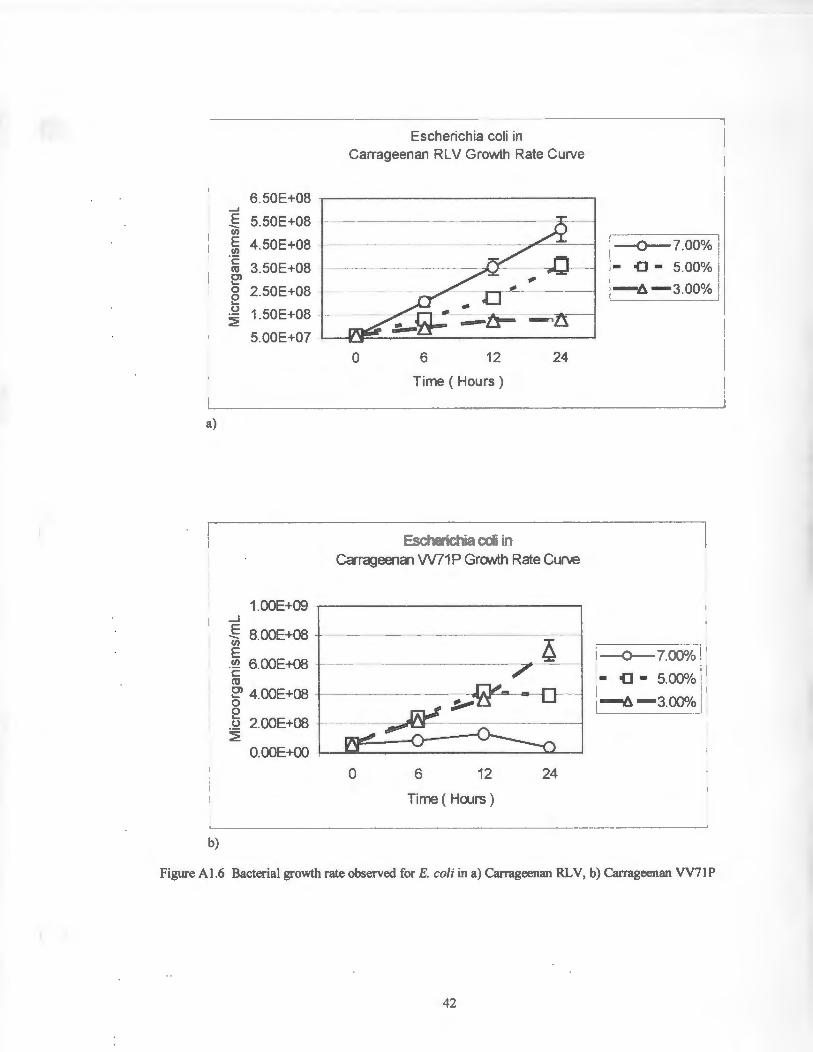
I I~ --o----7-.0-0°lc~o '1 I - <l - 5.00%
-6-300% 111 1.__ ___ • _ _:_j
:~7.00% 1 ;. {] - 5.00% ::
!-6-3000/ i, I . 10 I
I
Figure Al.6 Bacterial growth rate observed for E.coli in a) Carrageenan RLV, b) Carrageenan VV71P
42

----------- -
a)
b)
4.00E+OB ...... E 3.50E+08 (i)
3.00E+08 E .!!1 2 .50E+08 c: ni
~ 2.00E+08 0
1.50E +08 0
.2 1.00E+OB ~
5.00E+07
3.50E+08 E 3.00E+OB Vi E 2.50E+08 .!!1 c:
2.00E+OB ni O>
0 1.50E+08 0
.2 1.00E+OB ~
5.00E+07
Candida albicans in Carrageenan RLV Growth Rate Curve
0 6 12 24
Time (Hours)
Candida albicans in Carrageenan VV71P Growth Rate Curve
0 6 12 24
Time (Hours)
----------------------- -
I
!
i I
I ,~---0------1-. 0-0-%~0 i I ,_ 0 - 5.00% ii
I 1-~ -3.00% Ji
r=--o.- 7 .00% '
,- <l - 5.00% I
1-6 -3.00% 11
Figure 2.3 Bacterial growth rate observed for C. a/bicans in a) Carrageenan RL V, b) Carrageenan VV71 P
43

(
3.50E+08 ....J
E 3.00E+08 --Cl)
2.50E+08 E -~ 2.00E+08 c C1l
e> 1.50E+08 0
1.00E+08 0 '-.52 5.00E+07 ~
O.OOE+OO
' I
a)
1.05E+09 _J
E 8.50E+08 Cii E
6.50E+08 tJ) ·c: (1l Cl 4.50E+08 ..... 0 0 .....
2.50E+08 (.)
~ 5.00E+07 -
b)
0
Candida albicans in Guar gum Growth Rate Curve
6 12 24
Time ( Hours )
Candida albicans in Water Lock A-100 Growth Rate Curve
-0 6 12 24
Time ( Hours )
1--0-- 2.00% I !- <J - 1.75% '1 !--6-1.50% I,
1---o--o.70% I
,_ <l - 0 50% I . I 1 -~-0.30% 1
i
Figure 2.2 Bacterial growth rate observed for C. a/bicans in a) Guar gum, b) Water Lock A-100
44

(
a)
_J
E --(/) E (/) ·c= ('IJ O> ,_ 0 0 ,_ (..)
~
b)
Candida albicans in Carbopol 971 Growth Rate Curve
_J 1.50E+09 E en E 1.00E+09 (/) ·c= ('IJ O>
5.00E+08 -,_ 0 0 t; ~ O.OOE+OO
0 6 12 24 Time ( Hours )
Candida albicans in Water Lock DD-223 Growth Rate Curve
2.55E+09
2 .05E+09
1.55E+09
1.05E+09
5.50E+08
5.00E+07
0 6 12 24
Time (Hours)
l ---0-4.00% I
I- <l - 2.00%
.-I:!. -0.50% I
I , ; . ~1.30% !1 1- <l - 1 .00% 11 I I
1-.6. -0.70% ! j I
Figure 2. l Bacterial growth rate observed for C. a/bicans in a) Carbopol 971 , b) Water Lock DD-223
45

(
1.05E+09 _J
E 8.50E+08 Iii E
6.50E+08 "' ·c: ro C> 4 .50E+08 I-
0 0 ts 2 .50E+08 -~
5.00E+07
a)
1.20E+09 _J
E 1.00E+09 --VI
E 8.00E+08 VI c
6.00E+08 <ti Cl ,_ 0 4.00E+08 -0 ,_ (.)
2 .00E+08 ~ O.OOE+OO
b)
Pseudomonas aeruginosa in Carrageenan RLV Growth Rate Curve
0 6 12 24
Time ( Hours )
Pseudomonas aeruginosa in Carrageenan W71P Growth Rate Curve
.0 .0 --
0 6 12 24
Time ( Hours )
1---0---7.00% I i_ <l - 5.00% :
!-A-3.00% 1
--0- 7.00% I~ 'I
,- <J - 5.00% 1:
-ll.-3.00% !'
Figure 4.3 Bacterial growth rate observed for Ps. aeruginosa in a) Carragenan RL V, b) Carrageenan VV71P
46

a)
b)
E 4.00E+08 --
Pseudomonas aeruginosa in Guar gum Growth Rate Curve
E 3.00E+08 -+------------""i~-l (/)
~ 2.00E+08 __, ___________ t-"7""-----1
.... e 1.00E+08 u
:2 0 .OOE+OO -i------,---------L..),...----<
_J
0 6 12 24
Time ( Hours)
Pseudomonas aeruginosa in Wci..er Lock A-100 Gro.Nth Rate Curve
6.05E+09 --.-----------------,
~ 5.05E+09 -1----------(/)
E 4.05E+09 -1-------------.tl'-------1 (/)
~ 3.05E+09 -i------------,-----1 E'
r=----o--2.00% I 1
- Cl - 1.75% I -ti.-1 .50% I _JI
---0-0.?0% I - i[J - 0.50% 1! -ti.-0.30% ; g 2.05E+09
..... ---------'
~ 1.05E+09 -
5. OOE+O? ..L_--U\~.__.lmt'.Y!!!!........!=l.S:=--==::L.l---l
0 6 12 24
Time ( Hours )
Figure 4.2 Bacterial growth rate observed for P. aeruginosa in a) Guar gum, b) Water Lock A-100
47

(
a)
b)
-- -- - -- - ------~
E 5.00E+08
~ 4.00E+08
Pseudomonas aeruginosa in Carbopol 971 NF Growth Rate Curve
·E1 3.00E+08 -+------~~---ro e> 2.00E+08 _,__ __ _ 0
§ 1 . OOE +08 -t--rr~-::;;;:::::IAi-r -=--i11v-__,,=--.&......_-i
~ O.OOE+OO -'------.--------~
0 6 12 24
Time ( Hours )
___ I i---o--4.00% 1 I I • <l - 2. 00% ! I '-6-0.50% 11 , . I
Pseudomonas aeruginosa in Water Lock DD-223 Growth Rate Curve
_J 3.05E+09 -.----------- -----. E --(/)
~ 2.05E+09 -t-----------...__--1 c ro O> o 1.05E+09 +---e u
~ 5.00E+07
0 6 12 24
Time ( Hours )
---0--1 .30% ,,
,• (] • 1.00% I 1
I
.-6-0.70% '
Figure 4.1 Bacterial growth rate observed for P. aeruginosa in a) Carbopol 971 , b) Water Lock DD-223
48

Appendix 2 (Multiple regression, stepwise and best subset analysis)
49

A) P. aeruginosa - regression analysis using multiple techniques
Regression Analysis using all variables
The regression equation is Growth rate = 5 - 518 Concent - 1.01 Time GG + 0.907 Time G - 0.256 GG lin
+ 0.062 G lin + 7.6 GG crit - 4.67 G crit + 0.195 Osm_pres
Predictor Coef StOev T p
Constant 5.1 101. 9 0.05 0.961 Concent -518 3249 -0.16 0.877 Time GG -1. 0109 0.3349 -3.02 0.015 Time G 0.9075 0.3805 2.38 0.041 GG lin -0.2557 0.8835 -0.29 0.779 G lin 0.0622 0.1495 0.42 0.687 GG crit 7.60 12.28 0.62 0.551 G crit -4.672 6.918 -0.68 0.516 Osm_pres 0.1949 0.5546 0.35 0.733
s = 89.04 R-Sq 57.4% R-Sq(adj) = 19.5%
Analysis of Variance
Source OF SS MS F p
Regression 8 96053 12007 1. 51 0.274 Residual Error 9 71355 7928 Total 17 167408
Regression Analysis using best subset analysis
The regression equation is Growth rate 48.0 - 0.859 Time GG + 0.655 Time G + 0.0323 G lin
Predictor Coef StOev T p
Constant 47. 96 53.81 0.89 0.388 Time GG -0.8592 0.2300 -3.74 0.002 Time G 0.6548 0.2043 3.20 0.006 G lin 0.03225 0.01233 2.62 0.020
s = 75.77 R-Sq 52.0 % R-Sq(adj) = 41. 7 %
Analysis of Variance
Source OF SS MS F p
Regression 3 87033 29011 5.05 0.014 Residual Error 14 80374 5741 Total 17 167408
50

(
B) S. aureus - regresion analysis using multiple techniques
Regression Analysis using all variables
The regression equation is Growth rate = 35.1 + 2309 Concent - 0.168 Time GG + 0.051 Time G + 0.222 GG lin
- 0.0839 G lin + 8.69 GG crit - 1.44 G crit - 0.296 Osm_pres
Predictor Coef Constant 35.08 Concent 2309 Time GG -0.1685 -Time G 0.0513 -GG 1 . __ in 0.2221 G lin -0.08388 GG crit 8.688 G crit -1.437 Osm_pres -0.2962
s = 31.26 R-Sq
Analysis of Variance
Source Regression Residual Error
DF 8 9
St Dev 35.76
1141 0 .1176 0 .1336 0.3102
0.05248 4.310 2.429
0.1947
86.1%
SS 54298.5
8795.9
T 0.98 2.02
-1. 43 0.38 0. 72
-1. 60 2.02
-0.59 -1. 52
R-Sq (adj) =
MS 6787.3 977.3
p
0.352 0.074 0.186 0. 710 0.492 0.144 0.075 0.569 0.163
73.7 %
F 6.94
Regression Analysis using stepwise regresion analysis
The regression equation is Growth rate 72. 9 - 0.0348 G lin + 7.26 GG crit 0.165
Predictor Coef St Dev T p
Constant 72.95 20 .73 3 .52 0.003 G lin -0.034841 0.006675 -5.22 0.000 GG crit 7.263 1. 081 6. 72 0.000 Time GG -0.16480 0.05930 -2.78 0.015
s = 32.19 R-Sq 77.0 % R-Sq(adj) = 72 . 1%
Analysis of Variance
Source OF SS MS F Regression 3 48586 16195 15.63 Residual Error 14 14508 1036 Total 17 63094
51
p
0.004
Time GG
p
0.000

B) S. aureus - regresion analysis using multiple techniques
Regression Analysis using best subset analysis
The regression equation is Growt~ rate = 54.1 + 2188 Con cent - 0.171 Time GG - 0.0451 G lin + 6.36 GG crit
- 0. 2 79 Osm_pres
Predictor Coef StDev T p
Constant 54.06 20.10 2.69 0.020 Concent 2188.2 889.8 2.46 0.030 Time GG -0. 17092 0.05204 -3.28 0.007 G lin -0.045087 0.007126 -6.33 0.000 GG crit 6.360 1. 016 6.26 0.000 Osm_pres -0.2792 0.1424 -1. 96 0.073
s = 28.06 R-Sq 85.0 % R-Sq(adj) = 78.8 %
Analysis of Variance
Source DF SS MS F p
Regression 5 53646 10729 13. 63 0.000 Residual Error 12 9449 787 Total 17 63094
52

( C) Decrease Growth Rate with Increasing Concentration - regression analysis using multiple techniques
Stepwise Regression for bacteria showing decreasing growth rate with increasing concentration
F-to-Enter: 4.00 F-to-Remove: 4.00
Response is Grw rate on 8 predictors, with N 27
Step Constant
G crit T-Value
Time GG T-Value
GG lin T-Value
GG crit T-Value
s R-Sq
l 2 1.855 105.560
2.30 3.74
66.7 35.93
4.38 6.28
-0.340 -4 .11
52.2 62.40
Regression Analysis
The regression equation is
3 4 5 97.013 103.395 103.450
4.77 7.16
-0.321 -4.18
-0.108 -2.28
48.1 69.31
0.24 0 .11
-0.274 -3.69
-0.225 -3.25
8.3 2.19
44.6 74.82
-0. 271 -4.19
-0.231 -4.74
8.7 8.21
43.6 74.80
Grw rate 40.3 + 3346 Cone. - 0.151 Time GG + 0.002 Time G + 0.386 GG lin
- 0 .114 G lin + 8.03 GG crit - 0. 71 G crit - 0.478 Osmotic -Pressure
Predictor Coef St Dev T p
Constant 40.30 43.57 0.92 0.367 Cone. 3346 1167 2.87 0.010 Time GG -0. 1511 0 .1341 -1.13 0.275 Time G 0.0024 0.1552 0.02 0.988 GG lin 0.3861 0.3586 l. 08 0.296 G lin -0. 11359 0.05901 -1. 92 0.070 GG crit 8.032 4. 711 l. 70 0.105 G crit -0. 710 2.741 -0.26 0.798 Osmotic -0.4776 0. 2112 -2.26 0.036
s = 39.60 R-Sq 83.7% R-Sq(adj) = 76.5 %
Analysis of Variance
53

Source OF SS MS F p
Regression 8 145412 18177 11. 59 0.000 Residual Error 18 28233 1569 Total 26 173646
Source DF Seq SS Cone. 1 16747 Time GG 1 168 Time G 1 14716 GG lin 1 9141 G lin 1 6041 GG crit 1 90350 G crit 1 226 Osmotic 1 8023
Unusual Observations Obs Cone. Grw rate Fit StDev Fit Residual St Res id
6 0.0400 370.40 284.09 25.25 86.31 2.83R
R denotes an observation with a large standardized residual
Best Subsets Regression
Response is Grw rate
T G 0 i T G G G s
c m i G G m o e m c c 0
n e 1 1 r r t Adj. c G i i i i i
Vars R-Sq R-Sq C-p s G G n n t t c
1 35.9 33 .4 47.9 66.712 x 1 33.0 30.3 51. 2 68.225 x 2 62.4 59.3 20.6 52.160 x x 2 59.6 56.3 23.7 54.049 x x 3 75.5 72.3 8.1 43.026 x x x 3 74.8 71. 5 8.9 43.614 x x x 4 77.7 73.7 7.7 41.948 x x x x 4 76.6 72. 3 9.0 43.021 x x x x 5 82.7 78.5 4.2 37.851 x x x x x 5 80.6 75.9 6.5 40.080 x x x x x 6 83.7 78.8 5.1 37.672 x x x x x x 6 82.7 77.5 6.2 38.763 x x x x x x 7 83.7 77.8 7.0 38.548 x x x x x x x 7 83.7 77.7 7.1 38.620 x x x x x x x 8 83.7 76.5 9.0 39.605 x x x x x x x x
Saving file as: C:\WINDOWS\DESKTOP\Minitab P=values\decreasing GR.MPJ * NOTE * Existing file replaced.
54

( Worksheet size: 100000 cells Retrieving project from file: C:\WINOOWS\OESKTOP\MINITAB\OECREA-1.MPJ
Regression Analysis
The regression equation is Grw rate= 103 - 0 . 271 Time GG - 0.231 GG lin + 8 . 72 GG crit
Predictor Coef StOev T p
Constant 103.45 24 . 87 4.16 0.000 Time GG -0.27050 0 . 06456 -4.19 0.000 GG lin -0.23083 0.04871 -4.74 0.000 GG crit 8. 721 1. 062 8.21 0.000
s = 43.61 R-Sq 74.8 % R-Sq (adj) = 71. 5 %
Analysis of Variance
Source OF SS MS F p
Regression 3 129895 43298 22.76 0.000 Residual Error 23 43750 1902 Total 26 173646
Sou rce OF Seq SS Time GG 1 1147 GG lin 1 431 GG crit 1 128318
Unusual Observations Obs Time GG Grw rate Fit StOev Fit Residual St Res id
6 483 370 . 40 262.88 26. 67 107. 52 3.12R
9 684 24 . 90 111. 38 16.48 -86.48 2 . 14R
18 724 53.50 60.40 42.19 -6.90 0.62 x
21 684 27.10 111. 38 16.48 -84 . 28 2.09R
R denotes an observation with a large standardized residual X denotes an observation whose X value gives it large influence.
Regression Analysis
The regression equation is Grw rate 41.2 + 3321 Cone . - 0.163 Time GG + 0.363 GG lin - 0 . 107 G lin
+ 6.85 GG crit - 0.463 Osmotic Pressure
Predictor Coef StOev T p
55

( Constant 41. 20 30.60 1. 35 0.193 Cone. 3321 1057 3.14 0.005 Time GG -0.16340 0.07023 -2.33 0.031 GG lin 0.3625 0.3309 1.10 0.286 G lin -0.10744 0.05239 -2.05 0.054 GG crit 6.849 1. 093 6.27 0.000 Osmotic -0.4630 0.1744 -2.65 0.015
s = 37.67 R-Sq 83.7% R-Sq (adj) = 78.8%
Analysis of Variance
Source OF SS MS F p
Regression 6 145262 24210 17.06 0.000 Residual Error 20 28383 1419 Total 26 173646
Source OF Seq SS Cone. 1 16747 Time GG 1 168 GG lin 1 9925 G lin 1 4860 GG crit 1 103561 Osmotic 1 10002
Unusual Observations Obs Cone. Grw rate Fit StOev Fit Residual St Res id
6 0.0400 370.40 283.45 23.89 86.95 2.99R
18 0.0700 53.50 59.63 36.88 -6.13 0.80 x
R denotes an observation with a large standardized residual X denotes an observation whose X value gives it large influence.
* NOTE * Command cancelled.
Worksheet size: 100000 cells Retrieving project from file: A:\Minitab\decreasing GR.MPJ
56
( Paper II
"Importance of destructive oscillatory viscometry in the characterization of some of
the gels commonly used in the cosmetics, pharmaceutical and food industries."
57

( Summary
In this paper the rheological properties of nine different gels, namely carrageenan,
guar gum, pectin, sodium carboxy methyl cellulose, methyl cellulose, hydroxypropyl methyl
cellulose, Carbopol 971, Water Lock and bentonite were characterized. Oscillatory
viscometry was used to determine the elastic and viscous moduli and the phase angle at the
linear and critical stress regions at a stress range of 0 - 100 Pa and a frequency of 0.05 Hz.
The macrostructures of the gels varied from long linear chains, grafted and cross-linked
chains, natural gels forming helix and ribbon structures and suspended particles. The
concentration ranges used varied from 0.3% to 7.0% with no less than a 3 fold increment in
the concentration ranges. Five different concentrations per gel were used. The viscosity
types found were both shear thinning and shear thickening in behavior. The gel strengths
varied from O.OOlPa to 7,600 Pa. The critical stress (crc) was determined to test its use in
describing the gel strength. The linear, exponential, logarithmic and power functions were
tested as models to describe the relationship between the critical stress and gel concentration.
Within the concentration ranges studied, the critical stress was found to be linearly dependent
(crc=al + blC) on the concentration with 95% certainty. The model proposed was applicable
to gels of different chemical structures, molecular weights, molecular weight distributions,
chain structure and viscosity types; therefore, it can be accepted as a universal model to
describe gel strength and offers a practical and simple description useful for the formulator.
In the model described, the slope (bl) can be used to characterize the "concentration
sensitivity". This parameter may enable formulators to replace one gel with another in order
to make necessary concentration-gel strength adjustments in cosmetics, pharmaceuticals and
food gels.
58

( Introduction
Viscoelastic parameters commonly used in oscillatory viscometry are the elastic
modulus (G'), the viscous modulus (G"), the phase angle (a) and the complex viscosity
(11*). The elastic modulus denotes the energy stored while the molecules stretch and the
viscous modulus denotes the energy lost when the molecules go back to their original
conformation. The phase angle denotes the degree of viscoelasticity of the polymer
solution, 0° being a purely elastic material and 90° a purely viscous fluid, anywhere in
between 0° and 90° denotes the viscoelastic flow. The equation relating linear
viscoelasticity can be written as follows:
Tan (a)= G"/G' .................................................................................... (1)
(j = 2 11 * y ........................................................................................... (2)
where cr is the shear stress, y is the shear rate and 11* is the complex dynamic viscosity
which consists of a real and an imaginary part that can be expressed as:
11* = 11' + iG'/co, or ................................................................................. (3)
11* = G"/co + iG'/co ................................................................................. (4)
where 11' is the dynamic viscosity, G' is the elastic modulus, G" is the viscous modulus,
co is the frequency and i is the square root of negative one (..ft). For a purely viscous
fluid 11' becomes independent of the shear stress applied to the system (Chereminisoff,
1993).
Davis (1971a,b) described the viscoelastic properties of pharmaceutical
semisolids using both destructive and non-destructive oscillatory testing. In destructive
oscillatory testing a low stress is applied on the body until the elasticity (G') breaks down.
59

I I
This value is called the critical stress ( crc). In non-destructive oscillatory testing, the
linear region where G' is independent of the shear stress is chosen and frequency studies
are carried out. Davis (1971a,b) detailed the importance of these tests and mentioned
their use in storage stability tests of semisolid products, effects of consistency on the
percutaneous absorption of drugs and the effects of formulation on consistency and
prediction of flow behavior under manufacturing conditions.
Non-destructive oscillatory testing may have the advantage over transient
methods of covering a far wider time scale, therefore allowing one to assess the processes
taking place at the molecular level with more confidence. On the other hand, destructive
oscillatory testing provides useful information for the quality control and correlation of
the physical properties with consumer perception attributes.
Most aqueous polymer solutions, when subjected to low frequencies tend to
denote viscoelastic behavior as a result of their large molecular weights, sometimes in the
order of 106
or higher. The long branches of the molecules tend to store energy like a
spring and at the same time are able to move and flow through the solvent; therefore the
monomer deposition and the segment deposition along with the high molecular weight
also affect the viscous behavior of the solution. As shown in Figure 1, the monomer
disposition in the polymers can be alternate (IA), random (IB), block (IC) or grafted
(ID). The monomer disposition as well as the polymer segments, which could be linear,
branched or cross-linked, will also affect the viscosity and viscosity type (McCormic,
1991).
60

ABABABABABABAB IA. alternating copolymer
AAABBBAAABBBAAA lC. block copolymer
AABBBAABABABBBA IB. random copolymer
AAAAAAAAAAAAAA B B B B B B B B B
lD. graft copolymer
Figure 1. Schematic representation of the monomer disposition in a polymer chain
61

( In more concentrated solutions, intermolecular attractions tend to increase the
apparent viscosity. The shape and size of the hydrated molecule in solution is determined
by the placement of the charged groups, hydrogen bonds, hydrophobic moieties and
restriction rings. Functional groups impart water solubility because of their ability to
form hydrogen bonds. Some of the groups that impart water solubility are (- NHR), (
N=), (-COO¥), (-NR/HX-), (- OH), (-COOH), (-S03¥), (-NR/HX-), (- 0 -), (
NHC(=NH)NH2), (NH/JC), and (-NHC(=O)NH2). These factors affect polymer
viscosity by creating layers of water molecules that move along as the polymer chain
moves, or by creating attraction, repulsion or rigidity between the chains (McCormic,
1991).
Ferry (1980) using oscillatory viscometry studied and discussed the creep
compliance, stress relaxation modulus and storage modulus, the loss modulus, the
dynamic viscosity, the storage compliance, the loss compliance and the loss tangent of
polymer solutions. He was able to point specific rheological characteristics of each
polymer type. He classified eight types of viscoelastic behavior in polymers (Figure 2).
Those were polystyrene, a dilute polymer solution (2A), polyvinyl acetate, an amorphous
polymer of low molecular weight (2B) and atactic polymethyl methacrylate, an
amorphous polymer of high molecular weight (2C), poly-n-octyl methacrylate, an
amorphous polymer of high molecular weight with long side groups (2D), polymethyl
methacrylate, an amorphous polymer of high molecular weight below its glass transition
temperature (2E), havea rubber, a lightly cross linked amorphous polymer (2F), random
styrene co-butadiene, a very lightly cross linked amorphous polymer (2G) and linear
polyethylene, a highly crystalline polymer (2H).
62

0\ w
~
-===----- fl - ~~---
~
~ ,z; "-.J
~ 6
Log Stress or Time
Figure 2. Schematic representation of elastic modulus (G') dependence of viscoelastic polymer solutions on stress as described by Ferry
(l 980). A) Dilute polymer solution, B) amorphous polymer of low molecular weight C) amorphous polymer of high molecular weight D)
amorphous polymer of high molecular weight with long side groups E) amorphous polymer of high molecular weight below its glass
transition temperature F) lightly cross-linked amorphous polymer G) very lightly cross-linked polymer H) highly crystalline polymer.

Ferry' s use of the elastic modulus is used to study the effects of the critical stress
of the polymers structures used in this study. For linear or branched polymers G' reaches
a point where it decreases rapidly pinpointing the critical stress (Figures 2A and 2B). In
molecular terms, it corresponds to the breakage of the macromolecular coils, which have
completely freed themselves from the original constraints and start to flow. The
relaxation time is the time at which the critical stress is reached and can also be used to
define destructive oscillatory rheology. Among the properties such as chain length,
degree of cross linkage, molecular weight, the molecular weight distribution is also
important on the critical stress. If the molecular weight distribution is broad, crc is not as
well defined and the breakage may occur broadly or in two stages (Figures 2C and 2D).
For glassy and crystalline polymers (not used in this study) there is very little stress
relaxation over many decades of logarithmic time.
Barry and Eccleston (1973a,b) utilized oscillatory rheology in order to test O/W
emulsions with the purpose of investigating the effects of surfactant chain length over the
emulsion and found that the rheological properties of the emulsions were related to the
viscoelastic networks present in the continuous phase. Pans et al. (1993) reached similar
conclusions when studying the viscoelastic properties of gel-emulsions and pointed out
that the elastic modulus was related to the structure of the emulsions while the viscous
modulus was related to the continuous phase and volume fraction of the emulsion.
Rochefort and Middleman ( 1987) have used oscillatory and steady shear
experiments to prove the effectiveness of dynamic oscillatory viscometry for studying
gels and successfully investigated xanthan gum rheology to demonstrate that it is affected
by the addition of salt in different ways, depending on the concentration regime studied.
64

I In more recent studies, Giboreau et al. ( 1994) used a modified starch, xanthan gum and
locust bean gum and discussed the usefulness of the yield stress when characterizing the
rheological behavior of gels. Using a modified starch to observe the critical stress level,
they described this point as being a point where "catastrophic" destruction of the structure
of the system occurs. Chen and Dickinson ( 1998) when studying the viscoelastic
properties of heat-set whey protein found that the protein concentration is the main factor
affecting gel strength as a factor of the elastic modulus. They found that it was more
sensitive to concentration increases at lower concentrations. Terrisse et al. (1993) used
destructive oscillatory testing to characterize and evaluate W/O/W multiple emulsions
and predict their stability.
In this paper, the use of the critical stress in the characterization of the rheological
behavior of 9 gels commonly used in the cosmetics, pharmaceutical and food industries
was studied because the critical gel strength (described by the critical stress at G') was
hypothesized to be the overall representative of the internal gel strength. The chemical
structure, molecular weight, molecular weight distribution, degree of cross-linking, steric
conformation and micro and macromolecular structure of the chains, all influence the
internal gel structure. Some of these properties are influenced by the concentration,
therefore, any relationship between the critical stress and the concentration would provide
means of simplifying and comparing the rheological behavior of the gels. The critical
stress can be determined from the point where G' starts to dissipate, as shown in Figure 3.
65

At Concentration "X"
G' (Pa)
Stress (Pa)
Figure 3. Schematic representation of critical stress determination.
66

EXPERIMENTAL
MATERIALS
Polymers used: The structures, molecular weights and nature of the gels studied are
given in Table 1. Cellulose is a naturally occurring polymer of 13-D-glucopyranose.
Cellulose derivatives used in this study were sodium carboxymethylcellulose (Na CMC),
methyl cellulose (Methocel A4C) and hydroxypropyl methyl cellulose (Methocel K4M).
They have a common polymeric backbone of cellulose made up of 13-anhydroglucose unit
with one primary and two secondary hydroxyl groups at the C2, C3 and Cs positions.
They form linear homopolymers, very hydrophilic in nature and having a pH of about 7
in dilute solutions. A sodium carboxymethyl substituent has replaced one or more of the
hydroxyl groups to have a degree of substitution of about 0.5-1.0. In methylcellulose,
methyl groups have been introduced to the C3 and Cs positions. Methocel A4C has a
degree of substitution of approximately 1.8. In hydroxypropyl methylcellulose a
hydroxypropyl methyl group has been introduced to C2 and Cs positions. Methocel K4M
has a degree of substitution of about 1.4 (Kamide and Saito, 1987). Cellulose derivatives
used in this study form free flowing transparent gels at the lower end of the concentration
used. At higher concentrations they form elastic gels. The transparency is due to the
completely amorphous state of the chains in their macromolecular structure.
Carrageenans are linear polysaccharides of alternating 13-D-galactopyranosyl and
1,4-linked a-D-galactopyranosyl units. They exist in three basic forms as, lambda, kappa
and iota carrageenans. Lambda carrageenan is a non-gelling carrageenan with about 70%
sulfated pyranosyl units (sulfate substitutions in the 2,5 positions of 13-D
galactopyranosyl and of the a-D-galactopyranosyl).
67

(
Table I. Chemical Structures, Molecular Weights and Nature of the Gels Stud ied .
Polymer Chemical Structure Average M~ Structure in Gel C hemical Composition
(Daltons X 10~) Form
Lambda 3-5 Long linLo.r Lin.:ar polysaccharides having Carragcenan (Type
chains forming alternating P-D-RL V Genugel, Hercules. double hd ices galactop)ranosyl and 1.4-linkcd
Wilmington, DE Lot C~,PH '-"•"!•C:» a-D-galactopyTanosyl units #627240) ~«;)1-01~~ "ith sulfate substitutions in the o~ -0!'?3
2.5 positions orp-0-
galactop)ranosyl and of the a-
D-galaclopyranosyl
Kappa Carrageenan 3-5 Long linear Linear polysaccharides having (Type VV71P
chains forming alternating P-D-Genugel, Hercules, Wilmington, DE Lot double helices galactop)ranosyl and 1.4-linke<l
#627260) a-D-galaclopyranosyl units
-\~Y. "ith a sulfate substitution in !he
o" Ok .+ position of P-D-
galac1opyranosyl and a 1.4-
linked 3.6-anhydro-D-galactose
Iota Carrageenan 3-5 Long linear Linear polysaccharides havi ng (Type VY 11 PF
chains forming ahernating P-D-Genugel, Hercules, Wilmington. DE Lot double hd ices galactop)ranosyl and l,4-linkcd
#627220) c.<0" a-D-galactopyranosyl units
~4- "ith a sulfate substitution in !he
~ 2A positions of P-D-
galactopyranosyl and a 1.4-
I inked 3.6-anhydro-D-galactose
Pectin 0.1 - 1.3 Long linear a-1-+l linked D-galacturonic (Hercules. - c.o.
chains forming acid "ilh traces of L-rhamose Wilmington. DE, fo-&-(~J" Lot#FP1013478) the double ribbon residues ..... ""' conformation
Water Lock A-I 00 NA* Graft copolymer a starch backbone and graflcd (Grain Processi ng
(Branched) side chains of poly (2-Co., Muscatine. IA -~~.ii.~3;:f~1¥,~ Lot #9613001) propcnarnidc-co-2-propcnoic "U>f'll"'- p.,la:.
acid) . ~
68
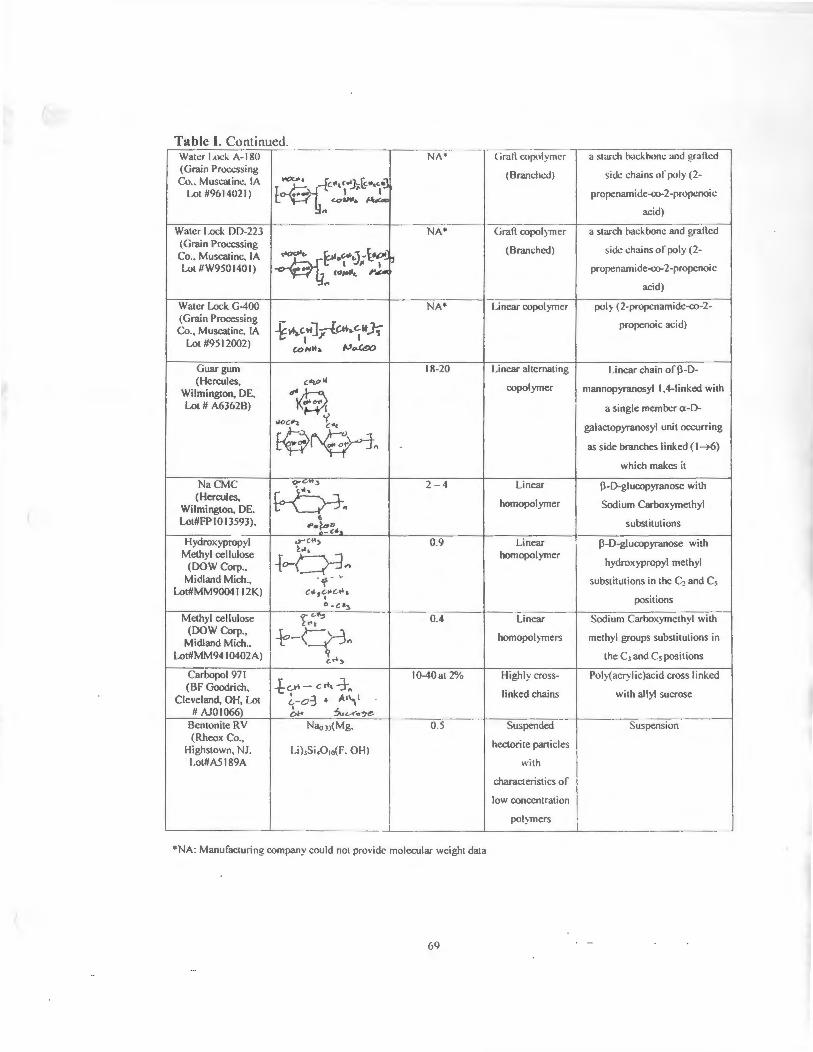
(
Table I. Continued. Waler Lock i\-1 80 NA• Clrall copolymer a starch tmcl.honc and grallcd (Grain Processi ng
(Branched) side chains or poly (2-Co .. Muscatin.:. IA ~ -fc."•"'J>:~"·',•J
1.ot #9614021 ) E ~ I I propcnamide-co-2-propcnoic <.o ...... ~ .. acid)
Water Lock DD-223 NA• Grall copolymer a starch hackbonc and graflcd (Grain Processing
~pi~~·J;l-~11 (Fl ranched) side chains of poly (2-
Co .. Muscatine. IA Lot #W950140 I) <O~fll I'~ propcnamidc-<:0-2-propcnoic
" acid)
Water Lock G-400 NA* Linear copol)'mer poly (2-propcnamidc-co-2-(Grain Processing
{~c.w]_;;-{~ .. c.11.J,- propcnoic acid) Co .• Muscatine. IA
Lot #9512002) I l lOllllH& "'"'"~
Guar gum 18-20 Linear alternating Linear chain of P-D-(Hercules. c:°'tJ"W
copolymer mannopyranosyl 1,4-linked with Wilmington, DE, ~K~ Lot # A6362B) a single member a-D-
.ioc~ ~"< galactopyranosyl unit occurring
~~ .. as side branches Ii nked (I -t6)
which makes it
NaCMC 0-C:. .. 3 2-4 Linear P-D-glucopyranosc with (Hercules, ~n homopolymer Sodium Carboxymethyl Wilmington, DE.
Lot#FPIOIJ593), <I substitutions "'~~'!.L
Hydrox)'Propyl (.)-C.H) 0.9 Linear P-D-glucopyranose with ~ ...
Methyl cellulose {o-L=r,,
homopolymer hydroxypropyl methyl (DOW Corp ..
Midland Mich., · o · .. substitutions in the C, and C5 I
Lot#MM9004112K) ,~,~t'C..t4a. positions
o-c•~
Methyl cellulose f <.~3 0.4 Linear Sodium Carboxymethyl with '" (DOW Corp., ~-L)-j,, homopol)mers methyl groups substitutions in
Midland Mich .. Lot#MM9410402A) y ... , the C 1 and C5 positions
Carbopol 971 fc..t"I- C:l~L-:i-n
10-40at 2% Highly cross- Poly(acrylic)acid cross linked (BF Goodrich,
linked chains with allyl sucrose Cleveland, OH, Lot ~-o3 ' A•\t
# AJ01066) 01-' 6uv<o':Jt!-
Bentonite RV NaoJJ(Mg. 0.5 Suspended Suspension (Rheox Co ..
hectorite particles Highstown. NJ. 1.i);Si40 1o(F. OH)
Lot#A5189A with
characteristics of
low concentration
pol~mcrs
*NA: Manufacturing company could not provide molecular weight data
69

( Kappa carrageenan has a sulfate substitution in the 4 position of P-D
galactopyranosyl and a 1,4-linked 3,6-anhydro-D-galactose. Iota carrageenan has the
same structure as kappa carrageenan with an extra sulfate substitution in the 2 position of
the 3,6-anhydro-D-galactose. Their viscous properties depend mainly on their
unbranched, linear macromolecular structure and ionizing potential. The repulsion of the
ester sulfated groups along the polymer chain causes the molecule to be rigid and
extended while their hydrophobic nature causes them to be surrounded by a sheath of
immobilized water molecules. Kappa and iota carrageenans gel by forming a double
helix structure (Clark and Ross-Murphy, 1987). Carrageenans used in this study form
free flowing gels at lower concentrations. At higher concentrations a more viscous gel
characterized by higher elasticity is formed. The gels are brown opaque in color. The
opaqueness is due to the double helix conformation of the chains, which tends to scatter
light through the gel.
Guar gum is a carbohydrate polymer, which is useful as a thickening agent for
water. It is a linear chain of P-D-rnannopyranosyl 1,4-linked with a single member a.-D
galactopyranosyl unit occurring as side branches linked ( 1 ~6) which makes it a linear,
alternating copolymer (Davidson, 1980). Guar gum gels are free flowing gels at low
concentrations and become more viscous with a green hue as the concentration is
increased. They are opaque in nature due to the same macromolecular conformation as
carrageenans. Pectins are polysaccharides that are found in nature as structural
components of cell walls in fruits. Although they are branched in their native form, the
one used in this study was a linear polymers of a.-1 ~ linked D-galacturonic acid
interrupted occasionally by L-rhamose residues. Their rnacrostructures form the double
70
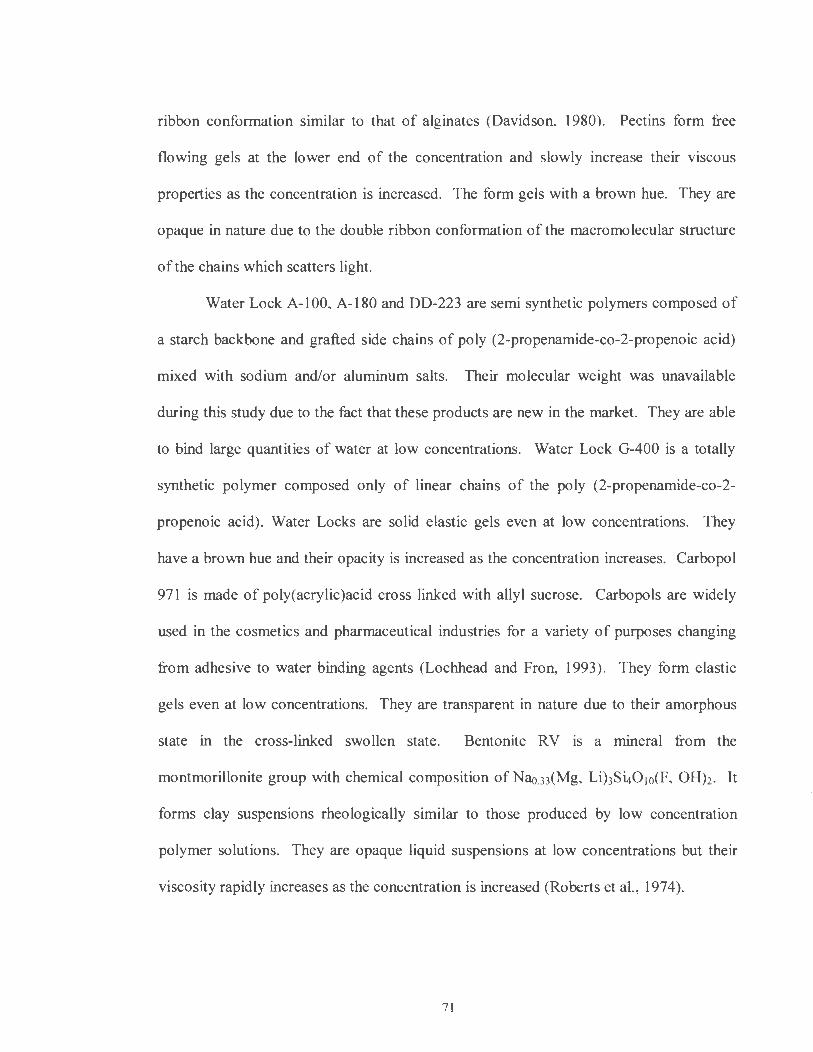
ribbon conformation similar to that of alginates (Davidson, 1980). Pectins form free
flowing gels at the lower end of the concentration and slowly increase their viscous
properties as the concentration is increased. The form gels with a brown hue. They are
opaque in nature due to the double ribbon conformation of the macromolecular structure
of the chains which scatters light.
Water Lock A-100, A-180 and DD-223 are semi synthetic polymers composed of
a starch backbone and grafted side chains of poly (2-propenamide-co-2-propenoic acid)
mixed with sodium and/or aluminum salts. Their molecular weight was unavailable
during this study due to the fact that these products are new in the market. They are able
to bind large quantities of water at low concentrations. Water Lock G-400 is a totally
synthetic polymer composed only of linear chains of the poly (2-propenamide-co-2-
propenoic acid). Water Locks are solid elastic gels even at low concentrations. They
have a brown hue and their opacity is increased as the concentration increases. Carbopol
971 is made of poly(acrylic)acid cross linked with allyl sucrose. Carbopols are widely
used in the cosmetics and pharmaceutical industries for a variety of purposes changing
from adhesive to water binding agents (Lochhead and Fron, 1993). They form elastic
gels even at low concentrations. They are transparent in nature due to their amorphous
state in the cross-linked swollen state. Bentonite RV is a mineral from the
montmorillonite group with chemical composition of Nao.33(Mg, Li)3S4010(F, OH)i. It
forms clay suspensions rheologically similar to those produced by low concentration
polymer solutions. They are opaque liquid suspensions at low concentrations but their
viscosity rapidly increases as the concentration is increased (Roberts et al. , 1974).
71

. (
Bentonite RV, sodium carboxy methyl cellulose, methyl cellulose (Methocel
A4C), hydroxypropyl methyl cellulose (Methocel KM4), pectin USP-100, Carbopol 971
NF, Carrageenan RLV, VVI IPF and VV71P, guar gum U-NF and Water Lock A-100,
A-180, DD-223 and G-400 were used to form gels.
METHODS
Preparation of the gels: All the gels except Carbopol 971 were prepared by adding
sterilized distilled water to the polymer powder to obtain the pre-selected weight by
weight concentration. The mixture was left to swell for 24 hr. , then the gels were
homogenized using a Fisher Scientific (Pittsburgh, PA) model Dyna-mix stirrer at 1000
rpm for 1 hr.
Their pH was measured using a Fisher Scientific (Pittsburgh, PA) model Accumet 20 pH
meter prior to the rheological measurements. Carbopol 971 was prepared to a neutral pH
by using the appropriate amount ofNaOH lN solution for each gel concentration.
72

( Rheometric measu rem en ts: All of the measurements were taken within 24-48 hours of
preparation. The rheological behavior of the gels was characterized at each concentration
using a Bholin instruments rheometer model CVO. The elastic modulus (G'), the viscous
modulus (G"), the complex viscosity (11*), the complex modulus (G*), the strain (y) and
phase angle (a.) were measured using a stainless stee~ plate and plate spindle number 4,
at a strain range of 0.00075 - 15 mm, a frequency of 0.05 Hz and a 1 mm gap.
Measurements were taken at a constant temperature of 25 °C. The critical stress ( crc) at
G' was further calculated for every gel concentration using the instrument's output.
RESULTS AND DISCUSIONS
Description and Comparison of Flow Properties of the gels: The rheograms obtained
for each gel at each concentration are 70. The gel concentrations varied from 0.3% to
7.0% allowing at least a three fold concentration range for each gel. The rheograrns of
five different concentrations of each gel were determined, Table II. Their consistencies
changed from free flowing to hard elastic gels. Due to the volume of the data obtained,
only the rheological parameters at the linear region, the phase angles and the rheological
parameters at the critical stress are presented in Table II. The rheograms obtained
demonstrated two types of rheological behavior: those which demonstrated a decrease in
G" with increasing stress and those which demonstrated an increase in G" with increasing
stress.
73

( Table II. Rheological parameters of the gels studied at frequency of 0.05 Hz and a stress
range ofO - 100 Pa.
Gel Concrotration C ritical Critical Pll Phas< Angle c~ al th< c.· •l th<
(w/w %) Stress at G" Strrss at G' Lintar l .intar
J.I'& J.P& R~oo R~on
NaCMC 0.5 0.23 0 .23 6.8 81 0 .006 0 .0-08 1.0 0.7 0.48 6.8 74 0 04 0 .005 2.0 6.33 9.57 7.0 50 0 89 0.77 4.0 30.22 19.54 7. I 25 J0.47 14.43 5.0 44 .05 29.75 7.1 30 21.7 36.1
Hydroxypropyl 1.0 O.QJ 0 .11 5.5 60 0.3 0.4 Methyl
C<llulos< (M<thocel 1.5 0. 14 0 .14 5.5 55 () 92 0 56
K4MJ_ 2.0 0.89 0.89 5.8 50 2.03 0 .57 3.0 5.46 I 1.29 6 .3 35 8.53 1.89 5.0 49 .8 16.05 6 .3 35 40.8 20.1
Methyl 1.0 0 .03 0 .11 6.0 7' 0.0 15 0.007 C<llulos• (M<thoc<I 1.5 0.10 0. 15 6.1 20 2.27 5.87
A4Q_ 2.0 0 .15 0.23 5.9 17 2.68 9.26 2.5 2.33 0.35 5.9 17 3.53 10.57 5.0 48 .5 1.95 5.9 17 22.4 23 .8
Beotooite RV 1.0 0.35 0 .35 7.5 65 045 0.54 2.0 1.83 2.64 7.5 62 2.5 1 2.35 3.0 2.64 5.46 7.5 60 2.81 4.33 5.0 39.86 10.69 7.5 35 219.0 305.9 7.0 179.02 23.26 7.5 30 667.7 1,000
Carbo~ 971 0.5 1.02 8.14 7.0 10 5.6 56 9 2.0 10.70 28.81 7.0 10 13 .1 142.4 3.0 37.30 50.19 7.0 10 27 .9 163 .8 4.0 39.25 73 .76 7.0 10 28 .5 2 17.5 5.0 60.75 90.79 7.0 10 35 .2 2 11 .5
Ptctio 1.0 O.QJ 0 .10 3.9 65 0.007 0 .003 2.0 O.o? 0 .13 3.9 38 0.54 0.45 4.0 0 .1 0 . 15 3.9 36 2.35 2.5 1 5.0 0 .3 0.20 3.9 36 2.8 2.58 6.0 0 .33 0 .23 3.9 36 4.33 2.8 1
Lambda 1.0 0 .005 0.074 5.6 "' 0 .007 0.002 , -Carrageeoao (Carrageeoao 3.0 0.29 0.23 5.6 15 6.6 29.3
Rfu 5.0 0 .34 0.49 5.4 15 15 .84 56. I 6 .0 1.04 0 .51 5.8 10 15 .9 55 .5 7.0 1.05 1.05 5.8 10 16.1 65 .4
74

( Table IL Continued.
Iola I 0 05 0 80 8.5 87 () 017 u 001 Carra~ttaan
(Carragttnan 2.0 0 .35 2.78 8.5 85 0 .021 0 OJ VVll~
2.5 7.08 10. 10 8.5 55 3.09 2.87 3.0 29.3 56.90 8.6 22 21.75 59.37 5.0 252.<i 147.90 8.6 5 60.9 540 I
Kappa 10 I 75 0 .78 6.7 18 2.6 015 Carragttaaa (Carragunan J .O 1.78 6.05 6.8 7 31.9 222.4
VV7111 5.0 20.57 30.94 7.J 8 319.3 2,832.9
t--6.0 38.30 49 .52 7.4 8 965.6 3.2«5.9 7.0 48.43 69.52 7.4 8 1.164 .2 7.671 7
Guargum 1.0 0.3 2.67 7.4 62 4.0 I 8
1.5 0.3 5.46 7.4 55 4.67 1.9
1.75 0.89 11.29 7.5 55 14 .6 11.8 2.0 7.85 33.57 7.7 53 29.6 24 .1 J.O 55.9 55 .9 7.7 42 59.2 42 .5
Waltr Lock G- 0.7 7.41 10.95 7.3 9 54 .92 393.55 400
1.0 10.95 16.40 7.4 9 56.9 420.92 l.J 16.08 23.64 7.6 9 59.44 498.84 3.0 84.5 41.59 7.7 9 77.43 584 .62 5.0 113 .48 63 .79 7.9 9 106.14 691.52
Wattr Lock 0.7 4.85 15 .23 6.9 5 14 .25 90.8 00-223
1.0 7. 11 23 .3 6.9 5 39.9 461.6 1.3 23 .3 47.8 7.0 5 44 .9 496.6 5.0 65.7 65.69 7.0 5 50.6 619.5 7.0 120.2 118.6 7.0 4 70.5 750.5
Wattr Lock A- 0.3 0.07 0. 11 7.9 20 27.1 70 7 100
0.5 0.23 0.50 7.9 10 89.1 196.5 0.7 2.35 3 45 7.9 10 112.7 582.7 1.0 13 .6 9. 16 7.9 10 147.5 922.5 3.0 56.9 34.11 7.9 8 327.5 l,750.l
Waltr Lock A- 0.7 O.Q7 0 .11 6.7 15 143 .05 237 180
1.0 0.23 0.50 6.7 7 154 .7 474 .1 1.3 2.35 3.45 6.7 7 173.05 828.04 3.0 75.15 9. 16 6.7 7 195.8 1,700 5.0 13 .43 34. 11 6.7 7 323.5 2,640
75

Sodium carboxy methyl cellulose, methyl cellulose, pectin and guar gum can be
included in the first group and are shown in Figure 4A, B, C and D. Their a values are in
the range of 40° to 90 ° Sodium CMC presents higher G" than G' at lower
concentrations, indicating a predominantly viscous body. At 2% concentrations the
phase angle (a) is in the order of 50° also demonstrating the viscous nature of the gel.
But at 4% concentration the G' becomes higher than G" and a goes down to 25° (Table
II). This is probably due to entanglement of the chains, which hardens the structure.
Hydroxypropyl methyl cellulose (Methocel K4M) tends to denote a two step decrease in
G' , similar to Ferry's description for the uncross-linked polymers of high molecular
weight (Figures 4A and B). Pectin has a G' almost equal as G" also denoting a viscous
nature, corroborated with a high a ( 40°), however at 6% concentration G' becomes
higher than G" and a decreases significantly (Table II). Pectin is also showing a very
soft, but early drop in G' showing a linear low molecular weight polymer with a wide
molecular weight distribution.
Bentonite RV (Figures SA and B) on the other hand is a clay suspension showing
the behavior of a low molecular weight polymer having higher G" than G'. The gel is
free flowing at 1 %, where there is not much change in a at 1 %, demonstrating a broader,
less steep increase at a range of 65 to 90°, whereas the phase angle a at 5% concentration
shows a steep increase with increased stress at around 40 Pa.
Gels like Carbopol 971 demonstrated shear thickening behavior in their viscous
modulus, G" with increased stress (Figures 6A, B and C). This behavior is accentuated
with increasing concentration. However, the concentration has not influenced the phase
76

-..J -..J
r ------ ____ ,_,, ____ ____ ·10---- - --·-··-- -- --- ·---- ·-· -·-·· ---- ·-·· ------·- .. -
I I I
i--i i-- i ~-~
I
~ J, ;; I
-I-- i-I- i-1--i -"I,,~ I I J • t- cf' ol--1--~L' 1---~1,l~r~
.._ ' Cl.> l ....... I Q)
E ! cu I .._ I cu :
Q..
cu .S2 CJ) 0 0 (1) .c 0::
!- -I-• - • .T - /!'-, ·:t- -I- .·!- . ·!- -·!- .· I-"i/ "'-,_
1' I ,
- 1-t·t~t-t-f-f l \. ' f-t-t-t-t t '.
0.01 '
' --- -- -- -0 001 --· - - - -- --- - - "
Figure 4A. Shear Stress (Pa)
I \
I
I \ i .. -!
Gels with shear thinning behavior A) G", G', Complex Viscosity and Phase Angle Rheogram for Sodium Carboxy Methyl Cellulose 2.0 % wlw Measured at 0.05 Hz and a Stress Range of 0.00 - 100 Pa
120
100
1ino
80 -(/) (1) (1) .._ CJ) (1)
0 "--
60 (1) CJ) c cu (1) (/)
cu 40 .c
Q..
20
0
.--.....
- ·• - Elastic Modulus
--a- Viscous Modulus
- - A- Complex Viscosity
- -X - Phase Angle

,-----
-.J 00
r·
I I i I ----- --·---
..-.. I cu 0.. i .__. I
Cf) I '--Q) I ....., i Q) J 011 cu I u I CJ) i 0 I 0 I Q) ..c I 0::: I
I I I
I I I '-· ···- ... --
Figure 4B .
··100 -- ------·- - -
~'--1 11 iti i IL.!.
10
·1..
I.. 0.1 . I..
~
0.01
... --·- ·· O.OG1 -- -- - ·-·- · - ... ·-···-·-- - ·---- --- --·-
Shear Stress (Pa)
'I
I.
-·~ - 1
I:
I I:
1 mo
Gels showing shear th1nn1ng behavior G", G'. Complex V1scos1ty and Phase Angle Rheogram for Hydroxypropyl Methyl Cellulose 2 0% w/w Measured at 0 05 Hz and a Stress Range of 0.00 - 100 Pa
~
120
100
..-.. Cf)
80 Q) Q) '--CJ) Q)
- ·• - Elastic Modulus 0 .__. --4- Viscous Modulus
60 Q)
CJ) ---..- Complex Viscosity c - -X- Phase Angle cu Q) Cf)
40 cu ..c 0..
20
0

Ctl n.. • z -0 c Ctl
0 0 (J) '-Cl.l (i)
-.J E -0 Ctl
'-Ctl 0..
Ctl u Ol 0 0 Cl.l ..c a:
,·-·-··--·---- ·-·-------·-------1c-00E+04T--·-··--·-·------·---------·-·· -·;·----·-··--··--····- 120
1 00~ -02. I I i j I
! i i I
I
I
I ~~ I 1100
~ j_ -·- --- ··- ---
f~\, · · :r1~JrFFFFt1~rt-t-r OOh02 '1 ·'- J.r J J I so ' ' '1 \.r··-· ·t .UUt:-UI I. _ ~, __ :_ .. ,-__ ::r_~ _ :r . _ _
~. ·. • . ---•---k-·---1--- i -- --1 I ' ' "'--- - I
(J)
Cl.l Cl.l '-Ol Cl.l 0
I '. ~I 1, I~ f . I ·~l~l~~-f--1--t
60 ~
I
t-t-Vf
Figure 4C .
1! J; ' 1.00E-02
\
J;
1 OOE-ii- J
\ I
·1-00E-04 -
\ !' . I -_.,.
~ .. ~ .. !- .. !- .. !- .. !- .. !- . ·!- .. I
Shear Stress (Pa) Gels with shear thinning behavior. G" . G' , Complex Viscosity and Phase Angle Rheogram for Pect in 2 0% wtw Measured at
0 05 Hz and a Stress Range of 0 CXl - 1 CXl Pa
Ol c Ctl Cl.l (J)
Ctl ..c
40 n..
20
0
- ·• - Elastic Modulus
--9- Viscous Modulus
---.-- Complex Vi scosity
- ~ - Phase Angle -· . --- ----- --- -
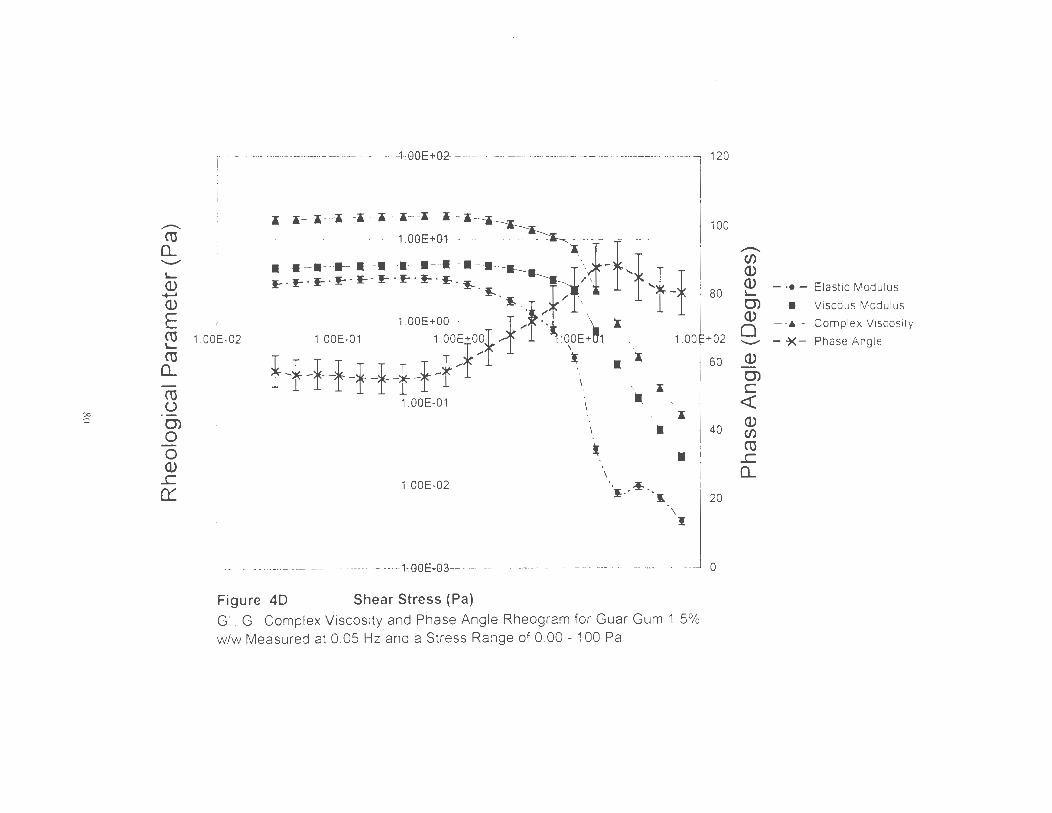
.-. cu
0... ---~ Q) _. Q)
E cu ~
cu 0... -cu (.)
00 ·-0 CJ)
0 0 Q)
..c er::
r- --··--··- -· ---··--·--1-;GGE+G2------------·--·--·--··- -·----·----- ·--··-·-·
I I i
I ~-~~--.-:1--t-:1~:1 !
120
100
i
j
I !
1 . 00~-02
· ·- -· ·--- ···-····---HlGE+-0-\--· ~--· ___ ..
~-~-~ - ~-~.~~:~~~:~1>1·f,r,f I ~.~ . ~/ ~\ I - I 80 . / \ 1.00E+OO . . ' . . I
1.00E-01 1.00E•O~t 1,f , :o,~~ \ 1 _00i+02
f-f +t-t-t+-t-r-t I \ \ BO
-1.00E-01
1.00E-02
I
- ·, - \ ~ .. \ ~
• \
•
·:l··~--~
• \
J:
40
20
I
I··-·--···--····-·--------- --1--0GE-03-·-·---·-·---·---·--. ·--- -- . --·- - - -- ·-. _ _J 0
Figure 40 Shear Stress (Pa)
G", G', Complex Viscos ity and Phase Angle Rheogram for Guar Gum 1.5% w/w Measured at 0 .05 Hz and a Stress Range of 0 .00 - 100 Pa
.-. Cf) Q) Q) ~
CJ) Q)
0 ---Q)
CJ) c <( Q) Cf)
cu .c 0...
- ·• - Elastic Modulus
--• - Viscous Modulus
--.- Complex Viscosity
- -X- Phase Angl e

00
cu 0...
Cf) '-(!)
QJ E cu '-cu
0...
cu l)
CTl 0 0 (j) _c 0:::
- .. ·-· ----- --·· --·· ·· - ·--·-· ----------------1 :008-01--.. -·-·-· ---····-·-··· -------····· -·-·-· -··- ·---······-----···--·-- , 120
I I
1 OOE-02 I I
100
-Hl~l-t-t+1 ''":' ~ ~ (j)
i--i-~-i--i---i-- -+.; 1.00E-01
1--1--,_ ,_, __ , ... __ ,_ :r.-::-
JC . JC·~ . Ff ;r,-t~:, -- - .. - . . Oi -- - -----· ~
Figure 5A.
\
-· 1 :OOE-02
1 :·l
1 OOE-03 ·
'i-\
I
I \
1 .. -J: ·
l OOE-04 - - -- ··-·- - · ····· --
Shear Stress (Pa)
"'-- ~"i-i ~ ........ ,
I ..
··""-~
.-~ ·- ~ ?. r- .. !.
·~ · ·-!
G" . G'. Complex V1scos1ty and Phase Angle Rheogram for Bentonite RV 1 0% w/w Measured at 0 .05 Hz and a Stress Range
of O 00 - I 00 Pa
60 (j)
CTl c
<{ (j) Cf)
cu _c
40 0...
20
0
- ·• - Elastic Modulus
-4- Viscous Modulus
--A-- Complex Viscosity
- ~ - Phase Angle

(\)
CL
(/) '-(1)
al E (\) '-(\)
CL
(\)
"" u f.J
O> 0 0 (1) .c 0:::
r-- ----· ·- ·- -·- ·--l-OOE+D4---·-- -----------
! I I I I I
I
I OOE -01
I 1 OOE+03 ·f-I-i--I-i·-I--I--i~-j-I~
- =~-~
!- ·!- ·!- ·!- -:t--!--!--!- + f- f- + + t-J ' ' ' , _, ' ' ' '
100""f Hf tf tHH-···· ··· · - .. -- - . -···. _· -1 - -·-
1 OOE+01
1 OOE+OO 1.00E+01 1 OOE+02
Figure 58. Shear Stress (Pa) G" . G'. Complex Viscosity and Phase Angle Rheogram for Bentonrte RV 5 0% w/w Measured at 0 05 Hz and a Stress Range
or o.oo . 1 oo Pa
70
60
I I so
~
(/) (1) (1) '-
40 ~ - ----- -·-·-·-· 0 - ·• - Elastic Modulus -~
---Viscous Modulus
O> --...--..- Complex Viscosity c
30 <t: - ~ - Phase Angle
(1) (/)
(\) .c CL
I 20
10
0
1 OOE+03

ro 0... -(/) '-())
(i) E ro '-(\)
0... 00 ro
u l,J
·ai 0 0 ()) .c 0:::
[--·--··-··-···-·- · ···-- · - ··--- ----·- -·-1-00803--- - - ·-··
I I I
I i i I i
1 ooE..02
! I
!
I ! !
1.00E+02 L I- ·I- ·I- ·I- -I- ·:I- ·:I- ·:I- ll , -- - --· ·····-·------·------ ·--·
1 00'~' _ "~ ~ - :,\~Jflf f 1-- -------·--------------- --\~{ I __ I -
"R\ \~
1 OOE+OO
/• .\ ' ~ \ x ... " -1& 1 OOE·01 1 OOE+OO
, .... 1.0dJE+01
I '• .-l'.OOE+02
Figure GA.
1.00E-01
I I
i 1 OOE-02 I I I z
I
,%
>E-******~-X' - ·· - -- · · ... · 1.00E-03 ·- · - ··
,
f I I
Shear Stress (Pa)
• I •
• "1l
•• .... .. •
\ ~ · -..I I '
Shear tt11ckening behavior as demonstrated by Carbopol 971 gels G" . G'. Complex Viscosity and Phase Angle Rheogram lor Carbopol 971 . 0 5% w/w Measured at 0 .05 Hz and a Stress Range or 0 00 - 100 Pa
120
100
80
60 I
1 OOE+03
40
20
0
(/) ()) ()) ..... Ol ())
0
())
O> c
<{ ()) (/)
ro .c 0...
-
- ·• - Elas11c Modulus
--a- Viscous Modulus
---..-- Complex Viscosity
- ~ - Phase Ang le

(\)
0....
U) '-QJ
03 E (\) '-(\)
0....
00 (\) .,. u a> 0 0 QJ ..c 0:::
·- - - -···· - -· ·-··· ·-- --- ··· -- ------ --+OOE+03-· -- .. ·-----------· I . I ~- ~--~--I--~-~-~--~~--~-~
i ~ I , i ~ -~ -~ -I-- ito~o,- -~ -~ -~ ·E- ·:E . ~ I x I •
•• -----· - - ~· I~ - · -· -- I II- ---•- -111~01 . \ . J: 'x . .
'I I \
I~ • I I i 1 GOE+OO · I
1 OOE-02 1 OOE-01 1 OOE+OO 1 OOE+p1
I I
i f I . ·- -· +GOE-01 • - - ---1 -
I I ! I
'I
• .,'I
I • \
~
. ... 1 Ot.+02
I I 1 , I
I I •• ' \ / - --- -- ---- - - ---- -------+OOE-02---------------- ----- - --,,'--------------.-------- - -- -- ·· --··
I ' \ I I .:C ,.X ·"-/ I 1 ~~ t
! ******~~ I !. __ .. ________________ ,,, ------.. 4 :00E-03 ·- __ ,, _________ ,,,, __ ,, __ --- ____ .. ... .. ..... - .......... . ___ ,_ __ .. ..
Figure 68. Shear Stress (Pa) G", G', Complex Viscosity and Phase Angle Rheogram for Carbopol 971 , 2.0% w/w Measured at 0 .05 Hz and a Stress Range
of 0 00 - 100 Pa
120
100
80 -(/) Q) Q) I..
O'> Q)
0 -60 Q)
1 oo t: +o3 "El c: <( Q) (/) ('C ~
40 c..
20
0
- ·• - Elastic Modulus
---- Viscous Modulus
- A-- Complex V1scos1ty
- ~ - Phase Ang le

cu 0... ~
(/) ..__
2 (!)
E cu ..__ cu
0...
00 cu '-" <.)
Ol 0 0 (!) ..c 0::
,- -- -- --
1
· --·- - 1cOOE+03-.,----- ------- - --· -- -·- ----·-··-- 100
I I
i I
1 ook-01
!-I-I-I--i---·---I--I--I--•-~ I -~\ f 11 f- -f- -f- ·:f- ·:f- ·:f- -f- -:f- ·f- ·f- ·f- ·:f - l \ I
I !-, .i !' 1 OOE•02 ' "' "
_ ,-, -t_ r -X~
I
! !
I I
l 1 OOE+OO I I
1 OOE+OO 1.00E+01 I~ ~
1 OOE+02
A.. .r- _g-~ ~~~~ ... _._..-~
·-· - ·-·+OGE-01--- - - --·---- --···-·· ·--- --·
Figure GC. Shear Stress (Pa)
~
\
1
G". G', Complex Viscosity and Phase Angle Rheogram for Carbopol 971 , 5 0% wtw Measured at 0 05 Hz and a Stress Range
of O.CXl - 1 OJ Pa
90
80
70
60
50
40
30
1 001::+03 20
10
0
.---.
~
(/)
(!) (!) ..__ Ol (!)
0 - ·• - Elastic Modulus .__.. (!) --a- Viscous Modulus
Oi ---&--- Complex Viscosity c
- ~ - Phase Angle <( .. - - -- ·- - . (!) (/)
cu ..c 0...

( angle which remains at 10 between 0.5% to 5%, Table II. The increase in G" with
increasing stress can be explained by an increased entanglement of the chains and
formation of solid like cores that is leading to breakage of the gel's internal structure with
increasing shear stress. The rheograms for Carbopol 971 show a sharp decline in G'
which is typical of high molecular weight cross-linked polymers with a narrow molecular
weight distribution. Pectin on the other hand (Figure 4C) demonstrates a gradual decline
in G' that is characteristic of a low molecular weight polymer with a broad molecular
weight distribution. Carbopol 971 behaved as an elastic body throughout the stress range
studied, denoting shear thickening properties. Its elastic nature is also obvious from its
low phase angle (a=10°) at all concentrations studied (0.5 - 5.0%). There was not much
differences between the phase angles of the 0.5% and 5.0% concentrations, showing a
weak concentration dependence of the degree of elasticity, Figure 6A.
The rheograms for Carrageenans denote the fact that the degree of sulfate
esterification influences the viscoelastic properties of the polymer. At 1 % concentration,
lambda carrageenan (Carrageenan RL V), the one with the highest degree of esterification
shows an a value of almost 90° throughout most of the stress range studied. At about 2%
concentration there is little increase in consistency (Table II). It coincides with a low
elastic and viscous modulus measured in the order of0.001 - 0.01 Pa (Figure 7A). At the
same concentration, iota carrageenan (Carrageenan VVI lPF), having a lesser degree of
esterification than lambda carrageenan, is showing a similar high phase angle a of almost
90°; but a higher viscous modulus and a well defined linear region in the elastic modulus
denotes higher viscoelastic properties than lambda carrageenan (Figure 7B). In both
cases, the viscous modulus was found higher than the elastic modulus and almost
86

C'O 0...
Cf) ...... Q)
Q) E C'O ...... C'O
0...
00 ro _, u CJ) 0 0 Q)
J:: er
4 fV'\C _..._ fV'\
1oor--.-;-'1;1V'L..-·~-1
1 OOE-01 1 OOE+OO 1.00E+01
1
I
I I ! ' I
------
r+r-i-ttFFFti~f-~t-rrr --i--1----i I
I · le- 1 OOE-02 . ~ I 1- i i I ·-1--t! ii ii I I --- 1, ii ii.---""
1- 1-·· I I · I I I I I I
120
1 ook+o2
100
80
60
Cf) Q) Q) ...... CJ) Q)
0 Q)
CJ) c !- . '!-
. '!- . ·r
,,, ' ' ' I I 40 <(
Q) Cf) %-- • 'I- 1.00E-03
J; \
-~ . ·-1-.
'!. '
1 OOE-04 · I
l- " ,.!'
···· lOOE-05 - ·--
Figure 7A. Shear Stress (Pa)
:r
.. .l. I I I I I
, I x·. I- . ·I- . ii- -I- . -I-. -I I I I )I(_-* -)(- 7(
G". G' . Complex V1scos1ty and Phase Angle Rheogram for lambda carrageenan (Tyep RLV) 1 0% w/w Measured at 0 05 Hz
and a Stress Range or 0 00 · 100 Pa
20
0
. -·- -20
C'O J:: 0...
- ·• - Elastic Modulus
-II- Viscous Modulus
A · Complex Viscosity
- ~ - Phase Angle
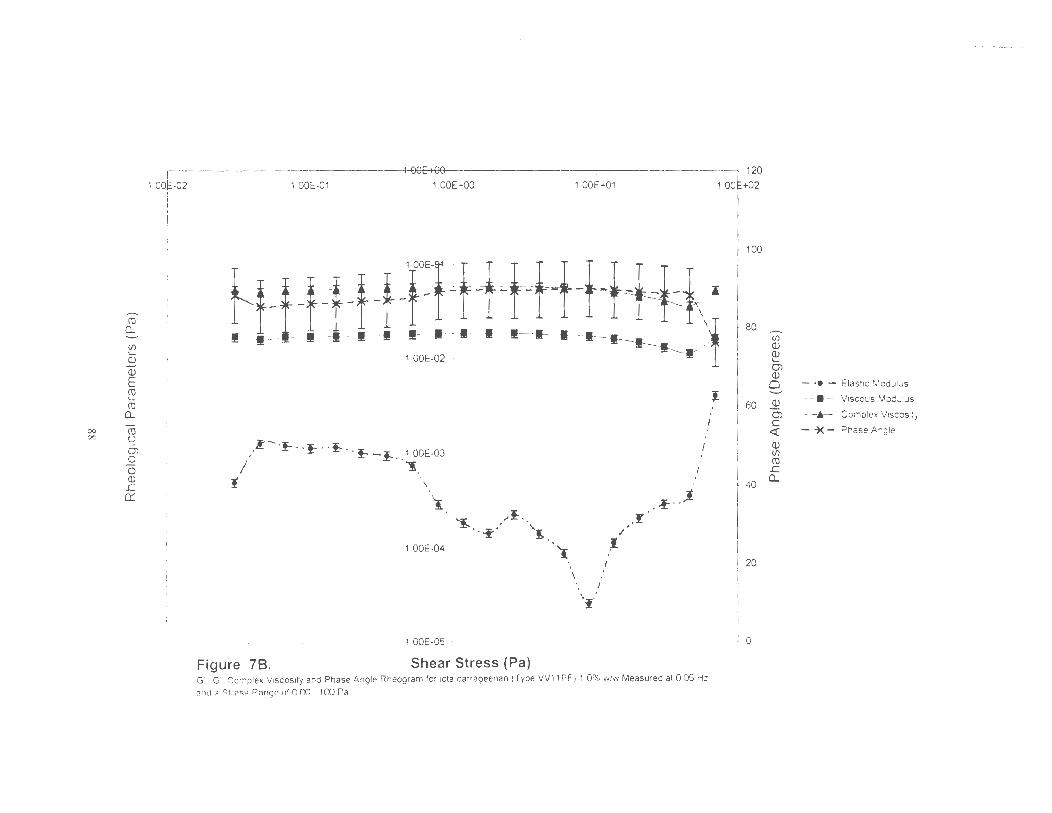
cu 0.. ~
C/) \.._
(j)
a; E cu '-cu
0..
00 cu 00 u
Ol 0 0 (j) _c a:
F 1 OOE+OO-;- ~ 120 100 -02 100E-01 100¥+00 100E+01 1.00+02
I I I
. ,l" ._ · !- · · !- · · !- -. I- _ !- . . 1 OOE-03 ' 'J; I .
i \
"!
1.00E-04 ·
1 OOE-05 -
~ .,I-. · - ~· ' !.
Figure 78. Shear Stress (Pa)
-~--1 .r
.I
't _.., __
I
'i
G '. G'. Complex Viscosity and Phase Angle Rheogram for iota carrageenan (Type VV11PF)1 .0% w/w Measured at O 05 Hz and a Stress Range of 0 00 - 100 Pa
J
100
80 C/)
(j) (j) \.._
Ol (j)
0 ~
60 ~ Ol c <t (j) C/)
(\) ..r:
40 0..
20
0
---._
- ·• - Elastic Modulus
--a-- Viscous Modulus
--k- Complex Viscosity
- ~ - Phase Angle . - - --~

C'O 0.... ~
en '-(lJ
(lJ
E C'O '-C'O
0....
00 C'O -0 u
6i 0 0 (lJ
.!:: 0:::
r-·· -·- · -·-· ·· ---··-·-·-··-- ··----- -·-------·----·-+.OOE-+-0-2-- ·--· ... -----·-·----· ·- -· - .. ·-··-·--· ------.. ···· ··- --· ··- ····· _ 120
I I
I I
r -
i
1 OOE-02 !
i j--·--i --i -·-i---.---. i--
F . . !- ·.::. F .,. ·"F :-:-1=-:-: :f: . . ~ ~1::~04 -------='i.;:::··------·r ·.:t-1--1·-- --. •!- "' 1""' - -~ '!- \
I I . I - 1 -· -I~ -·-1 - - 1-1---'~·. /°- I ' ¥1 l I ' I
1 OOE+OO . .\1 \ _ i \
100
80
en (lJ (lJ '-I ' -
100E+OO /.J 'f 1 oOE+06 \
,f \ I I: \
1 OOE-01 1 OOE-®2 g1 0
I \ I I I I ' I
1 OOE-01 I~ I w i--~ ··i ··i I • ,._
,..~ ~ .
,/
I l--+-9--•
i-,. f !--~-*"-·-~-~-~-
I I I
\ 1 OOE-02 · I
I I
t *-->< ' ' • !- · ·~.
~- - ~ · ·I
1 OOE-03 ·- ·
Figure 7C. Shear Stress (Pa) G". G', Complex V1scos1ty and Phase Angle Rheogram for kappa carrageenan (Type VV71P)1 0% w/w Measured at O 05 Hz and a Stress Range or 0 00- 100 Pa
(lJ
OJ c
40 <{ (lJ en C'O .c. 0....
20
0
·20
- ·• - Elast ic Modulus
·- • - - Viscous Modulus
- • - Complex V1scos11y
- ~ - Phase Angle

( independent of the stress applied. Kappa carrageenan (Carrageenan VV71P), having the
least degree of esterification demonstrated purely viscoelastic behavior at 1 %
concentration (Figure 7C). Its a. is of around 20° and its viscous and elastic moduli are
significantly higher than the latter two. The elastic modulus is higher than the viscous
modulus and shows a well-defined critical stress, also denoting its viscoelastic nature.
The rheograms for carrageenans are in agreement with the literature, which points to an
increase in the viscous properties of the gels as the degree of esterification is decreased
(16). Table II denotes that the elasticity of iota and kappa carrageenans is highly
concentration dependent, whereas the degrees of change G' at the linear region is small
for lambda carrageenan compared to the others.
Water Locks presented a very peculiar case. Although the structure of this gel is
known, which is a homopolymer grafted with copolymer side chains, the mean molecular
weights were not available. All of the Water Locks have similar G' in the order of 500 -
1000 Pa at 1 % concentrations (Figures 8A-D). Their phase angle were lower than 15°
indicating a strongly elastic nature. Except for Water Lock A-180, they showed an
increment in G" with increased stress, denoting dilatant behavior. They also showed a
sharp decline in G'. These two factors combined may be denoting entanglement of the
chains. On the other hand, Water Lock A-180 shows a broad decline in G' and no
increase in G" with increasing stress, probably denoting molecules with shorter chain
length and a broader molecular weight distribution. Water Locks form solid gels with
high degree of viscosity. Their a. value looks as if it is concentration independent above
0.5% (Table II)
90

,.-.._
ro Cl. -(/) .._ (l) ......, (l)
E ro .._ ro
Cl. -0 ro
(.)
CJ) 0 0 (l) ..c ~
f ...... -- -·-· ·-· - -· ··----------·--- ·--·1--GGE+-04 - --· ------- - ·-----··- -··-·- 120
1
I I I i i I I
I I I I I
I I-
I
1 OOE-02
~Ji Ji Ji Ji Ji Ji ~
~ . . :f--; ·£ -'· :I- . · ~ <·.r1-¥:+-Ci- ,-.·:t"-· ·F -· 'F :-: :i:: ~ ·i=:". -- ~--·
I . \ t \ \ f -·:,1,~l - 180
• \ I \ I ,
/ J; 'I
...,,---. \ _/......__, . 1.00E•02 ·
100
---- -- ----- - -·- -. ·-. --· - 1 OOE+01- . ___ --· -··· _ ·- .. ----·-··--1 .\ a, \ · .. J; '·
,.-.._ (/) (l) (l) .._ CJ) (l) 0 (l) CJ)
c <t: f
-·-- ·: ·------~~---- J. 60
,' \ l (l)
1 ;;~ta; - - \ - -'° ~ _j:~i, ! -- 1 00 •02 n.
1 OOE+OG - -- -·
1.00E-01 ,1 . 00~•00
- ,--- ---- I \ ;i, - --4 ,00E-01 C ___ __ 'f ~ ',/ 'x ----------/'---
' ~ / ~... -~ _ _. .... z- -JE----~%
··--- ------·--- ·--.. --.- --··· -1-00E-02-- -- -· --· .. ···--- ··- ····--·· .... --- ... ·-·· ····-·-
Figure SA. Shear Stress (Pa) G". G', Complex Viscosity and Phase Angle Rheogram for Water Lock A-100. 1 0%w/w Measured at O 05 Hz and a Stress Range of 0.00 - 100 Pa
.... 20
0
- ·• - Elastic Modulus
---- Viscous Modulus
---A-- Complex V1scos1ty
- ~ - Phase Angle

..--.. ro
0... -(/) ..... (]) ....... (])
E ro ..... ro
0...
'° ro N {)
O> 0 0 (]) ..c 0::
,--- -···-- ..... ···---·--- ----·---"){)800---·-·-··--·- ·- -----·-·-·-- ·-··---
I I I
0 01
I_
~ .. ..-:f-··I- ·· ][ i I \ ~ .r··:t-··!-. ',
I <L.' "!- .· IC '-.r .r . ·J_. i I
i ., .A, .... 9' / .... " ------- · l . 1-v -~~ --- - -~' --
f\\ .'\I I I. . I \ . \ ' 'I
~ • I ' I I I
J .. 10 . . -·
I I
I );
I I
j' 01 1 I· ~/
~-.-~. $, ~ ' a-•·~ I \ I , I
\~I :Z.- XI' \~I
10
- --------------·--·····--·-·--·- - ·-·0-1·· - ---···-··-----·--···-----·-·-·····-··- ·- ····· - . ---·- ··-
Figure 88. Shear Stress (Pa) G", G'. Complex Viscosity and Phase Angle Rheogram for Water Lock A-180, 1 Oo/ow/w Measured at 0 05 Hz and a
Stress Range of 0 00 - 100 Pa
100
90
- · 80
70 ..--.. (/) Q)
~ .. . 60 0)
(])
0 -50 Q)
40 I
I 30
r 1 0
10
0
0) c
<x: Q) (/)
ro ..c 0...
- ·• - Elastic Modulus
----- Viscous Modulus
---.- Complex V1scos1ty
- ~ - Phase Angle

..--.. C'O
CL ......... I/) ~
Q)
Q) E ~ C'O
CL
~ "' ·ai w
0 0 Q) ..c 0:::
,-----·-· --- ----·--- -------4~00E+04--------·-·-- ------- ------------- ---·--·--- -- -----·- .. ., 100
90
I I'! ------ - ~- -- -",·i - -111
• •. I
I -. 80
70
I 1-1 I I
I I
I I
i 1 OOE-02
Figure 8C.
,· '!- -·I-.·!- .. f- --I-.!- -f- -!- -I- -!- - !- . !- -1 ··l ., l ! • '
. i' . \
----------- -1-00E-+--02 ~--------·-----y-- ~~} -----\- -· -. I I! '
' ,, --~\. I I I ',
60
50
40
30
- -- --- 1 ~00E+01 - ·- -·-- --------- -------,, -- -- . - -J;------·-
' 20 I I
... :x, .,,. I X"'
x 'x. -~ -~- -)(- -* ->*-~ -* ->E- * -)<- - ! 10
1.00E-01 1.00E+OO 1.00E+01
0
1.00E+02
Shear Stress (Pa) G", G' , Complex Viscosity and Phase Angle Rheogram for Water Lock DD-223 . 1.0 %w/w Measured at 0.05 Hz and a Stress Range of 0.00 - 100 Pa
...
..--.. I/) -Q) - ·• - Elastic Modulus Q) ~ _._ Viscous Modulus Ol Q) --A- Complex V1scos1ty 0 - ~ - Phase Angle .........
·- -~ Ol c::
<t: Q) I/)
C'O ..c CL

-0 .,.
-----·--·--···--·-···-·---·--- ---4-:90E+Q4 --,-···-·- --- ·-··-· -- · ---·--·---···-··-·-· -----···--··-····----··-······-
i 100
i
,............ cu
0... .......... CJ) I-
Q) +-' Q)
E
I I y--i-i · - I -· I· -• -I · --· - - 1,r · · 1.00E+03 ) i ·-,'i-"-
1, 1
J I
f- - !- --!- .· !- . -f- . !- . -!- . f- -if-. f- . !- . !- . !- . -!- . . i .,J
90
80
,............
70 CJ) Q) Q) - ·• - E~astic Modulus I-0) - • - · Viscous Modulus
60 Q) 0 ----.- Complex Viscosity
cu I-
i _ ri -4.00E+02- " - -- ________ _,!!~';'. · \ '--' - -X- Phase Angle
cu 0...
cu (.)
0) 0 0 Q) ..c 0:::
\ : /- .. T J--i· - - -\-· --
' .f "°" --~1' .iii . • .-.,~~ i .. \ i ~- ~ ~ \ . I . ' \ \ I
I I I ,
\ --- --- ----i-,99E+Q.1--l--- ---·-·-· __________ ;r}, _______ . __ ·J-····-
! ~ •
!It I I
' ~' x I
I 'x %°,... , I ..._)E- -::f' -:. ~ -)E- -)E- -::f' -
i x'
I • I
\
!
L _________ Jf:..=:)t_" _ __ _ -:t-:00-E+OO-------------~-
50
40
30
20
10
0
1.00E-02 Figure 80.
1 .OOE-01 1.00E+OO 1.00E+01 1 OOE+02 Shear Stress (Pa)
Q)
0) c <( Q) CJ) cu ..c 0...
G". G' . Complex V iscosity and Phase Angle Rheogram for Water Lock G-400 , 1.0 %w/w Measured at 0.05 Hz and a
Stress Range of 0.00 - 100 Pa
rl~

( Use of Critical Stress as a Parameter for Gel Strength:
The critical stresses at each concentration were calculated for all the polymers
from the rheograms as described in the introduction. In Table II all of the values
calculated are shown. They all seem to be concentration dependent therefore, the
concentration dependency was statistically analyzed by using a linear function, an
exponential function, a logarithmic function and a power function. For all the gels the
linear function presented the best correlation coefficients Table III, with R2 changing
from 08975 (iota carrageenan) to 0.9949 (Water Lock A-100) and significance changing
from 0.48 (kappa carrageenan) to 0.000 (Water Locks). Accordingly, the critical stress
and concentration relationship can be described as:
crc= a1 + b1C ........................................................................................ (5)
where crc is the critical stress, C is the gel concentration and a1 and b1 are correlation
parameters (Table III). Figures 9 to 13 demonstrate the relationship between the
concentration and critical stress of all the gels studied as obtained by equation 5.
The most important finding demonstrated in this table is the degree of
significance of the model selected. All of the parameters fit the model within at least
95% confidence limit, Table III. Further, the significances given are demonstrating an
excellent fit, with the exception of Carrageenan VV7 l P, which is still within the selected
confidence interval of95%. The concentration dependence of the critical stress of Water
Locks can be described within 99% confidence, as well as that of Carbopol 971, pectin,
Bentonite RV, sodium carboxy m..:thyl cellulose and methyl cellulose. All of these
polymers formed highly elastic gels.
95

"' °'
---.....
Table Ill. Linear Regression Analysis of the Critical Stress Dependence on the Concentration crc=a I +b 1 C Obtained from Least
Square Analysis Data.
Polymer type Guar gum Lambda Iota Kappa Bentonite RV Pectin Carbopol 971
Carrageenan Carrageenan Carrageenan NF
(type RLV) (type VVI I PF) (type VV71 P)
Apparent 400 25 3,400 1,000 4,800 65
I 185.000
Viscosity (cP)
a, -32.04 - 0.06 - 63.98 - 19.40 - 4.80 - 0.03 - 3.4 I
b1 29.10 0.10 40.08 11.55 3.69 O.o3 16.26
R_T 0.910 0.961 0.8975 0.9054 0.9503 0.9829 0.9889
Significance 0.022 0.003 0.014 0.048 0.005 0.001 0.001
Polymer type Water Lock A- Water Lock A- Water Lock Water Lock G- Methocel A4C Methocel K4M Na CMC
180 100 DD-223 400
Apparent 140,000 36,000 166,000 260,000 280 1.700 2.500
Viscosity (cP)
~I + 1.432 - 4.83 + 4.83 + 3.76 - 0.61 -5.55 - 4.38
b, 4.20 12.99 22.40 12.19 0.48 4.50 6.53
R 0.9098 0.9949 0.959 0.9953 0.9369 0.9062 0. 9822
Significance 0.012 0.000 0.004 0.000 0.007 0.013 0.001
I '
I
I
'
I
I I
I

~
cu 0.. -Cl) Cl) Q) .... -(/)
'° ~ -.l
·;:: u
35 -------- - - --·-·-----------·-··-----, I I
30 +----------------------------..-------;
25 ·-
20
15
10
5 -
0
-5
-10
• Hydroxypropyl Methyl Cellulose j ·--· •Methyl Cellulose 1--·
A Na CMC
2 3 4
- ----·-·-·---- ---·--------·-··---- -----·--
Figure 9. Concentration (w/w %)
i _ y _::._6.,_5_3.4:ZX..:..U8-2L~
R2 = 0.9822 I
y = 4.502x - 5.559
R2 = 0.9062
5
y = 0.487x - 0.61 O
R2 = 0.9369
-- - -·- ---
-·-··---· ·-···- ··--- ·---- .
I
Critical Stress as a Function of Concentration for Hydroxypropyl Methyl Cellulose (Methocel K4M), Methyl Cellulose (Methocel A4c) and Sodium Carboxy
Methyl Celulose

......... co 0..
Cf) Cf) Q) \....
if> -0 -ro 00 . ~ .....
'C: ()
140 , -- ---------- ----··------------------ ---·1
120 Y = 22.404x + 4.834 7 R - 0.959
I I ' I
!
I I
I •Water Lock A-180
1 00 -~ •Water Lock G-400
•Water Lock A-1 oo X Water Lock DD-223
t----------------;,,r---------1
I 80
60
-- -------------- y : 12.193X + 3 . 7682
R2 = 0.9953
40 y=7 .151x-1.2605 R2 =0.9817
20
I 0
0
~ ~~ ~
• ~ , er: ~ s:>LL
1 2 3 4 Figure 10. Concentration (w/w %) Critical Stress as a Function of Concentration for Water Lock A-180. Water LockA-100, Water Lock G-400 and
Water Lock DD-223
y = 4.2036x + 1.432
R2 = 0.9098
5
I
-1 i I
-1
6
-----.,

250
200 I
I
150 .--.. C1l
0...
en en Q)
~ 100 Cf)
'° cu '° l) ..... "i: u
50
0
-50
--------·--·--------------·-- ------···-----------------·------1
•Lambda Carrageeana 1
•Kappa Carrageenan
A Iota Carrageena~
y = 40 .082x. 63 .986 R2 = 0.8975
y = 11 .556x-19.4
R2 = 0.9054
i I I I
y = o.1012x. 0.0608 I
----~..:::IL-----+-----.,..-------.-----+----..---.R2
= 0.96.1 j
2 3 4 5 6 7 $
Figure 11. Concentration (w/w %) Critical Stress as a Function of Concentration for lambda Carrageenan (Type) RLV. kappa Carrageenan (Type W71P) and iota Carrageenan (Type
W11PF)
I
I I
~

m 0....
(/) (/) Q) \....
U5 0
~ 0
·~ ·c: (,)
200
150 -
100
• Carbopol 971
• Guar gum 1
I• Bentonite RV l
y = 29.098x - 32 .047
R2 =0.9107
--· -·--~-- --------/-r-~-------:::;;;~7'~.,,,,....-··· ·- - -1 y = 16.262x - 3.4142
R2 = 0.9889
50 i :/i~ y = 3.6914x - 4 .809
R2 = 0.9503
0
2 3 4 5 6 7
-50 Figure 12. Concentration (w/w %) Critical Stress as a Function of Concentration for Carbopol 971 , Guar Gum and Bentonite RV
~ I I I i
_,

;; -
0.3
0.25 ,----------,------ _- _ ---1 i I
0.2 ~------
cu 0.. ~
CJ) I CJ) Q)
b) 0.15 I -----J
cu tl
·.;:::; ·c 0
0.1
y = 0.033x + 0.03
R2 = 0.9829
I
o.o5 L-----------------------------1
0
0 2 3 4 5 6 7
Concentration (w/w %) Figure 13. Critical Stress as a Function of Concentration for Pectin

( As described earlier, the rheological behavior of the systems studied varied from free
flowing to high-consistency gels. However, regardless of the wide rheological range
covered, the critical stress still efficiently explained their gel strength, demonstrating that
it is a highly significant parameter to describe gels and it may be considered as an
efficient tool for characterization.
Evaluation of the critical stress parameters obtained (Table III) also allows
formulators in the cosmetics, pharmaceutical and food industries the possibility of
replacing one gel with another having a similar critical stress. One more obvious use of
the parameters is the quick evaluation of gelling strength dependence on the
concentration. In Figures 9 - 13, and in Table III, the gels having high 'bl' values (Eq. 5)
are highly sensitive to small concentration changes, whereas the ones having low 'bl'
values may have similar gel strength in a wider concentration range. Table IV lists the
gels from highest to lowest "concentration sensitivity" based on their 'bl' parameter.
Through personal observation it was found out that the thickness of the gels with 'bl'
values higher than 10 Pa increases sharply with fractional increases in concentration,
whereas the ones that ha:.-·e 'bl' values less than 10 can only be thickened by greatly
increasing the polymer concentration.
This is the first study in the literature, which demonstrates the value, and use of
critical stress and its linear dependence on the concentration regardless of gel chemistry,
type and rheological strength. Dooublier and Launay (1994) studying locust bean gum
prepared empirical approximations between the critical stress, the specific viscosity and
the reduced concentration. Barry and Meyer (1979) working with Carbopol 940 and 941
in creep viscometry proposed a log-linear relationship between the apparent viscosity and
102
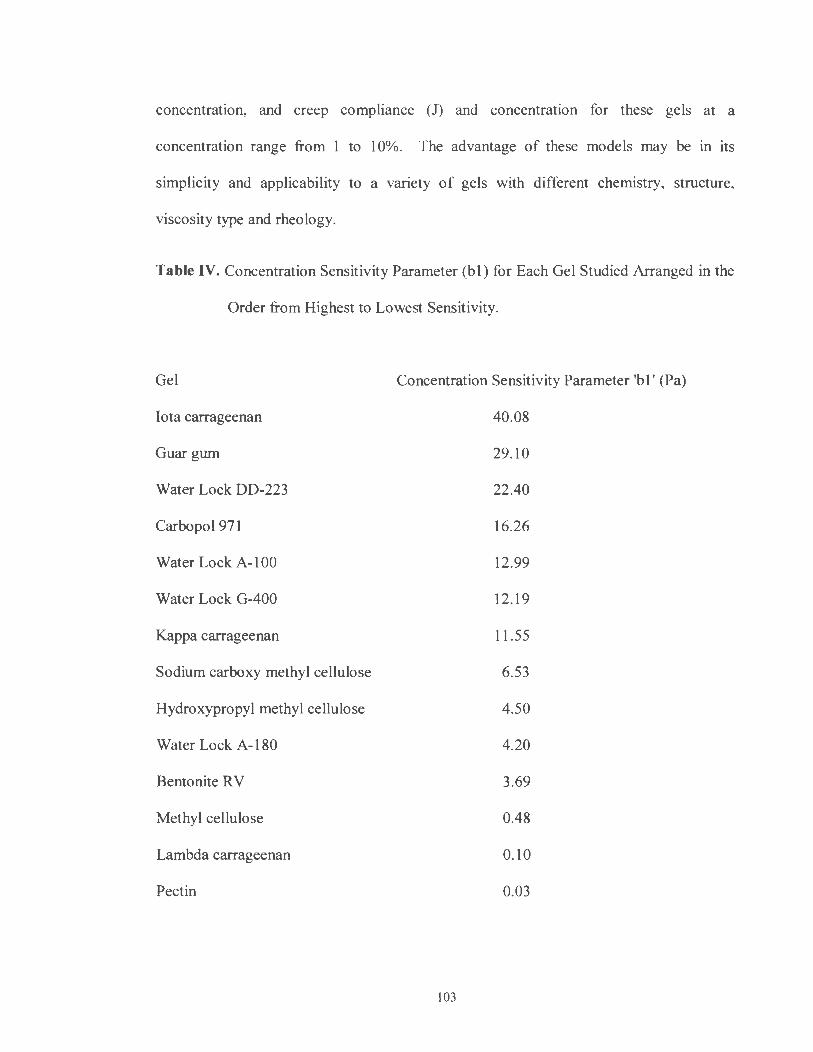
( concentration, and creep compliance (J) and concentration for these gels at a
concentration range from 1 to 10%. The advantage of these models may be in its
simplicity and applicability to a variety of gels with different chemistry, structure,
viscosity type and rheology.
Table IV. Concentration Sensitivity Parameter (bl) for Each Gel Studied Arranged in the
Order from Highest to Lowest Sensitivity.
Gel
Iota carrageenan
Guar gum
Water Lock DD-223
Carbopol 971
Water Lock A-100
Water Lock G-400
Kappa carrageenan
Sodium carboxy methyl cellulose
Hydroxypropyl methyl cellulose
Water Lock A-180
Bentonite RV
Methyl cellulose
Lambda carrageenan
Pectin
Concentration Sensitivity Parameter 'bl' (Pa)
40.08
103
29.10
22.40
16.26
12.99
12.19
11.55
6.53
4.50
4.20
3.69
0.48
0.10
0.03

( References
Barry, B. W. and Eccleston, G.M. , Oscillatory testing of o/w emulsions containing mixed
emulsions of the type surfactant-long chain alcohol type: self-bodying action, Journal
of Pharmaceutics and Pharmacokinetics, 25:244 - 253, (1973a)
Barry, B. W. and Eccleston, G.M., Oscillatory testing of o/w emulsions containing mixed
emulsions of the type surfactant-long chain alcohol type: influence of surfactant chain
length, Journal of Pharmaceutics and Pharmacokinetics, 25:394 - 400, (1973b)
Barry, B.W. and Meyer, M.C., The rheological properties of Carbopol gels I: Continuous
shear and creep properties of Carbopol gels. , International Journal of Pharmaceutics,
2:1 - 25, (1979)
Chen, J. and Dickinson, E., Viscoelastic properties of heat-set whey protein emulsion
gels, Journal of Texture Studies, 29:285 - 304, (1998)
Chereminisoff, N., An introduction to polymer rheology and processing, CRC Press,
London, 1993
Clark, A. and Ross-Murphy, S. , Structural and mechanical properties of biopolymer gels,
Advances in Polymer Science, 83:60-195, (1987)
Davidson, R., Handbook of water soluble polymers and resins, McGraw Hill, 1980
Davis, S. , Viscoelastic properties of pharmaceutical semisolids III : Destructive
oscillatory testing, Journal of Pharmaceutical Sciences, 60: 1357 - 1360, (1971 b)
Davis, S. , Viscoelastic properties of pharmaceutical semisolids III: Non-destructive
oscillatory testing, Journal of Pharmaceutical Sciences, 60:1351 - 1355, (1971a)
Doublier, J.L. and Launay, B., Rheology of galactomannan solutions: comparative study
of guar gum and locust bean gum, Journal of Texture studies, 25: 119 - 137, (1994)
104

Ferry, J., Viscoelastic properties of polymers, 3rd ed. , Wiley and Sons, NY, 1980
Giboreau, A. , Cuvelier, G. and Launay, B., Rheological behavior of three
biopolymer/water systems, with emphasis on yield stress and viscoelastic properties,
Journal of Texture Studies, 25:119-137 (1994)
Kamide, K. and Saito, M., Cellulose and cellulose derivatives: recent advances m
physical chemistry, Advances in Polymer Science, 83:5-59, (1987)
Lochhead, R. and Fron, W., Encyclopedia for polymers and thickeners for cosmetics,
Cosmetics and Toiletries, 108:95-135, (1993)
McCormic, C. Structural design of water soluble polymers, in Water-Soluble Polymers,
Synthesis, Solution Properties and Applications (S. Shalaby, C. MacCorrnick, G.
Butler, eds.) pp. 2-24, ACS, Washington, (1991)
Pans, R., Erra, P., Soians, C., Ravey, J. and Stebe, M., Viscoelastic properties of gel
emulsions: Their relationship with structure and equilibrium properties, Journal of
Physical Chemistry, 97: 12320-12324 (1993)
Roberts, W., Rapp, G. and Webber, J., Encyclopedia of minerals, VNR Co., NY, 1974
Rochefort and Middleman (1987), Rheology ofxanthan gum: salt, temperature and strain
oscillatory and steady shear experiments, Journal of Rheology, 31:337-369, (1987)
Terrisse, I., Seiller, M., Rabaron, A. and Grossiord, J.L., Rheology: how to characterize
and to predict the evolution of w/o/w multiple emulsions, International Journal of
Cosmetic Science, 15:53 - 62, (1993)
105

( Appendix 1
(Rheograms)
106

CIJ Cl.. ~
'-Q)
Q)
E CIJ '-CIJ
Cl..
CIJ 0 u -.J
O> 0 0 Q) .c 0:::
1· ··-·---- .- -··- · · · ---· -··HXlE+G1 -- -
I
1 OOE-02 1.00E-01 I I I
i ~------*1 f'l'~'~'
~ - .'I \
\
· -· 1-·00E-02 J:. :..'1 .. -
120
. 100
~r~rr-r-1 ,1 ~,..,, ~~', 180
"a- . ' ....... ·.,
' ~ , ......_ '•
...... , __ ~ . 60
'···~
C/) Q)
~ Cl Q)
0 ._ Q)
Ol c:: ~ Q) C/) ell .c
\
I 40 a.
1.00E-03
·1.00E-04 - -- -
Figure A 1. 1. Shear Stress (Pa )
I \ !. __ , .
-~·. -3' :r· r- . . J.. · ~ ·- -!
G" , G' . Complex Viscosity and Phase Angle Rheogram for Bentoni le RV 1 0% wlw Measured at 0.05 Hz and a Stress Range
of 0 00 - HXl Pa
20
0
'
- -• - Elastic Modulus
_._ Viscous Modulus
.............- Complex Viscosity
- ~ - Phase Angle

l'O a.. -I.. Q) ..... Q)
E l'O I.. l'O a.. l'O - u
0 00 Ol
0 0 Q)
..c:. 0::
r - - ... · - · · - · ··- -· ---·----- --· -- 1.00E<-02-- - ·· - - -··- ----· .•. - --· - . ·-· --·· -·· -· · __ -- 120
I I I
I
I
1 00~-02
I I_
i I
I
l
!
i I i i I I I i i ---'---1 100
I I
1 OOE+01 '. ~- -- --1- ·i 1- 1- 1- 1 ~ -- -1~ l --1 -
t-r-rr~LLf ~f.OO~roooo1~J~t1ttrrrr1 80 i r r r r I . '°'''°' • . • 1 . 'l I.. I .. 100 +02 gi \ ·, Cl l .• i 60 :; Ol
\ · - -1 OOE-G1 ·
l '1
·-··. .. - ·- - ----· ·-- .. ·-·- ---- - -· ---··-1-00E-02--: · ----·-···- - -·· ····------- - · -- --· -- ·- ---f -,--- - ·-7 f'.· ·· -! -. 'f' '.
c: <( Q) Cf) l'O
..c:. 40 a..
20
I ·-· ·--- -- ·------------·-----·------1-·.00&EB··-- ··- -·-- - ·· -·--···--· -·------ ·· ·- - ·-----· ··- ---·. - •. - ••. _J 0
Figure A1 .2 Shear Stress (Pa) G", G', Complex Viscosity and Phase Angle Rheogram for Bentonite RV 2.0% w/w Measured at 0.05 Hz and a Stress Range of 0.00 - 100 Pa
\
- · • - Elast ic Modulus
_._Viscous Modulus
--..-.- Complex Viscosity
- ~ - Phase Angle

ro a.. -"-Q) .... Q)
E ro "-ro 0..
ro 0
(.)
-0 C') 0 0 Q)
.c a:=
, 00Lo2 I I
I
-------··--··- --··-· -1--00E+-021 · - ····-···-·-···--· ---·-· ---.. ·-·--- ···---- - ·- -···--·-·-·· -- - , 120
x x ~ ~ i i i ~ ~ ·~ 100
t-t-FeLLl~fOO~+Dr~~~I;tlI ~ ,, " - 1 60 ~ r r r r r I ., , 00,.,, . . 1; • ~ . ' "-. 1 00 +02 C')
\. ' ' Q)
l ' 'I e I so ..9:! C')
1.00E-01 ·
I I
\
·\
l
'· '
c: <( Q) t/) ro .c
40 0..
-···--·-·· --··------------------+OOE-02·-· - ·--- --- ~-~----~---------- . r
1.
j \ . 'J-1
· 1 OOE-03 --
Figure A1.3 Shear Stress (Pa) G", G', Complex Viscosity and Phase Angle Rheogram for Bentonite RV 3.0% w/w Measured at 0.05 Hz and a Stress Range of 0.00 - 100 Pa
20
.. 0
- ·• - Elastic Modulus
-a- Viscous Modulus
--.- Complex V1scos1ly
- ~ - Phase Ang le

0
-('J
ll. ~ Q) -Q)
E ('J ~ ('J
ll.
('J u Ol 0 0 Q)
.:::. a:=
, .- . --·-·--·. ---1 008-04 I --·-·---- ··- ·---·-·- -----
I I - -- --· ·-
I !
A-----
\OOE•O>f ittiHii-ltittt~f( --·· -'.i . -····
1 OOE+01
70
60
50
VJ Q) Q) ~
40 gi Cl -Q)
Ol c:
30 ex:
20
10
Q) VJ ('J
.:::. ll.
'--~~~~~~'HltlE-+BG ~~~~~--~~~~ 0
1 OOE-01 1 OOE+OO 1 OOE+01 1 OOE+02
Figure A1.4 Shear Stress (Pa) G", G', Complex Viscosity and Phase Angle Rheogram for Bentonite RV 5.0% wlw Measured at 0.05 Hz and a Stress Range of 0.00 - 100 Pa
1 OOE+03
- ·• - Elastic Modulus
----- Viscous Modulus
----A-- Complex Viscosity
- ~ - Phase Angle - -- - - ·- - -

-ro a.. -.... <lJ ..... <lJ E ro ... ro a.. ro u C) 0 0 <lJ .c a:::
1.00E +04 · · ·-· ·-··---· ... ---·- - 45
'l:'l:'l:'l:l:i:i:~~liii'l:J:-x. .. 40
35 1 .OOE +03 •··· • · ·· -· ·· · --- ------1oonntf f;" ·- -- ·-·- ·-·1
1.00E+02
1 OOE+01
1 OOE +00 ··---
1 OOE+OO 1 OOE +01 1 OOE+02
Figure A1 .5 Shear Stress (Pa) G", G', Complex Viscosity and Phase Angle Rheogram for Bentonite RV 7.0% w/w Measured at 0.05 Hz and a Stress Range of 0.00 - 100 Pa
30 Vi' <lJ <lJ ... C)
25 i§: -<lJ C)
20 ~ (1) I/) ro .c
15 a.
10
5
0
1 OOE+03
--- ......
- ·• - Elastic Modulus
---Viscous Modulus
-A--- Complex V1scos1ty
- ~ - Phase Angle

,...,
·· -·-··---· - - ·· - - -·-- -- -------·-1-0GE-+-03- ·- -- ---- -·----- ·--- ---- - ·- - ·---····- - -·-· - ·-· ····-- - -··- 120
<1:1 a.. I -.... I
Cll I -Cll
I E <1:1
~ 1 00~0~ 5, I 0 ' - I 0 !
Cll .r:. a::
'
~ ~ ~ ~ : ~~ . 1 : : : ~ ';°':'J IC ·tc ·~ ·~:\ lf f H
..-----~ T/' 1.00E+01
. . ...-.-- ... j ~'. -•. . " " \
__ ,'_~_ --\~ ·-"~, ,--~~-;:~; 1 OOE+OO- · -
1 O~E+~.1 .,. , I .I
l I .• • ..
1 OOE-01 1 OOE+OO
J __ t_ _ --- -· --/ -1 OOE-01 ,_ - I
1 OOE-02 ·
- ,% ******~~~
,i
I I
i I
I
I
~ \ . ~ - !E- - 1: ~·
- ···- ·· -- ·· - -- ------- .. ---1·00E-93 ·--· ·· -· ·---· -··--· -·- -- ·- -· ---- -- ... _.
Figure A1.6 Shear Stress (Pa) G" , G' , Complex Viscosity and Phase Angle Rheogram for Carbopol 971
0.5% w/w Measured at 0.05 Hz and a Stress Range of 0.00 - 100 Pa
100
80 -fl) Cll Cll .... Cl Cll Q -
60 ~ 1 OOE+03 Cl c:
od: Cll fl) <1:1 .r:.
40 a..
20
· - 0
- ·• - Elastic Modulus
---Viscous Modulus
_..,._ Complex V1scos1ty
- ~ - Phase Angle -- - · ---

w
r
···- - . ---·- ··- · - --·-·----·--l:99E+03-~---·-·-·· · · ··· - - -··-··- ·---·· ---·· --··· - ··- - ··- - - ·- ·-- ··- - -·· --··- --- ·-· ·- ·--· -· ·--, 120
I
I I I
ro I ~
I ....... ~
~ -~ I E
I ro ~
ro
~ 100~~ I
Ol ' 0 0 ~ ~ ~
j(~~~~~
~ -~ -~ ·I-1toE!"o,.: ·I- ·I- ·I- ·I- ·I- ~ . 'I
\
~ Ir
l'l
-· -- · - '1 /' .. - -1 ". :1 ..
I~ • .,_ I .'-;1 I • a I .
I 1.00E+p1 \
I ~
! 1.00E-01
1.00E+OO ·
1 OOE+OO •, 1 o'til +o2
- -· - - 1-.00E-04 - t-·---·- - . . I \ I ~ I I I
-- +GOE-02 .L -- _ ···-· __ .. --J,------ --· --- -~- - - --- ------ -· ... - --·· .. ...x . ,I
..... ~~ \ . ******"*..)(-?O. ~-
· ··-··- -· ·- -··---···· -·1-00E-G-3-- -·· · -· ---·--·- ·· - --·· -·····- · -····
Figure A1 .8 Shear Stress (Pa) G", G' , Complex Viscosity and Phase Angle Rheogram for Carbopol 971 2.0% w/w Measured at 0.05 Hz and a Stress Range of 0.00 - 100 Pa
100
80 Vi ~ ~ ~
Ol ~ a
60 ~ 1.00E+03 Ol c:
c::x: ~ (/) ra ~
40 ~
- · 20
0
- · • - Elastic Modulus
------ Viscous Modulus
--k- Complex Viscosity
- ~ - Phase Angle

ell a. -.... Q,) -Q,)
E ell .... ell a. ell u
:t:: Ol 0 0 Q,)
..c: 0::
i···----·-- -· ·-···-·· -·----·- ·----·1-:BOE+G3--- --··· ·- --- ----·- -- -·----- - --- - -··--·-· . . ··- 120
I ~--
I
i I ! i I
1 oot:-02
i I
:f--:f-·:f--J--!- -I--F.-1-.1-.1- ~ 1 OOE+02 I ·J.. ·J_ l
I
1 OOE-01
. J. \._
__.-.:.. ' · . I ..-. ·--· •.-· • '-'Vt-\ - 1.00E+o1 , · ~1 "\I ~i~I
~I ', ',
\ 1. I •• I
I . --1.00E+OO -- -- -- ·-- · - - ·-~-r --· --· -· '1 --· --· ·---·-- ·---- · · ·-·
1 OOE+OO 1 OOE-f01 ', 1 OOE+02
.. /
i 1 OOE-01
I
I \ I J;
I \
/~ ~ \ I
x-~ .............. ~:,t ,x
.z.
··-·· -- ···--1·00E--0'2 ·- ··--·· ·-· ·· - - ·- · -· · -- ···-··- -
Figure A1.7 ShearStress(Pa) G", G', Complex Viscosity and Phase Angle Rheogram for Carbopol 971 3.0% w/w Measured at 0.05 Hz and a Stress Range of 0.00 - 100 Pa
100
80 Ci)
60
Q,) Q,) .... Ol Q,)
Q -Q,)
°' c: <l: Q,) tJ)
1 001:+03 ell ..c: 40 a.
20
0
- ·• - Elast ic Modulus
--a- Viscous Modulus
- A-- Complex V1scos1ty
- -X - Phase Angle

-ro a.. -~ Q) -Q)
E ro ~
ro I a.. -I ro
- u ._,,
I C'l 0 0 I Q) i .c I
0:: 1 00~-02
I
I
.. ·1·00E+03 - ·- ···- -·· . . - - ·-· ·--·------ -- . - · -····· --· ·- ·- - ·· - - - -· -· -, 100
!- -!--f--f--f--f--f--f--f-·!- ·I--!- -~ . f ·1 1 OOE+02
H-~~-H-·' · ' '' _ , -~K'1 ·-i
' !1 i
t1\ i
·. ,, 1 OOE+01 ·
_\ . ·,'-/ l ' I 1 ' I I I I
I I
- · 1.00E+OO · ·
1 OOE-01 1 OOE+OO 1 OOE-+O~ ,j'
:. ...................... ~~~~ - ·- 1-00E-01 ·-
Figure A1 .9 Shear Stress (Pa)
\
·1
! . !. • · -
\ 1 OOE+02
\ !
G", G', Complex Viscosity and Phase Angle Rheogram for Carbopol 971 4.0% w/w Measured at 0.05 Hz and a Stress Range of 0.00 - 100 Pa
90
80
70 -(IJ Q) Q) ~
60 C'l
50
Q)
0 -Q)
C'> c <
40 Q) (IJ ro .c
30 a..
1 OOE+03 20
10
0
- ,
- ·• - Elast ic Modulus
--a- Viscous Modulus
--6-- Complex V1scos1ty
- ~ - Phase Ang le

cu 0.. ~
'-Q)
Q) E cu '-cu 0..
cu . ~
;; Ol 0 0 Q)
J:: a:
-· . 1~00E+03-···---····-·- -·- ····-··-··-··········· ·-·-· ·- ..... ----·······--·-·- ··--·-·· ·-·· ·- ··-- · - 100
;
I
10+01
I
I
~·•·i~T
f- ·f- ·f- ·f- ·f- ·!- ·!- ·!--!- ·!- ·!-. ·-~\ f ,1 I ~-~ .
1 OOE+02 · %' , \~I I . .. ~ I
__ ,_l I \ , _ , __ , _ = -----' __ , . ' r/ ...
~-!~~~ = \: ,,, ~ ..
r< I '}
.! ! , \ 1.00E+01
1.00E+OO I
1 OOE+OO 1.00E+01
I ~g $-~ -s-~~ ... ~-I-
,,f -8
,/
I
~
I , '
! ' I
J I
,t !
1 OOE+02 \
!
1 - ···· ···· ·- ·-· · ····+OOE-0+---·-··· ·· -···-····· ··--·
Figure A1.10 Shear Stress (Pa) G", G' , Complex Viscosity and Phase Angle Rheogram for Carbopol 971 5 0% w/w Measured at 0.05 Hz and a Stress Range of 0.00 - 100 Pa
90
80
70
CJ) Q)
60 ~ Ol Q)
0
50 ~ CJ) c
<(
40 ~
30
1 OO E+03 20
10
0
cu J:: 0....
-
- ·• - Elastic Modulus
-4-- Viscous Modulus
--A-- Complex V1scos1ty
---~ ~ P_hase _Ang_le

re Q.. --... QJ ..... QJ
E re ... re
Q..
re u
- O'l -.J 0
0 QJ
.s::. 0::
'Ol02 ' OOE·O' • <l<lE ',~OE•OO 1 OOE+01
I
I I I
I
I
·~· ~-·- -H4if rrr1=t-:t:r-1=r+1----
120
1 OOE+02
100
80
(/) QJ
~ I
I
~ ~ I ,.__ _ LOOE-02 , i i i I
---- i - iO- I I • . ----- 11 i I- . __. I ~1---~1--------Jl;i:c_ -~ 60 g>
I
I I
I I
·~ . I I -~ . I -~ .• 11 I I
= · 1 OOE-0 I 3 . I
!. I I I
'llL.·~ I r • I
~ I •, :r-·. ~ .· I- -,1-. I- . I-. J: \.. / I . -s- -- ·----- r· --- ------- -· ---- . - ----- -- -- . --. I - ·· ---- ··- ·--- -·- ---·· --- -- ·-- ------ ---4 .OOE-04 -
• . I \. ~· )(_...-* "* ~ ~ - ·
c -QJ
Cl c:
40 cl:
20
0
QJ (/) re
.s::. Q..
·- -· -- ------ -------- --------------· --4:00E-es---!--- ------------------- ··------··- ·- - --- -- - ---- - - J -20
Figure A1.11 ShearStress(Pa) G", G', Complex Viscosity and Phase Angle Rheogram for lambda Carrageenan (RLV) 1.0% w/w Measured at 0.05 Hz and a Stress Range of 0.00-100 Pa
'~
- · • - Elastic Modulus
----- Viscous Modulus
---6- Complex Viscosity
- ~ - Phase Ang le

-re a.. -,_ Q) ..... Q)
E re ,_ re a.. re u C'l
00 0 0 Q)
.c 0:::
, - -·- ·- - - - ---· --- ·-- ----·---- ·- - ·-H3GE-+-03--··-.. ··- - - .. - - - ------.... ----- .. --·- 120
I 1--· --1 I I
1 OOE-02
I- -I I
I I I I.
,,-+1-=t--¥1 -. ..
100
1 80 Vi' Q) e O'l Q)
Cl -~ 1.00r+02
~ 60 ~
. 1 . OOE+10~0~ +0.0 f: l; , 1.00E .01
1/ ·-.. 1 OOE-01
·-·-- .. ·-· ·---- .. -------- -- -- 1-00E-01·-~---l'l - - -----------· · ·--· ij/ ' 1[ '•
.... _. _,, ... "II - ·-
~I i \ .. - - --- --·-· --·-· - - - .. - -·-1.GGtl02· ' ·- -· . ·--· -- ·- ·-· - - .... -- ·- - ·- -- \ -· -·-
i / .... t"
j: :j· :;,: :g---i'· -':::~-- - -- ·+OOE-03 - -
.... --.... - .. --- ·-· ---.. ----- ·--· -·- - -- -· --~ .. OOE-04--- -------
Figure A1.12 Shear Stress (Pa)
.,. " --I
I _/ __ .. __ _ -··- - ··--- ____ ____ ._ ____ _
I , . I '..'
G", G', Complex Viscosity and Phase Angle Rheogram for lambda Carrageenan (RLV) 3.0% w/w Measured at 0.05 Hz and a Stress Range of 0.00-100Pa
C'l c:
<1'. Q)
"' re .c
40 a..
20
0
- ·• - Elastic Modulus
--a- Viscous Modulus
---.-- Complex V1scos1ty
- ~ - Phase Angle .. ·- -····-· - -

I I -
- I
~ I ~ I (l) .
E t· -~ 1.00f.-02 ro I
~ I u I
-0 t I al i
..c I 0:: . I I
i i I
i
I I I I I l
- ··· ····· H>OE-+-03··-;··--·· --- ----··· -···· - ·- - ·· ·- -· - -·-------- - 120 I
~OE+02-!
-: . .,._ _,,_ -· -· ..... . \ \ i .. '
. ··-··· --- -~E+•
~--------- \'
' 1.00E-01 t ... ----1-.00E
,' ~~~ I . 1'. ( -..
f I
I
1 opE-01 Jl.
I I I
~E-02 I
I
:x- -~ -~ -~ -~)~ 1 OOE-03 I
· :r --r~t-~t-f -~t +--!
.. ' ._ ..
' ~
I
••
~
•
. .Jr" . -I
. 100
80 Ci) Q)
~ 0) al
+02 e 60 ~
0) c: <(
al !/) ro
40 ..r::. 0..
20
-- - · ---· ····· --·-·- ---- ···-· -- · ---- 1--00E-04 .L .. · - -- · ---··· - ----·· ·· -·- -·- ······· · -- · ·-·--··· ···-· - ·· · ····· ··· - --··· .. .J 0
Figure A1.13 Shear Stress (Pa) G" , G', Complex Viscosity and Phase Angle Rheogram for lambda Carrageenan (RLV) 5.0% wlw Measured at 0.05 Hz and a Stress Range of
0.00 -100 Pa
- -• - Elast ic Modulus
-9- Viscous Modulus
____...._ Complex Viscosity
- ~ - Phase Ang le

-l'J 0.. ._ I... Q.) .... Q.)
E l'J I... l'J
0..
l'J (.)
N C'l 0 0
0 Q.) .c. 0:::
r-----·--------------- --·- 4:00E+03-- --·· -·-··-·--- -- -------- ----· - ·· ·- - - ---- - ·- -- 120
i I
;JE--ilE ilE ii[ ~ +02 I I
1 oob.02
i I I
I
1t3E, 100
Jf- ··• · ·JE-·-.- ....... . ...
._ , :ttr+~-r-+~ ~~~~:t :~~1 ------~
1 OOE-01
:ic- .... lE- .... .. - ::i- ..... :r ,.,
1.00E.cri·. _ ~ .,~" 80 -
b
. Q.)
· 1.00E+01 a.>
11. ~E• o · - S,
\ 1.00 '°' e. 1.00 , _, 60 ~
I ' ·-- ··· ---- . ~ -,_ ----- ---- - ----- ------ gt I .. _..._ --- -- -- <t:
I 1 OOE-02
I I I I
J\oE-03 • ~ .....
~ ~ l'J
40 ..c: 0.. .. '\.
'11. ......
:-; ' I
20
\ .r ·· • ·· •
,r
'I ...... r . - ... . . . .. --- ··-------- -- . -- ·--1-00E-94 -- . -·· --·· ··-·-·- -··- - - -- 0
Figure A1 .14 Shear Stress (Pa) G" , G', Complex Viscosity and Phase Angle Rheogram for lambda Carrageenan (RLV) 6.0% w/w Measured at 0.05 Hz and a Stress Range of
0.00 - 100 Pa
~ . ·-- --- -- ·-- ·• - Elastic Modulus
---- Viscous Modulus
--A- Complex V1scos1ty
- ~ - Phase Angle - - ~ - -- - .

re I a.. - l "- I Q) i .... Q) I E I re 1 ook.02 "-re I a.. re I u I-
N Ol I 0 0 I Q)
I .s::. 0::::
I I I
i I i
-·- - - - - ------------ -· -·--1{)()E+tl3-,--------------------------------··--- -------., 120
I I ][]E:lE:lEJi:lEJi~
1 OOE+02 /' \ \
]f- . ... -]f- -)f- -]f- . • -· . .... . ! ~
... ' -~ '
------ ~· 'a..._ • --·- · ·--•--11--• ,. '1._ 1 OOE+01 · .. '·. -._.
• • -f-f-f-! '
1 OOE+OO i ·I .... '°OE•OOf -1-1 ·. 1 OOE-01
1-00E-G1
I I I
1 OOE-0:2- ~ I
I I
1 op~3 .
~ -:I- - :x- -~ -X- -x- -X'
- -- ·· · -1 OOE-04 - ·
I r I
Figure A1 .15 Shear Stress (Pa)
I_
' .. ' ..
\
ir;
\
G" , G' , Complex Viscosity and Phase Angle Rheogram for lambda Carrageenan (RLV) 7.0% w/w Measured at 0.05 Hz and a Stress Range of
0.00 - 100 Pa
\ I
100
80 I/) Q)
~ Ol Q)
+02 e 60 ~
C'l c: <(
Cl> I/) re
.s::. 40 a..
20
0
- ·• - Elastic Modulus
-9- Viscous Modulus
- A- Complex Viscosity
- ~ - Phase Angle

-ro 0.. -..... Ql -Ql
E ro ..... ro 0..
ro u
- Ol Iv l...l 0
0 Ql .c a:::
1 OOE+01
. .I"- · !- · ·!-·~·· 1- . -1- .. 1 OOE-03
I ~
:t'. \
. ~- _,i. 'I. ,,.:I-.
~-~· · ~ .. r.
,,.r 1 OOE-04 · 'I
\ . !
· ·· 1 OOE-05- · · · ··-- · ·- ·····-· · -
Figure A1.15 Shear Stress (Pa) G", G', Complex Viscosity and Phase Angle Rheogram for Iota Carrageenan (VV11 PF) 1.0% w/w Measured at 0.05 Hz and a Stress Range
of 0.00 -100 Pa
120
1.00E+02
J
100
80 Vi' Ql Ql ..... Ol Ql Q ._
60 ~ Ol c:: <t Ql VI ro .c
40 0..
20
0
- ·• - Elastic Modulus
--a- Viscous Modulus
---.-- Complex V1scos1ty
- ~ - Phase Angle

...--.. cu
CL .___.. ,__ Q) +-' Q)
E cu ,__ cu
CL -
t-J cu l.J u
0) 0 0 Q) ..c a::
r---·---· 120
1 OOE-02 E~O • _:r 1.00E+01 1 .00~+02 I I I
I ... ~ ' ~
tf-f ·~r-f-f-t ·~rrr ·~l=t~ -rm11 ' L · -!- ·· ~ ~ f.··:... I l- -- ~ ·.t-. . !.
1 OOE-02 - ~
1 OOE-03 ·
1 OOE-04 -
Figure A1 .16 ShearStress(Pa)
' I
\
! f-• • ~ .-! -.::. . / ":%.
,CL . 'f • I \
l I
!·'
G", G', Complex Viscosity and Phase Angle Rheogram for Iota Carrageenan (W11 PF) 2.0%w/w Measured at 0.05 Hz and a Stress Range of 0.00 - 100 Pa
100
80 -Ill Cl) Cl) I... Cl Cl)
c -60 ~
Cl c: <( Cl) Ill ro .c
40 a..
20
0
- · • - Elast ic Modulus
-4-V1scous Modulus
--.- Complex V1scos11y
- ~ - Phase Angle

ra 0... -1.-(1J -(1J
E ra 1.-ra
0...
rtl -N u A Ol
0 0 (1J
~ ~
~
r · -·- - ···- - HlOE+B2 T-· -·--·· -···--- - . -- 120
i i I I 1-
1 ooro2
I I
I·· I
I f
l - i - -1- x J; J; 100
·, I • • 80 (/)
11 ·,_ ~
-· 100E+OO· · · ( · · - 'I . · i 0, 1 OOE-01 1 OOE+OO I 1 'E+01 I ~ 00 +02 ~
t-t-t-f-f-f-f-f-f H-f -t-f '-- • • ,, ! .. ·- -··· . . . - · ··· ···--100E-G1 j. · · · •· ··· ·· ··· ·t ----- - · · (J)
rtl ~
40 0...
I -·· ·· ·· · 1.00E-02 f 1···"l- .._ \" · ·· r I l 20
I
1 I ' i i:
.............. .... ------·-·---·--·----··· ····-····- ··1·.00E-G3-...:_· - ···- ··-·· ···· --.. ........ ...... ··· ·· -·-· .. ·-·- · ·-···-···-- ...... ··· -· ···- ........ J 0
Figure A1.17 ShearStress(Pa) G", G', Complex Viscosity and Phase Angle Rheogram for Iota Carrageenan (VV1 1 PF ) 2.5% w/w Measured at 0.05 Hz and a Stress Range of 0.00 - 100 Pa
-----
- ·• - Elastic Modulus
-a--- Viscous Modulus
----.- Complex V1scos1ty
- ~ - Phase Ang le

re a.. - I ... I
<ll .... <ll E re I ... re I a.. re
I - u N V> Cl
0 I 0 <ll
.r::. 0::
1 ool.02
·····-1-00E-+03-- ·· -- - ·-·· - ··-· - .. ·- ··-- ····-·-· · ·--· -· -·- 100
l - l -- l · - 1- l - + · l T - l ·· l - l · l -I-- l -.. l .. -l--1-~ f I
fc . ·fc . fc . - ~-fc •. ~ -fc 1:E:- .fc . . : -~· .:- .~ -fc---~ ~~ •. : ..• ,\ -
. !\ J-f-f- f--' ' ' -IJ--f ' ' ' ' ' ' '1 \
1 OOE+G1 · - - - . . . ) . ' \
I I
I
f,~
90
80
70
60
50
40
30
. J; ~ ~ J;_ ~ ~ J;. ~ I -=- \Ii: ---~ --;t_·--~- ·;t_ --~-J' -· :· -f -~. ".'.'-~ . ::-~_,,.. T.,..._T_~-4-.~~-=.;oc; :.:.-i-:.-, _~ -~11J~+O~ -~ 11 OO~ +~J 1.00E-01 l'JOOE
-· ··· 1-·00E-01 - - ------·--·--·--··---·-· -·-- ···- ··· ····
Figure A1.18 Shear Stress (Pa) G", G', Complex Viscosity and Phase Angle Rheogram for Iota Carrageenan (W1 1 PF) 3.0%w/w Measured at 0.05 Hz and a Stress Range of 0.00 - 100 Pa
t !
10
0
/
-!/) <ll <ll ... C) Q) .. - -· -Q - ·• - Elast ic Modulus -Q) -9- Viscous Modulus
Cl --A-- Complex Viscosity c:
- ~ - Phase Angle <x: Q) !/) re
.r::. a..

-('ti a.. -I-Cl) ..... Cl)
E ('ti I-('ti
a.. ('ti
u -10 Cl °' 0
0 Cl) ~
0::
1 OOE+04
1.00E+03 ···
1.00E+02 ·
1.00E +01
100Ei00 · -··--- - - --··
I OOE+OO
I-i+i iii H-i--I-i-i-i- I-i-i , . 4 ~-. I
---- - -- ---- - -- - . - --- · . -· ---- -·· -··------- ·-- -- .. ·- ...... --- -· -- -- --- -
!- !- !- H-!- f- f- f- f-f- !- !- !- f- i- i. / ~
'·I I \
__ _t_ __ I ----- ----- ----- --- - - ---- -- - - I ~L- _,_, I
~ .,_, 1~·· ~
I I I
--·- ·----·-~ ----- ---
/ I
~s~ ~J ~ .. _.x-r~~
1 OOE+01 1.00E+02
Figure A1.19 Shear Stress (Pa)
70
. 60
50
-r/) Cl)
~ 40 gi
Cl -~ Cl c::
30 <( Cl) r/) ('ti ~ a..
20
. 10
----- ·- --- · 0
1 OOE +03
G", G', Complex Viscosity and Phase Angle Rheogram for Iota Carrageenan (W1 1 PF ) 5.0%w/w Measured at 0.05 Hz and a Stress Range of 0 00 - 100 Pa
,,---...
- -• - Elastic Modulus
-II-- Viscous Modulus
----..- Complex Viscosity
- -X - Phase Angle
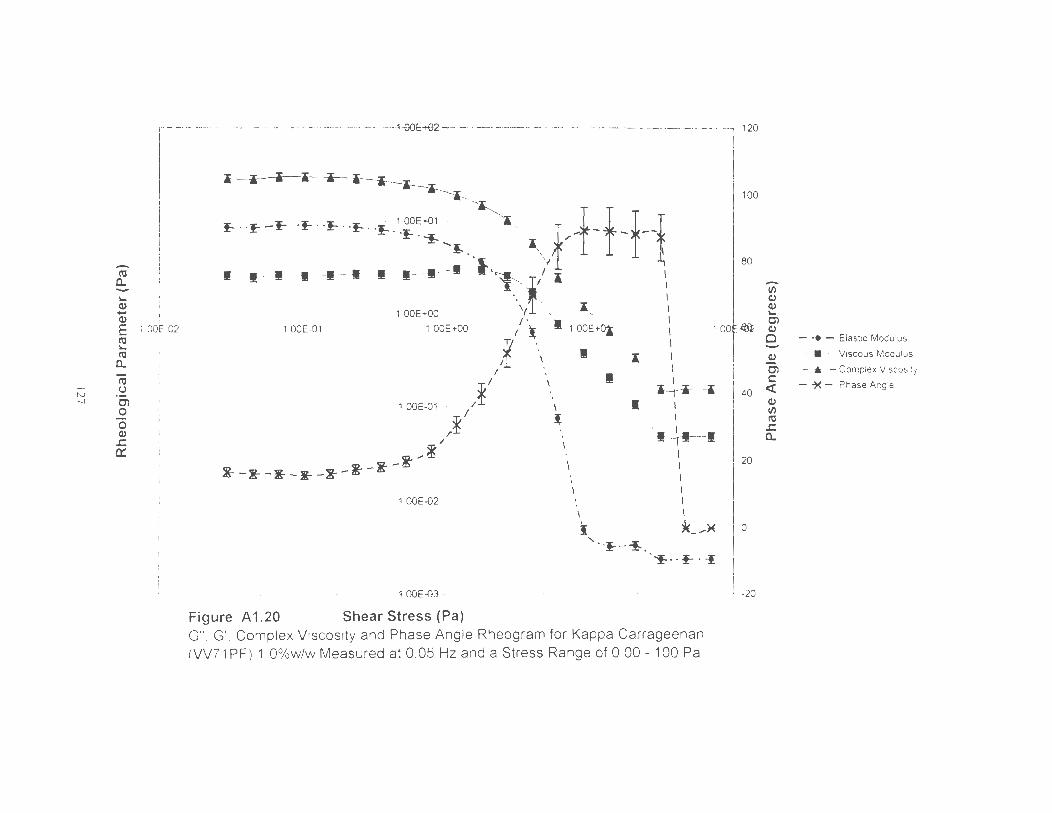
ra ll.. -.... ill ..... Q)
E ra .... ra ll..
ra N
(.)
-..] Cl 0 0 ill .c 0::
---- --- --- -- ---------------- ------1:00892-- -------- ---------------------- - --., 120
I I I
I i
1 OOE-02 I I
I- 1--1- + ·F 1- -~ '-~':: l~.. ~\ ,lf-Vf •····•·· -J!·---------·_______....... ~- ,'I I )'. , -1 I
\I\ ..• _ \
100
80
-f/j ill ill .... 1 OOE+OO I
1 OOE-01 1 OOE+OO / •• "._ . 1 OOE~ot 1
1 y ·. I
Cl 1 .ooE~ ill
Cl
1f I I 1. I I \ I
~/ I I . \ I
'i ti i -- ··- 1-00E-01 - - /. . I -- \ -- - -·--- --·-- · • ·-·-·- l
~ ~ \ I I'~ ' I
" · I I I ~ I I -!' .... ~ I
~-~-~-·-~-~-~ \ I
1 OOE-02 ·
I '
-- - - - - ------···-- ---- - ·· -- - 1 OOE-03 - -
Figure A1.20 Shear Stress (Pa)
··~- - ~.
I I I I
:K_ ... )(
~-- ~··!
G", G' , Complex Viscosity and Phase Angle Rheogram for Kappa Carrageenan (VV71 PF )1.0%w/w Measured at 0.05 Hz and a Stress Range of 0.00 - 100 Pa
ill Cl c::
40 cl:
20
0
-20
ill f/j ra .c ll..
- · • - Elastic Modulus
- a-- Viscous Modulus
--6--- Complex V1scos1ty
- ~ - Phase Angle

~ fl.. -'-Cl) ... Cl)
E ~ '-~
fl..
~
IV <..> oc Cl
0 0 Cl)
.!: 0:::
I I
1 00~-02
I I
- · - -·-···· --· - -· ·· -· 1:00E+05 ·- · 100
-- m---------:- -0- +00~+ : r--1 ~ \ ~\ -· ·- - -- 1-- - -
I ' I , \ A llE- / -,~ -~ ~ - ~ -· E----- --- --. , I\ • x- ··x- · ·x--F-·~ · -.._
-~ ' ' ' , ~ I , : . , \ I ·I , f' '\ I -,.· · l,,\.,,, I 1
I Ir \i \~ t-{ l "'~) 100~2 ' ii\
:t I I I~ \ ~ I I I I . \ I I I I · I I I I I_ \
I I I 1 OOE+01 . I \ I / \ I I ~ \Ji I I
f I i I I I I I 1.00E+OO I
90
80
70
60
50
. 40
30
20
1 OOE-01 I oqz_ - r I p:;, 1 OOE+OO 1 OOE +01 I
X I \ w '- I \ #>-
:i! OOf +02
10
- x, / X-*-~->*_.--:.--)1(--*-~-" \, ~
-···- - --- ·-·- ··- 1 OOE-01 --
Figure A 1.21 Shear Stress (Pa) G", G' , Complex Viscosity and Phase Ang le Rheogram for Kappa Carrageenan (VV71 PF ) 3.0% w/w Measured at 0.05 Hz and a Stress Range of 0 00 - 100 Pa
0
-f/) Cl) Cl) '-Cl Cl)
Q
Cl)
Cl c: <t Cl) fl) ~
.!: fl..
- · • - Elast ic Modulus
--• - Viscous Modulus
----.- Complex Viscosity
- ~ - Phase Angle

-N -0
ro c.. "Q) ..... Q)
E r: ro c.. ro u O'l 0 0 Q) .c QC
I '
I I I
I I
I 1 00~-02
I I
----- ·- -· ----·-·----1 :00E+DS.·~··· ··---·· - - -·· ·· - ··· ·---·· -·· · ·-· ·-- -·--- ···- ···- --- - ---· - -- - , 100
90
..-- ', j ~, - ' - - - - - -- ----- -1
I \). \;: . / \ •. : ~·-§- ··lf- -,._ . ·!f-··lf--!f-·-.."• ] · I \ ' 'I- I
~.. \ ' '·i:' .
80
70
• , , I \ 'I ,
I . l•\ r . 1 _ \ - / 1 OOE+02 • _ __ I\ \ \\. 1',1 1~ n\\\
I / I I • :1 I I I I \ , I I I I '. \ I I I 1 OOE+01 - 1 I I I I I I ' 1.Ji I I t I I
I
60
50
40
- 30
I 20 I
1 1 OOE+OO · · - - - - - ·-- · - · · r . L
1 OOE-011 $, 1 OOE+OO 1.00E+01 I I I \ X X I \ -'
~ 00~+02 10
'-x / X-*-~- .. ----•- ... ------' I '~ ·-·- · · -- ·-- -·- ·- ··· · -- ·--·- --· · HlOE-01 ·- · · ·
Figure A1.22 Shear Stress (Pa) G", G' . Complex Viscosity and Phase Angle Rheogram for Kappa Carrageenan (VV71 PF ) 5.0% w/w Measured at 0.05 Hz and a Stress Range of 0 00 - 100 Pa
0
-tll Q) Q) "-C'> Q) -··· - -Cl - ·• - Elast ic Modulus -Q) -II-- Viscous Modulus
C'> ---k-- Complex V1scos1ty c:
---~--:- P t:_a~e _Angl_e <t Q) tll ro .c c..

(tl
a.. -I-(l) -(l) E (tl I-(tl
a.. (tl
- u w ·-0 O'l
0 0 (l) .c Q:'.
· - -·· · ·- · ···· ·-t ·.OOE+05----·· ---·- ·- · ·-··-·--· - ·· - -·-· - ··-. - . -·- · ---- 120
. ·:f-. ·f- . ·!-. ~. ~ . ·1 .. 'l.r !- . ·!- . ·!-. ·!- ~ \ r · ·I+. !-.· . I .. ~ .. / l' I .-1 '\ / . I _._ / 11
,--· ~ .,..--, \ 111-~ ~ ~ -I. . / I
I"' 100E>03 \ . r v i \ i •A\ -----.~, I «. I I· . · I i/ I \ I 1 '1 , \ I
f I I I I :
!... ~ /~~OOE+02 \\ I i'
I i I '---
1 OOE-01
:i; I I J I \ t I I I I I /
\J \ :,, ~ ... ::i l 4> T ' \ ,,., ...._ _ _ ...._ -~-- .
\ ,,.- \ I - \ .. . - ,... x..- _, ___ . r ~ .... ·· 1.00E+01 - .. \. * -)( I
X- '.X
t
1 OOE+OO 1 OOE+01 1.00E+02
Figure A1.23 Shear Stress (Pa) G", G' , Complex Viscosity and Phase Angle Rheogram for Kappa Carrageenan (VV71 PF) 7 0% w/w Measured at 0.05 Hz and a Stress Range of 0.00 - 100 Pa
100
··· 80 -(/) (l)
~ O'l (l)
60 0 -Q)
O'l c:
40 <t (l) (/) (tl .c
.• 20 a..
0
-20
1 OOE+03
--.,.
- ·• - Elast ic Modulus
----- Viscous Modulus
-.- Complex V1scos1ty
- ~ - Phase Angle

-(\l 0.. -"-Q.) -Q.)
E (\l "-(\l
0..
(\l
- u w
C'l 0 0 Q.) ..c 0::
10 T 01 1
I I - ~~ - - - -- - - - 0.1 -
I
i i r-rT-¥-t-.__-i~
· · ~- - I- . ... .r-.._~ .
' 0 001
- _._ ·1 ··-~ '--11-·------------- . I I
I I
lf: " . ._.. ·:tE- . ·:tE- . -~. -~ . ·:tE-. -I-. -I-I. -I / I I
~ r · . \
I I I I
-y·
~ 0 0001- . I
I I
..... ·-- -- --· ·--1 I I I I
120
1~0
100
80
60
-t/) Q.)
~ C'l Q.)
Cl -Q.)
C'l c: <( Q.) t/) (\l
40 ..c 0..
i ' I I I ... -· . -·. --··-·· ·-· ·----·--··-- \iy_.; - Q -. QOOO~ -··· ·- -·-··- ·-- ·· -···-··· -·· · ·· . ··-·--··-····-· ! · -···· -- _, 20 I I : I
I \ J ..... -·-·----·- ----·---··-··--------G-tl9999·1~------··-·---- -----·----··-·· -'--··-· ·-· ··-··- ·---· *-·
Figure A 1.25 Shear Stress (Pa) G", G' , Complex Viscos ity and Phase Angle Rheogram for Sodium Carboxy Methyl Cellulose 0.5% w/w Measured at 0.05 Hz and a Stress Range of 0 .00 -
100 Pa
0
.........
- ·• - Elastic Modulus
--e- Viscous Modulus
--.ta- Complex V1scos1ty
- -X - Phase Angle

C'O 0.. -"-(1) ... (1)
E C'O "-C'O 0..
C'O - u w
O'l IJ
0 0 (1)
.i:;:,,
a::
,--------- ·--·------·
1 OOf-02 1 OOE-01
1-GGE-+BG------·
1 OO E +00 1 OOE+01
120
1 00L o2
tt+H+f ~ ~ 1-J-l ·· -I •-. ~-·-i ·~ ---.__ I ·~ • 1 OOE--02 . - -----. : -~. ~ ---.-.-1 . • r ··~ • •
. ·J_ I I I I
"I. .. 1 OOE-03 !.
'I
1 OOE-04 -
-- ·1-00E-05- - - · ·
Figure A1 .24 Shear Stress (Pa)
', \
• \
~
I
\
\
. y· ..
I I I I I I I I I I I t
1" ' I r ~ )I(---*~~
I -·'1---:t-- ~ - :t- - I
G", G' , Complex Viscosity and Phase Angle Rheogram for Sodium Carboxy Methyl Cellulose 1.0% w/w Measured at 0.05 Hz and a Stress Range of 0.00 -100 Pa
100
80 -t/) (1)
~ O'l (1)
60 Cl -(1)
O'l c
40 <t
20
0
-· -20
(1) t/) C'O
.i:;:,, 0..
-----
- -• - Elastic Modulus
--8- Viscous Modulus
---.- Complex V1scos1ty
- ~ - Phase Angle

C'O a. -i... Q) .... Q)
E C'O i... C'O a.
C'O (.) -·a, w
w
0 0 Q)
..c: c:::
1 ·· .. .. -- ..... ····-----·- ·· -·--· ...... ·- .... -·····4 0 - 120
I I I I
i
I I
100
0.01
i i i l-i-~. ~. -i• i .. ~~Hi:r-:·~f -... f o - Oo - ; 0 -
· 1 · ..... 10 ' 80 "' _ -,~~-t: ,. , ·, , , • ··-1-- 11-·· t- e -- ·--- 1" 1 (/) . 8 . . llCC I ·-. Cl I : ... · ·~ ·o · · l' . ·IC ~ . "'
!" -IC .. l'_l' ··l'··.f··.f ··IC .. y, CJ
! I
I I
i I
1·-· I I I
I I !
'
I -·-----------·- ·.l I
------- ----0--01··---------. ---···-----·---·----·-- . --- - --· - ..
! " --! 0 001 ..
Figure A1.26 Shear Stress (Pa) G". G' , Complex Viscosity and Phase Angle Rheogram for Sodium Carboxy Methyl Cellulose 2.0% w/w Measured at 0.05 Hz and a Stress Range of 0.00 -100 Pa
-60 ~
O'l s:: <( Q) (/) C'O
40 ..c: a.
20
0
....
- -• - Elastic Modulus
--a- Viscous Modulus
--...- Complex V1scos1ty
- ~ - Phase Angle

('Q
c.. -'-Q) -Q)
E ('Q '-('Q
c.. ('Q u
- C') w ~ 0
0 Q)
.r::. 0::
1000 ·-···- - . -- - . - --·-----.. --·------
100
10
-- --- --- -- -- - -- -- - --- - -,·!
!!!fl+ l Hf-ff f-f ff J
%%.£ ;tttn»nnw~- ·•
10 100
Figure A1.27 Shear Stress (Pa) G", G', Complex Viscos ity and Phase Angle Rheogram for Sodium Carboxy Methyl Cellulose 4 0% w/w Measured at 0.05 Hz and a Stress Range of 0 00 -100 Pa
60
50
40
30
20
10
0
1000
-(/) Q) Q) '-C') Q)
Cl -~ C') c: <( Q) (/) ('Q
.r::. c..
...._._
- -• - Elastic Modulus
-- • ·· - Viscous Modulus
---.-- Complex Viscosity
- ~ - Phase Angle

-w ,_,,
ca a.. -I... Cl) -Cl)
E ca I...
1 OOE+03 ----·----- -------·----------- -- ------
~'r-= tH. __ ·-- --- -· -- ---- -- -··-- -- -·- - - 100
-- -- -- --- --- -·- - ------ ---
90
80
70 en Cl) Cl) I...
60 01 Cl)
Cl ca Q.. 1 OOE+01
tttHttffl -- · 50 ~
01 c:: ca
u ·-01 0 0 Cl)
.c:: 0:: 1 OOE+OO
'!
1
40 <( Cl) CJ) ca
.c:: 30 a..
1 OOE +01 1 OOE+02 1 OOE+11.i3
1 OOE-01 ---·---·-· "~--- ·-·-·-···-- ··- ·· -·-- -
Figure A 1.28 Shear Stress (Pa) G", G', Complex Viscos ity and Phase Angle Rheogram for Sodium Carboxy Methyl Cellulose 5.0% wlw Measured at 0.05 Hz and a Stress Range of 0 00 -100 Pa
10
-· 0
- "
- -• - Elastic Modulus
------- Viscous Modulus
---6- Complex V1scos1ty
- ~ - Phase Angle -- - - - ·-

-ro a. -
I
l... <l> ~
<l> E ro 0 01 l...
I ro I a. i I ro I -
(.)
I w
°' c:n 0
I 0 <l> .c 0:::
·-- -------------------4-099·-,·-·- --·------------·-·- ·------- ·---- -----.,.. 120
~- ' - ---- - - 1100 -~,
. f f-: : : :-: :~~--. x__~",. -· t ·1}_-:~_l_=_= 1--- VI *' - "' , F Ff 80 .,
-- -- -- -- - . -- -• - e -- .. ~I -~ g>
. I' , o 1 f ;T, ~, - , o,o ;-
1 I \ C)
\ c I ~ < 'f I '. ··-- ·-·- --
0.1
. - ,-- ---0-1-j . --- J \ .. ··- _ f ,-f I 0-01
t--f-i, i __ * --
\
--~--·-
' · ·· "1( ..
.r ·- -·- -- -·······--··· .. 0.00-1 ·-·-·· •· --- . ·-····-·· -··· .. -···
\ I -~-. ,. -....
() 0001 .
Figure A1.29 Shear Stress (Pa) G", G', Complex Viscosity and Phase Angle Rheogram for Water Lock A-100 0.3% w/w Measured at 0.05 Hz and a Stress Range of 0 00 - 100 Pa
<l> IJ) ro
40 .c a.
20
()
--.,
- ·• - Elastic Modulus
---- Viscous Modulus
-.fr- Complex Viscosity
- ~ - Phase Angle

-w -.J
ro a.. '-Cl> -Cl> E ro 'ro a.. ro u C') 0 0 Cl> .c 0:::
1- --- - ·----- - -- -- - --18009 ~ -- ·--· -·- ·- - --- ·--- -··- ·--··· ·- - ··- - ·-- -··- --- -·. ··-·- -· ---. 100
I
I I I I
I l I
'
f I
0 01
I ' ! '
i .. I T - . --· 1-------·--·1 ' .--·il --1-~ ~ -I-,, 1000 - --
I /-~ -i'
1 : ,; '
' . ' ' \ . _,. I . I
1-··-I - . '·,. / ~ I ' . - I 100 ~· ·.\/. ·1 \I ' , .. ' 1 ,.\ (
' "'i ..... • '"'i..._ .,, ......
'~ a i ~ ! /
\J '~ __ ........ ~ 10 - l .. ,
I I I I I I I I I
· - -- L - \ I ~ b 1 "ii ---· .. ---1 . ~-1 ( -·-tt .
\ I I ~ 1 I I \ •-Sii 1 ' I
I I I ,a:. m, I ' ' I
\ I X/ -:J: ~
\
:t;
I 10
~ 41.
' I I I \
--· ·- ·--· ~-· ---··--- -·-· --·-· -·· . -· . -0-'1 ·-- --- -- -- . -- --- - . --- -· ·- -· ..
Figure A1.30 Shear Stress (Pa) G", G', Complex Viscosity and Phase Angle Rheogram for Water Lock A-100 0. 7% w/w Measured at 0.05 Hz and a Stress Range of 0.00 - 100 Pa
90
80
70
60
50
40
30
20
1ill0
10
0
-(/) Cl> Cl> '-C') Cl> Cl - ·• - Elastic Modulus -Cl> ___._ Viscous Modulus
C') .. . Complex V1scos1ty c:: - ~ - Phase Angle <( Cl> (/) ro .c a.

"
ro a.. -I-Q) -Q)
E ro I-ro a.. ro
w 00
(.)
Cl 0 0 Q) .c 0::
i .. ····- .. ··· 1-0QE+04--- -- - -· - ··· ·····------·- --- ··-·-···-- ··- --- -·- ···--··--·-· ··-· -··-··-·---, 120
i
I
I I
1 00~-02
~-~~-~~ ~ ~~
~ -~ • · ~ • · ~ • · :E- • . • 1 .PjE:+-!j.. I ·I-, ·F-. ·F- , ·I-• · :E- . • \ 100
.---- . ' \ ' , -....... ·--~-.., ~ -• x, \ f • ._,,.---11--.- .• ----·--_r :W:,\ \1--f-
\ i ~- . 80 1 OOE +02 ' '! ;. I
1 OOE+01 ·
! I I I I
1 OOE-01
1.00E+OO-· · ··
1.00E+OO 1 OOEJ!-01 I I I
·- . - ~ -.. t~~\ \ ·- ..... - -<ill. -- . - 'HJOE-01- ..... \ ~' ··- ·-.
~/ 'x / '~ ........ -~ ___ ..... z- -x--.- ..... x
- - ----- - -· · HJQE-02--·- ·-···--
Figure A1.31 ShearStress(Pa)
I I
\, \\ x , I
I , X I J;
\
\ :t;
'•
J;
\
•• 60
- l 40 1.00 +02
t; \
',-1 20
0
G", G', Complex Viscosity and Phase Angle Rheogram for Water Lock A-100 1.0% w/w Measured at 0.05 Hz and a Stress Range of O 00 - 100 Pa
-Cf) Q) Q) I-C) Q)
Cl -Q)
Cl i::::
c:i: Q) Cf) ro .c a..
. --·
- ·• - Elastic Modulus
···-• --· Viscous Modulus
--.....-- Complex Viscosity
- ~ - Phase Angle
-

ro a.. -I... Q) .... Q)
E ro I... ro a.. ro
- u '-' C) -0
0 0 Q) ..c 0:::
i !-
-- -· -· ·- --- --· - ---+OOE+05--,---------- ·-·- ·-·- - - - ---
1 OOE+04 L .. ~ i 1· i ·i -- -- . . ! i i i HU • H ii ii-~--·--·
i:.~_,,._ " f I .%. :r-~~f- A I f-f-f-f-f-f- \
- A •OE• <'>- i --- . ----- -- 'I' 'I' ~I 'I..,' : . . ... --- -·· --·· -··· ···- - ···-···--~--~I . t~ . ' --- ' I _ ____., 11 ·- .. ---- -- ..
1
\ ,....___ .~ I ,
.00802 ;_\/ .. _ 'If' I " '-. I . •
·····t·' · -' -··-
1.00E+G1
I I I
I -- ~--
l ,' ,, )I(~ ~ 'x>< x. ><-w .x- >it-~~~ .x-
\
!
100
90
80
70
60
tJ) Q) Q) ,_ C) Cl> 0 -
. 50 ~
40
C) c: <t Q) tJ) ro ..c
30 a.
20
10
'--~~~~~-HcAfl--+t!l+-i--~~~~~~~~~~~~~~~~~~--,~~~~~~~~~--' 0
1 OOE -01 1.00E+OO 1.00E+01 1.00E+02
Figure A 1.32 Shear Stress (Pa) G", G', Complex Viscosity and Phase Angle Rheogram for Water Lock A-100 3.0% w/w Measured at 0.05 Hz and a Stress Range of 0 00 - 100 Pa
1 OOE +03
-,
- -• - Elastic Modulus
-a- Viscous Modulus
-A-- Complex Viscosity
- ~ - Phase Angle

-C'O a. -'-Cl> .... Cl> E C'O "C'O a. .
I C'O I
~ .~ I C'l 0 b1 0 l
0 ! Cl> .c 0:::
-- ·- -- -- -- ·- --- - -· 10000 -- .. - -
ll:-..__ .... .-l( . .... - -- l( -· - -· l( l( . 1~0 Ill: ---"I;
:IE-........ .. .. ... "I lit"" . .... . ,,... •• ...._... . "
~\r_: ___ _;,;··:~,; 1-f-f-t-1 \ f i ,
. I ·, ' 1 ,
10 ••.• j\'0 ,f \:ti a-.....
0 1
1 .
01 . J JI
-,.. . ·- -'~' ,,~--:i/ I \ ,i, I . \ --I 0 01
I \ 'X ~ . .
:I( \ / \ I
>< . . .. ··0 ·001 - - .
Figure A1.33 Shear Stress (Pa)
I I 10 \
• \
:ti \
~ .....
I
G", G', Complex Viscosi ty and Phase Angle Rheogram for Water Lock A-180 0 7% wlw Measured at 0.05 Hz and a Stress Range of 0 00 - 100 Pa
120
100
80 -en Cl> Cl> '-C'l Cl> Q -
60 ~ C'l c: ~
1 (bO Cl> en C'O
40 .c a.
20
0
-
- ·• - Elastic Modulus
-- • - Viscous Modulus
--A- Complex V1scos1ty
- ~ - Phase Angle

:t:
·- ·· -·····-·· - · - ·- ··--·--- ··- - ---·- --------- ···--···- ······-·-·1-0000- -- ---· ··--- · ·-- ···--·· ·- ·
ro a.. -...
Cl> ..... Cl> E ro ... ro a.. ro u O'l 0 0 Cl> .c I ~ I
I oF I I
I i-- ' ~.._·--~~ i i
I i / . ·---· -· -·- . - 1000 '
i ' '--'r . . - ---.., 'i .. l:f: ,, ~ . ~ -:f- . ·I- . ·:f-. ·!- .......
' ~ ' :f- . . :r . ~· · r. ·:f- . i
:f . ~. '\ I
~ '1 i /"' 'J . ~~-~J\·
. r\\• ,~ J \ \ i . \
/ ' \. J
10
• I
I
~'
"T·-·- ---- ··-- .. I ~ - ll! ,'~, , .:&, . :~: ~ .Ft':t' \ I '\ I' I 3lt :X.- x \~/
-- ·--- . .... ····- ~ -· ...
10 \
!
. --- -- -- 100
90
80
70 -t/) Cl> Cl> ...
60 O'l Cl>
Cl
50 ~ O'l c: <(
40 Cl> t/) ro
- .C 30 a..
20
1~0
10
·-·--···----·------··-··· ·····-···01-·-·-- ................ ... . ........ ... --·· · --- ... - .... .. ...... .. ..... . 0
Figure A1 .34 Shear Stress (Pa) G", G' , Complex Viscosity and Phase Angle Rheogram for Water Lock A-180 1.0% w/w Measured at 0.05 Hz and a Stress Range of 0 00 - 100 Pa
~
- ·• - Elastic Modulus
-a-- Viscous Modulus
---A- Complex V1scos1ty
- ~ - Phase Angle

--- ·---·, 100 --WOOG- --·-- ---------------- -- ·-- - -- - ·--- ------
,-------- ~~-I~ Jl! ::: I !-- \ I -- J\ .' ;~ ' !- --!- -!- " !- . ·!- . 70 "' ~ I _,,.r·\•\_•/ ·t· "'··1 " ~ - -- -
a.
1
r , , ~ .... ---~ - E;;.,.,, "''"'"' ;:::' ~ 1 - ::_:_ v,~o"' "''"'"' E : j , / \ I !!"' ~ \ i g> _ >< - Phm Aogl• ('Cl I . ~ I 100 I" i < ~ ' I \ ! I '~ . 40 "' "" I '" '; I •, . Ill ~ • 'I '' '-. Ill Ill I \/ 1 I .c
- u : II I I I 30 0. ~ Cl I I
'
0
0 I 1 -~ I
0 •
1
iJ' I "0 Cl> I 1 I 10 · , I • .c I I I .,, I a:: I ,' ', ! /1'
'I I I I ,lit I 10 ,. I,, ,:I; I / \ I \ ;K, ...-X, ,;
I I I I \ -' '~ 'J: l x._-11: I l I \
/ ---~ 0 I X
11
X' __ ------- - --- -- -- 1 oo i )(' --+- 10 ! -- - --- 1 I .. ---· '-- - -- 0 1
0 01
Fig:.Jre A1.35 Shear Stress (Pa) G", G', Complex Viscos ity and Phase Angle Rheogram for Water Lock A-180 1.3% w/w Measured at 0.05 Hz and a Stress Range of 0.00 - 100 Pa
~---

,.-
I I I I-I - I
ro a.. -'-Q) ..... Q)
E ro '-ro a.. ro
,.,,. CJ ·-\,J Cl 0 0 Q) ..c 0::
I UOE-02
-··· .... _._ ·· . ... ·----- --·-·-·· .. --·· 1-GOE+05·- .. - -.... _ .. . _ - . .. . .. - ·- - - 70
\ . . 1 OOE+Q.3 . ' / \ . . . .. 11
-.: I /\ A· I \ _._.---------1-11-1~· I t
I 1 f I I ' \.. I
1 \\ .OOE 2 · I
I -I
I I I I I
i ~ I I I I I I \ / \ 1 OOE+01 . I I I I I
'i \ $, i I I \ ..-*-""· ..._ ,,1
I
I ' z-X- =-~-~-;x.-X 'lit I ~,,
I r'' v )(./ ......
1 OOF+OO , ..
60
50 -(f'I Q)
e Cl Q)
40 Cl -Q)
Cl c:
30 <t
20
10
0
Q) (f'I ro ..c a..
1 OOE-01 1 OOE+OO 1 OOE+01 1 OOE +02
Figure A1.36 Shear Stress (Pa) G", G' , Complex Viscos ity and Phase Angle Rheogram for Water Lock A-180 3 0% w/w Measured at 0.05 Hz and a Stress Range of 0 00 - 100 Pa
~
- ·• - Elastic Modulus
--a- Viscous Modulus
--A- Complex V1scos1ty
- ~ - Phase Angle

-ro Q.. -.... Q,) -Q,)
E ro .... ro
Q..
-.,.,. ro .z,. u
C'l 0 0 Q,) ..c 0.:::
r·-·· i i
1 OOF·02 I
- --·- ····-···· - · ------t-:GGE+-04 ··--··-········ -· ···- ·- ---·-··---·-·--·-··--·- ·---·· ··--·--··-· ······-- · ... ·····-···- .. , 100
0 i i , I i i i i "
~-- ~-I-·:f- · ·f-·!- \ 1 !-! ' ·!-·!--X ··1 II/ ~ '1 :f
p , '~·\ ' ~/ ·~ 1 00f+02 I~ !Ill, v . (\~\ :·i
I . I
I -r··--· -· -----~ ··- ·. , I ~ - - ·--- ---
! IK. : \ · I I I
t ·· +-G0E+01 . . - .. -- ....
\
I
\
80
60 -r.n Q,) Q,) .... C'l Q,) Q
40 -9:! C'l c: <( Q,) r.n ro
20 ..c Q..
f' -. . . !,' \ ,:.r-x, :i ,._ '"- '• ti I oo"-oo . . " * ->< _..,. ' ~ ><,r-· ;
1 OOE+OO 1 OOE+01 1 00!+02 1 OO E-OJ3
1 OOE-01 -·
Figure A1.37 Shear Stress (Pa) G", G', Complex Viscosity and Phase Angle Rheogram for Water Lock A-180 5 0% w/w Measured at 0.05 Hz and a Stress Range of 0 00 - 100 Pa
·::'O
~
- ·• - Elastic Modulus
-ti- Viscous Modulus
- A-- Complex V1scos1ty
- ~ - Phase Angle

....--... ro
0... ---I.... Q)
-+-' Q)
E ro I....
ro 0...
..... -._,, ro u 0) 0 0 Q)
..c. 0:::
1.00~02 __ 1.00E-01
1cBGE+tlO ~ 120
1.00E+02 1.00E+OO 1.00E+01
I
!
1.00E-01
~--1~1 ~tJ-Lf-f-++w~ I f- • . • • ·-., ~ >-. l ':ii----11 " :L I ·'
. ');.. 1. . ' );.. 11 . ' );..
'll. .OOE-03 1\
'I .'1 I I
\ ~-I- : I ~· · . ,..I- . . ..t I ~ .... r l
' 1 OOE-04 • r. \ I I
~ I I
I
I I \
1.00E-05 \ : \
I \ \
x
- ---- ------------------------ ----1-:0GE-06-- - ------- -- ----···------- - · ---- -------- --Figure A1.38 Shear Stress (Pa) G", G', Complex Viscosity and Phase Angle Rheogram for Methyl Cellulose (Methocel A4C) 1.0%w/w Measured at 0.05 Hz and a Stress Range of 0.00 - 100 Pa
I 100
80
60
40
I 20
0
-"' C1' C1' . ~ - -• - Elastic Modulus
0) __._ Viscous Modulus
~ --..-- Complex V1scos1ty
- - ~ - Phase Angle
C1' -0) c
c:x: C1'
"' C'O .c: a.

-.;:. °'
I i ! . I -ro
Q. i - 1 ,_ '
Cl) ! .... 0 01 Cl) i E I ro I ,_ I ro .
Q. !
ro (.) ·-0'> 0 -0 Cl)
.c: et:
I I
I
I
1-00 - . - . -
- & & · ~ &-· · & · ---~ . 10 .
:···· •· ····· · '::-::,~t'+t~t-f-f-t-! . - ~---:;-. ~ 10
1 ............
0 1 ~ ~--..-. ._...,. 0.1 .. ,. ,
I, ..... ..__.._._ • • ._. ,, I\
0.01 I '.
i • I I I I I I
J; 0 001 ' -l J"'T°'f '!-~---~
,.Y ~ 'l -* -t 0.0001
I I , I I I
·'
,i- · ·lf-··IE" ·- 11" ·· I
120
100
1©080
60
40
20
Figi:fre Ai :ss· · ·-- · ····-sfie~~~Pdss f Pa) - -·-- · ------- · · ··-- · ···· ···· · · - ·· ·· · .J 0
G", G' , Complex Viscosity and Phase Angle Rheogram for Methyl Ce llulose (Methocel A4C ) 1.5%w/w Measured at 0.05 Hz and a Stress Range of 0.00 -100 Pa
-"' ~ - ·• - Elastic Modulus
,_ - • - Viscous Modulus
O') .& Complex Viscosity
Cl) - ~ - Phase Angle
Cl -Cl) -O'> c < Cl)
"' ro .c: Q.
,. '
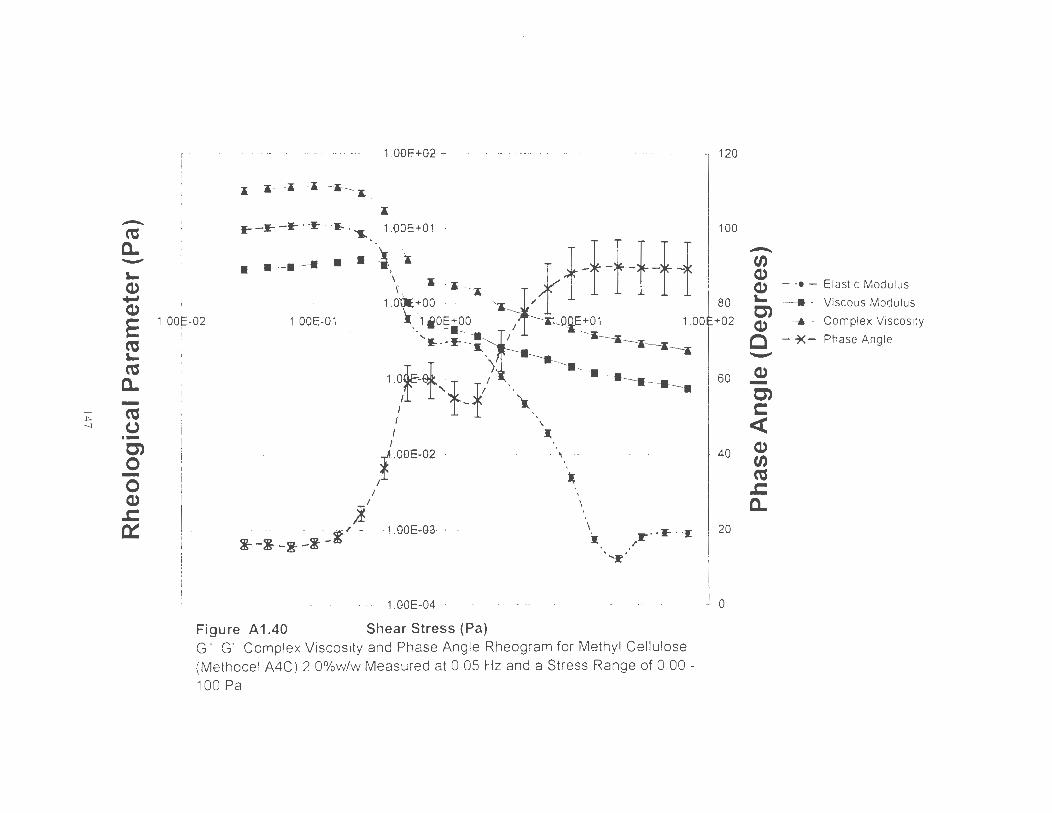
-~ a. -a... Q) ~ Q)
E ~ a... ~ a. -
~ ~ -...) CJ ·-C')
0 -0 Q) .c: ~
r .. -· - ·- ··· -····---···-·-·- 1-: 00E+G2 - ···-· ··- - · - -- -· 120
I ! I I I i I !
I--~_._~
,,__,,_ _,,_ . . ,,_ . . ,. . , __ ~+01 100
I i
1.006-02
·----·---~~~:~~1,f f-f-f-f-f-f · I 80
1.ooE-01 •.:~ li.P~+oo ,j-ru~~1 1 ooe+o2 i I
I I
'~~ ~ 1 .0~-1 :· (
,,r ',f-l ~ I
-----:-- - - ---~
I
-·. I -- --- --- -- - -- ;GOE-G2 -~ __
I I
\
I;
--··- --· -----\ ·---·---------·--· ---
•
60
-· 40
--- -----·-·--· - j i- -i- -1- -i---r-"-·-- - 1.0GE-G3-------- ··- -·--- --· ··- -\.· --··- --·--1 ~;;;F .-.. I - I 20 I'
':t
·· ·· ··- ---- - --· ·- ·· 1 : 00E-04 ~ · · -- ·· ··· · --·--· ·--- · · ·-- ····· --- ··· -' 0
Figure A1.40 Shear Stress (Pa) G", G' , Complex Viscosity and Phase Angle Rheogram for Methyl Cellulose (Methocel A4C ) 2 0%w/w Measured at 0.05 Hz and a Stress Range of 0.00 -100 Pa
-t.n Q) Q) a... C') Q)
c -Q) -C') c: <t Q) t.n ~ .c: a.
.---..
- ·• - Elast ic Modulus
---- Viscous Modu lus
-A-- Complex Viscos ity
- -)(- Phase Angle

-C'a a. -~ cu ....., cu E C'a ~
C'a a.
:c: C'a 00
() ·-C) 0 -0 cu
.c: ~
r- --- --- --· -· · ------·· ··---·-·-· --- ·--1. OOE+02- - · -- .. ,_,, ___ , __ _ - ----·-· -- ···----- - 120
I I I ~ I·· '"i- :-~---'F ·.-~ -;--~· :-.i · 1~-- --- --· ----- - - -·-·-------· --·-·
.. ~~ .. '~ij-f ++-f-! 100
I
I
1+02
1.00E+OO 'f·I. r - 80
1.ooE-01 1.ooE+~ T / .00~00Lo2 I:
\ ., ------------------i I i I I I I
!
I
···· .... · · · 1.00E-01 .. t · · ·'i ::~ .... · · · · ... I
1.00E-0.f /f x-t·f
I
i- -<D - - G .... . ~ 1 4S' -~ -:t -& .OOE-03
'I \ I
\
'.I:
\
\ -• 1r'
60
40
.,_ 20
1 OOE-04 - · - · j 0
Figure A1.41 Shear Stress (Pa) G", G', Complex Viscosity and Phase Angle Rheogram for Methyl Cellulose (Methocel A4C) 2.5%w/w Measured at 0.05 Hz and a Stress Range of 0.00 -100 Pa
-"' cu cu ~
C) cu c -cu -C) c: <( cu
"' C'a .c: c..
- ·• - Elastic Modulus
---• -- Viscous Modulus
-...-- Complex Viscos ity
- ~- Phase Angle

-ro a. -I-Q) ..... Q)
E ro I-ro a.
::i: ro '° 0 ·-O>
0 -0 Q) J: a=:
1.00E+03 ··-···· .. -·--·--·--·-- 100
~~- - ·rd1111 1.00E+o2
90
80
70
H-_,1--! ·I- ·t. i l; : ""i
1.00E+01 f ttff t1ff~L~. _._~ !- ' !-i. ~
60
50
40
l
! 30
- - · - -
1.00E+01 1 . 00E+O~ 1 .ooE~
1 OOE-01 .. . ·· · .... ---····-·
Figure A1.42 Shear Stress (Pa) G", G' , Complex Viscosity and Phase Angle Rheogram for Methyl Cellulose (Methocel A4C) 5.0%w/w Measured at 0.05 Hz and a Stress Range of 0.00 -100 Pa
10
0
"
-"' Q) .. --· - -·---··- ..
Q) - ·• - Elast ic Modulus
0, _. __ Viscous Modulus
Q) --A- Complex Viscosity
Cl - ~- Phase Angle -Q) -O> c ~ Q)
"' ro J: a.
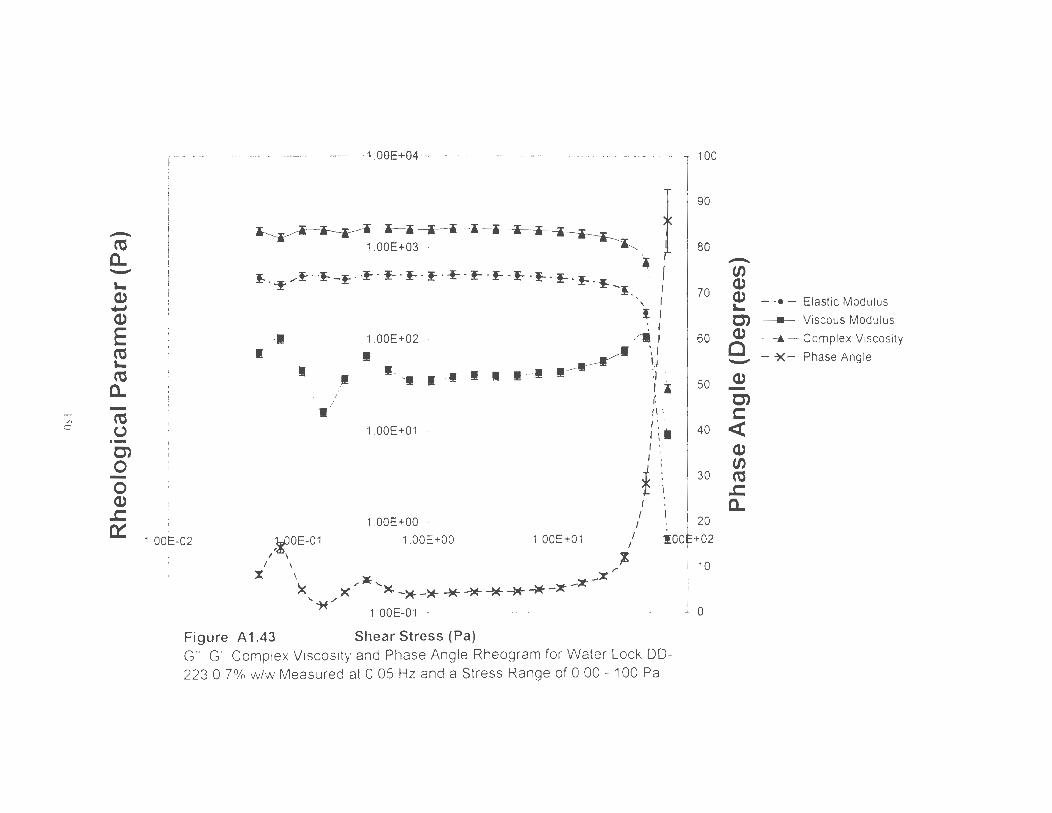
r--··--·· -- -·--·--·-··----·-·-·- -+OGE+94 -- - · · --·--- ---·--- -- -··-· --··---····· --·-· ___ . ., 100
I I f I 90
- ~~iiiiiiii ~ I 1.00E+03 ~ .... :-- . 80
- I -r I- . ·I--'&:... ·I-. I-- - !- - I- . ~ - I-- - f- . !- . !- . ,.._ . lL I 'Vi' .... %-,~/ x :r- :r--~- Q,)
Q,) 1 J; · , 70
Q.)._ ·-:_ -~ - - El~;ti~ M~dulus ~ I ! Q,) i C') --a-- Viscous Modulus
E i' / I \ 1.00E+02 - ~ \ 60 ~ _ ,,,,_Complex Viscosity
~ 1
I \ , I--,_ ~ \i \ _ - ~-Phase Angle
&. II \ ! ........... 1 -·· I · -l ·-1 - .-- I - -- 1\~ 50 ,.s? I (, C')
- ! l!' fl c: ~ .~ I 1.00E+01 . : ; ~ 40 <
C> 1: Q,) I I I CJ)
..Q ! 1: " 30 ~ o I f 1 ~ Q,) I I ' ~ ~ I I I I 1.00E+OO . , . 20
0:: 1.00E-02 .:fOE-01 1.00E+OO 1.00E+01 ,' '1:00 +02
! / \ ,,.'f. I 10 ! X \ ,...X-, -~-X I' ~ x ~~~*****~
''"*/ 1 1 OOE-01 -· -- - · · J 0
Figure A1.43 Shear Stress (Pa) G", G' , Complex Viscosity and Phase Angle Rheogram for Water Lock DD-223 0 7% w/w Measured at 0 05 Hz and a Stress Range of 0.00 - 100 Pa

-ro a.. -'-Cl> ....... Cl> E ro '-ro a.. -- ro '-" - (.) ·-O') 0 -0 Cl>
.r:. ~
,. .... ··- -- -···--···---------·---·-··1cOOE+04··- --· -·- - -- ·· - · - - ·· - -· ··-·-····-····- -·--·-··-··· ·-· ·-··---
\ i. 1.00E+03 · t~. - ····-1'1
I ·• \ !' I ~ I I '!-. I ·I-·J.·-:t-"!- ":f ":f · !-·!-·+·!-·f-·-I-.. '/
1 \ l ' '·1
I \ \ I ;J/ I \ I_ ~ 1.00E+02 · '\·', \
I \ .J 1' I '\ i I\~~~ ,'._ '"' I I 'r , I , _., I ~ \
I I ' I I
, , I 1- .00E+01 - ---· - - _ 1 _ I I
I ~ I I I I I I I I
x x ',x_M,~-~-~-~'~-~-~-~-~-~, ~~~~~'HtOE+~oo--~~~~-
- J: -
\
!
100
90
80
. 70
60
50
40
30
20
10
0
1.00E-02 1.00E-01 1.00E+OO 1.00E+01 1.00E+02
Figure A 1.44 Shear Stress (Pa) G", G' , Complex Viscosity and Phase Angle Rheogram for Water Lock DD-223 1.3% w/w Measured at 0.05 Hz and a Stress Range of 0.00 - 100 Pa
-"' Cl> -- -Cl> - ·• - Elast ic Modulus '- --11- Viscous Modulus O') Cl> -Ir- Complex Viscosity
c - ~- Phase Angle -Cl> -O') c: < Cl>
"' ro .r:. a..

-V•
'"
-ro a.. -a..
Cl> +J Cl> E ra a.. ro a.. -ro (.) ·-0') 0 -0 Cl>
.I::. 0:::
---...
- ·· · - ·- --1:00E+04 ·-·····--· ···· -- ·- · ·- --·--· ·- - . - . -·- 80
~i i' i i i i i i ~ ! i . I
1 OOE+03 J . I
~-~-~-~-~ - ~ - ~ -~-~ -~-~-~-~-~-~ - I . ! .
i '! I . I
l ~ '11
\ , I I ~\
I 1.00E+02 ~ 1': , \ r 11 \ I •.
\ !! ~'...-\ I \
\ ~ l--+-f--! " u d r \ I I \ I I I
~ \ 1.00E+01 / I % I ,.-
)C ~~")( /
" ~-X- * * * * *-X
~~~~-':Hm&+-00~~-·
70
60 -
"' 50
Cl> - ·• - Elastic Modulus
~ -11- Viscous Modulus
C') --A-- Complex Viscosity
Cl> - ~- Phase Angle
0 40 -
30
Cl> -C') t: <t
20 Cl>
"' ra .I::.
10 a..
0
-10
1 OOE-02 1 OOE-01 1.00E+OO 1.00E+01 1.00E+02 1 OOE+03
Figure A1 .46 Shear Stress (Pa) G", G' , Complex Viscosity and Phase Angle Rheogram for Water Lock DD-223 3 0% w/w Measured at 0.05 Hz and a Stress Range of 0 00 - 100 Pa

-ro a. -'-Q)
+-' Q)
E ro '-ro a. -- ro
'-" u w ·-C') 0 -0 Q)
.!: a::
1.00E-02
- -- - - 1 :OOE+04 - ·· - · · --
J\~--+--i·- i---i--¥--I -+--1---1-I-~ ,t . 1.0.QE+03 · I
/ . , . . f- · -f- · ·!- . !-- · f- -f- . f-. f- . !- . !- . f- -!- . f · 'J; I : f '.I
~ - ~ ~ r 1·
I 1i
I
"'' J
n J I \ I ·'
\ / I 100E~ .I · I
\ / - ~ ~1--..'t- ,..,-1 / I , __ , ___ ~ '-"--~--~ ,'
I I
~ ; I I ~ I \ 1.00E+01 · ~ I \ I I l I I l I
~ I \ ~'J. •l \ I I I 'I-:& ..x"'
..x x_~_x' ':s.-~-..*-~
1. f'\().C..L{)f\
1.00E-01 1.00E+OO 1.00E+01 1.00E+02
Figure A1.47 Shear Stress (Pa) G", G' , Complex Viscosity and Phase Angle Rheogram for Water Lock 00-223 5.0% w/w Measured at 0.05 Hz and a Stress Range of 0 .00 - 100 Pa
50
45
40
35
' 30
25
20
15
10
5
0
1.00E+03
--...
-(/) Q) Q) '-C')
- ·• - Elastic Modulus Q)
Cl __._Viscous Modulus -Q) ---• -- Complex Viscosity
- - -X- Phase Angle C') c: <( Q) (/) ro
.!: a.

-C'l:S a. -"-Cl) .., Cl)
E C'l:S "-C'l:S a. -- C'l:S V> (.) A ·-C) 0 -0 Cl) J: 0:::
I
i i
i ! I I
--- ·-· -···--····-
!-I
I I I i i
··· ··--··---- -·-·---- i -:OGE+04- ·-- ·- ··- 100
~ i11~-j-i-*- i _ A 1 f\t-n:+if'J. I . -:_ - ~~. 80
·. • 'I
:t- . ~ ~. I-.~ -:f-. ~. I- " I- . I- . I- . I-. I- . ~' .\ 'X ll. ·,
' I 'r . ,' .. '·
\.~. 1:00E+02 · ·_::· ··· ·· >-.. ·· '\ \ ·~~ I ·,. '•. \ \ I :t; ··... I
·1 I \ I\ t .• \ ~\ --. .. -·r · 1.00E+01-· - · · · ··· - - - - / ··· · ·· - - · ,--- -- -
\ I J; ' ~-x 'f. X/ I / ,,., ..... ' .... -X'
I /"' ~ ..... ,... '->E' -:. -:. _,..,
. 60
40
20
\
1 00~ 0; -- - · ,-- ···· \. .. 1-·· 1 :OOE+OO · ~--· ' I ,
1.00E-01 )( 1.00E+OO 1.00E+01 1~0E4-02
I i ··· i .OOE-01 -'· ·- -· ·· ·· ·
Figure A1 .48 Shear Stress (Pa) G", G' , Complex Viscosity and Phase Angle Rheogram for Water Lock G-400 0.75% w/w Measured at 0.05 Hz and a Stress Range of 0.00 - 100 Pa
-· -20
-ti) Cl) Cl) "C) Cl) 0 -Cl) -C) c: <t Cl) ti) C'l:S J: a.
.......
- ·• - Elast ic Modulus
-11-- Viscous Modulus
--a- Complex Viscosity
- ~- Phase Angle

-C'a a. -.... cu .... cu E C'a .... C'a a. -- C'a
V1 (.) '-" ·-C') 0 -0 cu
.c: ~
,--·-·· ·- ·-·--·····----- ··--·-·-·------··--1··GGE+G4 -- ·----· · - ·------------···-· · · I . ·-··-·-----····---~ 90
I I I I I 1-... -"' cu I i
I
.x.. I '-.. I .... . ..I-·~ ·J- .. :t- .. :f"!-··!-·!-·!-·!--:t-- '\ I 60 r :f. ·:f- "!-.·I, I
cu .... C') cu
I I I r
i I
• I \ '! I
'~
~-~ --- -- /~ .f:"~
1.00E+01 '
%-~, I / X , I
x I ' ,.4&, I ,...% , r ')e ~ -•-:.-::IE- -::IE- -::r-
'~"
. I
~
I I
I !
c 50 -
cu -40 C') c:
<i: 30 cu
"' ('a .c:
20 a.
10
· O
1.00E-02 1.00E-01
4-:00~~;:-~~~~~-J 1.00E+02 1.00E+OO 1 OOE+01
Figure A1.49 ShearStress(Pa) G", G' , Complex Viscosity and Phase Angle Rheogram for Water Lock G-400 1.5% w/w Measured at 0.05 Hz and a Stress Range of 0.00 - 100 Pa
--..,_
- ·• - Elastic Modulus
----- Viscous Modulus
-.-- Complex Viscos ity
- -X- Phase Angle

-ctS a. -I.. (1) .., (1)
E ctS I.. ctS a. --
VI ctS °' u ·-O')
0 -0 (1) .c 0:::
1.00E+04 ·- -· --·-·-----· 100
1.00E+03 i1 80
60
1.00E+02·· --·--- -- ·- -· ·- ·· 40
!
-tn (1) (1) I.. . - -- ····-·- --·-- -O') - ·• - Elastic Modulus
(1) --- Viscous Modulus
Cl --A-- Complex Viscosity
- - ~- Phase Angle (1) . . -O') c: <(
20 (1)
1 OOE+01
1.00E+OO
1.00E+OO
I
)(X I \ I I I X><><><><><XX
1 OOE+01
i
!
1.00E+02
Figure A1.50 Shear Stress (Pa)
0
-20
1.00E+03
G", G', Complex Viscos ity and Phase Angle Rheogram for Water Lock G-400 3 0% wlw Measured at 0.05 Hz and a Stress Range of 0.00 - 100 Pa
tn ctS .c a.
~

-LI\ --.J
1.00E+04 ,-- .. ·-- _. ··-· ---- -------- -----· ··-· ------ ·----------·-·-·-----------·-------··----· ··----·- ----- ... . ··-1 80
~ ~ f 170
ro ~I e:. 1.00E+03 j, ~ -.... . .. 60 (/)
. I Q) ! H-H-H-H-HH! Cl.I E 1., l ... - . -. --I SO C) - ·• - Elastic Modulus
~ f I ~ Cl.I - · -- ViSC0"5 Modol"5
~ 1 OOE+02 ~ i \ _ 40 £ ~__._. Complex Viscosity fl-!1!-!1!· , ~- Phase Angle
~ . Cl.I 0 £ I -·- I 30 Cl m ' c § r ~ Q) I - 20 Cl.I
..C 1.00E +01 I (/) c::: i!-xi~ I ~
1.00E+OO
1.00E+OO 1.00E+01
Figure A 1.51 Shear Stress (Pa)
:X-%% I · 10 I I Q. I I I I
)Oeeo~
1.00E+02
+ 0
-10
1.00E+03
G", G', Complex Viscosity and Phase Angle Rheogram for Water Lock G-400 5.0% wlw Measured at 0.05 Hz and a Stress Range of 0.00 - 100 Pa
~

..-..... cu
Q_ ---"--Q)
-+-' Q)
E cu "--cu
Q_
-- cu Vl
0 00
Q) 0 -0 Q)
....c 0:::
·= ~ ~----------------·
r
--- · · -··· ·- -·---·---· -.. -------··---.. --• "0E+"2'
I I
I i I
1 . 00~-02
i I !
1 .OOE-01
1.00E-02
t
'1/
'I: .. 'A
120
. 100
80
1.00E+02
60
\ 40
'I
~ 20
-- -· --· ------ -- ·-···------·-·-----·- -- - 1--:00E-W- ------ ----·- -··------- -· ------- --·-- -~ 0
Figure A1.52 Shear Stress (Pa) G", G', Complex Viscosity and Phase Angle Rheogram for Guar Gum 1.0% w/w Measured at 0.05 Hz and a Stress Range of 0.00 - 100 Pa
..-..... (/) Q) - --- ----- - ----· - -Q) - ·• - Elastic Modulus
"-- --11- Viscous Modulus 2' --A- Complex Viscosity
O - ~- Phase -~ngle ---Q)
Q) c <{ Q) (/)
cu ....c Q_

..--._
cu ()_ -I-Q)
........ Q)
E cu I-
cu ()_
cu 0 -
V> 0) -0
0 0 Q) ..c n::
,-I I i I I
i I
'cf"~ I I
[
I i
···--- --·-·
---1-:-00E+G2- -;····- ----· -··- - ·-··---·-----····--·- 120
--'1-~-00:+0~I~ - - rn- - -- - - - _> 100
~;:-:!.-:-:. ::-::: :.-:~:-:---·--------N ~ +r J J ~ · ~ .. r .. l "r , I I I 1 80
-~~~~~;~-- _,.o~o~oF;~, ~lt~o~l~\ ----1~;-t+c - . T ,,:t I ... \
·-- - --· -· --- -·-·· -1-:0ElE-Ol l- ··· - - -· - - -
1 ~00E-02
·-- ·----·-----·-·-· ·----·---1-. GOE-03 -
60
·,: --~'>~- I 40
\. \ • •
\ .. - '· ·- -~--··-- -- . --
~· · ·.I I 20 \
i:
0
Figure A1.53 Shear Stress (Pa)
G", G', Complex Viscosity and Phase Angle Rheogram for Guar Gum 1.5% w/w Measured at 0.05 Hz and a Stress Range of 0.00 - 100 Pa
..-.. Cf) Q) Q) 1-0) Q)
0 -Q)
0) c <( Q) C/) cu ..c ()_
- ·• - Elastic Modulus
-11- Viscous Modulus
--.tr-- Complex Viscosity
- ~- Phase Angle

,,.-..... cu
CL "--'
'-Q.) +-' Q.)
E cu '-cu
CL -cu () -
°' 0) 0
0 0 Q.) ..c 0:::
r---·-·- -··- i ·i --i i i i fOGj+Oj--i · -- .--.--i--i---~~ 120
I I \ l - l - t--t--1-1--1 ' ' ' ~ 100 i t . -f- . ·!- . !- - -f- -!- - f- - f- - f- . f- - f- - !- -!- -!- -~ . •!- . ~ ; 1.00E+01 'J,. . ~ I · I . !
·.I \ 80
f' \ r-t-tolg_t+-rrr,4+-f-t"r~r,l ~! 100Lsoo, 1 OOE-02
I
40
1.00E-01
20
! i I ! I --- ---- ·- ·-··-- -------·------·----·-:\-:-OQE-02- - - -- ------·· ·-- --- .. -· .. --- ·- -·--- --- ' 0
Figure A1.54 Shear Stress (Pa) G", G' . Complex Viscosity and Phase Angle Rheogram for Guar Gum 1. 75% wlw Measured at 0.05 Hz and a Stress Range of 0 00 - 100 Pa
.....-.. en Q.) Q.) '-0) Q.)
0 "--'
Q.)
0) c ~ Q.) en cu ..c Cl.
~
- -• - Elast ic Modulus
---a- Viscous Modulus
--..- Complex Viscosity
- ~- Phase Angle

,....-..... cu
0... -I..-Cl)
......... Cl)
E cu I..-
cu 0...
cu u -
°' ·-0) 0 0 Cl)
..c a:
I
I i
····- · ·--· - · l .OOE+03 - · 100
I I 90
/1.1 80
i i i i i i !,00-~+o} : i i · i - i i .. . -i -- i-~- t I I 70
~,1 ,
h+N 1- t t1 t: t:.t 1--1- tlt-.~ \,so f +f-f cf-f~o~offt-t-++-t-I; .. 1\"\1 so
! I I
40
. 30
1.00r-02 1.00E-01
1.00E+OO
1.00E+OO 1.00E+01 1 . CIO~~
! I I I I I
I ·-·-.. ·--- ·-· 1:00E-01 ---·
Figure A1.55 Shear Stress (Pa) G", G', Complex Viscosity and Phase Angle Rheogram for Guar Gum 2.0% wlw Measured at 0.05 Hz and a Stress Range of 0.00 - 100 Pa
10
0
,....-..... C/) Cl) Q) 1..-0) Q)
0 -Cl)
0) c <( Q) C/) cu ..c 0...
- ·• - Elastic Modulus
- • - Viscous Modulus
--A- Complex Viscosity
- -X- Phase Angle

...--.. cu
0... -..__...
I-Q) ......, Q)
E cu I-
cu 0...
cu -°' r.J u
CJ) 0 0 Q) _c
0::
f". - - - .. -· -· -- -- ··-·~OOE+03--- -· - · · --- --- - ---·-· - - · --- -- 90 1 I
I 1· ·-
I I I
I ! i
I I r
1--1 00~-02
I
I I
l. _ -·
. 80
l l -1 - -1 l · -1 l l ! l --1 - l --1----1 --1--1 --- 1--. --1 \ I 70
·----·--·--·---·---- --- ---- - -1--00802- -1--·- - ------· ·-·. - -- - - - - ·- · ··-- -·· --11-. ...--.. I ~
l - 1- I 1- 1- 1-1--rl-I I l-+- l--9-!l!-t-11 / \ 60 Q)
I- - !- -I- - -f-. -!-- . -f-. -f- . ~. -f- . I- -I- -I- . -f- -I- -1- . ·f. ~.. \\ ~ !' CJ)
1' Q)
f-t-f-t-Ff0-1°~t-t-t-t-t-t-t-t-fl 1t :: j
1.00E-01
1 ~00800 "
1.00E+OO
·-- - ---·-· -· ·-·--1-:-00E-O 1--L __ _
1.00E+01
Q)
30 ~ _c 0...
1 . ~~1+2£ 10
-·--·- -- . ·----··- --· ·- -.. ~ 0
Figure A1.56 Shear Stress (Pa) G", G' , Complex Viscosity and Phase Angle Rheogram for Guar Gum 3.0% w/w Measured at 0.05 Hz and a Stress Range of 0.00 - 100 Pa
'
- ·• - Elast ic Modulus
--a- Viscous Modu lus
---..-- Complex Viscos ity
- ~ - Phase Angle

...-,,
cu 0... .........., I.... (1) ~
(1)
E cu I....
cu 0...
cu °' w u
Ol 0 0
I (1) ..c ! O'.'. I
··----·- ·--·-1-cOOE+&'l---··--· -----·--·-- -----·----·-·---
_ ~~GE+OQ--- ------
. -- 1-:00E-03
~
1.00E-04
I I I
,.z . ~ ·I- ·I- Ji _. ·I
,t. I \ I I 'i ' -· .. -- -- - . -... -l------- - ..
~*~
- 120
100
10+03 80
60
40
20
0
· ···-·'----- =1 -,-QQE-05---· --····-· - --··-·· ·· --- ·····-- -- · -··--········--- ········ ···-····· - ·- · -- - ·-· -·····-· · · · -- ··· ·· .J -20
Figure A1.57 Shear Stress (Pa)
...-,, Cf)
<l.> <l.> I....
Ol <l.> 0 --<l.> Ol c <(
<l.> Cf)
cu ..c 0...
G" , G ', Complex V1scos1ty and Phase Angle Rheogram for Hydroxypropyl Methyl Cellulose 1 0% w/w Measured
at O 05 Hz and a Stress Range of 0 00 - 100 Pa
~
·--- ·-. - ·• - Elastic Modulus
--- Viscous Modulus
-t-- Complex Viscosity
- ~- Phase Angle
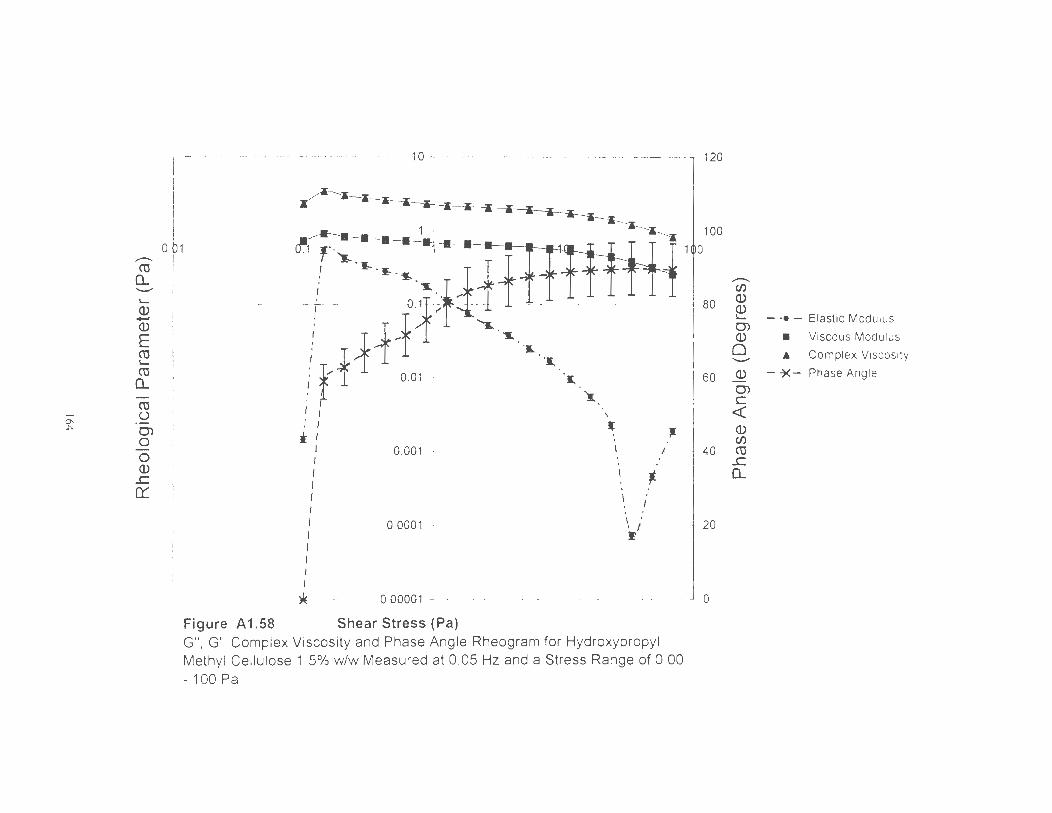
-°' A
,---. cu
0.... ........ '-Cl.> ....... Cl.> E C'O '-cu
0....
cu (.)
c::n 0 0 Q) ..c n::::
,--·· ---- ---1-0-- - ..... . ·---- ··-···-- 120
I
I
+ ~ ~---..---.. ~--·. •1•
·1 r·~-~- r T 1 I I-.$ -
1----·
1 i 11 ' .b . .i. -~ . _- -· -- --- " ~rr-=-·-1- - -± ------~f, ---..,'"',."' I
I
I I ' i. . _:'_t,_f 1 0.01 "'·I.
I ' : . I I : I
t I -0-091 -: ___ L - .. I I I I I
- .. I I I I I I
0.0001 .
--'*-· ··-·. . ·0:00001 · - ..
Figure A 1.58 Shear Stress (Pa)
.L
I ' ·- -J ~
;.
,: ·I ..
G", G', Complex Viscosity and Phase Angle Rheogram for Hydroxypropyl Methyl Cellulose 1.5% w/w Measured at 0.05 Hz and a Stress Range of 0.00 - 100 Pa
100
0
80
60
40
. 20
0
,---. Cf)
Cl.>
~ c::n Q)
0 ........ Q)
c::n c <( Q) (/)
cu ..c 0....
-
- ·• - Elastic Modu lus
-a-- Viscous Mod ulus
- A Complex Viscosity
- -X- Phase Angle

1- -- ----------- ---------··--··-400-....,---- --·----------·-- ·---· ------··--·-------··
............ cu
o... I ::- I Cl) i
...... I Cl> I E o 01 cu ! I....
cu 0...
- cu ~ u
CJ) 0 0 Cl)
..c er:
___ - 10--1 - - i kl_ l_ ~ i · i i ~ ~' :l-. ~
":l-.~ l 0.1 r rYt-'~ f -J'r 'I 1 I- 1-_ 1-
~
0 ·1-. 1 ..... I..
[~--:-~
10
·1.. ·1..
. '.l
\ I
0.01 l
!
120
100
80
0
60
. 40
20
- -···· -·-·· ... -·--·--·- . ·-----·-------·-··· -0-001-- ····----- -· --···- ---·-······· -· ·····--·-··-·- ····· -·-- - .J 0 Figure A1.59 Shear Stress (Pa) G", G' , Complex Viscosity and Phase Angle Rheogram for Hydroxypropyl Methyl Cellulose 2.0% w/w Measured at 0.05 Hz and a Stress Range of 0.00 - 100 Pa
....-... Cf) Cl)
~ CJ) Cl)
0 ...._... Cl)
CJ) c <{ Cl) Cf) cu ..c 0...
- ·• - Elastic Modulus
--a- Viscous Modulus
--A- Complex Viscosity
- ~- Phase Angle

...--.. ro
0... ..._ I-
Q) +..J
Q)
E ro I-
ro 0... -ro (.)
°' ·-°' Ql
0 0 Q) ..c n:::
1-····· ---- --··· · -·-- ··· ·- ·-· ·- ··· - -··--1-,90E+&2-- .. - ------ -· -----.. ··------- -----· ----·--···-- -· - ·-· - 120
I I I I
I
! I I
1 oor--02
A-:X 'i: 'i: • • i-i-i i i i
- 1.00E+-01 - ···· -··- - ·· --- --- ------
~~' '' ''' ''' ! f-
Hf ff ff ff ff ff !- - ~-!- -~-~-~-!--f-f-·f--~ ·f.·:t- .•
.r ·:t 1 OOE+OO · · ·· · - · ~-1,-·--·
1.00E-01 1.00E+OO 1.00E+01 '! 1.00E+02
!
!
-· 1 -. 00E-Q~ ·-·- --·- - ____ \ _______ --- .
· · ···· ··--· ···---··----·- ----1--: 99E-8-2 - ···
Figure A1.60 Shear Stress (Pa)
100
80
60
1 00~+03
40
20
0
G", G'. Complex Viscosity and Phase Angle Rheogram for Hydroxypropyl Methyl Cellulose 3.0% w/w Measured at 0.05 Hz and a Stress Range of 0.00 - 100 Pa
...--.. CJ) Q) Q) 1-
Ql Q)
0 .._ Q)
Ql c <{ Q) CJ) ro ..c 0...
- ·• - Elast ic Modulus
- a-- Viscous Modulus
-A-- Complex Viscosit y
- ~- Phase Angle

-
-cu o._ --~ Q)
........ Q)
E cu ~
cu o._ -cu -
°' .S2 -.J 0)
0 0 Q)
.s:::. er
1 OOE+03 - ----
1 OOE+02
1.00E+o1
1.00E+OO
I I
'·i
iii · ili ·-ili-~--trili iii ·ili·- ili ili-t -ili~
lf'·f-·!- ·f-.r .-. I/ r r· !-J "!-·~.
!- . !- ·!-. !- -!~:!'; ' i "!. J
I i I . I \ I ! I I
)(- * ** -X-~
100
90
80
70
60
50
40
30
20
10
0
-10
1.00E+OO 1.00E+01 1.00E+02 1.00E+03 Figure A1.61 Shear Stress (Pa) G", G', Complex Viscosity and Phase Angle Rheogram for Hydroxypropyl Methyl Cellulose 5.0% w/w Measured at 0.05 Hz and a Stress Range of 0 00 - 100 Pa
-C/) Q) Q) - ·• - Elastic Modulus ~
0) ----- Viscous Modulus Cl)
--A-- Complex Viscos ity 0 ..._ - ~- Phase Angle
Q) ... . ·-· .
0) c <( Q) C/)
cu .s:::. o._

~-
cu CL ~
'-2 Q)
E cu '-cu
CL
°' cu
CXl .S:! OJ 0 0 Q)
_c n:::
10r~-------- 1.00E-01
·- ----1c00f-+00----
1 ook+oo
r I I i I
._~ rJ,{,f-t=f 1f-f ++i 1.00E+01
120
1 ook+o2
100
80
I I i I I
lJ'~-ili a a : _ _
1
____ 1 rn'-" . a a iii 1----i! . a iii !:- .. -~-- -- iii iii !- , __ , _ - i . i
. !- l --!l!----1!-- I
60
..-.. (/) Q) Q) '-OJ Q)
0 ·~
Q)
OJ c I
I I
. !- 1- t +-t -. 1---1 X I --1--· 1- 1
- ~ I \ i..GOE-03- . _ I
40 <( Q)
I
!
Figure A1 .62
!
1-
~
! '. -- .J oo'tt.-04
I ' X !- ..
1 OOE-05 ··
Shear Stress (Pa)
. - I T
I I I I I :e:- I- . . ~ . + . ;I- . ·I- . ·I- . ·!- . ·!- . ·!
- -- . ----- -· -·-·· T ·--·--·-·. ·-- --·-- --- ...
\
~--* -x- -x- -x- -)(
G". G'. Complex V1scos1ty and Phase Angle Rheogram for Pectin 1 0% w/w Measured at 0 05 Hz and a Stress Range of 0 CO . 100 Pa
(/)
cu _c CL
20
0
-20
-·~
- ·• - Elastic Modulus
--• - Viscous Modulus
-- A ---- Complex Viscosity
- ~ - Phase Angle

°' -0
,--.
cu Q_
'-QJ
QJ
E cu '-cu
Q_
cu u Ol 0 0 QJ .c er:
---·---··---------·-- - ----------1cOOE-+tH-r-·-----·---------·--- ----··- ····-------, 120
I 1 00~-02
i i
~i 100
r ~r:~~, \ ,If '~f '-t-t-t-t ~t~t-f-f-t-r .. ,, I , ,I 1_ I 80
. { I "'
I
'. / ~--' I 1.00E-01 "i-- ---i --- i -· _ _ _ _ i i i . i - - 1 -- i · ·-- -1
/ ~'-------/ \ !I!--_.__ -l' - ~--t--1-1 ' ' 1-t
11 J; 1 OOE-02
\
60
(/) (]) (]) '-OJ (])
0
QJ
OJ c
<t: (]) (/)
cu .c
f-f-f'f • 40 Q_
1 OOE-~ -
\ :t" .. J; ......
~ · · -!- ·. f- . · f- · · !- · · !- · · !- · ·!- .. I I 20
·· 1 OOE-04 - - · -· I 0
Figure A1.63 Shear Stress (Pa) G" . G' . Complex V1scos1ty and Phase Angle Rheogram ror Pectin 2 0% w/w Measured at O 05 Hz and a Stre"s Range or 0 00.
100 Pa
- -• - Elastic Modulus
-II- Viscous Modulus
______.__ Complex Viscosity
- ~ - Phase Angle
·----.

co 10t02 Q... ~
'-
2 Q) I E co '-co
Q...
co -.J u c OJ
0 0 Q)
J:: 0:::
····--·-··-·-·- · - · . -- 1-00E+02-- -···- .... ··- .. ·······-·. ---·· . -- . --··· --· .. -- ···-· ···-··-·- ····- -· , 120
ii- ii ii ii ~ - ·-·--- ... --·---- ----~--"1-,00E+0-'1---------------------·-------·--·-··--- --·-·
\ ._ . -I- · <IE- · · ._ · · ._ .• JE. • I ... ·~
\'' .1'JoE 1.00E-01 ~ .,
t~:I;) . ·,
I \ I .
I Jl. I
I 1 OOE-02
,f t-t-r-t-rx 1 OOE-03
1 OOE-04 ·
· - - - -- ---- · -·-- -- -·- -- ·-· +OOE-05 - ·- --·
Figure A 1.64 Shear Stress (Pa)
\.
I.
-t-t-tlJ-t-t-t-t * • ZI 00
"&.
----· .........
I_
\
• I
\
- •.. -r-··~·····I
\ I
••
G". G' . Complex Viscos ity and Phase Angle Rheogram for Pectin 4 0% w/W Measured at 0.05 Hz and a Stress Range of O 00 .
100 Pa
100
+J(f -Cl) Q) Q) '-CJ) Q)
0
60 ~ CJ) c <t Q) Cl)
co J::
40 Q...
20
0
- -• - Elast ic Modulus
--a- Viscous Modulus
---A- Complex V1 scos1ty
- ~ - Phase Angle

-.J
,.--.
i ! I
cu 1 OOE-02 0...
I-
Q)
03 E cu '-cu
0...
cu u OJ 0 0 QJ _c a:
1.00E+02 --; ··· - -- · - -- ------------ --- -- ·------ ---- .. -- 120
:&----------:&--~
_ . . - _ ~ 1,00E+01 · 100
' ±ff : :· :· ~-~~;,~~ri f-Wti.f -t=_~~ 00 ·m ~ 1 OOE-01 I;_ E O / ui
- . • QJ . ' I --------. QJ
t~' ~ &~ · 0 .
I \ I :t:,
I
/ 1 OOE-02 '\ ...
,f -.. ........ . -t' ...
f-Fl-Ff,t \
1·.00E-03 · - )I.--'-~--- ----
1 OOE-04 I \
I;
\.t 1.00E-05 -
Figure A1.65 Shear Stress (Pa) G", G' , Complex Viscosity and Phase Angle Rheogram for Pectin 5.0% wlw Measured at 0.05 Hz and a Stress Range of O 00 - 100 Pa
'
I
60 QJ
OJ c <( QJ Ul ro
_c
40 0...
20
0
- ·• - Elast ic Modulus
---- Viscous Modulus
- • -- Complex Viscosity
- ~ - Phase Angle

i cu 1 OOE-02
0... ~
'-
2 Q)
E cu '-cu
0...
cu --.! . ~ t-..J OJ
0 0 Q) .c: 0:::
-1 00~2- ----· -- ·- - · ---·- ---- --- - - ------·-· ··-- --- --- - -·· ---- --, 120
.--iii--Jr-ll~ 1 OOE+01 - -- - - -
' ",l; - 1&-;,_ f 1--:;:.·9- ..... - . -1--:-:-t ---:-.____ T T-- - --
1 ~
1 OOE~ fl r
-- I-- : - -- - r~-t·~- -- -4 00E-G2-··-
r f--f-1
..... '1.
.. - - -- --· - ---· -· -- -- - 1.00E-03 : ·
• - 1.00E-04 ·
1 OOE-05 --
Figure A1.66 Shear Stress (Pa)
..... --- : ... .- ----- ----· - ·---- ---- - --- - --
'- -- 'I
' - -..-----~ -
r
• \ ' '. j_
G' ', G' , Complex Viscosity and Phase Angle Rheogram for Pectin 6 .0% w/w Measured at 0 .05 Hz and a Stress Range of 0.00 - 100 Pa
'
100
Cf) Q) Q) '-Ol Q)
0
60 Q)
OJ c <( Q) Cf)
cu .c:
40 0...
20
0
- ·• - Elastic Modulus
_.._ Viscous Modulus
A - Complex V1scos1ty
- ~ - Phase Angle
,---,..,

Section III (
Appendix
173

Calibration Curves (
174

(
Guar Gum 1.5%Calibration Qirve Candida albicans
Q..iar Qm 20% Calibration Q.rve Cardda albicans
~ 3CXE+03 -~ _, 2CXE+03 ~ 4CXE+03 t
I f 1.CXE-+03 ~ - H
I ~ OOCE+al t------~---~--1
I 0 0.1 0.15 0.2 0.25
[ ______ "'.'"_or_bancy __ ~~nm y = 38rox . 4800
R' =0.95(1; _______ ...J
ATl.1.3) GuargWTI2.0%
--- - --1 Gartxlpol 971~20%Calibration One
Gardda albicans
~ 4.CXE-+03
~ 3.CXE+C8
~ _, 2CXE+C8
r 1.CXE+C8 t--~ OOCE+al +-------------
0 OC6
Abso1:alcy at 434 nm
ATl.1.5) Carbopol9712.0%
0.1 015 y = 2800x + a;.-07
R' =0.9900
Q..iar Qm 1.75"!.Cal ibration One Cardda albicans
1"~= 1 - /.~ . g 1.CXE-+03 . ~ u ~ O.OCE+al , . ---,
0 01 0.2 0.3 0.4
Absorbancy at 434 nm
ATl.1.2) Guargum 1.75%
y = B800x. 4807 R'=0.9178
Cartxlpol 971 ~ 0.5%Calibration One Canddl albicans
E 4.a:E+ffi ;;; E 3.a:E+ffi ---- T
"' ~ _, 2a:E+ffi +-----"' g 1.a:E+ffi r----=--u ~ OCIE+<Xl +---·-~-------~
o a.as 01 0.15 I y = 2Etffix • :£+C6 I Absorban::yat434 nm
R'=o.m1 I ATl.1.4) Carbopol 971 0.5%
Ca~ 971 ~ 4.0'/oCalibration Q.r.e Carddl alticans
I
I .E 4. CXE+<l3 I "' rv-c...r<> I ~ 3.\A.CTU) t-----
1 ~ _, 2CXE+C8 +-----j ~
0 1.CXE+<:B .j---;,.-..C...--
u ~ OCXE+CD
0 001 002 003
.Absorbancy at 434 nm
ATl.l.6}Carbopol 971 4.0%
I
004 OC6 003 1 y=SE+OOx+~7 I
R' =0.9348 !
Figures AT 1. 1. 1-1. 1.6, Calibration curves for Candida albicans in Carbopol 971 and Guar gum
175

(
Carrageenan RLV 3.0%Calibration Curve Candida albicans
JJt~] L ~ ---0 0.05 0.1 0.15 0.2
Absorbancy ;it 434 nm
ATl.1.7) Carrageenan RLV 3.0%
y = 2E+OOx • 7807 R' =0.!Jl97
Carra;ieenai RLV7.0%Calibratiro One Cardida albicans
~ 4.00E+OO ~ . ~ 300E+Q8 -· - - - _;1 l ~= ------~ ·~·"---== § OOOE+OO
:E o 0.1 02 y = ft:<b9x . 3E+till4 I I Abscrtiancy at 434 nm R' = 0.9133
L___ J ATl.1.8) Carrageenan RLV 7.0%
,-------!
_J
Carrageenan Wl1P5.0% Olibration One Cardida al bi cans
~ 4.CXB-08 ' ~ 3.CXB-08 ~ -- -
l ~:= t --~~-~ -;:; O.OCE+OO ~--...,---.-,------~
~ 0 02
L Absorba-lcy al 434 nm
0.4 0.6 0.8 y = 1E+<l9x - 5808
R' = 0 9976
AT I. I. I 0) Carrageenan VV7 IP 5.0%
!: e "' c: .. __.
"' 0 0 0 ~
Carrageenan RLV 5.0"!.Calibration Qnve
Candida albicans
4CXX:+OO l 3cn:+OO ~ 2.CXX:+OO - - - -
1 cn:+00 . - - - I 0 cn:-+m -~--r--- -- ----,
0 0.05 0.1
Absorbancy ;it 434 nm
0.15 0.2 o.25 I y = 1E+-09x - 48-07
R'=0743 j
AT I. 1.8) Carrageenan RL V 5.0%
E ;;;
~ 5...J ~ 0 e u
Carrageenan W71P 3.0%Calibration c:Urve Candida albicans
- _A__ _ --~-
:E I
~::L; 1.00E+OO -O.OOE+OO t------------
0 0.1 0.2 0.3 0.4
I I
Absorbancy at 434 rvn y = 38CSx . !B<l! R' =O 9972
ATl.1.9) Carrageenan VV71P 3.0%
Carrageena-i Wl1P7.0%0litrairo Qr.e Crdida albie<r6
'
------- -- --
-g -;;; 4.CXBOO l l ~= +:~----_-_ - -~ u O.OCE+OO +t=--~, ----~ ~ 0 0.2 0.4
I Absortalcy at 434 rvn
L ______ _
0.6 0.8 1 Y = 88rex - 48re
R' = 0.9949
AT 1.1.7) Carrageenan VV7 IP 7.0%
Figures AT 1.1. 7-1. 1. 12, Calibration curves for Candida al bi cans in Carrageenan RL V and Carrageenan VV71P
176

(
_J
WI.ff LOO< A 100 03"/o~t:raim ~ Crdda <D:a-6
~ 4 . OOE+-08 f-------· ·---- -- -·-- __ ~~= -~::~- -___ -_-_ O> .
g 1. 00E+-OB - ·- -- - ..
.2 0. OOE+OO ' ' ! I
l ::;:
0 0. 05 P..Boo. -6EJb115 Absatl"1cy a 434 nm R' = o 9974
----------------ATl.1.13) WaterLockA-1000.3%
Water Loci< A-100 0.7%Calibration Quve i \ E 4 CIE+ffi ~Candida albicans !I
~ 3.CIE+ffi ---
!, m£<B ~ I
I J ~== lJZ~--. I i o oa; 01 015 I
AbsO<bancy at 434 nm Y = 38-09x - 1808 I R' =0.9528 J ATl.1.15) Water Lock A-100 0.7%
------------, Wiier Lock ID-2231.0'/oOlliaatim Qrve
Olrdda alacars
,~~ H: --- 1 :;;OOBffi ' ' '
0 001 002
Absarbancy at 434 rm
003 00! y = 38-1()( - 78<E
R' =0.9971
AT 1.1.17) Water Lock DD-223 1.0%
!
Vletff l..aj( A-100 0 5% Cailt:raim Qr..e Ca"dtda albG:n;
_J
~ 4.0Cl8al T - -!ii 3.0Cl8al : -~ 2.00E+al j -O> ' g 1.00E+-08 1 -
--~ I u O.OOE+OO
~ 0 0.01 0.02 I
ocq =~- 1E~s I R'=o'52.1 I
ATl.1.14) WaterLockA-100 0.5%
Water Lock ID-223 0. 7"!.Qilibration Qx-.e
Qilllida albicans
E 4.CIB<B --;;; T
~ -g tcIBffi --·- - --· ··
~_.. ~=--~- -·---- ---· -· ~ OCIEtal -------~---~
0 oa; 01 015 y = 2Et<D< • a)lffi()
R'= O!Hl5
ATl.1.16) Water Lock DD-223 0.7%
_J
WJ.er Led< ffi223 1 3'/o~baiol 0.1\e Q:rdc13 atiars
~ 4.CIE+ffi --- ---- - - - - - - - -- -
~ 3.CIE+ffi ' ~- . - -~ 2CIE+ffi : - - --·· g' 1CIE+ffi ' - - - -§ O.OB<D ~----------~ o oa; fl.~ -~s j
R' =0 937 I I
AT 1. l.18) Water Lock DD-223 1.3%
Figures AT 1. 1. 13-1. 1.18, Calibration curves for Candida al bi cans in Water Lock A- I 00 and Water Lock DD-223
177

r Carrageenan W71P 711'/. Calibration Cl..-..e
StaphoJlococcus a...ws
~ 4.CXBOO I .!! 3.CXBOO ~_, 2.CXBOO ·- -- -o 1.CXBOO -- - - - -0 u O.CXB<D , ,
~ 0 02 0.4
Pbiortrn:y at 434 rm Olly= 18Mc-5E+d
R' =0.876
ATl.2.1) Carrageenan RL V 3.0%
Camigeenan RL V 7.0 % Calibration CuNe
Staphylococcus aureus
y = 2E+<& - 58<ll R'=0.9636
ATl.2.3) Carrageenan RLV 7.0%
Carrageenan W71 P 5.0% Calibration CuM!
Staphylococcus aureus
E
i"~~p=~~~-~ u O.CXB<D . , , , ,
~ 0 02 0.4 O.~ = ~ _ :JE+<Jil Abso<bancy lit 434 rm ~ = 0.9926 _ _J
ATl.2.5) Carrageenan W71P 5.0%
Carrageenan RLV S.O"!.calibration Qne
Sttpt¥ococcus aisws
~ 40CE+OO F ·- - 1 .!! 30CE+OO - / i ~_, 2.0CE+OO - - - -·. - i g 1.0CE+OO - - -1 u OCXB<D 1-----~--~-~---1i ~ 0 0.1 02
Pbiortrn:y at 434 rm
ATl.2.2) Carrageenan RLV 5.0%
Carageenan W71P 3.0"/.Calibration Cl..-..e Stapt¥ococas 3l.etS
I ~= r~-- ---IL! - : I_,~=:-- ----~7-- i u UOCE+OJ • • ------i
:E o 0.1 0.2 o.~ = 2E<lW- 7E.&s I .<tbsaobancy at 434 rm R' = 0.13644
AT 1.2.4) Carrageenan VV71 P 3. 0%
---··----- -ATl.2.6) Carrageenan VV71P 7.0%
Figures AT 1-2. 1-1.2.6, Calibration curves for Staphyloccoccus aureus in Carrageen an RL V and Carrageenan W71 P
178

\/\0ter Lod< CD-223 1.3"k Calit:raicn One St~OOJCOJS areus
·~ 2.CU:«ll 0 1.CU:«l! 0
1~=1 u O.CXBOO t-----~----,.-----,
::? 0 0.05
l'bocrtErcy at 434 rm
ATI .1 .7) Water Lock A-100 0.3%
\/\0ter Lod< A 100 0.7% Calibraicn One St~OOJCOJS areus
'E
11~ r= =:-~:~=~1 , u OOCE+OO , , . ':E 0 0.02 0.04 O.~= 7EQH;.l-4E+& 1
l'bsortla-lcy at 434 nm R' = o 7299
ATl.1.9) Water Lock A-100 0.7%
-' E
\/\0ter Lod< CD-223 1.0% Calitraial One St~OOJCOJS areus
I~:=@=---~--- -=-=T .. 2.00E+-08 ---- ..a.._
~ 1.008-08 --~----£ O.OCE+OO , , , ::? 0 002 0.04
Absortlalcyat434nm
0.00 0.00 0.1 y=5E+OOx-1E+al
R' =0.9689
ATl.1.11) Water Lock DD-223 1.0%
-'
Wlter Lod< ID-223 0 7% Ca11trctio:l One St~cx:x:x:x:us areus
; ~= --=-- - =-~-~ 4.CXB081 · -
~1 .CXB08 ~ g O.CXBOO '-------~----~ ~ 0 002 004 o~=~-~
l'bocrtErcy at 434 rm R' = 09229
AT 1.1.8) Water Lock A- I 00 0.5%
\/\0ter Lod< CD-223 1.0% Calitraim One St~cx:x:x:x:us areus
-'
l~:=t ~ 2.CXB-08 "' 0 1.CXB08 0
~--- J
u O.CXBOO '-------~------, ~ 0 002 0.04 0.00 0.00 0. 1
l'bocrtErcy at 434 rm y = 5E+OOx-18<B
R' =09889
ATl.1.10) Water Lock DD-223 0.7%
------ --Wier Lock CD-223 1.3"/o Calitraim One
St~areus
-'
l~:=r-~ 2.CXB08 -"' g 1.CXE+Oa t u O.CXBOO "------------.,.-----~ 0 0.05
l'bocrtErcy a 434 rm vq, 4E +OOx _ 2£-+8i 1 s I
R' =08251
ATl.l.12) Water Lock DD-223 1.3%
Figures ATl.2.7-1.2.12, Calibration curves for Staphylococcus aureus in Water Lock A- I 00 and Water Lock DD-223
179

Catx:.pd 971 f\F 05%Ciitration One ~a.re.JS
1~:=1~·-. ~ 2CXB<ll ~ 1.CXB<ll - -
§ O.CXE+OO ' , ' ~
0 0.02 004 y=~+~ ~a434rm R'=09m
ATl.2. 13) Carbopol 971 0.5%
Catx:.pd 9711'-F 4.0"k Ciitration Qne S~ooxxu; areus
__,
t~=~ - . -t ~= -------~--0 O.CXE+-00 , , ~ 0 0.1 0.2 0.3 0.4
ATl.2.15) Carbopol 971 4.0%
y = 4E+OOx • SE+-07
R' =0629
~ QaQm'""~.;;,,,-<W, l
h:§~~ ~ 1.ClBOO - 1---- - -
§ O.CXE+-00 ~ '
:. o 0.1 02 y=:it-03x·1~ I l'boolbn::y a 434 rm R' = o 5998
AT 1.2. 17) Guar gum 1.75%
~4CXB<Bk· . ~ . E 3CXB<B ~ ~ . "2CXB<B . ' ~tC!E<ll~ · §oCXB<D ~ 0 001 QCI2 003 ~
R' =Offill
ATI.2. 14) Carbopo1971 2.0"/o
__,
1~=1 --~-- --_--_ ~-.. 2.IX8al . - -· ~1.IX8al --- ·-g 0.CIE+<Xl !------------~ ~ 0 0.2 0.4 O.fi 08
y = SE+<Bx • 4805 l'tlsatlrcy a 434 rm R' = o. 94Z1
ATl.2.16) Guar gum 1.5%
-'
1 ~= t·-- ~=-~-~~-/- -; 2.IX8al -- - - -~ 1.CXBOl - - -g O.CIE+<Xl
~ o 01 02 o.3 G,4 1~-~ I l'tlsatlrcy al 434 rm R' = O 9978
ATl.2.18) Guar gum 2.0%
Figures AT 1.2. 13-1 .2. 18, Calibration curves for Staphyloccoccus aureus in Carbopol 971 and Guar gum
180

i I
I
Carrageenan W71P 3 0% Calibration Cur.e
Psadc:rrooas aeruganosa
I=L_ y !':> 1.CIE+<B u •
'::E O.CXE+<D .---- ,- -·---,-·
0 02 0.4 0.6 QB
AbscrtErcy a 434 rm y = 18ffix - 5E+06
R' = 0.6873
ATl.3 . 1) Carrageenan VV7 l P 3.0%
~ W71P 7.CJ'lo C.alit:ra1on CU\e Psan:m::nas aen.ginosa
~ 4.CXE+al J
-~ 2CIE+<B
Camigeenan W71 P 5 0% Caltbral1on CUl\e PseOOcrrooas aen.g1nosa
1:=1~ ; 2CIE+<B ~ g 1.CIE+<B
~ O.CIE+OO - -
064 O.ffi Ofl3 07 072 074 0.76 ;
ATl.3 .2) Carrageenan VV7JP 5.0%
y = 2800x . 1 E+-09 Ff =O 9334
l ~ 3.CIE+<B t J_ I::: .... ________ -_-_-_.-_-_-_
0 05 AbscrtErcy at 434 rm
15 y = 18mx - 1809
Ff =O 0029
0 OC6 01
Absorbalcy al 434 nm
015 02 y = 38-09x · 1 E+OB
R=08441
ATl.3 .3) Carrageenan VV7 l P 7.0%
Qwrcy:e a 1RV50'/o C.alitraim Q.ne
Psad:nrra5 a:n.gra;a
E
g 3CIE+<B • ./
12CIE+<B ~ e lCIE+<B u *
_J 4CIE+<B L
'::E Oa:Et<D ·-. ------
0 OC6 01
AbscrtErcy al 434 rm
ATl.3.5) Carrageenan RLV 5.0%
015 02 y = 2E+Wx - SE+-07
R'=O~ J
ATl.3.4) Carrageenan RL V 3.0%
Carrageenan RV 7.0% Calibration Cur\e Pseulorrooas aen.g1ooxi
~ 3.CIE+<B 1
I 2CIE+<B I -~ 1 ~ 1.CIE+<B j 0
'::E OCIE+<D "----
0 01
AbscrtErcy al 434 rm
T •
/ 02 03 04
y = I E+00x . 2E+08 F< = 08788
ATl.3 .6) Carrageen an RL V 7 .0°10
Figures A Tl .3.1-1 .3.6, Calibration curves for Pseudomonas aeruginosa in Carrageenan V\171 P and Carrageenan RL V
181

( Guar G.rn 1 5% Calibratioo One
Psa.dcrrcnas aen.girosa
0 02 04
Abscw1>a'lcy at 434 nm
06 08
y = 48<Ex - 2806 R' =O 5837
ATl.3.7) Guar gwn 1.5%
I i I
Guar G.rn 2.0% Calibratioo One Psa.dcrrcnas aen.girosa
__, 4.aE+al~ i:=~ § 1.aE+al --. - --- - -
~ QClB{l) ' I
0 01 02 03 04 05 I
L AbSO<balcy at 434 rm
-
Y = JE<rex • 28re R' = 06282
ATl.3.9) Guar gwn 2.0%
OJrt:Jq:d 971 N= 2.0% Calibration One Psa.dcrrcnas aen.girosa
...J 4.aE+al E ;;; 3aE+al ~ ~ 2.aE+al O>
~ 1.aE+al
- -· f ~ /- ~
• ~ OCIB<Xl +-~~~~~~~-~~~~~~
0 QCl2 004 AbSO<balcy at 434 rvn
ATl.3.11) Carbopol971 2.0"to
QCE 000 01 y = 48-09x - 2E+O 7
R' =O 7479
Guar G.rn 1. 75% Calibration One Pseu::b-ronas aerugirosa
E 4aE+al
~ 3aE+al
~ 2.aE+al O>
g HIE+OO
" ~ QCIB<Xl 0 01 02 03 04 05 06
Abscw1>a'lcy at 434 nm y = SE+OOx - 531773
R'=0997
ATl.3 .8) Guar gwn 1.75%
Ca1:q:d 971 N= 0.5% Calil:ra1on ili\e Psa.dan::.nas aau;Jrcsa
:i 2.CIE+al O>
~ 1CIE+al -u
i:=r-~ Oa:Etal ~~~~~~~~~~-
0 oa; 01 015 02 y = 1809ic + 1808
ff=0724
AT 1.3. I 0) Carbopol 971 0.5%
~ 971 N= 4 .0'/o Calibration One Pseu::b-ronas aerujrosa
"E 4.aE+al
~ 3aE+al .l!! :ii 2.aE+al O>
g 1aE+al 1i ~ OCIB<Xl !--~~~~~~~~~-
0 001 oaz om 004 oa; om AbSOfbalcy at 434 rvn
AT 1.3. 12) Carbopol 971 4.0%
y = 5E+09x • 1E+07
R' =O 9963
Figures AT 1.3. 7-1 .3. 12, Calibration curves for Pseudomonas aeruginosa in Guar gum and Carbopol 971
182
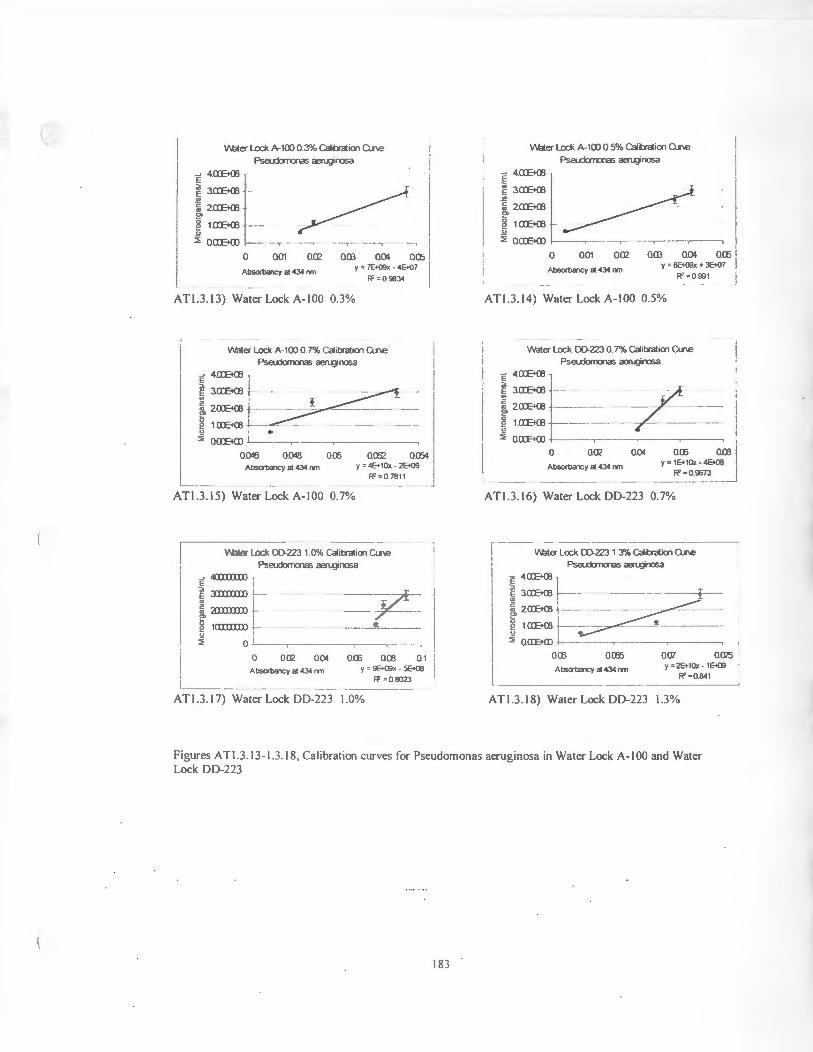
W31er Lock A-100 O 3% Calibratioo a.r.e Psadcrncnas aen.gorosa
-' 4CXB<ll E
~ 3.CXB<ll
~ 2CXB<ll !'!' § lCXB<ll ~ I ~ QCXEt<XJ - ' I
0 001 002 om 004 oa; I Absorbalc:y at 434 nm y = 7E+-09x . 4E+<l7 I
R'=O!Jl34
ATl.3.13) Water Lock A-100 0.3%
Water Lock A-100 0 7"k C3librat100 Cm.e Psel.domonas aerugirosa
-' 4.CXE+<ll l j 3CXE+<ll - f. ~ -
t ~=tc~-=-=--- = u •
~ O.lXE+OO
0.046 0.048 O.CE 0.052 0054 y =4E+10x -~ I
R'=07811 L Absort>a1cy at 434 nm
ATl.3 .15) Water- Lock A-100 0.7%
Water Lock 00-223 HJ% Calibratioo Cm.e Psel.domonas aerugirosa
-' 4ffiIXllXl ' E I
J
~ :mmXJO L
~ mmro ~ ~ 1amxro l Y i ~ ! ::;; 0 '
- - ! 0 004 OCE 0.00 0.1 I
y = !Brox . 58-08 R' =O OOZl
002
I __ AtJsort>;ricy at 434 nm
ATl.3 . 17) Water Lock DD-223 1.0%
VIia.er Lock A -100 O 5% Calit:raioo a.r.e Psadaronas aen.gorosa
"E 4.CXB<ll l ~ 3.CXB<ll
~ 2CXB<ll I~::~ ! 0 001 om 004 oa; I
y = SE<OOx • JE+07 002
Absort>aicy at 434 nm R' = 0 991
ATl.3.14) Water Lock A-100 0.5%
Water Lock 00.223 0. 7"k Calibratioo Cm.e Psel.domonas aerugirosa
1~=k . _L __ _ § laE+<ll - - - -/- ---· --·
~ O.lXE+OO .
0 ~ ~ 000 ~ 1 y = 1E<10x-4E+-06
Absortla-lcy at 434 nm R' = 0.9673 ! ----~·
ATl.3.16) Water Lock DD-223 0.7%
- -- - -- -- - - --------Vllater Lock ()).223 1. 3% Calibration Q.r.e
Pseudcrncr0s af3\.9rosa
~ 4CIE+Ol
E 3.0'.E+{8 -- - - -- - -
~ 2CIE+Ol - - -~ f laE+<ll --~--·---::;; OCIB(l) 1----- .,..--- --.,..-------,
OCE OCffi
AIJ5<Yta1cy al 434 nm
007 0075 y =2Et-1Cb< - 1800
R' =0 .841
ATl.3 .18) Water Lock DD-223 1.3%
Figures A Tl.3 . 13-1.3 .18, Calibration curves for Pseudomonas aeruginosa in Water Lock A- I 00 and Water Lock DD-223
183
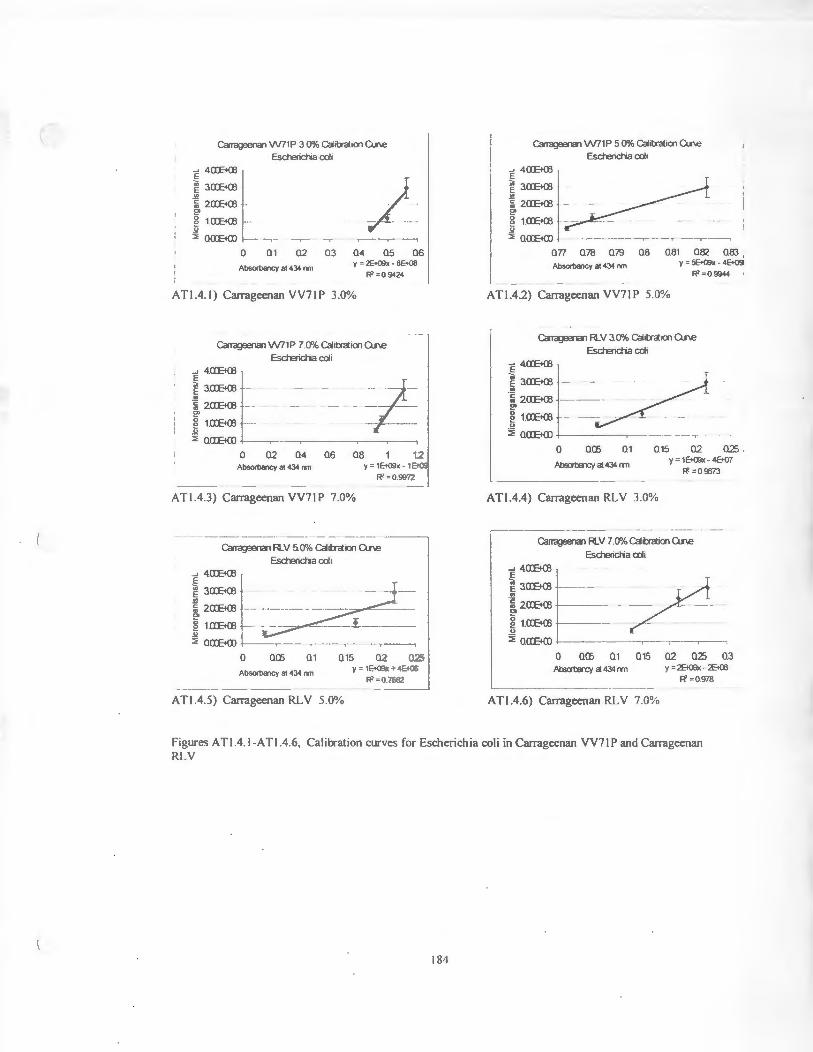
(
Carrageerai W71 P 3 0% Ca11b'aioo Cl.f\e Escherichia coli
) 03 04 05 06
Abso<t>alcy at 434 nm y = 2E+09x - 6E+08
R'=09424
ATl.4.1) Carrageenan VV71P 3.0%
~ W71P ?JJ'lo Ca111Tci100 Cl.f\e
~ 3.CIBCB
l 2CIBC8 --
g 1CIBC8 -~ .
Esctaicha coll
_/ -E
4
CIBCB L
~ QCXE+<ll -~---~-~-~
0 02 04 06 08 12 Absort>alcy at 434 nm y = 18-09x • 1
R' =O 99n
ATl.4.3) Carrageenan VV71P 7.0%
Carageena-1 RV 5.0% Ca11traioo Cu\e Eschericha col1
1:=1 ~r g tCIBCB I 0 ~ QCXE+<ll ~·--~--~-~
() 0(!) 01
Absorbancy al 434 rvn
015 02 y = 18-09x + 4E+06
R' = 0 7662
ATl.4.5) CarrageenanRLV 5.0%
Ca-rageeroo W71P 5 0'% Calitrciioo One Eschenchia coll
~ 3.CXBC8
~ 2CXBC8 - --g
4
CXBC8 ~ l::: -
--~ --. --- , --
077 078 079 Absort>alcy at 434 nm
QB 081 082 083 y = 5809x - 4800
R' =O 9944
AT 1.4-2) Carrageen an VV7 IP 5.0%
~ RV 3.CJ'lo Calib<tlC<l One Eschenchia coli
'E 4.CIBCB
1~= -=--/-~ ~ 1.CIBCB - - - . -0
~ QClE+{l) .+------~-() Q(l) Q1 015 02 Q25 .
Absorbircy at 434 rm y = 1 E+OOx - 4807
R' =O 9573
ATl.4.4) Carrageenan RLV 3.0%
Camgeena-i R.V 7.(J'/o Calibratioo OK\e
Eschencha coli
-' 4.aB<B l i 3.aB<B - -- - -
t:=t -:::;, QCIE+<D t= 1------~---~-~-~· - 0 . ~~~- -
I 1
0 aCii 01 015 L__ At:satal::y a 434 rm
AT 1.4.6) Carrageen an RL V 7 .0%
02 025 Q3 y = 28{)!,bc .. 2E+Ol
R' = 0978
Figures AT! .4.1-ATI .4.6, Calibration curves for Escherichia coli in Carrageenan VV71 P and Carrageenan RLV
184
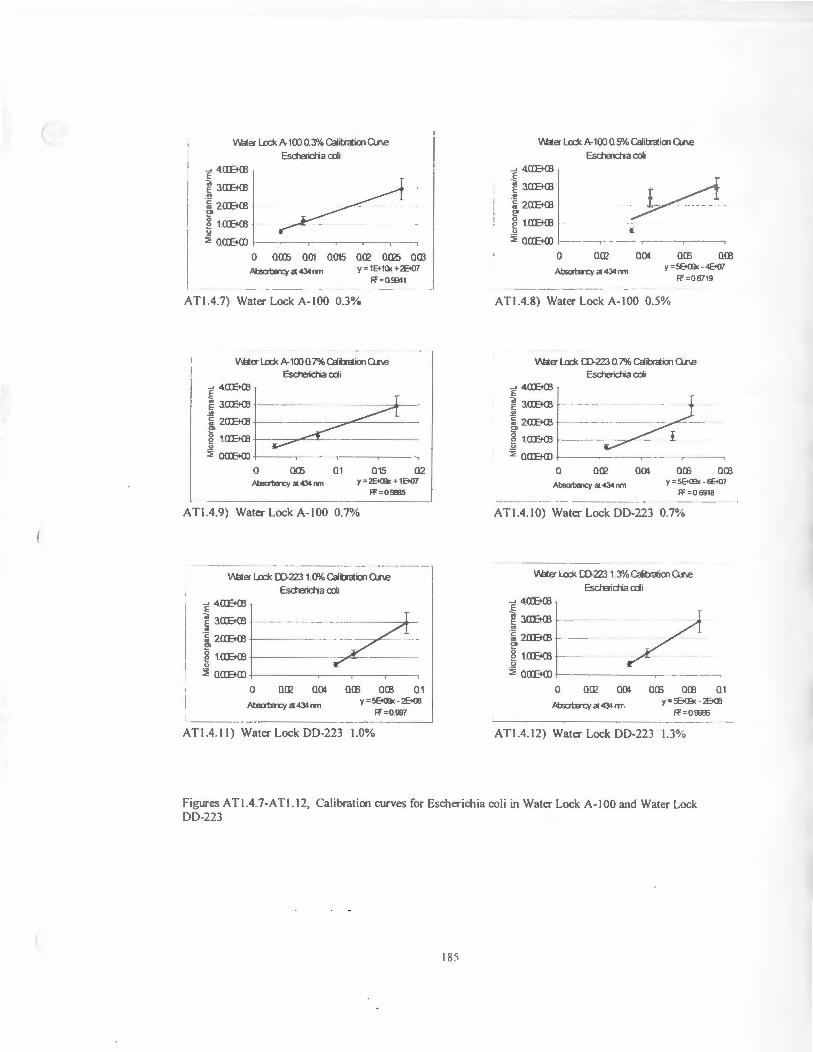
r \ 'v'leter Loci< A-100 0.3% Calilr.iiai Q.r.e
Esdlenctia coh
"E 4CXB<E I
~ 3CXB<Il I __ ~ 2CXB<Il r 1.CXB<Il
~ aCIE+<D -
0 aCID a01 a015 ace aCl15 am y = 181()( + 2807
R' =0.0041
ATl.4 .7) Water Lock A-100 0.3%
1,1\ker l..ocl< A-100 a 7% Qioaicn Q.r.e Escteicha cdi
"E 4CXB<E 5 ~ 3CIE+<B ~= :ii 2CIE+<B ____ ,_.~~---
I 1CIE+<B ~-----~ aCIE+<D ' .
0 aa; 01 015 02 y = 2EtOlx + 1807
R'=0.9685
l/IJ;j.er Loci< A-100 0.5% Calilr.i1m Q.r.e
Esdlenctia coh ..... 4CXB<Il E
~ 3CIB{B .. -~ 2CIB{B
"' ~ 1.CIB{B u
:!-: aCIE+<D -- - ,-0 ace am a CB a CB
AO;atB-cy at 434 rm y = 5800x - 4807 R' =0 0719
ATl.4.8) Water Lock A-100 0.5%
1,1\ker Loci< CD-223 0 7% QiibGticn Qr\e
Eschericha cdi
"E 4a&al
~3a&al -~-~ 2CIE+<B !----
"' 0 § 1.CIE+<B
~ OCIE+al +--~r----.--0 00? om OCB OCB
Absarba-cy al 434 nm y = 5E+09x - 6807 Ff = O 6918
ATl.4.9) Water Lock A-100 0.7% ATl.4. 10) Water Lock DD-223 0.7%
V\tlter Loci< CD-2'Z3 1.0'/o Calbcticn Clr.e Eschaicha cdi
"E 4CXB<E t ~ 3CXB<Il - --~ "J 2CIE+<B - - - ·-
0 1.CXB<Il - - -0 ~ aCIE+<D +--------,---,---~-~
a ace am aCB am a 1 AO;atB-cy at 434 rm y = 5800x - 2E+C6
R'=0."1i17
AT 1.4. 1 I) Water Lock DD-223 1.0%
lf.Uer l..ocl< CD-223 1. 3% Calit.ratim OJ\e
Eschencha cdi
"E 4CIB{B
~ 3CIB{B T
.. / ~ 2CIB{B
i 1.CIB{B -
~ aCIE+<D t---------0 ace am a03 am a 1
y = !Bal>< - 28C6 F( = 0 9\ffi
ATl.4.12) Water Lock DD-223 1.3%
Figures ATl.4. 7-A Tl.12, Calibration curves for Escherichia coli in Water Lock A- 100 and Water Lock DD-223
185

( Qa- Qrn 1 5%.Cahbraion OJ>e
Eschencna co1;
Q(li
Absorba'lcy at 434 nm
Ql Q15 y = 6E+OOx - 5(--00
R'= 1
ATl.4.13) Guar gum 1.5%
Gta- Qrn 2.0% Calibraion OJ>e Escherictla coli
-g
4
CXE+03 t j:= -----~- . !? 1.CXE+03 - __ _I __ .2
:::;; QCIE+<D ' '
I () Ql 02 Q3 Q4 QS Q6
l __ --A-bsorbaicy- at 434 nm y = 6E+-06x - 9E+07
R'=07434
AT 1.4.15) Guar gum 2.0%
,! ! ~ 971 t--F 2.CY'/o Calibration OJI\€
Escherichia coli
~ 3.aE+a! -!---- T -g 4.CXE+03 1
-~ 2CXE+03 ------~-----_ _L1 _ -_-_
I~= +------~--V--j( __ _ 0 QCE Q1 Q15
Allso'ba1cy at 434 rm
Q2 Q25 Q3 y = 4800>c - 7E+08
R' =O 9535
ATl.4.17) Carbopol 971 2.0%
Qa- Qrn 1. 75% Cahbraion 06\e Eschencha coli
1:=1 l:L ____ ~ _
0 QCE Ql 015 02 025 Q3
Absorba'lcy at 434 nm y = 1 E+09x - 1 E+-08 R'=08415
ATl.4.14) Guargum 1.75%
CarbqJol 971 t-s= 0 5% Calibra1on OJ>e Eschencha coli
~ 4.CXE+03 l ~ 3.CXE+03 I )
E::+t-----~--~ () Q01 QCl2 Qffi Q()I
Absortla1cy at 434 nm
ATl.4.16) Carbopol971 0.5%
y = 3E+10x - 7E+-08 R' =O 9996
Catx¢ 971 t--F 4.CY'/o (ailraial Qr.e
Escteic:ha roi "E 4.CIE+al i
~ 2CIE+al - .---1 13.CIE+al l l :::r >---~----
L ---~- o:-04rm 01
ATl.4.18) Carbopol 971 4.0%
015 Q2
y = 2Et<D< + 5E+C6 R' =09183
Figures AT 1.4. 13-A TI. 18, Calibration curves for Escherichia coli in Guar gum and Carbopol 971
186
( Bibliography
Atsumi, T. , Maekawa, Y., Yamada, T., Kawagishi, I. , Inae, Y. and Hamma, M., Effect of
viscosity on swimming by the lateral and polar flagella of Vibrio alginoliticus,
Journal of Bacteriology, 178:5024 - 5026, (1996)
Ballesteros, S.A., Chirife, J. and Bozzini, J. , Specific solute effects on Staphylococcus
aureus cells subjected to reduced water activity, International Journal of Food
Microbiology, 20:51 - 66, (1993)
Barry, B. W. and Eccleston, G.M., Oscillatory testing of o/w emulsions containing mixed
emulsions of the type surfactant-long chain alcohol type: influence of surfactant chain
length, Journal of Pharmaceutics and Pharmacokinetics, 25:394- 400, (1973b)
Barry, B.W. and Eccleston, G.M., Oscillatory testing of o/w emulsions containing mixed
emulsions of the type surfactant-long chain alcohol type: self-bodying action, Journal
of Pharmaceutics and Pharmacokinetics, 25:244 - 253 , (1973a)
Barry, B.W. and Meyer, M.C. , The rheological properties of Carbopol gels I: Continuous
shear and creep properties of Carbopol gels. International Journal of Pharmaceutics,
2:1 - 25, (1979)
Chen, J. and Dickinson, E., Viscoelastic properties of heat-set whey protein emulsion
gels, Journal of Texture Studies, 29:285 - 304, (1998)
Chereminisoff, N., An introduction to polymer rheology and processing, CRC Press,
London, ( 1993)
Clark, A and Ross-Murphy, S. , Structural and mechanical properties of biopolymer gels,
Advances in Polymer Science, 83:60-195, (1987)
187

( Clarke, P. and Richmond, C., Genetics and biochemistry of Pseudomonas, John Wiley
and Sons, NY, (1975)
Cohn, J., The Staphylococci, Wiley Interscience, NY, (1972)
Csonka, L.N., Physiological and genetic responses of bacteria to osmotic stress,
Microbiological Reviews, 53:121 - 147, (1989)
D.S. Orth, Establishing cosmetic preservative efficacy by use ofD-values, Journal of the
Society of Cosmetic Chemists, 31: 165-172, (1980)
Davidson, R., Handbook of water soluble polymers and resins, McGraw Hill, (1980)
Davis, S., Viscoelastic properties of pharmaceutical semisolids III: Destructive
oscillatory testing, Journal of Pharmaceutical Sciences, 60:1357 - 1360, (1971b)
Davis, S., Viscoelastic properties of pharmaceutical semisolids Ill: Non-destructive
oscillatory testing, Journal of Pharmaceutical Sciences, 60: 1351 - 1355, ( 1971 a)
Doublier, J.L. and Launay, B., Rheology of galactomannan solutions: comparative study
of guar gum and locust bean gum, Journal of Texture Studies, 25:119-137, (1994)
Eisman, P., Cooper, J. and Jaconia, P., Influence of gum tragacanth on the bacteria
activity of preservatives, Journal of The American Pharmaceutical Association,
46:144 - 147, (1957)
Ferrero, R.L. and Lee, A., Motility of Campylobacter jejuni in viscous environments:
comparison with rod shaped bacteria, Journal of General Microbiology, 134:53 - 59,
(1988)
Ferry, J., Viscoelastic properties of polymers, 3rd ed., Wiley and Sons, NY, (1980)
188

(
(
Giboreau, A., Cuvelier, G. and Launay, B., Rheological behavior of three
biopolymer/water systems, with emphasis on yield stress and viscoelastic properties,
Journal ofTexture Studies, 25:119-137 (1994)
Greenberg, E.P., Canale-Parola, E., relationship between cell coiling and motility of
spirochetes in viscous environments, Journal of Bacteriology, 131 :960 - 969, (1977)
Guiselly, K.B., Chemical and physical properties of algal polysaccharides used for cell
immobilization, Enzyme Microbial Technology, 11:706 - 716, (1989)
Kanide, K. and Saito, M., Cellulose and cellulose derivatives: recent advances in physical
chemistry, Advances in Polymer Science, 83:5-59, (1987)
Kets, E.P., de Bont, J.A.M. and Heipieper, H., Physiological responses of Pseudomonas
putida 512 subjected to reduced water activity, Microbiology Letters, 139:133 - 137,
(1996)
Lawrence, J.R. , Korber, D.R. and Caldwell, D.E., Behavioral analysis of Vibrio
parahaemolyticus variants in high and low viscosity microenvironments by use of
digital image processing, Journal of Bacteriology, 174:5732 - 5739, (1992)
Lochhead, R. and Fron, W., Encyclopedia for polymers and thickeners for cosmetics,
Cosmetics and Toiletries, 108:95-135, (1993)
McCarthy, T.J. and Myburgh, J.A., The effect of tragacanth gel on preservative activity,
Pharmaceutisch Weekblad, 109:265 - 268, (1974)
Mccormic, C. Structural design of water soluble polymers, in Water-Soluble Polymers,
Synthesis, Solution Properties and Applications (S. Shalaby, C. MacCormick, G.
Butler, eds.) pp. 2 - 24, ACS, Washington, (1991)
189

McFarland, J. , The Nephelometer, Journal of the American Medical Association,
49:1176, (1907)
Niedhart, F. , E. coli and Salmonella typimurin, cellular and molecular biology, American
Society for Microbiology, Washington, (1987)
Odds, F.C., Candida and Candidiosis, 2nd ed. Bailliere Tindall, Toronto, Ca., (1988)
Pans, R., Erra, P., Soians, C., Ravey, J. and Stebe, M., Viscoelastic properties of gel
emulsions: Their relationship with structure and equilibrium properties, Journal of
Physical Chemistry, 97: 12320-12324 (1993)
Robert, W., Rapp, G. and Webber, J. , Encyclopedia of minerals, VNR Co., NY, (1974)
Rochefort and Middleman (1987), Rheology ofxanthan gum: salt, temperature and strain
oscillatory and steady shear experiments, Journal of Rheology, 31:337-369, (1987)
Schlegel, H., General microbiology, 2nd ed., Cambridge University Press, (1993)
Stecchini, M.L. , Torre, M., Sorais, I. , Soro, 0 ., Messina, M. and Maltini, E., Influence of
structural properties and kinetic constraints on Bacillus cereus growth, Applied and
Environmental Microbiology, 64: 107 5 - 1078, ( 1998)
Terrisse, I., Seiller, M. , Rabaron, A. and Grossiord, J.L., Rheology: how to characterize
and to predict the evolution of w/o/w multiple emulsions, International Journal of
Cosmetic Science, 15:53 - 62, (1993)
Yanagi and Onishi G. , Assimilation of selected cosmetic ingredients by microorganisms,
Journal of the Society of Cosmetic Chemists. 22:851 , (1971)
190