a study of the relation of tissue differentiation to rate of growth during regeneration
TRANSCRIPT
A Study of the Relation of Tissue Differentiation to Rate of Growth during RegenerationAuthor(s): W. E. AllenSource: Biological Bulletin, Vol. 21, No. 4 (Sep., 1911), pp. 187-206Published by: Marine Biological LaboratoryStable URL: http://www.jstor.org/stable/1536041 .
Accessed: 16/05/2014 18:05
Your use of the JSTOR archive indicates your acceptance of the Terms & Conditions of Use, available at .http://www.jstor.org/page/info/about/policies/terms.jsp
.JSTOR is a not-for-profit service that helps scholars, researchers, and students discover, use, and build upon a wide range ofcontent in a trusted digital archive. We use information technology and tools to increase productivity and facilitate new formsof scholarship. For more information about JSTOR, please contact [email protected].
.
Marine Biological Laboratory is collaborating with JSTOR to digitize, preserve and extend access toBiological Bulletin.
http://www.jstor.org
This content downloaded from 195.78.108.42 on Fri, 16 May 2014 18:05:16 PMAll use subject to JSTOR Terms and Conditions

September, r9 Ir.
BIOLOGICAL BULLETIN
A STUDY OF THE RELATION OF TISSUE DIFFER- ENTIATION TO RATE OF GROWTH DURING
REGENERATION.1
W. E. ALLEN.
ACKNOWLEDGMENTS.
This work was done under the direction of Dr. Chas. Zeleny, whose advice and criticism have been invaluable. I am also indebted to Professor H. B. Ward for suggestions and encourage- ment, to Mr. S. F, Prince for help with the drawings, to Mr. W. Scott, of Indiana University, for Amblystoma material efficiently supplied and to the Illinois State Laboratory of Natural History for the loan of valuable literature.
OBJECT.
The object of this study was to find whether the greatest speed of regeneration occurs before or after or coincident with the completion of tissue differentiation. If the same correlation holds that was noted by Minot (1908) in ordinary growth, we should expect to find the rate of growth decreasing after the
major tissues have been well developed and still more so after differentiation is essentially complete. In the hope of securing definite information the present effort has been made to secure data in that definite line, using two distinct types for study.
EXPERIMENT I. A MATURE ANIMAL.
THE OLIOGOCHZETE WORM, Limnodrilus claparedianus, Ratzel. Material and Methods.
The work was begun in early October, I9Io. At that time there was not much choice of material for such investigation as a
1 Contributions from the Zoological Laboratory, University of Illinois, under
the direction of Henry B. Ward, No. 9. i87
Vol. XXI. No. 4.
This content downloaded from 195.78.108.42 on Fri, 16 May 2014 18:05:16 PMAll use subject to JSTOR Terms and Conditions
W. E. ALLEN.
preliminary survey of the local field soon showed. Lack of better material was therefore the principal reason for choosing Limnodri- lus. Of points distinctly in its favor, the most prominent were accessibility, hardiness, adaptability to laboratory conditions and rapidity of regeneration. On the other hand, the small size, irritability, quickness and sandy food caused some serious dif- ficulties. The specimens used were taken from a sandy slough margin just north of Urbana Fair Grounds. All were in good condition and in a few hours appeared quite at home under laboratory conditions.
The effort was made to select 120 worms of equal median size, but their activity was so great and their appearance changed so quickly that the results showed considerable variation. Great care was taken to make exact transverse cuts at the middle, but here again, activity interfered and there was a considerable percentage of errors in cutting. For operation each worm was placed on a paraffine block and a quick even cut was made with a sharp, thin scalpel. Anterior parts only were retained. Those of the first five worms bisected were at once stupefied in weak chloretone solution and killed in Gilson's sublimate mixture (Lee, I900). All other worms were handled in the same way. The second five was kept alive i hour after operation. All others were placed in 10 cm. Petri dishes in which was about 4 c.c. of sterilized native mud with 30 c.c. of tap water. Ten were placed in each dish except by miscount due to disappearance in the mud. Two dishes with unoperated worms were kept for check. One hundred were bisected. Water was changed in the Petri dishes twice daily immediately after taking the temperature of the water already in the dishes. The highest temperature re- corded was 28? C., the lowest 21? C. The greatest fluctuation in 12 hours was 5?. While it was unfortunate that laboratory conditions were not such as to permit more uniform temperature, it is hardly probable that even this variation seriously affected these hardy worms, none of which died. Light and other con- ditions were kept as nearly uniform as possible. Direct sunlight was avoided altogether.
As noted before the first five was killed immediately after operation, the second in i hour, third in 6 hours, fourth in I2
I88
This content downloaded from 195.78.108.42 on Fri, 16 May 2014 18:05:16 PMAll use subject to JSTOR Terms and Conditions
TISSUE DIFFERENTIATION AND RATE OF GROWTH. I89
TABLE I. Limnodrilus.
Individual Worm Length of Single Old Length of Whole Re- Number. Segment in mms. generated Part in mms.
Ist day........
2d day........
3d day........
4th day........
5th day ........
6th day........
7th day........
8th day........
7a 7b 7c 7d 7e
7f 7g 7h 7i 7j
8a 9a 9b
ioa iob
8c 8d gc gd
IOC iod
8e 8f ge
ioe
iof
8g 9g 9h
Iog ioh
8i 8j 8k 9i 9J
ioi 10oj iok iol iom
Iia iib 12a I3a 14a
.418
.432
.425
.432
.342
.418
.380
.361
.380
.418
.342
.494
.304
.380
.418
.418
.456
.342
.430
.418
.418
.418
.266
.304
.380
.370
.456
.418
.418
.342
.418
.284
.456
.418
.322
.304
.418
.380
.380
-494 .380
.456
.342
.456
.418
.456
.114
.057
.114
.076
.038
.083 (.034) .285 .380 .I90
.342
.228
.300 (.II4) .234
.6o8
.38o
.6o8
.684
.284
.6o8
1.254 .988 .722
.950
.912
1.824 1.824 2.012
1.824 2.204
3.648 3.800
(1.634) 2.546 1.900 (.988) 2.888 3.268 4.I8o (.076)
3.800 4.788 4.o66 5.928 5.oi6
Explanation of Table I.-Table I. is a copy of the records, in millimeters, from which the growth rate for the total regenerated part was calculated. Numbers omitted because of undue influence upon the average are placed in parenthesis.
This content downloaded from 195.78.108.42 on Fri, 16 May 2014 18:05:16 PMAll use subject to JSTOR Terms and Conditions
W. E. ALLEN.
TABLE I.-Continued.
Limnodrilus.
Individual Worm Number.
9th day........
ioth day ........
Iith day........
i2th day ........
Is5th day........
i8th day........
iic lid i2b I3b I4b
iie 12C
i2d 13C
I4C
I If
I2e
12f
I3d I4d
IIg I2g
I3e
I3f
14e
iih I2h
I3g
I3h I4f
I Ii
I2i
I3i
14g 14h
Length of Single Old Segment in mms.
.456
.456
.380
.494
.456
.342
.456
.532
.418
.380
.456
.456
.456
.494
.361
Length of Whole Re- generated Part in mms.
7-448 5.oi6 7.400 8.I32 6.840
7.400 7.068
(5.928) 7.980 8.626
6.346 9.196 7.670
10.754 7-752
9.1
9.4 9. 9.6 9.8
I2.7 I0.9 I3.3 II.5 i8.9
10.9 17.2 i6.8
I6.3 I3.7
hours and fifth in 24 hours. After that a group of five was taken each day to the twelfth day, the remainder on the fifteenth and eighteenth days. Since the specimens had to be killed for tissue study it was necessary to calculate the rate of growth from the condition in successive groups after killing instead of using periodic measurements of living worms.
DATA.
The following sets of measurements were taken: I. The total length of the regenerated part was measured by
eyepiece micrometer under low power as the specimens lay in
190
_ _
This content downloaded from 195.78.108.42 on Fri, 16 May 2014 18:05:16 PMAll use subject to JSTOR Terms and Conditions

TISSUE DIFFERENTIATION AND RATE OF GROWTH. I9I
cedar oil in a watch glass. (Table I. and Chart I.) specimens caused some inaccuracy here.
Ghart I.
Crooked
I 2 35 4 5 6 7 8 9 10 II 12 15
Explanation of Chart I.-A graphic representation of the records contained in Tables I. and II. The continuous line R is for the total regenerated part. The broken lines (I RS and 10 RS) are for the first and tenth regenerated segments respectively. Each I/20 inch rise in the polygon represents an increase in rate of growth of o.I mm. for R and 0.001oo for i RS and 10 RS.
2. At the same time and under the same conditions an old segment, about tenth from the level of cut, was measured in order to get a basis of comparison of general results. (Table I.)
3. Measurements were made after mounting on slides, some after sectioning but most in cedar oil. In this way some of the errors due to crookedness were detected though the general result is not essentially different. (Table II.)
4. Every tenth segment of the regenerated part was measured for length. (Table II.)
As these measurements form the only basis for the construction of a polygon (Chart I.) to graphically illustrate the rate of
This content downloaded from 195.78.108.42 on Fri, 16 May 2014 18:05:16 PMAll use subject to JSTOR Terms and Conditions
W. E. ALLEN.
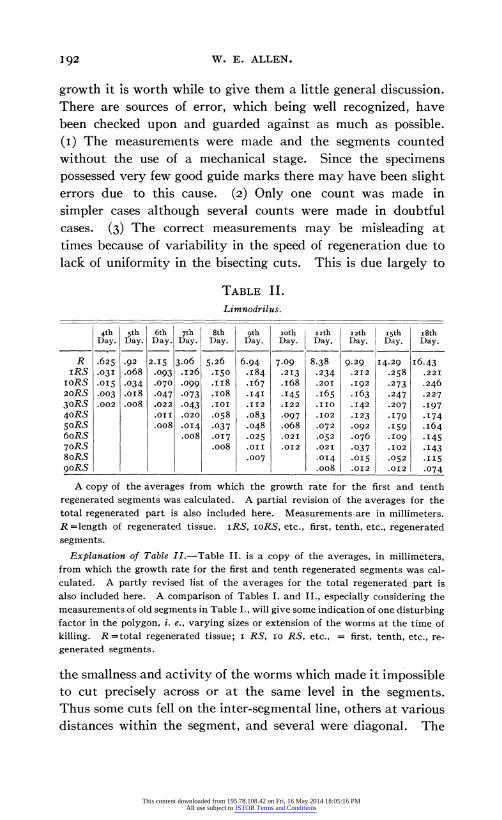
growth it is worth while to give them a little general discussion. There are sources of error, which being well recognized, have been checked upon and guarded against as much as possible. (I) The measurements were made and the segments counted without the use of a mechanical stage. Since the specimens possessed very few good guide marks there may have been slight errors due to this cause. (2) Only one count was made in simpler cases although several counts were made in doubtful cases. (3) The correct measurements may be misleading at times because of variability in the speed of regeneration due to lack of uniformity in the bisecting cuts. This is due largely to
TABLE II.
Limnodrilus.
4th 5th 6th 7th 8th oth ioth i ith i2th isth i8th Day. Day. Day. Day. Day. Day. Day. Day. Day. Day. Day.
R .625 .92 2.15 3.06 5.26 6.94 7-09 8.38 9.29 I4.29 I6.43 iRS .03I .o68 .093 .126 .I50 .184 .213 .234 .212 .258 .221
IORS .015 .034 .070 .099 .ii8 .167 .I68 .201 .I92 .273 .246 20RS .003 .oi8 .047 .073 .io8 .I4I .I45 .I65 .I63 .247 .227 30RS .002 .oo8 .022 .043 .IOI II12 .122 .IIO .142 .207 .I97 4oRS .oII .020 .058 .083 .097 .I02 .1I23 .179 .174 50RS .oo8 .014 .037 .048 .o68 .072 .092 .159 .164 6oRS .008 .017 .025 .02I .052 .076 .I09 .I45 70RS .008 .o0I .oi2 .02I .037 .I02 .I43 8oRS .007 .014 .015 .052 .115 9goRS .oo8 .o2 .oi2 .074
A copy of the averages from which the growth rate for the first and tenth regenerated segments was calculated. A partial revision of the averages for the total regenerated part is also included here. Measurements are in millimeters. R =length of regenerated tissue. iRS, IORS, etc., first, tenth, etc., regenerated segments.
Explanation of Table II.-Table II. is a copy of the averages, in millimeters, from which the growth rate for the first and tenth regenerated segments was cal- culated. A partly revised list of the averages for the total regenerated part is also included here. A comparison of Tables I. and II., especially considering the measurements of old segments in Table I., will give some indication of one disturbing factor in the polygon, i. e., varying sizes or extension of the worms at the time of killing. R =total regenerated tissue; I RS, I RS, etc., = first, tenth, etc., re- generated segments.
the smallness and activity of the worms which made it impossible to cut precisely across or at the same level in the segments. Thus some cuts fell on the inter-segmental line, others at various distances within the segment, and several were diagonal. The
192
This content downloaded from 195.78.108.42 on Fri, 16 May 2014 18:05:16 PMAll use subject to JSTOR Terms and Conditions

Epidermis. Intestinal Wall.
Proctodeum well formed. Chaotic. Proliferating.
Proliferating.
Little prolifer- ation.
Little prolifer- ation.
Almost normal.
Almost normal.
Almost normal.
Mature.
Mature.
Septa. Muscle.
Columns forming.
Columns formed.
Well formed.
Well formed.
Well formed.
Mature.
Mature.
Mature.
Mature.
Forming.
Distinct.
Distinct.
Distinct.
Distinct.
Mature.
Mature.
Mature.
Mature.
TABLE III. Limnodrilus.
Nerve Cord. Peritoneum. Blood Vessels.
Anlage distinct.
Distinct.
Well formed.
Well formed.
Almost mature.
Almost mature.
Mature.
Mature.
Forming.
Forming.
Well developed.
Well developed.
Mature.
Mature.
Mature.
Mature.
Chlorogogue.
Ventral present.
Ventral present.
Both Present. developed. Layer thin.
Both Present. developed. Layer thin.
Both Present. developed. Layer thin.
Mature. Present. Layer thin.
Mature. Present. Layer thin.
Setae.
Embryonic seta sacs distinct.
Embryonic seta sacs distinct.
Setae well developed.
Setae well developed.
Nearly mature.
Mature.
Day.
I
2
3
4
5
6
7
8
9
I0
Old cells cover wound. Proliferating.
Proliferating.
Proliferating.
Distinct, thin cuticle.
Some mature.
Some mature.
Some mature.
Some mature.
Some mature.
H-
tIl
z
H
0 0
0 H1
Nephridia.
Anlage present.
One loop developing.
Immature.
Immature.
-4
CA
I
This content downloaded from 195.78.108.42 on Fri, 16 May 2014 18:05:16 PMAll use subject to JSTOR Terms and Conditions

last point seems to be especially important as Muiller (I908) and others have shown that diagonal cuts produce marked differences in the detail of regeneration. (4) The state of contraction at time of killing was also probably somewhat variable so that detailed comparisons would have to be made with caution. The effort was made to test this factor by measuring the regenerated parts with the old segment as a unit. This indicates greatest speed of regeneration on the tenth day instead of the ninth as indicated by the other method. (5) The small number of specimens available gives opportunity for undue prominence in the showing of individuals. Evident extremes were omitted from the averages. But, after all, the general effect of most of these factors would be to diffuse rather than to accentuate the polygon, and there seems to be ample warrant for saying that the greatest speed of regeneration is at the ninth or tenth day, which is near enough for present purposes. In close ap- proximation to these results we have those from some unpublished work by Mr. Frank L. Pinckney, using Limnodrilus in this labor- tory in the spring of I9I0. As he used the method of successive measurements of living animals, the similarity seems to be practically conclusive.
In examining the polygons two striking points appear which are rather difficult to explain. In the first place, there is an apparent slackening in growth almost to the zero point on the tenth or eleventh day, the most obvious explanation for which seems to be in an accidental assemblage of extreme characters. At any rate there was no change in temperature or other observ- able laboratory conditions at that time that could possibly ac- count for it. In the second place there is a rise in the later portion of the polygon. This, however, in the total regeneration seems to be due to the fact that there are still some 50 or 60 very young segments, many of which are just at their maximum, thus serving to largely balance the decline of the older regenerated segments, which is not in itself, so very great by that time. As the study of tissue differentiation has been made principally on regenerated segment no. io, the polygons for segments no. I and no. 10 are shown (Chart I.). The maximum for no. 10
appears here at the ninth day but is apparently only more or
194 W. E. ALLEN.
This content downloaded from 195.78.108.42 on Fri, 16 May 2014 18:05:16 PMAll use subject to JSTOR Terms and Conditions

TISSUE DIFFERENTIATION AND RATE OF GROWTH.
less fortuitously coincident with the general maximum. Coin- cidence of this sort is hardly to be expected in all annelids. The abrupt rise for the tenth regenerated segment after the twelfth day is evidently due to accidental conditions in the groups.
For the differentiation study, longitudinal sections were used almost exclusively. All of these were sagittal or nearly so. While cross sections would certainly have given better histological detail they would have made it very difficult to interpret con- ditions in successive segments. The number of specimens favor- able for sectioning was too small to allow the use of both kinds. The general features of the rate of differentiation in the regenerat- ing part may be readily grasped by reference to Table III. The crookedness of some of the worms and the small size of all made interpretation of the sections rather difficult since so few sections in each specimen could be even approximately radial. There was the further difficulty, with many, of the fine sand in the digestive tract scratching and clouding the section even when it did not tear it. In spite of these disadvantages the character- istics of most tissues showed pretty well their relations to the embryonic and mature conditions. Ten tissues and organs are fairly easily distinguished in the mid body region of the normal worm. These will now be considered seriatim.
Mature epidermis is one layer in thickness with the form of cell varying from flat to cuboidal according to state of extension
(Fig. 5). There is a well-developed cuticle. In regeneration there is first an extreme extension of epidermal cells in the neigh- borhood of the injury which in a few hours results in a covering of the cut surface. This extension is carried so far that the cells are quite thin and almost separated from each other. Then follows a period of very rapid proliferation in which the cells are three or four deep (Fig. I). These cells are quite small, rounded, irregularly arranged and they have very little cytoplasm. This condition gradually changes until a portion four days old shows only a single layer. The cells even then are without well-marked walls, their nuclei are still prominent and they lack the definite- ness so characteristic of the mature epidermal cell. A cuticle is easily distinguished by the fifth day and a sixth day epidermis is essentially mature though still staining a little differently and
I95
This content downloaded from 195.78.108.42 on Fri, 16 May 2014 18:05:16 PMAll use subject to JSTOR Terms and Conditions
W. E. ALLEN.
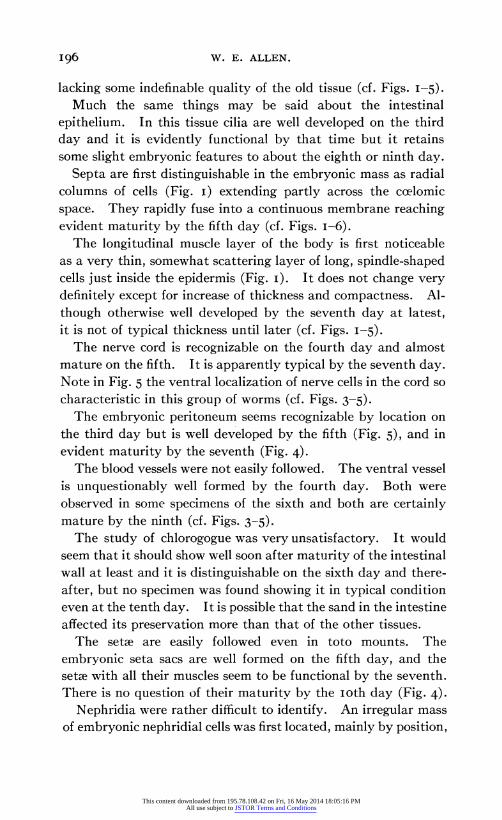
lacking some indefinable quality of the old tissue (cf. Figs. I-5). Much the same things may be said about the intestinal
epithelium. In this tissue cilia are well developed on the third day and it is evidently functional by that time but it retains some slight embryonic features to about the eighth or ninth day.
Septa are first distinguishable in the embryonic mass as radial columns of cells (Fig. I) extending partly across the coelomic space. They rapidly fuse into a continuous membrane reaching evident maturity by the fifth day (cf. Figs. I-6).
The longitudinal muscle layer of the body is first noticeable as a very thin, somewhat scattering layer of long, spindle-shaped cells just inside the epidermis (Fig. I). It does not change very definitely except for increase of thickness and compactness. Al- though otherwise well developed by the seventh day at latest, it is not of typical thickness until later (cf. Figs. I-5).
The nerve cord is recognizable on the fourth day and almost mature on the fifth. It is apparently typical by the seventh day. Note in Fig. 5 the ventral localization of nerve cells in the cord so characteristic in this group of worms (cf. Figs. 3-5).
The embryonic peritoneum seems recognizable by location on the third day but is well developed by the fifth (Fig. 5), and in evident maturity by the seventh (Fig. 4).
The blood vessels were not easily followed. The ventral vessel is unquestionably well formed by the fourth day. Both were observed in some specimens of the sixth and both are certainly mature by the ninth (cf. Figs. 3-5).
The study of chlorogogue was very unsatisfactory. It would seem that it should show well soon after maturity of the intestinal wall at least and it is distinguishable on the sixth day and there- after, but no specimen was found showing it in typical condition even at the tenth day. It is possible that the sand in the intestine affected its preservation more than that of the other tissues.
The setae are easily followed even in toto mounts. The embryonic seta sacs are well formed on the fifth day, and the setae with all their muscles seem to be functional by the seventh. There is no question of their maturity by the ioth day (Fig. 4).
Nephridia were rather difficult to identify. An irregular mass of embryonic nephridial cells was first located, mainly by position,
I96
This content downloaded from 195.78.108.42 on Fri, 16 May 2014 18:05:16 PMAll use subject to JSTOR Terms and Conditions
TISSUE DIFFERENTIATION AND RATE OF GROWTH. 197
on the seventh day. A single loop, probably functional, is plain on the eighth (Fig. 4), but the organ does not appear to be mature even on the tenth.
All organs and tissues except the nephridia appear to be func- tional on the eighth day. They have also reached apparent maturity by the tenth day, some before. The data are not as complete as could be wished but they certainly are very indicative of a correlation between the maximum rate of growth and the period of distinct differentiation. This is especially true when we consider the fact that the tenth regenerated segment is the one for which these data are recorded and that its maximum speed of growth falls on the ninth day.
EXPERIMENT II. AN IMMATURE ANIMAL. Amblystoma TADPOLE.
Material and Methods.
Eggs laid near Bloomington, Ind., probably in the night of January 29 were received in good condition at this laboratory on February I. They were kept 'in small lots under similar conditions except variation in water, until it was found that they did very well in tap water, after which it was used regularly. Up to the time of hatching, the main efforts for control were in the line of change of water, keeping temperature below 20? C., and avoidance -.of direct sunlight.
On February 16, IOO tadpoles were selected from a quite uniform lot and placed singly in berry dishes with about 50 c.c. of tap water. On the average, these individuals were about two days from the egg, none more than four nor less than one. The dishes were partly covered to reduce evaporation. Water was changed and the dishes washed two or three times per week. Fresh water was frequently added between times if evaporation seemed excessive. The temperature record was taken twice daily. No efforts to feed were successful until February 20. Within a few days many were feeding readily on live Limnodrilus which was used continuously to the end of the experiment.
By March I I several deaths had occurred but the larger number of tadpoles seemed to be well adjusted, seventy of the better specimens averaging about 20 mm. in length were retained,
This content downloaded from 195.78.108.42 on Fri, 16 May 2014 18:05:16 PMAll use subject to JSTOR Terms and Conditions
I98 W. E. ALLEN.
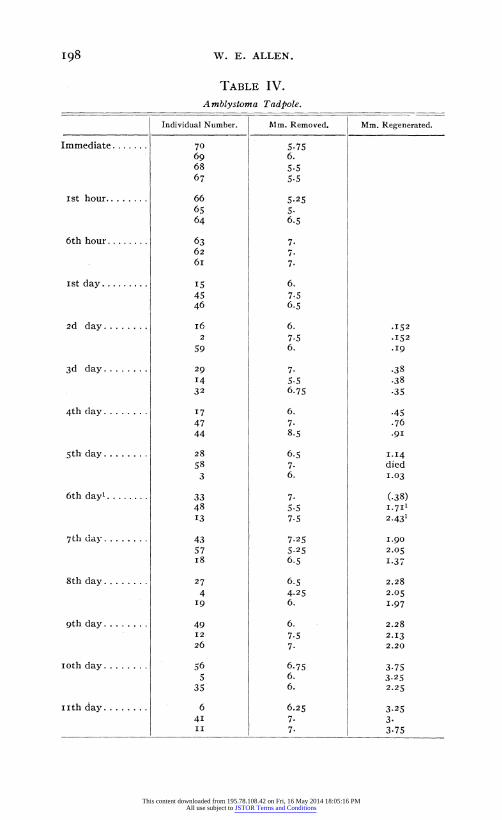
TABLE IV.
A mblystoma Tadpole.
Individual Number. Mm. Removed.
Immediate.......
ist hour........
6th hour........
ist day.........
2d day........
3d day........
4th day........
5th day ........
6th day'........
7th day ........
8th day........
9th day........
loth day........
i th day ........
70 69 68 67
66 65 64
63 62 6i
15 45 46
I6 2
59
29
14 32
17 47 44
28 58
3
33 48 13
43 57 i8
27
4 19
49 12 26
56 5
35
6 41 II
Mm. Regenerated.
5.75 6. 5-5 5-5
5.25 5. 6.5
7- 7. 7-
6. 7.5 6.5
6. 7-5 6.
7. 5.5 6.75
6. 7. 8.5
6.5 7. 6.
7. 5.5 7.5
7.25 5.25 6.5
6.5 4.25 6.
6. 7.5 7.
6.75 6. 6.
6.25 7. 7.
.152
.152
.19
.38
.38 -35
.45
.76
.91
1.14 died 1.03
(.38) I.7I1 2.431
1.90 2.05 1.37
2.28
2.05 1.97
2.28
2.13 2.20
3.75 3.25 2.25
3.25 3. 3.75
This content downloaded from 195.78.108.42 on Fri, 16 May 2014 18:05:16 PMAll use subject to JSTOR Terms and Conditions
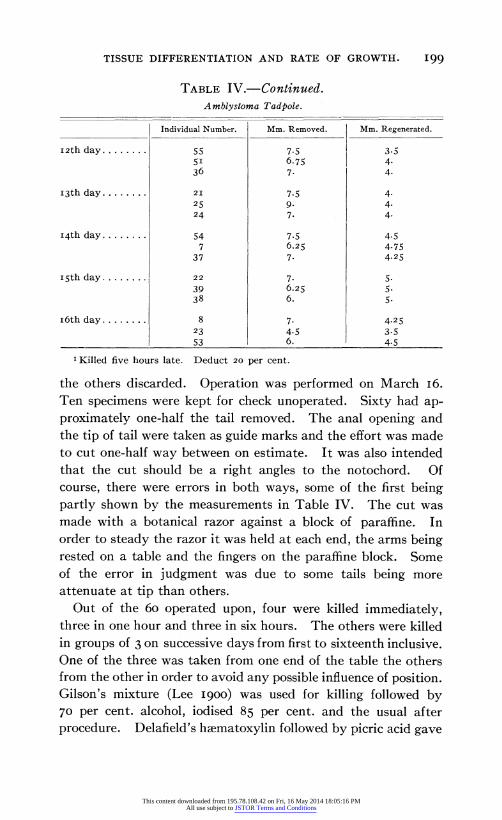
TISSUE DIFFERENTIATION AND RATE OF GROWTH. 199
TABLE IV.-Continued. Amblystoma Tadpole.
I2th day........
I3th day........
I4th day........
15th day........
I6th day........
Individual Number.
55 5I 36
21
25 24
54 7
37
22
39 38
8 23 53
1 Killed five hours late. Deduct 20 per cent.
the others discarded. Operation was performed on March I6. Ten specimens were kept for check unoperated. Sixty had ap- proximately one-half the tail removed. The anal opening and the tip of tail were taken as guide marks and the effort was made to cut one-half way between on estimate. It was also intended that the cut should be a right angles to the notochord. Of course, there were errors in both ways, some of the first being partly shown by the measurements in Table IV. The cut was made with a botanical razor against a block of paraffine. In order to steady the razor it was held at each end, the arms being rested on a table and the fingers on the paraffine block. Some of the error in judgment was due to some tails being more attenuate at tip than others.
Out of the 60 operated upon, four were killed immediately, three in one hour and three in six hours. The others were killed in groups of 3 on successive days from first to sixteenth inclusive. One of the three was taken from one end of the table the others from the other in order to avoid any possible influence of position. Gilson's mixture (Lee I900) was used for killing followed by 70 per cent. alcohol, iodised 85 per cent. and the usual after procedure. Delafield's haematoxylin followed by picric acid gave
Mm. Removed.
7.5 6.75 7.
7.5 9- 7.
7.5 6.25 7-
7. 6.25 6.
7. 4.5 6.
Mm. Regenerated.
3.5 4. 4.
4. 4. 4.
4.5 4.75 4.25
5. 5. 5.
4.25 3.5 4.5
This content downloaded from 195.78.108.42 on Fri, 16 May 2014 18:05:16 PMAll use subject to JSTOR Terms and Conditions
W. E. ALLEN.
excellent results in staining, the muscles showing especially well. Two adverse conditions must be kept in mind throughout the
consideration of this experiment. (i) Lack of ability to control temperature evidently affected the rate of growth seriously as indicated by Chart II. (2) The old tissue is itself so embryonic in character that it is extremely difficult to make an accurate measurement of the amount regenerated or an adequate descrip- tion of its changing features. Some of the vagaries of the polygon must be attributed to both these causes. General con- ditions were good as is shown by the fact of only one death in the regular series. Drawings are omitted because the requisite series is too complicated for a paper of this character.
DATA.
These descriptions are somewhat indefinite because the facts themselves with few exceptions lack clear definition.
By the end of the first hour the epidermis had stretched over and very nearly covered the cut surface. In six hours it showed rapid proliferation, with cells closely and irregularly massed and three or four deep. This condition remained much the same in general appearance except for outward extension of the entire mass at the end of the first day. In two days the older regen- erated epidermis was indistinguishable from the neighboring primary epidermis, though still proliferating at the tip. This general condition remains unchanged to the tenth day which is as far as the study of sections could be carried with any pretence of general accuracy.
The parenchyma showed some sign of reorganization in one day and there was a considerable apparent difference on the second day, but thereafter there was no appreciable difference from the ordinary conditions.
Bloodvessels were not in evidence in the regenerated tissue until the second day when some were seen which were evidently functional almost to the distal extremity of the new tissue. After the second day a fairly large vessel is uniformly found just beyond the distal end of the nerve cord, and some capillaries were identified quite near the tip in almost all specimens. Many of these were easily observable in the live specimens.
200
This content downloaded from 195.78.108.42 on Fri, 16 May 2014 18:05:16 PMAll use subject to JSTOR Terms and Conditions

TISSUE DIFFERENTIATION AND RATE OF GROWTH. 201
The first sign of extension of the nerve cord consists in a com- paratively loose mass of nerve cells or nuclei at the extreme end on the first day. These have some appearance of migration. Little difference appears on the second day although a distinct lengthening of the cord has taken place. The third day shows nearly a half millimeter of regenerated nerve cord but the end shows no very definite sign of rapid growth. After that the condition cannot be distinguished from the ordinary.
The notochord shows some renewal in one day and a slight proliferation on the second after which it appears normal except for a very small area at the end which retains the proliferating character. This is true till about the fifth day when the distal one half to three-fourths of the notochord is markedly different in appearance from the rest. The cells are smaller and more strongly stained, even the cytoplasm taking the haematoxylin stain slightly. Careful study of the slide indicates that this distal part of the notochord is in a transitional stage of differen- tiation and that it has appeared by a simultaneous change in the new cells destined to form the distal notochord. It is interesting to note that whereas on earlier days the notochord had lagged behind the nerve cord it quickly became coterminal with and even extended slightly beyond the nerve cord by the eighth or ninth day. This peculiarity of notochord development is very strongly suggestive as it is coincident with the period of greatest speed in regeneration.
The first sign of muscle development is found on the sixth day when certain cell masses are recognizable as anlagen of the new muscle tissue. These are distinguishable through about one-half the extent of new tissue. On the seventh day a few proximal strands of muscle show fair development. And on the eighth day some are found throughout the proximal third. In nine days a few well developed fibers are distinguishable half way out in the new tissue and on the tenth day it is extremely difficult to identify the border line between the proximal re- generated muscle and the old tissue.
While most of the tissues studied reach the original state of development too soon to show any connection with or influence upon the highest speed of -regeneration (Chart II.), it should be
This content downloaded from 195.78.108.42 on Fri, 16 May 2014 18:05:16 PMAll use subject to JSTOR Terms and Conditions

W. E. ALLEN.
remembered that all except the muscle are so generalized in their original condition that they require little change before reaching the original limit of differentiation. On the other hand, the muscle is rather highly specialized and if it be taken as a standard a rather marked correlation is noted. It is just becoming dis- tinguishable at the sixth day when growth has its greatest speed according to this polygon, and it gradually takes on maturity until it is well developed by the ninth day which is evidently
Chart II.
Chart II.-Temperature--I C. to I/20 inch rise. Growth rate-o.I mm. to 5/20 inch rise.
somewhat past the time of most rapid extension. A glance at the chart indicates the probability of greatest speed having been shown at about the seventh or eighth day if the temperature had been under control.
Chart II. is a polygon constructed from micrometer measure- ments under the compound microscope, of the tissues in toto
202
This content downloaded from 195.78.108.42 on Fri, 16 May 2014 18:05:16 PMAll use subject to JSTOR Terms and Conditions
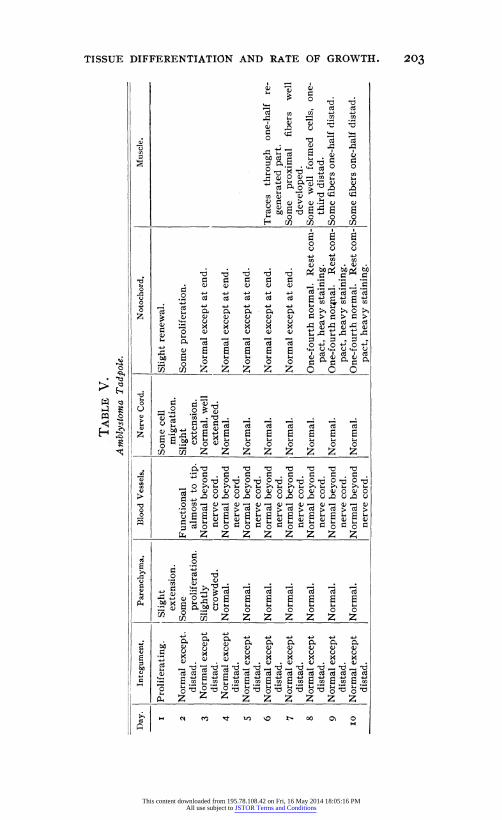
TABLE V. Amblystoma Tadpole.
Nerve Cord.
Functional almost to tip.
Normal beyond nerve cord.
Normal beyond nerve cord.
Normal beyond nerve cord.
Normal beyond nerve cord.
Normal beyond nerve cord.
Normal beyond nerve cord.
Normal beyond nerve cord.
Normal beyond nerve cord.
Some cell migration.
Slight extension.
Normal, well extended.
Normal.
Normal.
Normal.
Normal.
Normal.
Normal.
Normal.
Slight renewal.
Some proliferation.
Normal except at end.
Normal except at end.
Normal except at end.
Normal except at end.
Normal except at end.
One-fourth normal. Rest com- pact, heavy staining.
One-fourth nor4nal. Rest com- pact, heavy staining.
One-fourth normal. Rest com- pact, heavy staining.
Traces through one-half re- generated part.
Some proximal fibers well developed.
Some well formed cells, one- third distad.
Some fibers one-half distad.
Some fibers one-half distad.
Day. Integument. Parenchyma. Blood Vessels. Notochord.
I
2
3
4
5
6
7
8
9
IO
Proliferating.
Normal except. distad.
Normal except distad.
Normal except distad.
Normal except distad.
Normal except distad.
Normal except distad.
Normal except distad.
Normal except distad.
Normal except distad.
Muscle.
Slight extension.
Some proliferation.
Slightly crowded.
Normal.
Normal.
Normal.
Normal.
Normal.
Normal.
Normal.
CJ)
zr H:
z
0_
H
0 CA
~~~~~~~~~~~~~~_ I~~~~~~~~~~~~~~~~~~~~~~~~~~~~~~~~~~~~~ I
This content downloaded from 195.78.108.42 on Fri, 16 May 2014 18:05:16 PMAll use subject to JSTOR Terms and Conditions

W. E. ALLEN.
and after sectioning. The solid line indicates the former and the broken line the latter. Temperature fluctuations are re- corded in the upper part. It was very difficult both with the toto examination and the section examination to distinguish the exact plane of cut, and of course, a very slight error in identifi- cation of this level would make a marked difference in the poly- gon. This difficulty rapidly became worse as the regenerated tissue grew older and measurements taken by any method after the tenth day have a purely suggestive value since they have no basis in strict accuracy. A set of measurements was taken with dividers, using a binocular dissecting microscope, but as their results are not essentially different they are not plotted on the chart. Table V. is self explanatory.
SUMMARY.
It seems that the results of these two studies are sufficiently clear to warrant assumptions as follows though further data are very desirable.
I. When adult tissue is removed the resultant regenerative growth reaches its greatest speed just preceding, or at least not later than, the time when the major somatic tissues become typically differentiated.
2. When immature tissue is removed the resultant regenerative growth rate shows no relation of any sort to the differentiation of the more generalized somatic tissues. There is, however, a marked correlation with such a highly specialized tissue as muscle, the differentiation of which is coincident with the period of maximum growth rate. And the peculiar development of the notochord also strongly supports this view.
Of the literature available, only that which was found dis- tinctly useful is listed here. Krecker's list is good and a more general bibliography, especially concerning annelids, can be ob- tained from his paper.
PAPERS CITED. Durbin, M. L.
'09 An Analysis of the Rate of Regeneration throughout the Regenerative Process. Journ. Exp. Zo61., 3, 397-420.
Krecker, F. H. lIO Some Phenomena of Regeneration in Limnodrilus and Related Forms,
Zeitschr. wiss. Zool., 95, 383-450.
204
This content downloaded from 195.78.108.42 on Fri, 16 May 2014 18:05:16 PMAll use subject to JSTOR Terms and Conditions

TISSUE DIFFERENTIATION AND RATE OF GROWTH. 205
Lee, A. B. 'oo The Microtomist's Vade Mecum. London.
Minot, C. S. 'o8 Age, Growth and Death. New York.
Morgan, T. H. 'oi Regeneration. New York.
Morgulis, S. '07 Observations and Experiments in Lumbriculus. Journ. Exp. Zo01., 4,
549-574. 'ii Regulation of the Water Content in Regeneration. Journ. Exp. Zo61., Io,
321-348. Miiller, C.
'o8 Regenerationsversuche an Lumbriculus variegatus und Tubifex rivulorum. Arch. f. Entwicklungsmech. d. Organismen, 26, 209-277.
ABBREVIATIONS.
R =regenerated tissue. m =muscle. S =mature segment in old tissue. n =nerve cord.
RS = newly regenerated segment. nr =nephridium. b = bloodvessel. pe = peritoneum. c =chlorogogue. pr = proliferating mass. e =epidermis. s =septum or septal anlage.
ss =seta sac.
This content downloaded from 195.78.108.42 on Fri, 16 May 2014 18:05:16 PMAll use subject to JSTOR Terms and Conditions
ao6 W. E. ALLEN.
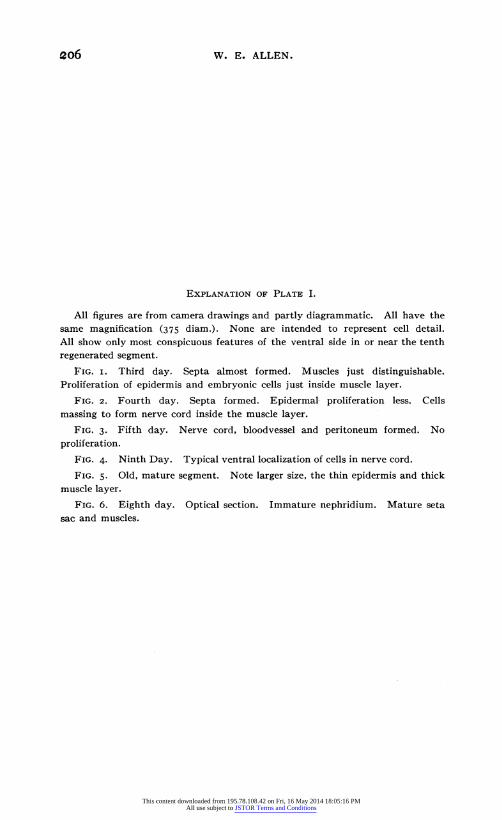
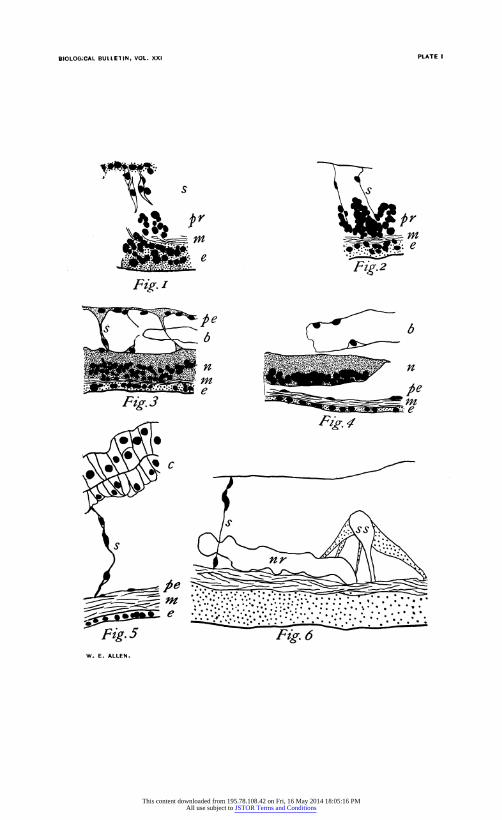
EXPLANATION OF PLATE I.
All figures are from camera drawings and partly diagrammatic. All have the same magnification (375 diam.). None are intended to represent cell detail. All show only most conspicuous features of the ventral side in or near the tenth
regenerated segment.
FIG. 1. Third day. Septa almost formed. Muscles just distinguishable. Proliferation of epidermis and embryonic cells just inside muscle layer.
FIG. 2. Fourth day. Septa formed. Epidermal proliferation less. Cells massing to form nerve cord inside the muscle layer.
FIG. 3. Fifth day. Nerve cord, bloodvessel and peritoneum formed. No
proliferation.
FIG. 4. Ninth Day. Typical ventral localization of cells in nerve cord.
FIG. 5. Old, mature segment. Note larger size, the thin epidermis and thick muscle layer.
FIG. 6. Eighth day. Optical section. Immature nephridium. Mature seta sac and muscles.
This content downloaded from 195.78.108.42 on Fri, 16 May 2014 18:05:16 PMAll use subject to JSTOR Terms and Conditions
BIOLOG;CAL BULLETIN, VOL. XXI
pr
. e Fig.
Ptg.J
pr - e
b
n
pe If
trzg./
* --;.----
.. .
* * *. * . *
. * :.. *.*. **. . . .' .
Fze 6 Fig. 5 W. E. ALLEN.
PLATE I
e
e
This content downloaded from 195.78.108.42 on Fri, 16 May 2014 18:05:16 PMAll use subject to JSTOR Terms and Conditions