a study of the quality of waste derived compost in ireland · the quality of waste derived compost...
TRANSCRIPT

Lorraine Herity, M.Sc. Environmental Engineering, Queens University of Belfast
A STUDY OF
THE QUALITY OF
WASTE DERIVED COMPOST
IN IRELAND
By Lorraine Herity
Thesis submitted in partial fulfillment of the requirements for the degree of Master of
Science in Environmental Engineering to the Faculty of Engineering,
Queens University of Belfast.
September 2003

Lorraine Herity, M.Sc. Environmental Engineering, Queens University of Belfast
Abstract Analysis of fifty-nine compost quality test results received from twelve composting
facilities throughout Ireland, was carried out to determine the overall quality of Irish
compost, to compare its quality with compost from other European countries and to
use statistical analysis to see if there were any significant correlations between heavy
metals in compost. The quality of the compost samples produced from biowaste,
green waste, commercial organics and sludge was then compared and classified
according to statutory limits for compost quality parameters, stipulated by the
Environment Protection Agency and the forthcoming EU Biowaste Directive. The
main parameters analysed included the concentration of heavy metals and nutrients
and the presence of foreign matter, salmonella and faecal coliforms.
Approximately fifty percent of the biowaste compost samples were classified either as
Class I or Class II compost according to the EU standard and in general contained
lower amounts of heavy metals when compared to other EU countries. However, high
levels of impurities and gravel and stones resulted in a significant amount of samples
being classified as stabilised biowaste or as non-conforming to the minimum
requirements of proposed Biowaste Directive. Significant correlations were also
found between some heavy metals in the biowaste compost, which suggest that single
laboratory tests of strongly correlated metals could be carried out in the future.
Sanitation requirements were met for nearly all the samples analysed. The biowaste
compost contained sufficient amounts of nutrients and had good fertilising
capabilities, whereas the green waste compost contained fewer nutrients. Some of the
compost samples were also found to be immature which was attributed to a lack of
space available at facilities to allow compost to fully mature.
The introduction of a national compost standard along with improved source
segregation and processing of feedstock was recommended to ensure the quality of
the product and to assist in the development of viable markets and outlets for compost
in the future.

Lorraine Herity, M.Sc. Environmental Engineering, Queens University of Belfast
Acknowledgements Many thanks to PJ Rudden and all the staff at M.C.O’Sullivan’s for all their support
and encouragement. A special word of gratitude to Conall Boland, my external
supervisor, for all his advice and guidance throughout the duration of this study, it is
very much appreciated. Sincere thanks also to Cré – the Composting Association of
Ireland Teo and all its members for their co-operation and input. Special thanks to Dr.
Trevor Elliot, my course co-ordinator and project supervisor for all his help and
advice throughout the project and the entire academic year
Thank you also to the following people for their input:
• Garry O’Lochlainn, Galway City Council.
• Caolan Woods, Natural Worlds Products.
• Walter Ryan Purcell and Ronan Beasley, Mc Gill Environmental Systems
(Ireland).
• Emily Nichols, the UK Composing Association.
• Louise Hollingsworth, WRAP.

Lorraine Herity, M.Sc. Environmental Engineering, Queens University of Belfast i
TABLE OF CONTENTS
TABLE OF CONTENTS .........................................................................................I
LIST OF FIGURES............................................................................................... VI
LIST OF TABLES ..................................................................................................X
1.0 INTRODUCTION.................................................................................... 1
1.1 THE EU LANDFILL DIRECTIVE (99/31/EC) .................................................. 1
1.2 THE EU BIOWASTE DIRECTIVE ................................................................... 2
1.3 IRISH WASTE MANAGEMENT POLICY .......................................................... 2
1.4 COMPOSTING OF BIODEGRADABLE WASTE.................................................. 2
1.5 COMPOST QUALITY TESTING....................................................................... 3
1.6 COMPOST STANDARDS ................................................................................ 4
1.7 AIMS AND OBJECTIVES........................................................................ 4
2.0 LITERATURE REVIEW............................................................................ 6
2.1 LOCATION OF COMPOSTING FACILITIES IN IRELAND .................................... 6
2.2 REVIEW OF COMPOSTING FACILITIES .......................................................... 6
2.2.1 Origins Of Feedstock ............................................................................. 6
2.2.2 Composting Technology Employed In Ireland ....................................... 7
2.2.3 Available Capacity And Actual Quantity Of Materials Composted In
Ireland .............................................................................................................. 8
2.3 PROCESSING FACTORS GOVERNING COMPOST QUALITY .............................. 9
2.3.1 Type Of Feedstock Utilised.................................................................... 9
2.3.1.1 Green Waste................................................................................... 9
2.3.1.2 Biowaste ........................................................................................ 9
2.3.1.3 Sludge .......................................................................................... 10
2.3.2 Source Segregation .............................................................................. 10
2.3.3 Seasonal Variations In Feedstock ......................................................... 12
2.3.4 Pre-processing And Post-Processing Methods ...................................... 12
2.3.5 Biological Processing........................................................................... 13
2.3.6 The Maturation Stage........................................................................... 14

Lorraine Herity, M.Sc. Environmental Engineering, Queens University of Belfast ii
2.3.7 Storage................................................................................................ 15
2.4 EVALUATING COMPOST QUALITY IN RELATION TO PHYSICAL, CHEMICAL
AND BIOLOGICAL ATTRIBUTES OF THE COMPOST. ................................................ 15
2.4.1 pH........................................................................................................ 15
2.4.2 Organic Matter..................................................................................... 15
2.4.3 Moisture Content ................................................................................. 15
2.4.4 Bulk Density ........................................................................................ 16
2.4.5 Conductivity ........................................................................................ 16
2.4.6 C:N Ratio............................................................................................. 16
2.4.7 Nutrient Content Of Compost............................................................... 16
2.4.7.1 Nitrogen ....................................................................................... 17
2.4.7.2 Total Nitrogen (TN) ..................................................................... 18
2.4.7.3 Available Nitrogen as NO3-N ....................................................... 18
2.4.7.4 Available Nitrogen as NH4-N ....................................................... 19
2.4.7.5 Phosphorous................................................................................. 20
2.4.7.6 Potassium..................................................................................... 20
2.4.7.7 Calcium and Magnesium .............................................................. 20
2.4.8 Heavy Metals ....................................................................................... 20
2.4.9 Maturity ............................................................................................... 21
2.4.9.1 Self Heating Test.......................................................................... 22
2.4.9.2 Oxygen Uptake Rate .................................................................... 23
2.4.9.3 Cress Germination Test ................................................................ 23
2.4.10 Foreign Matter ................................................................................. 24
2.4.10.1 Impurities....................................................................................... 24
2.4.10.2 Gravel and Stones .......................................................................... 24
2.4.11 Pathogens......................................................................................... 24
3.0 METHODOLOGY .................................................................................... 25
3.1 COMPOST QUALITY DATA COLLECTION .................................................... 25
3.2 ANALYSIS OF DATA .................................................................................. 25
3.3 SITE VISITS............................................................................................... 27
4.0 RESULTS................................................................................................... 29
4.1 HEAVY METALS ....................................................................................... 29

Lorraine Herity, M.Sc. Environmental Engineering, Queens University of Belfast iii
4.1.1 Heavy Metal Content of Biowaste Compost ......................................... 29
4.1.1.1 Comparison Of Heavy Metal Concentration In The Biowaste
Compost Versus The Critical Limits Specified By The EPA And The EU
Biowaste Directive....................................................................................... 30
4.1.2 Heavy Metal Content of Green Waste Compost ................................... 35
4.1.2.1 Comparison Of Heavy Metal Concentration In The Green Waste
Compost Versus The Critical Limits Specified By The EPA And The EU
Biowaste Directive....................................................................................... 36
4.1.3 Heavy Metal Content of the Commercial Organic Compost ................. 39
4.1.3.1 Comparison of Heavy Metal Concentration in the Commercial
Organic Compost Versus the Critical Limits Specified by the EPA and the EU
Biowaste Directive....................................................................................... 40
4.1.4 Heavy Metal Content of Sludge Compost............................................. 45
4.1.4.1 Comparison Of Heavy Metal Concentration In The Sludge Compost
Versus The Critical Limits Specified By The EPA And The EU Biowaste
Directive 46
4.1.5 Correlations Between Heavy Metals..................................................... 49
4.1.5.1 Correlations Between Heavy Metals in Biowaste Compost........... 49
4.1.5.2 Correlations Between Heavy Metals in Green Waste Compost ..... 50
4.1.5.2 Correlations Between Heavy Metals In Commercial Organic
Composts..................................................................................................... 52
4.1.5.4 Correlations Between Heavy Metals in Sludge Compost .............. 53
4.2 NUTRIENT CONTENT OF COMPOST SAMPLES.............................................. 54
4.2.1 Total Nitrogen (TN) ............................................................................. 55
4.2.2 Available Nitrogen as NO3-N............................................................... 56
4.2.3 Available Nitrogen as NH4-N............................................................... 56
4.3 OTHER PHYSICAL AND CHEMICAL PARAMETERS ....................................... 57
4.3.1 C:N Ratio............................................................................................. 58
4.3.2 pH Scale .............................................................................................. 58
4.3.3 Moisture Content ................................................................................. 58
4.3.4 Organic Matter Content........................................................................ 59
4.3.5 Conductivity ........................................................................................ 59
4.4 MATURITY................................................................................................ 59
4.4.1 Self Heating Test.................................................................................. 59

Lorraine Herity, M.Sc. Environmental Engineering, Queens University of Belfast iv
4.4.2 Oxygen Uptake Rate ............................................................................ 60
4.4.3 Cress Germination Test........................................................................ 60
4.5 FOREIGN MATTER..................................................................................... 61
4.6 PATHOGENS.............................................................................................. 61
4.7 OVERALL QUALITY OF THE BIOWASTE AND GREEN WASTE COMPOST ...... 62
5.0 DISCUSSION............................................................................................. 64
5.1 HEAVY METALS ....................................................................................... 64
5.1.1 Overview Of Classification Of Compost Samples According To Heavy
Metal Content ................................................................................................... 64
5.1.1.1 Quality Of Biowaste Compost Samples ........................................ 64
5.1.1.2 Quality Of Green Waste Compost Samples .................................. 65
5.1.1.3 Quality Of Commercial Organic Compost .................................... 65
5.1.1.4 Quality Of Sludge Compost.......................................................... 65
5.1.2 A Comparison Of Mean Heavy Metal Content For The Different Types
Of Compost Analysed....................................................................................... 66
5.1.3 Heavy Metals in Irish Biowaste Compost Compared to Composts from
Other Countries................................................................................................. 69
5.1.4 Heavy Metals In Irish Green Waste Compost Compared To Compost
From Other Countries ....................................................................................... 70
5.1.5 Correlations Between Heavy Metals..................................................... 72
5.2 NUTRIENT CONTENT OF COMPOST SAMPLES.............................................. 73
5.2.1 Total Nitrogen (TN) ............................................................................. 73
5.2.2 Available Nitrogen as NO3-N............................................................... 74
5.2.3 Available Nitrogen as NH4-N............................................................... 76
5.2.4 Total Phosphorous (TP) ....................................................................... 78
5.2.5 Available Phosphorous as PO4-P .......................................................... 79
5.2.6 Total Potassium (TK)........................................................................... 81
5.2.7 Available Potassium............................................................................. 82
5.2.8 Magnesium .......................................................................................... 83
5.2.9 Calcium ............................................................................................... 83
5.3 OTHER PHYSICAL AND CHEMICAL PARAMETERS ....................................... 84
5.3.1 C:N Ratio............................................................................................. 84
5.3.2 pH Scale .............................................................................................. 86

Lorraine Herity, M.Sc. Environmental Engineering, Queens University of Belfast v
5.3.4 Organic Matter Content........................................................................ 89
5.3.5 Conductivity ........................................................................................ 90
5.3.6 Dry Bulk Density ................................................................................. 92
5.4 MATURITY................................................................................................ 92
5.4.1 Self Heating Test.................................................................................. 92
5.4.2 Oxygen Uptake Rate ............................................................................ 93
5.4.3 Cress Germination Test........................................................................ 94
5.4.4 Summary of Maturity Findings ............................................................ 94
5.5 FOREIGN MATTER..................................................................................... 94
5.5.1 Impurities............................................................................................. 94
5.5.2 Gravel and Stones ................................................................................ 96
5.6 PATHOGENS.............................................................................................. 98
5.6.1 Faecal Coliforms.................................................................................. 98
5.6.2 Salmonella ........................................................................................... 99
5.7 OVERALL QUALITY OF IRISH COMPOST ..................................................... 99
6.0 CONCLUSIONS AND RECOMMENDATIONS ...................................102
REFERENCES
APPENDICES
APPENDIX 1 ANNEX IV AND III OF THE EU BIOWASTE DIRECTIVE
APPENDIX 2 VARIOUS TYPES OF COMPOSTING TECHNOLOGIES
APPENDIX 3 SEPARATION TECHNIQUES FOR SORTING FEEDSTOCKAND SIZE REDUCTION
PRIOR TO BIOLOGICAL PROCESSING
APPENDIX 4 GRAPHS OF HEAVY METALS CONCENTRATIONS FOR INDIVIDUAL COMPOST
SAMPLES
APPENDIX 5 PHOTOGRAPHS FROM SITE VISITS

Lorraine Herity, M.Sc. Environmental Engineering, Queens University of Belfast vi
LIST OF FIGURES
Fig 2.1 Location and Details of Composting Facilities in Ireland............................... 7
Fig 2.2 Graph showing the number of facilities employing different composting....... 8
technologies. ............................................................................................................. 8
Fig 2.3 Graph of the quantity of different feedstock composted in Ireland against
actual available capacity (tonnes/annum). .......................................................... 8
Fig 2.4. Mineralisation – Immobilisation turnover in relation to TN in compost ...... 18
Source: Barker, 1997............................................................................................... 18
Fig 2.5 Plant root damage due to reduced oxygen supply from application of uncured
compost. .......................................................................................................... 22
Fig 4.1 (a and b). Graph of mean concentrations of heavy metals in Irish biowaste
compost compared to the critical limits specified by the EPA and the Proposed
Biowaste Directive for Class I and II compost. ................................................ 32
Fig 4.2. Graph of the concentration of Hg (mg/Kg) in the biowaste compost samples
........................................................................................................................ 33
Fig 4.3 Graph of the concentration of Ni in the biowaste compost samples.............. 34
Fig 4.4. Graph of the concentration of Cr (mg/Kg) in the biowaste compost samples34
Fig 4.5 Graph of mean concentrations of trace elements in Irish biowaste compared to
the critical limits specified by the EPA. ........................................................... 35
Fig 4.6 (a and b). Graph of mean concentrations of heavy metals in Irish green waste
compost compared to the critical limits specified by the EPA and the proposed
Biowaste Directive for Class I and II compost. ................................................ 37
Fig 4.7 (a and b). Graph of mean concentrations of heavy metals in commercial
organics compost compared to the critical limits specified by the EPA and the
proposed Biowaste Directive for Class I and II Compost. ................................ 41
Fig 4.8 Graph of the concentration of Cu in the commercial organic compost samples.
........................................................................................................................ 42
Fig 4.9 Graph of the concentration of Zn (mg/Kg) in the commercial organic compost
samples............................................................................................................ 43
Fig 4.10 Graph of the concentration of Pb (mg/Kg) in the individual commercial
organic compost samples ................................................................................. 44
Fig 4.11 Graph of the concentration of Cr (mg/Kg) in the commercial organic
compost samples.............................................................................................. 45

Lorraine Herity, M.Sc. Environmental Engineering, Queens University of Belfast vii
Fig 4.12 (a and b). Graph of mean concentrations of heavy metals in sludge compost
compared to the critical limits specified by the EPA and the proposed Biowaste
Directive for Class I and II compost................................................................. 47
Fig 4.13 Graph of the concentration of Zn (mg/Kg) in the commercial organic
compost samples.............................................................................................. 48
Fig 4.14 Scatter graph showing the correlation between copper and nickel in the
biowaste compost ............................................................................................ 50
Fig 4.15 (a,b,c,d) Scatter graphs showing significant correlations between heavy
metals in green waste compost......................................................................... 52
Fig 4.16 Scatter graph showing the correlation between mercury and lead............... 54
Biowaste Samples ................................................................................................... 60
Fig 5.1 (a,b,c) Graph of the mean concentration of heavy metals in the different types
of compost analysed
Fig 5.2 (a, b, c). Graph of concentration of heavy metals in Irish biowaste compost
compared to heavy metal concentrations in green waste compost from other
countries. ......................................................................................................... 70
Fig 5.3 (a and b). Graph of concentration of heavy metals in Irish green waste
compost compared to heavy metal concentrations in green waste compost from
other countries. ................................................................................................ 71
Fig 5.4 (c). Graph of concentration of heavy metals in Irish green waste compost
compared to heavy metal concentrations in green waste compost from other
countries. ......................................................................................................... 72
Fig 5.5 Graph of the TN (%) for each of the biowaste compost samples showing
recommended threshold levels. ........................................................................ 73
Fig 5.6 Graph of the TN (%) for each of the green waste compost samples showing
recommended threshold levels. ........................................................................ 74
Fig 5.7. Graph of the concentration of NO3-N (mg/L) in the biowaste compost
samples showing recommended threshold levels.............................................. 75
Fig 5.8 Graph of the NO3-N concentration (mg/L) for each of the green waste
compost samples showing recommended threshold levels.
Fig 5.9 Graph of the NH4-N concentration (mg/L) for each of the biowaste compost
samples showing recommended threshold levels.............................................. 76
Fig 5.10 Graph of the NH4-N concentration (mg/L) for each of the green waste
compost samples.............................................................................................. 77

Lorraine Herity, M.Sc. Environmental Engineering, Queens University of Belfast viii
Fig 5.11 Graph of the TP (%) for each of the biowaste compost samples showing
recommended threshold levels. ........................................................................ 78
Fig 5.12 Graph of the TP (%) for each of the green waste compost samples showing
the recommended lower threshold level. .......................................................... 79
Fig 5.13 Graph of PO4-P (mg/L) content of the biowaste compost samples showing
recommended threshold levels. ........................................................................ 80
Fig 5.14 Graph of PO4-P (mg/L) content of the green waste compost samples showing
recommended threshold levels. ........................................................................ 80
Fig 5.15 Graph of the TK (%, dry wt) in the biowaste compost samples showing
recommended threshold levels. ........................................................................ 81
Fig. 5.16 Graph of the TK (%) in the green waste compost samples showing
recommended threshold levels. ........................................................................ 82
Fig 5.17 Graph of available K (mg/L) in the biowaste compost samples showing
recommended threshold levels. ........................................................................ 82
Fig 5.18 Graph of the total magnesium (%) for each of the biowaste compost samples
showing recommended threshold levels. .......................................................... 83
Fig 5.19 Graph of the total calcium (%) for each of the biowaste compost samples
showing recommended threshold levels. .......................................................... 84
Fig 5.20 Graph of the C:N ratios of the biowaste compost samples showing
recommended threshold levels. ........................................................................ 84
Fig 5.21 Graph of the C:N ratios of the green waste compost samples showing
recommended threshold levels. ........................................................................ 85
Fig 5.22 Graph of the C:N ratios of the commercial organic compost samples showing
recommended threshold levels. ........................................................................ 85
Fig 5.23 Graph of the pH for the biowaste compost samples showing recommended
threshold levels................................................................................................ 86
Fig 5.24 Graph of the pH of the green waste compost samples showing recommended
threshold levels................................................................................................ 86
Fig 5.25 Graph of the pH of the commercial organic compost samples showing
recommended threshold levels. ........................................................................ 87
Fig 5.26 Graph of the moisture content (%) of the biowaste compost samples showing
recommended threshold levels. ........................................................................ 88
Fig 5.27 Graph of the moisture content (%) of the green waste compost samples
showing recommended threshold levels. .......................................................... 88

Lorraine Herity, M.Sc. Environmental Engineering, Queens University of Belfast ix
Fig 5.28 Graph of the moisture content (%) of the commercial organic compost
samples showing recommended threshold levels.............................................. 89
Fig. 5.29 Graph of the organic matter content (%) of the biowaste compost samples
showing recommended threshold levels. .......................................................... 90
Fig. 5.30 Graph of the conductivity (µS/cm) of the biowaste compost samples
showing recommended threshold levels. .......................................................... 91
Fig. 5.31 Graph of the conductivity (µS/cm) of the green waste compost samples ... 91
Fig 5.32 Graph of the bulk density (g/L) for the biowaste compost samples showing
recommended threshold levels. ........................................................................ 92
Fig 5.33 Graph of impurities (%) in the biowaste compost samples showing the
statutory limit specified by the EU Biowaste Directive. ................................... 95
Fig 5.34 Graph of impurities (%) in the green waste compost samples showing the
statutory limit specified by the EU Biowaste Directive. ................................... 95
Fig 5.35 Graph of gravel and stones content (%) in the biowaste compost samples
showing the statutory limit specified by the EU Biowaste Directive................. 97
Fig 5.36 Graph of gravel and stones content (%) in the green waste compost samples
showing the statutory limit specified by the EU Biowaste Directive................. 97
Fig 5.37 Graph of the presence of faecal coliforms (MPN/g) in the biowaste compost
samples showing the statutory limit specified by the EU Biowaste Directive. .. 98
Fig 5.38 Graph of the presence of faecal coliforms (MPN/g) in the green waste
compost samples showing the statutory limit specified by the EU Biowaste
Directive.......................................................................................................... 99
Fig 5.39 Graphs showing the percentage classes of Biowaste and Green waste
compost according to the proposed Biowaste Directive……………………………101

Lorraine Herity, M.Sc. Environmental Engineering, Queens University of Belfast x
LIST OF TABLES
Table 1.1 EU Landfill Directive targets for reducing ................................................. 1
biodegradable waste sent to landfill ........................................................................... 1
Table 2.1 Compositions and Biodegradability of Municipal Waste .......................... 10
Table 2.2 Effects of different segregation and pre-processing techniques on the
concentration of heavy metals in compost........................................................ 11
Table 2.3 Interpretation of available Nitrogen as NO3-N in compost........................ 19
Table 2.4 Interpretation of available Nitrogen as NH4-N in compost........................ 19
Table 2.5 Table showing the classes of stability for the Self Heating Test................ 23
Table 4.1 Concentration of heavy metals in the biowaste compost........................... 29
Table 4.2 Critical limits for heavy metals in compost specified by the EPA and EU
Biowaste Directive and the percentage of the biowaste compost samples
exceeding the limits ......................................................................................... 30
Table 4.3. Concentration of heavy metals in the green waste compost ..................... 36
Table 4.4 Critical limits for heavy metals in compost and the percentage of green
waste compost samples exceeding the limits .................................................... 36
Table 4.5. Concentration of heavy metals in the commercial organic compost ......... 39
Table 4.6 Critical limits for heavy metals in compost and the percentage of
commercial organic compost samples exceeding the limits .............................. 40
Table 4.7. Concentration of heavy metals in the sludge compost.............................. 45
Table 4.8 Critical limits for heavy metals in compost and the percentage of sludge
compost samples exceeding the limits.............................................................. 46
Table 4.9 Pearson’s Correlations Between Heavy Metals in Biowaste Compost ...... 49
Table 4.10 Pearson’s Correlations Between Heavy Metals in Green Waste Compost50
Table 4.11 Pearson’s Correlations Between Heavy Metals In The Commercial
Organic Compost............................................................................................. 52
Table 4.12 Pearson’s Correlations Between Heavy Metals In The Commercial
Organic Compost............................................................................................. 53
Table 4.13 Pearson’s Correlations for sludge compost............................................. 53
Table 4.14. Summary of descriptive statistics for nutrient content and availability in
the biowaste and green waste compost samples................................................ 55

Lorraine Herity, M.Sc. Environmental Engineering, Queens University of Belfast xi
Table 4.15. t-Test: Two-Sample Assuming Unequal Variances Between the Means of TN ....................................................................................... 56
Table 4.16. t-Test: Two-Sample Assuming Unequal VariancesError! Bookmark not
defined.
Between Means of NO3-N ..........................................Error! Bookmark not defined.
Table 4.17. t-Test: Two-Sample Assuming Unequal VariancesError! Bookmark not
defined.
Between Means of NH4-N ..........................................Error! Bookmark not defined.
Table 4.18. Summary of descriptive statistics for other physical and chemical
parameters of the compost samples. ................................................................. 57
Table 4.19. ANOVA variance between means of C:N ratios for the different types of
compost studied. .............................................................................................. 58
Table 4.20. ANOVA variance between pH means for the different compost types
studied............................................................................................................. 58
Table 4.21 ANOVA variance between means of moisture content in the compost
samples............................................................................................................ 58
Table 4.22 ANOVA variance between means of organic matter content in the
compost samples.............................................................................................. 59
Table 4.23. t-Test: Two-Sample Assuming Unequal Variances between means ....... 59
of conductivity for the biowaste and green waste compost....................................... 59
Table 4.24. Self Heating Test Results for the Biowaste and Green Waste Compost . 60
Table 4.25. Oxygen Uptake Rate test results for the compost samples 66
Table 4.26. Summary of descriptive statistics for % cress
Germination test results ........................................................................................... 67
Table 4.27. Summary of descriptive statistics for foreign matter including impurities
and gravel and stone in the compost samples. .................................................. 61
Table 4.28. Summary of descriptive statistics for the presence of pathogens in the
compost samples.............................................................................................. 61
Table 4.29 Classification of biowaste compost samples according to the EU Biowaste
Directive.......................................................................................................... 62
Table 4.30 Classification of green waste compost samples according to the EU
Biowaste Directive .......................................................................................... 63

Lorraine Herity, M.Sc. Environmental Engineering, Queens University of Belfast xii
Table 5.1 The number and percentage of samples of each type of compost which met
the various standards as stipulated by the EPA and the EU Biowaste Directive 66
Table 5.2 Mean concentration of heavy metals in the different types of compost
analysed........................................................................................................... 67
Table 5.3 t-Test: Two-Sample Assuming Unequal Variances for unbiased means of
TP ................................................................................................................... 79
Table 5.4 Samples Exceeding the Statutory Limits Specified by.............................. 96
the EPA and EU Biowaste Directive........................................................................ 96
Table 5.5 Summary of the classification of samples of biowaste compost and green
waste compost according to the EU Biowaste Directive. .................................100

Chapter 1 Introduction
Lorraine Herity, M.Sc. Environmental Engineering, Queens University of Belfast 1
1.0 INTRODUCTION
With increased environmental legislation, higher costs of landfilling (Price, 2001),
growing amounts of biodegradable waste (MCOS 2003) and increasing environmental
awareness amongst, local authorities, environmental groups and individual people,
there is an imminent and growing need to find a cost effective and sustainable method
of disposing and recycling of biodegradable waste. Composting is the biological
degradation of organic material in the presence of oxygen to carbon dioxide, water
and a humic-like end product (Cabrera et al., 1999), which serves as a natural,
sustainable, safe and economical method of waste management (de Guardia et al.,
2002). Currently the growing interest in composting across Europe reflects this
(Favoino, 2000).
The main drivers for composting at a European and National level are the European
Union Directive on the Landfill of Waste (99/31/EC) which came into effect in April
1999 and the proposed Directive on the Biological Treatment of Biodegradable Waste
(Biowaste Directive) for which a 2nd draft of the working document was issued in
February 2001.
1.1 THE EU LANDFILL DIRECTIVE (99/31/EC)
The main aims of the EU Landfill Directive (99/31/EC) are to reduce the amount of
biodegradable waste sent to landfill and to decrease the amount of methane and
carbon dioxide (greenhouse gases) from being emitted from landfills to the
atmosphere. These greenhouse gases significantly contribute to global warming
(Price, 2001). The Directive sets statutory targets within a specific time frame for
reductions in the amount of biodegradable waste landfilled relative to a 1995 baseline
(Table 1.1). All member states are required to fully implement the directive.
Table 1.1 EU Landfill Directive targets for reducing biodegradable waste sent to landfill
Percentage Reduction
(With reference to 1995 levels)
Target Year
25% 2006
50% 2009
65% 2016
Source (Price, 2001).

Chapter 1 Introduction
Lorraine Herity, M.Sc. Environmental Engineering, Queens University of Belfast 2
1.2 THE EU BIOWASTE DIRECTIVE
The proposed EU Biowaste Directive aims to promote the biological treatment of
biowaste and to help achieve the targets set by the EU Landfill Directive (99/31/EC).
The most important provisions of the document is the need for member states to carry
out compost quality testing on specified parameters and the need to establish separate
collection schemes of biowaste in order to prevent the contamination of biowaste with
other polluting wastes, materials and substances (Commission of the European
Communities, 2001, DG ENV.A.2). Statutory limits for the presence of heavy metals,
micro organic pollutants and foreign matter in compost have being devised. It grades
compost and distinguishes it as Class I and Class II compost or stabilised biowaste,
based on established critical limits.
1.3 IRISH WASTE MANAGEMENT POLICY
Irish policy on waste management outlined in the document “Changing Our Ways” of
1998 recognises the need to comply with EU legislation and has set out targets to
reduce our reliance on landfill and also to reduce the amount of biodegradable waste
being disposed of in this way (van der Verf et al., 2002). Within the regional waste
management plans implemented in Ireland from 1998-1999, there are plans for
developing more composting facilities in addition to the existing sixteen facilities
currently in operation. Composting is therefore seen as having an important part to
play within integrated waste management planning in order to achieve the targets of
the EU Landfill Directive and to decrease Ireland’s over reliance on landfill in an
environmentally sustainable manner.
1.4 COMPOSTING OF BIODEGRADABLE WASTE
Apart from its role in waste management, composting provides an opportunity of
producing a very valuable end product which can be used in various market sectors.
Compost has many benefits and can be used in market sectors such as agriculture or
horticulture to improve soil physical and biological properties by acting as a soil
conditioner, as a supply of nutrients and as a disease suppressant (Zheljazkov and
Warman, 2003). Compost can also be used as a means of sequestering carbon in the
soil (Eunomia, 2001).

Chapter 1 Introduction
Lorraine Herity, M.Sc. Environmental Engineering, Queens University of Belfast 3
However, there is concern regarding the presence of organic and inorganic
contaminants, visual impurities and pathogens in compost. The main concern is the
presence of toxic heavy metals in the compost (Pinamonti et al., 1997). Nevertheless,
these can be controlled by ensuring a source-separated feedstock with little
contamination and strict control over the composting process (Zheljazkov and
Warman, 2003; Fricke and Vogtmann, 1992).
1.5 COMPOST QUALITY TESTING
Compost quality testing is necessary to determine the quality of the compost in order
to protect the environment and humans from any harmful substances it may contain,
to protect workers, to maintain the composting process and to verify compost
attributes (Anon (a), 1998). Results of compost quality testing provide the basis for
which recommendations can be made regarding suitable end uses for the product.
The three classes of compost; Class 1, Class II and stabilised biowaste designated by
the EU Biowaste Directive are classified according to certain statutory limits for
quality parameters which include heavy metals, impurities, gravel and stones and
micro organic pollutants such as PCB’s and PAH’s, details of which are given in
Annex III of the proposed Directive (see appendix 1). Micro-organic pollutants are
not examined in this study, as facilities did not test for their presence in compost.
The Biowaste Directive also places restrictions on certain classes of compost. Class I
compost can be used according to best agronomic practice without any restriction
whereas, Class II compost if spread on agricultural land must not exceed 30 tonnes
dry matter per hectare on a three-year average. Stabilised biowaste may only be used
in land applications, which are not used for food or fodder crop production and is
therefore most suitable for landfill restoration or as landfill cover (Commission of the
European Communities, 2001, DG ENV.A.2).
Certain market sectors such as the horticultural sector require compost of high quality
where there should be no possibility of compost posing threats to plant growth or
entering the food chain. The quality of compost is mainly determined by the type and
composition of input material and the biological process (Fricke and Vogtmann, 1992,
US EPA, 1994).

Chapter 1 Introduction
Lorraine Herity, M.Sc. Environmental Engineering, Queens University of Belfast 4
Currently the cost of compost quality testing deters some facility operators from
testing the product. However the EPA require that all composting facilities
composting over 5,000 tonnes per annum must have a waste licence and carry out
quality testing according to the specifications within the waste license. Quality testing
must be carried out on parameters such as heavy metals, maturity, foreign matter and
pathogens which are similar to those parameters identified in Annex III of the
proposed EU Biowaste Directive.
1.6 COMPOST STANDARDS
Investigations carried out in Europe show that quality and marketing of compost are
the most crucial issues facing the composting industry (Barth 2003). Compost
standards ensure the quality of the compost destined for the marketplace. There are
two types of standards: statutory standards and market driven standards. Statutory
standards focus more on environmental protection and implement the ‘precautionary
principle’. Market driven standards are not usually legalised, they are voluntary
standards, which relate to the attributes of the compost, which are required by a
certain sector of the compost market. Compost standards exist in European countries
which have well-developed composting systems such as Austria, Germany, Belgium,
the Netherlands, Luxembourg and Flanders (Hogg et al., 2002).
There are no compost standards in Ireland at the moment. Waste licences are the main
mechanism for controlling composting in Ireland (WRAP, 2002). The quality of
compost produced and the need for the introduction of a national compost standard
are the most pressing issues facing the composting industry at the moment. The
quality of Irish compost needs to be guaranteed so that markets can be developed and
that compost can be marketed as a quality product instead of a waste derived product.
The introduction of a compost standard will also instil confidence in the segments of
the market for which it is destined (Cré - Composting Association of Ireland Teo,
2003).
1.7 AIMS AND OBJECTIVES
The main aims of the research are:
• To collate available data on compost quality currently produced at composting
facilities in Ireland.

Chapter 1 Introduction
Lorraine Herity, M.Sc. Environmental Engineering, Queens University of Belfast 5
• To compare the quality of compost to quality specifications stipulated in the EU
Biowaste Directive and EPA stipulations for heavy metal content of compost.
• To compare the quality of compost produced in Ireland to compost from other
countries.
• To use statistical analysis to see if there are any correlations between heavy metals
in the compost.
• To examine the nutrient content of compost and other quality parameters and
attempt to link this to its suitability for use in certain sectors such as agriculture
and horticulture.
• To compare quality of compost produced from different feedstock.
The objectives of the study is to collect information which will be useful in providing:
• A benchmark against which Irish site operators can compare their results.
• A reference enabling Irish compost quality to be compared to compost from other
countries.
• Confidence building measures in the use of compost in sectors such as agriculture
and horticulture.
• Solid data, which can be used by Cré Teo to draw up compost quality standards
for Ireland.
• Information on any significant correlations between the occurrences of heavy
metals in the compost which may reduce the amount of testing required and in
turn decrease the cost of compost quality testing.
• Baseline information that would be useful to Teagasc and the Department of
Agriculture in deciding the typical nutrient content and guidelines for agricultural
use of the compost and in preparation of a Code of Good Agricultural Practice.

Chapter 2 Literature Review
Lorraine Herity, M.Sc. Environmental Engineering, Queens University of Belfast 6
2.0 LITERATURE REVIEW
2.1 LOCATION OF COMPOSTING FACILITIES IN IRELAND
There are currently sixteen composting facilities in operation in the Republic of
Ireland (Fig 2.1). Some of these are managed by local authorities through their own
activities or through the use of contracted waste processors. Others are managed
directly by private waste disposal companies.
2.2 REVIEW OF COMPOSTING FACILITIES
From the map in figure 2.1, it is clear that there is a wide range of composting
facilities utilising different feedstock, employing different types of composting
technology and with different composting capacities.
2.2.1 Origins Of Feedstock
Materials most commonly composted were found to be biowaste, green waste,
commercial organics and sludge. Most biowaste received at composting facilities in
Ireland is source segregated household waste. Green waste is usually supplied to
composting facilities by local corporation park departments, landscape contractors,
waste disposal contractors and the general public. Commercial organic feedstock is
collected from food manufacturers, supermarkets and restaurants for composting. The
feedstock for sludge composting consists of industrial sludge collected from industry.
Sludge arising from municipal wastewater treatment plants is also composted in
Ireland, however because no quality test results were available it is not examined in
this study. Some composting facilities in Ireland also collect organic material from
commercial food manufacturers, supermarkets and restaurants for composting.

Chapter 2 Literature Review
Lorraine Herity, M.Sc. Environmental Engineering, Queens University of Belfast 7
Fig 2.1 Location and Details of Composting Facilities in Ireland
2.2.2 Composting Technology Employed In Ireland
Windrows remain the most preferred form of composting technology used in Ireland
followed by in-vessel and aerated systems (Fig 2.2, see also appendix 2). This is due
to a low initial capital investment, low maintenance costs and also because windrows
are suitable and are commonly used in the composting of green waste due to its

Chapter 2 Literature Review
Lorraine Herity, M.Sc. Environmental Engineering, Queens University of Belfast 8
homogenous nature (Brinton and Brinton, 1992). Some facilities also use a mixture of
composting technologies deepening on what feedstock they compost.
02468
10121416
Windrow In-vessel Aerated System
Composting Technology
Num
ber
of F
acili
ties
Fig 2.2 Graph showing the number of facilities employing different composting
technologies.
2.2.3 Available Capacity And Actual Quantity Of Materials Composted In
Ireland
The total available capacity for composting of material in Ireland at present is 71,100
tonnes per annum, while the actual quantity of material composted annually was
found to be approximately 61,950 tonnes per annum. Figure 2.3 shows the available
capacity and the actual quantity of the various feedstock composted annually.
05,000
10,00015,00020,00025,00030,00035,000
Biowas
te
Green
Was
te
Sludge
Commer
cial O
rga...
Feedstock
Caa
paci
ty a
nd Q
uant
ity
(ton
nes/
annu
m)
Capacity Quantity
Fig 2.3 Graph of the quantity of different feedstock composted in Ireland against
actual available capacity (tonnes/annum).

Chapter 2 Literature Review
Lorraine Herity, M.Sc. Environmental Engineering, Queens University of Belfast 9
2.3 PROCESSING FACTORS GOVERNING COMPOST QUALITY
Many factors have an influence on the quality of the compost produced, which
include the type of feedstock utilised, the degree of source separation, the amount of
pre-processing and post-processing the biological process and the technology
employed and finally the maturation stage (Richard, 1992).
2.3.1 Type Of Feedstock Utilised
The type of feedstock used in the composting process, whether it is green waste,
biowaste, commercial organics or sludge tends to have an effect on the quality of
compost produced. Some feedstocks contain significant amounts of foreign material
and contaminants such as heavy metals and are not suitable for composting (Brinton
and Brinton, 1992) while others with less contaminants are more suitable for aerobic
composting. Green waste has good structure and low to medium moisture content
which is suitable for composting, whereas other materials such as biowaste may need
to be mixed and bulking agents added to ensure sufficient porosity and moisture
content of the feedstock. Otherwise, the composting process will not proceed
efficiently, which could have an effect on the quality of the compost produced due to
anaerobic conditions occurring (Kepp et al., 2000; Canet and Pomares, 1994).
2.3.1.1 Green Waste
Green wastes are homogenous in nature and contain less nutrients, contaminants and
heavy metals compared to other feedstock. Green waste feedstock can therefore
produce good quality compost with little contamination. Composted green wastes are
not rich in nutrients, which limit their use as fertiliser. However, this lack of nutrients
permits compost to be beneficially used in horticulture for the potting of young plants
or as mulch (US EPA, 1994).
2.3.1.2 Biowaste
Biowaste consists of the source separated portion of organics from household waste.
It has been estimated that biowaste constitutes between 35-40% of municipal waste
(Eunomia, 2001). Burnley et al. (1999) carried out research into the composition and
biodegradability of municipal waste, which is outlined in table 2.1. He found that
biowaste made up 62.2% of the total municipal waste stream. Kepp et al. (2000)
studied the composition of biowaste in Holland, which showed variations in the

Chapter 2 Literature Review
Lorraine Herity, M.Sc. Environmental Engineering, Queens University of Belfast 10
composition for different months. The green waste fraction increased in August due to
the collection of more green leaves during summer time. Various studies have shown
that source separated biowaste also contains less contaminants in comparison to
mixed municipal solid waste (Favoino, 2000; Brinton and Brinton, 1992).
Table 2.1 Compositions and Biodegradability of Municipal Waste
Source: (Burnley et al. 1999)
2.3.1.3 Sludge
Sludge, especially industrial sludge, may contain potentially high concentrations of
heavy metals and organic micro-pollutants (Lazzari et al., 2000). Sludge has been
found to also contain large amounts of pathogens which need to be fully destroyed in
the composting process to protect human health (Hoyos et al., 2002).
2.3.2 Source Segregation
Segregation of biowaste at source can help to reduce the amount of contaminants such
as plastic, glass and heavy metals in the feedstock material and hence produce a
finished compost product of high quality. A doctoral thesis undertaken in Germany
into quality of compost from different source materials showed that source separated
biowaste compost contained on average a quarter of the heavy metal content of mixed
MSW composts (Brinton and Brinton, 1992). Oosthnoek and Smit (1987) also looked
at the effect that different separation and pre-processing techniques had on the
concentration of heavy metals in the finished product. They found that heavy metal
concentrations were lowest in compost samples that had undergone the highest degree
of source segregation (Table 2.2). The proposed EU Biowaste Directive has

Chapter 2 Literature Review
Lorraine Herity, M.Sc. Environmental Engineering, Queens University of Belfast 11
acknowledged the effect source segregation can have on the quality of compost
produced and thus one of the most important provisions of the directive is the need for
member states to establish separate collection schemes of biowaste. However, even
after source segregation, some contaminants will remain in the feedstock and
ultimately in the compost due to their ubiquitous nature in the environment (Brinton
and Brinton, 1992).
Table 2.2 Effects of different segregation and pre-processing techniques on the
concentration of heavy metals in compost
Processing method (mg/kg, dry weight)
Metal A B C D
Zinc 1,700 800 520 230
Copper 600 270 100 50
Chromium 180 70 40 30
Nickel 110
Cadmium 7 2.5 1.8 1.0
A. Mixed household waste was composted without preparation. The
process took approximately 12 months. After composting, the product
was screened and inerts were removed.
B. The collected household waste was separated into two fractions.
The process took between two and-a-half and five months for the
composting process to be completed.
C. The collected waste was shredded, and then processed, resulting in
a fraction to be composted. This fraction was free of most inerts, such
as glass and plastics.
D. Wastes were separated at the source. The organic components were
collected separately at households. All necessary steps were taken to
insure that components containing heavy metals did not enter the
organic components.
Source: Oosthnoek and Smit, 1987

Chapter 2 Literature Review
Lorraine Herity, M.Sc. Environmental Engineering, Queens University of Belfast 12
2.3.3 Seasonal Variations In Feedstock
Research in Germany also found that the concentration of heavy metals in compost
was highest during the winter months, especially December and January. They found
that this was often attributable to Christmas wrapping paper and tree decorations
found in the waste feedstock. This extra paper may result in a high C:N ratio of the
feedstock (Brinton and Brinton, 1992). In the summer season with increased grass
trimmings the C:N ratio of the feedstock may decrease. Hence, seasonal variations in
the feedstock are an important factor for facility operators to consider and that
adjustments are made to the composting process accordingly (The Composting
Council of Canada (b), 2000). Identifying seasonal variations in feedstock or in the
final composted material is beyond the scope of this study.
2.3.4 Pre-processing And Post-Processing Methods
Pre-processing and post-processing of feedstock may have a significant impact on the
quality of the compost produced and the speed at which the process proceeds (US
EPA, 1994). Pre-processing usually involves sorting feedstock material, reducing
particle size and homogenisation and a variety of feedstock treatments prior to
initiating the biological process.
Incoming feedstock material should be sorted and non-compostable material such as
plastics, glass and metals removed to reduce or eliminate their presence in the finished
product. The amount of sorting depends on the feedstock, the quality of the compost
required and the technology involved. Biowaste may require more sorting due to a
greater risk of a contaminated feedstock compared to green waste (Richard, 1992).
Screens, manual separation, magnetic based separation, eddy current separators, air
classifiers, wet separation techniques and ballistic separators can all be used to
separate out non-compostables from the feedstock. Separation and size reduction
technologies are outlined in appendix 3.
After separation, the particle size of the material may be reduced to increase the
surface area to volume ratio of the feedstock. This will increase the surface area on
which micro-organisms can act which will in turn, increase the rate of decomposition,
facilitate effective mixing and produce a more uniform product (The Composting
Council of Canada (a), 2000). However, a balance must be achieved between

Chapter 2 Literature Review
Lorraine Herity, M.Sc. Environmental Engineering, Queens University of Belfast 13
reducing particle size and maintaining oxygen distribution to maximise the efficiency
of the composting process (Richard, 1991).
Feedstock treatments may include mixing of the feedstock or the addition of bulking
agents to feedstock such as biowaste as discussed in section 2.3.1.
Post-processing is optional and is usually carried out to increase the quality of the
compost as specified by the end-users or by market requirements. Post-processing
may involve the compost undergoing further screening to remove any foreign material
and size reduction to produce a compost of uniform size. At this stage, testing may
also be carried out to check for the quality of the compost (EPA, 1994) and will be
discussed in detail further on.
2.3.5 Biological Processing
Once feedstock has undergone pre-processing it is then ready to begin biological
processing using a variety of composting technologies. The choice of technology
chosen depends on the feedstock, capital and land availability, the desired speed of
the process and odour and leachate requirements. The quality of the end product
required is also an important factor to consider.
On comparing composting technologies aerated static piles offer more control over
the composting process than windrows, while in-vessel systems provide a composting
process, which is easier to control and regulate than an aerated static pile system.
Richard (1992) argues that it is nearly impossible to evaluate a composting system
based on the fact that systems designs are almost always unique with evolving
technologies and modifications to meet certain requirements. He states that it is the
pre-processing methods of segregation, size reduction and homogenisation and
mixing that have the biggest influence on the quality of the compost produced.
The key parameters which are important to consider during the process are: the C:N
ratio, moisture content, oxygen availability and temperature (de Guardia et al., 2002).
The recommended C:N ratio of feedstock has been reported to be 25:1 to 40:1
(Richard, 1992) but this varies depending on the substrate (Tuomela et al., 2000).
Adequate moisture is essential for microbial activity and as a source of oxygen

Chapter 2 Literature Review
Lorraine Herity, M.Sc. Environmental Engineering, Queens University of Belfast 14
supply. If moisture levels are too low microbial activity will decrease. On the other
hand, too much moisture can lead to a lack of aeration and leaching of nutrients with
anaerobic conditions occurring. Richard (1992) recommends a minimum moisture
content of around 50 to 55% for composting of biowaste. Oxygen and temperature
both work together in the composting process, in that, both fluctuate in response to
microbial activity, which decreases oxygen availability and increases temperature.
Oxygen concentrations of compost heaps must be at least 16-17% (Richard, 1992).
The proposed EU Biowaste Directive specifies a temperature of >55°C for two weeks
or >65°C for one week if windrow composting is employed. During in-vessel
composting the temperature should be >60°C to ensure that sanitary compost is
produced at the end of the process (Commission of the European Communities, 2001,
DG ENV.A.2).
At the end of the biological stage stable compost should be produced which refers to
the state of organic matter decomposition. A stable product is important so that
nitrogen immobilisation does not occur in the soil and that a consistent volume and
porosity of the compost is maintained (US Composting Council, 2003).
2.3.6 The Maturation Stage
Once all the material has been composted and is stable it should be allowed to mature.
During the maturation stage, remaining micro-organisms utilise available nutrients
and microbial activity diminishes as nutrients are depleted (Biey et al., 2000). The
maturation stage is relatively long taking between 3 and 6 months. As a result, it can
demand a large storage area, which can be problematic for facility operators. It is
important to maintain aerobic conditions during maturation to avoid problematic
anaerobic odours being produced and to maximise the maturation rate. Facility
operators who stack piles of compost too high (greater than 5m) during the maturation
stage to minimise the amount of space required, limit the amount of oxygen
circulating at the bottom of the pile. If this happens there is a risk of anaerobic
conditions occurring and bad smells being given off (Cabanas-Vargas and Stentiford,
2003). Fully mature compost should have an unpleasant smell and a C:N ratio less
than 20 (Biey et al., 2000).

Chapter 2 Literature Review
Lorraine Herity, M.Sc. Environmental Engineering, Queens University of Belfast 15
2.3.7 Storage
Storage practices can have an effect on compost quality. The most common storage
problem is inadequate drainage, which may result in the compost becoming overly
saturated (EPA, 1994). Rynk et al., (1992) states that if piles of compost are not kept
dry and aerated, anaerobic conditions may occur which could result in odours been
given off and the formation of harmful anaerobic by-products.
2.4 EVALUATING COMPOST QUALITY IN RELATION TO PHYSICAL,
CHEMICAL AND BIOLOGICAL ATTRIBUTES OF THE COMPOST.
Various parameters, which may have a significant influence on compost quality, are
discussed below.
2.4.1 pH
The pH value of compost is important, since applying compost to soil may alter the
soil pH and therefore have an effect on the availability of nutrients to plants. Bord na
Mona (2003) recommends a range of pH from 6.9-8.3. Efforts will need to be made to
lower the pH of compost if it exceeds this range. Lowering the pH will also help
reduce ammonia volatilisation and reduce odours (Woods End Research Laboratory,
1998).
2.4.2 Organic Matter
Organic matter is an important ingredient in all soils and has an important role to play
in maintaining soil structure, nutrient availability and water holding capacity. It is
usually expressed as a percentage of dry weight. There is no absolute value of organic
matter, which is ideal for compost. It may range from 30-70% (US Composting
Council, 2003). Under the EPA waste-licencing system it is required that compost
contain at least 30% organic matter on a dry weight basis.
2.4.3 Moisture Content
Moisture content is a measure of the amount of moisture present in a compost sample
and is expressed as a percentage of fresh weight. Compost with low moisture content
(<35%) may be too dry and dusty and irritating when handled. Compost with too high
a moisture content (>65%) can become too clumpy and difficult too transport which
will limit its chances of being marketed as a quality product (US Composting Council,

Chapter 2 Literature Review
Lorraine Herity, M.Sc. Environmental Engineering, Queens University of Belfast 16
2003). Consumers will not want to pay for a product with high water content. Biotreat
(2003) recommend a moisture range of 45-65%, fresh weight.
2.4.4 Bulk Density
The bulk density of compost is defined as its weight per unit volume and must be
maintained within an optimal range, as this is critical in achieving the required water
content and to maintain the temperature of the composting process (British Columbia
Ministry for Agriculture and Food, 1996). Bord na Mona measures the dry bulk
density of compost after drying the sample at 105°C for twelve hours and
recommends a range of 120-369 g/L.
2.4.5 Conductivity
Conductivity is the measure of a solutions ability to carry electrical charge, that is, a
measure of the soluble salt content of compost. The salt content of compost is due to
the presence of sodium, chloride, potassium, nitrate, sulphate and ammonia salts
(Brinton, 2003). Some soluble salts may be detrimental to plants whereas, other plant
nutrients supplied to plants exist in salt form and are essential for plant growth.
Usually compost does not contain quantities of soluble salts which cause concern in
landscape applications. Though excessive amounts of soluble salts in compost used in
growing media or applied to the land may inhibit crop growth and affect crop yield
(Barker, 1997). Bord na Mona (2003) report that the recommended range for
conductivity in compost is between 2,000-6,000 µS/cm.
2.4.6 C:N Ratio
The C:N ratio is not a test within itself, it is rather a test for organically bound carbon
and for total nitrogen. The ratio of these two can be used to provide an indication of
the rate of decomposition of the feedstock and to determine when ripeness has been
reached (Anon, 1998). Therefore, C:N ratios should be used in conjunction with some
other relevant parameter for testing compost maturity (Wood End Research
Laboratory, 1998). The EPA acknowledges this and specifies within a waste licence
that the C:N ratio of compost must be below 25.
2.4.7 Nutrient Content Of Compost
Compost contains macro and micronutrients, which are required for plant growth
(Zethner et al., 2000). Nitrogen, phosphorous and potassium are the nutrients, which

Chapter 2 Literature Review
Lorraine Herity, M.Sc. Environmental Engineering, Queens University of Belfast 17
are utilised, in the greatest quantities by plants. Knowledge of the nutrient content of
compost is important because the nutrient content of compost can vary widely and
also because it allows facility operators to determine an appropriate end use for the
compost. The agricultural market demands compost of high nutrient content, whereas
compost low in nutrients is well suited for the landscaping sector and for use as mulch
(Zethner et al., 2000). In general, nutrients are organically bound within compost and
are slowly released over a period of time as a result of microbial activity. This ensures
a continuous supply of nutrients to the plant (US Composting Council, 2003). Total
nutrient content is usually expressed as a percentage on a dry weight basis. Available
plant nutrients are expressed as mg/L on a fresh weight basis. In order words,
available nutrient content is measured as the sampled is received (Bord na Mona,
2003). Calcium and magnesium are also usually tested for.
2.4.7.1 Nitrogen
Nitrogen is an essential nutrient for successful plant production. The concentration
and availability of nitrogen in compost is a very important factor to be assessed when
considering its agronomic value. Knowledge of the concentration of nitrogen in
compost is also important due to concern of groundwater pollution from excess NO3-
N (Iglesias- Jiménez, 2001).
Typically more than 90% of nitrogen in compost is organically bound and the most
available form to plants is when nitrogen is converted into an inorganic form and
exists as NO3-N (Fricke and Vogtmann, 1994). The amount of total nitrogen and plant
available nitrogen depends on the composition of the waste material and the
composting process. Körner and Stegmann (2003) state that certain parameters such
as pH, temperature and moisture significantly influence the rate of nitrogen turnover
from proteins in biowaste to inorganic and organic forms. They found that the highest
concentration of ammonia could be measured during the thermophilic stage while
mature compost contains more nitrogen in the inorganic form as NO3-N. Hence, by
regulating the composting process, compost with a more predictable nitrate content
can be produced.

Chapter 2 Literature Review
Lorraine Herity, M.Sc. Environmental Engineering, Queens University of Belfast 18
2.4.7.2 Total Nitrogen (TN)
To report compost as having fertilising capabilities and for it to be used in agriculture
the TN content must be over 1%, dry wt (Barker, 1997). If compost contains TN of
less than 1%, supplemental nitrogen fertiliser will be required if the compost is to be
used as a soil improver or in potting media. If the TN in compost is approximately
0.6% or less there is a chance that nitrogen immobilisation will occur (Fig 2.4). Thus,
compost with low TN levels is better used as mulch (Barker, 1997). The typical range
of TN in compost is 1.0-3.0%, dry wt. Compost over 3% TN is usually found to be
immature and ammoniacal (Barker, 1997).
>1%TN Compost Mineralisation
<1%TN Immobilisation Fig 2.4. Mineralisation – Immobilisation turnover in relation to TN in compost
Source: Barker, 1997
2.4.7.3 Available Nitrogen as NO3-N
This is the form of nitrogen which is most available to plants. Bord na Mona (2003)
recommends a limit of 240 mg/L of NO3-N for compost, as values over this are
unnecessarily high and perhaps even excessive for all crops. Environment Agency
(2000) state that compost to be used in horticulture or agriculture is deficient in NO3-
N if it contains less than 15 mg/L. Below is the UK Environment Agency’s
interpretation of concentrations of available NO3-N in compost when used in growing
media. (Table 2.3).

Chapter 2 Literature Review
Lorraine Herity, M.Sc. Environmental Engineering, Queens University of Belfast 19
Table 2.3 Interpretation of available Nitrogen as NO3-N in compost
NO3-N (mg/L) Interpretation
0-15 Deficient
16-25 Low
26-50 Satisfactory for seedling and nursery stock
51-80 Satisfactory for pot plants and bedding plants
81-130
131-200
Satisfactory for tomatoes, cucumbers and carnations
201-300 Unnecessarily high for all crops
Over 300 Excessive
Source: Environment Agency, 2000
2.4.7.4 Available Nitrogen as NH4-N
Highest concentrations of NH4-N are produced in the first few weeks of composting.
In fact, the ratio of organic and inorganic forms of nitrogen has been used as a
maturity index. At the end of the process a concentration of NO3-N greater than the
concentration of NH4-N would indicate that the process took place under adequate
conditions of aeration and that mature compost was produced (Sánchez-Monederoet
al., 2001).
Levels of NH4-N over 200 mg/L in compost are very high for use in growing media as
high concentrations of. NH4-N in compost may impede seed germination and damage
seedlings and soil fauna (Environment Agency, 2000, Barker 1997). Levels of 0-20
mg/L are considered as low to normal for use in growing media. The UK
Environment Agency’s interpretation of NH4-N concentration in compost is given in
Table 2.4.
Table 2.4 Interpretation of available Nitrogen as NH4-N in compost
NH4-N (mg/L) Interpretation
0-20 Low, normal for composts in use
21-50 Normal
51-100 Normal values for unused composts
101-150 Normal values for unused, high nutrient composts
151-200 High may harm young plants
Over 200 Very high
Source: Environment Agency, 2000

Chapter 2 Literature Review
Lorraine Herity, M.Sc. Environmental Engineering, Queens University of Belfast 20
2.4.7.5 Phosphorous
Phosphorous is also an important nutrient for plant growth. Total phosphorous (TP) is
usually expressed in terms of percentage concentration per dry weight. Available
phosphorus is usually expressed as PO4-P in mg/L on a fresh weight basis (Bord na
Mona, 2003). According to Bord na Mona (2003) the range of TP is usually between
0.4 - 1.1%, dry wt for biowaste and green waste compost and the typical range of
PO4-P is between 50-120 mg/L, fresh wt.
2.4.7.6 Potassium
Potassium is a very abundant nutrient in plants. Potassium in its available form in
compost exists as K2O. The amount of potassium in compost depends on the
feedstock but also on the composting process (Barker, 1997). Compost usually does
not contain a great concentration of potassium because due to its high water solubility
it can be easily leached from the feedstock during the composting process. This may
occur especially in uncovered windrows (Fricke and Vogymann, 1994). Bord na
Mona (2003) state that the typical range of total potassium (TP) in biowaste and green
waste compost is between 0.6-1.7%, dry wt and that the typical range of available
potassium in this compost is between 620-2280 mg/L, fresh wt.
2.4.7.7 Calcium and Magnesium
Calcium and magnesium act as bases when they exist as oxides, hydroxides and
carbonates. Compost containing these bases, when applied to soil, may counteract soil
acidification and vary pH levels making soil nutrients more available to plants (Fricke
and Vogtmann, 1992). Compost can also be used to replace peat and be of much
benefit in container production of crops, as peat does not contain adequate calcium.
The typical range of calcium in compost is between 1.0-4.0%, dry wt and the typical
range of magnesium is 0.2-0.4%, dry wt.
2.4.8 Heavy Metals
Depending on the feedstock, heavy metals (copper, zinc, lead, cadmium, mercury,
nickel, chromium) and toxic elements (selenium, arsenic, molybdenum) may be found
at elevated levels in compost and thus create an environmental concern essentially
related to crop quality and human health (Zheljazkov and Warman, 2003; Hassen et
al., 2001). As the composting process proceeds organic matter content decreases

Chapter 2 Literature Review
Lorraine Herity, M.Sc. Environmental Engineering, Queens University of Belfast 21
while the concentration of heavy metals remains the same (except for water soluble
metals) thus increasing their concentration in compost. As of yet, there is no
consensus amongst researchers regarding the exact uptake of heavy metals by plants,
the accumulation of heavy metals in soils and the consequences once they enter the
food chain. However, it would appear that metal uptake depends on the soil type, the
plant species and the quality of the compost applied to the soil (Eunomia, 2001). This
concern has lead to the establishment of statutory limits for heavy metal
concentrations in compost by the EPA and EU Biowaste Directive which are given in
Annex III of the Directive (see appendix 1). The concentration of these metals in
compost is reported in mg/Kg on a dry weight basis by laboratories in Ireland. The
EU Biowaste Directive stipulates that heavy metal concentrations must be reported in
mg/Kg normalised to an organic matter of 30% because approximately 30% of
organic matter in the feedstock is lost during the composting process concentrating
the amount of heavy metals in the compost (Rogalski et al., 2002).
2.4.9 Maturity
Maturity is a measure of the degree of completeness of the composting process.
Maturity cannot be described by one single property, instead maturity is described by
examining two or more compost characteristics (US Composting Council, 2003).
It is important that compost is allow to fully mature so that it can be bagged and sold
to the horticultural market. Immature compost will reheat and spoil if it stored for a
period of time. Immature composts with high C:N ratios can also cause damage to
plants when used in horticulture by tying up available nutrients in the soil (Biey et al.,
2000) and by depriving plants of oxygen as shown in Figure 2.5 (Brinton, 2001). On
the left side of the photograph are the roots of a plant from immature compost, beside
it are plant roots from semi-mature compost and next to those are plant roots from
mature compost. To the far right are the roots from the control plant. The damage
done to the roots of the plants from the immature compost is quite evident.

Chapter 2 Literature Review
Lorraine Herity, M.Sc. Environmental Engineering, Queens University of Belfast 22
Fig 2.5 Plant root damage due to reduced oxygen supply from application of uncured
compost.
Source: Brinton, 2001
The damage was done to the roots because compost with too low a C:N ratio can
cause phytotoxins to be released which can burn plant roots and thereby inhibit plant
growth. It is also important to allow compost to mature due to the fact that, as
compost matures over time, the solubility of heavy metals decreases with a
subsequent decrease in bioavailability in the environment. The metals become bound
to humic compounds, metal oxides and phosphates in the compost when mixed with
soil (Chancy 1991).
Two maturity tests most used by Bord na Mona and Biotreat are the self heating test
and the oxygen uptake rate test. The Cress tests may also be used to determine
maturity.
2.4.9.1 Self Heating Test
The self heating test is one test which can be used to measure maturity of compost.
The FCQAO (Federal Compost Quality Assurance Organisation) documents a system
whereby composts are assigned an index value which range from I to V, based on

Chapter 2 Literature Review
Lorraine Herity, M.Sc. Environmental Engineering, Queens University of Belfast 23
levels of maturity, with level V being the most mature and level I the least mature.
The EPA states that compost must not reheat upon standing too greater than 200C
above ambient temperatures. That is, compost must have a maturity index value of V
or IV.
Table 2.5 Table showing the classes of stability for the Self Heating Test
Max. Temp Rise Over
Ambient
Class of
Stability
Description of Stability Self Heating
Potential
Type
0-100 C V Mature to very mature
compost
Very Low Finished
10-200 C IV Curing compost Low Curing
20-300 C III Moderately active,
immature
Medium Active
Compost
30-400 C II Very active, unstable
compost
Med-High Active
Compost
40-500C I Fresh raw compost High Raw
Feedstock
2.4.9.2 Oxygen Uptake Rate
Respiration can be used as an indicator of process performance and on product
stability The Specific Oxygen Uptake Rate (SOUR) test measures the maximum rate
of oxygen consumption in a water-compost suspension at 30°C. The proposed EU
Biowaste Directive specify that the upper limit for oxygen uptake is 1000 mg O2/kg
volatile solids per hour The EPA however specify that the oxygen uptake rate must be
less than 150 mg O2/kg volatile solids per hour which has in practice been very
difficult to achieve (McKinley, 2003).
2.4.9.3 Cress Germination Test
The Cress Germination test is recognised by the EPA as another method of
determining compost maturity. The cress test is a test to measure percentage seed
emergence and relative seedling vigour (US Composting Council, 2003). Under the
requirements of a waste licence, germination of cress seeds in compost must be
greater than 90% of the germination rate of the control sample.

Chapter 2 Literature Review
Lorraine Herity, M.Sc. Environmental Engineering, Queens University of Belfast 24
2.4.10 Foreign Matter
2.4.10.1 Impurities
Impurities in compost consist of the presence of organic or inorganic material that is
not readily biodegradable such as plastic, glass and metals. Some of these materials
may not be of great concern when using compost in certain agricultural applications
or as a landfill cover. However, their presence can decrease the value of the compost
because they are of no benefit and are often aesthetically offensive (US Composting
Council, 2003). Thus, impurities in noticeable concentrations may especially, inhibit
the use of compost in horticulture and landscape gardening. The EU Biowaste
Directive specifies a limit of 0.5%, dry wt of impurities greater than 2mm in compost.
2.4.10.2 Gravel and Stones
Gravel and stones not removed from the feedstock during the screening process will
end up in the final product and again inhibit the use of compost in certain sectors as
above. The EU Biowaste Directive has stipulated a limit of 5%, dry wt of gravel and
stones greater than 5mm in compost.
2.4.11 Pathogens
Pathogens may be present in the feedstock in the form of enteric bacteria, viruses and
parasites. (Eunomia, 2001). Pathogens may come from faecal material, sanitary
tissues or food and / or may also be introduced during the composting process
(Eunomia, 2001). The composting process must be adequately controlled to eliminate
or reduce pathogens to a level that is below the threshold where the danger of
transmitting disease may occur (US Composting Council, 2003). Test results are
reported as most probable number (MPN) per gram of compost.
It is a requirement under the proposed EU Biowaste Directive to monitor for
pathogens such as faecal coliforms and salmonella. The EU Directive specifies that
the concentration of faecal coliforms must be below 1000 MPN/g and that there must
be no salmonella present in 50g of total solids.

Chapter 3 Methodology
Lorraine Herity, M.Sc. Environmental Engineering, Queens University of Belfast 25
3.0 METHODOLOGY
3.1 COMPOST QUALITY DATA COLLECTION
The EPA requires facilities composting over 5,000 tonnes of material per annum to
carry out compost quality testing. This is stipulated in a facilities’ waste license. A
letter was sent to facility managers of thirteen composting facilities, currently in
operation throughout Ireland, advising them of the research, and requesting them to
send the author results of any compost quality testing which they may have carried
out on the final product from current and previous years. A satisfactory response rate
of 92.3% was achieved. The author had to guarantee complete confidentiality to
facility managers regarding all information obtained.
Most of the compost quality testing was carried out by Bord na Mona Laboratories in
Kildare and Biotreat Laboratories based in Cork. The main quality parameters
analysed were the concentration of heavy metals, total nutrient and available nutrient
content, C:N ratios, moisture content, pH, conductivity, dry bulk density, self heating
test and oxygen uptake rate test for determining maturity, foreign matter and the
presence of faecal coliforms and salmonella.
Data on compost quality was also sought from other countries so that a comparison of
Irish compost quality and that of other countries could be made. Published data on
compost quality for Austria, Australia and Germany was sited. Raw data on compost
quality was obtained from the UK Composting Association.
3.2 ANALYSIS OF DATA
In total, 59 samples of compost quality test results were collected. Test results were
received for 32 samples of biowaste compost originating from six composting
facilities, 9 green waste compost samples originating from four composting facilities,
7 commercial organic compost samples from two sites and 11 sludge compost
samples all originating from the same facility.
Data was separated and stored in four different Excel spreadsheets using Microsoft
Excel 2000 (9.0.6926 sp-3) according to the type of feedstock composted. A scheme

Chapter 3 Methodology
Lorraine Herity, M.Sc. Environmental Engineering, Queens University of Belfast 26
based on letters to identify the type of compost and a mixture of numbers to identify
individual sites and letters again to identify samples from the same site was devised
due to the confidentiality clause. The letter B was used to represent biowaste compost,
G for green waste compost, C for commercial organic compost and S for sludge
compost.
For the most part, both laboratories used the same units for reporting results. Some
results were reported on a dry weight basis or a fresh weight basis. When samples
were tested as received, the results were subsequently reported on a fresh weigh basis.
The only difference in reporting between the laboratories was the units used for the
concentration of salmonella. The units were consequently changed by the author and
the results reported according to the specification in the EU Biowaste Directive
(MPN/50g of total solids). A copy of the style of reporting of compost quality test
results for both Laboratories is attached in appendix 4.
Descriptive statistical analysis using Microsoft Excel 2000 (9.0.6926 sp-3) computer
package was carried out on all parameters. Comparisons were made between the
means of all parameters and statutory limits specified by the EPA and the EU
Biowaste Directive for Class I and II compost and for stabilised biowaste to determine
the class of each compost sample and to see how many of the samples exceeded the
statutory limits. Where no statutory limits were in place for certain parameters, a
comparison was made between the calculated means and recommended ranges or
values for these parameters as reported in the literature.
A comparison was made between the mean concentrations of heavy metals in the Irish
biowaste and green waste compost to heavy metal concentration in similar types of
compost from countries such as Germany, Austria, Australia and the UK.
Pearson’s product-moment correlation coefficient, r, was calculated to see if there was
any correlations between heavy metals in the compost samples using Microsoft Excel
2000 computer package. Scatter graphs for used to illustrate the correlations and the
results tabulated. Values of r lie between -1 and +1. There is a strong relationship
between the two variables if the value of r is close to either –1 or +1 (Mead et al.,
1993).

Chapter 3 Methodology
Lorraine Herity, M.Sc. Environmental Engineering, Queens University of Belfast 27
To see if there was a difference between two means values for some parameters a t-
test for two samples assuming unequal variances was carried out. The means were
assumed unequal as it was thought that this was the most conservative approach and
the least likely to produce a Type 1 error, t-tests give a t value from which the
probability is calculated. The P-value gives the probability of the means being
significantly different. The degrees of freedom (df) are also given. By testing the
difference between the means the Null Hypothesis was tested. The Null Hypothesis
states that there is no significant difference between the means. So the hypothesis can
be accepted or rejected. A small P value (P<0.05) indicated that there was a
significant difference between the means. A large P value (>0.05) signified that there
was no significant difference between the means (Ludwig and Reynolds, 1988).
Analysis of variance (ANOVA) was carried out where more than two means were
compared. ANOVA determines whether there is any probability that there is a
significant difference between the means. Again the Null Hypothesis is tested and a
small P indicated that there was a significant difference and a large P-value indicated
that there was not a significant difference between the means (Ludwig and Reynolds,
1988).
Quality results for individual parameters were not available for all the compost
samples. In some cases there were only a very small amount of facilities that tested
for certain parameters.
3.3 SITE VISITS
Site visits were made to the following facilities throughout the study:
• The Sandy Road facility in Galway who compost source segregated biowaste.
• The McGill Environmental Systems (Ireland) composting facility in Cork who
compost industrial sludge.
• Natural World Products Recycling facility in Armagh, who compost green waste
and biowaste.
• A new composting facility in Carrowbrowne, Galway that is currently under
construction.

Chapter 3 Methodology
Lorraine Herity, M.Sc. Environmental Engineering, Queens University of Belfast 28
The site visits involved examining the feedstock, the different types of technology
employed, segregation and screening processes used and the quality and storage
practices of the final product, whilst in consultation with individual facility managers.
Interviews were conducted with site managers to discuss various composting issues
with emphasis on compost quality and market availability. Photographs were also
taken of the composting facilities using a digital camera (see appendix 5).

Chapter 4 Results
Lorraine Herity, M.Sc. Environmental Engineering, Queens University of Belfast 29
4.0 RESULTS
4.1 HEAVY METALS
4.1.1 Heavy Metal Content of Biowaste Compost
The concentration of heavy metals in the biowaste compost samples are given in table
4.1. The table shows the number of samples analysed for each metal the minimum,
maximum, median and mean concentration of the heavy metals and toxic elements
and also the standard deviation. The maximum number of samples analysed was 29,
which originated from six composting facilities. Graphs of the concentration of each
heavy metal in the individual samples can be found in appendix 5.
Table 4.1 Concentration of heavy metals in the biowaste compost
Parameters Units No.1 Min Max Median Mean SD 2
Copper mg/Kg
dm 29 2.5 124 37.2 47.5 35.1
Zinc mg/Kg
dm 29 5.2 361 158 147.8 118.3
Lead mg/Kg
dm 24 7 122 28.1 39.5 32.5
Cadmium mg/Kg
dm 29 0.2 1.02 0.5 0.6 0.3
Mercury mg/Kg
dm 29 0 2.7 0.2 0.4 0.6
Nickel mg/Kg
dm 24 1.9 68 17.5 18.7 16.2
Chromium mg/Kg
dm 24 2 135 13.9 18.7 27.7
Selenium mg/Kg
dm 12 0.5 1 0.6 0.7 0.2
Arsenic mg/Kg
dm 20 0.2 8.3 2.5 3.1 2.7
Molybdenum mg/Kg
dm 12 0.8 3.3 2.1 2.2 0.8 1 Number of samples tested 2 Standard Deviation

Chapter 4 Results
Lorraine Herity, M.Sc. Environmental Engineering, Queens University of Belfast 30
4.1.1.1 Comparison Of Heavy Metal Concentration In The Biowaste Compost
Versus The Critical Limits Specified By The EPA And The EU Biowaste
Directive
Below is a discussion on the comparison of concentration of heavy metals in the
biowaste compost compared to the critical limits stipulated by the EPA and the EU
Biowaste Directive (Table 4.2).
Table 4.2 Critical limits for heavy metals in compost specified by the EPA and EU
Biowaste Directive and the percentage of the biowaste compost samples exceeding
the limits
Parameters Units No.1 EPA CL 2
%
ExceedingThe CL
Class I CL 3
%
ExceedingThe CL
Class II CL 4
% Exceeding
The CL
Stabilised Biowaste5
% Exceeding
The CL
Copper mg/Kg
dm 29 100 6.9 100 6.9 150 0 600 0
Zinc mg/Kg
dm 29 350 3.5 200 34.5 400 0 1,500 0
Lead mg/Kg
dm 24 150 0 100 8.3 150 0 500 0
Cadmium mg/Kg
dm 29 1.5 0 0.7 37.9 1.5 0 5 0
Mercury mg/Kg
dm 29 1 13.8 0.5 24.1 1 13.8 5 0
Nickel mg/Kg
dm 24 50 8.3 50 8.3 75 0 150 0
Chromium mg/Kg
dm 24 100 4.2 100 4.2 150 0 600 0
Selenium mg/Kg
dm 12 2 0
N/A
N/A N/A
Arsenic mg/Kg
dm 20 15 0
N/A
N/A N/A
Molybdenum mg/Kg
dm 12 5 0
N/A
N/A N/A
1 Number of samples tested 2 Critical Limits for heavy metals specified by the Environmental Protection Agency in accordance with Waste Licensing under the Waste Management Act 1996. 3 Critical Limits for heavy metals proposed by the EU Biowaste Directive (Class I) 4 Critical Limits for heavy metals proposed by the EU Biowaste Directive (Class II) 5 Critical Limits for heavy metals proposed by the EU Biowaste Directive (for stabilised biowaste)
Copper
The mean concentration of copper in biowaste compost was found to be 47.5 mg/Kg,
which is well below the critical limits specified by the EPA and the EU Biowaste
Directive (Fig 4.1, a). Two (6.9%) of the biowaste samples analysed exceeded this

Chapter 4 Results
Lorraine Herity, M.Sc. Environmental Engineering, Queens University of Belfast 31
limit for EPA and Class I compost. No samples exceeded the limit for Class II
compost (Table 4.2).
Zinc
The mean concentration of zinc found in the biowaste compost was calculated to be
147.8 mg/Kg, dm which is below the critical limits specified by the EPA and the EU
Biowaste Directive for Class I and Class II compost (Fig 4.1, a). Only one (3.5%) of
the samples exceeding the EPA critical limit for zinc. Ten (34.5%) of the samples did
not meet Class I requirements. None of the samples exceeded the limit for Class II
compost. A high standard deviation for zinc was observed which was the highest for
all the metals tested in the biowaste compost (Table 4.1).
Lead
On a nationwide average, biowaste compost contains 39.5 mg/Kg, which is below the
critical limits for the EPA standard and Class I and II compost (Fig 4.1, a) No
biowaste compost samples exceeded the EPA requirement. Two (8.3%) of the
samples exceeded the critical limit for Class I compost and no samples exceeded the
limit for Class II compost (Table 4.2).
Cadmium
The mean concentration of cadmium in the biowaste compost was calculated to be 0.6
mg/Kg which is below the EPA requirement for compost and below the limit for
Class II compost, however it is only slightly below the critical limit of 0.7 mg/Kg
stipulated for Class I compost (Fig 4.1, b). No samples exceeded the limits for EPA
compost and Class II compost. Eleven (37.9%) of all the samples exceeded the limit
for Class I compost (Table 4.2).

Chapter 4 Results
Lorraine Herity, M.Sc. Environmental Engineering, Queens University of Belfast 32
(a)
050
100150200250300350400450
Cu Zn Pb Ni Cr
Heavy Metal
Con
cent
ratio
n (m
g'K
g, d
m)
Mean of Samples EPA Class I Class II
(b)
00.2
0.40.6
0.81
1.21.4
1.6
Cd Hg
Heavy Metal
Con
cent
ratio
n (m
g/K
g, d
m)
Mean of Samples EPA Class I Class II
Fig 4.1 (a and b). Graph of mean concentrations of heavy metals in Irish biowaste
compost compared to the critical limits specified by the EPA and the proposed
Biowaste Directive for Class I and II compost.
Mercury
The mean concentration of mercury in the biowaste compost samples was 0.4 mg/Kg,
which is below the critical limits examined (Fig 4.1, b). Four (13.8%) of the samples
exceeded the EPA and Class II limit. Seven (24.1%) of the samples exceeded the limit
for Class I compost. Samples B4a and B4b showed elevated levels of mercury in the
biowaste compost compared to the other samples (Fig 4.2). No explanation was

Chapter 4 Results
Lorraine Herity, M.Sc. Environmental Engineering, Queens University of Belfast 33
available for the high concentrations of mercury in samples B4a and B4b. All the
other samples at this site had relatively low concentrations of mercury compared to
samples B4a and B4b, which would suggest that perhaps an analytical error produced
these results and therefore biased the mean. According to the EU Biowaste Directive
these samples are classified as stabilised biowaste. If these two samples were ignored,
a mean concentration of 0.2mg/kg would have been calculated.
0
0.5
1
1.5
2
2.5
3
EPA
Class I
Class I
IB1aB1bB2aB2bB2cB3aB3bB4aB4bB4cB4dB4eB4f
B4gB4hB4iB4jB4kB4l
B4mB5B6aB6bB6cB6dB6eB6f
B6gB6h
Biowaste Samples (n=29)
Hg
(mg/
Kg,
dm
)
Fig 4.2. Graph of the concentration of Hg (mg/Kg) in the biowaste compost samples
Nickel
The mean concentration of 18.7 mg/Kg of nickel found in the biowaste compost
samples was below the critical limits specified by the EPA and the EU Biowaste
Directive (Fig 5.1, a). Two (8.3%) of the samples exceeded the EPA limit and the
limit for Class I compost. No samples exceeded the limit for Class II compost (Table
4.2). Sample B6a and B5 showed a high nickel concentration of 68 mg/Kg and 52.5
mg/Kg respectively (Fig 4.3) when compared to the mean of 18.7 mg/Kg.

Chapter 4 Results
Lorraine Herity, M.Sc. Environmental Engineering, Queens University of Belfast 34
0
10
20
30
40
50
60
70
80
EPA
Class I
Class I
IB1aB1bB2aB2bB2cB3aB3bB4aB4bB4cB4dB4e B4f
B4gB4h B4i B4jB4k B4l
B4m B5B6aB6bB6c
Biowaste Samples (n=29)
Ni (
mg/
Kg,
dm
)
Fig 4.3 Graph of the concentration of Ni in the biowaste compost samples
Chromium
The mean concentration of chromium in the biowaste samples was found to be 18.7
mg/Kg, which is below the critical limits specified by the two standards (Fig 4.4, a).
All the samples of biowaste compost tested were below the critical limits for the two
standards except for one sample, B5 which had a concentration of 135 mg/Kg (Fig
4.4) and therefore exceeded the limit for EPA and Class I compost.
0
20
40
60
80
100
120
140
160
EPA
Class I
Class I
IB1aB1bB2aB2bB2cB3aB3bB4aB4bB4cB4dB4eB4f
B4gB4h B4i B4jB4k B4l
B4m B5B6aB6bB6c
Biowaste Samples (n=24)
Cr
(mg/
Kg,
dm
)
Fig 4.4. Graph of the concentration of Cr (mg/Kg) in the biowaste compost samples

Chapter 4 Results
Lorraine Herity, M.Sc. Environmental Engineering, Queens University of Belfast 35
Other Trace Elements
The mean concentrations for selenium, arsenic and molybdenum were found to be 0.7
mg/Kg, 3.1 mg/Kg, and 2.2 mg/Kg respectively. All of these means in particular the
mean value for arsenic were below the limits specified by the EPA (Table 4.2 and Fig
4.5).
02468
10121416
Se Ar Mo
Trace Elements
Con
cent
ratio
n (m
g/K
g,
dm)
Mean of Samples EPA
Fig 4.5 Graph of mean concentrations of trace elements in Irish biowaste compared to
the critical limits specified by the EPA.
4.1.2 Heavy Metal Content of Green Waste Compost
The heavy metal content of the green waste compost analysed is given in table 4.3.
The table shows the number of samples analysed for each metal, the minimum,
maximum, median and the mean concentration of the heavy metals in the green waste
compost. Standard deviations from the mean concentrations are also given.
Altogether, eight samples of green waste compost from four different composting
facilities were analysed. Graphs of the concentration of each heavy metal in the
individual samples can be found in appendix 5.

Chapter 4 Results
Lorraine Herity, M.Sc. Environmental Engineering, Queens University of Belfast 36
Table 4.3. Concentration of heavy metals in the green waste compost
Parameters Units No.1 Min Max Median Mean SD 2
Copper mg/Kg
dm 8 1 62.7 35.5 33.3 18.8
Zinc mg/Kg
dm 8 12 301 128 140.1 85.7
Lead mg/Kg
dm 8 1 129 65.6 64 41.9
Cadmium mg/Kg
dm 8 0.5 1.2 1 0.9 0.3
Mercury mg/Kg
dm 8 0.1 0.3 0.3 0.2 0.1
Nickel mg/Kg
dm 8 1 53.1 10.5 15.5 16
Chromium mg/Kg
dm 8 1 148 13.7 31 48 1 Number of samples tested 2 Standard Deviation
4.1.2.1 Comparison Of Heavy Metal Concentration In The Green Waste
Compost Versus The Critical Limits Specified By The EPA And The EU
Biowaste Directive
Table 4.4 shows the critical limits specified for heavy metals by the EPA and the EU
Biowaste Directive for Class I and II compost and for stabilised biowaste. The
percentage of green waste compost samples exceeding the critical limits are also
given. Figure 4.6 (a and b) shows a graph of the mean of all the heavy metals in the
green waste compost compared to the critical limits stipulated by the two standards.
Table 4.4 Critical limits for heavy metals in compost and the percentage of green
waste compost samples exceeding the limits
Parameters Units No.1 EPA CL 2
% Exceeding
The CL
Class I CL 3
%
Exceeding The CL
Class II CL 4
%
ExceedingThe CL
Stabilised Biowaste5
% Exceeding
The CL
Copper mg/Kg
dm 8 100 0 100 0 150
0 600 0
Zinc mg/Kg
dm 8 350 0 200
12.5 400 0 1,500 0
Lead mg/Kg
dm 8 150 0 100
12.5 150 0 500 0
Cadmium mg/Kg
dm 8 1.5 0 0.7
62.5 1.5 0 5 0
Mercury mg/Kg
dm 8 1 0 0.5 0 1
0 5 0
Nickel mg/Kg
dm 8 50 12.5 50
12.5 75 0 150 0
Chromium mg/Kg
dm 8 100 12.5 100
12.5 150 0 600 0

Chapter 4 Results
Lorraine Herity, M.Sc. Environmental Engineering, Queens University of Belfast 37
1 Number of samples tested 2 Critical Limits for heavy metals specified by the Environmental Protection Agency in accordance with Waste Licensing under the Waste Management Act 1996. 3 Critical Limits for heavy metals proposed by the EU Biowaste Directive (Class I). 4 Critical Limits for heavy metals proposed by the EU Biowaste Directive (Class II). 5 Critical Limits for heavy metals proposed by the EU Biowaste Directive (for stabilised biowaste)
(a)
050
100150200250300350400450
Cu Zn Pb Ni Cr
Heavy Metal
Con
cent
ratio
n (m
g/K
g, d
m)
Mean of Samples EPA Class I Class II
(b)
00.20.40.60.8
11.21.41.6
Cd Hg
Heavy Metal
Con
cent
ratio
n (m
g/K
g, d
m)
Mean of Samples EPA Class I Class II
Fig 4.6 (a and b). Graph of mean concentrations of heavy metals in Irish green waste
compost compared to the critical limits specified by the EPA and the proposed
Biowaste Directive for Class I and II compost.
Copper
The mean concentration for copper in the green waste samples was calculated to be
33.3 mg/Kg. This is well below the critical limits specified by the two standards

Chapter 4 Results
Lorraine Herity, M.Sc. Environmental Engineering, Queens University of Belfast 38
(Table 4.4). The standard deviation of 18.8 was also quite low. None of the green
waste samples exceeded the critical limits for copper.
Zinc The mean concentration of Zinc was found to be 140.1 mg/Kg, which is below the
critical limits specified, by the EPA and the EU Biowaste Directive. No samples
exceeded the limits for the EPA or Class II compost, whereas one (12.5%) of the
samples exceeded the limits for Class I compost (Table 4.2).
Lead
The mean concentration of lead in the green waste compost was calculated to be 64
mg/Kg, which is below the critical limits specified by the two standards. No samples
exceeded the EPA or Class II compost limit for lead, with one (12.5%) of the samples
exceeding the limit for Class I compost (Table 4.4).
Cadmium
The mean concentration of cadmium was found to be 0.9 mg/Kg, which is below the
critical limits for EPA and Class II compost with none of the green waste compost
samples exceeding these limits. However, the mean concentration of cadmium and
five (62.5%) of the samples exceeded the critical limit for Class I compost
Mercury
The mean concentration of mercury in the green waste compost was calculated to be
0.23 mg/Kg, dm. A standard deviation of 0.10 was calculated with no samples
exceeding the limits for the two standards.
Nickel
The mean concentration of nickel was found to be 15.5 mg/Kg with one (12.5%) of
the samples exceeding the critical limits for EPA and Class I compost. No samples
exceeded the limit for Class II compost (Table 4.2). Sample G3 contained a
significantly higher level of nickel compared to the other samples as did sample B5
which originated from the same composting facility.

Chapter 4 Results
Lorraine Herity, M.Sc. Environmental Engineering, Queens University of Belfast 39
Chromium
The mean concentration of chromium in the green waste compost was found to be 31
mg/Kg, which is below the limits specified by the two standards. One (12.5%) of the
samples exceeded the critical limits for EPA and Class I compost whereas, none of
the samples exceeded the critical limit for Class II compost. Sample G3 also showed
elevated levels of chromium compared to the rest of the samples. (See graph in
appendix 5).
4.1.3 Heavy Metal Content of the Commercial Organic Compost
A summary of descriptive statistics for heavy metal concentrations in commercial
organic compost are given in table 4.5. The table shows the number of samples
analysed for each metal, the minimum, maximum, median and the mean concentration
of the heavy metals in the commercial organic compost. Standard deviations from the
mean are also given. Seven samples were available for analysis, which originated
from two separate composting facilities. Graphs of the concentration of each heavy
metal in the individual samples can be found in appendix 5.
Table 4.5. Concentration of heavy metals in the commercial organic compost
Parameters Units No.1 Min Max Median Mean SD 2
Copper mg/Kg
dm 7 20.8 2476 42 392.1 919.1
Zinc mg/Kg
dm 7 10.9 2707 120 476.3 984.7
Lead mg/Kg
dm 7 16 342 37 111.2 125.7
Cadmium mg/Kg
dm 7 0.2 1.6 0.5 0.8 0.5
Mercury mg/Kg
dm 7 0.1 0.3 0.1 0.1 0.1
Nickel mg/Kg
dm 7 2.7 49 9 15.4 17.1
Chromium mg/Kg
dm 7 0.1 116 1.2 19.8 42.7 1 Number of samples tested 2 Standard Deviation

Chapter 4 Results
Lorraine Herity, M.Sc. Environmental Engineering, Queens University of Belfast 40
4.1.3.1 Comparison of Heavy Metal Concentration in the Commercial Organic
Compost Versus the Critical Limits Specified by the EPA and the EU Biowaste
Directive
Table 4.6 shows the critical limits for heavy metals specified by the EPA and the EU
Biowaste Directive for Class I and II compost, for stabilised biowaste and the
percentage of commercial organic compost samples which exceeded the critical
limits. Figure 4.7 (a and b) shows a graph of the mean of all the heavy metals in the
commercial organic compost compared to the critical limits stipulated by the two
standards.
Table 4.6 Critical limits for heavy metals in compost and the percentage of
commercial organic compost samples exceeding the limits
Parameters Units No.1EPA CL 2
% Exceeding
The CL
Class I CL 3
%
ExceedingThe CL
Class II CL 4
%
Exceeding The CL
Stabilised Biowaste5
% Exceeding
The CL
Copper mg/Kg
dm 7 100 14.3 100 14.3 150 14.3 600 0
Zinc mg/Kg
dm 7 350 14.3 200 14.3 400 14.3 1,500 14.3
Lead mg/Kg
dm 7 150 28.6 100 42.9 150 28.6 500 0
Cadmium mg/Kg
dm 7 1.5 14.3 0.7 42.9 1.5 14.3 5 0
Mercury mg/Kg
dm 7 1 0 0.5 0 1 0 5 0
Nickel mg/Kg
dm 7 50 0 50 0 75 0 150 0
Chromium mg/Kg
dm 7 100 14.3 100 14.3 150 0 600 0
1 Number of samples tested 2 Critical Limits for heavy metals specified by the Environmental Protection Agency in accordance with Waste Licensing under the Waste Management Act 1996. 3 Critical Limits for heavy metals proposed by the EU Biowaste Directive (Class I) 4 Critical Limits for heavy metals proposed by the EU Biowaste Directive (Class II) 5 Critical Limits for heavy metals proposed by the EU Biowaste Directive (for stabilised biowaste)
(a)

Chapter 4 Results
Lorraine Herity, M.Sc. Environmental Engineering, Queens University of Belfast 41
0
100
200
300
400
500
600
Cu Zn Pb Ni Cr
Heavy Metal
Con
cnet
ratio
n (m
g/K
g, d
m)
Mean of Test Samlple EPA Class I Class II
(b)
00.20.40.60.8
11.21.41.6
Cd Hg
Heavy Metal
Con
cent
ratio
n (m
g/K
g, d
m)
Mean Of Samples EPA Class I Class II
Fig 4.7 (a and b). Graph of mean concentrations of heavy metals in commercial
organics compost compared to the critical limits specified by the EPA and the
proposed Biowaste Directive for Class I and II Compost.
Copper
The mean concentration of copper in the commercial organic compost was calculated
to be 392.1 mg/Kg, which highly exceeds the limits specified by the standards. This
was due to sample C1e which had an extremely high concentration of copper at 2476
mg/Kg compared to the other samples and even exceeded the critical limits for
stabilised biowaste. The author thinks that because all the other samples at this site
contained relatively small concentrations of copper, that perhaps analytical error
resulted in such a high figure and therefore biased the mean (Fig 4.8). If the mean of
the concentration of copper were calculated without including this sample the mean

Chapter 4 Results
Lorraine Herity, M.Sc. Environmental Engineering, Queens University of Belfast 42
concentration would have been 44.8 mg/Kg, which is well below the limits for the
two standards. Apart from sample C1e no other samples exceeded the limits.
0250500750
10001250150017502000225025002750
EPA
Class I
Class I
IC1a C1b C1c C1d C1e C2a C2b
Commercial Organics Samples (n=7)
Cu
(mg/
Kg,
dm
)
Fig 4.8 Graph of the concentration of Cu in the commercial organic compost samples.
Zinc
The mean concentration of Zinc was also very high at 476.3 mg/kg, which exceeded
the critical limits specified by the standards. Again, this was due to sample C1e which
had an extremely high concentration of 2707 mg/Kg and was the only sample to
exceed the critical limits (Fig 4.9). By ignoring sample C1e the mean was calculated
to be 104.5 mg/Kg, which would have been below the critical limits specified by the
two standards for zinc, otherwise sample C1e would be classified as stabilised
biowaste.

Chapter 4 Results
Lorraine Herity, M.Sc. Environmental Engineering, Queens University of Belfast 43
0
500
1000
1500
2000
2500
3000
EPA
Class I
Class I
IC1a C1b C1c C1d C1e C2a C2b
Commercial Organics Samples (n=7)
Zn (m
g/K
g, d
m)
Fig 4.9 Graph of the concentration of Zn (mg/Kg) in the commercial organic compost
samples
Lead
The mean concentration of lead in the commercial organic compost was 111.2 mg/kg,
which is below the EPA and Class II compost limits but exceeds the limits for Class I
compost. Two (8.6%) of the samples exceeded the EPA and Class II compost limits
while three (42.9%) of the samples exceeded the critical limit for the concentration of
lead in Class I compost. Samples C2a and C2b contained very high levels of lead
compared to the commercial organic compost samples from the other composting
facility and was classified as stabilised biowaste according to the EU Biowaste
Directive (Fig 4.10).

Chapter 4 Results
Lorraine Herity, M.Sc. Environmental Engineering, Queens University of Belfast 44
0
50
100
150
200
250
300
350
400
EPA
Class I
Class I
IC1a C1b C1c C1d C1e C2a C2b
Commercial Organics Samples (n=7)
Pb
(mg/
Kg,
dm
)
Fig 4.10 Graph of the concentration of Pb (mg/Kg) in the individual commercial
organic compost samples
Cadmium
Then mean concentration of cadmium in the commercial organic compost was found
to be 0.8 mg/Kg. This is below the limits for EPA and Class II compost while one
(14.3%) of the samples exceeded these critical limits (Table 4.6). The mean just
exceeded the limit for Class I compost (Fig 4.7, b) while three (42.9%) of the samples
were greater than this limit.
Mercury
The mean concentration of mercury in commercial organic compost was calculated to
be 0.1 mg/Kg, which is below the critical limits for both standards (Fig 4.7, b). None
of the commercial organic compost samples exceeded the critical limits.
Nickel
The mean concentration of nickel in the commercial organic compost was found to be
15.4 mg/Kg, which is below the critical limits stipulated by both standards. None of
the samples exceeded the critical limits.
Chromium
The mean concentration of chromium in the samples was 19.8 mg/Kg, which is below
the limits stipulated by the two standards (Table 4.6). None of the samples exceeded
the limits for Class II compost while one (14.3%) of the samples exceeded the limits

Chapter 4 Results
Lorraine Herity, M.Sc. Environmental Engineering, Queens University of Belfast 45
for EPA and Class I compost. Sample C2a showed a very high concentration of
chromium compared to the other samples (Fig 4.11).
0
20
40
60
80
100
120
140
160
EPA
Class I
Class I
IC1a C1b C1c C1d C1e C2a C2b
Commercial Organics Samples (n=7)
Cr
(mg/
Kg,
dm
)
Fig 4.11 Graph of the concentration of Cr (mg/Kg) in the commercial organic
compost samples.
4.1.4 Heavy Metal Content of Sludge Compost
A summary of descriptive statistics for heavy metal concentrations in industrial
sludge compost are outlined in table 4.7. The table shows the number of samples
analysed for each metal, the minimum, maximum, median and the mean concentration
of the heavy metals present in the samples. There were eleven samples available for
analysis, which all originated from one composting facility.
Table 4.7. Concentration of heavy metals in the sludge compost
Parameters Units No.1 Min Max Median Mean SD 2
Copper mg/Kg
dm 11 3.5 80 5.9 16.6 23.6
Zinc mg/Kg
dm 11 0 553 47 102.1 154.9
Lead mg/Kg
dm 11 0.1 17 4 5.1 4.8
Cadmium mg/Kg
dm 11 0 1 0.3 0.4 0.3
Mercury mg/Kg
dm 11 0 0.3 0.1 0.1 0.1
Nickel mg/Kg
dm 11 0 42 5 8.1 11.4
Chromium mg/Kg
dm 9 2.1 13.7 5.3 6.4 3.8 1 Number of samples tested 2 Standard Deviation

Chapter 4 Results
Lorraine Herity, M.Sc. Environmental Engineering, Queens University of Belfast 46
4.1.4.1 Comparison Of Heavy Metal Concentration In The Sludge Compost
Versus The Critical Limits Specified By The EPA And The EU Biowaste
Directive
Table 4.8 shows the critical limits specified for heavy metals by the EPA and the EU
Biowaste Directive for Class I and II compost and for stabilised biowaste. The
percentage of sludge compost samples which exceeded the critical limits are also
given. Figure 4.12 shows a graph of the mean of all the heavy metals in the sludge
compost compared to the critical limits set out by the EPA and the EU Biowaste
Directive for the two standards.
Table 4.8 Critical limits for heavy metals in compost and the percentage of sludge
compost samples exceeding the limits
Parameters Units No.1 CL 2
% Exceeding
The CL
CL 3
%
ExceedingThe CL CL 4
%
Exceeding The CL
Stabilised Biowaste5
% Exceeding
The CL
Copper mg/Kg
dm 11 100 0 100 0 150 0 600 0
Zinc mg/Kg
dm 11 350 9.1 200 9.1 400
9.1 1,500 0
Lead mg/Kg
dm 11 150 0 100 0 150 0 500 0
Cadmium mg/Kg
dm 11 1.5 0 0.7 9.1 1.5 0 5 0
Mercury mg/Kg
dm 11 1 0 0.5 0 1 0 5 0
Nickel mg/Kg
dm 11 50 0 50 0 75 0 150 0
Chromium mg/Kg
dm 9 100 0 100 0 150 0 600 0
1 Number of samples tested 2 Critical Limits for heavy metals specified by the Environmental Protection Agency in accordance with Waste Licensing under the Waste Management Act 1996. 3 Critical Limits for heavy metals proposed by the EU Biowaste Directive (Class I) 4Critical Limits for heavy metals proposed by the EU Biowaste Directive (Class II) 5 Critical Limits for heavy metals proposed by the EU Biowaste Directive (for stabilised biowaste)

Chapter 4 Results
Lorraine Herity, M.Sc. Environmental Engineering, Queens University of Belfast 47
(a)
050
100150200250300350400450
Cu Zn Pb Ni Cr
Heavy Metals
Con
cent
ratio
n (m
g/K
g, d
m)
Mean of Samples EPA Class I Class II
(b)
00.20.40.60.8
11.21.41.6
Cd Hg
Heavy Metals
Con
cent
ratio
n (m
g/K
g,dm
)
Mean of Samples EPA Class I Class II
Fig 4.12 (a and b). Graph of mean concentrations of heavy metals in sludge compost
compared to the critical limits specified by the EPA and the proposed Biowaste
Directive for Class I and II compost.
Copper
The mean concentration of copper was found to be 16.6 mg/Kg, which is below the
critical limits specified by the EPA and the EU Biowaste Directive. No samples
exceeded the limits.

Chapter 4 Results
Lorraine Herity, M.Sc. Environmental Engineering, Queens University of Belfast 48
Zinc
The mean concentration of 102.1 mg/Kg of zinc in the sludge compost was below the
critical limits for both standards. One (9.1%) of the samples exceeded the critical
limits for both standards. Sample S1g contained a very high concentration of 553
mg/Kg especially compared to the other samples and was classified as stabilised
biowaste.
0
100
200
300
400
500
600
EPA
Biowas
te I
Biowas
te II
S1a S1b S1c S1d S1e S1fS1g S1h S1i S1j
S1k
Sludge Samples (n=11)
Zn (m
g/K
g, d
m)
Fig 4.13 Graph of the concentration of Zn (mg/Kg) in the commercial organic
compost samples
Lead
The mean concentration of lead was found to be very low at 5.13 mg/Kg in the sludge
compost. No samples exceeded the critical limits specified by both standards.
Cadmium
The mean concentration of cadmium was 0.4 mg/Kg, which is below the critical
limits stipulated by the EPA and the EU Biowaste Directive. No samples exceeded the
EPA limit or the critical limit for Class II compost. One (9.1%) of the samples
exceeded the limit for Class I compost.
Mercury
The mean concentration of mercury was found to be 0.1 mg/Kg, which was well
below all the critical limits specified by the standards. None of the samples exceeded
the limits.
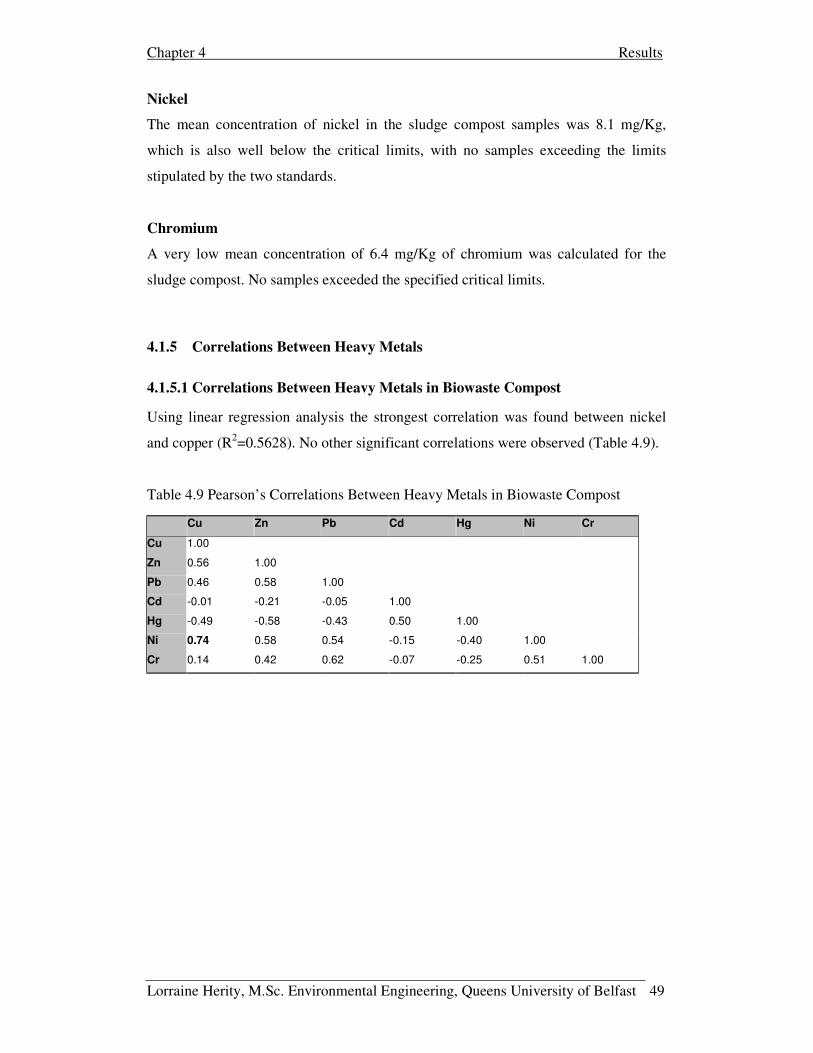
Chapter 4 Results
Lorraine Herity, M.Sc. Environmental Engineering, Queens University of Belfast 49
Nickel
The mean concentration of nickel in the sludge compost samples was 8.1 mg/Kg,
which is also well below the critical limits, with no samples exceeding the limits
stipulated by the two standards.
Chromium
A very low mean concentration of 6.4 mg/Kg of chromium was calculated for the
sludge compost. No samples exceeded the specified critical limits.
4.1.5 Correlations Between Heavy Metals
4.1.5.1 Correlations Between Heavy Metals in Biowaste Compost
Using linear regression analysis the strongest correlation was found between nickel
and copper (R2=0.5628). No other significant correlations were observed (Table 4.9).
Table 4.9 Pearson’s Correlations Between Heavy Metals in Biowaste Compost
Cu Zn Pb Cd Hg Ni Cr
Cu 1.00
Zn 0.56 1.00
Pb 0.46 0.58 1.00
Cd -0.01 -0.21 -0.05 1.00
Hg -0.49 -0.58 -0.43 0.50 1.00
Ni 0.74 0.58 0.54 -0.15 -0.40 1.00
Cr 0.14 0.42 0.62 -0.07 -0.25 0.51 1.00

Chapter 4 Results
Lorraine Herity, M.Sc. Environmental Engineering, Queens University of Belfast 50
y = 0.3416x + 0.4938R2 = 0.5628
0
10
20
30
40
50
60
70
80
0 20 40 60 80 100 120 140Cu (mg/Kg, dm)
(n=24)
Ni (
mg/
Kg,
dm
)
Fig 4.14 Scatter graph showing the correlation between copper and nickel in the
biowaste compost
4.1.5.2 Correlations Between Heavy Metals in Green Waste Compost
Correlations were found between zinc and lead (R2= 0.9288), copper and zinc
(R2=0.9172), copper and lead (R2=0.875) and finally zinc and nickel (R2=0.7205),
(Table 4.10).
Table 4.10 Pearson’s Correlations Between Heavy Metals in Green Waste Compost
Cu Zn Pb Cd Hg Ni Cr
Cu 1.00
Zn 0.96 1.00
Pb 0.94 0.96 1.00
Cd 0.52 0.55 0.54 1.00
Hg -0.16 -0.23 -0.08 -0.65 1.00
Ni 0.77 0.85 0.72 0.64 -0.51 1.00
Cr 0.69 0.78 0.64 0.44 -0.31 0.95 1.00

Chapter 4 Results
Lorraine Herity, M.Sc. Environmental Engineering, Queens University of Belfast 51
(a)
y = 4.3603x - 4.9645R2 = 0.9172
-50
0
50
100
150
200
250
300
350
0 10 20 30 40 50 60 70
Cu (mg/Kg, dm)(n=8)
Zn (m
g/K
g, d
m)
(b)
y = 2.0809x - 5.2923R2 = 0.875
-20
0
20
40
60
80
100
120
140
0 10 20 30 40 50 60 70
Cu (mg/Kg, dm)(n=8)
Pb
(mg/
Kg,
dm
)
(c)
y = 0.4709x - 2.0374R2 = 0.9288
020406080
100120140160
0 50 100 150 200 250 300 350
Zn (mg/Kg, dm)(n=8)
Pb
(mg/
Kg,
dm
)

Chapter 4 Results
Lorraine Herity, M.Sc. Environmental Engineering, Queens University of Belfast 52
(d)
y = 0.1583x - 6.6762R2 = 0.7205
-10
0
10
20
30
40
50
60
0 50 100 150 200 250 300 350
Zn (mg/Kg, dm)(n=8)
Ni (
mg/
Kg,
dm
)
Fig 4.15 (a,b,c,d) Scatter graphs showing significant correlations between heavy
metals in green waste compost.
4.1.5.2 Correlations Between Heavy Metals In Commercial Organic Composts
Findings of significant correlations between heavy metals in the commercial organic
compost are given in table 4.11.
Table 4.11 Pearson’s Correlations Between Heavy Metals In The Commercial
Organic Compost
Cu Zn Pb Cd Hg Ni Cr
Cu 1.00
Zn 1.00 1.00
Pb -0.34 -0.31 1.00
Cd -0.23 -0.21 -0.13 1.00
Hg 0.64 0.65 0.40 -0.32 1.00
Ni 0.86 0.87 -0.02 -0.31 0.58 1.00
Cr -0.12 -0.10 0.45 -0.28 -0.12 0.39 1.00
No significant correlations were found between heavy metals in the commercial
organic compost contrary to the findings in Table 4.7. These high correlations values
are due to outlier data involving sample C1e, which contained excessive amounts of
zinc and copper compared to the other samples. It was thought that this could be due
to an error in laboratory reporting of the concentration of heavy metals in sample C1e.

Chapter 4 Results
Lorraine Herity, M.Sc. Environmental Engineering, Queens University of Belfast 53
If these outliers were ignored there still was no significant correlations found (Table
4.12).
Table 4.12 Pearson’s Correlations Between Heavy Metals In The Commercial
Organic Compost
Cu Zn Pb Cd Hg Ni Cr
Cu 1.00
Zn 0.43 1.00
Pb -0.30 0.51 1.00
Cd 0.54 0.67 -0.23 1.00
Hg -0.19 0.35 0.85 -0.22 1.00
Ni -0.28 0.34 0.57 -0.21 0.06 1.00
Cr -0.20 0.19 0.44 -0.32 -0.06 0.97 1.00
4.1.5.4 Correlations Between Heavy Metals in Sludge Compost
According to Pearsons’s correlation coefficient for lead and mercury (R2=0.716), a
significant correlation was found (Table 4.13). The author advises that this may not be
so, due to such a small number of samples being analysed which limited the accuracy
of the correlation and due to a few outlier data points as can be seen in figure 4.3.
Table 4.13 Pearson’s Correlations for sludge compost
Cu Zn Pb Cd Hg Ni Cr
Cu 1.00
Zn -0.17 1.00
Pb 0.41 0.20 1.00
Cd 0.54 -0.07 0.34 1.00
Hg 0.40 0.01 0.85 0.54 1.00
Ni -0.16 -0.31 -0.26 0.19 0.26 1.00
Cr -0.19 0.07 -0.20 -0.02 -0.38 -0.34 1.00

Chapter 4 Results
Lorraine Herity, M.Sc. Environmental Engineering, Queens University of Belfast 54
y = 0.0166x + 0.0093R2 = 0.716
0
0.05
0.1
0.15
0.2
0.25
0.3
0.35
0 5 10 15 20
Pb, (mg/Kg, dm)
Hg
(mg/
Kg,
dm
)
Fig 4.16 Scatter graph showing the correlation between mercury and lead.
4.2 NUTRIENT CONTENT OF COMPOST SAMPLES
Test results for nutrient content were only available for biowaste compost and green
waste compost samples. Other facilities, which composted commercial organics and
sludge, did not test for this parameter and no results were available. Concentrations of
calcium and magnesium were available only for the biowaste compost samples.
Descriptive statistics were carried out on these parameters and are presented in table
4.14. Recommended ranges for nutrients in compost are also given and discussed in
detail in chapter 5. t-Test’s were carried out to see if there were significant differences
between the means of some parameters only when the author thought that unbiased
means had been calculated.

Chapter 4 Results
Lorraine Herity, M.Sc. Environmental Engineering, Queens University of Belfast 55
Table 4.14. Summary of descriptive statistics for nutrient content and availability in
the biowaste and green waste compost samples.
Parameters Units No.1 Min Max Median Mean SD 2
Recommended
Range3
Biowaste
Total Nutrients
TN % dry wt 26 1.1 3 2.1 2.1 0.5 1.0-3.0 4
TP % dry wt 26 0.2 16 0.4 1.6 3.9 0.4-1.1 7
TK % dry wt 26 0.5 39.5 1.1 3.7 9.5 0.6-1.7 8
TMg % dry wt 9 0.1 0.3 0.2 0.2 0.1 0.2-0.4 9
TCa % dry wt 9 0.4 2.7 1.4 1.5 0.8 1.0-4.0 10
Water Soluble Nutrients
NH4-N mg/L fresh wt 26 0 253 17.5 59.9 72.8 500 5
NO3-N mg/L fresh wt 26 0 400 84.5 146 130.3 240 6
PO4-P mg/L fresh wt 24 5 154 28 48.9 44.3 50-120 7
K2O mg/L fresh wt 24 26 2029 1089.5 1112.4 507.4
620-
2280 8
Green Waste
Total Nutrients
TN % dry wt 9 1.1 4 1.3 1.6 0.9 1.0-3.0 4
TP % dry wt 7 0.2 0.6 0.4 0.4 0.2 0.4-1.1 7
TK % dry wt 7 0.7 6 1.2 2.6 2.4 0.6-1.7 8
Water Soluble Nutrients
NH4-N mg/L fresh wt 8 0 6 0.9 1.5 2 500 5
NO3-N mg/L fresh wt 8 0 252 20.5 44.5 84.4 240 6
PO4-P mg/L fresh wt 3 8 23 17 16 7.6 50-120 7
K2O mg/L fresh wt 3 617 2094 922 1211 779.8
620-
2280 8
1 Number of samples tested 2 Standard Deviation 3 Recommended ranges for nutrients in compost 4 Recommended range of TN in compost (Barker, 1997). 5, 6 Bord na Mona typical range for available NH4-N and NO3-N in compost 7 Bord na Mona recommended range for TP and available PO4-P in compost 8 Bord na Mona recommended range for TK and available K 9, 10 Recommended range of TMg and TCa in compost (Barker 1997).
4.2.1 Total Nitrogen (TN)
A t-test was carried out to see if there was a significant difference between the mean
of the TN for the two types of compost. From the results presented, it is evident that
there is no significant difference between the means, t =1.549, 10 df, p=0.152 (Table
4.15).

Chapter 4 Results
Lorraine Herity, M.Sc. Environmental Engineering, Queens University of Belfast 56
Table 4.15. t-Test: Two-Sample Assuming Unequal Variances
Between the Means of TN
t-Test Biowaste Green Waste
Mean 2.096 1.589
Df 10
t Stat 1.549
P(T<=t) two-tail 0.152
t Critical two-tail 2.228
4.2.2 Available Nitrogen as NO3-N
A t-test was carried out to see if there was a significant difference between the means
of NO3-N of the two types of compost. From the results presented it can be seen there
was a highly significant difference, t=5.071, 26 df, p=0.000 (Table 4.16).
Table 4.16. t-Test: Two-Sample Assuming Unequal Variances
Between Means of NO3-N
t-Test Biowaste Green Waste
Mean 146.038 14.857
Df 26
t Stat 5.071
P(T<=t) two-tail 0.000
t Critical two-tail 2.056
4.2.3 Available Nitrogen as NH4-N
A t-test was carried out to see if there was a significant difference between the means
of NH4-N for the two types of compost. From the results presented it can be seen
there was a highly significant, t=4.087, 25 df, p=0.000 (Table 4.17).
Table 4.17. t-Test: Two-Sample Assuming Unequal Variances Between Means of NH4-N
t-Test Biowaste Green Waste
Mean 59.896 1.450
df 25
t Stat 4.087
P(T<=t) two-tail 0.000
t Critical two-tail 2.060

Chapter 4 Results
Lorraine Herity, M.Sc. Environmental Engineering, Queens University of Belfast 57
4.3 OTHER PHYSICAL AND CHEMICAL PARAMETERS
Other important physical and chemical parameters of the biowaste, green waste and
the commercial organic compost are examined below with emphasis on parameters
such as C:N ratio, pH, moisture content, organic matter content, conductivity and bulk
density. A summary of descriptive statistics for each of these parameters are given in
Table 4.18.
Table 4.18. Summary of descriptive statistics for other physical and chemical
parameters of the compost samples.
Parameters Units No.1 Min Max Median Mean SD 2
Recommended
Range3
Biowaste
C:N ratio 26 12.2 29.5 15 16.5 4 <254
pH pH-units 26 6.3 8.6 7.7 7.7 0.6 6.9-8.3 5
Moisture % fresh wt 24 22.1 75 48.3 47.2 12.2 45-65% 7
Organic matter content % dry wt 24 30 75.5 56.9 58.4 10.8 >30% 8
Conductivity µS/cm 26 780 7260 4920 4574 1497.4 2,000-6,000 9
Bulk density g/L fresh wt 13 227 441.6 285.3 306.7 69.3 120-369 10
Green Waste
C:N ratio 9 6.5 29.7 19 18.2 8.4 <254
pH pH-units 9 6.8 8.5 7.5 7.6 0.5 6.9-8.3 5
Moisture % fresh wt 8 56.6 72.2 65.5 63.8 5.7 45-65% 7
Organic matter content % dry wt 9 32 56.4 47 47.5 7.4 >30% 8
Conductivity µS/cm 9 636 2660 742 1100.7 693.9 2,000-6,000 9
Commercial Organics
C:N ratio 7 6 21 14 13.8 6.3 <254
PH pH-units 7 3.7 8.2 6.3 6.09 1.8 6.9-8.3 5
Moisture % fresh wt 7 26 49 38 39 7.9 45-65% 7
Organic matter content % dry wt 3 40 75.5 50 55.2 18.3 >30% 8
Conductivity µS/cm 3 640 4770 4670 3360 2356.1 2,000-6,000 9
1 Number of samples tested 2 Standard Deviation 3 Recommended ranges for compost quality parameters 4 Limit for C:N ratio specified by the Environmental Protection Agency in accordance with Waste Licensing under the Waste Management Act 1996. 5 Recommended pH range of compost, Bord na Mona, 2003 6,7 Recommended range of moisture content, Biotreat, 2003 8 Minimum limit for organic matter, specified by the Environmental Protection Agency in accordance with Waste Licensing under the Waste Management Act 1996. 9,10 Recommended ranges for conductivity and dry bulk density, Bord na Mona, 2003

Chapter 4 Results
Lorraine Herity, M.Sc. Environmental Engineering, Queens University of Belfast 58
4.3.1 C:N Ratio
An ANOVA test was carried out to see if there was a significant difference between
the means of the C:N ratios for the biowaste, green waste and commercial organic
compost. From the results presented in table 4.19 it can be seen there was no
significant difference between the means, F=1.271, 2 df, p=0.292.
Table 4.19. ANOVA variance between means of C:N ratios for the different types of
compost studied.
ANOVA
Source of Variation SS df MS F P-value F crit
Between means 78.199 2 39.099 1.271 0.292 3.238
4.3.2 pH Scale
An ANOVA test was carried out to see if there was a significant difference between
the means of the pH for the biowaste, green waste and commercial organic compost.
From the results presented in table 4.20 it can be seen there was a highly significant
difference between the means, F=9.452, 2 df, p=0.000.
Table 4.20. ANOVA variance between pH means for the different compost types
studied
ANOVA
Source of Variation SS df MS F P-value F crit
Between pH means 14.505 2 7.253 9.452 0.000 3.238
4.3.3 Moisture Content
An ANOVA test was carried out to see if there was a significant difference between
the means of the moisture content for the biowaste, green waste and commercial
organic compost. From the results presented in table 4.21 it can be seen there was a
highly significant difference between the means, F=11.269, 2 df, p=0.000.
Table 4.21 ANOVA variance between means of moisture content in the compost
samples
ANOVA
Source of Variation SS df MS F P-value F crit
Between moisture means 2537.032 2 1268.516 11.269 0.000 3.259

Chapter 4 Results
Lorraine Herity, M.Sc. Environmental Engineering, Queens University of Belfast 59
4.3.4 Organic Matter Content
An ANOVA test was carried out to see if there was a significant difference between
the means of the organic matter content for the biowaste, green waste and commercial
organic compost. From the results presented in table 4.22 it can be seen there was a
significant difference between the means, F=3.402, 2 df, p=0.045.
Table 4.22 ANOVA variance between means of organic matter content in the
compost samples
ANOVA
Source of Variation SS df MS F P-value F crit
Between organic matter means 784.239 2 392.119 3.402 0.045 3.285
4.3.5 Conductivity
A t-test was carried out to see if there was a significant difference between the means
of conductivity for the biowaste and green waste compost. The mean of conductivity
for the commercial organic compost was not included as it was felt that it was not a
representative mean due to a very small sample number. From the results presented it
can be seen there was a highly significant difference between the means, t=9.291, 30
df, p=0.000 (Table 4.23).
Table 4.23. t-Test: Two-Sample Assuming Unequal Variances between means
of conductivity for the biowaste and green waste compost
t-Test Biowaste Green Waste
Mean 4574 1100.7
df 30
t Stat 9.291
P(T<=t) two-tail 0.000
t Critical two-tail 2.042
4.4 MATURITY
4.4.1 Self Heating Test
Five test results for the self heating test were available for the biowaste compost. Four
of these were found to be of class stability IV, whilst the other sample was found to be
in class III (Table 4.24).

Chapter 4 Results
Lorraine Herity, M.Sc. Environmental Engineering, Queens University of Belfast 60
Eight sample test results were available for the green waste compost of which six
were found to be in class of stability V and the other two samples were in class of
stability III (Table 4.24).
Table 4.24. Self Heating Test Results for the Biowaste and Green Waste Compost
Biowaste Samples (n=5) B4h B4i B4j B4k B5
Class of Stability IV IV IV III IV
Green Waste Samples (n=8) G1a G1b G1c G1d G1e G1f G2 G3
Class of Stability V V V V V V III III
4.4.2 Oxygen Uptake Rate
Table 4.25. Oxygen Uptake Rate test results for the compost samples
Parameters Units No.1 Min Max Median Mean SD 2
Oxygen uptake rate
Biowaste mg O2 kg VS-1 h-1 2 1220 1833 N/a N/a N/a
Green Waste mg O2 kg VS-1 h-1 6 43 2024 367.5 608 714.1
Commercial Organics mg O2 kg VS-1 h- 7 12 226 96.3 116.9 74.9
1 Number of samples tested 2 Standard Deviation 3 Not Applicable
4.4.3 Cress Germination Test
Table 4.26. Summary of descriptive statistics for % cress
Germination test results
Parameters Units No.1 Min Max Mean Median SD 2
Cress Germination Test %
Biowaste % 5 70 100 87.8 88.9 13.
Green Waste % 2 78 90 84. 84 8.5
1 Number of samples tested 2 Standard Deviation

Chapter 4 Results
Lorraine Herity, M.Sc. Environmental Engineering, Queens University of Belfast 61
4.5 FOREIGN MATTER
Table 4.27. Summary of descriptive statistics for foreign matter including impurities
and gravel and stone in the compost samples.
Parameters Units No.1 Min Max Median Mean SD 2
Biowaste
Impurities %(> 2 mm) 21 0 11 0.6 1.8 3
Gravel and Stone %(> 5 mm) 19 0 24 3.9 6 6.8
Green Waste
Impurities %(> 2 mm) 8 0 11 0.1 1.5 3.9
Gravel and Stones %(> 5 mm) 7 0.1 6.2 2 2.6 2.2
Commercial Organics
Impurities %(> 2 mm) 3 0 0.4 0.4 0.3 0.2
Gravel and Stones %(> 5 mm) 3 4.8 8 7 6.6 1.6
1 Number of samples tested 2 Standard Deviation
4.6 PATHOGENS
Results for the presence of faecal coliforms and salmonella were available for the
biowaste and green waste compost. Some descriptive statistics are given in table 4.28.
Table 4.28. Summary of descriptive statistics for the presence of pathogens in the
compost samples
Parameters Units No.1 Min Max Median Mean SD 2
Biowaste
Faecal coliforms MPN/g of total solids 21 3 1100 4 112.2 263.2
Salmonella Absent in 50 g 21 0 3200 0 286.51 906.9
Green Waste
Faecal coliforms MPN/g of total solids 6 3 688 60 221.7 300.6
Salmonella Absent in 50 g 6 0 0 0 0 0
1 Number of samples tested 2 Standard Deviation

Chapter 4 Results
Lorraine Herity, M.Sc. Environmental Engineering, Queens University of Belfast 62
4.7 OVERALL QUALITY OF THE BIOWASTE AND GREEN WASTE
COMPOST
The overall quality of twenty samples of the biowaste compost and eight samples of
green waste compost were analysed according to the statutory limits specified in
Annex III of the EU Biowaste Directive (Table 4.29 and 4.30).
Table 4.29 shows each sample classification according to heavy metal content,
whether it passed or failed the specifications for the impurities and gravel and stones
content of compost, and the overall classification of the sample. Non-conforming
samples exceeded all the statutory limits according to the EU Biowaste Directive.
Table 4.29 Classification of biowaste compost samples according to the EU Biowaste
Directive
Sample Heavy
Metals
Impurities
<0.5%
Class I and
II
Impurities
<3.0%
Stabilised
Biowaste
Gravel
and
Stones
(<5.0 %)
Sanitation
Requirements
Overall
Classification
B1a Class II P P P F Non conforming *
B1b Class II P P P F Non conforming*
B2a Class I F P P P SB
B2b Class I F P P P SB
B2c Class II P P F P SB
B3a Class II F P P P SB
B3b Class I F P P P SB
B4a SB F P P P SB
B4b SB F F P F Non conforming*
B4c Class I P P P P Class I
B4d Class I F P P P SB
B4e Class I F F F P None
B4f Class I P P F P SB
B4g Class I P P F P SB
B4h Class I P P F P SB
B4i Class II F F N/a P Non conforming
B4j Class II P P P P Class II
B4k Class II P P P P Class II
B4l Class II P P F P SB
B4m Class II P P F P SB
* Failed sanitation requirements as specified in Annex II of the EU Biowaste Directive
SB: Stabilised Biowaste

Chapter 4 Results
Lorraine Herity, M.Sc. Environmental Engineering, Queens University of Belfast 63
It can be seen that when all the parameters were considered only one sample was
classified as Class I compost, TWO as Class II compost and 12 as stabilised biowaste
and that five of the samples were non-conforming and exceeded all the statutory
limits stipulated for these parameters.
On comparing eight of the green waste compost samples for overall compost quality it
was found that three (37.5%) of the samples could be classified as Class I compost
and three (37.5%) samples as Class II compost. One of the samples (12.5%) was
classified as stabilised biowaste and one (12.5%) of the samples was non-conforming
to the statutory limits specified by the standard (Table 4.29).
Table 4.30 Classification of green waste compost samples according to the EU
Biowaste Directive
Sample Heavy
Metals
Impurities
<0.5% Class
I and II
Impurities
<3.0%
Stabilised
Biowaste
Gravel
and
Stones
(<5.0%)
Sanitation
Requirements
Overall
Classification
G1a Class II P P P P Class II
G1b Class I P P P P Class I
G1c Class II P P P P Class II
G1d Class II P P P P Class II
G1e Class I P P P P Class I
G1f Class I P P P P Class I
G2 Class I P P F P SB
G4 N/A F F N/A P Non conforming
N/A: test results not available
SB: stabilised biowaste

Chapter 5 Discussion
Lorraine Herity, M.Sc. Environmental Engineering, Queens University of Belfast 64
5.0 DISCUSSION
5.1 HEAVY METALS
The concentration of heavy metals in compost is of serious concern and is one of the
main quality criteria, which mostly restricts the use of compost in agriculture
(Pinamonti, et al., 1997). Classifying compost into certain quality classes according to
the EU Biowaste Directive, and restricting its use, serves to protect the environment
and human health, as heavy metals may bioaccumulate and enter the food chain if
applied to agricultural crops in the form of contaminated compost. (Veeken and
Hamelers, 2002; Zheljazkov and Warman, 2003).
5.1.1 Overview Of Classification Of Compost Samples According To Heavy
Metal Content
5.1.1.1 Quality Of Biowaste Compost Samples
Twenty-four samples of biowaste compost were completely analysed for the
concentration of all the heavy metals in the compost. According to the EU Biowaste
Directive and after taking an allowed 20% deviation from statutory limits of samples
which failed to conform to any given limit for heavy metal concentration, ten (41.7%)
of the biowaste compost samples met the requirements of the Biowaste Directive and
can be classified as Class I compost. Twelve samples (50%) can be classified as Class
II compost. Nineteen (79.2%) of the samples met the requirements for heavy metal
content in compost as specified by the EPA. No deviation from the EPA statutory
limits was allowed for. Two (8.3%) samples were contaminated with too high a
concentration of mercury and did not meet the requirements of the two standards and
were classified as stabilised biowaste (Table 5.6). These findings were very promising
and show that heavy metal contamination of biowaste compost is not of major
concern to the composting industry however, every effort should be made to continue
to decrease heavy metal contamination of compost and thereby increase compost
quality. No major restrictions will be placed on the use of the biowaste compost
samples examined apart from the two samples classified as stabilised biowaste.

Chapter 5 Discussion
Lorraine Herity, M.Sc. Environmental Engineering, Queens University of Belfast 65
5.1.1.2 Quality Of Green Waste Compost Samples
Eight samples of green waste compost were analysed for the presence of heavy metals
in the compost. Four (50%) of the green waste compost samples were be classified as
Class I compost and the other four (50%) as Class II compost. Seven (87.5%) of the
samples met the requirements of the EPA standard. One sample (G3) failed to meet
the EPA requirement due to excessive amounts of chromium (Table 5.1).
Samples B5 and G3 which originated from the same site, contained elevated levels of
nickel and chromium. This could be due to contamination of the feedstock with metal
or glass (Reinhofer et al., 2002) or perhaps due to the use of machinery such as
shredders and screeners which may have contained a nickel-chromium alloy and that
‘rub off’ between the machinery and the compost may account for the contamination
(Fricke et al., 1992).
5.1.1.3 Quality Of Commercial Organic Compost
Eleven samples of organic compost were analysed for the presence of heavy metals.
One of the commercial organic compost samples can be classified as Class I compost
while three (42.9%) of the samples can be classified as Class II compost Three
(42.9%) of the samples met the requirements of the EPA standard. Three (42.9%)
samples were too contaminated and exceeded the requirements of both standards and
were therefore classified as stabilised biowaste (Table 5.1).
5.1.1.4 Quality Of Sludge Compost
Nine (81.8%) of the eleven samples of sludge compost samples could be classified as
Class I compost and one (9.1%) of the samples as Class II compost. Ten (90.9%) of
the samples met the requirements for EPA compost, while one of the sludge compost
samples exceeded all the critical limits for the two standards and was classified as
stabilised biowaste (Table 5.1).

Chapter 5 Discussion
Lorraine Herity, M.Sc. Environmental Engineering, Queens University of Belfast 66
Table 5.1 The number and percentage of samples of each type of compost which met
the heavy metal requirements as stipulated by the EPA and the EU Biowaste Directive
Standard
Biowaste Compost
(n=24)
Green Waste Compost
(n=8)
Commercial Organic Compost
(n=7)
Sludge Compost
(n=11)
EPA 19 (79.2%) 7 (87.5%) 3 (27.3%) 10 (90.9%)
Class I 10 (41.7%) 4 (50%) 1 (14.3%) 9 (81.8%)
Class II 12 (50%) 4 (50%) 3 (27.3%) 1 (9.1%)
Stabilised Biowaste 2 (8.3%) 0 (0%) 2 (27.3%) 1 (9.1%)
Non-conforming to both standards 0 (0%) 0 (0%) 1 (14.3%) 0 (0%)
5.1.2 A Comparison Of Mean Heavy Metal Content For The Different Types
Of Compost Analysed.
Sludge compost contained the least amount of contamination when concentrations of
all the heavy metals were take into account albeit, all samples originated from one
composting facility. Commercial organic compost contained significantly greater
amounts of copper, zinc and lead compared to the other types of compost (Table 5.2).
It contained similar concentrations of cadmium, mercury, nickel and chromium
compared to the biowaste and green waste compost.
On comparing the biowaste compost and the green waste compost, biowaste compost
contained greater amounts of copper, zinc, mercury and nickel, whereas the green
waste compost contained higher concentrations of lead, cadmium and chromium. The
concentration of lead was significantly higher which could be attributable to lead
being released into the air from car exhausts and industry, and then undergoing
deposition from the air onto soils and because green waste compost contains a certain
proportion of soil, lead could be introduced into the composting process in this way,
and subsequently into the end product. Green waste and biowaste compost contained
approximately similar amounts of copper and zinc.
Green waste compost contained slightly higher concentrations of chromium compared
to the other types of compost. Sludge compost contained the least amount. The
concentration of nickel was similar in all the types of compost except again for the
sludge compost where it was at its lowest concentration (Fig 5.1, b).
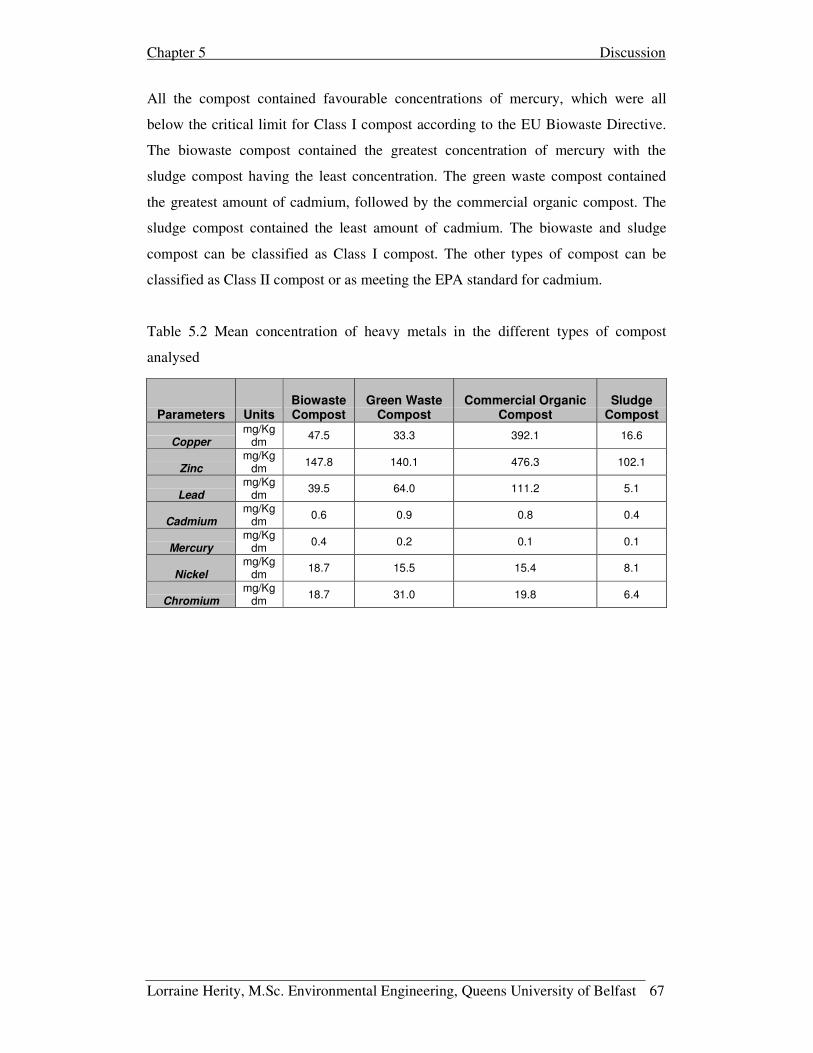
Chapter 5 Discussion
Lorraine Herity, M.Sc. Environmental Engineering, Queens University of Belfast 67
All the compost contained favourable concentrations of mercury, which were all
below the critical limit for Class I compost according to the EU Biowaste Directive.
The biowaste compost contained the greatest concentration of mercury with the
sludge compost having the least concentration. The green waste compost contained
the greatest amount of cadmium, followed by the commercial organic compost. The
sludge compost contained the least amount of cadmium. The biowaste and sludge
compost can be classified as Class I compost. The other types of compost can be
classified as Class II compost or as meeting the EPA standard for cadmium.
Table 5.2 Mean concentration of heavy metals in the different types of compost
analysed
Parameters Units Biowaste Compost
Green Waste Compost
Commercial Organic Compost
Sludge Compost
Copper mg/Kg
dm 47.5 33.3 392.1 16.6
Zinc mg/Kg
dm 147.8 140.1 476.3 102.1
Lead mg/Kg
dm 39.5 64.0 111.2 5.1
Cadmium mg/Kg
dm 0.6 0.9 0.8 0.4
Mercury mg/Kg
dm 0.4 0.2 0.1 0.1
Nickel mg/Kg
dm 18.7 15.5 15.4 8.1
Chromium mg/Kg
dm 18.7 31.0 19.8 6.4

Chapter 5 Discussion
Lorraine Herity, M.Sc. Environmental Engineering, Queens University of Belfast 68
(a)
0
100
200
300
400
500
600
Cu Zn Pb
Types of Compost
Mea
n C
once
ntra
tion
(mg/
Kg,
dm
)
Green Waste Biowaste Commercial Organics Sludge
(b)
0
5
10
15
20
25
30
35
Ni Cr
Type of Compost
Mea
n C
once
ntra
tion
(mg/
kg,
dm)
Green Waste Biowaste Commercial Organics Sludge
(c)
0.0
0.2
0.4
0.6
0.8
1.0
Cd Hg
Types of Compost
Mea
n C
once
ntra
tion
(mg/
Kg,
dm
)
Green Waste Biowaste Commercial Organics Sludge
Fig 5.1 (a,b,c) Graph of the mean concentration of heavy metals in the different types
of compost analysed

Chapter 5 Discussion
Lorraine Herity, M.Sc. Environmental Engineering, Queens University of Belfast 69
5.1.3 Heavy Metals in Irish Biowaste Compost Compared to Composts from
Other Countries
On comparing the means of heavy metal concentrations, it was found that Irish
biowaste compost compares favourably with compost from Germany, Austria and the
UK. Irish biowaste compost contained the lowest concentration of zinc, lead and
cadmium. Concentrations of zinc and lead were distinctly lower (Fig 5.2, a). This
could be attributed to the fact that these countries are more heavily industrialised and
perhaps have a higher housing density which may increase the amount of
contamination by heavy metals in biowaste compost. Irish biowaste compost
however, contained the highest concentration of mercury (Fig 5.2, b) perhaps due to
the two erroneous sample results.
(a)
0
50
100
150
200
250
Cu Zn Pb
Country
Mea
n C
once
ntra
tion
(mg/
Kg,
dm
)
Ireland Germany Austria UK

Chapter 5 Discussion
Lorraine Herity, M.Sc. Environmental Engineering, Queens University of Belfast 70
(b)
00.10.20.30.40.50.60.70.80.9
Cd Hg
Country
Mea
n C
once
ntra
tion
(mg/
Kg,
dm
)
Ireland Germany Austria UK
* It was thought that the mean concentration of mercury (mg/Kg) in the Irish biowaste
compost was quite high due to two possibly erroneous sample results analysed.
(c)
05
1015
2025
3035
40
Ni Cr
Country
Mea
n C
once
ntra
tion
(mg/
Kg,
dm
)
Ireland Germany Austria UK
Fig 5.2 (a, b, c). Graph of concentration of heavy metals in Irish biowaste compost
compared to heavy metal concentrations in green waste compost from other countries.
Source: Fricke, 1994, Amlinger, 2001, UK Composting Association, 2003.
5.1.4 Heavy Metals In Irish Green Waste Compost Compared To Compost
From Other Countries
As with biowaste compost, green waste compost again compares favourably on
comparing heavy metal concentrations in green waste compost from other countries

Chapter 5 Discussion
Lorraine Herity, M.Sc. Environmental Engineering, Queens University of Belfast 71
namely Germany, Austria and Australia. Irish green waste compost had similar or
more often, lower concentrations of heavy metals (Fig 5.3, a). Cadmium is an
exception to this as Irish green waste compost contained a slightly higher
concentration of this heavy metal compared to the other countries examined (Fig 5.3,
b).
(a)
0
50
100
150
200
250
300
350
Cu Zn Pb
Country
Mea
n C
once
ntra
tion
(mg/
Kg,
dm
)
Ireland Germany Austria Australia
(b)
00.20.40.60.8
11.21.41.6
Cd Hg
Country
Mea
n C
once
ntra
tion
(mg/
Kg,
dm
)
Ireland Germany Austria Australia
Fig 5.3 (a and b). Graph of concentration of heavy metals in Irish green waste
compost compared to heavy metal concentrations in green waste compost from other
countries.
Source: Fricke, 1994, Amlinger, 2001, Wilkinson et al., 2002.

Chapter 5 Discussion
Lorraine Herity, M.Sc. Environmental Engineering, Queens University of Belfast 72
05
10152025303540
Ni Cr
Caountry
Mea
n C
once
ntra
tion
(mg/
Kg,
dm
)
Ireland Germany Austria Australia
Fig 5.4 (c). Graph of concentration of heavy metals in Irish green waste compost
compared to heavy metal concentrations in green waste compost from other countries.
Source: Fricke, 1994, Amlinger, 2001, Wilkinson et al., 2002.
5.1.5 Correlations Between Heavy Metals
The most significant correlation between heavy metals in the biowaste compost was
found between nickel and copper (R2 = 0.5628). However this correlation was not
very strong. Significant correlations were found between copper and zinc
(R2=0.9172), copper and lead (R2=0.875), zinc and lead (R2= 0.9288) in the green
waste compost. Similar correlations between these heavy metals were also found in
other studies on compost quality (Prasad, 2003 and Reinhofer et al., 2002). Another
correlation was found between zinc and nickel (R2=0.7205) in the green waste
compost, which also supports Prasad (2003) findings in which he found a similar
correlation between these heavy metals (R2= 0.8692).
Overall, the most significant correlations were found between some of the heavy
metals in the green waste compost. This supports findings from other studies and
presents more evidence that some heavy metals do in fact occur together. These
findings may allow laboratories to limit heavy metal testing and therefore carry out
single tests for pairs of strongly correlated heavy metals. This would in turn, limit the
costs of quality testing for facility operators. The accuracy of the findings of this
research was limited due to the fact that only a small number of compost samples
were available for analysis. More detailed research into correlations between metals in

Chapter 5 Discussion
Lorraine Herity, M.Sc. Environmental Engineering, Queens University of Belfast 73
compost is required on a larger scale, whilst also considering the time of year and the
season in which the feedstock is composted.
5.2 NUTRIENT CONTENT OF COMPOST SAMPLES
5.2.1 Total Nitrogen (TN)
A favourable mean of 2.1% TN was found in the biowaste compost. All the samples
were within the recommended range (Fig 5.5).
0
0.5
1
1.5
2
2.5
3
3.5
B1aB1bB2aB2bB2cB3aB3bB4aB4bB4cB4dB4e B4fB4gB4h B4i B4j
B4k B4lB4m B5
B6aB6bB6cB6dB6e
Biowaste Samples (n=33)
Tota
l Nitr
ogen
(% d
ry w
t)
Fig 5.5 Graph of the TN (%) for each of the biowaste compost samples showing
recommended threshold levels.
A mean of 1.6% TN was found in the green waste compost. One (11.1%) of the
samples exceeded the upper threshold of the recommended range (Fig 5.6). Sample
G1a contained a high amount of TN especially when compared to sample G1b, which
is from the same site.

Chapter 5 Discussion
Lorraine Herity, M.Sc. Environmental Engineering, Queens University of Belfast 74
00.5
11.5
22.5
33.5
44.5
G1a G1b G1c G1d G1e G1f G2 G3 G4
Green Waste Samples (n=9)
Tota
l Nitr
ogen
(%, d
ry w
t)
Fig 5.6 Graph of the TN (%) for each of the green waste compost samples showing
recommended threshold levels.
On comparing the values of the means there was no significant differences between
TN in the biowaste and green waste compost (p=0.15). All of the samples analysed
for both types of compost contained more than 1% TN. Thus, both composts can be
considered to have fertilising capabilities and can be used in agriculture. Irish
biowaste and green waste compost could also potentially be used in container
production of crops as the TN content also exceeds the typical level of 1.5% TN
required for growing crops in this way (Barker, 1997)
5.2.2 Available Nitrogen as NO3-N
The mean NO3-N values for the biowaste compost samples was found to be 146 mg/L
which is below the recommended upper threshold level of 240 mg/L. Eight samples
(30.8%) of the biowaste compost exceeded the recommended limit (Fig 5.7) and
therefore, according to Bord na Mona (2003), contained excessive amounts of NO3-N.
Two samples (7.7%) of the biowaste compost contained less than the recommended
minimum level of 15 mg/L (Fig 5.7). Therefore, because of such a low nutrient
concentration these compost samples would be better used as mulch (Barker, 1997).
A high standard deviation of 130.3 was calculated which showed a lot of variation
around the mean. It can be seen from figure 5.7 that variations in the concentration of
NO3-N existed between sites and also between samples of biowaste compost from the
same site. This is evident on examining compost samples from facility B4 and B6.

Chapter 5 Discussion
Lorraine Herity, M.Sc. Environmental Engineering, Queens University of Belfast 75
This variation indicates that the composting process at these facilities were not fully
controlled with different rates of mineralisation of organic nitrogen occurring and
compost of different maturity levels been produced.
The high variation in the concentration of NO3-N in compost from site B4 and B6
meant that each compost sample would have to be looked at individually and an
appropriate end use for the product be selected accordingly. For use in horticulture for
example, some of the compost samples from site B4 and B6 were suitable for seedling
and nursery plants, some for potting plants and bedding plants, while others were
more suitable for crops such as tomatoes and cucumbers (Environment Agency,
2000). Site B4 and B6 obviously lack consistency in producing a product of uniform
quality and content.
0306090
120150180210240270300330360390420
B1aB1bB2aB2bB2cB3aB3bB4aB4bB4cB4dB4e B4fB4gB4h B4i B4j
B4k B4lB4m B5
B6aB6bB6cB6dB6e
Biowaste Samples (n=26)
Nitr
ate-
N (m
g/L,
fres
h w
t)
Fig 5.7. Graph of the concentration of NO3-N (mg/L) in the biowaste compost
samples showing recommended threshold levels.
The mean concentration of NO3-N in the green waste compost was 44.5 mg/L, which
is below the recommended upper threshold and above the lower threshold. However,
one (12.5%) of the samples was above the recommended upper threshold and
contained excessive amounts of NO3-N. It should be noted that Sample G3 contained
an extremely high concentration of NO3-N which could be due to laboratory error and
therefore was biased towards the mean. If sample G3 was ignored the unbiased mean
would be 14.9 mg/L, which is slightly below the recommended lower threshold for
the concentration of NO3-N in compost. Two (25%) of the samples of the green waste
compost were totally deficient in NO3-N and again should be used as mulch (Fig 5.8).

Chapter 5 Discussion
Lorraine Herity, M.Sc. Environmental Engineering, Queens University of Belfast 76
Overall, considering the unbiased mean the green waste compost was quite low or
deficient in available NO3-N for use in growing media.
050
100150200250300350400450
G1b G1c G1d G1e G1f G2 G3 G4
Green Waste Samples (n=8)
Nitr
ate-
N (m
g/L,
fres
h w
t)
Fig 5.8 Graph of the NO3-N concentration (mg/L) for each of the green waste
compost samples showing recommended threshold levels.
A t-test was performed which concluded that the mean of the two samples were
highly significantly different (p=0.000), and that the biowaste compost samples
contained a greater amount of available NO3-N compared to the green waste compost.
5.2.3 Available Nitrogen as NH4-N
The mean value of NH4-N was 59.9 mg/L in the biowaste compost. This is below the
upper threshold of 200 mg/L. Two samples (7.7%) of the biowaste compost exceeded
this threshold (Fig 5.9).
0
50
100
150
200
250
300
B1aB1bB2aB2bB2cB3aB3bB4aB4bB4cB4dB4e B4fB4gB4h B4i B4j
B4k B4lB4m B5
B6aB6bB6cB6dB6e
Biowaste Samples (n=26)
Am
mon
ium
-N, (
mg/
L, fr
esh
wt)
Fig 5.9 Graph of the NH4-N concentration (mg/L) for each of the biowaste compost
samples showing recommended threshold levels.

Chapter 5 Discussion
Lorraine Herity, M.Sc. Environmental Engineering, Queens University of Belfast 77
The mean concentration of NH4-N in the green waste compost was 1.5 mg/L, which is
well below the recommended upper threshold level. All the green waste samples were
below this threshold level (Fig 5.10).
0
10
20
30
40
50
G1b G1c G1d G1e G1f G2 G3 G4
Green Waste Samples (n=8)
Am
mon
ium
-N (m
g/L,
fres
h w
t)
Fig 5.10 Graph of the NH4-N concentration (mg/L) for each of the green waste
compost samples
A t-test was carried out which indicated that there was a highly significant difference
between the means (p=0.000) and that the biowaste compost contained a significantly
higher amount of NH4-N compared to the green waste compost.
The mean values of NH4-N in the biowaste and green waste compost samples indicate
that they contain low to normal values for use in horticulture and agriculture
(Environment Agency, 2000).
On comparing the concentration of NO3-N and NH4-N in the biowaste compost
samples it can be seen that some of the samples, for example B1a, B2b, B4e, B4h, B4i
and B33 contained more NH4-N than NO3-N indicating that the composting process
may not have been complete and that immature compost was produced. (Fig 5.7 and
Fig 5.9). The concentration of NO3-N was higher then the concentration of NH4-N in
the green waste compost samples indicating that these samples were mature (Sánchez-
Monedero et al., 2001). Samples G3 and G4 contained no NO3-N or NH4-N (Fig.5.8
and 5.10).

Chapter 5 Discussion
Lorraine Herity, M.Sc. Environmental Engineering, Queens University of Belfast 78
5.2.4 Total Phosphorous (TP)
The average TP content was found to be 1.6% for the biowaste compost, which
exceeds the typical upper threshold of 1.1%. Eleven (42.3%) of the biowaste compost
samples had levels of TP outside of the recommended range. Samples B1a and B1b
showed exceptionally high levels for TP content which could be due to an analytical
or reporting error which biased the mean TP value (Fig 5.11). If TP values for
samples B1a and B1b were ignored, the mean value for TP would then be 0.5%,
which is within the typical range.
0123456789
1011121314151617
B1aB1bB2aB2bB2cB3aB3bB4aB4bB4cB4dB4e B4fB4gB4h B4i B4j
B4k B4lB4m B5
B6aB6bB6cB6dB6e
Biowaste Samples (n=26)
Tota
l Pho
spho
rous
(% d
ry w
t)
Fig 5.11 Graph of the TP (%) for each of the biowaste compost samples showing
recommended threshold levels.
The mean of TP for the green waste compost was 0.4% which is just at the
recommended lower threshold level of 0.4%. Two (28.6%) of the green waste
compost samples were below the lower threshold level (Fig 5.12).

Chapter 5 Discussion
Lorraine Herity, M.Sc. Environmental Engineering, Queens University of Belfast 79
0
0.1
0.2
0.3
0.4
0.5
0.6
0.7
G1b G1c G1d G1e G1f G3 G4
Green Waste Samples (n=7)
Tota
l Pho
spho
rous
(% d
ry w
t)
Fig 5.12 Graph of the TP (%) for each of the green waste compost samples showing
the recommended lower threshold level.
A t-test was carried out to see if there was a significant difference between the
unbiased means of TP for the two types of compost. From the results presented it can
be seen there was no significant difference, t=0.928, 12 df, p=0.371 (Table 5.3).
Overall, according to Bord na Mona (2003) and on considering the unbiased means,
TP was quite low in both composts.
Table 5.3 t-Test: Two-Sample Assuming Unequal Variances for unbiased means of
TP
t-Test Biowaste Green Waste
Mean 0.495 0.417
df 12
t Stat 0.928
P(T<=t) two-tail 0.371
t Critical two-tail 2.179
5.2.5 Available Phosphorous as PO4-P
The mean of the PO4-P content of the biowaste compost (48.9 mg/L) was found to be
quite low and just below the typical lower threshold level of 50 mg/L. Fifteen (62.5%)
of the biowaste compost samples were below the lower threshold level, while two
(8.3%) of the samples exceeded the upper threshold level of 120 mg/L of the typical
range (Fig 5.13).

Chapter 5 Discussion
Lorraine Herity, M.Sc. Environmental Engineering, Queens University of Belfast 80
020406080
100120140160180
B2aB2bB2cB3aB3bB4aB4bB4cB4dB4e B4fB4gB4h B4i B4j
B4k B4lB4m B5
B6aB6bB6cB6dB6e
Biowaste Samples (n=24)
Pho
spha
te-P
, (m
g/L,
fres
h w
t)
Fig 5.13 Graph of PO4-P (mg/L) content of the biowaste compost samples showing
recommended threshold levels.
The mean of the PO4-P content of the green waste compost was calculated to be 16
mg/L however, it must be noted that since there were only three samples available for
analysis, this value may not accurately represent the nationwide mean of PO4-P in
green waste compost. It was found that all the samples (100%) of the green waste
compost did not contain the typical minimum threshold concentration of PO4-P (Fig
5.14).
020406080
100120140160180
G2 G3 G4
Green Waste Samples (n=3)
Pho
spha
te-P
(mg/
L, fr
esh
wt)
Fig 5.14 Graph of PO4-P (mg/L) content of the green waste compost samples showing
recommended threshold levels.

Chapter 5 Discussion
Lorraine Herity, M.Sc. Environmental Engineering, Queens University of Belfast 81
5.2.6 Total Potassium (TK)
The average content of TK in the biowaste compost was found to be 3.7%, which is
quite high compared to other values quoted in the literature (Barker, 1997, Bord na
Mona, 2003). Samples B1a and B1b showed extremely high levels of TK compared to
the other samples which could be due to laboratory error and therefore biased the
mean (Fig 5.15). If TK values for samples B1a and B1b were ignored, the mean of the
other samples of the biowaste compost would have been 1.1% and within the typical
range of 0.6-1.7 % (Bord na Mona, 2003). Four samples (15.4%) of the biowaste
compost samples were found to be outside of the typical range (Fig 5.15).
0
5
10
15
20
25
30
35
40
45
B1aB1bB2aB2bB2cB3aB3bB4aB4bB4cB4dB4e B4fB4gB4h B4i B4j
B4k B4lB4m B5
B6aB6bB6cB6dB6e
Biowaste Samples (n=26)
Tota
l Pot
assi
um (%
dry
wt)
Fig 5.15 Graph of the TK (%, dry wt) in the biowaste compost samples showing
recommended threshold levels.
The mean of the TK in the green waste was 2.6%, which is greater than the upper
threshold level of the typical range. Samples G1e and G1f showed very high
concentrations of TK, which had a big influence on the mean value of TK (Fig 5.16).
Three (42.9%) of the samples of green waste compost were found to exceed the
typical upper threshold level of 1.7% (Fig 5.16).

Chapter 5 Discussion
Lorraine Herity, M.Sc. Environmental Engineering, Queens University of Belfast 82
0
1
2
3
4
5
6
7
G1b G1c G1d G1e G1f G3 G4
Green Waste Samples (n=7)
Tota
l Pot
assi
um (%
dry
wt)
Fig. 5.16 Graph of the TK (%) in the green waste compost samples showing
recommended threshold levels.
5.2.7 Available Potassium
The average content of available K in the biowaste compost was found to be 1112.4
mg/L, which is within the typical range of 620-2280. None of the samples exceeded
the upper threshold level while three samples (12.5%) of the biowaste compost were
below the lower threshold level (Fig 5.17).
0
500
1000
1500
2000
2500
B2aB2bB2cB3aB3bB4aB4bB4cB4dB4e B4fB4gB4h B4i B4j
B4k B4lB4m B5
B6aB6bB6cB6dB6e
Biowaste Samples (n=24)
Pot
assi
um (m
g/L,
fres
h w
t)
Fig 5.17 Graph of available K (mg/L) in the biowaste compost samples showing
recommended threshold levels.
In the green waste compost the mean concentration of 1211 mg/L of available K was
calculated which is also within the typical range. Only three samples of the green
waste compost were available for analysis, therefore this may not reflect a very

Chapter 5 Discussion
Lorraine Herity, M.Sc. Environmental Engineering, Queens University of Belfast 83
accurate mean value. One (33.3%) of the green waste compost samples was below the
lower threshold level of 620 mg/L.
5.2.8 Magnesium
The mean of the total concentration of magnesium in the biowaste compost samples
was found to be 0.2%, which is just within the typical range of 0.2-0.4%. Five
samples (55.6%) of the biowaste compost samples were found to be below the lower
threshold level (5.18). The concentration of the total magnesium in the compost is
quite low and is probably due to a low concentration of magnesium in the feedstock
material (Barker, 1997).
0
0.1
0.2
0.3
0.4
0.5
B4a B4b B4c B4d B4e B4fB4g B4l
B4m
Biowaste Samples (N=9)
Tota
l Mag
nesi
um (%
dry
wt)
Fig 5.18 Graph of the total magnesium (%) for each of the biowaste compost samples
showing recommended threshold levels.
5.2.9 Calcium
The mean of the total concentration of calcium in the biowaste compost samples was
calculated to be 1.53%, which is within the typical range of 1.0-4.0%. Two samples
(22.2%) of the biowaste compost samples were found to be below the lower threshold
level (Fig 5.19).

Chapter 5 Discussion
Lorraine Herity, M.Sc. Environmental Engineering, Queens University of Belfast 84
0
1
2
3
4
5
B4a B4b B4c B4d B4e B4fB4g B4l
B4m
Biowaste Samples
Tota
l Cal
cium
(%, d
ry w
t)
Fig 5.19 Graph of the total calcium (%) for each of the biowaste compost samples
showing recommended threshold levels.
5.3 OTHER PHYSICAL AND CHEMICAL PARAMETERS
Results of analysis of other important physical and chemical parameters of the
biowaste, green waste and the commercial organic compost are discussed below.
5.3.1 C:N Ratio
In this study the mean of the C:N ratio for the biowaste compost was calculated to be
16.5, which is below the recommended limit of 25 stipulated by the EPA. Only one
sample (3.9%) of the biowaste compost was found to be in excess of the EPA limit
which is an indication that this sample is immature compared to the other samples.
0
5
10
15
20
25
30
35
B1aB1bB2aB2bB2cB3aB3bB4aB4bB4cB4dB4e B4fB4gB4h B4i B4j
B4k B4lB4m B5
B6aB6bB6cB6dB6e
Biowaste Samples (n=26)
C:N
rat
io
Fig 5.20 Graph of the C:N ratios of the biowaste compost samples showing
recommended threshold levels.

Chapter 5 Discussion
Lorraine Herity, M.Sc. Environmental Engineering, Queens University of Belfast 85
In the green waste compost the mean of the C:N ratio was calculated to be 18.2 which
is below the EPA limit. Three samples (33.3%) were equal to or exceeded the EPA
limit and are most likely to be immature compost samples (Fig 5.21).
0
5
10
15
20
25
30
35
G1a G1b G1c G1d G1e G1f G2 G3 G4
Green Waste Samples (n=9)
C:N
rat
io
Fig 5.21 Graph of the C:N ratios of the green waste compost samples showing
recommended threshold levels.
The mean of C:N ratio for the commercial organic compost was found to be 13.8 with
no samples found to exceed the EPA limit (Fig 5.22). Therefore, according to the
EPA all the commercial organic compost samples are most likely to be mature.
0
5
10
15
20
25
30
C1a C1b C1c C1d C1e C2a C2b
Commercial Organic Samples (n=7)
C:N
rat
io
Fig 5.22 Graph of the C:N ratios of the commercial organic compost samples showing
recommended threshold levels.

Chapter 5 Discussion
Lorraine Herity, M.Sc. Environmental Engineering, Queens University of Belfast 86
5.3.2 pH Scale
The recommended range of pH for compost is between 6.9-8.3 (Bord na Mona, 2003).
The mean of the pH for the biowaste compost was found to be 7.7, which is within the
recommended range. Six samples (23.1%) were outside of the recommended range
(Fig 5.23).
.
0123456789
10
B1aB1bB2aB2bB2cB3aB3bB4aB4bB4cB4dB4e B4fB4gB4h B4i B4j
B4k B4lB4m B5
B6aB6bB6cB6dB6e
Biowast Samples (n=26)
pH
Fig 5.23 Graph of the pH for the biowaste compost samples showing recommended
threshold levels.
The mean of the green waste compost was found to be 7.6, which is also within the
recommended range. Two samples (22.2%) were outside of the range (Fig 5.24).
0123456789
10
G1a G1b G1c G1d G1e G1f G2 G3 G4
Green Waste Samples (n=9)
pH
Fig 5.24 Graph of the pH of the green waste compost samples showing recommended
threshold levels.

Chapter 5 Discussion
Lorraine Herity, M.Sc. Environmental Engineering, Queens University of Belfast 87
In the commercial organic compost samples the mean was found to be 6.1, which is
below the typical range. Four (57.1%) of the samples were outside of the range with
most of these samples being quite acidic (Fig 5.25).
0123456789
10
C1a C1b C1c C1d C1e C2a C2b
Commercial Organic Samples (n=7)
pH
Fig 5.25 Graph of the pH of the commercial organic compost samples showing
recommended threshold levels.
On comparing the means of pH there was a highly significant difference between the
means of the pH analysed for the different types of composts (p=0.000). The
commercial organic compost was the most acidic, which could be due to a greater
amount of food scraps such as fruit peelings in the feedstock, or the composting
process not having gone to full completion.
5.3.3 Moisture Content
The mean of the moisture content for the biowaste compost samples was found to be
47.2%, which is within the recommended range of 45-65%. Nine (37.5%) of the
samples were outside of the recommended range (Fig 5.26). Two of the samples were
found to be too wet, while seven of the samples did not contain adequate moisture
levels. In comparison to other parameters, there was not as much variation in moisture
content between samples from the same site.

Chapter 5 Discussion
Lorraine Herity, M.Sc. Environmental Engineering, Queens University of Belfast 88
0
10
20
30
40
50
60
70
80
B1aB1bB2aB2bB2cB3a B3bB4aB4bB4cB4dB4e B4fB4gB4h B4i B4j
B4k B4lB4mB6bB6cB6dB6e
Biowaste Samples (n=24)
Moi
stur
e (%
fres
h w
t)
Fig 5.26 Graph of the moisture content (%) of the biowaste compost samples showing
recommended threshold levels.
In the green waste compost samples the mean of the moisture content was 63.8%,
which is quite high and just within the recommended moisture range. Four (50%) of
the samples slightly exceeded the upper limit of the range (Fig 5.27).
01020304050607080
G1a G1b G1c G1d G1e G1f G2 G4
Green Waste Samples (n=8)
Moi
stur
e (%
fres
h w
t)
Fig 5.27 Graph of the moisture content (%) of the green waste compost samples
showing recommended threshold levels.
In the commercial organic compost samples the mean moisture content was 39%,
which is not within the recommended range. Five (71.4%) of the samples were
outside of the range. Site C1 used windrow composting technology while site C2 used
in–vessel composting technology. Variation in some quality parameters would be
expected using windrow technology, as there is limited control over the process.

Chapter 5 Discussion
Lorraine Herity, M.Sc. Environmental Engineering, Queens University of Belfast 89
However, the variation in moisture levels at site C2 was unexpected, as in-vessel
technology offers more control over the composting process and should produce
compost of more uniform quality than when using windrow technology (Brinton,
1992).
The same inconsistency in quality can be seen from Figure 5.28 where there was also
a marked variation in the pH of the compost from site C2. One of the samples had a
pH of 6.3 and the other a pH of 8.02.
0
10
20
30
40
50
60
70
80
C1a C1b C1c C1d C1e C2a C2bCommercial Organic Samples (n=7)
Moi
stur
e (%
fres
h w
t)
Fig 5.28 Graph of the moisture content (%) of the commercial organic compost
samples showing recommended threshold levels.
On comparing the means of moisture content for the biowaste, green waste and the
commercial organic waste, a highly significant difference between the means was
found (p=0.000). The green waste compost being the wettest and the commercial
organic compost the driest. Green waste feedstock composted in out-door windrows
often tends to have higher moisture content to feedstock that is composted in enclosed
conditions (Brinton and Brinton, 1992).
5.3.4 Organic Matter Content
The mean content of organic matter in the three types of composts analysed were all
greater than the lowest critical threshold level of 30% as specified by the EPA.

Chapter 5 Discussion
Lorraine Herity, M.Sc. Environmental Engineering, Queens University of Belfast 90
Only one of the biowaste compost samples was found to be just slightly below the
minimum critical threshold level. All the other individual samples of compost were
found to be above this critical level (Fig 5.29).
0
10
20
30
40
50
60
70
80
B1aB1bB2aB2bB2cB3a B3bB4aB4bB4cB4dB4e B4fB4gB4h B4i B4j
B4k B4lB4m B5
B6aB6bB6e
Biowaste Samples (24)
Org
anic
Mat
ter
(% d
ry w
t)
Fig. 5.29 Graph of the organic matter content (%) of the biowaste compost samples
showing recommended threshold levels.
There was only a slightly significant difference between the mean values of organic
matter in the three types of compost investigated (p= 0.045).
5.3.5 Conductivity
Bord na Mona state that the recommended range for conductivity in compost is
between 2,000-6,000 µS/cm. In the biowaste compost the mean conductivity of 4574
µS/cm was within this range. Four samples (15.4%) of the biowaste compost were
outside of this range (Fig 5.30).
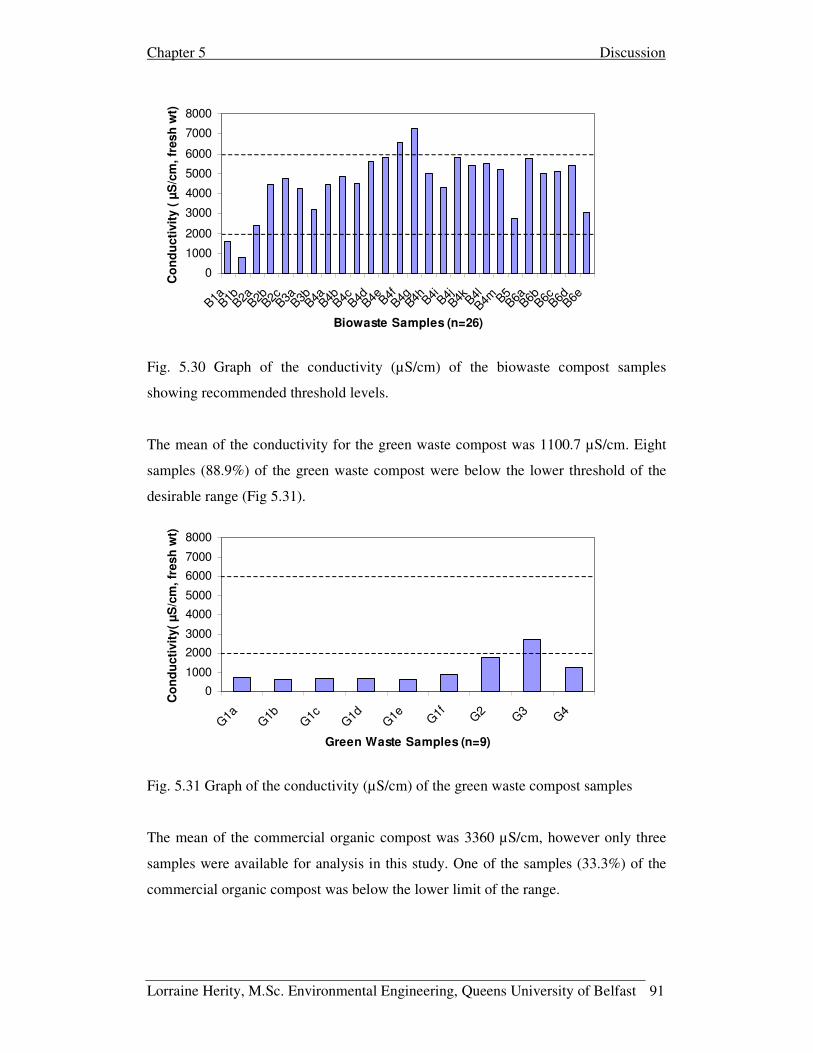
Chapter 5 Discussion
Lorraine Herity, M.Sc. Environmental Engineering, Queens University of Belfast 91
0
1000
2000
3000
4000
5000
6000
7000
8000
B1aB1bB2aB2bB2cB3aB3bB4aB4bB4cB4dB4e B4fB4gB4h B4i B4j
B4k B4lB4m B5
B6aB6bB6cB6dB6e
Biowaste Samples (n=26)
Con
duct
ivity
( µS
/cm
, fre
sh w
t)
Fig. 5.30 Graph of the conductivity (µS/cm) of the biowaste compost samples
showing recommended threshold levels.
The mean of the conductivity for the green waste compost was 1100.7 µS/cm. Eight
samples (88.9%) of the green waste compost were below the lower threshold of the
desirable range (Fig 5.31).
01000
20003000
40005000
60007000
8000
G1a G1b G1c G1d G1e G1f G2 G3 G4
Green Waste Samples (n=9)
Con
duct
ivity
( µS
/cm
, fre
sh w
t)
Fig. 5.31 Graph of the conductivity (µS/cm) of the green waste compost samples
The mean of the commercial organic compost was 3360 µS/cm, however only three
samples were available for analysis in this study. One of the samples (33.3%) of the
commercial organic compost was below the lower limit of the range.

Chapter 5 Discussion
Lorraine Herity, M.Sc. Environmental Engineering, Queens University of Belfast 92
There was a highly significant difference between the means of conductivity for the
biowaste compost and the green waste compost (p=0.000). This could be due to the
difference in input materials but also due to leaching of salts in the uncovered
windrows used for composting the green waste (Fricke and Vogtmann, 1994).
5.3.6 Dry Bulk Density
Results for bulk density were only available for thirteen samples of the biowaste
compost. The mean of the bulk density was calculated to be 306.7 g/L, which is
within the recommended range of 120-369 g/L. Two samples (15.4%) exceeded the
upper threshold of the recommended range (Fig 5.32).
050
100150200250300350400450500
B3b B4a B4b B4c B4d B4e B4fB4g B4h B4i B4jB4k B4l
Biowaste Samples (n=13)
Bul
k D
ensi
ty (g
/L, d
ry w
t)
Fig 5.32 Graph of the bulk density (g/L) for the biowaste compost samples showing
recommended threshold levels.
5.4 MATURITY
5.4.1 Self Heating Test
Of the five test results available for biowaste compost, four (80%) samples were
found to be of class stability IV that is described by the self heating test as curing
compost and is below the critical limit set out by the EPA. The other biowaste
compost sample was found to be in class III that is described as moderately active,
immature compost, which reheats to a temperature above 20°C of the ambient
temperature and hence exceeds the critical limit.
Six (75%) of the sample test results available for the green waste compost were found
to be in class of stability V that is described as a mature to very mature compost with

Chapter 5 Discussion
Lorraine Herity, M.Sc. Environmental Engineering, Queens University of Belfast 93
the maximum temperature rise less than 20°C above the ambient temperature. Two
(25%) of the samples were found to be in class of stability III which is described as a
moderately active, immature compost.
The samples of compost with a class of stability of III are not suitable for use in
horticulture due to the potential for self heating. For example, if this compost was
bagged and stored in a shed for six months, as it often is, there is a high risk of it
reheating and spoiling (Environment Agency, 2000).
Therefore, according to the self heating test results there was evidence that the green
waste compost samples were more mature than the biowaste compost samples. This
indicates that the green waste underwent a more complete composting process and
was allowed to mature for longer.
5.4.2 Oxygen Uptake Rate
Both of the biowaste compost samples (B1a, B1b) analysed for this quality parameter
exceeded the limit of 1000 mg O2 kg VS-1 h-1 indicating immature compost samples. It
was thought that the high amount of NH4-N compared to NO3-N for sample B1a,
indicated immature compost (section 5.2.3). This supports the findings of the oxygen
uptake rate test.
The mean of the oxygen uptake rate test result for green waste compost was below the
limit with only one sample exceeding it, indicating that the remainder of the compost
samples were mature according to the EU Biowaste Directive.
The mean of the oxygen uptake rate test result for commercial organic compost was
also below the limit with no samples exceeding it.
According to the oxygen uptake rate test results, there is evidence again that the green
waste compost samples were generally more mature than the biowaste compost
samples. Although it should be noted that only two biowaste samples test results for
this parameter were available.

Chapter 5 Discussion
Lorraine Herity, M.Sc. Environmental Engineering, Queens University of Belfast 94
5.4.3 Cress Germination Test
In the biowaste compost a mean germination rate of 87.8% was calculated which is
below the minimum threshold level of 90% by the EPA. Three (60%) of the samples
were below the minimum critical level.
In the green waste compost only two samples were available for analysis and both of
these did not meet the specified requirement.
5.4.4 Summary of Maturity Findings
On looking at the self heating test results and the oxygen uptake rate test results, none
of the seven biowaste compost samples were found to be fully mature while eleven
out of fourteen samples of the green waste compost samples were found to be mature.
On visiting various composting facilities and following discussions with facility
operators it was evident that sometimes there was not enough adequate storage space
available on site to allow the compost to fully mature which made process
management very difficult to maintain and in turn may result in poor quality,
immature compost being produced.
5.5 FOREIGN MATTER
5.5.1 Impurities
The mean content of impurities (1.8%) in the biowaste compost was found to be
greater than the limit of 0.5%. Eleven (52.4%) of the biowaste compost samples
exceeded this limit (Fig 5.33). Three was a considerable amount of variation in the
presence of impurities in the compost at site B4. Sample B4b, B4d, B4e, B4h and B4i
contained excessive amounts of impurities while some of the other compost samples
at this site contained levels of impurities below the limit. The high amount of
impurities was probably due to the facility composting feedstock, which contained too
many impurities due to insufficient source segregation. Increased preliminary
screening and post process screening may have helped in reducing the amount of
impurities present in the compost. Compost samples at site B1 contained zero
impurities in the compost samples.

Chapter 5 Discussion
Lorraine Herity, M.Sc. Environmental Engineering, Queens University of Belfast 95
0123456789
101112
B1a B1b B2a B2b B2c B3a B3b B4a B4b B4c B4d B4e B4fB4g B4h B4i B4j
B4k B4lB4m B6e
Biowaste Samples (n= 21)
Impu
ritie
s (%
, dry
wt)
Fig 5.33 Graph of impurities (%) in the biowaste compost samples showing the
statutory limit specified by the EU Biowaste Directive.
In the green waste compost the mean of 1.5% of impurities found in the compost also
exceeded the critical limit. However, this high mean was due to sample G4 which
contained excessive amounts of impurities (Fig 5.34). Sample G4 (12.5% of the
samples) was the only sample to exceed the limit. All the other samples of green
waste compost contained zero or small amounts of impurities
0123456789
101112
G1a G1b G1c G1d G1e G1f G2 G4
Green Waste Samples (n=8)
Impu
ritie
s (%
, dry
wt)
Fig 5.34 Graph of impurities (%) in the green waste compost samples showing the
statutory limit specified by the EU Biowaste Directive.

Chapter 5 Discussion
Lorraine Herity, M.Sc. Environmental Engineering, Queens University of Belfast 96
There were only three samples available for the commercial organic compost, which
contained a mean of 0.28% impurities, which is below the critical limit. None of the
samples exceeded the limit.
The biowaste compost contained a significantly higher percentage (52.4%) of samples
exceeding the statutory limit compared to the green waste compost (12.5%). This is
often attributable to the fact that green waste compost contains a more homogenous
feedstock (US EPA, 1994) compared to biowaste compost and will in turn contain
significantly less impurities as this study as shown.
5.5.2 Gravel and Stones
The number of samples which exceeded statutory limits specified by the EPA and the
EU Biowaste Directive are given in Table 5.4.
Table 5.4 Samples Exceeding the Statutory Limits Specified by
the EPA and EU Biowaste Directive
Parameters Units No.1 SD 2 CL3
% Exceeding
the CL
Biowaste
Impurities %(> 2 mm) 21 3 <0.5 52.4
Gravel and Stone %(> 5 mm) 19 6.8 <5 36.8
Green Waste
Impurities %(> 2 mm) 8 3.9 <0.5 12.5
Gravel and Stones %(> 5 mm) 7 2.2 <5 14.3
Commercial Organics
Impurities %(> 2 mm) 3 0.2 <0.5 0
Gravel and Stones %(> 5 mm) 3 1.6 <5 66.7
In the biowaste compost the mean (6%) of gravel and stones present in the compost
slightly exceeded the statutory limit of 5%. Seven samples (36.8%) exceeded this
limit. A lot of variation in the percentage content of gravel and stones was also
evident in site B4 where some samples such as B4e, B4f, B4g, B4l and B4m greatly
exceeded the critical limit while other samples at this site were below the limit (Fig
5.35).

Chapter 5 Discussion
Lorraine Herity, M.Sc. Environmental Engineering, Queens University of Belfast 97
0
5
10
15
20
25
B1a B1b B2a B2b B2c B3a B3b B4a B4b B4c B4d B4e B4fB4g B4j
B4k B4lB4m B6e
Biowaste Samples (n=19)
Gra
vel a
nd S
tone
s (%
dry
wt)
)
Fig 5.35 Graph of gravel and stones content (%) in the biowaste compost samples
showing the statutory limit specified by the EU Biowaste Directive.
In the green waste compost a favourable mean of 2.6% of gravel and stones was
calculated which is below the critical limit. One sample (14.3%) was found to exceed
the limit (Fig 5.36).
0
5
10
15
20
25
G1a G1b G1c G1d G1e G1f G2
Green Waste Samples (n=7)
Gra
vel a
nd S
tone
s (%
, dry
wt)
Fig 5.36 Graph of gravel and stones content (%) in the green waste compost samples
showing the statutory limit specified by the EU Biowaste Directive.
Only three commercial organic compost samples were available for analysis and
hence this small sample number only gives a slight indication of the presence of
gravel and stones in the compost. The mean value was found to be 6.6% which is over
the statutory limit. Two out of the three samples exceeded the limit.

Chapter 5 Discussion
Lorraine Herity, M.Sc. Environmental Engineering, Queens University of Belfast 98
Statistical analysis showed that on comparing the means of gravel and stones in the
biowaste and green waste compost there was no significant difference between the
means ( p=0.068).
5.6 PATHOGENS
5.6.1 Faecal Coliforms
In the biowaste compost the mean number of coliforms was calculated to be 112.2
MPN/g, which is well below the limit of 1000 MPN/g. Only one sample (4.8%) of the
biowaste compost was found to exceed the critical limit (Fig 5.37).
0100200300400500600700800900
100011001200
B1a B1b B2a B2b B2c B3a B3b B4a B4b B4c B4d B4e B4fB4g B4h B4i B4j
B4k B4lB4m B6e
Biowaste Samples (n=21)
Faec
al C
olifo
rms
(MP
N/g
)
Fig 5.37 Graph of the presence of faecal coliforms (MPN/g) in the biowaste compost
samples showing the statutory limit specified by the EU Biowaste Directive.
The green waste compost had a slightly higher mean of 221.67 MPN/g, which is also
below the critical limit. None of the individual samples exceeded the limit as can be
seen from Figure 5.38.

Chapter 5 Discussion
Lorraine Herity, M.Sc. Environmental Engineering, Queens University of Belfast 99
0100200300400500600700800900
100011001200
G1b G1c G1d G1e G1f G2
Green Waste Samples (n=6)
Faec
al C
olifo
rms
(MP
N/g
)
Fig 5.38 Graph of the presence of faecal coliforms (MPN/g) in the green waste
compost samples showing the statutory limit specified by the EU Biowaste Directive.
5.6.2 Salmonella
In the biowaste compost the mean concentration of salmonella was found to be 286.5
MPN/50g which was due to salmonella present in two (9.5%) of the biowaste
samples. The two samples B1a and B1b originated from the same site with the cause
of the contamination due to the presence of chickens located near the composting site,
which have since been removed from the vicinity (Gill, 2003). Salmonella was absent
in all the other biowaste samples. No Salmonella was present in the other biowaste
compost samples.
No salmonella was found in the green waste compost, which is compliant with the
sanitation requirements of the EU Biowaste Directive.
5.7 OVERALL QUALITY OF IRISH COMPOST
From the analysis carried out it was evident that the heavy metal content of Irish
compost is not a serious factor affecting compost quality. Heavy metal content was
more or less similar in the biowaste and green waste compost.
Many of the biowaste compost samples were classified as Class I or Class II compost
according to the EU Biowaste Directive. However, when other quality parameters
such as impurities and gravel and stones were considered the quality of the compost
decreased significantly. Compost samples which would otherwise have been classed

Chapter 5 Discussion
Lorraine Herity, M.Sc. Environmental Engineering, Queens University of Belfast 100
as Class I or Class II compost, were then classified as stabilised biowaste or non-
conforming samples (Table 5.5). These classifications could seriously deter the sale of
compost in certain sectors of the markets in which it can be used. Stabilised biowaste
is very often used as a landfill cover or in landfill restoration and has very little added
market value. Care has to be taken here to avoid a loophole in which biodegradable
waste finds its way back into landfills (Favoino, 2000).
Overall, the quality of the green waste compost was higher than the biowaste compost
due to lower amounts of impurities and gravel and stones in the samples analysed and
a greater maturity of the compost samples The green waste compost therefore will be
a lot easier to market and with less restrictions if it is to be used in agriculture.
As the quality of compost can vary so much, as seen in this study, it is important to
choose feedstock whilst adjusting processing procedures, according to a pre-
determined end use of the compost (Rogalaski et al., 2002).
Table 5.5 Summary of the overall classification of samples of biowaste and green
waste compost according to the EU Biowaste Directive.
Standard
Biowaste
Compost
(n=20)
Green Waste
Compost
(n=8)
Class I 1 (5%) 3 (37%)
Class II 2 (20%) 3 (37%)
Stabilised Biowaste 12 (60%) 1 (13%)
Non-conforming
to both standards 5 (15%) 1 (13%)

Chapter 5 Discussion
Lorraine Herity, M.Sc. Environmental Engineering, Queens University of Belfast 101
Classification of Biowaste Compost (n=20)
5% 10%
60%
25%
Class I Class II Stabilised Biowaste Non-Conforming
Classification of Green Waste Compost
37%
37%
13%
13%
Class I Class II Stabilised Biowaste Non-Conforming
Fig 5.39 Graphs showing the percentage classes of Biowaste and Green waste
compost according to the proposed EU Biowaste Directive.

Chapter 6 Conclusions and Recommendations
Lorraine Herity, M.Sc. Environmental Engineering, Queens University of Belfast 102
6.0 CONCLUSIONS AND RECOMMENDATIONS
Heavy Metal Content of the Compost
On classifying the biowaste and green waste compost according to the specifications
of the EU Biowaste Directive, according to heavy metal content, the green waste
compost was of a slightly better quality. Nearly half of the samples of both types of
compost were classified as Class I and the other half as Class II compost. However,
two (8.3%) of the biowaste samples were non-conforming to the statutory limits
specified by the standard. There was no major concern regarding heavy metal content
of biowaste and green waste compost. Commercial organic compost contained the
highest concentration of heavy metals. One (9.1%) of the samples was classified as
Class I compost and three (42.9%) of the samples as Class II compost. Three (42.9%)
of the samples were classified as stabilised biowaste and three (42.9%) as non-
conforming. Only one facility was analysed for heavy metal content of sludge
compost, with low concentrations of heavy metals occurring although, one of the
samples was classified as non-conforming.
• Correlations Between Heavy Metals
The most significant correlations between heavy metals were found between copper
and zinc, copper and lead, zinc and lead and zinc and nickel in the green waste
compost. These findings may allow laboratories to limit heavy metal testing and
therefore carry out single tests for pairs of strongly correlated heavy metals. This
would in turn, limit the costs of compost quality testing for facility operators. No
significant correlations were found between heavy metals in the biowaste or
commercial organic compost.
• Heavy Metal Content of Irish Compost Compared to Compost from Other
Countries
Irish biowaste compost compared most favourably with biowaste compost from
Germany, Austria and the UK on comparing heavy metal content. However, the
mercury content was slightly elevated in comparison to these countries. It is thought
that this may be due to outlier data of two samples caused by analytical error in the
laboratory. Irish Green waste compost green contained similar, or more often, lower

Chapter 6 Conclusions and Recommendations
Lorraine Herity, M.Sc. Environmental Engineering, Queens University of Belfast 103
concentrations of heavy metals when compared to green waste compost from
Germany, Austria and Australia.
• Variability Between Heavy Metal Concentrations in the Compost Samples
A lot of variability especially in the biowaste compost was found between sites and
within sites when analysing the heavy metal content of the composts. It was thought
that variability in heavy metal concentrations, within sites, may have been caused by a
range of /or a mixture of factors which include; inadequate control over the
composting process, seasonal factors having an influence on heavy metal
concentrations, or batches of feedstock coming from specific areas where there is
relatively high levels of contamination.
• Nutrient Content
The biowaste compost contained adequate amounts of TN and available NO3-N and
could be considered as having fertilising capabilities and be used as an organic
fertiliser in agriculture and in container production of crops. The green waste compost
also contained sufficient amounts of TN however, some of the green waste compost
samples were quite low or deficient in available NO3-N for use in growing media and
therefore, it was recommended that the green waste compost be used as mulch. The
biowaste compost contained sufficient amounts of available NO3-N for use in
growing media, although a lot of variation in NO3-N concentrations was found
between sites and within sites. More regulated control over the biological process
especially with regard to pH, temperature, and moisture will have an influence on
nitrogen turnover from organic forms into inorganic forms and therefore allow
compost to be produced with more predictable fertilising capabilities (Körner and
Stegmann 2003). The concentration of TP and available PO4-P was found to be quite
low in the biowaste and green waste compost. The biowaste and green waste compost
contained adequate to high concentrations of potassium. High potassium
concentrations of these composts could restrict its use in growing media, especially
where young plants are concerned. Biowaste compost contained sufficient amounts of
calcium required for plant growth. However, it contained low concentrations of
magnesium.

Chapter 6 Conclusions and Recommendations
Lorraine Herity, M.Sc. Environmental Engineering, Queens University of Belfast 104
• Maturity
None of the biowaste samples were found to be fully mature, while eleven of the
green waste samples were found to be mature. The area needed for compost storage
especially during the maturation stage was very often not available at biowaste
compost facilities. This will make process management very difficult and can result in
a low quality product that has not reached full maturity and thereby, limit its
marketability.
• Foreign Matter
High levels of impurities and gravel and stones in the biowaste compost caused
significant problems and resulted in a lot of the samples which may otherwise have
been classified as Class I or Class II compost according to heavy metal
concentrations, being classified as stabilised biowaste or worse again as non-
conforming samples. Because of such classifications the biowaste compost could
incur severe restrictions in its use. Such concentrations of impurities may especially,
inhibit the use of compost in horticulture and landscape gardening. The presence of
impurities and gravel and stones was not as significant in the green waste compost.
Only one of the samples which was classified as Class I compost according to heavy
metal content, was subsequently, classified as stabilised biowaste because of too a
high a content of gravel and stones in the compost sample.
• Variability Amongst Other Quality Parameters
A lot of variability was also found in the compost samples within sites and between
sites on analysing other parameters, apart from heavy metals. Variability will limit the
use of compost in growing media as it can cause significant problems in horticulture if
it affects growth rates, nutrition, or plant aesthetics, as successful container production
of crops and plants rely on growing media to produce consistent quality plants. Poor
quality compost will inhibit the widespread use of compost and the development of
future markets for the product.
• Overall Quality of The Biowaste and Green Waste Compost
In biowaste compost samples, one sample was classified as Class I compost, two as
Class II compost, twelve as stabilised biowaste and five as non-conforming samples.

Chapter 6 Conclusions and Recommendations
Lorraine Herity, M.Sc. Environmental Engineering, Queens University of Belfast 105
Three of the green waste samples were classified as Class I compost, three as Class II
compost, one as stabilised biowaste and one as a non-conforming sample. The green
waste was of a higher quality mainly due to low concentrations of impurities and
gravel and stones, and greater levels of maturity. It is important to recognise and
acknowledge that poor quality compost will inhibit the widespread use of compost
and the development of future markets for the product.
• Laboratory Units for Reporting Results
Units of reporting test results need to be more standardised to ensure that facility
operators are able to fully interpret and have a good understanding of the results.
Laboratories should adopt the specific units specified in the EU Biowaste Directive
when reporting compost quality results for the parameters therein.
RECOMMENDATIONS
• Improved source segregation, pre- processing and post-processing of the biowaste
are highly recommended to decrease the amount of impurities and gravel and
stones in compost.
• It is recommended that every load of feedstock undergo a visual entrance
inspection and the contaminants be removed by adequate screening, or the load be
rejected if it contains too much contamination.
• Consistent loads of contaminated biowaste should be traced back to the specific
area where it came from and residents and suppliers from these areas be made
more aware of the importance of source segregation and how to actually carry out
proper source segregation of biowaste.
• The lack of consistency in producing a product of uniform quality and content at
individual sites is important to address in the future if these facilities are to fully
succeed in marketing its product. This could be done by greater control over the
physical and biological processing and by allowing the compost to fully mature
over time.

Chapter 6 Conclusions and Recommendations
Lorraine Herity, M.Sc. Environmental Engineering, Queens University of Belfast 106
• Feedstock intended for composting should be chosen with the end use in mind,
whilst adjusting processing procedures accordingly, and producing a pre-
determined quality compost product.
• It is strongly recommended to ensure adequate storage areas in new and existing
facilities, and to ensure that the product is stored in a manner where it is protected
from excess moisture, and there is no possibility of the re-introduction of
pathogens to the compost.
• Laboratories should start to report heavy metals in mg/kg of dry weight for an
organic matter content of 30%. This will allow an easier comparison of data of
different composts as it eliminates the effect of compost maturity and compost
with low organic matter content will not be subjected to stricter statutory limits.
• Laboratories should adopt the specific units specified in the EU Biowaste
Directive when reporting compost quality results for the parameters therein.
• Composting must be seen as an environmentally safe and sustainable process in
which a high quality product with many beneficial attributes and uses is produced
instead of a means of waste management. Otherwise, there is a risk of producing
great amounts of compost with no added market value.
• The introduction of a national compost standard and a quality assurance scheme is
crucial to ensure the quality of compost and to assistant in the development of
viable and sustainable markets and outlets for the product.
Further Research
• More research is required into physical and biological processing technologies so
that optimum configurations and effective and efficient systems can be designed
with a particular emphasis on contaminant screening systems recommended.
• To confirm correlations between heavy metals, more detailed research on a larger
scale is required. This should take into account the time of year and the season in
which the feedstock is composted.

Chapter 6 Conclusions and Recommendations
Lorraine Herity, M.Sc. Environmental Engineering, Queens University of Belfast 107
• Growing trials should be undertaken with a variety of biowaste and green waste
composts, over a period of 3-5 years to determine the long-term benefits to the
soil physical environment and its nutrient availability to plants. This would instil
confidence in farmers to utilise compost to a greater degree and promote the use
of compost as an organic fertiliser.
• More research should be carried out the quality of industrial sludge compost
especially concerning the presence of substances such as antibiotics and hormones
and more detailed study on the quality of commercial organic compost should take
place, as the composting of both of these waste streams is growing in Ireland at
the present.

References
Lorraine Herity, M.Sc. Environmental Engineering, Queens University of Belfast 108
REFERENCES
• Anon, 1998, Testing Compost, The Ohio State University Extension Fact Sheet,
ANR-15-03.
• Barker, A.V., 1997, Composition and Uses of Compost, Agricultural Uses of By-
Products and Wastes ASC Symposium Series, American Chemical Society,
668:140-162.
• Barth, J and H., Stöppler-Zimmer, 1998, Compost Quality In Europe, Biocycle,
August Edition.
• Barth, J., 2003, Biological Waste Treatment In Europe-Technical and Market
Developments, available at:
http://www.bionet.net/en/waste/print.
• Bezdicek, D., Fauci, M., Caldwell, D., and Finch, R., 2000, Compost Quality, New
Threats from Persistent Herbicides,
available at:
http://www.tricity.wsu.edu/aenews/Oct00AENews/Oct00AENews.htm.
• Biey, E.B., H., Mortier and W., Verstraete, 2000, Nitrogen transfer from grey
municipal solid waste to high quality compost, Bioresource Technology, 73: 47-
52.
• Biotreat, 2003, Interpretation of Results Report, available from Biotreat , National
Food Biotechnological Centre, University college Cork, Ireland.
• Bord na Mona, 2003, Compost Testing And Analysis Service – Interpretation of
Results, available from Bord na Mona, Newbridge, Co. Kildare.

References
Lorraine Herity, M.Sc. Environmental Engineering, Queens University of Belfast 109
• Brinton W.F., and R.B., Brinton, 1992, MSW Composting: Old History, New
Challenges, MSW Composting Report REV 2.0, Woods End Research, Mt
Vernon, USA.
• Brinton, W.F, 2001, Compost Maturity Effects on Plant and Root Performance,
Biodynamics, 233: 22-27.
• Brinton, W.F, 2003, Interpretation of Waste and Compost Tests, Journal of the
Woods End Research Laboratory, Vol 1. No.4.
• Cabanas-Vargas, D.D and E. I., Stentiford, 2003, Designing compost maturation
facilities based on maintaining aerobic conditions, School of Civil Engineering,
The University of Leeds. Leeds, United Kingdom.
• Cabrera, G.L, D.M.G., Rodriguez and A.B., Maruri, 1999, Genotoxicity of the
extracts from the compost of the organic and the total municipal garbage using
three plant assays, Mutation Research, 426: 201-206.
• Canet, R., and F., Pomares, 1994, Changes in Physical, Chemical and Physico –
Chemical Parameters During The Composting Of Municipal Solid Wastes in Two
Plants In Valencia, Bioresource Technology, 51: 259-264.
• Chancy, R.L., 1991, Land application of composted municipal solid waste, Public
health, safety, and environmental issues, As cited in proceedings of the Northeast
Regional Solid Waste Composting Conference, June 24-25, Albany, New York.
• Commission of the European Communities, 2001: Working Document on the
Biological Treatment of Biowaste, 2nd draft, Brussels, February 12, 2001, DG
ENV.A.2, 2001.
• Cré - Composting Association of Ireland Teo, 2003, Cré Newsletter, Vol 1 (4).

References
Lorraine Herity, M.Sc. Environmental Engineering, Queens University of Belfast 110
• De Guardia, D., S., Burnet, D., Rogeau and G., Matejka, 2002, Fractionation and
characterisation of dissolved organic matter from composting green wastes,
Bioresource Technology, 83: 181-187.
• Déportes, I., J.L Benoit-Guyod and D. Zmirou, 1995, Hazard to man and the
environment posed by the use of urban waste compost: a review, The Science of
The Total Environment, Vol 172: 197-222.
• Environment Agency, 2000, An Assessment of the Quality of Waste Derived
Composts Produced by a Range of Processes, Environment Agency, Research and
Development Technical Report p229.
• Eunomia, 2001, Economic Analyses OF Options For Managing Biodegradable
Municipal Waste, Final Report to the European Commission.
• Favoino, E, 2000, Composting across Europe, Leading experiences and
developing situations: ways to success, Internet Reference available at:
http://www.hua.gr/compost.net/Favoino%202,%20composting%20across%20Eur
ope.pdf.
• Fricke, K., and H., Vogtmann, 1994, Compost Quality: Physical Characteristics.
Nutrient Content, Heavy Metals and Organic Chemicals, Toxicological and
Environmental Chemistry, Vol 43: 95-114.
• Gill, O, 2003, Personal Communication with facility manager regarding
contamination at the composting site.
• Hicklenton, P.R., V. Rodd and P.R. Warman, 2001, The effectiveness and
consistency of source-separated municipal solid waste and bark composts as
components of container growing media, Scientia Horticulture, Vol 91: 365-378.
• Hogg, D., J., Barth, E., Favoino, M., Centemero, V., Caimi, F., Amlinger, W.,
Devliegher, W., Brinton and S., Antler, 2002, Comparison of Compost Standards

References
Lorraine Herity, M.Sc. Environmental Engineering, Queens University of Belfast 111
Within the EU, North America & Australasia, Main Report Section 1, WRAP,
Oxon.
• Hoyos, S.E.G., J.V., Juarez, C.A., Ramonet, J.C., Lopez, A.A., Rios and E.G.,
Uribe, 2002, Aerobic thermophilic composting of waste sludge from gelatin-
grenetine industry, Resources, Conservation and Recycling, Vol 34:161-173.
• Iglesias-Jiménez, E., 2001, Nitrogen availability from a mature compost
determined by the 15N isotope dilution method, Soil Biology & Biochemistry, Vol
30: 409-412.
• Körner, I., and R., Stegmann, 2003, Influence of Biowaste Composition And
Composting Parameters On The Nitrogen Dynamics During Composting And On
Nitrogen Contents In Composts, Paper presented at the International Symposium
on Composting & Use of Composted Material In Horticulture.
• Kepp, U., O. E., Solheim and S., Molde, 2000, Thermal Hydrolysis as
Pretreatment of Digestion Feed, Cambi, available at:
http://www.cambi.com/publications/sludge/Foredrag%20-%20Stavanger.PDF.
• Lazzari, L., L., Sperni, P., Bertin and B., Povoni, 2000, Correlation between
inorganic (heavy metals) and organic (PCB’S and PAH’s) micropollutants during
sewage sludge composting process, Chemosphere, 41: 427-435.
• Ludwig, J.A and J.F. Reynolds, 1998, Statistical ecology, New York, Wiley.
• McKinley, 2003, personal communication regarding compost maturity, Biotreat
Laboratories.
• Mcknight Foundation Collaborative Crop Research Program, 2003, New Data on
Phosphorous Acquisition, available at:
http://www.google.ie/search?q=cache:UT5E774KLd0J:www.hu-
more.com/document/Ag%2520Compost%2520Brochure%2520-%25202-8-

References
Lorraine Herity, M.Sc. Environmental Engineering, Queens University of Belfast 112
02.pdf+Humalfa+compost+new+data+on+phosphorus+acquisition&hl=en&ie=U
TF-8.
• Mead, R., R.N. Curnow and A>M> Hasted, 1993, Statistical methods in
agriculture and experimental biology, 2nd edition, London, Chapman & Hall.
• Oosthnoek, J., and J.P.N. Smit, 1987, Future of Composting in the Netherlands,
Bioycle, Vol 7: 37-39.
• Prasad, M, 2003, Heavy Metals and Pathogens Present in Irish Compost, Paper
Presented at the Cré Composting Association of Ireland 3rd Annual Composting
Seminar.
• Price, J.L., 2001, The landfill directive and the challenge ahead: demands and
pressures on the UK householder, Resources and Conservation & Recycling, Vol
32: 333-348.
• Reinhofer, M., E., Steinlechner and P., Trinkhaus, 2002, Compost Quality, Heavy
Metal Contamination in Biowaste and Biowaste Compost – A Case Study,
presented at the VIIth International Symposium Waste Management Zagreb.
• Richard, T.L., 1992, Municipal Solid Waste Composting, Physical and Biological
Processing, Biomass and Bioenergy, 3, (3-4), 195-211.
• Rogalski, F.P., G Gilnreiner and E. Erhart, 2002, Vienna’s biowaste compost-
quality development and effects of input materials, Waste Management &
Research, Vol 20: 127-133.
• Rynk, R et al., 1992, On-Farm Composting Handbook, Ithaca, New York:
Cooperative Education, Northeast Regional Agricultural Engineering Service
• Sánchez-Monedero, M.A., A. Roig, C., Parades and M.P., Bernal, 2001, Nitrogen
transformation during the organic waste composting by the Rutgers system and its

References
Lorraine Herity, M.Sc. Environmental Engineering, Queens University of Belfast 113
effects on pH, EC and maturity of the composting mixtures, Bioresource
Technology, Vol 78: 301-308.
• The Composting Council of Canada (a), 2002, The Composting Process:
Feedstock Management, available at:
http://www.compost.org/sheet_5.PDF.
• The Composting Council of Canada (b), 2002, The Composting Process:
Fundamental Processes, available at:
http://www.compost.org/sheet_1.PDF.
• Tuomela, M., M. Vikman, A. Hatakka and M. Itävaara, 2000, Biodegradation of
lignin in a compost environment: a review, Bioresource Technology, Vol 72: 169-
183.
• US Composting Council, 2003, STA Test Parameters, available at:
http://tmecc.org/sta/compost_attributes.html.
• US EPA, 1994, Composting Yard Trimmings and Municipal Solid Waste, EPA
S30-R-94-003.
• Woods End Research Laboratory, 1998, Interpretation of Waste and Compost
Tests, Journal of the Woods End Research Laboratory, Vol 1 (4).
• Wilkinson, K, R. Paulin, E. Tee and P.O’Malley, 2002, Grappling With Compost
Quality Down Under, Biocycle, September, 2002.
• Zethner, G., B Götz and F, Amlinger, 2000, Quality of Austrian Compost from
Derived Waste Collection – Summary, available at;
http://www.ubavie.gv.at/publikationen/Mono/M133s.HTM.

Lorraine Herity, M.Sc. Environmental Engineering, Queens University of Belfast 114
APPENDIX 1
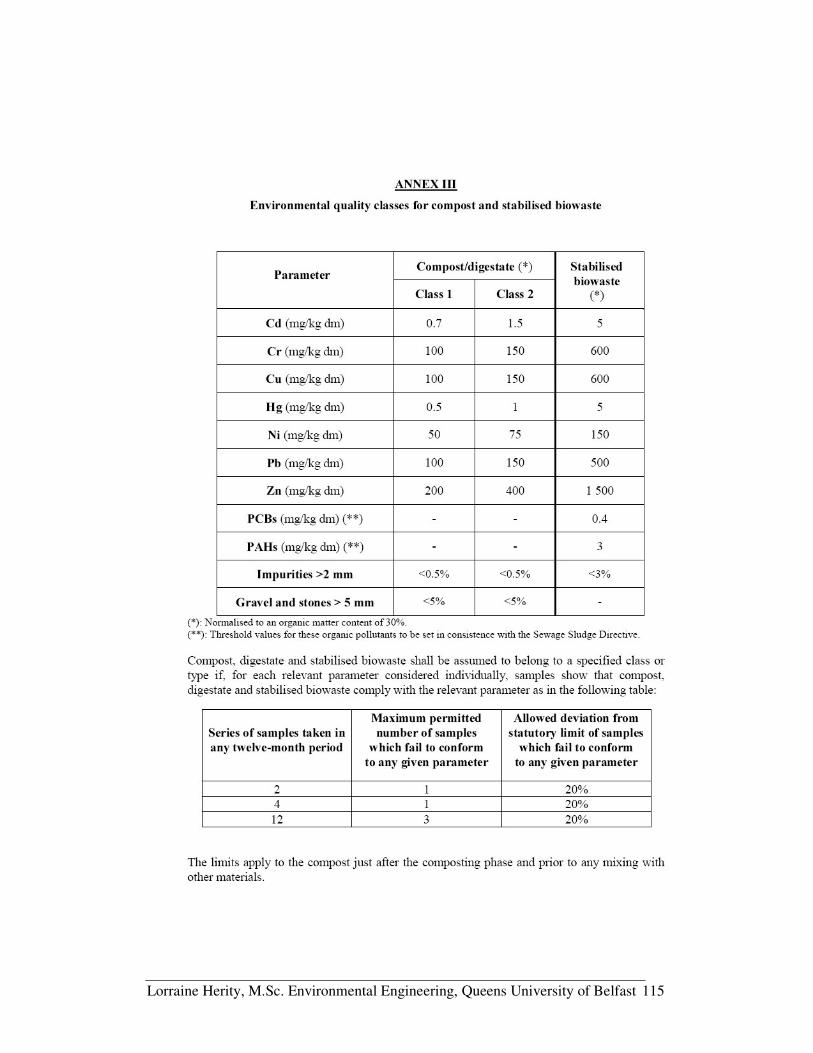
Lorraine Herity, M.Sc. Environmental Engineering, Queens University of Belfast 115

Lorraine Herity, M.Sc. Environmental Engineering, Queens University of Belfast 116

Lorraine Herity, M.Sc. Environmental Engineering, Queens University of Belfast 117
APPENDIX 2

Lorraine Herity, M.Sc. Environmental Engineering, Queens University of Belfast 118
Appendix 2 Various Types of Composting Technology
(a) a typical windrow
(b) an aerated static pile
(c) In-vessel composting

Lorraine Herity, M.Sc. Environmental Engineering, Queens University of Belfast 119
A VAR Aerated Static Pile at Sandy Road Composting Facility, Galway, Ireland

Lorraine Herity, M.Sc. Environmental Engineering, Queens University of Belfast 120
APPENDIX 3

Lorraine Herity, M.Sc. Environmental Engineering, Queens University of Belfast 121
Appendix 3 Pre-Processing and Separation techniques for sorting feedstock
prior to biological
Below is an outline of separation techniques used in the composting of MSW.
• Screens
Trommels are often used for the separation of non – compostable materials in
feedstock, as outlined in body of text.
A Trommel as seen at Sandy Road Composting Facility
• Manual Separation
When feedstock materials have been reduced to similar sizes it becomes practical to
sort out the remaining contaminants as the feedstock moves along a conveyor belt
Richard, 1991).
• Magnetic Based Separators
Magnetic separators are used to remove ferrous material from feedstock as it moves
along a conveyor belt. Because they are inexpensive and effective they can be used at
various points throughout the composting facility. Two magnetic separators usually

Lorraine Herity, M.Sc. Environmental Engineering, Queens University of Belfast 122
work in-series to increase ferrous removal. Magnetic separation is effective for iron
and steel but not for aluminum, copper and other non-ferrous metals.
• Eddy Current Separators
Eddy current separators are used to separate non- ferrous materials from the feedstock
(Fig???). High-energy electromagnetic fields that induce an electrical charge in non-
ferrous metals and other materials that conduct electricity are generated. These
materials are then repelled by the non-charged materials in the feedstock and
subsequently removed. Eddy current separation should follow magnetic separation to
minimise contamination by ferrous materials (EPA, 1994).
AN EDDY CURRENT SEPARATOR
Source: EPA, 1994
• Air Classifiers
Air classifiers are additional separation techniques used in some composting facilities.
They are used to separate feedstock on the basis of weight differences. Heavier
fractions such as glass and metals are removed from lighter materials such as paper
and plastic. The main part of the air classifier is the ‘throat’ where material is fed. An
air blower then sucks the lighter material up thorough the throat. They then enter a
cyclone separator where they looses velocity and settle out. Heavier materials fall
directly out of the throat. Some of this material may also consist of compostbale

Lorraine Herity, M.Sc. Environmental Engineering, Queens University of Belfast 123
material as food material. Plastics and sometimes paper are then removed from the
lighter phase with the remainder composted (Richard, 1991).
Air Classifiers
• Wet Separation Techniques
Wet separation techniques are work on a similar principle as air classifiers in that it is
based on density differences. Instead of an air medium there is a water medium in
which the heavy material drops into a sloped tank where it moves to a removal zone.
The lighter organic material floats where it is removed form the reticulating water
using separation techniques similar to that used in wastewater treatment plants. This
type of separation technique is particularly useful in removing heavy objects such as
glass and other sharp objects.
• Balstic Separators
Balsitic separators work on the differences in densities and elasticity between inert
and organic materials.

Lorraine Herity, M.Sc. Environmental Engineering, Queens University of Belfast 124
Size Reduction Technologies for Reducing Particle Size Prior to Biological
Processing
HAMMERMILL
Source: US EPA 530-R-94-003, 1994
Hammermills consist of swinging rotating hammers, which pound the feedstock and
reduce it into smaller particles. They are energy intensive with the hammers needing
replacement on a regular basis.
Shear Shredders consist of a pair of rotating knives or hooks, which rotate at a low
speed with high torque. The shearing action tears or cuts up material, which also
opens up the internal structure of the particles, increasing the surface area and the rate
of decomposition.

Lorraine Herity, M.Sc. Environmental Engineering, Queens University of Belfast 125
Rotating drums rely on gravity to tumble mix and homogenise materials in rotating
drums. These drums may also act as biological reactors with typical residencies times
of 36 hours, therefore it is important to ensure adequate aeration at all times.
Rotating Drum
Source: US EPA 530-R-94-003, 1994

Lorraine Herity, M.Sc. Environmental Engineering, Queens University of Belfast 126
APPENDIX 4

Lorraine Herity, M.Sc. Environmental Engineering, Queens University of Belfast 127
Appendix 5 Graphs of Heavy metal Concentration in Individual Compost Samples
0
20
40
60
80
100
120
140
160
EPA
Class I
Class I
IB1aB1bB2aB2bB2cB3aB3bB4aB4bB4cB4dB4eB4f
B4gB4hB4iB4jB4kB4l
B4mB5B6aB6bB6cB6dB6eB6f
B6gB6h
Biowaste Samples (N=29)
Cu
(mg/
Kg,
dm
)
050
100150200250300350400450
EPA
Class I
Class I
IB1aB1bB2aB2bB2cB3aB3bB4aB4bB4cB4dB4eB4f
B4gB4hB4iB4jB4kB4l
B4mB5B6aB6bB6cB6dB6eB6f
B6gB6h
Biowaste Samples (n=29)
Zn (m
g/K
g, d
m)
0
20
40
60
80
100
120
140
160
EPA
Class I
Class I
IB1aB1bB2aB2bB2cB3aB3bB4aB4bB4cB4dB4eB4f
B4gB4h B4i B4jB4k B4l
B4m B5B6aB6bB6c
Biowaste Samples (n=24)
Pb
(mg/
Kg,
dm
)

Lorraine Herity, M.Sc. Environmental Engineering, Queens University of Belfast 128
0
0.2
0.4
0.6
0.8
1
1.2
1.4
1.6
EPA
Class I
Class I
IB1aB1bB2aB2bB2cB3aB3bB4aB4bB4cB4dB4eB4f
B4gB4hB4iB4jB4kB4l
B4mB5B6aB6bB6cB6dB6eB6f
B6gB6h
Biowaste Samples (n=29)
Cd
(mg/
Kg,
dm
)
0
0.5
1
1.5
2
2.5
3
EPA
Class I
Class I
IB1aB1bB2aB2bB2cB3aB3bB4aB4bB4cB4dB4eB4f
B4gB4hB4iB4jB4kB4l
B4mB5B6aB6bB6cB6dB6eB6f
B6gB6h
Biowaste Samples (n=29)
Hg
(mg/
Kg,
dm
)
0
10
20
30
40
50
60
70
80
EPA
Class I
Class I
IB1aB1bB2aB2bB2cB3aB3bB4aB4bB4cB4dB4e B4f
B4gB4h B4i B4jB4k B4l
B4m B5B6aB6bB6c
Biowaste Samples (n=29)
Ni (
mg/
Kg,
dm
)

Lorraine Herity, M.Sc. Environmental Engineering, Queens University of Belfast 129
0
20
40
60
80
100
120
140
160
EPA
Class I
Class I
IB1aB1bB2aB2bB2cB3aB3bB4aB4bB4cB4dB4eB4f
B4gB4h B4i B4jB4k B4l
B4m B5B6aB6bB6c
Biowaste Samples (n=24)
Cr
(mg/
Kg,
dm
)
0
0.5
1
1.5
2
2.5
EPA B3 B4 B5 B6 B7B13 B14 B15 B16 B17 B18 B21
Biowaste Samples (n=12)
Se
(mg/
Kg,
dm
)
0
2
4
6
8
10
12
14
16
EPA B3 B4 B5 B6 B7B13 B14 B15 B16 B17 B18 B21 B22 B23 B24 B25 B26 B27 B28 B29
Biowaste Samples (n=20)
As
(mg/
Kg,
dm
)

Lorraine Herity, M.Sc. Environmental Engineering, Queens University of Belfast 130
0
1
2
3
4
5
6
EPAB2a B2b B2c B3a B3b B4f
B4g B4h B4i B4jB4k B5
Biowaste Samples (n=12)
Mol
yebd
enum
(mg/
Kg,
dm
)

Lorraine Herity, M.Sc. Environmental Engineering, Queens University of Belfast 131
0
20
40
60
80
100
120
140
160
EPA ClassI
ClassII
G1a G1b G1c G1d G1e G1f G2 G3
Green Waste Samples (n=8)
Cu
(mg/
Kg,
dm
)
050
100150200250300350400450
EPA
Class I
Class I
IG1a G1b G1c G1d G1e G1f G2 G3
Green waste Samples (n=8)
Zn (m
g/K
g, d
m)
0
50
100
150
200
EPA
Class I
Class I
IG1a G1b G1c G1d G1e G1f G2 G3
Green Waste Samples (n=8)
Pb
(mg/
Kg
dm)

Lorraine Herity, M.Sc. Environmental Engineering, Queens University of Belfast 132
00.20.40.60.8
11.21.41.6
EPA Clas
s IClas
s II
G1a G1b G1c G1d G1e G1f G2 G3
Green Waste Samples (n=8)
Cd
(mg/
Kg,
dm
)
0
0.2
0.4
0.6
0.8
1
1.2
EPA
Class I
Class I
IG1a G1b G1c G1d G1e G1f G2 G3
Green Waste Samples (n=8)
Hg
(mg/
Kg,
dm
)
01020304050607080
EPA
Class I
Class I
IG1a G1b G1c G1d G1e G1f G2 G3
Green Waste Samples (n=8)
Ni (
mg/
Kg,
dm
)

Lorraine Herity, M.Sc. Environmental Engineering, Queens University of Belfast 133
0
20
40
60
80
100
120
140
160
EPA ClassI
ClassII
G1a G1b G1c G1d G1e G1f G2 G3
Green Waste Samples (n=8)
Cr
(mg/
Kg,
dm
)

Lorraine Herity, M.Sc. Environmental Engineering, Queens University of Belfast 134
0250500750
10001250150017502000225025002750
EPA
Class I
Class I
IC1a C1b C1c C1d C1e C2a C2b
Commercial Organics Samples (n=7)
Cu
(mg/
Kg,
dm
)
0
500
1000
1500
2000
2500
3000
EPA
Class I
Class I
IC1a C1b C1c C1d C1e C2a C2b
Commercial Organics Samples (n=7)
Zn (m
g/K
g, d
m)

Lorraine Herity, M.Sc. Environmental Engineering, Queens University of Belfast 135
0
50
100
150
200
250
300
350
400
EPA
Class I
Class I
IC1a C1b C1c C1d C1e C2a C2b
Commercial Organics Samples (n=7)
Pb
(mg/
Kg,
dm
)
00.20.40.60.8
11.21.41.61.8
EPA
Class I
Class I
IC1a C1b C1c C1d C1e C2a C2b
Commercial Organics Samples (n=7)
Cd
(mg/
Kg,
dm
)
0
0.2
0.4
0.6
0.8
1
1.2
EPA
Class I
Class I
IC1a C1b C1c C1d C1e C2a C2b
Commerical Organics Samples ( n=7)
Hg
(mg/
Kg,
dm
)

Lorraine Herity, M.Sc. Environmental Engineering, Queens University of Belfast 136
0
10
20
30
40
50
60
70
80
EPA
Class I
Class I
IC1a C1b C1c C1d C1e C2a C2b
Commercial Organics Samples (n=7)
Ni (
mg/
Kg,
dm
)
0
20
40
60
80
100
120
140
160
EPA
Class I
Class I
IC1a C1b C1c C1d C1e C2a C2b
Commercial Organics Samples (n=7)
Cr
(mg/
Kg,
dm
)
0255075
100125150175
EPA
Biowas
te I
Biowas
te II
S1a S1b S1c S1d S1e S1fS1g S1h S1i S1j
S1k
Sludge Samples (n=11)
Cu
mg/
Kg,
dm
)

Lorraine Herity, M.Sc. Environmental Engineering, Queens University of Belfast 137
0100200300400500600
EPA
Biowas
te I
Biowas
te II
S1a S1b S1c S1d S1e S1fS1g S1h S1i S1j
S1k
Sludge Samples (n=11)
Zn (m
g/K
g, d
m)
0255075
100125150175
EPA
Biowas
te I
Biowas
te II
S1a S1b S1c S1d S1e S1fS1g S1h S1i S1j
S1k
Sludge Samples (n=11)
Pb
(mg/
Kg,
dm
)
00.20.40.60.8
11.21.41.6
EPA
Biowas
te I
Biowas
te II
S1a S1b S1c S1d S1e S1fS1g S1h S1i S1j
S1k
Sludge Samples (n=11)
Cd
(mg/
Kg,
dm
)

Lorraine Herity, M.Sc. Environmental Engineering, Queens University of Belfast 138
00.20.40.60.8
11.2
EPA
Biowas
te I
Biowas
te II
S1a S1b S1c S1d S1e S1fS1g S1h S1i S1j
S1k
Sludge Samples (n=11)
Hg
(mg/
Kg,
dm
)
01020304050607080
EPA
Biowas
te I
Biowas
te II
S1a S1b S1c S1d S1e S1fS1g S1h S1i S1j
S1k
Sludge Samples (n=11)
Ni (
mg/
Kg,
dm
)
020406080
100120140160
EPA
Biowas
te I
Biowas
te II
S1a S1b S1c S1d S1e S1fS1g S1h S1i S1j
S1k
Sludge Samples (n=11)
Cr
(mg/
Kg,
dm
)

Lorraine Herity, M.Sc. Environmental Engineering, Queens University of Belfast 139
APPENDIX 5

Lorraine Herity, M.Sc. Environmental Engineering, Queens University of Belfast 140
Appendix 5 Photographs taken During Site Visits
Start of biological composting at a Composting Facility
Finished product with evidence of impurities present Plastic
Also store improperly on water logged soil