a study of the nutritional status of children and health …
TRANSCRIPT

A STUDY OF THE NUTRITIONAL STATUS OF CHILDREN
AND HEALTH SEEKING BEHAVIOUR IN AREAS WITH
HIGH RATES OF MIGRATION
.
Dissertation submitted in partial fulfilment of the requirement of The
Tamil Nadu Dr M.G.R. Medical University, Chennai, for the M.D.
Community Medicine Examination to be held in May 2020.
Registration Number 201725053
1

DECLARATION
I hereby declare that this dissertation titled ‘A study of the nutritional status of children and
health seeking behaviour in areas with high rates of migration .’ is my original work done
under the guidance and supervision of Dr. Kuryan George, Professor, Department of
Community Health, Christian Medical College, Vellore. This dissertation is submitted in
partial fulfilment of the rules and regulations for the degree of MD in Community Medicine
examination of the Tamil Nadu Dr. M.G.R Medical University, Chennai to be held in May
2020.
Dr. Harsh,
Registration Number 201725053
Post Graduate Registrar ,
Community Medicine,
Christian Medical College,
Vellore 632002.
2

CERTIFICATE
This is to certify that the dissertation titled ‘A study of the nutritional status of children and
health seeking behaviour in areas with high rates of migration’. is a bonafide original work
done by Dr. Harsh during his academic term April 2017 to March 2020, at the Christian
Medical College, Vellore as per Community Medicine examination of the Tamil Nadu Dr.
M.G.R Medical University, Chennai to be held in May 2020. This work carried out under
my guidance in the department has been done by the candidate himself and is genuine.
Dr. Kuryan George, Dr. Anuradha Rose,
Professor, Professor,
Department of Community Health, Department of Community Health,
Christian Medical College, Christian Medical College,
Vellore 632002 Vellore - 632002
3

CERTIFICATE
This is to certify that the dissertation titled ‘A study of the nutritional status of children and
health seeking behaviour in areas with high rates of migration ’.is a bonafide original work
done by Dr. Harsh during his academic term April 2017 to March 2020, at the Christian
Medical College, Vellore as per Community Medicine examination of the Tamil Nadu Dr.
M.G.R Medical University, Chennai to be held in May 2020. This work carried out under
my guidance in the department has been done by the candidate himself and is genuine.
Dr. Vinod Abraham, Dr. Anna B Pulimood
Professor and Head, Principal,
Department of Community Health, Christian Medical College,
Christian Medical College, Vellore - 632002
Vellore - 632002
4

ANTI-PLAGIARISM CERTIFICATE
5

ACKNOWLEDGEMENTS
This dissertation would be incomplete without expressing my gratitude to the people
involved in the conceptualization and completion.
My sincere gratitude and thanks to my guide Dr. Kuryan George for his mentorship,
guidance, patience and encouragement.
Dr. Anuradha Rose for being the inspiration for the study. For her steadfast help throughout
the entire process.
Dr. Jasmine Helan, previous Head of Department for her valuable guidance through the
study. Dr. Vinod Abrahan, Head of Department for supporting and guiding me.
Father Vinod and the Don Bosco, Jamunamarathur team for giving me a base of operations.
The entire department of Community Health, Christian Medical College,especially my
batchmates Dr.Bincy, Dr. Cheryl and Dr. Ranjith. Special thanks to Dr. Shalini, Dr. Sam
Marconi, Dr. Sandeep and Dr. Deepak
Abhay and Ira for being the twin pillars of support from the start to the end. My parents for
intellectual and academic guidance.
Finally, Tawra, without whom this entire process wouldn't have been possible.
6
TABLE OF CONTENTS
1.0 Introduction................................................................................................................. 12
2.0 Review of literature..................................................................................................... 15
2.1 Migration............................................................................................................ 15
2.2 Malnutrition....................................................................................................... 25
2.3 Health seeking behavior..................................................................................... 36
2.4 Effects of migration on health seeking and nutrition ....................................... 41
3.0 Objectives.................................................................................................................... 44
4.0 Methodology............................................................................................................... 45
5.0 Results.......................................................................................................................... 53
5.1 Socio-demographics of study population.......................................................... 53
5.2 Antenatal care in jawadhi hills.......................................................................... 57
5.3 Migration ......................................................................................................... 59
5.4 Nutritonal status ............................................................................................... 64
5.5 Childhood morbidity and health seeking behaviour.......................................... 71
6.0 Discussion ................................................................................................................... 74
7.0 Conclusions ................................................................................................................ 84
8.0 Recommendations ....................................................................................................... 85
9.0 Limitations .................................................................................................................. 87
10.0 Bibliography ............................................................................................................. 88
11.0 Appendix .................................................................................................................. 91
7

ABBREVIATIONS
ANC Antenatal |Care
ASHA Accredited Social Health Activist
MUAC Mid Upper Arm Circumference
NFHS National Family Health Survey
NSS National Sample Survey
PHC Primary Health Centre
SD Standard Deviation
UN United Nations
UNDA United Nations Development Agency
UNICEF United Nations International Children’s Emergency Fund
WHO World Health Organization
8

LIST OF TABLES
Table 2.1.1 Seasonal migration rates by caste and place according to NSS 2000 20
Table 2.1.2 Seasonal migration rates by monthly per capita expenditure quintiles according to NSS 2000.
22
Table 5.2.1 Number of antenatal visits during the reference pregnancy 57
Table 5.2.2 Place of antenatal check-up 57
Table 5.2.5 In Jawadhi hillsfor the entire period of pregnancy 57
Table 5.3.1 Number of migrants 59
Table 5.3.2 Place of migration 59
Table 5.3.3 Place of residence of child during migration 60
Table 5.3.4 Availability of toilet in place of migration 60
Table 5.3.5 Number of months of the pregnancy in migration 60
Table 5.3.6 Number of antenatal visits during the period of migration 61
Table 5.3.7 Comparison between migrants and non- migrants 62
Table 5.4.1 Wasting and gender 64
Table 5.4.2 Stunting and gender 65
Table 5.4.3 MUAC and gender 66
Table 5.4.4 Waterlows classification 66
Table 5.4.5 Factors associated with wasting 67
Table 5.4.6 Factors associated with stunting 69
Table 5.5.1 Morbidity profile in Jawadhi hills 71
Table 5.5.2 Morbidity profile in place of migration 71
Table 5.5.3 Hospital visits for illness 72
Table 5.5.4 Comparison of health seeking between Jawadhi hills and place of migration
73
9

LIST OF FIGURES
Figure 2.1.1 Seasonal migrant rate [per 1000 population] according to NSS 2000 21Figure 2.2.1 Weight/Length for boys from 0 to 5 years 26Figure 2.2.1 Weight/Length for girls from 0 to 5 years 26Figure 2.2.3 Classification of malnutrition 28Figure 2.2.4 Waterlow’s classification (22) 29Figure 2.2.5 Odds ratio for mortality by weight for height 31Figure 2.2.7 Global prevalence of stunting and wasting (18) 33Figure 2.2.8 Statewise percentage of stunting (1) 34Figure 5.1.1 Age distribution of study population 53Figure 5.1.2 Age sex distribution 54Figure 5.1.3 Birth order of the child 54Figure 5.1.4 Type of family 55Figure 5.1.5 Type of house 56Figure 5.1.6 Access to toilet 56Figure 5.2.1 Place of delivery 58
10

1. INTRODUCTION AND JUSTIFICATION
Malnutrition has plagued low and middle-income countries for decades. The prevalence of
malnutrition continues to be high despite the knowledge of various inputs required to tackle
it. In India, the prevalence of wasting was 21% and stunting 38% (1) in 2015. One in five
children under the age of five suffers from wasting and more than one in three children are
stunted. There is large degree of variance between states and between groups.
Marginalized groups like the tribal population are much more likely to be affected. (2)
Migration or the movement of people for the purpose of resettlement or work is increasing
globally. There is a slow but steady movement of people to certain regions. This can be
attributed to an uneven distribution of resources and facilities across the globe.. Although it
is more noticeable at a global level, there is a considerable amount of migration within
countries. In India, about 30% of the population are internal migrants(3) – residing in a
place away from their birth. Most of this migration is towards cities primarily because there
is a higher chance of finding jobs in cities and improved access to healthcare. Many
migrants are forced to live in deplorable conditions, primarily because of the quantum of
migration and subsequent strain on the resources needed for the support of the
migrants.They are also more likely to take up tougher and more dangerous job.(4) primarily
because of the economic deprivation.
13

The added barriers in a new place including language, culture, xenophobia and lack of
social support groups increase the vulnerability of the migrant population. This can affect
the health status as well as the health seeking behaviour of migrant populations all over the
world. (5) This then further contributes to worse health outcomes and has an effect on the
economic status.
The children of migrant labourers are one of the most vulnerable groups among migrants.
Having moved with their families, they exist in a space without all the measures for a
healthful childhood. Very often, they do not have access to schooling and anganwadi
centres, (6)consequently being unable to avail of facilities like mid-day meal and health
checkups including growth monitoring.
This puts them at a disadvantage compared to the permanent residents. Many studies have
been done on the health status of migrant labourers and their children. A study in Rajasthan
found the prevalence of malnutrition migrants was 58% and that of a non-migrant
population to be 39 %. (7) . Another group that is particularly vulnerable are pregnant
women. With the requirement of hard labour along with poor living conditions, routine
antenatal care is neglected. In Punjab a study among women found only 10.5% had the
recommended number of antenatal check-ups. (8)
14
All the studies done till now have concentrated on migrants who have permanently settled in
their place of migration. The health status and health seeking behaviour of seasonal or
temporary migrants has not been adequately studied. As a population that spends a few
months a year in their place of migration and partly in their native areas, they pose a unique
problem of being at a risk of being excluded from the health systems in both places. Being
just seasonal workers, they are also at a risk of having housing and sanitation facilities that
are just temporary and probably worse off.
This study aims to fill in the gaps in the knowledge regarding the health status and health
seeking behaviour of seasonal migrants
15

2. REVIEW OF LITERATURE
2.1 MIGRATION
Migration can be defined as the form of mobility in which people change their residential
location across defined administrative boundaries for a variety of reasons, which may be
involuntary or voluntary, or a mixture of both.(1) The UN Migration Agency (IOM) defines
a migrant as any person who is moving or has moved across an international border or
within a State away from his/her habitual place of residence, regardless of the person’s
legal status; whether the movement is voluntary or involuntary; what the causes for the
movement are; or what the length of the stay is. (2).
Migration can be further classified based on the temporal pattern of migration or the
location of migration. Temporally, it can either be permanent – involving a permanent
resettling for reasons like marriage, work or studies, or seasonal. Seasonal migration is
usually for work related activities and involves shifting of residence for a period each year,
depending on the availability of work. Rural and urban migration are defined by the place
the person is moving to.
16

2.1.1 GLOBAL SCENARIO
As of 2017, there were a total of 258 million migrants globally. This number rose from 244
million in 2015. A large majority of the migrants [150.3 million] were labour migrants. 68.5
million were displaced due to conflict and natural disasters and 4.8 million were student
migrants.(3) . The United Nations Development agency also studied patterns in international
migration over the years, and found that apart from migrants coming to North America, all
other continents predominantly had migrants originating from the same continent. (3) Male
migrants formed 51.2 percent of the total migrant population though there was a significant
variation between regions. Male migrants formed a much larger part in Asia due to
migration to Western Asian and Gulf countries. In all other regions, women formed a
slightly higher percentage.
The mean age of migrants increased from 38 years in 2000 to 39.2 years in 2017. 74 percent
of the total migrant population was between the ages of 20 and 64 indicating a migration of
working age populations. (3)
Global migration has significantly increased over the past few decades and has far- reaching
consequences demographically, socio-economically and culturally. Though there are local
factors and feelings against large scale international migration in many countries across the
globe, the official view of the United Nations as well as civil society groups across the globe
is positive. (4)
17

The 2030 Agenda for Sustainable Development recognizes for the first time the contribution
of migration to sustainable development. 11 out of the 17 Sustainable Development Goals
(SDGs) contain targets and indicators that are relevant to migration or mobility.
War and conflict mainly in West Asia and Africa apart from growing inequality and
economic factors have been responsible for the increase in the number of migrants, mainly
to higher income countries outside the region. Given the current geopolitical situations
prevailing in these regions and in regions like South and Central America, the rate is
expected to increase over the next few decades.
Internal migration within countries is also set to increase in the coming decades. Rapid
urbanization has been observed in the past few decades. (5) By 2030 about 61% of the
global population is expected to reside in urban areas. This increase in urban population size
must come from the rural areas of each because of a significant level of internal migration.
Low- and middle-income countries are set to witness the highest levels of these migration
patterns. This is evidenced by the emergence and growth of megacities [containing more
than 10 million population] in Asia and Africa. As of 2015 there were 26 megacities in the
world, with 22 in Low- and middle-income countries and 18 in the continent of Asia alone.
(5) This number has increased from just 2 cities in 1960 and 17 in 1999.
18

2.1.2 INDIAN SCENARIO
Data for internal migration in India comes from two sources – the decennial census
conducted by the government and the NSS data. The census takes anyone enumerated
differently from their place of birth as a migrant. Both describe a permanent resident as
somebody residing in their current place for at least a period of six months. Anybody else is
classified as a migrant.
According to the census data from 2001, 307 million have been reported as migrants. A
large majority of them [84.2%] are migrants in the same state of origin. If inter-district
migration is considered, the number is much lower as intra district migration forms about
74% of the total migrant population. (6). Inter-state migrants form about 14% of the total
migrants and the remaining immigrants from other countries.
Given the difference in economic growth rates in the country between certain regions, a net
migration internally is expected and focused on faster growing areas. The primary cause of
migration in the female population is resettlement after marriage and [64.9%] . For the male
population, labour and seeking new work opportunities [37.6%]are the predominant causes
for migration. (6)
19

Though the urbanisation rates in India have been consistently increasing over the past few
decades, 53% of the total migration in the country is from one rural area to another. The
migration of women forms a very large part of this shift, especially in intra state migration.
The movement from urban to rural areas was 6% and the remaining was movement from
rural to urban areas.
There is clear pattern of migration patterns when it comes to states with Maharastra and
Delhi having the highest net influx of migrants at 2.3 million and 1.7 million respectively.
These numbers are high due to an increase in the rural to urban migration in search of labour
and job opportunities in cities like Mumbai and Delhi. Uttar Pradesh and Bihar had the
highest number of migrants leaving the state, more so from rural areas.
33.1% of the males and 36.8% of the females who migrate for labour are part of the
informal sector with no guaranteed and regular income. (1) Due to the nature of their work
and non-formal housing, the number of those migrating for labour would tend to be under-
estimated
20

2.1.3 SEASONAL MIGRATION
Seasonal migration is short- term migration, usually for a few months every year and
predominantly for labour. Reports from the past few decades have shown that a large
percentage of seasonal migrants come from a predominantly deprived sections of society,
mainly Scheduled caste and Scheduled tribe populations. (1) The relative increase in these
sections of society stems from an already low socio-economic background leading to an
increased need for higher paying gainful employment. All studies done on this show that
most of this category has people aged between 15 and 45 indicating the movement of the
population in the working age group.
Table 2.1.1 Seasonal migration rates by caste and place according to NSS 2000
21

There is also a clear pattern in the statewise spread of seasonal migration as shown in the
map below. (7)
Figure 2.1.2 Seasonal migrant rate [per 1000 population] according to NSS 2000
22

The seasonal migration rates are higher in males [15 per 1000] as compared to females [9
per 1000] at a national level. There is a difference at a state level for this too as states like
Uttar Pradesh, Bihar and West Bengal have a much higher number of male migrants while
states like Tamil Nadu and Karnataka as a more equal level. This is a clear implication of
the respective pattern of migration. In states like Tamil Nadu, seasonal migration happens
with the entire family as a unit seeking work in a different place. In states in the Northern
and Central parts of India the job seekers and labour force is more from the male population.
There is also a clear association between the economic status and seasonal patterns.
Seasonal migrants tend to be from a lower economic background and hence are more likely
to migrate in search of work. Using Monthly per-capita expenditure quintiles as an indicator
of economic status, the data for migration from NSS shows the following:
Table 2.1.2 Seasonal migration rates by monthly per-capita expenditure quintiles
according to NSS 2000.
23

This shows a clear decrease in the migration rate as the economic status of population
increases. There is also more of a difference in the rural and urban rates for lower economic
status. The difference diminishes in the higher economic groups.
24

2.1.4 MIGRATION PATTERN IN JAWADHI HILLS
2.1.4.1 DESCRIPTION OF THE POPULATION
The Malayali or ‘hill people’ tribe are the largest tribal group in Tamil Nadu forming about
47.6% of the total tribal population in the state (2001 census). The tribal people of Tamil
Nadu are spread across the various ranges of the Eastern ghats in Northern Tamil Nadu,
namely Jawadhi, Kalvarayan, Shevaroy, Kolli, Sitheri and Yelagiri hills. Having settled in
these hill ranges sometime in the mid-18th century, they are predominantly animistic in
belief and localised to the hill ranges. Subsistence farming is the main source of livelihood.
The Malayalis have the highest percentage of cultivators among all the tribes in Tamil
Nadu,. 98.3% of the entire tribe is rural in residence (2011 census). The literacy rate is
37.4%, much lower compared to the state average of 73.5% and even the state tribal average
of 41.5%.(9) Immigration for education and employment is a relatively new phenomenon –
more over the last two decades.
25

2.2 MALNUTRITION
Malnutrition refers to either a level of under-nutrition or over -nutrition as compared to the
global standards .(11) During this study, only under-nutrition is looked at as malnutrition.
Different countries have attempted to define malnutrition and optimal growth for children
using local data. WHO along with other International Agencies had embarked on many
attempts to define a global standard from the early 1990s. (12) This culminated with the
WHO Multi Centre Growth Reference Study conducted between 1997 and 2003. In this
attempt to create global standards, a total of 8440 children across six countries namely
India, Brazil, Oman, Norway, Ghana and the United States of America were enrolled in the
study . The children were selected from strata of the population where low socio-economic
status and mobility would not impede the normal growth of the child. Subsequent to this
effort , most studies now refer to the WHO Growth Standards of 2006.
, A growth curve indicating the median weight for the ages of 6 to 59 months was created
by using data from all the countries combined. There was also a stratification of the growth
for each standard deviation above and below the median. Two separate growth curves were
created for boys and girls. (13) Separate charts were made for weight for age, length for age,
weight for length, head circumference and mid upper arm circumference.
26

Figure 2.2.1 Weight/Length for boys from 0 to 5 years
Figure 2.2.1 Weight/Length for girls from 0 to 5 years
27

The above figures are from the International growth standards for weight/length. There are
similar tables for all the other anthropometric measurements. The central green line
indicates the median. The red lines above and below indicate a change of one standard
deviation from the median and black lines denote a difference of two standard deviations.
2.2.1 CLASSIFICATION
|Malnutrition can be classified further in three broad categories (14)
1. Under-nutrition: this includes stunting [ low length for age], wasting [low height for
length] and underweight [weight for age]
2. Micronutrient related malnutrition: deficiency or excess of any micronutrient
3. Overweight and obesity
The three of the categories are commonly considered when looking at under-nutrition: (15)
1. Low weight for height: This is known as wasting. It indicates acute malnutrition
primarily due to an acute deficiency of calories and protein either due to natural
disasters or acute disease.. The overall prevalence of wasting is below 5% in most
countries, though India is an exception with a slightly larger rate. A rate of above
15% indicates a critical level of malnutrition in the area. This usually peaks in the
second year of life.
28
2. Low height for age: Below 2 years, the recumbent length of the child is used as a
measure of stature. The standing height is used after 24 months. Stunting is the term
used to denote this type of malnutrition. Stunting is an indicator of chronic
malnutrition. In younger ages , upto 2 years it is indicative of an ongoing process of
malnutrition while at later ages it can indicate a past history of malnutrition. A
progressive decrease in the stunting rate shows an overall improvement in the
nutritional status of a population..
3. Low weight for age : This is a reflection of the body mass to the current age of the
child. Since it is influenced by both the weight and height, the interpretation is
harder. For example, a child who is shorter may have a weight that is ideal for the
height. Due to this conundrum, weight for height is a more accurate measure for
wasting. The global distribution varies to the same extent as length for age. A
decrease can also indicate an acute process like an infection. In some cases though, it
is still indicative of a long term malnutrition. Due to the complex nature of its
interpretation, it is seldom used in actual comparisons of large populations.
29

WHO bases the classification of severity based on the number of standard deviations from
the mean for a particular age or the Z-score.
Figure 2.2.3 Classification of malnutrition
30

A compound classification known as Waterlow’s classification has been derived putting
both the stunting and the wasting together. Here the two axes represent stunting and wasting
and the population is classified as only stunted, only wasted, both stunted and wasted and
finally neither stunted nor wasted
Figure 2.2.4 Waterlow’s classification (16)
The classification of malnutrition and the grade of the same is important as the various side
effects and the dangers of malnutrition vary with the respective levels. Mortality rates are
significantly higher below -3 SD. Both WHO and UNICEF have characterised a Z score
below below -3 as severe malnutrition. This is compounded by the clinical presence of any
oedema.
31

2.2.2 EFFECTS OF MALNUTRITION
Malnutrition is not only a health issue but has socio-economic and cultural dimensions also.
It is important to understand the aetiology of the malnutrition to enable analysis of the
effects of both acute and chronic malnutrition in a child,. The causes of under-nutrition in a
population include underlying poverty, repeated attacks of acute diseases like diarrhoea and
chronic deficiency in both protein and energy levels in the diet. (17)
The effects of malnutrition are multiple and is a major determinant of childhood mortality.
Though deaths due to malnutrition alone are few, the underlying weakness in the child’s
physiological make up as a result of malnutrition can increase mortality. 45% of the
childhood deaths have been attributed to underlying malnutrition. (15) Severe acute
malnutrition has been found to greatly increase the rate of death due to any other illness
compared to a healthy population.(18)
Figure 2.2.5 Odds ratio for mortality by weight for height
32

The consequences of malnutrition are by no means restricted to the mortality and biological
outcomes. Chronic malnutrition influences the overall mental development of the child and
the current physical condition. Children who are poorer end up being malnourished. A
malnourished child is more likely to get sick and increase the health care expenditure for the
family. An episode of disease contributes to a higher chance of being continually
malnourished after that. This then puts the family into a vicious cycle of poverty and
disease. Translating this to adulthood, there is a chance for decreased productivity and hence
a furthering of the vicious cycle.(19)
33

2.2.3 BURDEN OF MALNUTRITION
Child malnutrition is a global problem, affecting low- and middle-income countries much
more than high income countries. (18) Though there has been a considerable amount of
reduction in the number of malnourished children since the 1990s, the burden is still
considerably high and clustered. WHO estimates that of 2011 there are 165 million stunted
children worldwide, with a rate of about 26 %. The percent of underweight children is about
16%.
Figure 2.2.7 Global prevalence of stunting and wasting (18)
34

From both the maps there is clearly an uneven distribution, with Sub-Saharan Africa and
South Asia having a much high prevalence as compared to the rest of the world.
According to NFHS 4, the overall prevalence of stunting among under five children in India
was 38% and wasting was 21%. Though there has been a decrease from the previous survey,
the number remains high. There is a large discrepancy in the geographical spread of
malnutrition with differences between states being very high.
Figure 2.2.8 Statewise percentage of stunting (21)
35

In Tamil Nadu, the overall prevalence of stunting was found to be 27% and overall wasting
to be 20%. (22) In Tiruvannamalai district, stunting as found to be 24.5% and wasting 34.6
% . (23)
Tribal populations in India have a much higher level of malnutrition compared to the rest of
the population. The expert committee on Tribal health found that the prevalence of
underweight children was 42 %. (24) The report also concluded that due to geographical
nature of these populations, there was very little data to get a clearer picture.
The Tamil Nadu state planning commission report of 2017 found that 41.69% of the under
five children in Jawadhi hills were malnourished. Studies done previously in Jawadhi hills
found the prevalence of wasting to be 10.4% and that of stunting to be 55.4% . (25)
Overall , the prevalence is much higher in Jawadhi hills as compared to the district, state
and national levels, though slightly less than the rates for national tribal poulations.
36

2.3 HEALTH SEEKING BEHAVIOUR
Health seeking behaviour is a term used to explain the pattern of health care utilization
among any population group and the sequence of remedial actions that individuals take in
order to rectify perceived ill health. (26) It is essentially the total health care utilization by
the population. The nature of health seeking behaviour is not homogenous and is affected
by a large number of factors. (1)
A number of models have been used to characterize and understand health seeking
behaviour. These are : (2)
1. Health information acquisition model - this model assumes the steps of health
information seeking to be in six steps - Stimulus ,information goal setting ,cost -
benefit analysis of search ,search behavior , information evaluation and , decision
point on adequacy of information . This is a descriptive model and does not consider
personal factors for the influence of health seeking.
2. Johnson’s comprehensive model – this model lists four main factors governing the
behaviour - Demographic factors, , direct experiences of people, ,salience and beliefs
of people. The strength of the model lies in its inclusion of beliefs and accounting for
personal experience of the patients
3. Millers monitoring and blunting model – this model gives a larger degree of
importance to personal factors in the model of health seeking. It assumes that those
37

with a higher degree of information seeking will take more active steps in the health
seeking as opposed to those who dont
4. Longo’s expanded model – this is by far the most comprehensive model thus far.
Here the effects of personal and contextual factors on the information seeking
behaviour of patients are investigated. Personal factors include demographic and
socio-economic factors, health history, genetics, anxiety, culture, language, attitudes,
behaviours, current health status, cognitive abilities and interpersonal communication
motives. Contextual factors include health situation, healthcare structure, delivery of
healthcare, information environment, information seeking for self, family members
or friend at risk or with current medical problems, interpersonal social supports and
networks.
5. Health belief model – this takes into account two main factors – the belief about the
disease condition and its consequences as well as the belief in the curative effect of
the treatment. It has been applied in many low income countries. (3)
On the basis of the various models proposed, an understanding of the local factors is
necessary to explain the health seeking behaviour in any area. On the whole international
and national health programs assume that just the provision of knowledge about a disease
condition and the health.is enough to influence positive health seeking behaviour (1)
Evidence from descriptive studies around the world has shown that in the absence of other
interventions, just provision of knowledge is not always enough to cause a change.
38

Some of the other factors proposed are : (3) (2) (4) (5)
1. Access to health care – availability and geographical location
2. Quality of health care provided
3. Local customs and beliefs regarding healthcare
4. Relevance of health care to local needs
5. Economic status
6. Social capital
7. Demographics
8. Women’s rights and customs locally
9. Community / caste makeup of the society
10. Stigma related to diseases
The overall trend towards a positive health seeking behaviour comes from a conglomeration
of all the various factors. Considering the sheer number of factors that influence this, the is
expected to be a great degree of variance between populations. In a heterogeneous society,
there is also an expected variance between population subgroups. In a population like the
Jawadhi hills where the population is homogenous with regard to social status and
community, this differences within the community is expected to be less.
39

For this study two aspects of health seeking are specially considered – antenatal care and
morbidity in under five children.
Antenatal care is an opportunity to promote a positive pregnancy experience and improved
maternal and child survival. Apart from the added effects of maternal protection, ANC has
been shown to impact the growth and overall make up of child health. (6) (7) Public health
platforms across the world have been advocating for a comprehensive and targeted system
for providing care. In India systems have evolved over the years to help with this but have a
varied acceptance in different parts of the country. (8)
WHO recommends the following for a safe and ideal pregnancy with a minimal perinatal
mortality : (27)
1. Minimum of eight antenatal visits [ 4 earlier]
2. Daily intake of oral Iron and Calcium supplements
3. Tetanus toxoid vaccinations
4. One ultrasound before 24 weeks
5. Counselling by healthcare professional
Globally only 62% of the women have had access to this level of care. (9)
Both UNICEF and WHO recommend that all deliveries be institutional to minimize
neonatal mortality. (28) National level data shows that 99% of all deliveries in Tamil Nadu
are institutional. (29) The national recommendations for India also advocate a minimum of
four visits to a health care centre and institutional delivery.
According to NFHS 4, Tiruvannamalai district had 83.4 % of women having atleast 4
40

antenatal check-ups though only 33.4% had eight. The percentage of institutional deliveries
were 95.5% (23)
The most notable factor that has helped in the increased utilization of antenatal care has
been the advent of conditional cash transfer programs. In Tamil Nadu the program was
named the Dr. Muthulakshmi Reddy scheme and nationally the Janani Suraksha Yojna was
introduced. A study done in Madhya Pradesh found an increase of 42.6% in institutional
deliveries after the introduction of the scheme. (10) In Uttar Pradesh a study found antenatal
registrations increased from 61.79 to 96.34% deliveries at the Government Health Facility
increased from 25.20 to 53.25% and postnatal check-ups increased from 45.93 to 69.51%.
41

2.4 EFFECT OF MIGRATION ON NUTRITIONAL STATUS AND HEALTH
SEEKING BEHAVIOUR
Apart from having a large socio-economic impact on life, migration has a large effect on the
health and health seeking behaviour of migrants. (30) A large part of the impact on health
come from the loss of identity or exclusion from the public infrastructure in the place of
migration. A large number of migrants are from the informal sector of employment and
hence fall outside the scope of labour laws, labour unions and consequently health services.
. (31)., The risk is even greater, primarily because many migrant labourers end up taking
higher risk jobs, and being housed in places that do not have the recommended sanitation
levels. Migrant labourers face a double risk when it comes to health. Due to the factors that
require migration, they are more likely to require a good contact with the health system, but
due to their status as migrants, are far more likely to be excluded from them. (31)
For many seasonal migrants, the added effects of poor sanitation, lack of clean drinking
water, poor housing, exposure to environmental factors and over- crowding play a large role
in the health effects. There are a variety of reasons that make both the access to health and
quality of health worse than a resident population. Some of these include language barriers,
poorer economic status, feeling of alienation in place of migration and local prejudices
against migrants. (31)(32) These factors are not mutually exclusive but act synergistically to
make the situation even worse than normal. It can be worse in seasonal migrants as the place
of migration may vary each time and hence the access point for health changes. For
42

pregnant women and children, who are more vulnerable and need a higher degree of
medical care even normally, the effects can be devastating. (33)There are certain theories
however, that a better access to healthcare in the place of migration may be a factor for the
migration itself. (34) (35) A bulk of the evidence found on this though, point in the other
direction, with migrants having a much less access to health, with women and child health
being much more at a risk.
A study done in rural Rajasthan comparing the nutritional status of migrants along with non-
migrants found a much higher prevalence of malnutrition among migrants. The prevalence
of stunting was found to be 53% among migrants and 39% among non-migrants while
wasting was 33% and 15 % respectively. This study also found a significant reduction in
consumption of healthy food by the mother and the child. Apart from the nutritional status,
the access to schemes like the anganwadi was absent in the migrant population. (36)
The study concluded that a compound pathway consisting of lower access to health, absence
of caregivers when the parents are at work and lower access to other security measures and
infrastructure like anganwadi are a primary cause the poor outcomes
A study done in urban India found the health care utilization to be lower among migrant
labourers, and migrants being associated with lower levels of education and income. (37)
This influenced the antenatal care received and the overall health seeking behaviour.
43

A study done among migrant construction workers in Punjab found that the migrants had a
much lower education than the state average. Only 10.5% of the migrants had at least three
antenatal check-ups as compared to the state average of 70%. Only 9.7% received Iron and
Calcium supplements as compared to 24 % and only 15% of the migrants had institutional
deliveries as compared to the state average of 48.4%.(38)
44

3. OBJECTIVES
1. To determine the nutritional status of children between 6 and 59 months of age in
panchayaths with a high rate of migration in Jawadhi hills.
2. To study the health seeking behaviour about maternal and child health in the population.
3. To study the effects of migration on nutritional status and health seeking behaviour.
4.To compare the health seeking behaviour of migrant labourers in Jawadhi hills and at the
place of migration.
45

4. METHODOLOGY
4.1 STUDY SETTING
The study was carried out in two panchayaths [Nammiyampattu and Kovilur] of the
Jawadhi hills revenue division of Tiruvannamalai district in Tamil Nadu. Jawadhi hills is a
hill range belonging to the Eastern ghats and lying in both Tiruvannamalai and Vellore
districts. The average elevation is between 2400 and 2500 feet and mostly covered by
reserve forests. (8). The total population of Jawadhi hills according to the 2011 census was
50,688 with 83.5% belonging to the Malayali tribal community. The population is spread
over 11 panchayaths and 229 villages.
4.2 PERIOD OF RECRUITMENT
The study was conducted between January 2019 and June 2019, a period when seasonal
migrants from Jawadhi hills return to their home villages.
4.3 STUDY DESIGN
A community based cross sectional study was used
4.4 INCLUSION CRITERIA
Children aged 6 to 59 months belonging to the tribal community were recruited for the
study. The questionnaire was administered to the mothers of the children selected.
46

4.5 EXCLUSION CRITERIA
Single parent and no parent households were excluded.
4.6 SAMPLE SIZE CALCULATION
From the NFHS 4 the prevalence of underweight children in Tamil Nadu was 35.5%. The
precision of the study was fixed at 20 % of the prevalence and a non-response rate of 20%
was expected
Using the standard formula :
N = 4 p q
d²
Sample size = 187
Adding 20 % non-response, final sample size = 225
47

4.7 SELECTION OF STUDY SUBJECTS
A two staged sampling technique was used.
The two panchayaths in Jawadhi hills with the on the highest rates of migration from the
hills were selected . Thirty villages were selected by simple random sampling from the two
panchayaths Eight children were chosen from every village.
After reaching the geographical centre of each village , a random number ranging from 11
and 59 was generated. The first digit indicated the direction [1- North, 2- South, 3-East, 4-
West and 5- field huts. The second digit indicated the number of the house in the chosen
direction. Every successive house after that was visited and households with children
fulfilling the inclusion criteria were identified. The process was continued in successive
houses until 8 children were identified in the cluster. If a particular direction did not yield
eight children a second random number was chosen and a new direction identified.. The
process was continued till a total of eight children were chosen from the village. If there
were more than one child in the house satisfying the criteria, the oldest child was chosen.
48
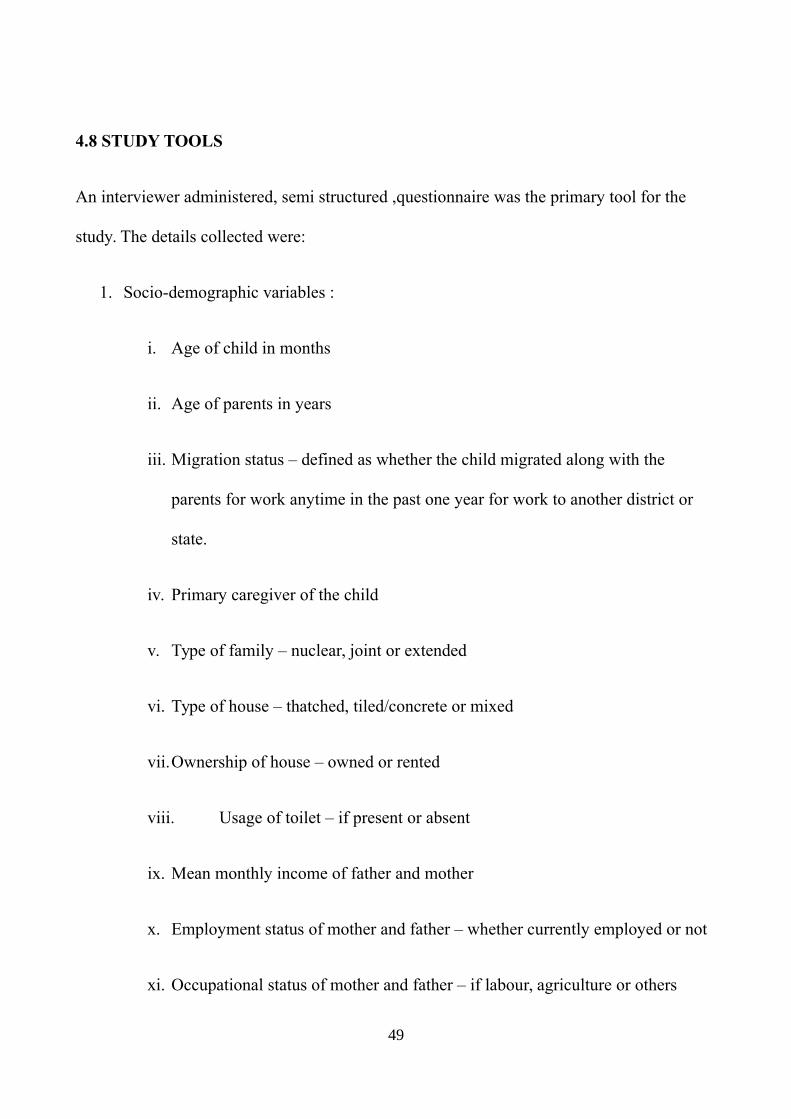
4.8 STUDY TOOLS
An interviewer administered, semi structured ,questionnaire was the primary tool for the
study. The details collected were:
1. Socio-demographic variables :
i. Age of child in months
ii. Age of parents in years
iii. Migration status – defined as whether the child migrated along with the
parents for work anytime in the past one year for work to another district or
state.
iv. Primary caregiver of the child
v. Type of family – nuclear, joint or extended
vi. Type of house – thatched, tiled/concrete or mixed
vii.Ownership of house – owned or rented
viii. Usage of toilet – if present or absent
ix. Mean monthly income of father and mother
x. Employment status of mother and father – whether currently employed or not
xi. Occupational status of mother and father – if labour, agriculture or others
49

xii.Education of mother and father – recorded as number of years of education
xiii. Distance from hospital
2. Antenatal care
i. Number of antenatal visits for the pregnancy of the child in question – if
above or below 5
ii. Tetanus toxoid administered for pregnancy – if given or not
iii. Iron and Calcium supplements during pregnancy – if given or not
iv. Place of antenatal care – government, private or both
v. Place of delivery – if home , government or private
vi. Birth weight of child
3. Health seeking behaviour
i. Vaccination status for all vaccines applicable to that age as per the Tamil Nadu
government protocol
ii. Any instance of fever, cough, diarrhoea or injuries in the past six months
iii. Hospital visit for any condition – present or absent
iv. Usage of traditional medicine, home remedies for the condition
v. Hospital admissions in the past six months – present or absent
vi. Chronic conditions – present or not
50

4. Details of migration
i. Place of last migration
ii. Number of months of stay in place of migrantion
iii. Parental work in place of occupation
iv. Residence in place of migration
v. Usage of toilet in place of migration
The questions pertaining to antenatal care and health seeking were repeated for all the
migrants to get the details at the place of migration.
For nutritional anthropometry the following measurements were taken:
1. Height using stadiometer
2. Weight using an electronic weighing scale
3. Mid upper arm circumference using inch tape
The anthropometric measurements were converted to Z scores using the WHO anthro tool
version 3.2.2. Data entry was done using EpiData version 3.1. Data analysis was done using
IBM SPSS version 23.
51

Data entry
4.9 DIAGRAMMATIC ALGORITHM OF STUDY
52
Data analysis
Two panchayaths selected based on migration patterns
Eight households chosen in each village
Questionnaire administeredto mother
Anthropometric measurements for child

4.10 STATISTICAL ANALYSIS
4.10.1 UNIVARIATE ANALYSIS
Univariate analysis was done using measures of central tendency and dispersion for
continuous variables and proportions for categorical variables. Z scores obtained from the
nutritional anthropometry were converted to the grade of malnutrition using the standard
WHO definitions.
4.10.2 BIVARIATE ANALYSIS
Bivariate analysis was done using Chi-square test. Association between socio-demographic
variables including migration status and presence of moderate to severe stunting and
wasting were ascertained. A comparison between the socio-demographic characteristics of
migrants and non-migrants were also checked. Health seeking behaviour among migrants in
Jawadhi hills was compared, to the behaviour at their their place of migration.
4.10.3 MULTIVARIATE ANALYSIS
Binary logistic regression was done to assess the independent association between socio-
demographic variables including migration status and stunting and wasting. All confounders
were included in the model.
53
5. RESULTS
5.1 SOCIO-DEMOGRAPHIC CHARACTERISTICS OF THE STUDY
POPULATION
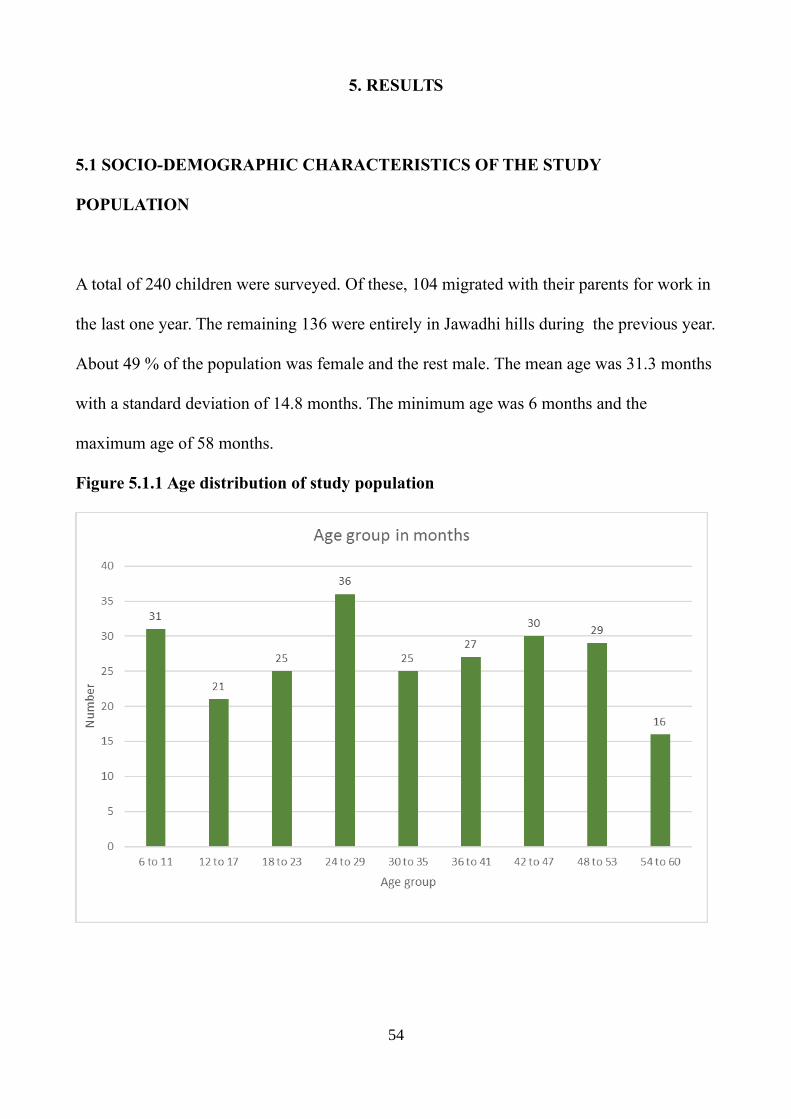
A total of 240 children were surveyed. Of these, 104 migrated with their parents for work in
the last one year. The remaining 136 were entirely in Jawadhi hills during the previous year.
About 49 % of the population was female and the rest male. The mean age was 31.3 months
with a standard deviation of 14.8 months. The minimum age was 6 months and the
maximum age of 58 months.
Figure 5.1.1 Age distribution of study population
54

Figure 5.1.2 Age sex distribution
Figure 5.1.3 Birth order of the child
55

Most of the children [60%] were the first child of the parents. The mother of the child was
primary caregiver for 95.4% of the children. The grandmother was the primary caregiver for
the remaining children. 42.5% of the mothers and 82.5% of the fathers were currently
gainfully employed. This considered the employment status at the time of the survey
irrespective of their migration status and work through the rest of the year
Figure 5.1.4 Type of family
Approximately half the families were nuclear families
56

Figure 5.1.5 Type of house
.
About half the population stayed in thatched houses. 95.4% of the houses were
self-owned and the remaining were rented.
Figure 5.1.6 Access to toilet
Most (92.9%) study subjects did not have access to any toilet facilities.
57

5.2 ANTENATAL CARE IN JAWADHI HILLS
The mean maternal age was 25.4 years with a standard deviation of 4.4 years. The minimum
age was 16 and maximum 39.
Table 5.2.1 Number of antenatal visits during the reference pregnancy
Number PercentageMore than 5 144 60.0Less than 5 92 38.3
None 4 1.7
Table 5.2.2 Place of antenatal check-up
Number PercentageGovernment only 196 81.6
Private only 4 1.7Both government and private 42 17.5
Both the chosen panchayaths had PHCs and they were the place of primary antenatal care in
most people. 94.2 % of the mothers had tetanus immunization during pregnancy and 92.9 %
had access to Iron and Calcium supplements
Table 5.2.5. In Jawadhi for the entire period of pregnancy
Number PercentageYes 148 61.7No 92 38.3
Of the 114 mothers who had migrated this year, 22 were in Jawadhi hills for the entire
pregnancy.
58
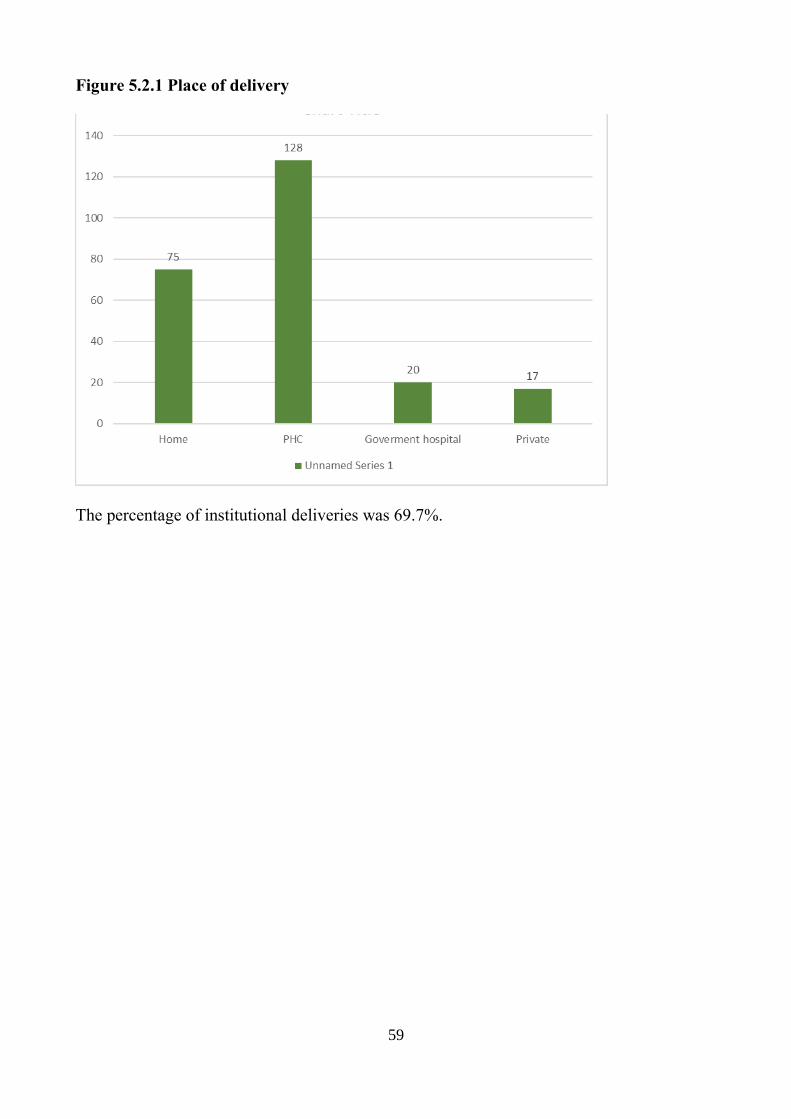
Figure 5.2.1 Place of delivery
The percentage of institutional deliveries was 69.7%.
59

5.3 MIGRATION
The panchayaths were chosen as they were known earlier as those in Jawadhi hills with the
highest rates of migration.
Table 5.3.1 Number of migrants
Number PercentageChildren 104 43.0Mothers 114 47.5Fathers 125 52.1
There were 10 children who stayed back in Jawadhi hills but mother and father migrated for
work. A further 11 children had their mother resident with them in Jawadhi hills but father
migrated for work. The children whose parents had migrated but who themselves did not,
were counted as non-migrant for the analysis.
Table 5.3.2 Place of migration
Female MaleNumber Percentage Number Percentage
Kerala 31 27.1 31 24.6Karnataka 83 72.9 92 73.0
Andhra Pradesh 0 0 2 2.4
Most of the migration was to Karnataka, more to the coastal districts and Kodagu. The
primary job was spice and coffee harvesting as well as a small amount of manual labour.
60

Table 5.3.3 Place of residence of child during migration
Number PercentageHouse 19 18.3Shed 77 74.0Tent 8 7.7
Many of the migrants were housed in temporary sheds in the place of migration. All the
migrants going to that estate for migration would be in the same shed. A few had separate
houses to stay in during the same period.
Table 5.3.4 Availability of toilet in place of migration
Number PercentageNone 95 91.3Dry pit 2 1.9Flush type 7 6.7
The access to toilet was more in the place of migration than Jawadhi hills, though by a very
small percentage.
Table 5.3.5 Number of months of the pregnancy in migration
Number Percentage4 78 84.86 14 15.2
61

Table 5.3.6 Number of antenatal visits during the period of migration
Number PercentageNil 78 84.8Less than 5 14 15.2More than 5 0 0
A large majority of the women did not have any antenatal check-ups in their place of
migration. Those who had any check-ups, were all among those who migrated to Kerala
68.5% felt there was a place for emergency care available.
Various socio-demographic factors were compared between migrants and non-migrants to
see any statistically significant differences between the two groups.
62

Table 5.3.7 Comparison between migrants and non-migrants
Factor Migrant Non-Migrant P-value ORGender Female 45 [43.2] 72 [52.9] 0.137 0.678
Male 59 [56.8]] 64 [47.1] [0.406-1.133]Mother
employed
Yes 71 [68.2] 31 [22.7] 0.000 7.287No 33 [31.8] 105 [77.3] [4.099-12.955]
Father
employed
Yes 99 [95.2] 99[72.7] 0.000 7.400No 5 [4.8] 37 [27.3] [2.793-19.610]
Family type Nuclear 53 [50.9] 66 [48.5] 0.709 1.102Non-nuclear 51 [49.1] 70 [51.5] [0.661-1.837]
House type Thatched 58 [55.7] 60 [44.1] 0.074 1.597Others 46 [44.3] 76 [55.9] [0.955-2.671]
House
ownership
Own 99 [95.2] 130 [95.5] 0.884 0.914Rented 5 [4.8] 6 [4.5] [0.271-3.081]
Access to
toilet
Absent 98 [94.2] 125 [91.9] 0.488 1.437Present 6 [5.8] 11 [8.1] [0.514-4.023]
Mothers
ANC visits
Less than 5 64 [61.5] 32 [22.7] 0.000 5.200More than 5 40 [38.5] 104 [77.3] [2.972-9.099]
Place of
delivery
Home 33[31.7] 42 [30.8] 0.888 1.040Institution 71 [68.3] 94 [69.2] [0.600-1.804]
63

There was a statistically significant association between the employment status of the
mother, employment status of the father, number of ANC visits by the mother and the
migration status of the child. Migrant children were 7.28 times more likely to have their
mother currently employed and 7.4 times more likely to have their father currently
employed. This employment status is at Jawadhi hills not during the time of migration.
Mothers of migrant children were 5.2 times more likely to have had less than five antenatal
visits in total. There was no association found between any of the other factors and
migration. There was also no statistically significant difference between the birth weights of
the children in both groups and the mean family incomes of both groups.
64

5.4 NUTRITIONAL STATUS
The weight, height and mid upper arm circumference was converted into a z-score and
calculated. The definitions of mild, moderate and severe wasting was taken from WHO
guidelines.
Table 5.4.1 Wasting and gender
Female MaleNumber Percent Number Percent
Mild wasting 79 67.6 62 50.4Moderate wasting 28 23.9 33 26.8Severe wasting 10 8.5 28 22.8
Figure 5.4.1 Wasting and gender
Severe wasting was more prevalent among males and mild wasting among females. The
prevalence of moderate wasting was comparable among both genders.
65
Mild Moderate Severe0
10
20
30
40
50
60
70
80
50.4
26.822.8
67.6
23.9
8.5
Male
Female
Grade of Wasting
Pe
rce
nta
ge
of t
ota
l

Table 5.4.2 Stunting and gender
Female MaleNumber Percent Number Percent
Mild stunting 102 87.2 89 72.3Moderate
stunting
14 12.0 27 22.0
Severe stunting 1 0.9 7 5.7
Figure 5.4.2 Stunting and gender
Both moderate and severe stunting was more prevalent among males.
66
Mild Moderate Severe0
10
20
30
40
50
60
70
80
90
100
72.3
22
5.7
87.2
12
0.9
Male
Female
Grade of stunting
Pe
rce
nta
ge
of t
ota
l

Table 5.4.3 MUAC and gender
Female MaleNumber Percent Number Percent
Mild wasting 74 63.2 73 47.2Moderate
wasting
43 36.8 65 52.8
Severe wasting 0 0 0 0
Malnutrition as defined by MUAC was comparable among both genders.
Waterlows classification of malnutrition was then done to compare between genders.
Table 5.4.4 and Table 5.4.5 Waterlows classification
Males Females
There were no children who were both stunted and wasted among the females. The
prevalence of neither stunted or wasted children was 54.8% among the females and only
29.2% among the males. Moderate and severe wasting and stunting were combined for the
purpose of bi-variate analysis. Chi square test was done with socio-demographic factors and
migration status as possible risk factors.
67
Normal Wasted
Normal 36[29.2%]
53[43.0%]
Stunted 26[21.1%]
8[6.5%]
Normal Wasted
Normal 64[54.8%]
38[32.4%]
Stunted 15[12.8%]
0

Table 5.4.6 Factors associated with wasting
Factor Wasted Not wasted p-value OR Adjusted OR
Migration
status
Migrant 41 [39.4] 63 [60.6] 0.615 0.875 1.136Non-migrant 58 [42.6] 78 [57.4] [0.52-1.47] [0.63-2.03]
Gender Male 61 [49.6] 62 [50.4] 0.007 2.044 2.207Female 38[32.5] 79 [67.5] [1.21-3.57] [1.28-3.84]
Family
type
Nuclear 49 [41.2] 70 [58.8] 0.982 0.994 1.063Non-nuclear 50 [41.3] 71 [58.7] [0.59-1.66] [0.62-1.81]
House
type
Thatched 44 [37.3] 74 [62.7] 0.220 0.724 1.448Others 55 [45.1] 67 [54.9] [0.43-1.21] [0.84-2.48]
Access to
toilet
Absent 94 [42.2] 129 [57.8] 0.304 1.749 0.570Present 5 [29.4] 12 [70.6] [0.59-5.13] [0.18-1.72]
ANC
visits
Less than 5 37 [38.5] 59 [61.5] 0.486 0.829 1.196
More than 5 62 [43.1] 82 [56.9] [0.49-1.4] [0.66-2.15]
Place of
delivery
Home 34 [45.3] 41 [54.7] 0.386 1.276 0.732Institution 65 [39.4] 100 [60.6] [0.73-2.21] [0.41-1.30]
Income High 47 [40.9] 68 [59.1] 0.909 0.970 0.903
Low 52 [41.6] 73 [58.4] [0.58-1.62] [0.52-1.54]
68

Income was dichotomized at the median total income as high and low. There was a
statistically significant association between gender and wasting. Males were 2.044 times
more likely to be wasted as compared to females. There were no other significant
associations found between any of the socio-demographic variables and wasting. There was
also no association found between migration and wasting. All the variables were included in
a binary logistic regression model to adjust for possible confounders. Here too, there was an
association between gender and wasting with boys being 2.207 more likely to have
moderate to severe wasting. The same was repeated with moderate and severe stunting.
69

Table 5.4.7 Factors associated with stunting
Factor Stunted Not
Stunted
p-value OR Adjusted OR
Migration
status
Migrant 28 [26.9] 76 [73.1] 0.029 2.018 2.217Non-migrant 21 [15.4] 115 [84.6] [1.06-3.81] [1.02-4.38]
Gender Male 34 [27.6] 89 [72.4] 0.004 2.597 2.457Female 15 [12.8] 102 [87.2] [1.3-5.26] [1.23-5.00]
Family
type
Nuclear 23 [19.3] 96 [80.7] 0.678 0.875 1.170Non-nuclear 26 [21.5] 95 [78.5] [0.46-1.64] [0.60-2.25]
House
type
Thatched 29 [24.6] 89 [75.4] 0.116 1.662 0.708Others 20 [16.4] 102 [83.6] [0.87-3.14] [0.36-1.38]
Access to
toilet
Absent 46 [20.6] 177 [79.4] 0.769 1.213 1.011Present 3 [17.6] 14 [82.4] [0.33-4.39] [0.26-3.85]
ANC
visits
Less than 5 20 [20.8] 76 [79.2] 0.896 1.044 1.306
More than 5 29 [20.1] 115 [79.9] [0.55-1.97] [0.62-2.71]
Place of
delivery
Home 16 [21.3] 59 [78.7] 0.812 1.085 0.896Institution 33 [20.0] 132 [80.0] [0.55-2.12] [0.43-1.83]
Income High 21 [16.8] 104 [83.2] 0.147 0.627 1.647
Low 28 [24.3] 87 [75.7] [0.33-1.18] [0.84-3.20]
70

There was an association between migration status and stunting as well as gender and
stunting. Migrant children were 2.018 times more likely to be stunted and boys were 2.597
more likely to be stunted. A binary logistic model also gave the same results with migrants
2.217 more likely to be stunted and boys 2.45 more likely to be stunted. There were no
significant associations for any factors with MUAC for age. There was a statistically
significant association with weight for age and gender, with males 3.0 times more likely to
have a weight for age Z score less than -2.0
71
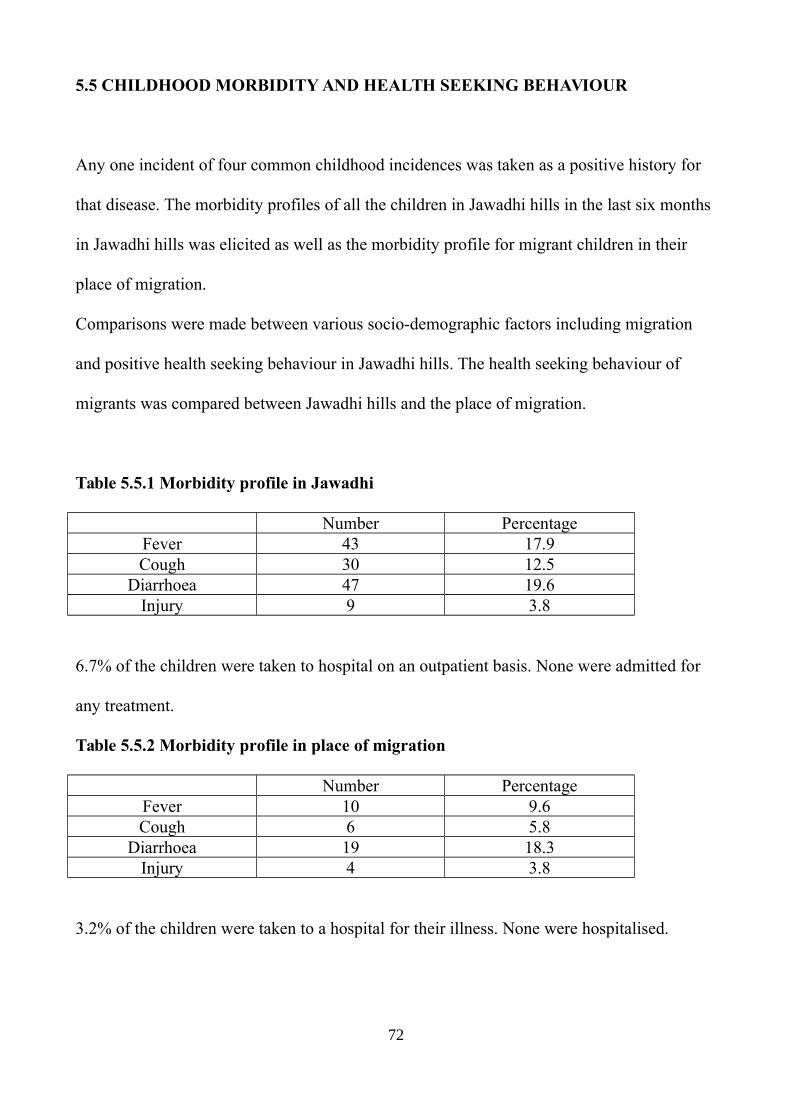
5.5 CHILDHOOD MORBIDITY AND HEALTH SEEKING BEHAVIOUR
Any one incident of four common childhood incidences was taken as a positive history for
that disease. The morbidity profiles of all the children in Jawadhi hills in the last six months
in Jawadhi hills was elicited as well as the morbidity profile for migrant children in their
place of migration.
Comparisons were made between various socio-demographic factors including migration
and positive health seeking behaviour in Jawadhi hills. The health seeking behaviour of
migrants was compared between Jawadhi hills and the place of migration.
Table 5.5.1 Morbidity profile in Jawadhi
Number PercentageFever 43 17.9Cough 30 12.5
Diarrhoea 47 19.6Injury 9 3.8
6.7% of the children were taken to hospital on an outpatient basis. None were admitted for
any treatment.
Table 5.5.2 Morbidity profile in place of migration
Number PercentageFever 10 9.6Cough 6 5.8
Diarrhoea 19 18.3Injury 4 3.8
3.2% of the children were taken to a hospital for their illness. None were hospitalised.
72

Table 5.5.3 Hospital visits for illness
Factor Visited
hospital
No hospital
visit
p-value OR
Migration
status
Migrant 9 [18.8] 39 [81.3] 0.321 1.714Non-migrant 7 [11.9] 52 [88.1] [0.587-5.00]
Gender Female 11 [18.6] 48 [81.4] 0.235 1.971Male 5 [10.4] 43 [89.6] [0.634-6.128]
Family type Nuclear 8 [15.1] 45 [84.9] 0.968 1.022Non-nuclear 8 [14.8] 46 [85.2] [0.353-2.958]
House type Thatched 7 [12.5] 49 [87.5] 0.456 0.667Others 9 [17.6] 42 [82.4] [0.229-1.944]
ANC visits Less than 5 6 [13.0] 40 [87.0] 0.630 0.765
More than 5 10 [16.4] 51 [83.6] [0.256-2.283]Place of
delivery
Near 7 [18.9] 30 [81.1] 0.403 1.582Far 9 [12.9] 61 [87.1] [0.537-4.651]
Income High 11[20.4] 43 [79.6] 0.113 2.457
Low 5 [9.4] 48 [90.6] [0.789-7.633]
There was no association between any socio-demographic factors including migration and
positive health seeking behaviour while in Jawadhi hills.
73

Table 5.5.4 Comparison of health seeking between Jawadhi and place of migration
Visited
hospital
No hospital
visit
p-value OR
In Jawadhi 2 [4.1] 46 [95.9] 0.325 0.405In Migration 3 [9.6] 28 [90.4] [0.06-2.58]
There was no difference in health seeking behaviour for childhood illnesses between
Jawadhi hills and the place of migration.
74

6. DISCUSSION
There has been a steady rise in the rate of migration, both globally and locally. (11) (12)
(13) (14). Given the current economic state in the world, and more so in India, the rate is
expected to increase in the coming decades. With the various factors that lead to migration
still not being addressed, without a careful; plan and implementation, the results could be
disastrous for the population .
This study looked at the prevalence of malnutrition among children aged between 6 and 59
months. It also looked at health seeking behaviour with respect to antenatal care and
childhood morbidity. Using the migration status as sub-group, a comparison between the
nutritional status and health seeking behaviour was done. Thirty villages were selected from
two panchayaths in Jawadhi hills known to have a high rate of migration. Eight children in
the chosen age group were selected in each village.
Analysis of the age and sex distribution of the study population showed that roughly half -
[49%] of the population was female. There was an almost uniform spread of all the age
groups considered, even after separating gender. Sixty percent of the children were the first
child of their parents and the number of people with higher birth orders progressively
decreased with an increase in the number. It has to be noted however though, that there is
still a few children with birth orders of four and five.
75

Even after seven decades after independence, the facilities for sanitation remain extremely
poor in Jawadhi hills. With a growing focus on making India open defecation free, many
initiatives have come nationally, leading to multiple government reports stating that the
country is officially open defecation free. This was announced by the Primeminister on
October 2nd 2019. Our study found that over 92% of the children studied were still practising
open defecation. In many of the cases, there were both complete and incomplete toilets in
their homes or near it. Even with the infrastructure in place, there is still a lack of motivation
from the side of the community for the usage of toilets. Just building infrastructure only
solves part of the problem and does not address all the issues. Given the multiple
implications from such a high prevalence of unsanitary practices, a structural rethinking of
the approach should be done.
In terms of housing, about half the families lived in thatched huts. The other half had both
self-built and government assisted concrete or tiled housing. Half the families also lived as
nuclear families. The other half was divided between joint and extended. This is an
important point to note as in most other rural areas, extended families and joint families are
more common.
76

The study showed a very high prevalence of seasonal migration. 43% of the children in the
study had migrated along with their parents in the past one year. 47% of the women and
52% of the men had also migrated. In a sense half the population in the working age group
had to leave their place of residence to find work for a part of the year. The latest NSS gives
the rate in rural tribal population as 34%, making these two panchayaths in Jawadhi hills
have a much higher percentage.
Usually majority of the migration happens to the state of Kerala and a smaller number to
Karnataka. This year however, after the Kerala floods, there was a decrease in the job
opportunities there and most of the people went to Karnataka. The patter of migration is
very localised, in the sense that people from the same village migrate to the same place for
work, usually arranged by a local contractor in the village. This helps because even at the
point of migration there still exists a social support system. Sharing of duties such as
cooking and taking care of children also exists in this pattern. The doctrine of safety in
number applies to this pattern. What was surprising however was that most people could
not name the exact place they were migrating to. The only knowledge present was the state
which they had migrated to and occasionally the railway station they alighted in. This was
applicable to both men and women. This makes the population which migrates much more
vulnerable in general and at the mercy of the local contractor and the estate manager at the
place of migration. This can be seen in the fact that over 40% of the women didn’t know
any place for emergency health care in case they needed to go. The implications are
discussed more about health seeking behaviour.
77

Living conditions at the place of migration were considerably worse off as compared to
Jawadhi hills. 74% of the children who migrated stayed in temporary sheds erected for the
period of migration. Only 18% stayed in a permanent house. The median number of people
staying at the same place was 10 in the place of migration and only 4 in Jawadhi.
Surprisingly, the percentage of people with access to toilet is marginally higher in the place
of migration. The access to clean water was the same in both places.
The results for antenatal care paint a very different picture than what present data shows.
While the NFHS 4 had shown that 83% of the women in Tiruvannalmalai district had more
than four antenatal check-ups, our study found that only 60% had more than four. More
importantly, only 15% of the women who migrated had any antenatal check-up in the place
of migration. Considering that the women spend between 4 and 6 months at the place of
migration, this number is alarmingly high. There is also a difference in the place of
migration as nobody who migrated to Karnataka had any antenatal check-ups. Tetanus
immunization coverage was 94%, which though is a high number should ideally be 100%.
Several possible factors can be attributed to the reduced number of check-ups. Though both
the panchayaths taken for the study have PHCs within the panchayath, , a number of
villages remain inaccessible by road given the rough nature of the. Some villages have only
dirt tracks making walking the most practical form of travel. For those who are daily wage
labourers ,the loss of pay for even a day can have a profound economic impact making the
a trip to the PHC even once a month hard.
78

At the place of migration a number of other factors add up to the economics. Difference in
language and local biases account for the absence. The fact that most migrants don’t know
exactly where they are and the location of a local health centre makes it even harder. Given
the structured nature of antenatal care with everyone attached to a local PHC and supposed
to have regular care from there, there is an alienation from the system leading to loss of
access to the care.
The decrease in the access to antenatal care also translates to a decrease in the. The study
population had only institutional delivery rate of 68.7%. Tamil Nadu has an institutional
delivery rate of 99%, Historically, institutional deliveries in the region have always been
uncommon partly due to geographical barriers and the presence of traditionally trained
persons in the village capable of conducting deliveries. Though the number has increased
considerably after the advent of the Muthulakshmi Reddy scheme , which gives a cash
benefit for antenatal care and hospital births, there is much more scope for an improvement
in this aspect. None of the study subjects had delivered in the place of migration. The
continued presence of a high rate of home deliveries is bound to influence the overall health
situation in Jawadhi hills.
79

Two indicators were used for the analysis of malnutrition,. The weight for height and height
for age were considered. The overall prevalence of wasting [moderate and severe] was
found to be 41.25%. This level was higher than the NFHS 4 result of 36.5%. Other studies
done in Jawadhi have found the rates to be lower. The number is comparable to that of the
expert committee on tribal health [42%] and Tamil state planning commission report
[41.7%].
Boys were 2.044 [95% CI 1.21-3.57] more likely to be wasted as compared to girls. There
was no association with migration status and wasting. There is no evidence of an increased
risk acute malnutrition in migrants.
The overall prevalence of stunting was found to be 20.4%. This level was considerably
lower than the NFHS 4 prevalence of 27% in Tiruvannamalai district. The number is also
much lower than other studies done in Jawadhi hills which found a prevalence rate of 55.4%
for stunting. There was a statistically significant association found between gender and
stunting as well as migration status and stunting. Migrant children were 2.018 [1.06-3.81]
times more likely to be stunted and boys were 2.597 [ 1.3-5.36] more likely to be stunted.
Multiple studies have found that it is the economically poorer groups of population which
tend to migrate. (15) Given the fact that the families of migrant workers were probably
poorer to start off with causing them to migrate, the chronic malnutrition can be explained.
Although there wasn’t a statistically significant difference in the family income between
migrants and non-migrants in the study population, it is safe to assume that the migrants
were probably poorer a few years earlier. This is compounded by the fact that parents of
80

migrant children also tend to have a higher percentage of employment when back in the hills
after migration. If the need for a job can be seen as an indicator for the economic status, the
migrant group is poorer. The fact that there is no association with wasting and thereby acute
malnutrition and migration status shows that the economic benefits of migration have had a
part to play in the situation currently.
Seen from this perspective, it can be argued that migrating for labour may be protective for
the development of acute malnutrition. Migration ensured enough economic relief to avoid
a condition of acute malnutrition. This argument however only looks at malnutrition as an
effect of a lower economic status and does not consider other factors. The worse living
conditions in the place of migration and the time away from programs like the anganwadi
system in the place of migration may have a negative impact on the nutritional status.
The association between gender and malnutrition found here in this study is slightly harder
to understand. Normal global patterns, especially in low- and middle-income countries have
a higher rate of malnutrition among female children. (16) (17) (18) Many reasons are
attributed to this but the underlying factor is discrimination against female children by virtue
of their gender. In many South Asian societies there is a gender preference for male children
due to the cultural norms of inheritance and care for the elderly. Taking the fact that the
parents would prefer a male child instead of a female child, the overall care for the child
decreases for females. This is manifested in a lower school enrolment rate for girls, worse
health seeking behaviour and finally into a poorer nutritional status.
81

Given all these, it is intuitive to think that a population in a tribal area will have a higher
rate of malnutrition for girls, considering the population overall is of a lower economic
status. The findings of the study on the other hand, show that male children have a
statistically significant higher rate of both stunting and wasting. A possible explanation for
this is that the discriminatory practices found in many other parts of the country are absent
in Jawadhi hills. Prior work experience by the institution in Jawadhi hills has indicated that,
though there is a preference for a male child at birth, after that there isn’t much
discrimination practised in the community. If both genders now will receive the same
amount of care and nutrition, female children are constitutionally more likely to thrive under
the same conditions. A lack of gender-specific discrimination could explain why for the
given set of environmental conditions, female children will seem better of as far as
nutritional status is considered. This explanation could ideally be tested by looking at other
outcomes such as school enrolment and employment opportunities . The difference is thus
explained by biological factors given that the environment and social factors are assumed to
be equal in both the genders.
On analysing the health seeking behaviour a few interesting patterns were found. Health
seeking behaviour for childhood morbidity was taken as the instance of visit to a hospital for
any of the common childhood illnesses asked for in the questionnaire. If a child had a
condition in the past six months and was take to any healthcare centre for the same, it was
taken as a positive health seeking behaviour. Children who had fallen ill and not taken to the
hospital was assumed to be having a negative health seeking behaviour.
82

There was no association between positive health seeking behaviour and socio-
demographic variables including migration. Visits to any health care setup occurred only in
6.7% of the instances of illness.
On comparing the health seeking behaviour between Jawadhi hills and the place of
migration, there was no significant difference. There was a difference in the occurrence of
any of the illness, where there were more reported instances at home as compared to the
place of migration but the difference was not statistically significant..
Health seeking behaviour of a population is a result of many factors like economic status,
cultural values, access to health care and knowledge about the disease condition. When in
Jawadhi hills the only factor that would differ from the migrants and others would be
knowledge gained from migration and observing health seeking patterns outside Jawadhi
hills. There was no statistically significant difference in the income and distance from
hospital and we can assume that the cultural factors regarding the disease will be same in
both the groups. Given the fact that there no difference between both the groups, we can
conclude that observation of health seeking behaviour in places outside Jawadhi did not
translate into a difference in the actual practice of health seeking. In the place of migration
the only different factor would be the access to health care and the local factors like
acceptance in the place and discrimination. None of these were significant enough to bring
about a change in the health seeking behaviour.
83

These observations lead us to conclude that addressing the root cause of migration may help
solve the problems that arise from it such as poor antenatal care. A higher degree of chronic
malnutrition among migrant children may indicate that it may be the poorer who tend to
migrate. If the economic factors that that lead people to migrate away in the first place could
be alleviated by any mechanism, the need for migration would not arise.
The poorer quality and availability of healthcare, especially with regard to antenatal care in
the place of migration, indicate the need for a more comprehensive health delivery system
for migrants at their place of migration. The rate of migration is only set to increase in the
years to come. Not addressing this will further alienate a migrant population which is more
vulnerable to start with. While structural mechanisms need to be brought in to address this
issue, there also needs to be change at a humanitarian level with acceptance of a migrant
population. Lastly, there needs to be a conscious effort to bring this populations from the
informal sectors into the formal and recognized labour force. Only then can there be a
larger, more comprehensive change in the nature of work and the living conditions of those
migrating for for manual work .
84

7. CONCLUSION
1. The prevalence of wasting among children aged 6 to 59 months was found to be
41.2% and that of stunting to be 20.4%.%.
2. Unsanitary practices like open defecation are very prevalent [92.9%].
3. Male gender was a risk factor for wasting with an adjusted odds ratio of 2.207 [1.28-
3.84].
4. The male gender was also a risk factor for stunting with an adjusted odds ratio of
2.457 [1.83-5.0].
5. Children migrating with their parents also had a 2.217 times chance of having
stunting.
6. Migrant mothers were 5.2 times more likely to have had less than 5 antenatal check-
ups
7. There was no association between migration status and health seeking behaviour for
childhood illnesses
85

8. RECOMMENDATIONS
Based on the results of found by the study and the inferences madewe would like to
recommend that:
1. The root cause of migration is socio-economic, with the poorer sections of society
tending to migrate more. With all the problems attributed to migration, a
comprehensive system including higher work opportunities at the place of residence
is needed to check the problem.
2. The prevalence of malnutrition is still extremely high even after multiple years
trying to address the problem. A more streamlined approach that is able to cater to a
larger section of the population is required. Along with this, adequate support, both
monetary and human resources should be put into existing programs. A complete
and through audit of programs like the anganwadi system and mid-day meal scheme
is the need of the hour. If there are shortcomings and gaps in providing the necessary
facilities, they need to be addressed. Systems to identify children who are at risk of
malnutrition, and who show early signs of malnutrition should be put in place.
Adding to this, targeted treatment of the cases found with nutritional supplementation
and parental counselling is needed. This can be aligned with existing infrastructure
86

like the PDS system and man power like ASHA workers. This is also directly related
to the first point about income generation and improvement of economic statndards.
3. There is an urgent need to bring rhe migrant population into the social security
mechanisms implemented by the state. Most migrants who go to other states,
especially seasonal migrants exist outside the social security mechanisms iBeing
outside the system results in the loss of things like antenatal care and childhood
immunization. With no proper follow up between various centres of health, the
migrant population gets lost. With the overall stress nationally on adequate and
proper antenatal care, extra steps need to be taken to ensure this group is incuded.
Steps like having separate clinics for migrants labourers in states with high migration
could be attempted.
4. Being a part of the informal sector, most migrant labourers don’t get covered by any
labour laws. This is reflected by the fact that living conditions are much worse than
those at home. The nature of labour is also much harder in nature . A more regulated
informal sector, which has to comply to all the labour laws is needed.Employers of
migrant labourers should be mandated to ensure that every employee has access to
healthcare, that every pregnant woman has access to proper care and that living
conditions should meet a certain standard
87

9. LIMITATIONS
1. The sample collection could not be done exactly as planned due to the geography of
the villages. With only a few number of villages having a clear quadridirectional
orientation, there was some amount of change in direction, making the sampling not
completely ideal.
2. Recall bias for morbidty in the past six months could have affected the results
regarding health seeking.
88

10.0 BIBLIOGRAPHY
1. NFHS 4 India.
2. Expert report on Tribal Health in India – Dr. Abhay Bhang
3. Census of India: Migration [Internet]. [cited 2019 Oct 17]. Available from: http://censusindia.gov.in/Census_And_You/migrations.aspx
4. Global Migration Trends [Internet]. International Organization for Migration. 2018 [cited 2019 Oct 16]. Available from: https://www.iom.int/global-migration-trends
5. Barriers to access to health services for migrants | Situation Report [Internet]. [cited 2017 Dec 28]. Available from: http://sitreport.unescapsdd.org/health/barriers-access-health-services-migrants
6. Borhade A. Health of internal labour migrants in India: Some reflections on the current situation and way forward. Asia Eur J. 2011 Apr 1;8:457–60.
7. Mohan P, Agarwal K, Jain P. Child Malnutrition in Rajasthan. 2016;(33):9.
8. s12914-017-0132-4.pdf [Internet]. [cited 2017 Dec 28]. Available from: https://link.springer.com/content/pdf/10.1186/s12914-017-0132-4.pdf
9. UNESCO, New Delhi, UNICEF, New Delhi, Indian Council of Social Science Research, Sir Dorabji Tata Trust, editors. Internal migration in India initiative: National Workshop on Internal Migration and Human Development in India: 6-7 December 2011: workshop compendium. New Delhi: United Nations Educational, Scientific and Cultural Organization : UNICEF; 2011. 2 p.
10. WHO-HEN-Report-A5-1-Labour-FINAL_EN.pdf [Internet]. [cited 2017 Dec 28]. Available from: http://www.epgencms.europarl.europa.eu/cmsdata/upload/114f16b6-1667-44ab-802b-a5a83dd50af0/WHO-HEN-Report-A5-1-Labour-FINAL_EN.pdf
11. United Nations International Migration Report 2017.
12. Migration [Internet]. 2018 [cited 2019 Oct 16]. Available from: https://www.un.org/en/sections/issues-depth/migration/index.html
13. Global Trend Towards Urbanisation [Internet]. [cited 2019 Oct 16]. Available from: http://www.unesco.org/education/tlsf/mods/theme_c/popups/mod13t01s009.html
14. KUNAL KESHRI* - RAM. B. BHAGAT* Temporary and seasonal migration in India.
15. TNFOREST :: Tamil Nadu Forest Department [Internet]. [cited 2019 Oct 17]. Available from: https://www.forests.tn.gov.in/pages/view/Tribal_Development_on-going
89

16. Vasanthapriya S, Asokhan M. Impact of Off-seasonal Migration of Hilly Tribes in Tiruvannamalai District of Tamilnadu. Asian J Agric Ext Econ Sociol. 2019 Oct 9;1–9.
17. Malnutrition [Internet]. [cited 2019 Oct 19]. Available from: https://www.who.int/news-room/fact-sheets/detail/malnutrition
18. technical_report_2.pdf [Internet]. [cited 2018 May 27]. Available from: http://www.who.int/childgrowth/standards/second_set/technical_report_2.pdf?ua=1
19. Technical_report.pdf [Internet]. [cited 2018 May 27]. Available from: http://www.who.int/childgrowth/standards/Technical_report.pdf?ua=1
20. Malnutrition [Internet]. [cited 2019 Oct 19]. Available from: https://www.who.int/news-room/fact-sheets/detail/malnutrition
21. WHO | Description [Internet]. WHO. [cited 2019 Oct 19]. Available from: https://www.who.int/nutgrowthdb/about/introduction/en/index2.html
22. Figure 1 Waterlow classification. A, C, D and F: stunted or wasted. B:... [Internet]. ResearchGate. [cited 2019 Oct 19]. Available from: https://www.researchgate.net/figure/Waterlow-classification-A-C-D-and-F-stunted-or-wasted-B-stunted-and-wasted-E_fig1_11924124
23. 9789241598163_eng.pdf [Internet]. [cited 2018 May 27]. Available from: http://www.who.int/nutrition/publications/severemalnutrition/9789241598163_eng.pdf
24. jme_unicef_who_wb.pdf [Internet]. [cited 2019 Oct 19]. Available from: https://www.who.int/nutgrowthdb/jme_unicef_who_wb.pdf
25. Padma DK. Malnutrition – Incidence and Impact (A Comparative Study of Four Southern States in India). :10.
26. Malnutrition Quantifying the health impact at national and local levels.
27. NFHS 4 TN.
28. NFHS 4 Tiruvannamalai.
29. T GT, Logaraj M, John KR. Assessment of nutritional status of children aged under five years in tribal population of Jawadhu hills in Tamil Nadu. Int J Community Med Public Health. 2018 Feb 24;5(3):1041–6.
30. Das S, Das M. Health Seeking Behaviour and the Indian Health System. J Prev Med Holist Health. :5.
31. WHO | New guidelines on antenatal care for a positive pregnancy experience [Internet]. WHO. [cited 2019 Oct 19]. Available from: http://www.who.int/reproductivehealth/news/antenatal-care/en/
90

32. Delivery care [Internet]. UNICEF DATA. [cited 2019 Oct 19]. Available from: https://data.unicef.org/topic/maternal-health/delivery-care/
33. Institutional Deliveries | NITI Aayog [Internet]. [cited 2019 Oct 19]. Available from: https://niti.gov.in/content/institutional-deliveries
34. PIIS0140-6736(16)32262-0.pdf [Internet]. [cited 2017 Dec 28]. Available from: http://www.thelancet.com/pdfs/journals/lancet/PIIS0140-6736(16)32262-0.pdf
35. Hesketh T, Jun YX, Lu L, Mei WH. Health Status and Access to Health Care of Migrant Workers in China. Public Health Rep. 2008;123(2):189–97.
36. Singh PK, Rai RK, Singh L. Examining the Effect of Household Wealth and Migration Status on Safe Delivery Care in Urban India, 1992–2006. PLoS ONE [Internet]. 2012 Sep 7 [cited 2019 Jan 23];7(9). Available from: https://www.ncbi.nlm.nih.gov/pmc/articles/PMC3436793/
37. Abrol A, Kalia M, Gupta B, Sekhon A. Maternal Health Indicators Among Migrant Women Construction Workers. Indian J Community Med Off Publ Indian Assoc Prev Soc Med. 2008 Oct;33(4):276–7.
38. Wise T. DISTRICT CENSUS HANDBOOK. :346.
39. Bhagat R. Internal Migration in India: Are the Underprivileged Migrating More? Asia-Pac Popul J. 2010 Jun 1;25.
40. Mehrotra S. Child Malnutrition and Gender Discrimination in South Asia. Econ Polit Wkly. 2006;41(10):912–8.
41. Pillai VK, Ortiz-Rodriguez J. Child Malnutrition and Gender Preference in India: The Role of Culture. Health Sci J [Internet]. 2015 Nov 13 [cited 2019 Oct 20];9(6). Available from: http://www.hsj.gr/abstract/child-malnutrition-and-gender-preference-in-india-the-role-of-culture-7426.html
42. Child Undernutrition in India: A Gender Issue | UNICEF [Internet]. [cited 2019 Oct 20]. Available from: https://unicef.in/Story/108/Child-Undernutrition-in-India-A-Gender-Issue
91

11.0 APPENDIX
APPENDIX 11.1 IRB CLEARANCE FORMS
92
93

94

95

96

APPENDIX 11.2 DATA COLLECTION PROFORMA
97

98

99

100

APPENDIX 11.3 CONSENT FORM – ENGLISH
101

102

APPENDIX 11.4 CONSENT FORM – TAMIZH
103

104
APPENDIX 11.5 INFORMATION SHEET – ENGLISH
105

106

APPENDIX 11.6 INFORMATION SHEET – TAMIZH
107

108

109