a study of the effect of construction variable on the bond...
TRANSCRIPT

TECHNICAL REPORT STANDARD TITLE PAGE
1. Report No. 2. Go•en'IIIIOftt Accenio" No. 3. Rocipieftl' s Catalog No. I FHWA/TX-88+457-4
... Title oftd S...lotitle S. Report Dote I A STUDY OF THE EFFECT OF CONSTRUCTION October 1987
VARIABLES ON THE BOND BEHAVIOR 6. Perlormiftg Organization Code OF CRCP OVERLAYS 7. Authorls) 8. P erlorming Orgoni zation Report No. Abdulrahman Ismail Solanki,
Resea~ch Report D. W. Fowler, and B. Frank McCullough 457-4 9. Performing Orgllftizotion Nome llftd Addreu 10. Work Unit No.
Center for Transportation Research The University of Texas at Austin 11. Conlract or Grant No.
Austin, Texas 78712-1075 Research Study 3-8-86-457 13. Type of Report and Period Covered
12. Sponsoring Agency Nome and Addreu
Texas State Department of Highways and Public Interim Transportation; Transportation Planning Division
P. o. Box 5051 1 ... Sponsoring Agency Code Austin, Texas 78763-5051 15. Supplementary Notn
Study conducted in cooperation with the U. s. Department of Transportation, Federal Highway Administration
Research Study Title: "Thin-Bonded Overlay Implementation" 16. Abatroct
This report summarizes the findings of Report 457-4, "A Study of the Effect of Construction Variables on the Bond Behavior of CRCP Overlays," and describes a series of research activities concerned with the development of the bond between an existing CRCP pavement and a new CRCP overlay.
This report includes a summary of activities related to preparation of the surface, and determination of the effect of moisture leve 1, grout condition, vibration level, and locations in CRCP overlays. Results of general linear model (GLM) analysis are used to find the best and worst interactions of variables.
Various texture measurement and bond evaluation devices are evaluated in terms of time, economy, and repeatability.
17. Key Warda 18. Diattibutlon St_. __ t
overlays, CRCP, interface bond, density, No restrictions. This document is texture measurement, interface bond available to the public through the evaluation, interactions, construction National Technical Information Service, variables, grout, moisture, vibration Springfield, Virginia 22161.
19. Security Clouil. (of thia r.,.n) 20. Security Cl .. alf. (of thiap ... ) 21. No. of Poges 22. Price
Unclassified Unclassified 50
Form DOT F 1700.7 ca.ul

A STUDY OF THE EFFECT OF CONSTRUCTION VARIABLES ON THE BOND BEHAVIOR OF CRCP OVERLAYS
by
Abdulrahman Ismail Solanki D. W.Fowler
B. Frank McCullough
Research Report 457·4
Thin-Bonded Overlay Implementation Research Project 3-8-86-457
conducted for the
Texas State Department of Highways and Public Transportation
in cooperation with the
U. S. Department of Transportation Federal Highway Administration
by the
CENTER FOR TRANSPORTATION RESEARCH Bureau of Engineering Research
THE UNIVERSITY OF TEXAS AT AUSTIN
September 1987

The contents of this report reflect the views of the authors, who are responsible for the facts and the accuracy of the data presented herein. The contents do not necessarily reflect the official views or policies of the Federal Highway Administration. This report does not constitute a standard, specification, or regulation.
ii
PREFACE The work accomplished and summarized in this report
was subdivided into the following categories:
(1) pilot study: (a) evaluation of texture measurement devices, (b) selection of two appropriate vibration levels for field study, and (c) evaluation ofbond measurement devices.
(2) field study of the effect on the bond at interface, density, and tensile strength of concrete depending on the following factors:
(a) vibration level, (b) moisture condition, (c) grout condition, and (d) location of core.
iii
Special appreciation is extended to David Whitney, Abdullatif Solanki, So hail Khan, Constantine Pehlivanides, Chris Papaleontiou, George Frantzi, Don Dombroski, Dr. Virgil Anderson, Dr. Waheed Uddin, Jim Lundy, Joy Suvunphugdee, Soetjipto Koesno, Koestomo Koesno, Fred Barth, James Stewart, and the work study students for the laboratory testing program and field testing program; Lyn Gabbert and Michele Sewell for typing and drafting the manuscript; the Texas State Department of Highways and Public Transportation and its officials who helped in getting the site for the field study and foe providing equipment; and Mike Swain of Humble Equipment Company for his suggestions on surface preparation technique, and for equipment support.
Appreciation is also extended to all the staff of CTR and the Civil Engineering department for their readiness to help when needed. Their assistance was essential to the conduct of this study.

LIST OF REPORTS Report457-l, "Preliminary Design of a Testing Facility
to Subject Full Scale Pavement Sections to Static and Cyclic Loading," by Marlc: D. Wickham, B. Frank McCullough, and D. W. Fowler, defmes the problems of and presents possible solutions for the design of a testing facility to cyclicly load full scale pavement sections.
Report 457-2, "A Laboratory Study of the Fatigue of Bonded PCC Overlays," by Karen Reilley, Chhote Saraf, B. Frank McCullough, and D. W. Fowler, presents the findings of laboratory fatigue experiments which simulate the field conditions of lli-610 in Houston, Texas.
Report457-3, "A Mechanistic Design for Thin-Bonded Concrete Overlay Pavements," by Moussa Bagate and B. Frank McCullough, presents a detailed procedure which can
iv
be used by the Texas SDHPT to design bonded concrete overlays of continuously reinforced concrete pavements. The procedure utilizes the fmite element method and field data for the structural analysis; an economic model accounts for the worth of the bonded concrete overlay by using initial construction of the overlay and subsequent maintenance of the pavement structure.
Report 457-4, "A Study of the Effect of Construction Variables on the Bond Behavior of CRCP Overlays," by Abdulralunan Ismail Solanki, D. W. Fowler, and B. Frank McCullough, presents the findings of a pilot study and afield study to select the best combination of factors that effect bond at the interface.

ABSTRACT
This report summarizes the findings of report457 -4, "A Study of the Effect of Construction Variables on the Bond Behavior of CRCP Overlays," and describes a series of research activities concerned with the development of the bond between an existing CRCP pavement and a new CRCP overlay.
This report includes a summary of activities related to prepamtion of the surface, and determination of the effect of
moisture level, grout condition, vibration level, and locations in CRCP overlays . Results of general linear models (GLM) analysis are used to fmd the best and worst interactions of variables.
Various texture measurement and bond evaluation devices are evaluated in terms of time, economy, andrepeatability.
KEYWORDS: Overlays, CRCP, interface bond, density, texture measurement, interface bond evaluation, interactions, construction variables, grout, moisture, vibration, location.
v

SUMMARY Development of the bond between an existing CRCP
pavement and a new CRCP overlay is an important aspect of pavement design. The development of bond between the two concretes gives an indication of the structural capacity of the pavement
The development of the bond depends on many variables, like seasonal variations, vibration levels, moisture condition, presence of grout and surface preparation techniques. Evaluation of texture and bond is also an important aspect of pavement design.
This study involves a pilot study and a field study. The pilot study includes evaluation of texture, and bond by several methods and devices. It also involves selection of two appropriate vibration levels for the field study. The field study includes evaluation of bond at the interface and den-
vi
sity, and tensile stength of the concrete, depending on various variables.
Significant interactions and factors are found by using General Linear Model (GLM) analysis.
In addition, conclusions are made and recommendations given to help in the implementation of the findings of the study.
Variables associated with the construction of pavement overlays vary significantly from one operation to another. The determination of the best and worst interaction of variables will improve the construction practice and increase reliability of the overlays.
Information and recommendations related to the above concepts are summarized in this report.

IMPLEMENTATION STATEMENT
Steps should be taken to begin the implementation of the findings of this study. The use of the knowledge concerning the interaction of construction variables should
vii
result in better construction practices and lead to a more reliable bond development under the given conditions.

TABLE OF CONTENTS
PREFACE . .. .. .. .. .. . . .... .. .. .. .... .. ... ...... .. .... . . .. .. .. .... . . ..... .... .. .... . . .... .. .. .. .... .... ... .......... .... .. .. .. .. .. .. .. .. . .. .. iii
LIST OF REP()RTS ................ ............ ............... ...... .................................... .......... .... .... ........ ....... iv
ABS1RACf................................................................................................................................. v
SUMMARY................................................................................................................................. vi
IMPLEMENTATION STA1EMENT ................................................................................................ vii
C~Rl. ThiTRODUCTION
BACKGROUND ... .. .... .. .... ...... ...... ..... .. .... . . ...... .... ....... ........ ........ ........... .. .. .. .. .... .. .. .. .... .... ... .... 1 Designs of Overlays on CRCP..... .... .. .. .. .. .... .. .... . .... .. .......... ......... .............. ............. .. .... .. ..... 1
Experience at the Center for Transportation Research .... ........ ... .... .. .. .. .... .. ... .. .. .. .. .. .... . ...... ......... 2 OBJECfiVE OF TilE STUDY.................................................................................................. 2 SCOPE OF TilE STUDY......................................................................................................... 2 SCOPE OF TilE REroRT ... .... .. .. .... . . .... . . ... . . .. .. . . .... . . .. .. . . .... ... .. .. .. .. .. .. .. .. .. .. . .. .. .. .. .. .. .. .. .... .. .. ... . . 2
~R 2. REVIEW OF CONS1RUCTION VARIABLES
SURFACE PREPARATION..................................................................................................... 3 Acid Etching..................................................................................................................... 3 Water Blasting................................................................................................................... 3 Air Blasting...................................................................................................................... 4
Sand Blasting.................................................................................................................... 4 Shot Blasting.................................................................................................................... 4 Rotomilling. ..... . .. ..... . . .......... ... ... .. . .. ..... .. ... . . ... ... . . ..... . . . .. ... . . ... .. . .. ... . . ... . . ..... ........ ... ..... .. ... . . 5
SURF ACE CONDmONS.... .... . . .... .. .... .. ... . . .... .. .. .. . . .... .. .. .. . .. . . .. .. .. . . .. .. .. .. .. .. . .. . . .. . . . . . . .. . . .. . . .. . . . . . .. 5 Grout Conditions............................................................................................................... 5 Moisture Conditions........................................................................................................... 5 Vibration Levels................................................................................................................ 6
SEASONAL VARIATIONS...................................................................................................... 6 Winter............................................................................................................................. 6 Summer........................................................................................................................... 7
SUMMARY........................................................................................................................... 7
C~ 3. 1EXTURE AND BOND EVALUATION METHODS
1EXTURE EVALUATION DEVICES .. .... . ... .. .. .. .. .. . .. .. .. .. .. .. .. .. .. .. . .. .. .. .. ... . . .... ... .... . .. .. .. .. .. .. .. .. ... . . 8 Sand Patch Method............................................................................................................. 8 Text-Ur-Meter ................................................................................................................... 8 Texwre Proflle Recorder...................................................................................................... 9
BOND EVALUATION DEVICES ............ .... .. ... . . .... .. .. .... ........ .. . .... .... . . .... .... . ... . . . .. .. .. .. .... .. .. .. . .. . . 9 Direct Shear Test............................................................................................................... 10 Bond Pull-Out Test............................................................................................................ 10
SUMMARY ........................................................................................................................... 11
viii

CHAPTER 4. DEVELOPMENT OF THE EXPERIMENTAL PROORAM
PROBLEM DEFINmON AND IDENTIFICATION...................................................................... 12 PILOT STUDY....................................................................................................................... 12 FIELD STUDY....................................................................................................................... 12
CHAPTERS. PILOTSTUDYPROGRAM
CONSTRUCTION OF SLAB.................................................................................................... 16 SURFACE PREPARATION..................................................................................................... 16 TEXTURE EVALUATION....................................................................................................... 16
Sand Patch Method............................................................................................................. 16 Text-Ur-Meter . .............. ...... .. . . ... .. .. .... .. ............ .... ..... .... . . .... .. . . . . .. .... ... .. .. .. .... . . . . .. . . .... .. .. . .. .. 17 Texture Profile Reconler .... .... . . . . .. .. .. . . ....................... ...... . ................... ... . .. .. .... .. .. . . .. .... . . .. . .... 17
OVERLAY PLACEMENT........................................................................................................ 17 VIBRATION LEVELS............................................................................................................. 17 CORIN"G PROORAM............ ........ .... . . ... . . .. .. .. .... .. .... ............... .... .... .. .... ... .. . . .. .. .. .. .... .. .. .. .... . .. .. 17 TESTIN"G PROORAM............................................................................................................. 18
Direct Shear...................................................................................................................... 18 Density............................................................................................................................ 18 Bond Pull-Out Strength...................................................................................................... 18
CHAPTER 6. FIELD STUDY
CONSTRUCTION OF THE TEST SLAB.................................................................................... 19 Surface Preparation............................................................................................................. 19 Mix Design .. .... ........ .......... .... . .... .. .. .... .. .. . . .. .. .. . . ............... .. .. .. . ... .. ... .... . . .. . . .. .. .. . . .. .. .... .. ... .. 20
QUALITY CONTROL............................................................................................................. 20 CORIN"G PROORAM.............................................................................................................. 21 TESTIN"G PROORAM............................................................................................................. 21
Di.rect Shear...................................................................................................................... 21 Density ............................................................................................................................ 21 Splitting Tensile Strength of Concrete................................................................................... 21
CHAPTER 7. RESULTS AND DISCUSSION
PILOT STUDY....................................................................................................................... 22 Texture Evaluation Devices.................................................................................................. 22 Direct Shear Test (Bond at Interface) .. .. . ... .. .. .. .. .. .. . .. .. .. .. . . .. .. . . .. .. .. . . . . .. . . .. . .. .. .. .. . .. .. .. .. .. .. .. .. .. . .. .. 23 Density ............................................................................................................................ 23 Bond Pull-Out Test............................................................................................................ 23
FIELD STUDY....................................................................................................................... 23 Direct Shear (Bond at Interface)............................................................................................. 24 Density ............................................................................................................................ 26 Tensile Strength of Overlay Concrete..................................................................................... 28
ix

RELATIONSHIP BETWEEN BOND, DENSITY AND 1ENSILE STRENGTH .................................. 28 Bond Versus Density.......................................................................................................... 29 Tensile Strength Versus Density........................................................................................... 29 Tensile Strength Versus Bond Strength.................................................................................. 29
CHANGE IN BOND STRENGTH FROM CORNER TO INTERIOR............................................... 29
CHAP'IER 8. CONCLUSIONS AND RECOMMENDATIONS
CONCLUSIONS..................................................................................................................... 32 RECOMMENDATIONS........................................................................................................... 32
REFERENCES............................................................................................................................. 33
APPENDICES
APPENDIX A......................................................................................................................... 35 APPENDIX B......................................................................................................................... 39
X
CHAPTER 1. INTRODUCTION
This chapter describes the background, including design of overlays and experience at the Center for Transportation Research, objective, and scope of the study and scope of the report.
BACKGROUND Conventionally. concrete resurfacing has been done
with asphalt overlays. Asphalt has been used because of its low cost and because the technology of asphalt paving was developed so that it made the paving operation fast and durable. Concrete was not used largely because the technology for concrete paving was relatively new and it could not compete with asphalt because of high costs and low reliability. However, with the increase in the cost of asphalt and a fairly developed concrete paving technology, concrete resurfacing is gaining popularity throughout the country. Reason its long economic life cycle and the fact that other asphalt overlays require frequent repairs causing excessive traffic delay costs.
Actually, old concrete pavements have been resurfaced with new concrete overlays since the beginning of this century and experience has shown that the repair of concrete pavements with bonded concrete may is effectively. A clean and sound surface must be provided to insure success, high quality materials must be used, and a high level of workmanship must be employed in placing and consolidating concrete, grouting and curing. Since the bonded concrete layers may be relatively thin, the ambient weather conditions must be considered (Ref 1).
Cores taken from various projects using different surface preparations have shown that adequate bond can be obtained between the old and the new concrete and that it will endure for a long time (Ref 2). Experience has also shown that any loss ofbond between the two surfaces occurs soon after the construction. There is little or no growth in the loss of bond area over a period of time and under service. Also, more debonding occurs at the corners of the slabs than elsewhere (Ref 2). The debonding at the corners is mainly due to lack of vibration there and also because of the curling of the comers due to shrinkage and temperature effects.
Many variables involved in the construction of concrete overlays on continuously reinforced concrete pavements (CRCP). The main unanswered questions to this date are
( 1) Whatlcind of surface preparation is best under what conditions?
(2) Should a bonding grout be used under all conditions?
(3) Does the vibration level or the placement technique play a role in the development of bond between the two concretes?
( 4) What is the optimum temperature at which to place an overlay?
1
(5) Does the moisture level on the pavement effect the development of bond at the interface?
(6) Does the strength of concrete have an effect on the development of bond?
(7) Does the density of concrete have an effect on the development of bond?
Designs of Overlays on CRCP
The most challenging job of the responsible highway official is to keep the highways open with minimum traffic interruptions. However, when the distress level on the highway becomes unacceptable, it has to be repaired The distresses may be of many typeS, depending on their pattern and the way in which they effect the performance of the highways. Traffic delay costs rise due to the frequent closing of the highways, for maintenance and, since the nation's economy depends heavily on the efficiency of the highway systems, they must be designed and built so that they require the least possible maintenance.
There are many ways in which a highway can be made serviceable again. These methods include grinding the pavement, repairing cracks of severely distressed sections, partial depth repairing, full depth repairing, resurfacing with overlays, and replacing the old pavement with a new one.
The highway maintenance official should allocate resources to the most distressed and necessary part of the pavement. An economic evaluation of the pavement system should assist in allocating the priorities for pavement rehabilitation.
· While there are many typeS of resurfacings available today. this report deals with resurfacing of CRCP with CRCP. There are basically three typeS of overlay designs (Ref 4):
(1) unbonded or separated overlays, (2) partially bonded or direct overlays, and (3) bonded or monolithic overlays.
Unbonded or Separated Overlays. Essentially. constructing an unbonded or separated overlay involves keeping the old and the new concrete separate. It is designed to prevent reflection crackings to appear on the new surface. The separation between the two is achieved by laying polythene sheets on the old pavement or by placing an asphalt sand layer on the old pavement before placing the overlay. Since the old pavement and the new overlay act separately, the new overlay design requires a thick concrete layer. Sometimes the new overlay may be equal to or greater than the old pavement in thickness. This type of resurfacing is very expensive because of the thick design of the overlay and also because of the need to provide an additional layer between the old pavement and the new overlay.

2
Partially Bonded or Direct OreriiJy. A partially bonded overlay is placed on the old pavement directly, after cleaning off excessive oil, dust or joint sealants. No surface preparation is required in this type of overlay design. The bond between the new and old pavement is considered to be partial. Therefore, the old pavement structural capacity is partially used to carry the traffic load. The overlay design and construction are nonnally less involved than for onbonded overlay. Some reflection cracking will appear on the new surface after construction.
Bonded or MonoUthk OreriiJy. In this type of overlay design, the old and the new pavement structural capacities are used to take the traffic load; therefore they are designed to act as one unit. Since the old and the new pavements act monolithically, the overlay design is considerably less thick than the other types of overlays. The surface of the old pavement is scarified using rotomilling or shotblasting. The unsound concrete, dirt and oil are completely removed before overlay placement. This ensures that the two concretes will bond completely. To ensure a proper bond, a cement grout is applied to the scarified surface. This method of overlay construction is very efficient in terms of design because it assumes the old pavement to act monolithically with the new concrete and they take the traffic load together .. Because of the relatively thin design of the overlay and a good surface preparation, the concrete paving operation is extremely fast and economical.
Experience at the CeniiJr for Transportation Research
During the past several years several research studies were undertaken at CfR to address the several questions on the validity and usefulness of adopting CRCP overlays for highway pavement rehabilitation. Tests were made on laboratory specimens and cores from constructed slabs in the field A major finding of this research (Ref 3) was that the interface between existing slab and the overlay develops shear strength three to four times the theoretically predicted shear stress under traffic. The study also concluded that using a dry surface with grout gives a lower bond than a dry surface without grout but htata higher interface bond results when grout is used on a wet surface.
Based on previous research, the State Department of Highways and Public Transportation (SDHP'I) decided to overlay the pavement on a portion of lli-610 in Houston. Several sections of this pavement were identified and are being monitored to gather performance information periodically. The analysis carried out with this data will answer questions about the relative merits of different overlay materials and techniques being used today.
OBJECTIVE OF THE STUDY
The objective of this study was to evaluate the effect of construction variables on the development of bond between
a CRCP overlay placed over an old CRCP. The purpose was to determine the circumstances under which a particular variable helps or hinders the development of an effective bond. In addition, different texture evaluation and bond evaluation devices were studied and compared
The main study comprised a pilot study and a field study. The pilot study included evaluation of texture and bond using different devices and finding the best device for the field evaluation. It also included fmding two appropriate vibration levels for the field study. The field study consists of the following variables:
( 1) surface preparation, (2) vibration level, (3) moisture level, (4) grout condition (with and without), (5) location of the cores, and (6) seasonal variations.
SCOPE OF THE STUDY
For the pilot study, a 3-foot x 3-foot x 4-inch slab was cast in the lab to study the different texture evaluation devices. The slab was then cut into four 1.5-foot x 1.5-foot x 4-inch slabs to evaluate the effect of vibration level on the bond in direct shear and tension bond pull out.
For the field study, sixteen 5-foot x 12-foot x 4-inch slabs were cast under winter conditions on an exit ramp of SH-225 at IH-610. Variables were applied on the surface after surface preparation by rotomilling and shotblasting. Two cores were taken at the age of seven days from the corners, sides and the interior of each slab. These cores were tested for direct shear, tensile strength of the overlay con~ crete, and the density of the overlay concrete. Another slab will be cast for the summer conditions to compare the performance of the overlay with seasonal variations.
SCOPE OF THE REPORT
A review of the various construction variables is given in Chapter 2. Chapter 3 describes various texture measurement and bond evaluation devices. Development of the experimental program is described in Chapter 4. Chapter 5 describes the construction of slabs for the pilot study, evaluation of texture measurement methods, coring, and evaluation of bond measurement devices. Chapter 6 describes the field study including construction of test slabs, coring, and testing. A discussion of the results for the pilot study and the field study is given in Chapter 7. Chapter 8 includes conclusions and recommendations of the report

CHAPTER 2. REVIEW OF CONSTRUCTION VARIABLES
The purpose of this chapter is to provide a general overview of the variables associated with the construction of bonded overlays on concrete pavements. The variables play an important role in the development of bond between the new and old concrete. The recognition of these variables will help in better understanding the behavior of bonded pavements and thus help in developing a more logical design and construction practice.
The construction variables associated with the thin bonded concrete overlay placement operation may be broadly categorized as
( 1) surface preparation methods, (2) surface conditions, and
(3) seasonal variations.
These variables play a major role in the development of good bond at the interface between the old pavement and the new overlay. The interaction of two or more of these variables is also very important and is studied very carefully in this report. The use of interactions will help in deciding which factors interact to a significant degree to affect the development of interface bond and which do not. When the significant factors and their interactions are found, they can be appropriately used in the field for a more economical and reliable overlay placement. When one factor is fixed in the field due to economic or environmental considerations, the interaction of other factors will assessed to allow the development of a better bond For example, from a previous CTR study (Ref 3), it was concluded that when a pavement was dry, there is no need to grout a section; when a pavement is wet, grouting will help to obtain a better bond. Thus, interaction terms can help in developing a more reliable design and construction practice.
SURFACE PREPARATION
The process of cleaning and scarifying a surface before an overlay placement is called surface preparation. Proper surface preparation of the old pavement is essential to obtaining an adequate bond between the old concrete and the new overlay. A clean and properly scarified surface will insure that the bond is complete and that the two slabs act as a monolithic slab. It is very important that the slabs act monolithically so that the old concrete contributes to the structural capacity of the pavement If the two concretes cannot act monolithically, they will have to be designed for the existing partial bond condition. The design and construction of a partially bonded or unbonded overlay is complex and expensive.
Before an overlay is placed, all the loose materials, such as debris, grease, oil, road markings, and loose concrete, should be removed from the surface. There are many types of surface preparation methods available. Some of these
3
methods involve washing away the dirt, and others involve cleaning the surface with an acid. Still other methods involve mechanically chipping some part of the top of the old pavement. Most of these methods are adequate for a good surface preparation. However, the best and most economical method of surface preparation depends on the particular pavement condition. While some surfaces require a modest cleaning, others require an extensive and expensive surface preparation operation. The use of a combination of two or more of these methods may result in a more reliable surface preparation. Before a surface preparation method is chosen, the pavement should be studied very carefully for the amount and kind of dirt present and the pavement condition. The depth of carbonation should also be studied carefully. This preliminary study will help in deciding whether a water blasting operation will be sufficient or whether a more involved mechanical scarification is required. The most economical and most effective method should then be selected depending on the pavement condition and the funds available for this operation.
The economic analysis of each of the surface preparation methods is beyond the scope of this study. Further study can be made to determine what level of a particular surface preparation is adequate for a satisfactory bond. The following is a brief description of some of the methods used for surface preparation prior to thin bonded concrete overlay operations.
Acid Etching
Acid etching is a process in which a strong acid is uniformly applied on the pavement. The acid helps in cleaning laitance and other kinds of organic materials that are deposited on the old pavement. The laitance and other kinds of organic materials which remain on the old pavement prevent thedevelopmentof a complete bond between the the new and the old concretes. Acid etching also helps to clean off paint and road markings. After the acid etching process is completed, the entire surface is thoroughly cleaned with water.
The most common acids used for etching are hydrochloric acid (HCL) and muriatic acid- these acids are readily available and relatively inexpensive. This procedure is extremely fast and reliable in cleaning out the dirt from the pavement. However, there are disadvantages, and this system is not recommended. Acid treatment also leads to penetration of the acid to the steel reinforcement in the old concrete, thus leading to rusting and fast deterioration of the steel reinforcement (Ref 5). Also, acids are hard to handle because of their inherent hazardous nature.
Water Blasting
Water blasting cleans the surface by directing high pressure water against the surface. It is most useful for

4
cleaning loose dirt. It is also used in jointed reinforced concrete pavement (JRCP) and jointed concrete pavement (JCP) to remove debris from cracks and joints.
Water blasting is used in many paving operations with considerable success. The surface after water blasting is fairly clean and the water needed for this operation is easily available and inexpensive. The principal disadvantage of this system is that water blasting is inefficient because it carries contaminants to the lower level of the pavement by absorption (Ref 5). When the water evaporates, the contaminants adhere to the pavement In addition, water blasting has only limited applications for actual paving operations because of its inability to remove paint and road markings completely.
Air Bklsting
Air blasting is very simple and can be used on projects where minimal cleaning is required and where the dirt is loose. If the old concrete is sound and there is no carbonation penetration, air blasting may be the only surface preparation required. Air blasting is usually used in combination with other surface preparation methods. It is usually the last operation to be done before an overlay placement After a sand blasting operation, air blasting helps in removing the sand that is left on the pavement
Air blasting is a fast and economical method for cleaning loose materials from a surface. The principal disadvantage of this method is that it is not able to remove most typeS
of paint, oil, and grease from the pavement. However, where conditions warrant, it may be the most economical and fastest option for cleaning a surface for a bonded overlay placement
Sand Bklsting
Sand blasting uses high pressure air to force sand particles against the surface. The sand particles may vary in size depending on the type of surface and the required level of scarification. The sand particles, striking the surface at high speeds, loosen the oil, grease, paint, and the grout matrix around the aggregate. The surface obtained from this operation is highly scarified. There may be some loose debris and sand left behind on the sur-face. This can be easily cleaned by air blasting the surface. The concentration of blasting of particles malc:es it difficult to scarify a large area unifonnly. However, an experienced sand blaster can do a fairly good job of obtaining a unifonnly scarified surface.
Sand blasting has been successfully used in many applications including overlay placement operations. The bond obtained by this kind of scarification is lower than that by other mechanical methods of scarification, such as shot
blasting and rotomilling. This is because the surface obtained from sand blasting has rounded projections, where as rotomilling and shotblasting give more pointed projections, and rounded projections do not bond as well as the pointed projections. A disadvantage of this system is that a lot of airborne dust is generated during this operation. This dust is hazardous to the nearby traffic and may violate air pollution regulations. Also, as discussed before, it is very difficult to obtain a unifonn scarification by this method.
Shot Blasting
Shot blasting is a relatively new and popular method of surface scarification. The principle involved in this operation is basically the same as that of sand blasting. The difference is that shot blasting uses tiny steel balls instead of sand particles to scarify the surface. The steel balls or pellets strike the surface at an angle and chip away a small amount of the surface concrete on impact The steel pellets rebound after impact and are collected along with the dust The dust and steel pellets are separated; the dust is deposited in a bag, and the steel pellets go back into circulation (Ref 6). Usually aU of the steel pellets are recovered in nonnal shot blasting operations, thus making it an efficient operation in tenns of material recovery and recycling.
The surface obtained by this method is highly scarified, very clean, and unifonn. No further cleaning is required, and so the surface is ready for overlay placement. An overlay placement can closely follow a shotblasting operation, thus making the overlay placement extremely fast and efficient. The level of scarification can be easily varied by varying the speed of the blaster: the slower the speed of the blaster, the more the scarification. A shot blasting operation removes the matrix around the aggregates, thus exposing them for efficient interlocking at the interface. The interlocking mechanism provided with this system helps in developing high interface bond.
Shot blasting is a very practical and efficient method of surface preparation. The principal advantages of this system are unifonn scarification, speed, quality, and the different levels of scarification possible. Figure 2.1 shows a shot blasting operation in progress.
Fig 2.1. A shot bklsting operation in progress.

•
The specifications governing the shot blasting operation are very rigid in order to ensure a good bond. It is recommended that the overlay placement should be done the same day or at the latest by the following day after a shot blasting operation (Ref 6).
Care should be taken to make sure that the comers and sides of the pavement are cleaned. If it is not possible to clean them with a shot blaster, the surface can be scarified using sand blasting. The level of scarification in terms of roughness obtained by sand blasting should be about the same as that by shot blasting (Ref 6).
Rotomilling
Rotomilling is one of the oldest methods of surface scarification widely used for overlay placement It has been extensively used on bridge decks. It has also been used to increase the skid resistance of the old pavement
Rotomilling scarification is done by a rotating drum with mounted steel studs that is pressed against the surface. These steel studs abrade the surface, forming grooves. The loose concrete is loaded on a hopper. The rotomill uses water to prevent undue wear on the drum and the steel studs.
The level of scarification can be varied, depending on the requirement of the operation. A rotomill scarification is completed in two or more passes of the rotomill on the same surface. The rotomilling operation can take away up to 5 inches of the top layer of the pavement in one pass.
As in shot blasting, rotomilling is the last operation before an overlay placement. Light sand blasting of the rotomilled section helps to remove loose and fractured concrete and also debris and dust left behind by the rotomill.
Rotomilling is one of the fastest and most effective methods for surface preparation. It is very economical and gives a highly scarified surface that is good for the development of bond between the old pavement and the new overlay. Figure 2.2 shows a typical rotomilling operation in progress.
SURF ACE CONDITIONS
Proper surface conditions should be present for an effective bond to occur between the old pavement and the
Fig 2.2. A typical rotomilling operation in progress.
5
overlay. The surface may be properly textured and clean, but, if the right combination of surface conditions is not present, the bond may not be adequate. This section deals with the various surface conditions that are present and their effects on the bond. The following surface conditions are studied in this experimental program:
(1) grout conditions, (2) moisture levels, and
(3) vibration levels.
These conditions exist in almost all paving projects. A combination of two or more of these conditions that will give a better bond wil be found by interaction study.
Grout Conditions
The purpose of the grout in the past has been to bond the overlay with the old pavement It has been assumed that the grout acts as a bonding agent and helps in increasing the interface bond. Some recent studies have shown that grouting a pavement does not necessarily increase the bond between the old and the new concrete. In fact, grouting in some cases gives a lower bond than not grouting (Ref 3).
If an adequate bond can be obtained without a bonding agent, such as the grout, thousands of dollars can be saved in grouting costs and the paving operation can be much faster. For this reason, the study of grout condition is very important. Understanding the interaction of grout condition with moisture level, vibration level, and surface preparation will be a very useful. There are basically two types of grout conditions:
(1) grouted surface and
(2) non-grouted surface.
A grout for bonding the two concretes can be obtained by mixing water with portland cement so that the mix is plastic enough to be sprayed by a grout sprayer.
The overlay should be placed as soon as the grout is applied. The grout should not be allowed to dry. If the grout is allowed to dry, the bonding capacity of the overlay will be considerably reduced and the pavement system will not function as it was designed.
Moisture Conditions
Normal overlay placement is done when the pavement is completely dry and there is no water present on the surface. However, in some cases, the overlay has to be placed when the pavement is stilI wet There is some reluctance on the part of the agencies to delay a paving operation until a pavement is completely dry. One of the questions that this study aims to answer is whether it is safe to place an overlay on a wet pavement.
Previous research performed on this subject by the CTR (Ref 3) showed that moisture condition on the surface greatly affects the bond between the pavement and the overlay. The study showed that placing an overlay on a wet

6
surface reduces the bond capacity of the interface. However, if the wet surface is grouted before an overlay placement, there is an increase in the bond capacity at the interface.
In practice, a wet surface is caused by rain. The field study will attempt to obtain a wet surface by sprinkling water over the surface and pennitting it to soak for some time.
The study of the interaction of moisture condition with grout condition, vibration level, and surface preparation will help in understanding the effects of moisture condition on the bonding at the interface. If they are significant, they can be investigated further to see if they increase or decreases the bond.
While many levels of moisture are possible on the pavement, this study deals with two extreme conditions, i.e., wet and dry:
(1) wet is the condition of the pavement just after rain, without standing water; and
(2) dry is the condition in which the surface is completely dry, achieved when there has been some dry, sunny weather.
Vibration Levels
Proper consolidation of the concrete is the fundamental principle of any concrete paving operation. If a pavement is poorly consolidated, there is an increased chance of honey-combing and thus reduced bond at the interface. Many
appropriate vibration level when other conditions are present. Figure 2.3 shows some of the different types of vibrators used in paving operation (Refs 8 and 9).
SEASONAL VARIATIONS
Detennining the effects of seasonal variation on the bonding of overlays with portland cement concrete (PCC) pavements is an important part of this study. Seasons are known to affect the properties of concrete: thus it is expected that they will also affect the bonding between the overlay
(a) Slipformpaver(Ref9).
(b) Pencil type vibrators (Ref 10). types of vibrators are used for consolidation of the pavement concrete. The type used should be approved by the agency. Usually because of the stiff nature of
Fig 2.3. Illustration of several types of vibration systems used in PCC paving operations.
concrete, high frequency pencil type or heavy duty pan type vibrators are specified for paving operations (Ref 7 and 8).
A difference in vibration level leads to variation in consolidation of the concrete which leads to variable density of the concrete. Usually proper consolidation of concrete is checked by fmding the specific gravity and density of the concrete. Therefore, a density test should be specified as a quality control measure to ensure proper consolidation. Proper vibration is very important: while under-vibrating concrete will lead to honey-combing as discussed above, over-vibrating will cause the aggregate and the cement grout to segregate, which leads to a lower quality concrete. It is also important that the concrete be unifonnly vibrated. An important point to remember is that vibrators should be used only for consolidation of concrete and not for spreading or leveling (Ref 8).
Again, determining interaction of vibration level with grout condition, moisture condition, and surface preparation is important The results will lead to the selection of the most
and the pavement Also, because of the changes in the temperature cycles and soil properties with the seasons, the warping and curling response of the pavement is changed. Thus, it is important to know how one season affects the interface bond and whether one season is better than the other for overlay placement in tenns of the interface bond.
Due to its unique characteristics, each season demands a unique mix design. This study uses the same concrete mix design so that bond development can be compared for various seasons. Due to cost constraints only two seasons will be considered. This will also reduce the number of variables. The design and execution of the field study is therefore simplified. The two seasons considered are winter and summer.
Winter
Winter is characterized by low temperatures. During this season, the subgrade modulus is high. The higher modulus provides better support for the overlaying pave-

ment Therefore, the structural capacity of the pavement is high. A lot of cracks open up in the pavement due to shrinkage. The temperature cycles are not large. The mix design has to be specially designed for this condition. Since the mix is cold and stiff, plasticizers are added to obtain better workability of the concrete.
One of the purposes of this study is to place an overlay in winter and evaluate different interactions to fmd the best conditions for winter season.
Summer
Summer is characterized by high temperatures and high humidity and a dry in terms of rainfall. The structural capacity of the pavement is high because of the dry subgrade. There is a large variation in the temperature cycles. The nights have relatively low temperatures and the days often
7
have high temperatures. The concrete mix design has to be specially designed for the hot weather. Some times ice is added to the mix to cool it
Another study will be made to compare the bond with winter conditions and find out if the bond development is higher or lower in summer. As for the winter conditions, an evaluation of the interaction terms is important
SUMMARY
A brief review of surface preparation techniques, including acid etching, water blasting, air blasting, sand blasting, shot blasting, and rotomilling is presented. Also, various surface conditions, including grout conditions, moisture levels, and vibration levels, are described, and seasonal variations are briefly discussed.
CHAPTER 3. TEXTURE AND BOND EVALUATION METHODS
This chapter describes the different methods for the evaluation of pavement texture and the interface bond between the old and the new concrete.
Evaluation of texture and bond is an important aspect of overlay design. The texture or bond strength given by one piece of equipment or method can be different from that by another kind of equipment or method. An equipment or method that gives consistent results is acceptable. However, economics, time required for obtaining readings, and repeatability of the method should be given prime consideration.
TEXTURE EVALUATION DEVICES
Texture evaluation of an old pavement is an important and should be done before an overlay placement. Such a study shows the type of texture, whether pointed or rounded, and the extent. There are many methods by which texture evaluation can be done. The purpose of this study is to evaluate some of the methods. The following methods are considered in this study:
(1) sand patch method (Ref 10), (2) Text-Ur-Meter (Ref 11), and (3) Texture Profile Recorder (Ref 12).
The following is a brief description of each of the texture evaluation methods considered in this study.
Sand Patch Method
The sand patch method is given in ASTM E965-83, "Standard Test Method for Measuring Surface Macro Texture Depth Using a Sand Volumetric Technique." This method gives an average depth of the pavement surface macrotexture, and has been widely used in many paving projects to determine the texture of the pavement.
Theory. When a known amount of sand is spread on the surface, the fine sand particles fill up the matrix between the aggregates. The amount of sand required to fill up the matrix gives an estimate of the roughness of the surface: the rougher the surface, the more sand required to fill up the matrix. The average macrotexture depth of a surface is given by
MA'fXd 4V
= (3.1) 7tD2
where
MATXd = average surface macro-texture depth;
v = sand sample volume, inches3 (mm3
); and a
8
D = average sand patch diameter, inches (mm).
Procedure. The proper procedure involves the following steps:
(1) Select a homogeneous, dry surface area on the pavement
(2) Clean the surface with a stiff brush thoroughly. (3) Fill the cylinder of known volume with sand and
pour on the surface.
V=
where
v =
7tn2 X h
4
volume of sand, inches3 (mm3);
(3.2)
D = inside diameter of the cylinder, inches (mm);and
h = height of cylinder, inches (mm).
( 4) With the help of a sand spreader, spread the sand in a circle.
(5) When the sand spreads no further, measure the diameter of the circle at four places.
(6) Find the average macrotexture depth by Eq l. (7) RepeatSteps 1 through6forfurthermeasurements.
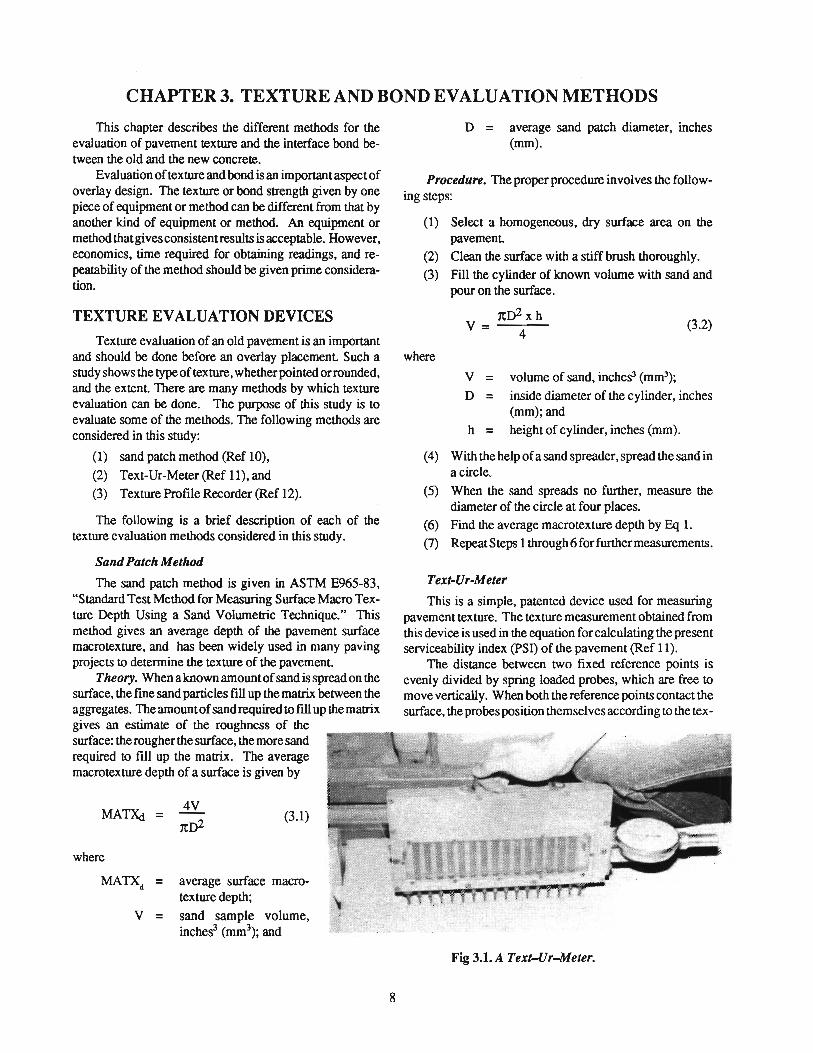
Text-Ur-Meter
This is a simple, patented device used for measuring pavement texture. The texture measurement obtained from this device is used in the equation for calculating the present serviceability index (PSI) of the pavement (Ref 11 ).
The distance between two fixed reference points is evenly divided by spring loaded probes, which are free to move vertically. When both the reference points contact the surface, the probes position themselves according to the tex-
Fig 3.1. A Text--Ur-Meter.

ture of the pavement. This positioning of the probes deflect a cord from its straight zero position and the dial indicator shows the additional length of cord needed because of the texture. Figure 3.1 shows a Text-Ur-Meter.
Theory. The texture of the surface between two points at a known distance is given by the length of cord in excess of the distance between the two points necessary for the cord to follow the surface.
The texture of the surface is given by
where
~L AVTX-- N
AVTX = average texture, inches (mm);
(3.3)
AL
N = =
excess length of cord, inches (mm); and
number of probes.
Procedure. The proper procedure involves the following steps:
(1) Select a homogeneous surface on the pavement
(2) Calibrate the equipment by obtaining a zero dial reading on a smooth surface.
(3) Position the two fixed points in a selected direction. Drawing a line in the direction of positioning of the equipmenteasesrepetitionsandassuresrepetitions on the same line.
(4) Press the equipment against the surface until the two fixed reference points touch the pavement.
(5) Note the dial reading and release the instrument
(6) Repeat Steps 1 through 5 for repetitions.
Texture Profile Recorder
This instrument was developed by the Texas State Department of Highways and Public Transportation. The
9
instrument records a magnified profile of a pavement on a pressure sensitive graph. The peaks and valleys are counted and the roughness of the pavement is then found. Figure 3.2 is a Texture Profile Recorder.
Theory. When a feeler needle moves along a line on a pavement surface, its movements are recorded on a pressure sensitive graph paper. The counter reading on the instrument gives a measure of cumulative vertical movements. This counter reading can be transformed into an accumulated peak height (APR). Visually, from the graph, number of peaks can be counted (a peak is arbitrarily defined as any magnified asperity with a minimum height of l/16-inch and maximum base length of 1/4-inch or any multiple set of these dimensions). The average peak height of the pavement is given by dividing the accumulative peak heights by the number of peaks.
Procedure. The proper procedure involves the following steps:
( 1) Place the Texture Profile Recorder on the surface. The pressure sensitive graph paper is placed in position.
(2) Release the loaded stylus so that it touches the graph paper.
(3) Zero the counter reading.
(4) The stylus-feeler assembly is moved either manually or by electric motor across the surface. The profile is recorded on the graph paper when the assembly moves along the surface.
(5) Record the counter reading and note it on the graph paper.
(6) Count the number of peaks and note that on the graph paper also.
(7) Calculate accumulated peak heights by dividing the counted reading by 29.
(8) Calculate the average peak height by dividing the accumulated peak height by the number of peaks.
BOND EVALUATION DEVICES
Bond evaluation was a very important partofthisstudy, for determining the effect of construction variables on the bond between the old and the new concrete. It is very important to get an adequate bond between the two pavements. If the bond is not adequate, the pavement system will deteriorate very fast.
Fig 3.2. A Texture Profile Recorder (Ref 12).
Bond at the interface between the old and the new pavement can be measured as the shear force devel-

10
oped at the interface or as the tension (pull-out strength) developed at the interface. In this study the following tests for the evaluation of bond were used.
Direct Shear Test
If the shear strength of the interface between the two concretes is greater than the stress developed due to traffic conditions, the overlay system is adequate. However, if the stress developed due to traffic conditions is higher than the stress capacity of the interface, the overlay system will fail and the two concretes will not act monolithically as assumed in the design. Thus, the basic design assumption of a bonded concrete overlay system will be violated. For this reason, it is very important that the old and the new concrete bond together.
The shear strengths of the cores from the pilot study and the field study were evaluated using a direct shear test Figure 3.3 shows a drawing of the test apparatus. The instrument consists of two steel plates, 3/4-inch each of which is welded to a semi-circular pipe (4-inch inside diameter, 1/2-inch-thick plate). The specimen is placed in the instrument and the bolts are tightened. The load is applied at the interface to apply direct shear.
16" 9"
6"
)-7/16" q,Bol~ r· 6"
1.5" f .. 3.5" ..
(a) Plan view.
/ Welded Pipe
/ ~ Stiffeners
-11 ..... : :-...... :"""'i-~1 c=., :f~ f..t+---6--.---..-loj ~7116" ~-
16"
(b) Front view.
Fig 3.3. Plan and front views of the direct shear testing device.
Procedure. The proper procedure involves the following steps:
(1) Clamp the instrument to the loading machine by means of C clamps.
(2) Load the specimen and tighten the bolts with uniform tension. Be sure that the interface is exactly at the clamp ends.
(3) Apply the load at the interface until the specimen breaks.
(4) Record the load reading and calculate the bond strength at the interface by the following formula:
where
S =PIA s (3.4)
S = shear stress at the interface in psi (kg/mm2 ),
s P = load at failure in pound (kg), and
A = cross-sectional area at the interface, inch2
(mm2 ).
Bond Pull~ut Test
The other method for evaluating the adhesion of the pavement to the new concrete is the ACI bond pull-out test (Ref 13). This test has been widely and successfully used in a variety of bonding conditions. The pull-out test measures the tension that the drilled core disc can withstand, as a measure of adhesion of the two surfaces. A brief description of the ACI procedure for bond pull-out test is given below.
Procedure. The proper procedure involves the following steps:
(1) Thoroughly clean the portion of the area to which the epoxy compound is to be applied thoroughly .
(2) Mix epoxy materials and apply a test patch using the epoxy compound.
(3) Mter the test patch hardens, core drill through the overlay and into the base slab with a 2-inch core drill.
(4) Bond a standard 1.5 -inch pipe cap, the bottom of which has been machined, to the core disc using a rapid-curing epoxy.
(5) Mter bonding the pipe cap to the core disc, test the core by applying tension to it using a testing device similar to the one shown in Fig 3.4. To prepare the testing device, screw the lower hook into the threaded pipe cap and attach to the hook on the lower portion of a Dillon Dynamometer. Screw the upper hook, which has a threaded shaft, into the loading arm at the top of the rig, and attach to the loop on the upper portion of the dynamometer.
Rotate the loading arm so that the threaded shaft and its connections are lifted, placing the pipe cap in tension.

Fig 3.4. A typical bond pull-out testing device (Ref 13).
11
Record the load at which the pipe cap and the connected core are separated from the base slab.
The unit stress is given by the following formula:
T = F/A s (3.5)
where
T5
= tensile stress, psi (kg/mm2),
F = pull-out force pound (kg), and
A = area of the core disc, inch2 (mm2 ).
SUMMARY
This chapter gives an overview of texture evaluation methods including sand patch method, Text-Ur-Meter, and Texture Profile Recorder. Bond evaluation devices, including direct-shear test and pull-out test, are discussed.

CHAPTER 4. DEVELOPMENT OF THE EXPERIMENTAL PROGRAM
This chapter describes the development of the experimental program, including the factorial design, pilot study, and field study. The aim of the experimental program was to select the most important construction variables out of the many existing in the field. These variables were assigned to one of the two major levels of study,
(1) pilot study and (2) field study.
Using these two levels of study made it possible to study fewer variables at one time and then to apply the selected variables to the next level of study.
Generally, thefli'Ststepin the development of an experimental program is defining and identifying the problem. After the problem is defmed, the program is usually divided into a pilot study and a field study. The pilot study is a preliminary study to support the field study. The field study is the main study. A list of objectives is made for each study, and a factorial is designed for each study.
PROBLEM DEFINITION AND IDENTIFICATION
A bonded concrete overlay is used in order to obtain a complete bond between the new concrete and the old pavement so that the whole pavement system acts like a monolothic slab, and, the structural capacity of the old pavement can be used in the design to build an economical pavement system. However, there have been some debonding problems with bonded concrete overlay in the Houston area. The fact that some areas bonded and others debonded when the same mix design was used, led to the decision that the level of bonding between the pavement and the overlay is due to construction variables.
The major construction variables considered in this study were
(1) season, (2) surface preparation, (3) vibmtion level, (4) moisture condition, (5) use of grout, and (6) location of cores.
In addition, there appeared to be a need to evaluate some of the texture and bond evaluation techniques that are presently used in the field.
PILOT STUDY
The main purpose of the pilot study was to evaluate the factors that could not be evaluated in the field and also to reduce the number of variables in the field study. The variables evaluated in the pilot study were
12
(1) texture evaluation devices -(a) Sand Patch Method, (b) Text-Ur-Meter, and (c) Texture Proflle Recorder;
(2) bond evaluation devices -(a) direct shear and (b) bond pull-out test;
(3) vibmtion levels(a) nil, (b) low, (c) medium, and (d) high; and
(4) locations of cores(a) comer and (b) middle orinterior.
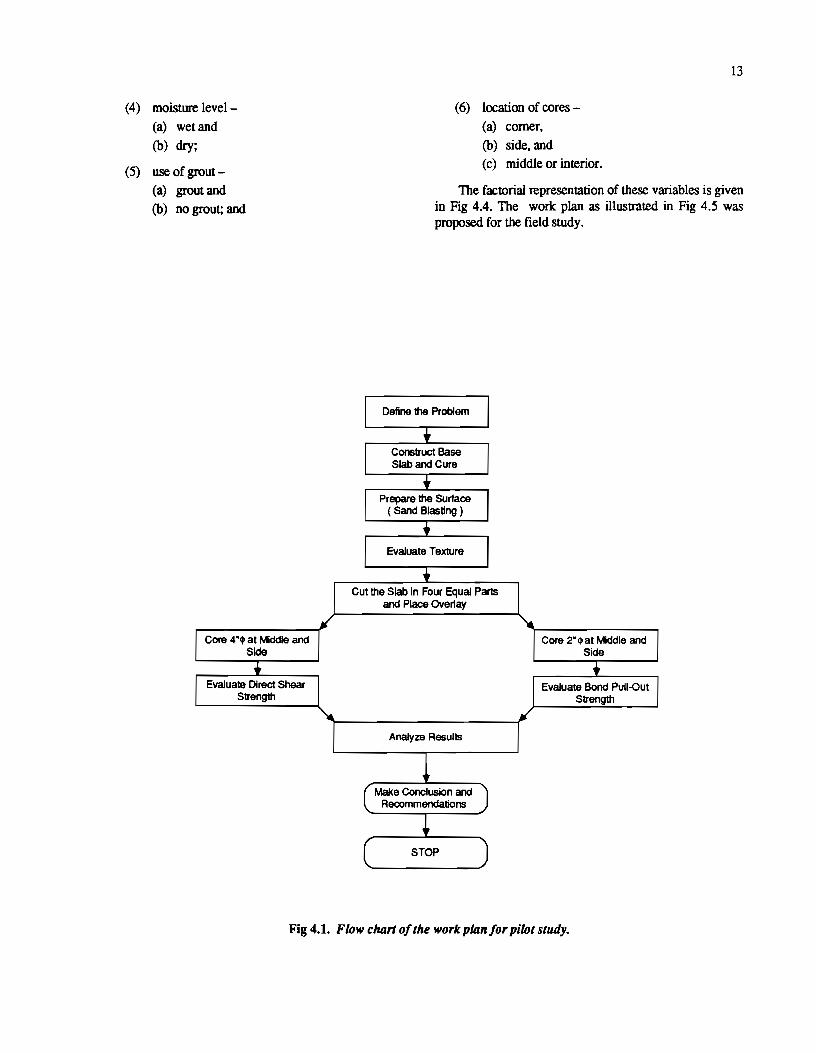
The work plan for the pilot study is illustrated by the flow chart in Fig 4.1.
A factorial design for the pilot study was made from the selection of variables and the flow chart in Fig 4.1. The factorial design for the pilot study is given in Fig 4.2.
An analysis of variation (ANOV A) was done to select the best texture evaluation device and two vibmtion levels were selected for the field study from the four that were being studied. The selection of the texture measurement device depended on the cost analysis, time, and repeatability of the measurements.
FIELD STUDY
The purpose of the field study was to determine the effects of construction variables on an actual PCC bonded overlay operation. For this study, an actual overlay was placed. The field study was proposed for and done on SH 225 Houston. The location of the field study is given in Fig 4.3.
The following variables were planned for the field study:
(1) seasons -(a) winter and (b) summer;
(2) surface preparation (a) rotomill and (b) shot blast;
(3) vibmtion level -(a) high and (b) low;
(4) moisture level
(a) wetand (b) dry;
(5) use of grout
(a) grout and (b) no grout; and
(6) location of cores -
(a) corner, (b) side, and (c) middle or interior.
13
The factorial representation of these variables is given in Fig 4.4. The work plan as illustrated in Fig 4.5 was proposed for the field study.
Cut the Slab In Four Equal Parts and Place Overlay
Analyze Results
Fig 4.1. Flow chart of the work plan for pilot study.

14
METHOD OF TEXTURE EVALUATION
Sand Patch X
Text-Ur-Meter X
Texture Profile X Recorder
(a) Factorial design for texture evalwtion.
M =Middle C = Center
DIRECT BOND SHEAR PULLOUT
M c M c
ZERO X X X X
LOW X X
MEDIUM X X
HIGH X X
(b) F actorilll design for vibration level and locadon.
Fig. 4.2
Fig 4.3. Locadon ofthef~ld study in Houston.

Rotomill Shotblast
tza Low Vibration
~ High Vibration
• Grout
X No Grout
Find Bond Strength
Fig 4.4. Factorial design for the fteld study.
Define Problem
Design the Forms
Prepare Surface
Apply Surface Conditions
Place and Cure Concrete
Cora At Middle, Side and Corner
Find Density
Make Statistical Analysis
Make Conclusions and Recommendations
Stop
Find Tensile Strength
Fig 4.5. Flow clt.an for the work plan for pilot study.
15

CHAPTER 5. PILOT STUDY PROGRAM
This chapter describes the pilot study. The selection and application of variables is extended and the program is described in detail. The work plan in Fig 4.1 was followed and the study was carried out in the Civil Engineering Laboratory at The University of Texas at Austin.
CONSTRUCTION OF SLAB
A 3-foot x 3-foot x 4-inch base slab was constructed with a concrete mix design consisting of 5 sacks of cement/cubic yard and a 5/8-inch maximum aggregate size. Air content was 5 percent and the water-cement ratio was 0.4.
The concrete was mixed in the laboratory using a 3-cubic-feet-capacity concrete mixer. After the concrete was thoroughly mixed and placed, it was immediately vibrated with a pencil type vibrator at 2,000 vibrations per minute. The concrete
LINE NO.1
12"
LINE NO.2
12"
LINE NO.3
3ft
was covered with wet burlap, left to cure in the laboratory for 24 hours, and moved to the moisture room for
Fig S.l. Plan view of the base slab with the lines drawn on the slab for texture evaluation.
further curing. The slab was taken out of the moisture room at seven days and left to dry naturally.
SURFACE PREPARATION
After the slab was dried, the surface was prepared by uniformly sand blasting it Then the surface was cleaned with a stiff broom to remove the loose concrete and slab debris from the surface.
TEXTURE EVALUATION
After the surface preparation, three lines were drawn on the slab for texture evaluation, as shown in Fig 5.1. A plan had been developed for measuring the texture with the different texture evaluation devices and evaluating them on the basis of reliability of the measurements, cost and time per measurement, and repeatability of the measurements. Figure 5.2 shows the work plan for the evaluation of texture measurement devices.
Sand Patch Method.
The sand patch method was used as described in Chapter 3. The sand patch readings were takenat two locations along each line where readings were taken at each location,
16
one reading immediately after the other, as soon as the sand used in the previous reading was cleaned off with a stiff brush. The test was then performed at another location, with three readings taken, before moving to another location. The complete data for the sand patch test are given in Appendix A (Table A.1).
Observations.
(1) Considerable time was required to set up and spread the sand, measure diameters, and calculate the texture.
(2) Very consistent results were obtained.
(3) This method is three-dimensional, as compared to the other methods, which are two-dimensional.
Sources of E"or.
(1) Sand is difficult to use in presence of the high winds.
(2) The sand may not have been spread fully.
(3) It is difficult to make a perfect circle of sand; however, to minimize the error, diameter is taken as the average of four measurements.

Sand Patch Method
StalislicaJ and Economic Analysis
Stop
Texture Profile Recorder
Fig 5.2. Illustration of the flow chortfor the work plan for the evaluation of texture measurement devices.
Text-Ur-Meter
Three locations along each line on the base slab were selected. One reading was taken at one location, and the meter was moved to the second and third locations. This was repeated until three readings were taken on each location along the line. The the meter was moved to the next line for further readings. The complete data for the texture meter are given in Appendix A (Table A.2).
Observations.
(1) This method is extremely fast (2) The compact size allows for easy transportation of
the equipment (3) Consistent readings are obtained.
Sources of Error. If the force which the meter is pressed is variable, the dial readings may be different.
Texture Profile Recorder
Each line on the base slab represented one location. The Texture Proftle Recorder was run on the line three times
17
before being moved to another location. This was done in order to make sure the same proftle was recorded on the graph paper. The complete data for texture profile recorder are given in Appendix A, Table A.3.
Observations.
(1) The counter readings were consistent (2) Speed and accuracy carLbe increased if the device
is run with an electric motor. (3) Results are not instantaneous. The graph has to be
carried to the lab and the number of peaks marked before texture can be found.
Sources of Error.
(1) Number of peaks obtained may be operator dependent.
(2) Sometimes the needle or the counter does not respond to a small peak.
OVERLAY PLACEMENT
After the texture measurements on the base slab were taken, the 3-foot x 3-foot x 4-inch slab was cut in four equal parts of 1.5 foot x 1.5 foot x 4 inch. The overlay concrete mix design consisted of 7 sacks of cement/cubic yard and 5/8-inch maximum aggregate size. The air content was 5 percent and the water-cement ratio was 0.4.
VIBRATION LEVELS
Four vibration levels were used. Table 5.1 gives the vibration categories and a description of the vibration
level used for each slab.
CORING PROGRAM
Cores were taken at the corner and middle of each slab. Figure 5.3 shows the core locations for a typical slab for the
TABLE 5.1. VIBRATION LEVELS USED FOR THE PIWT STUDY SLABS
Vibration Description of
Slab Level Vibration Level
1
2
3
4
Zero Zero
Low 8.0 cubic feet/minute
Medium 2.0 cubic feet/minute
High 0.5 cubic feet/minute

18
1'-6"
0 2" Core
0 4"Core
c
1'-6"
Fig 5.3. Typical siJJb for pilot study wilh core locations.
pilot study. The coring was done using 4-inch anti 2-inch-diameter core barrels. The 4-inch cores were used for direct shear test and the 2-inch cores were used for the pull-out test The results of the shear and density tests are giveninAppendixA(TableA.4). Theresultsofthepull-out test are given in Appendix A (Table A.5).
TESTING PROGRAM
Direct Shear
The 4-inch cores were drilled all the way through the 6-inch slab which included thed overlay and the base slab.
These cores were then tested for direct shear as described in Chapter 3. The data for this test is given in Appendix A (Table A.4).
Density
After the direct shear tests, the specific gravities of the specimens were found according to ASTM C641-81 (Ref 14 ). The densities of the cores was found from the following relationship:
Density = 62.4 x Specific gravity (pet)
The data for this test result are given in Appendix A (Table A.4).
Bond Pull-Out Strength
The pull-out test required 2-inch cores. The cores were to be drilled just past the interface of the overlay and the base slab, so that a cored disc could be pulled out according to the ACI standards, as described in Chapter 3. It was very difficult to make the cored discs at the corners because, after the drilling was fmished, the core broke at the interfac!'e. Out of a total of eight attempts to core at the comer, only two unbroken cores were obtained. The data for this test are given in Appendix A (Table A.5).

CHAPTER 6. FIELD STUDY
This chapter describes the construction of the test slab for field swdy including surface preparation, form placement. equipment used. application of surface conditions, quality control, coring program, and testing and analysis program.
CONSTRUCTION OF THE TEST SLAB
Surface preparation was the fll'St task in the construction of the slab overlay. Two types of surface preparations were used: rotomilling and shot blasting. After surface preparation, the required surface conditions were met and the concrete was placed After concrete placement, it was fmished and cured.
Surface Preparation
The test slab to be overlaid required two types of surface preparation, as described in the work plan. The following is a description of the construction of the overlay using the two types of surface preparations.
RotomilUng. The rotomilled section of the test slab was overlaid on March 5 and 6, 1987. It consisted of 4 inches of overlay. It was placed on an 8-inch existing pavement on SH-225 at IH-610 in Houston. The rotomilling was performed by District 12. The rotomill was set to remove 1/4 inch to 1/2 inch of existing pavement surface. Figure 6.1 shows the plan view of the rotomilled section of the slab with the surface conditions.
.......... ""'"'!,; :; :; :; :; ~~ e :; e :; 1-~~ :; e :; e
<!) e <!) e )~~ e <!) e <!) 0 <!) 0 <!) ~!"' .... <!) 0 <!) 0 z z ~~"'""' z z ........
:$:$
Dry Wet Wet Dry
4@5'-20' 4@ 5'=20'
High Vibration Trtmsition Low Vibration
Fig 6.1. Surface conditions and -vibration lelJels for rotomill section for fuld study.
After rotomilling, the surface was cleaned meticulously with the help of stiff brooms and a compressor before the overlay was placed. It would have been better if the surface had been vacuumed, because cleaning the surface with the brooms and compressed air was very tedious and ineffective at removing all of the dust. The fme particles from brushing and blowing redeposited themselves on the cleaned surface,
19
and therefore, the surface was cleaned again just before the overlay was placed.
(1) Procedure. The high vibration section was placed on the fll'St day, March 5, 1987, and the low vibration section was placed on March 6, 1987. Since the grout was still being mixed, the overlay was placed on the non-grouted sections frrst. The surface was cleaned again just before overlay placement to make sure it was as clean as possible when concrete was placed on it. The compressor motor burned out during the placement, and the final cleaning was done with a broom. The fine particles collected with the broom were deposited on one side of the forms where coring was not performed. Therefore, if fulllre cores are taken from the dusty half of the sections, the bond strength may be affected.
After the truck arrived, a slump test was performed on the concrete. The slump was 1 to 3/4 inches, which was a little less than the 2 to 3-inch design value. The driver was told to add water and the pouring continued. Test beams and cylinders were also made from the concrete for estimating the quality of the concrete.
The wet surface condition was achieved by spraying enough water on the surface of the pavement to model light to medium rain. The partition forms were caulked in order to prevent water running from the wet sections into the dry sections.
The grout was mixed in a mortar mixer and transported to the section using a wheelbarrow. Grout was applied 1/8-inch thick with the help of stiff brooms. Grout application was uniform over all the sections.
After the grout application, the concrete was poured as in the non-grouted sections. The concrete was then vibrated using 2-inch diameter vibrators. The desired frequency of vibrator was 8000 vibrations/minute. The required vibrator was not available, and a vibrator with 2000 vibrations/ minute was used. The original planned vibration time was multiplied by four, to get the required vibration level equivalent.
The following vibration levels were applied (Ref 8) on the sections:
High vibration: 2 cubic feet/minute
(8000 vibrations/minute),
Actual vibration: 0.5 cubic feet/minute
(2000 vibrations/minute),
Low vibration: 8 cubic feet/minute
(8000 vibrations/minute), and
Actual vibration: 2 cubic feet/minute.
The vibration times for the panels were
Vibration time = Volume/Vibration level

20
High vibration = (5 feet x 4){1.
= 10 minutes/section (8000 vibrations/minute)
Actual time = 10 x 4
= 40 minutes/section
(2000 vibrations/minute)
Low vibration = (5 feet x 4)/8
= 2.5 minutes/section
(8000 vibrations/minute)
Actual time = 2.5 x 4
= 10 minutes/section
(2000 vibrations/minute)
(2) Finishing. After concrete placement, the surface was finished by using a concrete screed which consisted of a mechanical vibrator mounted on top of a 2 x 8 x 16-footlong wood board. After the screeding process, the surface was troweled and broom finished.
(3) Curing. After initial set, water was sprayed on the surface. Polyethylene sheets were then used to cover the wet surface. The sheets were stapled to the sides in order to prevent moisture loss.
ShotBiasdng. The shot blastsectionofthetestslabwas placed on March 12, 1987. It also consisted of a 4-inch overlay on 8 inches of existing pavement on SH-225 at IH-610 in Houston. The shot blasting operation was performed by Humble Equipment Company. Figure 6.2 shows the plan view of the shot blast section of the test slab with the surface conditions.
= N -
Dry Wet
'S 'S 'S 'S e e
<!) <!) e e 0 0 <!) <!) z z
311
High Low Vibration Vibfation
'Deep Shot Blasting
Wet Dry
. 'S
'S 'S
'S 'S 'S e e e e
<!) e <!) e <!) <!) 0 <!) 0 <!) 0 0 z z z z
Low Vibration
(1) Procedure. The high vibration sections were cast first The grout condition, moisture condition, and vibration levels were prepared and executed the same as the test sections on March 5 and 6.
The first mix sections were difficult to work because the bulk of mix remained too stiff even after addition of water. Slump tests were performed on the concrete as for the previous sections, but the initial slump was very low; thereforewaterwasaddedtogeta2-inchslump. Themixbecame stiff again, probably due to inadequate mixing after addition of water.
The grout was mixed in a wheel barrow with the same mix design as in previous test sections.
Vibrators were the same as used in the previous rotomill test sections. The vibrators stopped worlring in the second panel, but they were started again within 4 to 5 minutes. No problems with vibrators occurred after this time. High and low vibration levels were applied as before.
(2) Finishing. Finishing was the same as in previous sections. A vibrating screed was used and the surface was broomed.
(3) Curing. After the initial set, water was sprayed on the concrete surface and covered with polyethylene sheets. The sheets were stapled to the sides in order to prevent moisture loss.
Mix Design
Concrete. The concrete mix design was 7 sacks of cement/cubic yard with a water cement-ratio of 0.4, and a slump of 2 to 3 inches. The maximum size aggregate used was 5/8 inch.
Grout. Equal amounts of sand and cement were mixed in a grout mixer. Enough water was added to the mix to form a stiff but workable mix that could be spread with a stiff broom.
QUALITY CONTROL
The actual slump was measured to be 3/4 inch, instead of the design value of 2 to 3 inches, and water was added to the mix to give a slump of 2 inches. After some concrete was placed. the slump reduced again, due to inadequate mixing. Water was added again to obtain a workable mix. The average slump in the concrete was taken as 1.5 inches. Due to the problems encountered with the slump of the concrete and the unavailability of proper vibrators, the required vibration levels on the slabs were not achieved. Therefore, the results relating to vibration levels are not considered to be accurate.
Fig 6.2. Surface condidons and vibration levels for shot blast surface for fwld study.
For each truck, beam and cylinder moulds were taken for seven-day flexural and compressive strength. The average flexural strength of the beams was 706 psi. The average compressive strength of the cylinders was 5,794 psi.

f.JC2
C =Comer S =Side M =Middle
Fig 6.3. Typical slllb for jreld study with core locations.
CORING PROGRAM
After the test slab was allowed to cure for seven days, the coring program was implemented. Cores were taken at the comer, side, and middle (interior). Figure 6.3 shows a typical slab with coring locations.
After the cores were retrieved, they were labeled with a three-part identification. The ftrSt part identifies the section number (1-17). The second part indicates the location of the core in the section (c= comer, S=side, m=middleorinterior). The last part indicates the core number at the section and location (1 or 2 ).
The coring was performed by a private coring contractor. A portable coring drill was used with a truck mounted water tank and a power generating unit. After the cores were
21
retrieved, they were put in plastic bags to prevent loss of moisture and taken to the laboratory for testing.
TESTING PROGRAM
Direct Shear
The direct shear test was performed using the universal loading machine and the equipment described in Chapter 3. The loading rate was 2 inch/minute. The load at failure was automatically recorded on graph paper. The data obtained from this test is given in Table B.1, Appendix B.
Density
After the direct shear test was performed on the cores, the specific gravity of the overlay was found according to ASTM C 641-81 (Ref 15). After the specific gravity was obtained, the density of the specimens was found by the following relationship:
Density = 62.4 x Specific Gravity (pet)
The data for the density of the overlay specimens is summarized in Table B.1, Appendix B.
Splitting Tensile Strength of Concrete
After the density test was performed on the cores, the splitting tensile strength of the overlay concrete was found according to ASTM C496-85 (Ref 15). The data for· the splitting tensile strength is summarized in Table B.2, Appendix B.

CHAPTER 7. RESULTS AND DISCUSSION
This chaprer deals with the results of the pilot study and the field study. The results are summarized and discussed, and the necessary plots are presenled and explained.
Pll..OTSTUDY
Texture Evaluation Devices
The following equipment and methods were used to evaluare the rexture of the slab:
( 1) sand patch method, (2) Text-Ur-Merer, and (3) Texture Profile Recorder.
The rexture measurement data for these devices are shown in Tables A.l, A.2, and A.3 (in Appendix A), for the Sand Patch, Text-Ur-Merer, and Texture Profile Recorder, respectively.
An analysis of variance (ANOV A) was done on each data set to fmd the best model. Table 7.1 summarizes the ANOV A table obtained for each device. An a :::; 0.01 was chosen as acceptable for all the models. The results show that the Sand Patch Method has the second lowest probability of rejection. The coefficient of variation is also very low. The Text-Ur-Merer has a very high probability of rejection. Also, the coefficient of variation is very high for this equipment The average lexture given by this method is very close to the texture given by the Sand Patch Method. The Texture Profile Recorder has the lowest probability of rejection. The coefficient of variation is also low. The average texture
given by this equipment is very different from the other two devices. The reason for this is that the counting of peaks in the profile graph obtained from the equipment is somewhat arbitrary. A peak is arbitrarily chosen as having a height of about 1/16 inch and a flat base of about 1/8 inch. The operator has to visually decide whether a protrusion should be counledasapeakornot Therefore,thenumberofpeaksmay vary from operator to operator. For this reason the texture profile recorder should be used by no more than one operator to evaluate the results.
Mter the ANOV A analysis, an estimare of the cost and time taken for each measurement was evaluated. Table 7.2 summarizes the average cost per measurement, time per measurement, and the ratio of cost to coefficient of variation and the ratio of time to coefficient of variation. The cost per measurement includes the cost of materials needed and the labor cost The initial cost of the equipment is not included in the study. Table 7.2 shows that even though the Text-Ur-Meter has a high coefficient of variation, its time and cost per coefficient of variation are minimum. The Sand Patch Method has the second best time and cost value per coefficient of variation. The Texture Profile Recorder has the worst cost and time value per coefficient of variation.
Though the time and cost value of the Text-Ur-Meter are low, it is not recommended because of high variation and low reliability in the data obtained from this equipment Thus, the Sand Patch Method is the recommended procedure for rexture evaluation because it gives very consistent results. This method is also recommended because it is an ASTM standard.
TABLE 7.1. ANOVA TABLE FOR SAND PATCH, TEXT-UR-METER AND TEXTURE PROFILE RECORDER
Coefficient Equipment Probability Significance of Variance Mean
Model F-value of Rejection sa 0.01 R-squared (percent) Texture
Sand Patch 24.19 0.0010 Yes 0.91 6.80 O.Ql79 Text-Ur-Meter 0.95 0.5000 No 0.30 24.80 0.0180 Texture Profile
Recorder 44.05 0.0003 Yes 0.93 5.41 0.0330
TABLE 7.2. SUMMARY OF THE ECONOMIC ANALYSIS OF TEXTURE MEASUREMENT DEVICES
Time/( minute) Cost/(dollars) Equipment Time Cost Coefficient Coefficient Coefficient
Model (minute) (doUars) of Variance of Variance of Variance
Sand Patch 6.75 2.30 0.068 99.00 33.82 Text-Ur-Meter 2.00 0.66 0.245 8.16 2.69 Texture Profile
Recorder 8.50 2.80 0.054 157.00 51.85
22

Direct Shear Test (Bond atlnter;{ace)
The minimum interface shear strength at the interface was 234 psi at the middle or interior core for the slab with zero vibration level. The maximum shear strength at the interface was 529 psi at the corner core of the slab with low vibration level. The shear strength for each vibration level at the corner and interior is shown in Fig 7 .1. Since the corner cores did not break at the interface for the medium and high vibration levels, their actual strengths at the interface is unknown. Therefore, no defmite pattern can be established for the bond strength as related to the vibration level for these set of cores. The interior cores failed at the interface in one loading and show that, as the vibration level increases, the shear strength at the interface increases. The corners show a higher shear strength. Since the slabs were very small, the vibration level could have caused the water to gather in the middle of the slab. This could have resulted in a decrease in bond at the interior.
Density
The lowest density was 137 pcf for medium vibration and the highest density was 141 pcf for the high vibration slab. A plot of average densities for vibration level is shown in Fig 7.2.1t is seen that the density remains constant (138
600
"!500
100
Zero
• Did not break in one try .. Did not break at interface in two tries
Low Medium High Vibration Level
Fig 7 .1. Effect of vibmtion level on the bond strength at corner and interior.
145
'[ ··------·----~·--~ -~ 135 (/)
i c
125 ~...... ____ ...._ ___ ...._ ____ ....._ ____ .....
Zero Low Medium High
Vibration Level
Fig 7.2. Effect of vibmtion level on the density of the overlay for pilot study for pilot study.
23
pet) up to and including medium vibration level. It increases to 141 pcfat the high vibration level.
Bond PuU-Out Test
The pull-out test was performed using the ACI test, as described in Chapter 3. Figure 7.3 shows the plot of pull-out strength for the different vibration levels. It is seen from this figure that the pull-out strength increases with increase in vibration level. Figure 7.4 shows the relationship between bond pull-out strength and the shear strength at the interface. The bond pull-out strength increases with increase in shear strength at the interface.
FIELD STUDY
The field study was done in Houston on SH-225. After the overlay was placed, the pavement was allowed to cure for seven days. Cores were taken from the locations discussed and described in Chapter 6, Fig 6.3. The cores were taken to the lab for the foUowing tests:
200 ·a .c a, c: CD
~ 5 100
2 '3 Q.. "0 c: 0 m
0 Zero Low Medium High
Vibration Level
Fig 7 .3. Effect of vibration level on the puU-out strength at the corner and interior for the pilot study.
'! £ C» c: Q) .=
200
Cf) 100 -::I 0 ..!.. "5 a.. 1:1 c: s
D
y = - 16.0192 + 0.3496x R = 0.83
D
o~~~~~~~~...._~~~--~
0 1 00 200 300 400 500 600
Direct Shear Strength, psi Fig 7 .4. Relationship between bond pull-outstrength and shear strength at the interface for the pilot study.

24
(1) direct shear (bond),
(2) density, and TABLE 7.3. SUMMARY OF BOND STRENGTH DATA FOR SHOT BLAST SURFACE FOR FlEW STUDY
(3) tensile strength.
The data from shear and density tests are given in Appendix B, Table B.l. The data from the tensile strength test are given in Table B.2 , Appendix B. These data include the pertinent infonnation about the cores, including strength, location, surface preparation, vibration level, moisnue condition, grout condition, and section number.
Direct Shear (Bond at Interface)
LOW VIBRATION
HIGH VIBRATION
NO GROUT
AV - 372
so - 90
CV - 0.24
AV - 466
so - 46
CV - 0.10
DRY
GROUT
AV - 321
so - 83
cv - 0.26
AV • 355
so - 36
CV • 0.10
WET
NO GROUT GROUT
AV - 306 AV • 303
so - 96 so= 148
cv - 0.31 cv - 0.49
AV - 193 AV • 186
so - 74 so - 65
cv = 0.38 cv - 0.35
The direct shear test was perfanned using the equipment described inChapters3and6. Tables7.3and7.4 TABLE 7.4. SUMMARY OF BOND STRENGTH DATA FOR ROTOMILL show the summary of the data of each SURF ACE FOR FlEW STUDY section for shotblast and rotomill surfaces, respectively. A preliminary statistical analysis of the data was perfanned to fmd the average bond strength, standard deviation, coefficient of variation, lowest bond strength, and highest bond strength for each surface preparation. Table 7.5 shows the summary of the preliminary statistical analysis. The next step was to find the significant factors and interactions. For this purpose, a General Linear Models ( GLM ) analysis was
NO GROUT
AV =
LOW so= VIBRATION
cv =
HIGH AV =
VIBRATION
perfonned on the IBM PC using SAS (Ref 16). The GLM analysis was chosen over the more popular analysis of variance (ANOV A) because it is capable of handling unbalanced data. The data became unbalanced because some of the cores were not recovered after coring and some were broken in handling. The Type III analysis was used for interpretation. Tables 7.6 and 7.7 summarize the GLM analysis for shot blast surface and rotomill surfaces, respectively. The F-value and the probability of rejection is also included for the main variables and the interactions. The last columns in these tables show whether the variable or interaction is significant at an acceptable as; 0.05.
The next step in the analysis was to fmd the effect of main variables and the interactions on the bond at the interface. This was accomplished by fmding the coefficient for the variable and interaction in the regression equation. The coefficients in the regression equation give an estimate of the effect of the variable or interaction on the bond at the interface. Figure 7.5 shows the effect of main variable on the bond at the interface for shot blast and rotomill surfaces, respectively. Figure 7.6 shows the effect of interaction for the two surface preparations. An error tenn is included with the effect. The error tenn associated with an effect gives an
so=
cv =
347
85
0.24
335
142
0.42
DRY WET
GROUT NO GROUT GROUT
AV = 178 AV = 278 AV = 223
so= 80 so= 67 so= 86
CV= 0.45 cv = 0.24 cv = 0.39
AV = 246 AV = 271 AV = 251
so= 79 so= 66 so= 48
CV= 0.32 cv = 0.24 CV = 0.20
TABLE 7.5. SUMMARY OF PREliMINARY STATISTICAL ANALYSIS FOR BOND AT INTERFACE FOR THE FlEW STUDY
Shot Blast Rotomill
Mean 313.00 psi 259.00 psi Standard Deviation 124.00 101.00 Coefficient of Variance 0.40 0.39 Lowest 103.00 psi 51.00 psi Highest 543.00 psi 480.00 psi
TABLE 7.6. SUMMARY OF GLM ANALYSIS FOR BOND AT INTERFACE ON SHOT BLAST SURFACE FOR THE FlEW STUDY
Shot Blast Rotomill
Mean 313.00 psi 259.00 psi Standard Deviation 124.00 101.00 Coefficient of Variance 0.40 0.39 Lowest 103.00 psi 51.00 psi Highest 543.00 psi 480.00 psi

25
TABLE 7.7. SUMMARY OF GLM ANALYSIS FOR estimate of the reliability of the effect. An effect is significant only if the error term associated with it is sufficiently lower than the effect itself. It is seen from Table 7.6 and Fig 7 .5(a) that all variables except the grout are significant for the shot blast surface. The only significant factor for the rotomill section is the grout, as shown in Table 7.7 and Fig 7 .5(b). Table 7.6andFig 7.6(a)showthatall the interactions are significant for the shotblast surface except the location/ grout and vibration/grout. For the interactions on the rotomilled section, Table 7. 7 and Fig 7 .6(b) show that none of the interactions is significant. Even though the effect of moisture/grout interactions is greater than the error, it is not high enough to be significant.
BOND AT INTERFACE ON ROTOMILL SURFACE FOR THE FlEW STUDY
Variable
Location Vibration Moisture Grout Location/Vibration Location/Moisture Location/Grout Vibration/Moisture Vibration/Grout Moisture/Grout
·- 400 a -ci'300 c: 0
a:l .5 200 (I)
~100 as ..r:::. Q 0
'iii 200 a.
'2 ~ .5 100 (I)
~ as ..r:::. Q 0
Location/ Vibration
'[200
'2 0
~100 (I)
~ as ..r:::. Q 0
F-value o: Level
1.41 0.245 0.51 0.482 0.29 0.593 4.73 0.038 0.06 0.809 0.00 0.963 0.73 0.401 0.17 0.687 0.70 0.409 1.87 0.182
..... ~
Significance
No No No Yes No No No No No No
IZl EHect on Bond B Error
After the significant factors are found, it is important to fmd the best and worst combinations in the interactions. Plotting the significant interaCtions against the bond
-~ 300
'2 ~ 200
.5
0 EHect on Bond II Error
Location Vibration Moisture Main Variable
Grout 0
Location Vibration Moisture Grout
Main Variable
(a) Shot blast surface. (b) Rotomill surface.
Fig 7 .5. Effect of main variable on bond.
1Z1 Effect on Bond
• Error
Locatiorv' Location/ Vibration/ Vibration/ Moisture/ Moisture Grout Moisture Grout Grout
Interaction
(a) Shot blast surface.
Grout Moisture
Interaction
(b) Rotomill surface.
[A EHect on Bond
II Error
strength helps in visualizing and comparing the combinations. The best combination is one which gives the highest average strength and the worst combination is one which gives the lowest average strength. Figures 7. 7to 7.10showeachofthe significant interactions for shot blast surface. Table 7.8 gives the summary of the best and worst combinations in the significant interactions for each surface preparation.
Fig 7 .6. Effect of interactions on the bond.
An analysis of the main factorial was also performed to find the better of the two surface preparations. This analysis gives an overall picture of the factorial. Table 7.9 shows the summary of the preliminary statistical analysis for bond strength on the main factorial. Table 7 .I 0 shows the summary of the GLM analysis performed for bond strength on the main factorial. This analysis shows that surface preparation is a significant factor for bond strength at the interface. Also, moisture plays the most significant role in the decision to select a surface preparation technique. Figure 7 .II shows the interaction between surface
26
preparation and moisture condition. The interaction shows that a dry pavement gives the best bond for both rotomill and shot blast surfaces. When the pavement is dry, shot blasting gives significantly greater bond than rotomilling, but when the surface is wet, surface preparation does not make much difference.
Density
The specific gravity of the specimens was found by ASTM C642-81 (Ref 14) procedure. Density of the cores was found by the following relationship:
M,L
M,H
S,L
S • Side M • Middle or Interior H .. High Vibration L • Low Vibration
o~----~----~L-----Sk:le Middle or Interior
Location
Fig 7.7. Interaction of location and vibration for bond at interface for shot blast surface.
500
M,D
400
s.o/.M.w a <i (J Ill 300 t Ql
.5 1ii ~ 200 cB
s-skle 100 M • Middle or Interior
W- Wet D • Dry
Side Middle or Interior
Location
Fig 7 .8. Interaction oflocation and moisture condition for bond at interface for shot blast surface.
Density = 6.24 x Specific Gravity (pet).
The data for density are summarized by sections in Table 7.11. Since the density of the overlay is an internal property of the concrete, surface preparation is not considered a variable in the statistical analysis. Therefore, the preliminary statistical analysis is done over the entire density data set without dividing into surface preparation sections. Table7.12summarizesthepreliminarystatisticalanalysisof the density data. The significant variables and interactions are found by the GLM procedure as perfonned before for the
D,H
D,L
D • Dry w- Wet
W,L
W,H
H • High Vibration L .. Low Vibration
0~----~------~-----Dry Wet
Moisture Condition
Fig 7 .9. Interaction of vibration and moisture for bond at interface for shot blast surface.
D,N
W,Y
W,N
D • Dry W- Wet Y • Grout N • NoGrout
0~----~------L---Dry Wet
Moisture Condition
Fig 7.10. Interaction of moisture and groutfor bond at interface for shot blast surface.

TABLE 7.9.
TABLE 7.8. TABULATION OF THE BEST AND WORST COMBINATIONS IN SIGNIFICANT INTERACTIONS FOR BOND STRENGTH AT INTERFACE FOR THE FIELD STUDY
Interaction
Shot Blast Location/Vibration
Location/Moisture
Vibration/Moisture
Moisture/Grout
Rotomill No Significant Interactions
SUMMARY OF THE
Best
Middle or Interior, Low Vibration Middle or Interior, Dry Dry, High Vibration
Dry, No Grout
Worst Side, Low Vibration Side, Wet
Wet, High Vibration Wet, No Grout
27
PRELIMINARY STATISTICAL TABLE 7.10. SUMMARY OF THE OUTPUT OF GLM
ANALYSIS FOR BOND STRENGTH ON THE MAIN FACTORIAL FOR
ANALYSIS FOR BOND STRENGTH ON THE MAIN
THE FlEW STUDY FACTORIAL FOR THE FlEW STUDY
Mean 284.0 psi Variable F-value a Level Standard Deviation 114.7 Surlace Preparation 9.53 0.0031 Coefficient of Variance 0.40 Location 12.47 0.0080 Lowest Bond Strength 51.0 psi Vibration 0.26 0.6151 Highest Bond Strength 543.0 psi Moisture 10.68 0.0018
Grout 5.09 0.0278 Location/Vibration 2.11 0.1519 Location/Moisture 1.48 0.2281
TABLE 7.12. SUMMARY OF THE Location/Grout 0.46 0.5009 PRELIMINARY STATISTICAL Vibration/Moisture 5.20 0.0262 ANALYSIS FOR DENSITY FOR Vibration/Grout 0.04 0.8490 FlEW STUDY Moisture/Grout 4.10 0.0474
Surlace Preparation/Location 3.36 0.0720 Mean 140pcf Surlace Preparation/Vibration 2.82 0.0986 Standard Deviation 4.56 Surlace Preparation/Moisture 11.13 0.0015 Coefficient of Variance 3.25 Surlace Preparation/Grout 0.58 0.4496 Lowest Density 108 pcf Highest Density 147 pcf
TABLE 7.11. SUMMARY OF THE DENSITY DATA BY SECTIONS FOR FlEW STUDY
DRY WET
NO GROUT GROUT NO GROUT GROUT
AV • 143 AV • 142 AV = 143 AV ... 143
LOW so- 2.17 so. 1.28 so= 1.60 so. 0.76 VIBRATION cv- 0.015 cv- 0.009 cv. 0.011 cv- 0.005
HIGH AV = 142 AV • 140 AV • 137 AV = 137
VIBRATION so= 1.38 so- 1.32 so= 2.01 so. 1.52
CV • 0.01 CV = 0.0094 cv = 0,015 cv- 0.011
Sianifi~I!D~ll Yes Yes No Yes Yes No No No Yes No Yes No No Yes No

28
400
·a. 300
~ 1:: (I) 200 .s iii , c:
~ 100
R, /
S,D
- _____.S,W R,wr-
s - Shotblast R .. Rotomill D • Dry W-Wet
0~----~----~------Rotomill Shotblast
Surface Preparation
Fig 7.11. Interaction of surface preparation and moisture on the bond at interface for the main factorillL
4
8. 3
-~ Ill c: (I)
Cl 2 .5 & c: liS
t3 1
0
t21 Effect on Density
location Vibration Moisture Grout
Main Variable
(a) Main varillble.
TABLE 7.13. SUMMARY OF THE OUTPUT OF GLM ANALYSIS FOR DENSITY FOR FIELD STUDY
Variable F-value o:Level Significance
Location 3.84 0.0536 No Vibration 10.11 0.0021 Yes Moisture 6.64 0.0118 Yes Grout 0.80 03749 No Location/Vibration 0.42 0.5200 No Location/Moisture 0.59 0.4435 No Location/Grout 0.32 0.5731 No Vibration/Moisture 1.62 0.2073 No Vibration/Grout 0.01 0.9289 No Moisture/Grout 0.06 0.8087 No
bond strength data. Table 7.13 summarizes the output from GLM analysis. The acceptable o: ::; 0.05. From this table it is seen that vibration is themostsignificantfactorthataffects the density. Moisture level on the surface also affects the density significantly, but to a lesser extent
The coefficients in the regression equation give an estimate of the affect of the variable or interaction on the density of the concrete. Figure 7.12 shows the effect of main variables and interactions on the density of concrete. None of the interactions significantly affect the density of an overlay concrete.
Tensile Strength of Overlay Concrete
The tensile strengths of the specimens were found by following ASTM C496-85 procedures (Ref 15). The tensile strength of the overlay is an internal property of the concrete. Therefore, surface preparation is not considered as a variable. Table 7.14 summarizes the tensile strength data by sections. A summary of the preliminary statistical analysis is shown in Table 7 .15. A summary of the GLM output for the tensile strength is given in Table 7.16. The table shows that vibration is the only factor that significantly affects the
3
tensile strength. The coefficients in the regression t::l Effect on Density equation for tensile strength for main variables and II Error interactions are given in Fig 7 .13. It is seen here that
even though the standard error is smaller than the effeet, the variables are not significant
0 Localion/ Localion/ location/ Vibration/ Vibration/ Vibration Moisture Grout Moisture Grout
Interaction
(b) Interactions.
Moisture/ Grout
RELATIONSHIP BETWEEN BOND, DENSITY AND TENSILE STRENGTH
Fig 7.12. Effect of(a) main varillble and (b) interaction on the density of overltly concrete for f~ld study.
The relationship between bond, density, and tensile strength is an important area of study. If the these parameters can be related to each other, knowing one of the parameters will give an estimate of the other parameters. Therefore, knowing the relationship between the variables can help in improving construction practice for overlay placement The following graphs are plotted to fmd the relationship for:

29
(1) bond versus density, (2) tensile strength versus
density, and
TABLE 7.14. SUMMARY OF TENSILE STRENGTH DATA BY SECTIONS FOR FlEW STUDY
(3) tensile strength versus bond.
DRY WET
NO GROUT GROUT NO GROUT GROUT Bond Versus Density
This case considers all the data points and gives the graph of bond strength versus density over the entire factorial. A plot of bond strength versus density is given in Fig 7.14. This indi· cates that the data have considemble variability and no defmitive relationship exists between bond strength density.
LOW VIBRATION
HIGH VIBRATION
Tensile Strength Versus Density
AV = so = cv =
AV =
so =
cv =
Figure 7.15(a) shows the relationship between tensile strength and density. As with bond strength, no correlation exists between tensile strength and density.
Tensile Strength Versus Bond Strength
Tensile strength and bond strength are shown in Fig. 7.15(b). There is considerable scatter in the data. Because of the large scatter of the data points, no relationship was found between tensile strength and bond strength.
CHANGE IN BOND STRENGTH FROM CORNER TO INTERIOR
It is important to know the change in bond strength when the core location is changed from comer to interior or vice-versa. To find the change in bond strength from corner to interior, a plot was made consisting of Y -axis as the change in bond strength.
The change in bond from the corner to the interior is the difference between the avemge bond at the interior and the average bond at the corner.
Figure 7.16 shows the change in bond strength from comer to interior for rotomill and shot-blast sections. The plot shows that, on the avemge, there is a larger change in bond from comer to interior for the shot-blast case than the rotomill case. Therefore, location of the core is more important for shotb1ast surface than a rotomill surface prepamtion.
711
110
0.15
595
16
0.03
AV = 552 AV = 652 AV "' so= 65 so = 38 so =
cv "' 0.10 cv = 0.06 CV =
AV = 625 AV = 510 AV = so .. 150 so = 68 so =
cv = 0.24 cv = 0.13 cv =
TABLE 7.15. SUMMARY OF THE PRELIMINARY STATISTICAL ANALYSIS FOR TENSILE STRENGTH OF CONCRETE FOR FlEW STUDY
Mean Standard Deviation Coefficient of Variance Lowest Tensile Strength Highest Tensile Strength
606.00psi 113.00
0.19 404.00psi 881.00 psi
671
132
0.20
542
31
0.06
TABLE 7.16. SUMMARY OF THE OUTPUT OF GLM ANALYSIS FOR TENSILE STRENGTH OF CONCRETE FOR FlEW STUDY
Variable F-value a Level Significance
Location 0.08 0.77 No
Vibration 4.91 0.04 Yes
Moisture 0.35 0.56 No Grout 0.42 0.52 No Location/Vibration 0.92 0.34 No Location/Moisture 3.43 O.o? No Location/Grout 0.47 0.50 No Vibration/Moisture 2.69 0.11 No Vibration/Grout 2.18 0.15 No Moisture/Grout 1.18 0.29 No

30
500 ·~
£400 g' ~
Ci5 300 ..9! "iii c: ~ 200
.!: <D g' 100 ns
.s:::. (.)
121 Effect on Tensile Strength B Error
Location Vibration Moisture Grout
Main Variable
(a) Main variable.
.!: 100 <D g' ns
.s:::. (.) 0
Location! Vibation
Location! Moisture
f:J Effect on Tensile Strength
18 Error
Location/ Vibration! Vibration/ Moisture/ Grout Grout Moisture Grout
Interaction
(b) Interactions.
Fig 7 .13. Effect of (a) main variable and (b) interactions on the tensile strength of concrete overlay.
600 .. 500
I "ill '7400 .c
t300 .I 05 ~ 200 • cB
100 .~
• 0
0 50 100 150 200
Density, pet
Fig 7 .14. Relationship of bond and density for field study.
1000 1000
900
"iii a. 800
.c 700 c:n 600 c: <D
c7) 500
..9! "iii
400 c: 300 CD 1-
200
100
0 0
• J •
' • I •
50 100 150
Density, pet
{a) Tensile strength and density.
200
900
800 ·c;; Q. 700 s£ '5I 600 c: I! 500
en 40o .SR -~ 300
~ 200
100
II
alii
Iii
II \II
II g II
li
II II
II
II Q
fiiJIIrllll II II "II II
II II
II
o~~~~~~~~~~~~
0 1 00 200 300 400 500 600
Bond Strength, psi
(b) Tensile strength and bond strength.
Fig 7.15. Relationship between (a) tensile strength and density and (b) tensile strength and bond strength.
300 •
200 ...... • ... CD c • ... 0 0 •
• ... • 0 • ;:::: 100 • CD - • § -;; Q.
...: • Ill CD •
.r::. • en 0 <I •
• -100 l.-------l-----...1....----
Rotomill Shot Blast
Fig 7.16. Change in bond/rom corner to interior for the ju!ld study.
31

CHAPTER 8. CONCLUSIONS AND RECOMMENDATIONS
The conclusions based on the tests performed in the pilot and field sbJdies are presented These conclusions are based on the limited tests and the specific conditions of these tests and the materials and equipments used. A set of recommendations is presented based on the conclusions from the study.
CONCLUSIONS
1. The Sand Patch Method is the best method for evaluating the texture of a pavement
2. There was insufficient data to derive conclusions about the trend of bond strength from comer cores.
3. The bond pull-out strength increases with an increase in vibration level for the middle or interior cores. Sufficient data could not be gathered for the corner locations to make a defmitive statement about the trend in bond pull-out strength.
4. The bond pull-out strength increases with an increase in the bond strength at the interface.
5. The density of concrete increases with an increase in vibration level.
6. For a shot blast surface, the location and moisture condition are significant factors. For a rotomilled surface these factors are not significant. Grout is not a significant factor for a shot blast surface, but for a rotomilled surface. When interactions are considered, none of the interactions are significant for a rotomilled surface. For a shotblast surface, the Location/Moisture, Location/Vibration, Vibration/Moisture, and Moisture/Grout interactions are significant.
7. The effect of main variables and the interactions relating to vibration levels should not be considered because of the problems encountered with the vibrations in the field.
32
8. For a shotblast surface, when the pavement is wet the shear strength at the interface is lower than when the pavement is dry. Specifically, the cores taken at the sides show a lower shear strength than the interior cores for the same moisture level.
9. Overlaying on a dry surface results in a higher bond strength at the interface than overlaying on a wet surface. Specifically, when the surface is rotomilled, there is a slight increase in bond strength from wet to dry conditions. For a shot blast surface, bond strength is substantially higher for a dry surface than for a wet surface.
10. There is no relationship between the tensile strength of concrete and the shear strength at the interface. Furthermore, density does not have a pronounced effect on either bond or tensile strength.
11. The change in shear strength from interior to corner is more pronounced for a shot blast case than for a rotomill case.
12. Also, when the pavement is dry, the no grout condition gives higher bond strength than the grout condition. But when the pavement is wet, grouting increases the bond strength.
RECOMMENDATIONS
1. There should be additional studies at different temperatures.
2. There should be an experimental design to study the effects of different levels of scarification for rotomilled and shot blast cases.
3. Relative economics of dryness and grouting should be investigated to determine if it is economical to dry a wet surface before overlaying or is it more economical to apply grout to a wet surface.

REFERENCES 1. Felt, E. J ., "The Repair of Concrete Pavement." ACI 9. Reading, Thomas J., "Choosing a Concrete Vibra-
Journal, Proceedings, Vol 57, No.2., pp 139-153, tor," Concrete Construction, September 1982, pp August 1960. 701-707.
2. Gillette, Roy W ., "A I 0-Year Repc>rt on the Perform- 10. "Measuring Surface Macrotexture Depth Using a ance of Bonded Concrete Resurfacings," High- Sand Volumetric Technique," ASTM Standard way Research Record No. 94, Highway Research E965-83. Board, 1965, pp 61-76. II. Scrivner, Frank H., and W. R. Hudson, "A Modifica-
3. "A Study of the Effects of Interface Condition on tion of the AASHO Road Test Serviceability Thin Bonded PCC OverJays," Research Report Index to Include Surface Texture," Highway 357-1, Center for Transportation Research, The Research Board, WashingtOn, D. C., 1964. University of Texas at Austin, December 1984. 12. Ashkar, B. H., "Development of a Texture Profile
4. "Design of Concrete Overlays for Pavements," Re- Recorder," Research Report No. 133-2, Texas JX)rt 325-1R -67, American Concrete Institute, Highway Department, Highway Design Division, 1967. July 1970.
5. Wibby, Richard J ., "PortJand Cement Concrete 13. "Use of EJX>XY ComJX>unds with Concrete," Report Thin-Bonded OverJay," ASCE Journal of Con- 503R-80, Revised 1984, American Concrete In-struction Engineering and Management. Vollll, stitute, 1985. No.3, September 1985, pp 281-292. 14. "Standard Test Method for Specific Gravity, Absorp-
6. "Surface Preparation Prior to Thin-Bonded Over- tion, and Voids in Hardened Concrete,'' ASTM Jay," Humble Manufacturing Company, 1987. Standard C642-81.
7. "Standard Specifications for Construction of High- 15. "Standard Test Method for Splitting Tensile Strength ways, Streets and Bridges," Texas Department of of Cylindrical Concrete Specimens," ASTM Highways and Public Transportation, 1982. Standard C495-85.
8. "Standard Practice for Consolidation of Concrete," 16. "SAS Language Guide for Personal Computers," ReJX>rt 309-72, American Concrete Institute, Version 6 Edition, SAS Institute, Cary, NC, 1985. 1982.
33


APPENDIX A
TABLE A.l. TABULATION OF THE DATA FOR SAND PATCH TEST FOR PILOT STUDY
Observation Texture Section Location
1 0.0177 1 1 2 0.0167 1 1 3 0.0166 1 1 4 0.0161 1 2 5 0.0141 1 2 6 0.0131 1 2 7 0.0230 2 3 8 0.0225 2 3 9 0.0227 2 3
10 0.0145 2 4 11 0.0139 2 4 12 0.0148 2 4 13 0.0224 3 5 14 0.0197 3 5 15 0.0208 3 5 16 0.0202 3 6 17 O.ot73 3 6 18 0.0165 3 6
TABLE A.2. TABULATION OF THE DATA FOR TEXT-UR-METER FOR PILOT STUDY
Observation Texture Section Location 1 0.0158 1 1 2 0.0158 1 1 3 0.01% 1 1 4 0.0158 1 2 5 0.0158 1 2 6 0.0158 1 2 7 0.0158 1 3 8 0.0158 1 3 9 0.0196 1 3
10 0.0236 2 4 11 0.01% 2 4 12 0.0158 2 4 13 0.0314 2 5 14 0.0158 2 5 15 0.01% 2 5 16 0.0236 2 6 17 0.01% 2 6 18 0.01% 2 6 19 0.0236 3 7 20 0.0236 3 7 21 0.0118 3 7 22 0.0236 3 8 23 0.0118 3 8 24 0.0158 3 8 25 0.0158 3 9 26 0.0158 3 9 27 0.0118 3 9
35

36
TABLE A.J. TABULATION OF THE DATA FOR TEX-TURE PROFILE RECORDER FOR PIWT STUDY
Observation Texture Section Location 1 0.0345 2 0.0388 1 1 3 0.0345 1 1 4 0.0255 2 2 5 0.0255 2 2 6 0.0255 2 2 7 0.0364 3 3 8 0.0397 3 3 9 0.0397 3 3
TABLEA.4. TABULATIONOFTHEDATAFORDIRECTSHEARTEST AND DENSITY TEST FOR PIWT STUDY
Bond Strength Density
3 Observation Vibration Level Location (psi) (slugs /ft. )
1 Zero Interior or Middle 234 4.33 2 Zero Comer 304 4.29 3 Low Interior or Middle 323 4.31 4 Low Comer 529 4.29 5 Medium Interior or Middle 481 4.31 6 Medium Comer >373 4.27 7 High Interior or Middle 501 4.35 8 High Comer >287 4.38
TABLE A.S. TABULATION OF THE DATA FOR BOND PUU OUT TEST FOR PILOT STUDY
Bond Strength
Observation Vibration Level Location (psi)
1 Zero Interior or Middle 64 2 Zero Comer Not Covered 3 Low Interior or Middle 104 4 Low Comer Not Covered 5 Medium Interior or Middle 113 6 Medium Comer Not Covered 7 High Interior or Middle 193 8 High Comer 257

APPENDIX B
TABLE 8.1. TABULATION OF THE DATA FOR BOND AND DENSITY FOR FlEW STUDY
Bond Density Surface Observations (psi) (pcO Location* Preparation Vibration Moisture Grout Section
1 253 144 s R H D N l 2 228 144 s R H D N 1 3 475 142 s R H D N 1 4 480 143 s R H D N 5 119 144 M R H D N l 6 457 144 M R H D N 1 7 110 141 s R H D y 2 8 264 139 s R H D y 2 9 192 142 s R H D y 2
10 239 138 s R H D y 2 11 336 139 M R H D y 2 12 332 145 M R H D y 2 13 230 139 s R H w N 3 14 137 s R H w N 3 15 184 137 s R H w N 3 16 252 137 s R H w N 3 17 368 141 M R H w N 3 18 322 139 M R H w N 3 19 208 137 s R H w y 4 20 178 139 s R H w y 4 21 312 138 s R H w y 4 22 287 138 s R H w y 4 23 230 140 M R H w y 4 24 288 138 M . R H w y 4 25 205 142 s R L w y 5 26 159 143 s R L w y 5 27 181 141 s R L w y 5 28 226 147 s R L w y 5 29 159 144 M R L w y 5 30 409 143 M R L w y 5
1 S = Side of Comer 6 L = Low Vibration 2 M = Middle or Interior 7 D=Dry 3 R = Rotomill 8 W=Wet 4 S = Shotbla.st 9 N =No Grout 5 H = High Vibration 10 Y =Grout
37
38
TABLE B.l. (CONTINUED)
Bond Density Surface Observations (psi) (pc:O Location* Preparation Vibration Moisture Grout Section
61 178 108 s s L w y 12 62 142 s s L w y 12 63 169 142 s s L w y 12 64 331 144 s s L w y 12 65 143 M s L w y 12 66 534 143 M s L w y 12 67 142 s s L w N 13 68 137 s s L w N 13 69 215 140 s s L w N 13 70 206 140 s s L w N 13 71 412 142 M s L w N 13 72 391 143 M s L w N 13 73 103 135 s s L w y 14 74 136 s s H w y 14 75 156 136 s s H w y 14 76 135 s s H w y 14 77 280 137 M s H w y 14 78 205 137 M s H w y 14 79 137 s s H w N 15 80 146 137 s s H w N 15 81 147 137 s s H w N 15 82 148 130 s s H w N 15 83 187 137 M s H w N 15 84 339 137 M s H w N 15 85 351 138 s s H w y 16 86 139 s s H D y 16 87 338 139 s s H D y 16 88 347 139 s s H D y 16 89 316 140 M s H D y 16 90 422 138 M s H D y 16 91 140 s s H D N 17 92 402 141 s s H D N 17 93 543 141 s s H D N 17 94 475 140 s s H D N 17 95 447 141 M s H D N 17 96 462 140 M s H D N 17
1 S = Side of Comer 6 L = Low Vibration 2 M = Middle or Interior 7 D=Dry 3 R= Rotomill 8 W=Wet 4 S = Shotblast 9 N =No Grout 5 H = High Vibration 10 Y =Grout

39
TABLE B.l. (CONTINUED)
Bond Density Surface Observations (psi) (pd) Location• Preparation Vibration Moisture Grout Section
61 178 108 s s L w y 12 62 142 s s L w y 12 63 169 142 s s L w y 12 64 331 144 s s L w y 12 65 143 M s L w y 12 66 534 143 M s L w y 12 67 142 s s L w N 13 68 137 s s L w N 13 69 215 140 s s L w N 13 70 206 140 s s L w N 13 71 412 142 M s L w N 13 72 391 143 M s L w N 13 73 103 135 s s L w y 14 74 136 s s H w y 14 75 156 136 s s H w y 14 76 135 s s H w y 14 77 280 137 M s H w y 14 78 205 137 M s H w y 14 79 137 s s H w N 15 80 146 137 s s H w N 15 81 147 137 s s H w N 15 82 148 130 s s H w N 15 83 187 137 M s H w N 15 84 339 137 M s H w N 15 85 351 138 s s H w y 16 86 139 s s H D y 16 87 338 139 s s H D· y 16 88 347 139 s s H D y 16 89 316 140 M s H D y 16 90 422 138 M s H D y 16 91 140 s s H D N 17 92 402 141 s s H D N 17 93 543 141 s s H D N 17 94 475 140 s s H D N 17 95 447 141 M s H D N 17 96 462 140 M s H D N 17
1 S =Side of Comer 6 L = Low Vibration 2 M = Middle or Interior 7 D=Dry 3 R Rotomill 8 W=Wet 4 S = Shotblast 9 N=NoGrout 5 H = High Vibration 10 Y =Grout

40
TABLE B.2. TABULATION OF THE DATA FOR TENSILE STRENGTH OF CONCRTE FOR FIELD STUDY
ensile Strength Surface
Observations (psi) Location Preparation Vibration Moisture Grout Section
1 570 s R H D N 1 2 609 M R H D N 1 3 738 s R H D y 2 4 785 M R H D y 2 5 562 s R H w N 3 6 457 M R H w N 3 7 524 s R H w y 4 8 514 M R H w y 4 9 881 s R L w y 5
10 541 M R L w y 5 11 679 s R L w N 6 12 679 M R L w N 6 13 623 s R L D y 7 14 568 M R L D y 7 15 743 s R L D N 8 16 816 M R L D N 8 17 526 s R L D N 10 18 759 M s L D N 10 19 446 s s L D y 11 20 569 M s L D y 11 21 685 s s L w y 12 22 576 M s L w y 12 23 s s L w N 13 24 599 M s L w N 13 25 536 s s H w y 14 26 595 M s H w y 14 27 429 s s H w N 15 28 591 M s H w N 15 29 404 s s H D y 16 30 571 M s H D y 16 31 592 s s H D N 17 32 608 M s H D N 17
1 S = Side of Comer 6 L = Low Vibration 2 M = Middle or Interior 7 D=Dry 3 R = Rotomill 8 W=Wet 4 S = Shotblast 9 N=NoGrout 5 H = High Vibration 10 Y =Grout