a study of the effct of co-curricular … · a study of the effct of co-curricular courses on...
TRANSCRIPT
A STUDY OF THE EFFCT OF CO-CURRICULAR COURSES ON STUDENT ATTENDANCE, COMPOSITE ACT SCORE AND STUDENT DROPOUT RATE
RONALD D. FORTUNE
Submitted to
The Department of Professional Education Faculty
Northwest Missouri State University Missouri
Department of Professional Education
College of Education and Human Services
Maryville, MO 64468
Submitted in Fulfillment for the Requirements for
61-683 Research Paper Fall 2011
May 5, 2013
Effect of Co-curricular courses
2
ABSTRACT
Student participation in co-curricular courses may have benefits to students
beyond the intrinsic value of the subject taught. This research intends to investigate three
specific areas of possible impact for students involved in the following specified co-
curricular activities: Debate, Acapella Choir, Jazz Band, Orchestra, Show/Jazz Choir,
Symphonic Band and Theatre. All research data is provided by one large Mid-western
school district office of Core Data and is compared to the data for the same district
located in the data inquiry section of the Missouri Department of Elementary and
Secondary Education.
Twenty-one individual t-Tests have been used to measure the data for each of the
seven co-curricular courses measuring student attendance, ACT Composite score and
dropout rate. The results of these tests are provided within this paper and indicate the
result of a comparison between students enrolled in the specified co-curricular course and
the general high school population of the Mid-western suburban School District over the
years 2009-10, 2010-11 and 2011-12. It should be noted that there may be some
distortion in accuracy of test comparison because the data for each of the co-curricular
courses is also embedded in the general population.
The results of the t-Tests and research indicate that students who participate in co-
curricular courses have significantly better attendance, significantly better ACT
composite scores and a significantly lower dropout rate.

Effect of Co-curricular courses
3
INTRODUCTION
Background, Issues and Concerns Missouri is currently employing the School Improvement Program referred to as MSIP 5.
This program requires schools be evaluated in five specific areas: Academic
Achievement as indicated on MAP, EOC and soon Common Core State Standards,
Subgroup Achievement as identified by specific subgroups within the school community,
College and Career Readiness as indicated in a variety of testing tools such as ACT,
SAT, ASVAB, COMPASS and scores within AP, IB and TSA tests and post high school
experience, Attendance Rates and Graduation Rates. All school districts are searching
for ways to decrease the dropout rate and increase persistence to graduation as well as
increase attendance, address subgroup performance and improve test readiness for the
rigor and relevance of Common Core.
This study is intended to help determine if co-curricular courses provide benefits
to students beyond their intrinsic subject content. Do co-curricular courses in some way
help reduce the dropout rate for enrolled students, impact attendance, increase grade point
average and impact ACT scores? If these courses do reduce dropout rate and increase
attendance, grade point average and ACT test scores, then administrators and counselors
may consider the importance of encouraging parents of middle and high school students
to involve their students in activities related to high school co-curricular courses.
Practice under Investigation Should middle school and high school administrators and counselors encourage students
to become involved in co-curricular courses? Should district administration consider
Effect of Co-curricular courses
4
providing more course options for middle school students within an enrichment field that
may lead to improved participation in high school and beyond? Do co-curricular courses
offer additional benefits beyond the course subject that can benefit the student, the school
and the district?
School Policy to be Informed by Study Middle School and High School course offerings and counseling of students should be
considered carefully with this study in mind. Additionally parent information about the
benefits of involvement in co-curricular courses should be made available.
Conceptual Underpinning High School students who participate in the highest level of school co-curricular courses
develop an internal social community that increases expectation of attendance, grade
point average, graduation rate and preparation for college and career readiness. These
communities are developed by internal expectations developed within the group that are
often related to performance expectations for concerts, contests and other events
associated with the student’s co-curricular course. Participation in these co-curricular
courses increases student engagement in all aspects of school and increase the likelihood
that a student will find success as indicated by the Missouri Improvement Program.
Statement of the Problem There is limited research data available that conclusively explores the theory that student
involvement in co-curricular courses will significantly decrease high school dropout rates
and increase attendance, grade point average and college and career readiness.

Effect of Co-curricular courses
5
Purpose of the Study Collect and analyze data of students who participate in specified co-curricular courses
that relate to student success in three areas: 1. Student Attendance, 2. Dropout Rate, 3.
ACT Test results and the general school population. This data may provide important
information for district officials who help decide student programs of study and available
coursed for participation in co-curricular courses at the high school level. This may also
help promote discussion and evaluation of course opportunities available for middle level
students.
Research Questions RQ 1: Do students who participate in co-curricular courses have a higher attendance
rate?
RQ 2: Do students who participate in co-curricular courses have a higher ACT
composite score?
RQ 3: Do students who participate in co-curricular courses have a lower dropout rate?
Null Hypotheses Ho 1: There is no significant difference in attendance rate for students who participate in
identified co-curricular courses compared to the general school population. Hypotheses
Ho 2: There is no significant difference in Composite ACT score for students who
participate in identified co-curricular courses compared to the general school population.

Effect of Co-curricular courses
6
Hypotheses 3: There is no significant difference in Dropout rate for students who
participate in identified co-curricular courses compared to the general school population.
Anticipated Benefits of the Study This study will help determine advantages of student participation in co-curricular
activities. The study may also provide additional rational for continued or increased
support by all levels and facets of school staff to increase student participation in co-
curricular courses leading to and continuing in high school.
Definition of Terms Dropout Rate- For grades 9-12 the number of dropouts divided by the total of September
enrollment, plus transfers in, minus transfers out, minus dropouts, added to September
enrollment, then divided by two.
Co-curricular Courses- Identified in this study as one of the following classes: Jazz
Band, Symphonic Band, Orchestra, Jazz/Show Choir, Accapella Choir, Debate and
Theater
ACT Results- The percentage of graduates taking the ACT, along with the average
composite ACT score. These statistics are provided to DESE by ACT.
MSIP5- Missouri School Improvement Program designed to evaluate schools success in:
Academic Achievement, College and Career Readiness, Sub-group performance,
Attendance and Graduation Rate.
Effect of Co-curricular courses
7
Summary
Most high school staff and counselors encourage students to be immersed in the
school society and be a part of an extra-curricular or co-curricular activity. The intrinsic
value of a co-curricular course is important for life beyond a regular work area and study
in the particular course may offer preparation for a career within the associated field.
There may also be other benefits to student enrollment within a co-curricular class. This
study hopes to answer at least one question. Does involvement in co-curricular courses
improve student engagement in school and encourage behavior that promotes success in
school as measured by Attendance, Standardized tests and Persistence to Graduation?

Effect of Co-curricular courses
8
REVIEW OF LITERATURE
The literature reviewed provided support that students involved in co-curricular
courses helped increase attendance rate, decrease dropout rate and increase student
standardized test scores. According to O’Brien and Rollefson (1995) in a study for the
National Center for Educational Statistics:
Indicators of successful participation in school include consistent attendance,
academic achievement, and aspirations for continuing education beyond high
school. Extracurricular participation (1) was positively associated with each of
these success indicators among public high school seniors in 1992 (table 1).
During the first semester of their senior year, participants reported better
attendance than their non-participating classmates--half of them had no unexcused
absences from school and half had never skipped a class, compared with one-third
and two-fifths of nonparticipants, respectively. Students who participated were
three times as likely to perform in the top quartile on a composite math and
reading assessment compared with nonparticipants. Participants were also more
likely than nonparticipants to aspire to higher education: two-thirds of participants
expected to complete at least a bachelor's degree while about half of
nonparticipants expected to do so. It cannot be known from these data, however,
whether participation leads to success, successful students are more inclined to
participate, or both occur.”
This report did indicate extracurricular to include a wide variety of activities that
included co-curricular courses identified in this study as well as academic clubs and

Effect of Co-curricular courses
9
sports.
Additional support for the supposition that co-curricular courses provide benefits
beyond their subject was reported in an online Washington Post article by Strauss (2007).
Schools with music programs have graduation rates of 90.2 percent, as compared
with a 72.9 percent rate for schools without music education, according to a 2006
Harris Interactive poll of high school principals funded by the National
Association for Music Education and International Music Products Association,
known as NAMM. The poll also found that schools with music programs have
attendance rates of 93.3 percent, compared with 84.9 percent for those that don't.
(p. 1)
The author from this same article quotes the same Harris poll indicating a marked
difference in SAT scores in verbal and math based on experience in music performance.
One may also infer from the available literature other components of co-curricular
courses that support student engagement and impact student achievement. These
components work together to help influence the positive impacts that students gain from
participation in co-curricular activities. Examples of these components include: student
relationships, parental involvement, connections to school and student engagement in
school.
Students in co-curricular courses develop relationships with teachers and other
students providing an incentive to attend school and do well in school so they can
continue participation in their select co-curricular course. Taylor (2011), suggests that
“Today’s learners want to connect and communicate constantly and want an environment
to support these connections.” Every co-curricular course not only encourages, but

Effect of Co-curricular courses
10
requires by the nature of the course that students communicate and connect to those
around them. Students build a trust with each other and their teachers and the
expectations of both community and teacher impact the student’s decision to attend
school, complete assignments and continue education beyond high school. Wilson
(2009) observes, “Another positive impact of participation in extracurricular activities is
the possibility of a student acquiring some type of supportive relationship, mentor or role
model with an adult. When children identify with a helpful coach or talented director, the
children get to know them better by being involved.” (p. 15)
Parent involvement in a student’s education will impact that student’s success.
Sanders, Epstein, Joyce and Connors-Tadros report that: “The findings of this study
suggest that high schools that develop programs of partnership, including practices for
different types of involvement, are likely to improve parental attitudes toward the school
and enable more families to become involved in their teens’ education at school and at
home.” (p. 15) Parents with student in co-curricular courses continue to be involved in
their student’s school life as they are asked to participate in school functions in a variety
of capacities such as fund raising, supervision of trips and audience members for
performances.
Students who are connected to school are more likely to attend. Blue and Cook
(2004) report that:
Participation in school activities is an additional strategy for schools to help
students form school attachments to prevent dropping out.” A study by Davalos,
Chavez, and Guardiola (1999) examined extracurricular activity, perception of

Effect of Co-curricular courses
11
school, ethnic identification, and the association of these variables with school
retention rates among Mexican Americans and White non-Hispanics. They found
that students reporting participation in extracurricular activity were 2.3 times
more likely to be enrolled in school than were those not participating in
extracurricular activity. (p. 8)
The Virginia Department of Education (2005, p. 11) cited the Journal of School
Health, Heather Libbey (2004) indicating “specific markers for students’ sense of
connection at school:
Academic engagement. The extent to which students are motivated to learn and do well in
school.
Belonging. This includes being proud of one's school, feeling respected, being able to talk
to teachers, and feeling like school staff are interested in students.
Discipline/fairness. The extent to which students perceive the rules of the school to be
enforced fairly.
Liking for school. Whether students looked forward to going to school.
Extracurricular activities. Participation in out-of-school activities.
Student voice. This includes, for example, opportunities for students to participate in
decision making.
Peer relations. This includes the presence of friends and students' feelings of loneliness.
Safety. The extent to which students reported that they feel safe in school.
Effect of Co-curricular courses
12
Teacher support. The most common theme that emerged from the literature review, this
includes whether students feel close to or valued by teachers and school staff.”
According to Gallup (2012), “57% of students are engage in school, 27% are not
engaged and 16% are actively disengaged.” (p. 4) Gallup continues to define each of the
preceding as:
Engaged | students are highly involved with and enthusiastic about school�
Not Engaged | students are present but not involved with or enthusiastic about school
Actively Disengaged | students undermine the educational process for self and others (p. 11)
Students who participate in co-curricular courses demonstrate a higher level of
engagement in the school community. Band and choir members participate in a wide
variety of school activities from marching band to pep band. All groups represent their
school at district and state level events as well as community and school performances.
Some groups are continue their education with local and national trips to competitive
festivals.
Effect of Co-curricular courses
13
RESEARCH METHODS Research Design
This study utilizes the independent variables of Student Attendance, ACT Composite
Score and Dropout Rate as recorded by the Missouri Department of Elementary and
Secondary Education for the years 2009-10 2010-11 and 2011-12. The dependent
variables will be provided by the department of Core Data for the School District with
excel spreadsheets indicating Student Attendance, ACT Composite Score and Dropout
Rate for students enrolled in Debate, Acapella Choir, Jazz Band, Orchestra, Jazz/Show
Choir, Symphonic Band and Theatre for the years indicated above. Independent t-Tests
will be utilized to compare high school Attendance, ACT Composite and Dropout Rate
between the independent variables and the dependent variables. The results of the t-Tests
will determine if participation in the specified Co-curricular courses impacts student
outcomes for Attendance, ACT Composite and Dropout Rate.
Study Group Description This study reviews Attendance, ACT Composite and Dropout Rate of students who
participated in specified co-curricular courses within a large suburban mid-western
school district during the 2009-2010, 2010-11 and 2011-2012 school year. This
information will be compared to all high school students within this district for these
years. Although the study group dependent variables are specific to students who have
only enrolled in the specified co-curricular courses, the data provided by the Missouri
Department of Elementary and Secondary Education will include all students enrolled in
high school during those years. Therefore, the independent variables reported by the

Effect of Co-curricular courses
14
Missouri Department of Elementary and Secondary Education will include scores for
both the members and non-members of the co-curricular courses reviewed.
Data Collection and Instrumentation All data will be collected with the assistance of the school district office of Core Data
with the exception of data provided by the Missouri Department of Elementary and
Secondary Education. Data concerning specific outcomes of co-curricular courses will
be transferred to an excel spreadsheet to be incorporated into t-Tests utilizing the
VassarStats: Statistical Computation Web Site.
Statistical Analysis Methods Data from the Missouri Department of Elementary and Secondary Education has been
utilized to provide independent variables from the study school district in the areas of
Attendance, ACT Composite Score and Dropout Rate for the years of 2009-10, 2010-11
and 2011-12. The dependent variables are provided from data retrieved by the office of
core data in the study school district for the same years and research topics within
specific Co-curricular courses that include, Debate, Acapella Choir, Jazz Band,
Orchestra, Show/Jazz Choir and Symphonic Band. A series of t-Tests have been applied
to Attendance, ACT Composite Score and dropout rate comparing the District average to
averages in each Co-Curricular course for the indicated years.

Effect of Co-curricular courses
15
FINDINGS
Table 1 t-Test Analysis Results for Attendance NKC District Average & Debate
Source Mean Mean D t-test df p-value
Debate Attend (n=3) 95.26
District Attend (n=3) 92.43 2.823 6.05 4 0.0019
Note: Significant when p<=0.25
The above data table is information from the study school district comparing
differences between Attendance for students in Debate class and all high school students
in the district. The mean of attendance for Debate course students was 95.26% and the
mean of the district was 92.43%. The Mean D, or difference between the two groups,
was 2.823. The t-test result was 6.05 and the df was 4. The null hypothesis states there is
not a significant difference in attendance for students enrolled in Debate class and all
other high school courses. Since the p-value was 0.0019, and the Alpha number was set
at 0.25, the null hypothesis is rejected. Therefore, students enrolled in the co-curricular
course Debate demonstrated a significantly higher attendance rate than those not enrolled
in this course.
Table 2 t-Test Analysis Results for Attendance NKC District Average & Acapella Choir
Source Mean Mean D t-test df p-value
Acapella Attend (n=3) 95.35
District Attend (n=3) 92.43 2.92 5.44 4 0.0055
Note: Significant when p<=0.25

Effect of Co-curricular courses
16
The above data table is information from the study school district comparing
differences between Attendance for students in Acapella Choir class and all high school
students in the district. The mean of attendance for Acapella course students was 95.35%
and the mean of the district was 92.43%. The Mean D, or difference between the two
groups, was 2.92. The t-test result was 5.44 and the df was 4. The null hypothesis states
there is not a significant difference in attendance for students enrolled in Acapella class
and all other high school courses. Since the p-value was 0.0055, and the Alpha number
was set at 0.25, the null hypothesis is rejected. Therefore, students enrolled in the co-
curricular course Acapella Choir demonstrated a significantly higher attendance rate than
those not enrolled in this course.
Table 3 t-Test Analysis Results for Attendance NKC District Average & Jazz Band
Source Mean Mean D t-test df p-value
Jazz Attend (n=3) 96.70
District Attend (n=3) 92.43 4.267 12.11 4 0.00027
Note: Significant when p<=0.25
The above data table is information from the study school district comparing
differences between Attendance for students in Jazz Band class and all high school
students in the district. The mean of attendance for Jazz Band course students was
96.70% and the mean of the district was 92.43%. The Mean D, or difference between the
two groups, was 4.267. The t-test result was 12.11 and the df was 4. The null hypothesis

Effect of Co-curricular courses
17
states there is not a significant difference in attendance for students enrolled in Jazz Band
class and all other high school courses. Since the p-value was 0.00027, and the Alpha
number was set at 0.25, the null hypothesis is rejected. Therefore, students enrolled in
the co-curricular course Jazz Band demonstrated a significantly higher attendance rate
than those not enrolled in this course.
Table 4 t-Test Analysis Results for Attendance NKC District Average & Orchestra
Source Mean Mean D t-test df p-value
Orch. Attend (n=3) 96.94
District Attend (n=3) 92.43 4.51 11.15 4 0.00037
Note: Significant when p<=0.25
The above data table is information from the study school district comparing
differences between Attendance for students in Orchestra class and all high school
students in the district. The mean of attendance for Orchestra course students was 96.94%
and the mean of the district was 92.43%. The Mean D, or difference between the two
groups, was 4.51. The t-test result was 11.15 and the df was 4. The null hypothesis
states there is not a significant difference in attendance for students enrolled in Orchestra
class and all other high school courses. Since the p-value was 0.00037, and the Alpha
number was set at 0.25, the null hypothesis is rejected. Therefore, students enrolled in
the co-curricular course Orchestra demonstrated a significantly higher attendance rate
than those not enrolled in this course.

Effect of Co-curricular courses
18
Table 5 t-Test Analysis Results for Attendance NKC District Average & Show Choir
Source Mean Mean D t-test df p-value
Shw Ch. Attend (n=3) 95.34
District Attend (n=3) 92.43 2.91 4.82 4 0.00852
Note: Significant when p<=0.25
The above data table is information from the study school district comparing differences
between Attendance for students in Show/Jazz Choir class and all high school students in
the district. The mean of attendance for Show/Jazz Choir course students was 95.34%
and the mean of the district was 92.43%. The Mean D, or difference between the two
groups, was 2.91. The t-test result was 4.82 and the df was 4. The null hypothesis states
there is not a significant difference in attendance for students enrolled in Show/Jazz
Choir class and all other high school courses. Since the p-value was 0.00852, and the
Alpha number was set at 0.25, the null hypothesis is rejected. Therefore, students
enrolled in the co-curricular course Show/Jazz Choir demonstrated a significantly higher
attendance rate than those not enrolled in this course.
Table 6 t-Test Analysis Results for Attendance NKC District Average & Band
Source Mean Mean D t-test df p-value
Band Attend (n=3) 96.54
District Attend (n=3) 92.43 4.11 12.59 4 0.00023
Note: Significant when p<=0.25

Effect of Co-curricular courses
19
The above data table is information from the study school district comparing differences
between Attendance for students in Symphonic Band class and all high school students in
the district. The mean of attendance for Symphonic Band course students was 96.54%
and the mean of the district was 92.43%. The Mean D, or difference between the two
groups, was 4.11. The t-test result was 12.59 and the df was 4. The null hypothesis
states there is not a significant difference in attendance for students enrolled in
Symphonic Band class and all other high school courses. Since the p-value was 0.00023,
and the Alpha number was set at 0.25, the null hypothesis is rejected. Therefore,
students enrolled in the co-curricular course Symphonic Band demonstrated a
significantly higher attendance rate than those not enrolled in this course.
Table 7 t-Test Analysis Results for Attendance NKC District Average & Theatre
Source Mean Mean D t-test df p-value
Theatre Attend (n=3) 94.69
District Attend (n=3) 92.43 2.257 3.62 4 0.02236
Note: Significant when p<=0.25
The above data table is information from the study school district comparing differences
between Attendance for students in Theatre class and all high school students in the
district. The mean of attendance for Theatre course students was 94.69% and the mean of
the district was 92.43%. The Mean D, or difference between the two groups, was 2.257.
The t-test result was 3.62 and the df was 4. The null hypothesis states there is not a
significant difference in attendance for students enrolled in Theatre class and all other

Effect of Co-curricular courses
20
high school courses. Since the p-value was 0.02236, and the Alpha number was set at
0.25, the null hypothesis is rejected. Therefore, students enrolled in the co-curricular
course Theatre demonstrated a significantly higher attendance rate than those not enrolled
in this course.
Table 8 t-Test Analysis Results for ACT Comp. NKC District Average & Debate
Source Mean Mean D t-test df p-value
Debate ACT (n=3) 23.86
District ACT (n=3) 21.27 2.593 8.03 4 0.00130
Note: Significant when p<=0.25
The above data table is information from the study school district comparing
differences between Composite ACT scores for students in Debate class and all high
school students in the district. The mean of ACT Composite for Debate course students
was 23.86 and the mean of the district was 21.27. The Mean D, or difference between
the two groups, was 2.593. The t-test result was 8.03 and the df was 4. The null
hypothesis states there is not a significant difference in Composite ACT score for
students enrolled in Debate class and all other high school courses. Since the p-value was
0.00130, and the Alpha number was set at 0.25, the null hypothesis is rejected.
Therefore, students enrolled in the co-curricular course Debate demonstrated a
significantly higher ACT Composite score than those not enrolled in this course.

Effect of Co-curricular courses
21
Table 9 t-Test Analysis Results for ACT Comp. NKC District Average & Acapella Choir
Source Mean Mean D t-test df p-value
Acapella ACT (n=3) 22.48
District ACT (n=3) 21.27 1.217 10.29 4 0.00025
Note: Significant when p<=0.25
The above data table is information from the study school district comparing
differences between Composite ACT scores for students in Acapella Choir class and all
high school students in the district. The mean of ACT Composite for Acapella Choir
course students was 22.48 and the mean of the district was 21.27. The Mean D, or
difference between the two groups, was 1.217. The t-test result was 10.29 and the df was
4. The null hypothesis states there is not a significant difference in Composite ACT score
for students enrolled in Acapella Choir class and all other high school courses. Since the
p-value was 0.00025, and the Alpha number was set at 0.25, the null hypothesis is
rejected. Therefore, students enrolled in the co-curricular course Acapella Choir
demonstrated a significantly higher ACT Composite score than those not enrolled in this
course.
Effect of Co-curricular courses
22
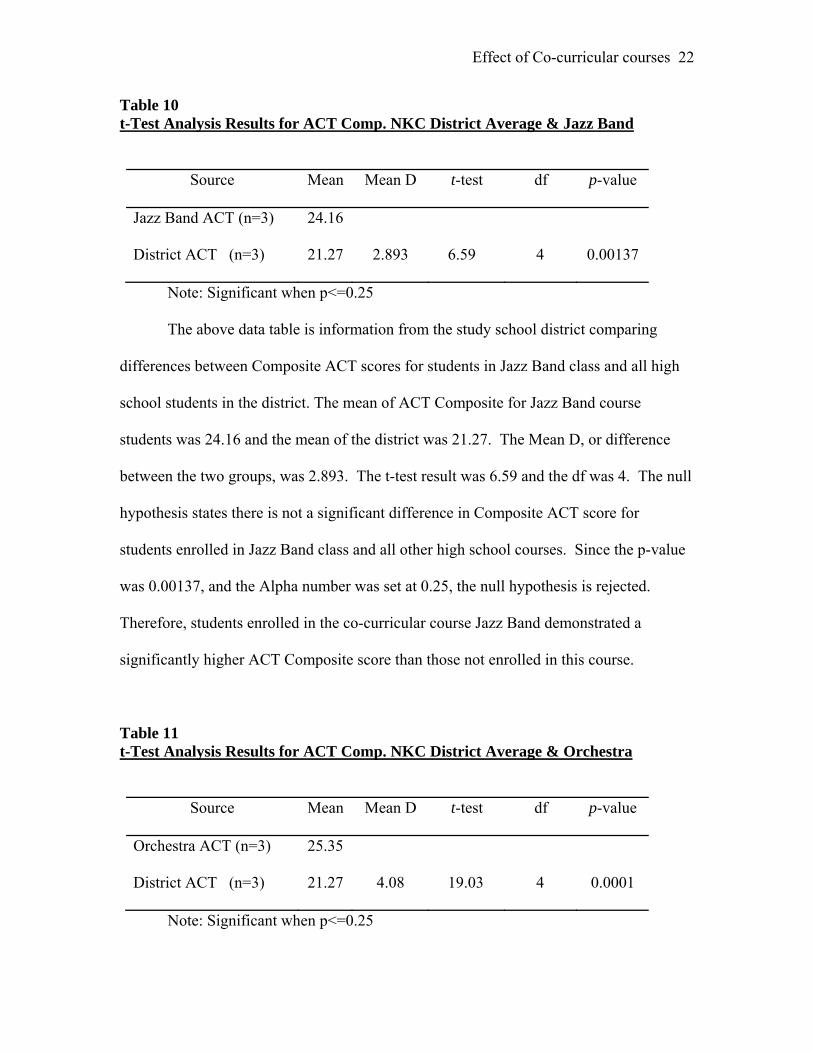
Table 10 t-Test Analysis Results for ACT Comp. NKC District Average & Jazz Band
Source Mean Mean D t-test df p-value
Jazz Band ACT (n=3) 24.16
District ACT (n=3) 21.27 2.893 6.59 4 0.00137
Note: Significant when p<=0.25
The above data table is information from the study school district comparing
differences between Composite ACT scores for students in Jazz Band class and all high
school students in the district. The mean of ACT Composite for Jazz Band course
students was 24.16 and the mean of the district was 21.27. The Mean D, or difference
between the two groups, was 2.893. The t-test result was 6.59 and the df was 4. The null
hypothesis states there is not a significant difference in Composite ACT score for
students enrolled in Jazz Band class and all other high school courses. Since the p-value
was 0.00137, and the Alpha number was set at 0.25, the null hypothesis is rejected.
Therefore, students enrolled in the co-curricular course Jazz Band demonstrated a
significantly higher ACT Composite score than those not enrolled in this course.
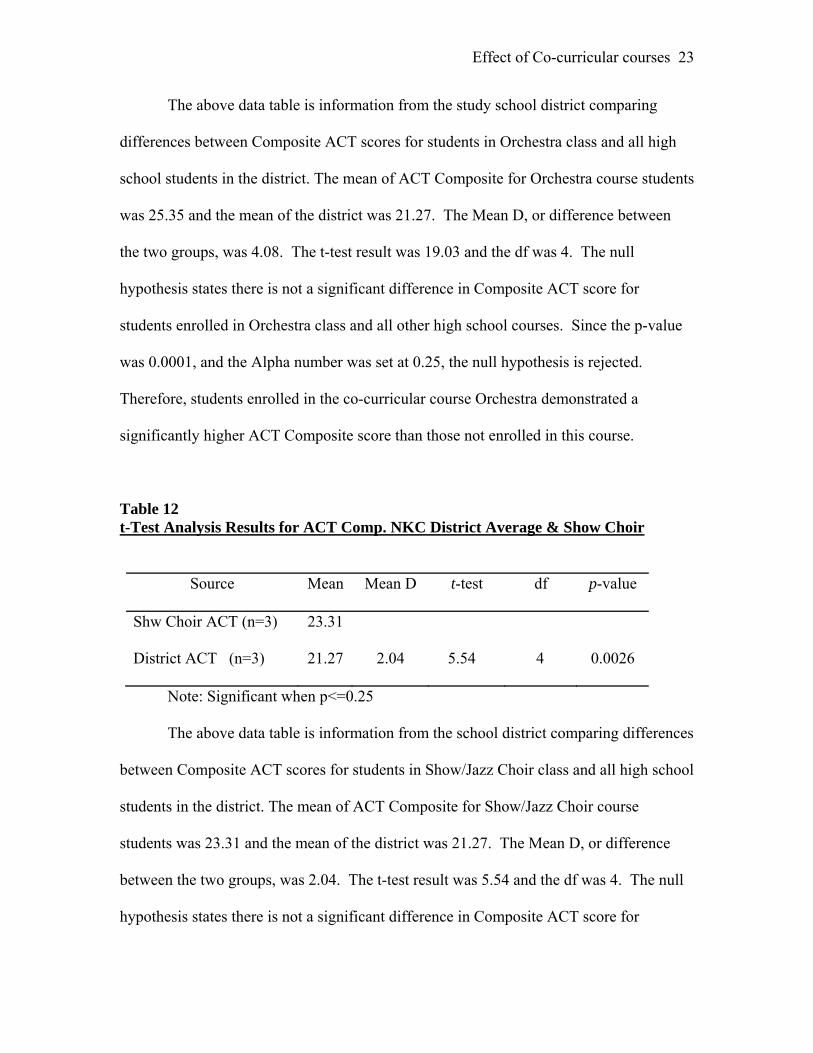
Table 11 t-Test Analysis Results for ACT Comp. NKC District Average & Orchestra
Source Mean Mean D t-test df p-value
Orchestra ACT (n=3) 25.35
District ACT (n=3) 21.27 4.08 19.03 4 0.0001
Note: Significant when p<=0.25
Effect of Co-curricular courses
23
The above data table is information from the study school district comparing
differences between Composite ACT scores for students in Orchestra class and all high
school students in the district. The mean of ACT Composite for Orchestra course students
was 25.35 and the mean of the district was 21.27. The Mean D, or difference between
the two groups, was 4.08. The t-test result was 19.03 and the df was 4. The null
hypothesis states there is not a significant difference in Composite ACT score for
students enrolled in Orchestra class and all other high school courses. Since the p-value
was 0.0001, and the Alpha number was set at 0.25, the null hypothesis is rejected.
Therefore, students enrolled in the co-curricular course Orchestra demonstrated a
significantly higher ACT Composite score than those not enrolled in this course.
Table 12 t-Test Analysis Results for ACT Comp. NKC District Average & Show Choir
Source Mean Mean D t-test df p-value
Shw Choir ACT (n=3) 23.31
District ACT (n=3) 21.27 2.04 5.54 4 0.0026
Note: Significant when p<=0.25
The above data table is information from the school district comparing differences
between Composite ACT scores for students in Show/Jazz Choir class and all high school
students in the district. The mean of ACT Composite for Show/Jazz Choir course
students was 23.31 and the mean of the district was 21.27. The Mean D, or difference
between the two groups, was 2.04. The t-test result was 5.54 and the df was 4. The null
hypothesis states there is not a significant difference in Composite ACT score for

Effect of Co-curricular courses
24
students enrolled in Show/Jazz Choir class and all other high school courses. Since the p-
value was 0.0026, and the Alpha number was set at 0.25, the null hypothesis is rejected.
Therefore, students enrolled in the co-curricular course Show/Jazz Choir demonstrated a
significantly higher ACT Composite score than those not enrolled in this course.
Table 13 t-Test Analysis Results for ACT Comp. NKC District Average & Band
Source Mean Mean D t-test df p-value
Band ACT (n=3) 23.94
District ACT (n=3) 21.27 2.67 29.69 4 0.0001
Note: Significant when p<=0.25
The above data table is information from the study school district comparing
differences between Composite ACT scores for students in Symphonic Band class and all
high school students in the district. The mean of ACT Composite for Symphonic Band
course students was 23.94 and the mean of the district was 21.27. The Mean D, or
difference between the two groups, was 2.67. The t-test result was 29.69 and the df was
4. The null hypothesis states there is not a significant difference in Composite ACT score
for students enrolled in Symphonic Band class and all other high school courses. Since
the p-value was 0.0001, and the Alpha number was set at 0.25, the null hypothesis is
rejected. Therefore, students enrolled in the co-curricular course Symphonic Band
demonstrated a significantly higher ACT Composite score than those not enrolled in this
course.

Effect of Co-curricular courses
25
Table 14 t-Test Analysis Results for ACT Comp. NKC District Average & Theatre
Source Mean Mean D t-test df p-value
Theatre ACT (n=3) 21.597
District ACT (n=3) 21.270 0.33 1.22 4 0.1627
Note: Significant when p<=0.25
The above data table is information from the study school district comparing
differences between Composite ACT scores for students in Theatre class and all high
school students in the district. The mean of ACT Composite for Theatre course students
was 21.597 and the mean of the district was 21.27. The Mean D, or difference between
the two groups, was 0.33. The t-test result was 1.12 and the df was 4. The null
hypothesis states there is not a significant difference in Composite ACT score for
students enrolled in Theatre class and all other high school courses. Since the p-value
was 0.1627, and the Alpha number was set at 0.25, the null hypothesis is rejected.
Therefore, students enrolled in the co-curricular course Theatre demonstrated a
significantly higher ACT Composite score than those not enrolled in this course.

Effect of Co-curricular courses
26
Table 15 t-Test Analysis Results for Dropout Rate NKC District Average & Debate
Source Mean Mean D t-test df p-value
Debate Drop (n=3) 0.0
District Drop (n=3) 2.833 2.833 11.79 4 0.00015
Note: Significant when p<=0.25
The above data table is information from the study school district comparing
differences between Dropout rate for students in Debate class and all high school students
in the district. The mean of Dropout rate for Debate course students was 0.00% and the
mean of the district was 2.833%. The Mean D, or difference between the two groups,
was 2.833. The t-test result was 11.79 and the df was 4. The null hypothesis states there
is not a significant difference in Dropout rate for students enrolled in Debate class and all
other high school courses. Since the p-value was 0.00015, and the Alpha number was set
at 0.25, the null hypothesis is rejected. Therefore, students enrolled in the co-curricular
course Debate demonstrated a significantly lower Dropout rate than those not enrolled in
this course.
Table 16 t-Test Analysis Results for Dropout Rate NKC District Average & Acapella
Source Mean Mean D t-test df p-value
Acapella Drop (n=3) 0.007
District Drop (n=3) 2.833 2.826 11.76 4 0.00015
Note: Significant when p<=0.25
Effect of Co-curricular courses
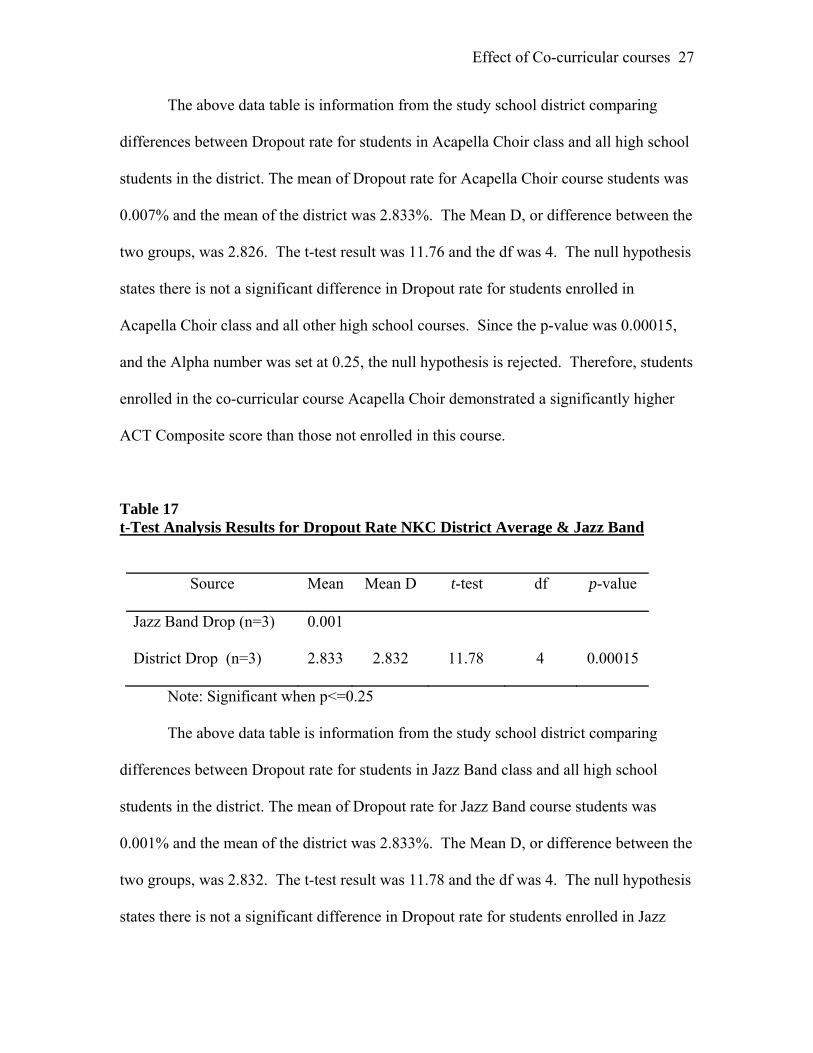
27
The above data table is information from the study school district comparing
differences between Dropout rate for students in Acapella Choir class and all high school
students in the district. The mean of Dropout rate for Acapella Choir course students was
0.007% and the mean of the district was 2.833%. The Mean D, or difference between the
two groups, was 2.826. The t-test result was 11.76 and the df was 4. The null hypothesis
states there is not a significant difference in Dropout rate for students enrolled in
Acapella Choir class and all other high school courses. Since the p-value was 0.00015,
and the Alpha number was set at 0.25, the null hypothesis is rejected. Therefore, students
enrolled in the co-curricular course Acapella Choir demonstrated a significantly higher
ACT Composite score than those not enrolled in this course.
Table 17 t-Test Analysis Results for Dropout Rate NKC District Average & Jazz Band
Source Mean Mean D t-test df p-value
Jazz Band Drop (n=3) 0.001
District Drop (n=3) 2.833 2.832 11.78 4 0.00015
Note: Significant when p<=0.25
The above data table is information from the study school district comparing
differences between Dropout rate for students in Jazz Band class and all high school
students in the district. The mean of Dropout rate for Jazz Band course students was
0.001% and the mean of the district was 2.833%. The Mean D, or difference between the
two groups, was 2.832. The t-test result was 11.78 and the df was 4. The null hypothesis
states there is not a significant difference in Dropout rate for students enrolled in Jazz

Effect of Co-curricular courses
28
Band class and all other high school courses. Since the p-value was 0.00015, and the
Alpha number was set at 0.25, the null hypothesis is rejected. Therefore, students
enrolled in the co-curricular course Jazz Band demonstrated a significantly higher ACT
Composite score than those not enrolled in this course.
Table 18 t-Test Analysis Results for Dropout Rate NKC District Average & Orchestra
Source Mean Mean D t-test df p-value
Orchestra Drop (n=3) 0.008
District Drop (n=3) 2.833 2.825 11.75 4 0.00015
Note: Significant when p<=0.25
The above data table is information from the study school district comparing
differences between Dropout rate for students in Orchestra class and all high school
students in the district. The mean of Dropout rate for Orchestra course students was
0.008% and the mean of the district was 2.833%. The Mean D, or difference between the
two groups, was 2.825. The t-test result was 11.75 and the df was 4. The null hypothesis
states there is not a significant difference in Dropout rate for students enrolled in
Orchestra class and all other high school courses. Since the p-value was 0.00015, and the
Alpha number was set at 0.25, the null hypothesis is rejected. Therefore, students
enrolled in the co-curricular course Orchestra demonstrated a significantly higher ACT
Composite score than those not enrolled in this course.

Effect of Co-curricular courses
29
Table 19 t-Test Analysis Results for Dropout Rate NKC District Average & Show Choir
Source Mean Mean D t-test df p-value
Show C. Drop (n=3) 0.00
District Drop (n=3) 2.833 2.833 11.79 4 0.00015
Note: Significant when p<=0.25
The above data table is information from the study school district comparing
differences between Dropout rate for students in Show/Jazz Choir class and all high
school students in the district. The mean of Dropout rate for Show/Jazz Choir course
students was 0.00% and the mean of the district was 2.833%. The Mean D, or difference
between the two groups, was 2.833. The t-test result was 11.79 and the df was 4. The
null hypothesis states there is not a significant difference in Dropout rate for students
enrolled in Show/Jazz Choir class and all other high school courses. Since the p-value
was 0.00015, and the Alpha number was set at 0.25, the null hypothesis is rejected.
Therefore, students enrolled in the co-curricular course Show/Jazz Choir demonstrated a
significantly higher ACT Composite score than those not enrolled in this course.
Table 20 t-Test Analysis Results for Dropout Rate NKC District Average & Band
Source Mean Mean D t-test df p-value
Band Drop (n=3) 0.01
District Drop (n=3) 2.833 2.823 11.74 4 0.00015
Note: Significant when p<=0.25

Effect of Co-curricular courses
30
The above data table is information from the study school district comparing
differences between Dropout rate for students in Symphonic Band class and all high
school students in the district. The mean of Dropout rate for Symphonic Band course
students was 0.01% and the mean of the district was 2.833%. The Mean D, or difference
between the two groups, was 2.823. The t-test result was 11.74 and the df was 4. The
null hypothesis states there is not a significant difference in Dropout rate for students
enrolled in Symphonic Band class and all other high school courses. Since the p-value
was 0.00015, and the Alpha number was set at 0.25, the null hypothesis is rejected.
Therefore, students enrolled in the co-curricular course Symphonic Band demonstrated a
significantly higher ACT Composite score than those not enrolled in this course.
Table 21 t-Test Analysis Results for Dropout Rate NKC District Average & Theatre
Source Mean Mean D t-test df p-value
Theatre Drop (n=3) 0.011
District Drop (n=3) 2.833 2.822 11.74 4 0.00015
Note: Significant when p<=0.25
The above data table is information from the study school district comparing
differences between Dropout rate for students in Theatre class and all high school
students in the district. The mean of Dropout rate for Theatre students was 0.011% and
the mean of the district was 2.833%. The Mean D, or difference between the two groups,
was 2.822. The t-test result was 11.74 and the df was 4. The null hypothesis states there
is not a significant difference in Dropout rate for students enrolled in Theatre class and all

Effect of Co-curricular courses
31
other high school courses. Since the p-value was 0.00015, and the Alpha number was set
at 0.25, the null hypothesis is rejected. Therefore, students enrolled in the co-curricular
course Theatre demonstrated a significantly higher ACT Composite score than those not
enrolled in this course.

Effect of Co-curricular courses
32
CONCLUSIONS and RECOMMENDATIONS
The data provided in each test suggests that participation in co-curricular classes
impacts students in a positive way. The literature reviewed reinforces that this
participation increases student success in school evidenced in lower student dropouts,
higher test scores and better attendance. This is an important concept for school officials
to keep in mind especially in an environment of high stakes testing that does not
specifically target these courses.
The Common Core State Standard tests will soon be part of nearly every school
vocabulary. Students will be held accountable for their knowledge in specific areas such
as math, science and communication. Limited funding will continue to be an issue and
although it may seem counterintuitive to continue supporting co-curricular courses, these
courses may be the reason that students come to school each day. These courses may
also impact the level of engagement in all coursework which students apply daily.
It is suggested that continued research be applied to the impact of co-curricular
and extra-curricular courses on student achievement and engagement. An informal
survey of teachers who either teach co-curricular courses or coach extra-curricular
activities have indicated a general drop in student participation over the past ten years. It
is suggested that research in the number of middle and high school students involved in
either extra or co-curricular activities be researched.
The original intent of this paper was to define the relationship between participation
in co-curricular courses and student dropout rate. Much of the literature indicated in the
reference section of this paper relates specifically to this topic and although there is
limited specific research data, much of the literature implies that there is a link between

Effect of Co-curricular courses
33
reduced dropout rate and student participation in co-curricular courses. Because
additional data was available, the scope of this paper has extended and the research of the
this study has extended. This paper seeks to answer several questions concerning
student participation in co-curricular classes. The tests that follow research three specific
topics: 1. The impact of co-curricular classes on student attendance. 2. The impact of
co-curricular classes on student composite ACT scores. 3. The impact of co-curricular
classes on student dropout rates.
Once important research consideration may be determining when students become
disengaged from school and why. Instinct and years of teaching would suggest that this
may occur in the middle school years indicating an increased need to find activities for
this age student to find a passion that will link them to school. The original tenants of
middle school suggest that students should utilize these years to explore a variety of
interests and engage in those that provide positive reinforcement. How many students
who drop out of school or become disengaged with learning have never found a passion
for some area of school?
Effect of Co-curricular courses
34
REFERENCES
Allan, M. (2006). Young native fiddlers: more than just making music. The Delta Kappa
Gamma Bulletin. Pg. 25-27
American Psychological Association. (2010). Facing the school dropout dilemma.
Washington, DC: Author. Retrieved at
http://www.apa.org/pi/families/resources/school�dropout�prevention.aspx
Blue, D. & Cook, J. E. (2004). High school dropouts: Can we reverse the stagnation in
school graduation? Study of High School Restructuring. V. 1, I. 2. Pg. 1-11.
Retrieved at http://www.edb.utexas.edu/hsns/HSNSbrief2.pdf
Center for Music Research. (1990). The role of the fine and performing arts in high
school dropout prevention.
Fredricks, J. (2011). Measuring student engagement in upper elementary through high
school: a description of 21 instruments. National Center for Education Evaluation
and Regional Assistance. No. 98, Retrieved at
http://www.imdetermined.org/files_resources/252/student_engagement.pdf
Gallup. (2013). Gallup student poll. Retrieved at
http://www.gallupstudentpoll.com/home.aspx
Henderson, A. and Mapp, K. (2002). A New Wave of Evidence, The impact of school,
family, and community connections on student achievement. Southwest
Educstional Development Laboratory. Retrieved from:
Effect of Co-curricular courses
35
http://www.sedl.org/connections/resources/evidence.pdf
Klesse, E. J. & D’Onofrio, J. A. (2000). The value of co-curricular activities. Principal
Leadership. Pg. 5-8
Lowry, R. (2012). VassarStats. Available free on-line at
http://vassarstats.net/
Missouri Department of Elementary and Secondary Education. (2013). Missouri
comprehensive data system. Retrieved from
http://mcds.dese.mo.gov/guidedinquiry/School%20Report%20Card/District%20Re
port%20Card.aspx
O’Brien, E. and Rollefson, M. (1995). Extracurricular participation and student
engagement. National Center for Educational Statistics. Retrieved from:
http://nces.ed.gov/pubs95/web/95741.asp
Peterson, P. E. (2010, July 6). Small schools work after all, A good study shows.
EducationNext. Retrieved at http://educationnext.org/small-schools-work-after-all-
a-good-study-shows/
Israel, D. (2009). Staying in school, Arts education and New York city high school
graduation rates. The Center for Arts Education. Retrieved at
www.caenyc.org/Staying-in-School/Arts-and-Graduation-Report
Sanders, M., Epstein, J., and Connors-Tadros, L. (1999). Family partnerships with high
schools: The parents’ perspective. Center for Research on the Education of
Students Placed at Risk. Baltimore, MD. Johns Hopkins University, Report No. 32.

Effect of Co-curricular courses
36
Retrieved from: http://www.csos.jhu.edu/crespar/techReports/Report32.pdf
Strauss, V. (2007). Cranking up graduation rates, SATs. The Washington Post.
Washingtonpost.com Retrieved from: http://www.washingtonpost.com/wp-
dyn/content/article/2007/12/16/AR2007121601763.html
Taylor, L. & Parsons, J. (2011). Improving Student Engagement. Current Issues in
Education, 14(1). Retrieved from: http: //cie.asu.edu/
Virginia Department of Education. (2005). Improving school attendance: A resource
guide for Virginia schools. Retrieved at
http://www.doe.virginia.gov/support/prevention/dropout_truancy/improving_school
_attendance.pdf
Wilson, N. (2009). Impact of extracurricular activities on students. (Masters Thesis)
Retrieved from: http://www2.uwstout.edu/content/lib/thesis/2009/2009wilsonn.pdf
Yazzie-Mintz, E. (2010). Charting the path from engagement to achievement: A report on
the 2009 High School Survey of Student Engagement. Bloomington, IN: Center for
Evaluation & Education Policy. Retrieved at:
http://ceep.indiana.edu/hssse/images/HSSSE_2010_Report.pdf