a study of thai consumer behavior toward high protein
TRANSCRIPT

A STUDY OF THAI CONSUMER BEHAVIOR TOWARD
HIGH PROTEIN YOGURT DRINKS IN BANGKOK
BY
MISS UNCHAREE ONPROM
AN INDEPENDENT STUDY SUBMITTED IN
PARTIAL FULFILLMENT OF
THE REQUIREMENTS FOR THE DEGREE OF
MASTER OF SCIENCE PROGRAM IN MARKETING
(INTERNATIONAL PROGRAM)
FACULTY OF COMMERCE AND ACCOUNTANCY
THAMMASAT UNIVERSITY
ACADEMIC YEAR 2017
COPYRIGHT OF THAMMASAT UNIVERSITY
Ref. code: 25605902040848CRN

A STUDY OF THAI CONSUMER BEHAVIOR
TOWARD HIGH PROTEIN YOGURT DRINKS
IN BANGKOK
BY
MISS UNCHAREE ONPROM
AN INDEPENDENT STUDY SUBMITTED IN
PARTIAL FULFILLMENT OF
THE REQUIREMENTS FOR THE DEGREE OF
MASTER OF SCIENCE PROGRAM IN MARKETING
(INTERNATIONAL PROGRAM)
FACULTY OF COMMERCE AND ACCOUNTANCY
THAMMASAT UNIVERSITY
ACADEMIC YEAR 2017
COPYRIGHT OF THAMMASAT UNIVERSITY
Ref. code: 25605902040848CRN


(1)
Independent Study Title A STUDY OF THAI CONSUMER BEHAVIOR
TOWARD HIGH PROTEIN YOGURT DRINKS
IN BANGKOK
Author Miss Uncharee Onprom
Degree Master of Science Program in Marketing
(International Program)
Major Field/Faculty/University Faculty of Commerce and Accountancy
Thammasat University
Independent Study Advisor Professor Malcolm C. Smith, Ph.D.
Academic Year 2017
ABSTRACT
Nowadays, emergence of the health and wellness trend has changed global
lifestyles and initiated new ways of active living which have an impact on how young
adults eat and exercise. The public has become more aware of the benefits of protein
as a functional ingredient to live active and healthy lifestyles. In Thailand, the protein
trend invaded the dairy market a few years ago, mostly applied in pasteurized milk
and communicated as high protein sports drinks. Even though the shift toward high
protein yogurt drinks in Thailand presents a great opportunity for dairy product
producers, there are few studies related to high protein consumer behavior, and none
of them focus on high protein yogurt drinks.
“A Study of Thai Consumer Behavior toward High Protein Yogurt Drinks
in Bangkok” applies contemporary marketing to focus on health issues and
opportunities. There are five main study objectives. The first is to evaluate consumer
perceptions of key brands in the yogurt drinks market. The second is to identify
Ref. code: 25605902040848CRN

(2)
consumer attitudes toward high protein yogurt drinks. The third is to identify
important attributes that impact on consumer purchase decisions regarding high
protein yogurt drinks. The fourth is to identify the behavior of potential consumers of
high protein yogurt drinks, and the last is to determine the profile and segmentation
for consumers of high protein yogurt drinks.
This research utilized both exploratory and descriptive methods with
qualitative and quantitative data collection. Qualitative research included in-depth
interviews, while quantitative research was used to collect data from 300 respondents.
The quantitative research was comprised of both online and offline surveys
distributed throughout Bangkok and upcountry metropolitan cities. Target
respondents were Thai consumer who showed an intention to purchase high protein
yogurt drinks. Results were based on data collection from secondary research, in-
depth interviews, and the questionnaire survey. SPSS (Statistical Package for the
Social Sciences) was used to analyze and summarize the data which was reported as
tables, graphs and a descriptive essay.
The results validated the great opportunity to capitalize on recent increased
consumer interest in the high protein yogurt drinks in Thailand. Potential consumers
of high protein yogurt drinks were classified into five segments, derived from factor
analyses of correlated lifestyle and attitudes. The attractive consumer segments for
high protein yogurt drinks are Busy Dieters, Active Dieters and Active Explorers,
respectively. These three segments show high purchase intention toward the high
protein yogurt drinks concept. Moreover, they tend to have a higher frequency of
consumption than the other two segments and contribute more to market value.
All Findings will be beneficial for marketing managers of Thai dairy
product brands and people interested in the yogurt drinks industry to thoroughly
understand the consumer behavior and attitudes of Thai consumers regarding high
protein yogurt drinks. This will assist readers to develop effective marketing strategies
to capture the high protein trend, and also find the right marketing mix for maximum
impact of new product launches to target Thai consumers.
Ref. code: 25605902040848CRN

(3)
Keywords :Thai consumer, Bangkok, Yogurt drinks, High protein, Behavior,
purchase decision, Segmentation
Ref. code: 25605902040848CRN

(4)
ACKNOWLEDGEMENTS
The completion of this individual study could not have been possible without
the endless support from my advisor, Prof. Malcolm C. Smith. I would like to express
my sincere appreciation and gratitude on his kind, high-dedicated supervision,
continuous encouragement, and valuable recommendations. It was my great honour to
work and study under his guidance.
I would like to express my deepest thanks and sincere gratitude to all the
respondents for their time and willingness to complete the surveys that delivered the
valuable data and suggestions, which were the most significant part of this study. I
would also like to thank all the professors from all the classes of the MIM program for
imparting all the valuable knowledge which has increased my knowledge and helped
me to become a professional person. In addition, I really appreciate all of the
assistance and helpful information from the MIM Office during my two years of
studying.
Last but not least, I would like to extremely thank my family, friends and
colleagues for their understanding and encouragement throughout these tough years.
It would be impossible for me to finish this individual study without their tremendous
support.
Miss Uncharee Onprom
Ref. code: 25605902040848CRN

(5)
TABLE OF CONTENTS
Page
ABSTRACT (1)
ACKNOWLEDGEMENTS (4)
LIST OF TABLES (8)
LIST OF FIGURES (9)
CHAPTER 1 INTRODUCTION 1
1.1 Introduction to the Study 1
1.2 Objectives 2
CHAPTER 2 REVIEW OF LITERATURE 3
CHAPTER 3 RESEARCH METHODOLOGY 5
3.1 Exploratory research 5
3.1.1 Secondary data 5
3.1.2 In-depth interviews 5
3.2 Descriptive research 5
3.3 Identification of Key Variables 6
3.4 Target population 7
3.4.1 In-depth interview 7
3.4.2 Survey Questionnaires 8
3.5 Data collection plan 8
3.5.1 In-depth interview 8
3.5.2 Survey Questionnaires 9
3.6 Data Analysis 9
Ref. code: 25605902040848CRN

(6)
CHAPTER 4 RESULTS AND DISCUSSION 10
4.1 Key Results from Secondary Data 10
4.2 Key Results from In-depth Interviews 10
4.2.1 Attitude toward High Protein Products 11
4.2.2 Perception of Protein Benefit in Yogurt Drinks 11
4.2.3 Linkage of High Protein Product Benefit to 11
Product Image and Usage
4.2.4 Selection Criteria for Buying High Protein 12
Yogurt Drinks
4.3 Key Results from the Questionnaire Survey 12
4.3.1 General Profile of Respondents 12
4.3.2 Thai Consumer Perception of Key Brands in the 13
Yogurt Drinks Market
4.3.3 The Profile and Segmentation for Consumers of High 15
Protein Yogurt Drinks
4.3.4 Important Attributes that Impact on Consumer Purchase 17
Decisions Regarding High Protein Yogurt Drinks
4.3.5 Behavior of High Protein Yogurt Drinks Potential 19
Consumers
CHAPTER 5 CONCLUSIONS AND RECOMMENDATIONS 25
5.1 Research Summary 25
5.2 Recommendations 26
5.2 Limitation of the Study 28
REFERENCES 29
APPENDICES 30
APPENDIX A In-depth Interviews Questions 31
Ref. code: 25605902040848CRN

(7)
APPENDIX B Survey Questionnaire 32
APPENDIX C Socio-economics Status Scale 43
APPENDIX D Summary of Respondents Profile 44
APPENDIX E Yogurt Drink Brand Image 45
APPENDIX F Factor Analysis 46
APPENDIX G Cluster Analysis 47
APPENDIX H Level of Importance for Each Selection Criteria 50
of High Protein Yogurt Drinks
APPENDIX I High Protein Yogurt Drinks Purchase Intention 57
APPENDIX J Reason to Consume High Protein Yogurt Drinks 58
APPENDIX K Key Influence Factor to Consume High Protein 60
Yogurt Drinks
BIOGRAPHY 62
Ref. code: 25605902040848CRN

(8)
LIST OF TABLES
Tables Page
Table 4.1 Summary of Difference between Segments for Selection Criteria 17
for Buying High Protein Yogurt Drinks
Table 4.2 Summary of Results for High Protein Yogurt Drinks Top Box 17
Purchase Intention Score
Table 4.3 Summary of Results for High Protein Yogurt Drinks Willing to 18
Pay Price
Table 4.4 Summary of Results for Frequency of Potential Consumers of 18
High Protein Yogurt Drinks
Table 4.5 Summary of Results for Product Size of Potential Consumers of 19
High Protein Yogurt Drinks
Table 4.6 Summary of Results for Occasions to Imbibe High Protein Yogurt 20
Drinks
Table 4.7 Summary of Results for Distribution Channel of Potential 20
Consumers of High Protein Yogurt Drinks
Table 4.8 Summary of Difference between Segments for Reasons to 21
Consume High Protein Yogurt Drinks
Table 4.9 Summary of Difference between Segments for Key Influencers 22
to Consume High Protein Yogurt Drinks
Ref. code: 25605902040848CRN

(9)
LIST OF FIGURES
Figures Page
Figure 3.1 In-dependent and dependent Variables 6
Figure 4.1 Yogurt Drinks Brand Awareness 12
Figure 4.2 Yogurt Drinks Purchase Funnel 13
Figure 4.3 Yogurt Drinks Key Brand Image 14
Ref. code: 25605902040848CRN

1
CHAPTER 1
INTRODUCTION
1.1 Introduction to the Study
Nowadays, the emergence of the health and wellness trend has changed global
lifestyles and initiated new ways of active living which impact on how young adults
eat and exercise. The public has become more aware of the benefits of protein as a
functional ingredient to live active and healthy lifestyles. Protein boosts and maintains
muscle, helps with weight management, improves growth and development, and helps
to keep people active as they age (Cabel, 2017). Dairy products are a high quality
source of protein which also offers other food nutrients that are easier to digest into
amino acids. Many new dairy products have recently been launched which market
‘high protein’ as the key selling point (Mintel, 2017).
In Thailand, the protein trend invaded the dairy market a few years ago,
mostly applied in pasteurized milk and it was communicated as high protein sports
drinks. Dutch Mill as a market leader launched high protein products in 2017 which
targeted young adult sports consumers. However, Dutch Mill’s high protein products
comprise only 2.1% market share of total yogurt drinks (Nielsen, 2017). Thus, the
shift toward high protein yogurt drinks in Thailand presents a great opportunity for
dairy product producers to capitalize on this market trend.
This contemporary marketing topic is focused on health issues and
opportunities. The main objective is to understand the consumer behavior and attitude
of Thai consumers toward high protein yogurt drinks and the opportunities of
launching these products in Thailand. It also aims to evaluate consumer perception on
current yogurt drink brands in the market and the influencing factors toward
purchasing high protein yogurt drinks by Thai consumer. Results will be useful for
marketing managers of Thai dairy product brands to capture the trend. Finding the
right marketing mix to have an impact on new product launches targeting Thai
consumers will also be beneficial.
Ref. code: 25605902040848CRN

2
1.2 Objectives
1.2.1 To evaluate consumer perceptions of key brands in the yogurt drinks
Market.
a. To evaluate the awareness level of key brands in the yogurt drinks market.
b. To evaluate the image of key brands in the yogurt drinks market.
1.2.2 To identify consumer attitudes toward high protein yogurt drinks.
a. To identify consumer attitudes toward high protein products.
b. To demonstrate how consumers perceive the protein benefit in yogurt
drinks.
c. To identify how consumers link high protein benefit to product image.
d. To identify how consumers link high protein benefit to product usage.
1.2.3 To identify important attributes that impact on consumer purchase decisions
regarding high protein yogurt drinks.
a. To identify selection criteria for buying high protein yogurt drinks.
b. To measure the level of importance for each selection criterion to buy high
protein yogurt drinks.
c. To determine the price that consumers are willing to pay for high protein
yogurt drinks.
1.2.4 To identify the behavior of potential consumers of high protein yogurt drinks.
a. To identify the frequency and product size of potential consumers of high
protein yogurt drinks.
b. To identify occasions when potential consumers imbibe in high protein
yogurt drinks.
c. To determine the distribution channels used by potential consumers of
high protein yogurt drinks.
d. To identify the reasons and key influencing factors to consume high
protein yogurt drinks.
1.2.5 To determine the profile and segmentation for consumers of high protein
yogurt drinks according to demographics and psychographics.
Ref. code: 25605902040848CRN

3
CHAPTER 2
REVIEW OF LITERATURE
High protein ingredients in Asia were forecast to grow by 11.2% in 2017
(Mintel, 2017). This trend has become more apparent with an increase in healthy
lifestyles. The high protein product growth of 8% in South East Asia has been led by
Thailand. Existing high protein products in Thailand are often produced in a dairy
format which is perceived as a high quality source of protein and other food nutrients.
Over 60% of high protein product consumers around the world are Millennials
(people born between 1980 and 2000) because the benefits of protein match their
active and time-poor lifestyles (French, 2015).
Eating is important and helps to promote an active lifestyle. Thus, the trend of
active nutrition and high protein power continues to expand for various target
consumers, moving well beyond protein powders to dairy products and even
confectionery. Food and beverage product launches featuring high protein claims
have grown by 30% compounded annual growth rate (CAGR) from 2012 to 2016
(Innova, 2017).
The global popularity of yogurt and yogurt beverage consumption continues
to grow as people increasingly recognize the health and wellness benefits associated
with fermented dairy foods. Whey, as one type of protein in dairy products, provides
multiple nutritional, functional and cost benefits that enhance the value of all types of
yogurt products (Hugunin, 2009). These all-natural, dairy-derived ingredients
complement the flavor, texture and composition of the yogurt. In the United States,
proteins are well known as key components of training regimens for professional
athletes and gym enthusiasts.
Health-minded and weight-conscious adults are also discovering the benefits
of protein diets as part of an overall healthy, active lifestyle. Dietary guidance around
the world tends to focus on the amount of protein required to prevent nutritional
deficiencies. However, apart from quantity, the benefits of proteins for human health
can also be optimized by paying attention to protein quality as well as intake timing
Ref. code: 25605902040848CRN

4
(USDA, 2015). The key to optimizing the benefits of milk proteins involves balancing
protein intake throughout the day to maximize health and wellness benefits; 22-25
grams is an upper limit for the amount of protein that can be absorbed or used by the
body at one time.
Asian consumers are increasingly seeking specific nutritional benefits to
support their growing interest in health and active living, while demanding greater
convenience to fit urban, time-poor lifestyles (Cabel, 2017). Protein is rapidly
evolving from a ‘fitness’ to a ‘health and wellness’ ingredient as incomes rise and
people become more aware of its benefits. Although protein has long been associated
with bodybuilders and elite athletes, protein-fortified food has now expanded into the
mainstream. Dairy, in particular, is an excellent source of high quality protein and a
tremendous nutritional bundle. Consumers are increasingly seeking dairy products
from a trusted retailer and want to know their food source. They are looking for
natural ingredients, minimal additives and clean labels with a clearly stated origin.
According to the Nielsen Retail Index of Thailand (Nielsen, 2017), the yogurt
drinks market in Thailand was valued at over 9,500 million baht in August 2017,
though facing a -1.9% CARG. The market is saturated with new flavor product
launches. Dutch Mill, the category brand leader, launched a high protein Greek yogurt
drink at a premium price in June 2017 which increased total brand sales by 1.7% three
months after launch.
To summarize: (1) Research on high protein products and consumer behavior
in Thailand is limited, (2) Most of high protein products are well penetrated into the
Millennial market because their benefits match Millenials’ active time-poor lifestyle,
(3) Protein has evolved to a health and wellness ingredient that has become more
popular in dairy products and associated with fermented dairy food because it is
perceived as an all-natural source with multiple benefits, and (4) Even though protein
has long been associated with bodybuilders and elite athletes, protein-fortified food
has now expanded into the mainstream. The evidence supports the rise of high protein
products in Thailand in terms of market growth but there are no details of consumer
attitudes and criteria regarding high protein product purchase. The objective of this
study is to provide more information in these four areas.
Ref. code: 25605902040848CRN

5
CHAPTER 3
RESEARCH METHODOLOGY
3.1 Exploratory research
Exploratory research was conducted during the early stages to develop a
questionnaire for better understanding of the yogurt drinks market in Thailand
Secondary data was collected and in-depth interviews were conducted during this
stage.
3.1.1 Secondary data
Secondary data was collated from credible public sources as (1) Research
Institutes such as the National Statistic Office of Thailand, The Nielsen Company,
Euromonitor International, and Mintel Social and Lifestyle Press Center, (2)
Marketing articles and interviews including Positioning Magazine and Asia Food
Journal, and (3) CP-Meiji High Protein Milk Consumer Usage and Attitude Research
Report in 2017
3.1.2 In-depth interviews
In-depth interviews were conducted to identify deeper insights of consumer
attitudes toward high protein yogurt drinks. This helped to uncover important
attributes for purchase decisions which were generated from the interviewees’ own
words. Six respondents were selected to represent yogurt drinks consumers and non-
consumers. All respondents showed their interest in the high protein yogurt drinks
product concept. The moderator asked open-ended questions prepared in advance
(See Appendix A). The length of each in-depth interview session was approximately
20 minutes.
3.2 Descriptive research
Descriptive research was conducted using a questionnaire to gather quantitative
data, which delivered a clear picture of consumer brand perceptions, consumer
Ref. code: 25605902040848CRN

6
behavior and characteristics. Results helped to determine key factors for buying high
protein yogurt drinks and an acceptable price range for the product. Due to time
constraints, the questionnaires were distributed by convenience sampling through
online and offline channels. The questions for the questionnaire are available in
Appendix B.
3.3 Identification of Key Variables
Initial independent variables are Thai consumer demographics,
psychographics and lifestyles which lead to these follow key variables (1) Yogurt
drinks product usage and occasion that links to distribution channels used, (2) Brand
image of key brands in the yogurt drinks market that links to brand image evaluation.
(3) Attitude toward high protein products that link to perception on protein benefit in
yogurt drinks. Key independent variables that relate to dependent variables are
clarified in the diagram below.
In-dependent Variables Dependent Variables
Figure 3.1: In-dependent and dependent Variables
Ref. code: 25605902040848CRN

7
3.4 Target population
This study used in-depth interviews in the exploratory research and survey
questionnaires for the descriptive research. Convenience sampling was used for
survey questionnaires. The target respondent criteria and sample size were illustrated
below:
3.4.1 In-depth interviews
Pretest pilot: 2 persons
Sample size: 6 persons
Target: Yogurt drink consumer (4 persons)
Yogurt drink non-consumer (2 persons)
Age: 18 - 35 years-old
Gender: male and female
Area: Bangkok
SES: A, B, C+, C Household income (See Appendix C)
Sample Profile: (1) 22 years-old, female university student yogurt drinks
consumer with B household income, (2) 27 years-old, female
office worker yogurt drinks consumer with C+ household
income, (3) 34 years-old, female entrepreneur yogurt drinks
consumer with A household income, (4) 26 years-old, male
freelancer yogurt drinks consumer with B household income,
(5) 25 years-old, female office worker yogurt drinks non-
consumer with B household income, and (6) 32 years-old, male
entrepreneur yogurt drinks non-consumer with A household
income.
Remark: All respondents must show intention to high protein yogurt
drinks product concept
Ref. code: 25605902040848CRN

8
3.4.2 Survey Questionnaires
Pretest pilot: 10 persons
Sample size: 300 persons
Target: Yogurt drink consumer (200 persons)
Yogurt drink non-consumer (100 persons)
Age: 18 - 35 years-old
Gender: male and female
Area: Bangkok and Metropolitan cities in upcountry
SES: A, B, C+, C Household income (See Appendix C)
Remark: All respondents must show intention to high protein yogurt
drinks product concept
3.5 Data Collection
Data was collected for the research using convenience sampling with the
following methods.
3.5.1 In-depth interview
Recruitment: Personal connection
Method: Face to face interview and phone call
Location: At coffee shop nearby respondent’s resident
When: 17th – 24th December 2017
Duration: 15 - 20 minutes for each respondent
Ref. code: 25605902040848CRN

9
3.5.2 Survey Questionnaires
Recruitment: Research agency recruitment
Method: Distribute questionnaire survey through online and offline
channel
Location: While online questionnaires were distributed through Facebook
attached the Survey Monkey link, offline questionnaire were
distributed by agency named Researcher (Thailand) Co., Ltd.
When: 15th - 29th January 2018 (7 days)
Duration: 10-15 minutes for each respondent
3.6 Data Analysis
All the primary data from exploratory research was analyzed and described as
key findings and used to develop the survey questionnaire.
The completed survey questionnaires were analyzed by using the Statistical
Package for the Social Science (SPSS) software. The analysis methods used mean
comparison, frequency, percentage, standard deviation, factor analysis, cluster
analysis, and correlation analysis. The derived data was interpreted and shown in bar
graphs and charts based on the above research objectives. All data was used to
conduct the key findings and recommendations.
Ref. code: 25605902040848CRN

10
CHAPTER 4
RESULTS AND DISCUSSION
4.1 Key Results from Secondary Data
In 2017, the Yogurt drinks market in Thailand had a saturated market value with
0% growth due to the economic recession (Nielsen, 2017), in spite the fact that the
key brands such as Dutchmill 4in1 and Dutchmill Life Plus continued their
marketing communication and pushed in-store promotion. Dutchmill also launched a
new sub-brand in May 2017, Dutchie Greek Style, to pioneer in the high protein
yogurt drinks market , but its market share is still small when considering the total
yogurt drinks market. Yomost, a sub-brand of Foremost, the brand leader in UHT
milk, has sustained its market share by practicing everyday low price with no
marketing communication support. Meiji Bulgaria also extended its product line from
cup yogurt into yogurt drinks in February 2016 with a full launch marketing
campaign. Meiji Bulgaria’s point of differentiation is rich texture with fruit inclusion
and superior LB81 microorganism.
Thai consumers are familiar with high protein milk because the product has
been in the market since 2014 (Nielsen, 2017). Key brands of milk producers such as
Ducthmill, Meiji and Hooray have high protein milk with a variety of flavors in their
product portfolio. The main distribution channel is modern trade, especially
convenience stores. However, the high protein milk market penetration still has a
limited role in the sport nutrition territory. Therefore, there are a great opportunity to
expand user base.
4.2 Key Results from In-depth Interviews
The in-depth interviews were conducted with yogurt drink consumers and
non-consumers. The objectives were to identify consumer attitudes toward high
protein products and perceptions about protein benefits in yogurt drinks which could
give rise to selection criteria for buying high protein yogurt drinks.
Ref. code: 25605902040848CRN

11
4.2.1 Attitudes toward High Protein Products
Thai consumers link protein to three core benefits; (1) source of energy, (2)
repair body’s cells and (3) fill stomach. Adults believe high protein can help in
slowing aging and increasing longevity. However, they still need other added benefits
to balance the nutrients. Most of interviewees defined high protein as an ingredient for
an active younger group. They have a strong belief that high protein food will benefit
physical growth and development. Males tends to associate high protein products
with exercisers and muscle builders. Therefore, they link high protein products to
milk, eggs and whey-powdered protein. Females associate high protein to diet foods
such as chicken breasts, milk and plant based protein.
4.2.2 Perception of Protein Benefit in Yogurt Drinks
Dairy products are convenient sources of protein; they are easy to buy and often
ready to eat. However, eggs and fresh meat immediately spring to mind as top protein
sources. Interviewees who showed strong intention to buy high protein yogurt drinks
shared similar characteristics of an active lifestyle with concern regarding body shape.
High protein yogurt drinks are superior to other products. They have positive benefits
from microorganisms to balance the excretory system while providing refreshment and
satisfaction from both sweet and sour taste. Indulging oneself to try all the different
fruit flavors in yogurt drinks is also one of the key triggers for product trial and
increases consumption frequency.
4.2.3 Linkage of High Protein Product Benefit to Product Image and Usage
Consumers link high protein benefit to product image by expecting yogurt drink
texture to be richer than regular yogurt drinks. The product must provide a fuller
stomach feeling. Interviewees who actively exercised preferred eye-catching package
design and color with protein content clearly listed. Most interviewees expected a high
vivid package color which suggested a source of energy and active lifestyle.
Ref. code: 25605902040848CRN

12
Product usage of high protein yogurt drinks tended to be while on the go or
when out of the home. Interviewees demanded a convenient product format.
Interviewees following weight management programs tended to consume high protein
yogurt drinks instead of breakfast or dinner. Most consumers used the product as a
stomach filler between meals to give them energy and refreshment.
4.2.4 Selection Criteria for Buying High Protein Yogurt Drinks
Many selection criteria for buying high protein yogurt drinks were identified
from the in-depth interviews such as containing whey protein, high quality protein,
low fat, low sugar and convenience to buy. Quality of protein, good taste and
reasonable price were the top three important attributes. Brand of producer and other
added nutritional benefits such as excretory benefit from microorganisms were also
criteria considered. Yogurt drinks’ consumers were triggered by convenience,
reasonable price, microorganisms and variety of flavors, while yogurt drink non-
consumers were more attracted by source and quality of protein, refreshing attribute,
good taste and attractive packaging design.
4.3 Key Results from the Questionnaire Survey
4.3.1 General Profile of Respondents
Online and offline questionnaires were distributed to 300 respondents via
SurveyMonkey.com. and research agencies. The quota of target respondents was set.
The 200 respondents must be yogurt drinks consumer who consumed a yogurt drink
in the past month. The other 100 respondents must be yogurt drink non-consumers.
(See Appendix D for the general profile of respondents)
Gender: Out of the 300 respondents 72% were female.
Age: Age of respondents was 18 – 45 with 60% in the age range 21 – 35.
Ref. code: 25605902040848CRN

13
Household Income: A total of 35% of respondents had household income
from 35,001 – 50,000 baht, with 21% at 18,001 –24,000 and 20% at 24,001 –
35,000 baht.
Occupation: The top two occupations were office workers (28%) and
government officers (18%).
All respondents declared their opinions toward the high protein yogurt drinks product
concept.
4.3.2 Thai Consumer Perception of Key Brands in the Yogurt Drinks Market
4.3.2.1 Awareness Level of Key Brands in the Yogurt Drinks Market
Yogurt drinks brand awareness of each brands are shown in Figure 4.1. Dutch
Mill 4 in1 gained the highest brand awareness at 84%, followed by Yomost, Dutch
Mill Life Plus, Meiji Bulgaria, Dutchie Greek Style and Richesse with 59%, 42%,
24%, 20% and 11%, respectively.
Figure 4.1: Yogurt Drinks Brand Awareness
Ref. code: 25605902040848CRN

14
4.3.2.2 Purchase Funnel of Key Brands in the Yogurt Drinks Market
Purchase funnel scores of key brands in yogurt drink market are shown in
Figure 4.2. Dutch Mil 4 in 1, the market leader, had the highest conversion rate of
brand purchase funnel at both trial (92%) and repeat (52%) stages. Yomost also had a
competitive conversion rate compared to the market leaders. Dutch Mill Life Plus had
a lower conversion rate at both trial (70%) and repeat (28%) stages. Meiji Bulgaria
had a high trial rate (80%) but needed to improve its repeat rate (15%) which was well
below the leaders. Dutchie Greek Style and Richness needed to improve both their
trial and repeat rates.
Brand Dutch Mill 4 in 1 Yomost Dutch Mill Life Plus
Repeat
Trial
Awareness
Brand Meiji Bulgaria Dutchie Greek Style Richesse
Repeat
Trial
Awareness
Figure 4.2: Yogurt Drinks Purchase Funnel
4.3.2.3 Image of Key Brands in the Yogurt Drinks Market
Image scores of key brand in the yogurt drinks are shown in Figure 4.3. Key
brands of yogurt drinks with active marketing communication during the past year
were Dutch Mill 4 in 1, Dutchie Greek and Meiji Bulgaria. The top five selection
criteria for buying yogurt drinks were Refreshing (mean=3.89), Variety of flavor
(mean=3.72), Popular brand (mean=3.70), Rich texture (mean=3.53), and Reasonable
price (mean=3.52). Dutch Mill 4 in 1 had a superior brand image to the ideal mean
52%
92%
Ref. code: 25605902040848CRN

15
score for Variety of flavor (mean=3.97), Rich texture (mean=3.84) and Reasonable
price (mean=3.77). Dutchie Greek Style scored Rich Texture (mean=3.87), while
most Meiji Bulgaria brand image scores were lower (See Appendix E for mean scores
of yogurt drink brand images).
Figure 4.3: Yogurt Drinks Key Brand Image
4.3.3 Profiles and Segmentation for Consumers of High Protein Yogurt Drinks
Factor and cluster analyses were used to classify the segments of respondents
based on their correlated lifestyles and attitudes. Factor analysis was conducted to
reduce 11 lifestyle and attitude variables down to five factors (See Appendix F). The
five factors were Busy Worker, Explorer, Body Focus, Active, and Preventive.
Cluster analysis was applied to identify and develop lifestyle and attitude patterns.
Results were classified into five groups of high protein yogurt drink potential
consumers; Busy Dieter, Passive User, Active Dieter, Early Adopter and Active
Explorer (See Appendix G-1).
Characteristics of each segment were elaborated as follows (see Appendix G-2
for demographics profiles of the five clusters):
2.00
2.50
3.00
3.50
4.00
4.50
Ideal Dutchmill 4in1 Dutchie Greek Style Meiji Bulgaria
Ref. code: 25605902040848CRN

16
4.3.3.1 Segment 1: Busy Dieter (14% of respondents)
These are consumers who have time-poor lifestyles. They are very busy at
school or work with no time to try new things or do different activities apart from
their jobs. They have high concern for their health and want to prolong their
longevity. Therefore, when selecting food, quality is more important than price.
Weight and body shape management are their top concerns and this impacts their
eating habits.
4.3.3.2 Segment 2: Passive User (18% of respondents)
Consumers in this segment are passive people who do not have an explicit
lifestyle and attitude. Since they have a low passionate lifestyle, convenience and safe
choice are what they always look for. Therefore, products from a popular brand are
potential choices.
4.3.3.3 Segment 3: Active Dieter (19% of respondents)
Consumers who fall into this segment are active people who admit to
exercising regularly. The reason behind their active lifestyle is to manage their weight
and body shape. When selecting food, they read the label and nutrition information
before making a purchase. Definitely, quality is more important than price.
4.3.3.4 Segment 4: Early Adopter (25% of respondents)
Early Adopters are looking forward to trying new things and have many
different activities. They are advanced consumers who look for highly nutritious food
and quality is more important than price. Their reason for healthy living is to prevent
serious illness in the future. They also have some concerns over their weight and body
shape.
4.3.3.5 Segment 5: Active Explorer (24% of respondents)
Consumers classified into this segment may be time-poor but promote activity
in every aspect of their lifestyle. They exercise regularly and regard food nutrition as
Ref. code: 25605902040848CRN

17
important to live healthily and prolong longevity. At the same time, they are open to
try new things and join many different activities.
4.3.4 Important Attributes that Impact on Consumer Purchase Decisions
Regarding High Protein Yogurt Drinks
4.3.4.1 Level of Importance for Each Selection Criteria to Buy High
Protein Yogurt Drinks
Questions regarding the level of importance of selection criteria to buy high
protein yogurt drinks were based on a five-point Likert scale. One-way ANOVA was
applied to compare means of different criteria among the segments. A confidence
level of 95% was used to show a significant difference among segments.
Means of selection criteria ‘Good taste’ (F = 16.13 and p-value < 0.001) ,
‘Refreshing’ (F = 20.14 and p-value < 0.001), ‘Contains good microorganisms’ (F =
33.08 and p-value < 0.001), ‘Variety of flavors’ (F = 24.83 and p-value < 0.001),
‘Superior protein content’ (F = 20.48 and p-value < 0.001), ‘Produced by popular
brand’ (F = 46.63 and p-value < 0.001), ‘Rich texture’ (F = 22.49 and p-value <
0.001) and ‘Good package design’ (F = 4.03 and p-value = 0.003 ) were significantly
different among the five segments. (Appendix H-1 and H-2). Table 4.1 shows the
different levels of importance among the five segments.
Busy Dieters gave higher importance toward ‘Good taste’, ‘Refreshing’,
‘Contains good microorganisms’ and ‘Variety of flavors’, while Early Adopters gave
more importance toward ‘Superior protein content’ and ‘Rich texture’. ‘Produced by
popular brand’ was more important among Passive Users and Active Explorers.
‘Good package design’ was more important to Active Explorers.
Ref. code: 25605902040848CRN

18
Table 4.1: Summary of Difference between Segments for Selection Criteria for
Buying High Protein Yogurt Drinks
Selection Criteria
Total
(n=300)
5 Cluster Number of Case
Busy Dieter
(n=43)
Passive User
(n=53)
Active Dieter
(n=57)
Early Adopter
(n=76)
Active Explorer
(n=71)
Mean SD Mean SD Mean SD Mean SD Mean SD Mean SD
Convenience to buy 3.88 1.29 3.81 1.14 3.96 1.41 3.81 1.14 3.70 1.24 4.13 1.42
Good taste 3.88 1.08 4.65 0.72 3.08 1.14 3.81 1.06 3.88 1.05 4.07 0.87
Reasonable price 3.81 1.05 3.91 1.11 3.96 1.18 3.72 0.90 3.80 0.86 3.73 1.22
High Quality of
protein 3.75 1.19 4.07 1.03 3.74 1.15 3.63 1.28 3.76 1.07 3.65 1.34
Refreshing 3.71 1.13 4.65 0.72 2.96 1.19 3.30 0.94 3.80 1.13 3.93 0.90
Contains good
microorganism 3.69 1.09 4.67 0.68 2.60 0.84 3.58 1.05 3.74 1.00 3.96 0.87
Contain Whey
protein content 3.67 1.24 3.63 1.31 3.83 1.28 3.60 1.03 3.58 1.27 3.72 1.32
Variety of flavors 3.63 1.11 4.72 0.59 2.91 1.16 3.19 0.90 3.64 1.12 3.86 0.88
More functional
benefits 3.62 1.16 3.49 1.24 3.66 1.07 3.81 1.14 3.67 1.12 3.48 1.24
Superior protein
content 3.62 1.05 3.02 1.16 3.08 1.02 3.39 0.98 4.28 0.79 3.87 0.81
Produced by popular
brand 3.62 1.12 3.42 0.98 4.38 0.81 2.75 0.93 3.08 0.96 4.44 0.71
Low fat 3.57 1.17 3.37 1.22 3.62 1.10 3.56 1.25 3.75 1.05 3.45 1.26
Rich texture 3.52 1.05 2.88 0.98 2.83 0.85 3.46 1.05 4.11 0.86 3.85 0.89
Low sugar 3.43 1.11 3.21 1.15 3.28 1.13 3.54 0.95 3.59 1.04 3.42 1.27
Recommended by
friend and family 3.27 0.92 3.05 0.97 3.45 0.85 3.33 0.69 3.16 1.05 3.32 0.94
Good package
design 3.08 1.06 2.79 1.08 2.89 1.14 3.05 1.01 3.01 1.05 3.48 0.92
4.3.4.2 High Protein Yogurt Purchase Intention Score
Questions concerning the level of purchase intention score toward high protein
yogurt drinks were asked in this part. (See Appendix I for the chart of Purchase
Intention Score) Busy Dieters had the highest top box score (44.2%) followed by
Active Dieters (35.1%). However, when considering the top two box scores, Active
Explorers recorded the highest (80.3%) followed by Active Dieters and Busy Dieters.
Table 4.2 shows the different levels of purchase intention score among the five
segments.
Ref. code: 25605902040848CRN

19
Table 4.2: Summary of Results for High Protein Yogurt Drinks Top Box and
Top Two Boxes Purchase Intention Scores
Purchase Intention
Total
(n=300)
%
Busy
Dieter
(n=43)
%
Passive User
(n=53)
%
Active
Dieter
(n=57)
%
Early Adopter
(n=76)
%
Active
Explorer
(n=71)
%
Top Box 28.3 44.2 24.5 35.1 22.4 22.5
Top Two Boxes 76.3 76.7 73.6 77.2 73.7 80.3
4.3.4.3 Willingness to Pay Price for High Protein Yogurt
In this part, respondents were asked about the ‘willingness to pay’ price of
high protein yogurt drinks at size 160 ml. Results showed no significant difference of
willingness to pay price among the five segments (F = 0.51 and p-value = 0.73).
Willingness to pay price was 18.22 baht per 160 ml. Table 4.3 shows the different
levels of willingness to pay price among the five segments.
Table 4.3: Summary of Results for High Protein Yogurt Drinks Willingness to
Pay Price
Total
(n=300)
5 Cluster Number of Case
Busy Dieter
(n=43)
Passive User
(n=53)
Active Dieter
(n=57)
Early Adopter
(n=76)
Active Explorer
(n=71)
Mean SD Mean SD Mean SD Mean SD Mean SD Mean SD
Price 18.22 3.15 18.07 3.56 17.94 2.99 17.96 2.81 18.61 3.44 18.30 2.98
4.3.5 Behavior of High Protein Yogurt Drinks Potential Consumers
4.3.5.1 Frequency and Product Size of Potential Consumers of High
Protein Yogurt Drinks
Nominal questions about frequency and product size of high protein yogurt
drinks were asked in this part. Even though the result did not show significant
Ref. code: 25605902040848CRN

20
differences between the frequencies or the segments tested by using a Chi-square test,
results showed that overall frequency of consuming high protein yogurt drinks was 4
– 6 times a week (32.5%). Table 4.4 shows the different levels of frequency of
potential consumers of high protein yogurt drinks among the five segments.
Table 4.4: Results for Frequency of Potential Consumers of High Protein Yogurt
Drinks
Frequency
Total
(n=300)
5 Cluster Number of Case
Busy Dieter
(n=43)
Passive User
(n=53)
Active Dieter
(n=57)
Early Adopter
(n=76)
Active
Explorer
(n=71)
n % n % n % n % n % n %
Once a week 29 14.5% 5 16.7% 4 18.2% 6 13.0% 10 15.9% 4 10.3%
2 – 3 times a
week 57 28.5% 6 20.0% 7 31.8% 17 37.0% 17 27.0% 10 25.6%
4 – 6 times a
week 65 32.5% 14 46.7% 10 45.5% 12 26.1% 18 28.6% 11 28.2%
Everyday 39 19.5% 4 13.3% 1 4.5% 9 19.6% 15 23.8% 10 25.6%
More than
once a day 10 5.0% 1 3.3% 0 0.0% 2 4.3% 3 4.8% 4 10.3%
Even though the result did not show significant differences between the
frequencies or the segments tested by using a Chi-square test, the majority of
consumers preferred high protein yogurt drinks at 140 – 160 ml bottle size across
segments (45.5%). Table 4.5 shows the different levels of product size of potential
consumers of high protein yogurt drinks among the five segments.
Table 4.5: Product Size of Potential Consumers of High Protein Yogurt Drinks
Size
Total
(n=300)
5 Cluster Number of Case
Busy Dieter
(n=43)
Passive User
(n=53)
Active Dieter
(n=57)
Early Adopter
(n=76)
Active
Explorer
(n=71)
n % n % n % n % n % n %
80 – 120 ml. 33 16.5% 4 13.3% 4 18.2% 10 21.7% 9 14.3% 6 15.4%
140 – 200 ml 91 45.5% 17 56.7% 11 50.0% 18 39.1% 31 49.2% 14 35.9%
220 – 500 ml 53 26.5% 6 20.0% 6 27.3% 13 28.3% 16 25.4% 12 30.8%
650 – 830 ml 23 11.5% 3 10.0% 1 4.5% 5 10.9% 7 11.1% 7 17.9%
Ref. code: 25605902040848CRN

21
4.3.5.2 Occasions to Imbibe High Protein Yogurt Drinks
Questions based on a five-point scale concerning occasions to imbibe high
protein yogurt drinks were asked in this part.
The top three occasions when potential consumers imbibed high protein
yogurt drinks were: consume with or instead of breakfast (mean =3.87), consume with
or instead of dinner (mean=3.67), and consume between dinner or sleep time
(mean=3.64). Means scores are shown according to each segment in Table 4.6.
Table 4.6: Results of Occasions to Imbibe High Protein Yogurt Drinks
Occasions
Total
(n=300)
5 Cluster Number of Case
Busy Dieter
(n=43)
Passive User
(n=53)
Active Dieter
(n=57)
Early Adopter
(n=76)
Active
Explorer
(n=71)
Mean SD Mean SD Mean SD Mean SD Mean SD Mean SD
Consume
with/instead of
breakfast
3.87 1.13 4.72 0.63 2.72 1.01 3.91 1.15 3.89 1.03 4.15 0.86
Consume
with/instead of
dinner
3.67 1.09 3.23 1.11 3.28 1.29 3.58 1.05 4.11 0.97 3.83 0.88
Consume between
dinner/sleep time 3.64 1.06 3.02 1.16 3.17 1.07 3.32 0.95 4.24 0.80 3.72 0.84
Consume between
breakfast/lunch 3.63 1.12 4.72 0.59 2.91 1.16 3.16 0.90 3.64 1.12 3.86 0.88
Consume during
exercise 3.57 0.83 3.58 0.73 3.85 0.84 3.26 0.79 3.32 0.87 3.86 0.70
Consume Before
exercise 3.48 0.95 3.91 1.09 3.23 1.07 3.63 0.82 3.49 0.86 3.28 0.88
Consume
with/instead of
lunch
3.46 0.99 3.35 1.25 3.36 0.98 3.51 0.85 3.51 0.95 3.49 1.00
Consume after
exercise 3.45 0.89 3.37 0.72 3.64 0.83 3.23 1.02 3.46 0.96 3.52 0.79
Consume between
lunch/dinner 3.20 0.99 3.07 0.94 3.45 0.75 3.26 1.08 3.09 1.13 3.14 0.95
Ref. code: 25605902040848CRN

22
4.3.5.3 Distribution Channels Used by Potential Consumers of High
Protein Yogurt Drinks
Questions based on a five-point scale regarding distribution channels used by
potential consumers of high protein yogurt drinks were asked in this part.
A one-way ANOVA did not show any significant differences between the
segments. The top distribution channel was convenience store (mean=3.59) followed
by mom and pop shop (mean=3.53), super/hypermarket (mean=3.34) and direct sales
(mean=3.25), respectively. Mean scores are shown according to each segment in
Table 4.7.
Table 4.7: Distribution Channels of Potential Consumers of High Protein Yogurt
Drinks
Channel
Total
(n=300)
5 Cluster Number of Case
Busy Dieter
(n=43)
Passive User
(n=53)
Active Dieter
(n=57)
Early Adopter
(n=76)
Active
Explorer
(n=71)
Mean SD Mean SD Mean SD Mean SD Mean SD Mean SD
Convenience
store 3.59 1.02 3.83 1.05 3.18 1.10 3.48 1.05 3.57 1.00 3.79 0.92
Mom and Pop
shop 3.53 1.18 2.93 1.14 2.41 1.05 4.28 0.89 3.37 1.08 3.97 0.93
Super/
Hypermarket 3.34 1.18 2.87 1.14 2.86 1.25 3.91 1.15 3.13 1.08 3.64 1.06
Direct Sales 3.25 1.16 2.83 1.26 2.68 1.04 4.11 0.92 2.57 0.78 3.97 0.84
4.3.5.4 Reasons and Key Influencing Factors for Consumption of High
Protein Yogurt Drinks
(1) Reasons for Consumption of High Protein Yogurt Drinks
Questions based on a five-point scale concerning reasons to consume
high protein yogurt drinks were asked in this part. The top three reasons were
‘Slow aging and longevity’ (mean=3.88), ‘Help maintain strong bones’
(mean=3.76) and ‘Boost up energy’ (mean=3.59), respectively.
Ref. code: 25605902040848CRN

23
Reasons to consume high protein yogurt drinks as ‘Repair body cells’
(F = 5.01, p-value = 0.001) and ‘Help with weight management’ (F = 3.94, p-
value = 0.004) were significantly different among the five segments.
Compared to the other segments, repair body cells had more impact in terms
of reason to consume high protein yogurt drinks for Active Explorers. Active
Dieters rated help with weight management as the key reason compared to the
other segments (Appendix J-1 and J-2). Mean scores are shown according to
each segment in Table 4.8.
Table 4.8: Difference between Segments for Reasons to Consume High Protein
Yogurt Drinks
Total
(n=300)
5 Cluster Number of Case
Busy Dieter
(n=43)
Passive User
(n=53)
Active Dieter
(n=57)
Early Adopter
(n=76)
Active Explorer
(n=71)
Mean SD Mean SD Mean SD Mean SD Mean SD Mean SD
Slow aging and
longevity 3.88 1.29 3.81 1.14 3.96 1.41 3.81 1.14 3.70 1.24 4.13 1.42
Help maintain
strong bone 3.76 0.97 3.79 1.04 3.85 1.17 3.65 0.83 3.70 0.77 3.82 1.09
Boost up energy 3.59 1.14 3.63 1.13 3.30 1.22 3.39 1.18 3.80 0.98 3.72 1.17
Fill stomach 3.43 1.11 3.21 1.15 3.28 1.13 3.54 0.95 3.59 1.04 3.42 1.27
Boosts and
maintains
muscle
3.41 1.03 3.56 1.01 3.42 1.10 3.33 0.99 3.42 1.06 3.37 1.00
Repair body’s
cells 3.38 0.79 3.30 0.99 3.06 0.79 3.32 0.76 3.45 0.77 3.66 0.61
Improves
growth and
development
3.27 0.92 3.05 0.97 3.45 0.85 3.35 0.74 3.17 1.04 3.32 0.94
Helps with
weight
management
3.08 1.06 2.79 1.08 2.89 1.14 3.48 0.92 3.03 1.05 3.07 1.05
(2) Key Influencers to Consume High Protein Yogurt Drinks
Questions were asked based on a five-point scale concerning key
influencers to consume high protein yogurt drinks. The top three key
influences were ‘Review from social media or internet’ (mean=3.80), ‘Sales
promotion’ (mean=3.77) and ‘Received free sampling’ (mean=3.68),
respectively.
Ref. code: 25605902040848CRN

24
Mean values of key influencers to consume high protein yogurt drinks
for ‘Received free sampling’ (F = 8.12, p-value < 0.001) and ‘See products on
shelves’ (F = 6.63, p-value < 0.001) were significantly different among the
five segments (Appendix K-1 and K-2). Compared to the other segments,
Early Adopters and Active Explorers were more influenced by receiving free
sampling. Passive Users and Active Explorers were influenced by seeing the
product on shelves more than the other segments. Mean scores are shown
according to each segment in Table 4.9.
Table 4.9: Difference between Segments of Key Influencers to Consume High
Protein Yogurt Drinks
Total
(n=300)
5 Cluster Number of Case
Busy Dieter
(n=43)
Passive User
(n=53)
Active Dieter
(n=57)
Early Adopter
(n=76)
Active
Explorer
(n=71)
Mean SD Mean SD Mean SD Mean SD Mean SD Mean SD
Review from
social media /
internet
3.80 1.22 3.86 1.23 3.94 1.25 3.70 1.05 3.74 1.24 3.79 1.32
Sales promotion 3.77 1.17 3.79 1.19 3.55 1.20 3.82 1.23 3.97 1.11 3.68 1.13
Received free
sampling 3.68 1.23 2.86 1.30 3.64 1.23 3.77 1.05 3.96 1.15 3.83 1.21
See products on
shelves 3.63 0.80 3.60 0.73 3.92 0.81 3.30 0.80 3.43 0.82 3.90 0.66
See
celebrity/superstar
consume it
3.56 1.04 3.65 1.07 3.34 1.14 3.42 1.08 3.75 0.95 3.59 0.98
Recommended by
family / friends 3.51 0.90 3.37 0.72 3.64 0.83 3.28 1.05 3.59 0.98 3.59 0.80
Advertising 3.25 1.13 3.19 1.22 3.11 1.09 3.23 1.15 3.36 1.15 3.28 1.08
Ref. code: 25605902040848CRN

25
CHAPTER 5
CONCLUSIONS AND RECOMMENDATIONS
5.1 Research Summary
The high protein yogurt drinks market in Thailand has a great opportunity to
capitalize on recent increased consumer interest. Key market players are young adults
who have active lifestyles. Currently, products are mainly targeted to sportsmen. High
protein yogurt drinks are superior to other high protein products in terms of
convenient product format, benefits from microorganisms and providing refreshment.
Consumers expect high protein yogurt drinks to have thicker texture than regular
yogurt drinks with fruit flavors that contribute a good refreshing taste. Product design
and marketing communication should involve vibrant colors that portray an active
lifestyle image.
Dutch Mill 4 in 1 as the brand leader had the highest market share with a healthy
purchase funnel conversion rate in both trial and repeat stages followed by Yomost,
Dutch Mill Life Plus, Meiji Bulgaria, Dutchie Greek Style and Richesse. Meiji
Bulgaria had a high trial rate as a new brand launched to the market but needed to
improve its repeat rate. Research results suggested that the top three selection criteria
for buying yogurt drinks were 1) Refreshing, 2) Has variety of flavors, and 3) Popular
brand. Comparing key brands of yogurt drinks that implemented marketing
communication during the past year, Dutch Mill 4 in1 performed best in various
attributes especially ‘Variety of flavor’, ‘Rich texture’ and ‘Reasonable price’,
exceeding scores of Meiji Bulgaria and Dutchie Greek Style.
Potential consumers of high protein yogurt drinks were classified into five
segments, derived from factor analyses of correlated lifestyle and attitude, as 1) Busy
Dieters, 2) Passive Users, 3) Active Dieters, 4) Early Adopters and 5) Active
Explorers. Each segment had a different lifestyle, behavior pattern and profile.
Top five important selection criteria for buying high protein yogurt drinks
were 1) Convenience to buy, 2) Good taste, 3) Reasonable price, 4) High quality of
Ref. code: 25605902040848CRN

26
protein, and 5) Refreshing and contains good microorganisms. Purchase intention
scores toward high protein yogurt drinks product concept were high, especially among
Active Explorers, Active Dieters and Busy Dieters. The ‘willingness to pay’ price was
not significantly different across segments with an acceptable price at 18.22 baht per
160 ml. Most frequent consumption of high protein yogurt drinks by consumers was 4
– 6 times a week. Active Explorers showed distinct selection, with more frequency
ranges than other segments. The most popular product size of high protein yogurt
drinks was 140 – 160 ml; however, Active Explorers preferred larger sizes (220 – 500
ml). Occasions to imbibe high protein yogurts drinks were mainly with or instead of
breakfast and dinner because consumers used high protein yogurt drinks as gap fillers.
Convenience stores were consumers’ first choice distribution channels followed by
mom and pop stores, super/hypermarkets and direct sales.
The top three key reasons to consume high protein yogurt drinks were 1) Slow
aging and longevity, 2) Help to maintain strong bones, and 3) Boost up energy.
Interestingly, Active Explorers significantly rated the reason, ‘repair body cells’ more
than other segments while Active Dieters rated the reason, ‘help with weight
management’ higher than others. The top three key influencing factors to consume
high protein yogurt drinks were 1) Review from social media or internet, 2) Sales
promotion, and 3) Receive free sampling. Early Adopters and Active Explores were
more influenced by receiving free sampling. Passive Users and Active Explorers were
influenced by seeing the product on shelves more than other segments.
5.2 Recommendations
Attractive consumer segments for high protein yogurt are Busy Dieters, Active
Dieters and Active Explorers, respectively. These three segments show high purchase
intention toward the high protein yogurt drinks concept. Moreover, they tend to have
a higher frequency of consumption than the other two segments and contribute more
to market value. Recommendations for these three segments are as follows.
Ref. code: 25605902040848CRN
27
5.2.1 Busy Dieters
This group has a time-poor lifestyle. Marketers should ensure product
availability in convenience stores. High protein yogurt drinks for Busy Dieters should
have good taste with a variety of flavors to indulge nutrition and provide refreshment.
Superior benefits from microorganisms are recommended as important. The right
product size is 140 – 200 ml. Consumption should be promoted at breakfast or
between breakfast and lunch. For best impact, the benefits of high protein yogurt
drinks that should be communicated are: 1) slow aging and longevity, 2) maintains
strong bones, and 3) boosts up energy. Product reviews through social media internet
channels and sales promotions would effectively induce Busy Dieters to try the
product.
5.2.2 Active Dieters
Consumers in this segment have an explicit goal of an active lifestyle to manage
their weight and body shape. To capture this segment, the product should be
communicated as an energy nutrient that helps with weight management. High protein
yogurt drinks for this segment should be convenient to buy, have good taste and offer
more functional benefit. Product size is recommended at 140 – 200 ml but smaller 80
– 120 ml size could also be considered. Consumption should be promoted at breakfast
and before exercise. Product reviews through social media internet channels,
attractive sales promotions and free sampling would effectively induce Active
Dieters to try the product.
5.2.3 Active Explorers
This segment is the most open to new products that match their active lifestyles.
To launch high protein yogurt drinks for this segment, good and attractive package
design should be leveraged. If the mother brand is strong enough, promoting a
product produced by the mother is recommended. Product size should be 140 – 200
ml but larger sizes as 220 – 500 ml could also be considered. Consumption is best
promoted at breakfast and during exercise. Product reviews through social media
Ref. code: 25605902040848CRN

28
internet channels, sales promotions, free sampling and product on shelf availability
would effectively induce Active Explores to try the product.
5.3 Limitation of the Study
The research findings cannot be generalized to represent the entire population due
to the use of convenience sampling .
Ref. code: 25605902040848CRN

29
REFERENCES
Cabel, D. (2017, August 31). Consumer trends driving huge demand for protein in
Asia. Retrieved (2017, September 27) from Asia Food Journal:
https://www.asiafoodjournal.com/2017/08/consumer-trends-driving-huge-
demand-protein-asia/
French, S. (2015, May 5). Marketing Trend in Protein. Retrieved (2017, September
27) from Global Food Forums:
https://www.globalfoodforums.com/wp-content/uploads/2015/06/2015-PTT-
Marketing-Trends-Steve-French.pdf
Hugunin, D. A. (2009). U.S. WHEY INGREDIENTS IN YOGURT AND YOGURT
BEVERAGES. In Application Monograpgh Yogurt (pp. 1-3). Arlington: U.S.
Dairy Export Council.
Innova. (2017, October 4). Retrieved (2017, September 10) from
foodengineeringmag:
https://www.foodengineeringmag.com/articles/96332-the-top-10-food-trends-
for-2017-from-innova-market-insights
Mintel. (2017, August 27). 75% OF INDONESIAN CONSUMERS AIM TO HAVE A
HEALTHIER DIET IN 2017. Retrieved (2017, September 3) from Mintel:
http://www.mintel.com/press-centre/social-and-lifestyle/healthy-lifestyles-
growing-focus-for-southeast-asians
Nielsen, A. (2017). Thailand Cultured and Drinking Yogurt Retail Index. Bangkok:
The Nielsen Company (Thailand).
Society, T. M. (2010). Standardization of Socio-Economic Status Classification
Thailand. Bangkok: Thailand Market Research Society.
USDA. (2015). Dairy Proteins for Healthy and Active Lifestyle. In Nutrition Spotlight
(pp. 5 - 8). U.S. Dairy Export Council .
Ref. code: 25605902040848CRN

30
APPENDICES
Ref. code: 25605902040848CRN

31
APPENDIX A
IN-DEPTH INTERVIEWS QUESTIONS
1. What do you think about high protein product?
2. Do you think that high protein product is popular in Thailand?
3. What are the benefits from intake high protein product?
4. How you think about protein benefit claiming?
5. When one brand launching new high protein product, what would you feel to the
brand?
6. Who is the target of high protein product? How do they consume it?
7. What are the important factors when you decide to but high protein yogurt
drinks?
8. What are your purchasing criteria in choosing high protein yogurt drinks?
9. Regarding to high protein yogurt drinks product concept, how much will you
willing to pay for it?
Ref. code: 25605902040848CRN

32
APPENDIX B
SURVEY QUESTIONAIRE
Section A: General behaviors and brand perception
Q1. Have you consume any yogurt drinks, in the past 1 month?
(1) ◯ Yes, I consume yogurt drinks.
(2) ◯ No, I did not consume any yogurt drinks. [If selected this choice, please
go to question 9]
Q2. On average, how frequent do you consume yogurt drinks?
(1) ◯ Once a week. (4) ◯ Everyday
(2) ◯ 2 – 3 times a week . (5) ◯ More than once a day
(3) ◯ 4 – 6 times a week
Q3. What size of yogurt drinks do you normally consume?
(1) ◯ 80 – 120 ml. (3) ◯ 220 – 500 ml.
(2) ◯ 140 – 200 ml. . (4) ◯ 650 – 830 ml.
Q4. From the following list, which brand of yogurt drinks are you aware of? (Check
all that
apply)
(1) Dutch Mill 4in1 (4) Meiji Bulgaria
(2) Dutch Mil Life
Plus
(5) Richesse
(3) Dutchie Greek (6) Yomost
Ref. code: 25605902040848CRN

33
Q5. From the following yogurt drinks band lists, how often do you consume in the
past 1 month? (Check all that apply)
Brand Never (1)
Rarely (2)
Sometimes (3)
Often (4)
Always (5)
(1) Dutch Mill 4in1 ◯ ◯ ◯ ◯ ◯
(2) Dutch Mil Life
Plus ◯ ◯ ◯ ◯ ◯
(3) Dutchie Greek ◯ ◯ ◯ ◯ ◯
(4) Meiji Bulgaria ◯ ◯ ◯ ◯ ◯
(5) Yomost ◯ ◯ ◯ ◯ ◯
(6) Richesse ◯ ◯ ◯ ◯ ◯
Q6. How often do you buy yogurt drinks at the following types of retail outlets?
(Check all that apply)
Place Never (1)
Rarely (2)
Sometimes (3)
Often (4)
Always (5)
(1) Convenience store ◯ ◯ ◯ ◯ ◯
(2) Super/Hypermarket ◯ ◯ ◯ ◯ ◯
(3) Direct Sales ◯ ◯ ◯ ◯ ◯
(4) Small store/Mom and Pop
shop ◯ ◯ ◯ ◯ ◯
Q7. In the table below, please rate your level of importance on each selection criteria
for buying yogurt drinks. (Rank from Not important to Very important)
Attribute Not
Important (1)
Slightly
Important (2)
Moderately
Important (3)
Important
(4)
Very
Important (5)
(1) Rich texture ◯ ◯ ◯ ◯ ◯
Ref. code: 25605902040848CRN

34
(2) Good taste ◯ ◯ ◯ ◯ ◯
(3) Refreshing ◯ ◯ ◯ ◯ ◯
(4) Contains good
microorganism ◯ ◯ ◯ ◯ ◯
(5) Variety of
flavor ◯ ◯ ◯ ◯ ◯
(6) Product has
higher health
benefits than
other brands
◯ ◯ ◯ ◯ ◯
(7) Convenience to
buy ◯ ◯ ◯ ◯ ◯
(8) Reasonable
price ◯ ◯ ◯ ◯ ◯
(9) Continuous
innovative
product
development
◯ ◯ ◯ ◯ ◯
(10) Brand most
suitable for me ◯ ◯ ◯ ◯ ◯
(11) Popular brand ◯ ◯ ◯ ◯ ◯
(12) Have expertise
in yogurt drinks ◯ ◯ ◯ ◯ ◯
(13) Recommended
by friend and
family ◯ ◯ ◯ ◯ ◯
(14) Good package
design ◯ ◯ ◯ ◯ ◯
8. In the table below, there are statements which describe attribute of yogurt drinks.
Please circle the score for each attribute of each brand.
Ref. code: 25605902040848CRN

35
(1 = Strongly disagree, 2 = Disagree, 3 = Neutral, 4 = Agree, 5 = Strongly
agree) Notice: According to the question number 6, please SKIP the brand which you
are not aware of.
Attribute Dutch Mill 4in1 Dutchie Greek Meiji Bulgaria
(1) Rich texture 1 2 3 4 5 1 2 3 4 5 1 2 3 4 5
(2) Good taste 1 2 3 4 5 1 2 3 4 5 1 2 3 4 5
(3) Refreshing 1 2 3 4 5 1 2 3 4 5 1 2 3 4 5
(4) Contains good
microorganism
1 2 3 4 5 1 2 3 4 5 1 2 3 4 5
(5) Variety of flavors 1 2 3 4 5 1 2 3 4 5 1 2 3 4 5
(6) Product has higher
health benefits than
other brands
1 2 3 4 5 1 2 3 4 5 1 2 3 4 5
(7) Convenience to buy 1 2 3 4 5 1 2 3 4 5 1 2 3 4 5
(8) Reasonable price 1 2 3 4 5 1 2 3 4 5 1 2 3 4 5
(9) Continuous innovative
product development
1 2 3 4 5 1 2 3 4 5 1 2 3 4 5
(10) Brand most suitable for
me
1 2 3 4 5 1 2 3 4 5 1 2 3 4 5
(11) Popular brand 1 2 3 4 5 1 2 3 4 5 1 2 3 4 5
(12) Have expertise in yogurt
drinks
1 2 3 4 5 1 2 3 4 5 1 2 3 4 5
(13) Recommended by friend
and family
1 2 3 4 5 1 2 3 4 5 1 2 3 4 5
(14) Good package design 1 2 3 4 5 1 2 3 4 5 1 2 3 4 5
Ref. code: 25605902040848CRN

36
Section B: High protein yogurt drinks evaluation
9. In the table below, please rate your level of importance on each selection criteria
for buying high protein yogurt drinks. (Rank from Not important to Very important)
Attribute Not
Important (1)
Slightly
Important (2)
Moderately
Important (3)
Important
(4)
Very
Important (5)
(1) Superior protein
content ◯ ◯ ◯ ◯ ◯
(2) Rich texture ◯ ◯ ◯ ◯ ◯
(3) Good taste ◯ ◯ ◯ ◯ ◯
(4) Refreshing ◯ ◯ ◯ ◯ ◯
(5) Contains good
microorganism ◯ ◯ ◯ ◯ ◯
(6) Variety of
flavors ◯ ◯ ◯ ◯ ◯
(7) More functional
benefits ◯ ◯ ◯ ◯ ◯
(8) Contain Whey
protein content ◯ ◯ ◯ ◯ ◯
(9) High Quality
protein ◯ ◯ ◯ ◯ ◯
(10) Low fat ◯ ◯ ◯ ◯ ◯
(11) Low sugar ◯ ◯ ◯ ◯ ◯
(12) Convenience to
buy ◯ ◯ ◯ ◯ ◯
(13) Reasonable price ◯ ◯ ◯ ◯ ◯
(11) Produced by
popular brand ◯ ◯ ◯ ◯ ◯
(12) Good package
design ◯ ◯ ◯ ◯ ◯
Ref. code: 25605902040848CRN
37
(13) Recommended
by friend and
family ◯ ◯ ◯ ◯ ◯
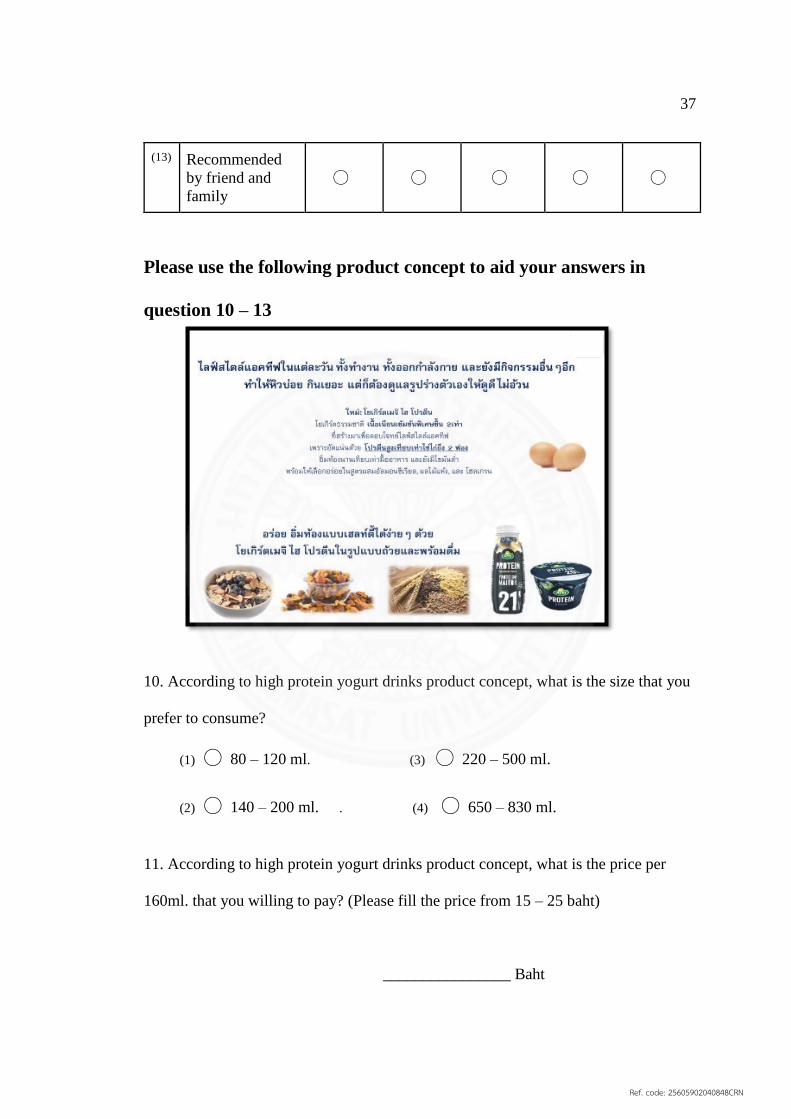
Please use the following product concept to aid your answers in
question 10 – 13
10. According to high protein yogurt drinks product concept, what is the size that you
prefer to consume?
(1) ◯ 80 – 120 ml. (3) ◯ 220 – 500 ml.
(2) ◯ 140 – 200 ml. . (4) ◯ 650 – 830 ml.
11. According to high protein yogurt drinks product concept, what is the price per
160ml. that you willing to pay? (Please fill the price from 15 – 25 baht)
________________ Baht
Ref. code: 25605902040848CRN

38
12. According to high protein yogurt drinks product concept, please rate your
purchase intention.
13. In the table below, please rate your frequency of occasion when will you consume
high protein yogurt drinks? (Rank from Not at All to Most Often)
Attribute Not at All
(1) Rarely
(2) Sometimes
(3) Often
(4)
Most
Often (5)
(1) Consume with/instead of
breakfast ◯ ◯ ◯ ◯ ◯
(2) Consume between
breakfast/lunch ◯ ◯ ◯ ◯ ◯
(3) Consume with/instead of
lunch ◯ ◯ ◯ ◯ ◯
(4) Consume between
lunch/dinner ◯ ◯ ◯ ◯ ◯
(5) Consume with/instead of
dinner ◯ ◯ ◯ ◯ ◯
(6) Consume between
dinner/sleep time ◯ ◯ ◯ ◯ ◯
(7) Consume before sleep
time ◯ ◯ ◯ ◯ ◯
(8) Consume Before
exercise ◯ ◯ ◯ ◯ ◯
(9) Consume during ◯ ◯ ◯ ◯ ◯
◯ I definitely will buy it.
◯ I probably will buy it.
◯ I am uncertain whether I will buy it.
◯ I probably will not buy it.
◯ I will not buy it.
Ref. code: 25605902040848CRN
39
exercise
(10) Consume after exercise ◯ ◯ ◯ ◯ ◯
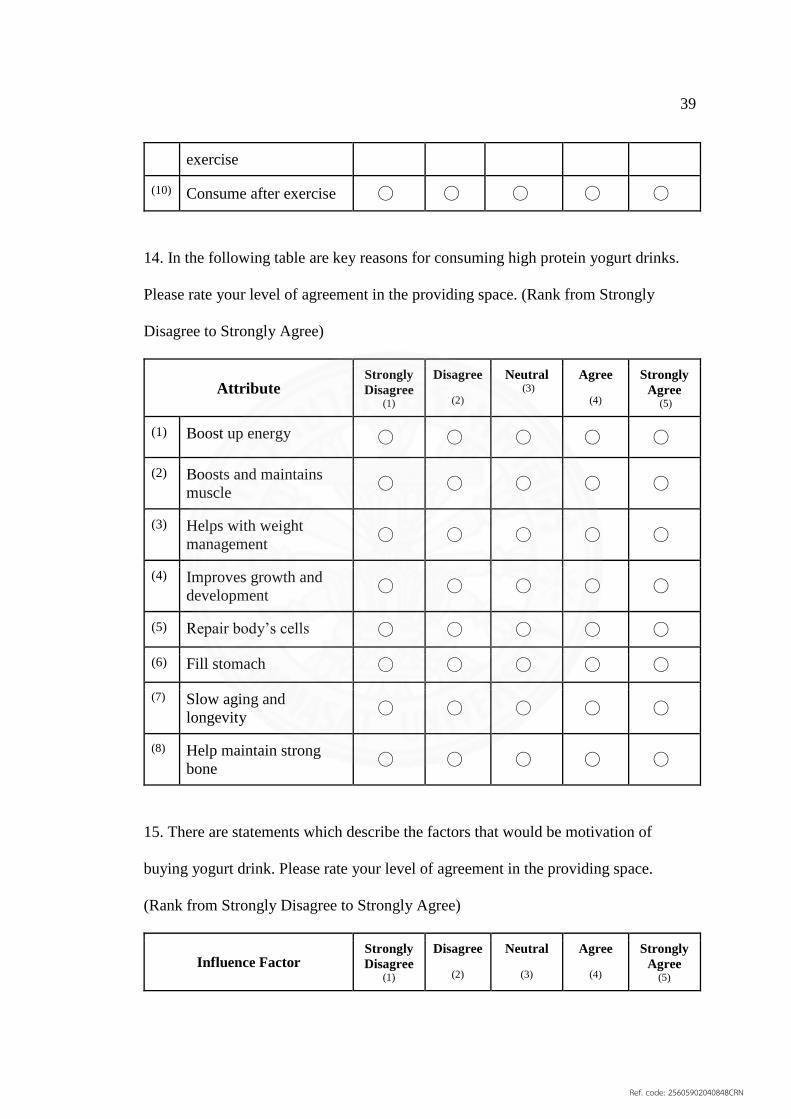
14. In the following table are key reasons for consuming high protein yogurt drinks.
Please rate your level of agreement in the providing space. (Rank from Strongly
Disagree to Strongly Agree)
Attribute Strongly
Disagree (1)
Disagree
(2)
Neutral (3)
Agree
(4)
Strongly
Agree (5)
(1) Boost up energy ◯ ◯ ◯ ◯ ◯
(2) Boosts and maintains
muscle ◯ ◯ ◯ ◯ ◯
(3) Helps with weight
management ◯ ◯ ◯ ◯ ◯
(4) Improves growth and
development ◯ ◯ ◯ ◯ ◯
(5) Repair body’s cells ◯ ◯ ◯ ◯ ◯
(6) Fill stomach ◯ ◯ ◯ ◯ ◯
(7) Slow aging and
longevity ◯ ◯ ◯ ◯ ◯
(8) Help maintain strong
bone ◯ ◯ ◯ ◯ ◯
15. There are statements which describe the factors that would be motivation of
buying yogurt drink. Please rate your level of agreement in the providing space.
(Rank from Strongly Disagree to Strongly Agree)
Influence Factor Strongly
Disagree (1)
Disagree
(2)
Neutral
(3)
Agree
(4)
Strongly
Agree (5)
Ref. code: 25605902040848CRN

40
(1) See products on
shelves ◯ ◯ ◯ ◯ ◯
(2) Recommended by
family / friends ◯ ◯ ◯ ◯ ◯
(3) Received free
sampling ◯ ◯ ◯ ◯ ◯
(4) Review from social
media / internet ◯ ◯ ◯ ◯ ◯
(5) Advertising (TVC, print, OOH, radio,
point at purchase)
◯ ◯ ◯ ◯ ◯
(6) Sales promotion ◯ ◯ ◯ ◯ ◯
(7) See celebrity/superstar
consume it ◯ ◯ ◯ ◯ ◯
Section C: Lifestyle and attitude
Q16. How often do you exercise? (Check all that apply)
Q17. How do the quotes below correlate to your lifestyle and attitude?
(Rank from Strongly Disagree to Strongly Agree)
Lifestyle & Attitude Strongly
Disagree (1)
Disagree
(2)
Neutral
(3)
Agree
(4)
Strongly
Agree (5)
(1) I like to try a new thing ◯ ◯ ◯ ◯ ◯
(2) I have a lot of different
activities ◯ ◯ ◯ ◯ ◯
(1) Everyday (5) Twice a month
(2) 5-6 times a week (6) Once a month or less
(3) 3-4 times a week (7) I do not exercise
(4) 1-2 times a week
Ref. code: 25605902040848CRN

41
(3) When selecting food,
quality is more important
than price ◯ ◯ ◯ ◯ ◯
(4) When selecting food, high
nutrient is what I look for ◯ ◯ ◯ ◯ ◯
(5) I want to be healthy to
prevent serious
illness/sickness ◯ ◯ ◯ ◯ ◯
(6) I have concerns over my
weight / body shape ◯ ◯ ◯ ◯ ◯
(7) I have concerns over my
health ◯ ◯ ◯ ◯ ◯
(8) I am busy at work/school ◯ ◯ ◯ ◯ ◯
(9) Exercising is what I do
regularly and I cannot live
without it ◯ ◯ ◯ ◯ ◯
(10) I read the label and
nutrition fact before I buy ◯ ◯ ◯ ◯ ◯
(11) I want to prolong my
longevity ◯ ◯ ◯ ◯ ◯
Section D: Demographic
Q18. What is your gender?
(1) ◯ Female
(2) ◯ Male
Q19. How old are you?
(1) ◯ 18-20 years old (4) ◯ 31-35 years old
(2) ◯ 21-25 years old (5) ◯ 36-40 years old
(3) ◯ 26-30 years old (6) ◯ 41-45 years old
Ref. code: 25605902040848CRN

42
Q20. What is your monthly household income?
Q21. What is your highest level of education completed?
Q22. What is your occupation?
(1) ◯ More than 160,000 Baht (5) ◯ 24,001 - 35,000 Baht
(2) ◯ 85,001 - 160,000 Baht (6) ◯ 18,001 - 24,000 Baht
(3) ◯ 50,001 - 85,000 Baht (7) ◯ 7,500 - 18,000 Baht
(4) ◯ 35,001 - 50,000 Baht (8) ◯ Less than 7,500 Baht
(1) ◯ Below high school (4) ◯ Bachelor degree
(2) ◯ High school (5) ◯ Graduate degree or higher
(3) ◯ College
(1) ◯ Student/University Student (4) ◯ Housewife
(2) ◯ Office worker (5) ◯ Officer
(3) ◯ Part-time/Freelancer
Ref. code: 25605902040848CRN

43
APPENDIX C
SOCIO-ECONOMICS STATUS SCALE
A table of Socio-Economics status scale in Bangkok and Urban Upcountry
(Society, 2010)
SES Bangkok
Income per household
(Baht)
Urban Upcountry
Income per household
(Baht)
A+ More than 160,001 More than 85,001
A 85,001 - 160,000 55,001 – 85,000
B 50,001 - 85,000 33,001 – 55,000
C+ 35,001 - 50,000 22,501 – 33,000
C 24,001 - 35,000 15,001 – 22,500
C- 18,001 - 24,000 10,001 – 15,000
D 7,501 - 18,000 5,001 – 10,000
E Less than 7,500 Less than 5,000
Ref. code: 25605902040848CRN

44
APPENDIX D
SUMMARY OF RESPONDENTS PROFILE (n = 300)
Demographic Frequency Percentage
Gender Female 216 72.0%
Male 84 28.0%
Age 18-20 y.o. 34 11.3%
21-25 y.o. 42 14.0%
26-30 y.o. 78 26.0%
31-35 y.o. 61 20.3%
36-40 y.o. 39 13.0%
41-45 y.o. 46 15.3%
Household
Income
More than 160,000 Baht 0 0.0%
85,001 - 160,000 Baht 21 7.0%
50,001 - 85,000 Baht 43 14.3%
35,001 - 50,000 Baht 106 35.3%
24,001 - 35,000 Baht 59 19.7%
18,001 - 24,000 Baht 64 21.3%
7,500 - 18,000 Baht 7 2.3%
Less than 7,500 Baht 0 0.0%
Highest level
of education
Below high school 26 8.7%
High school 73 24.3%
College 55 18.3%
Bachelor degree 134 44.7%
Graduate degree or higher 12 4.0%
Career Student/University Student 31 10.3%
Office Worker 83 27.7%
Part-time/Freelancer 49 16.3%
Housewife 35 11.7%
Officer 55 18.3%
Self-employed 47 15.7%
unemployed 0 0.0%
Ref. code: 25605902040848CRN

45
APPENDIX E
YOGURT DRINK BRAND IMAGE
Image towards Brand
Mean Score
Ideal Dutchmill
4in1
Dutchie
Greek Style
Meiji
Bulgaria
Refreshing 3.89 3.61 3.69 2.76
Variety of flavor 3.72 3.97 3.15 2.79
Popular brand 3.70 3.41 3.07 2.76
Rich texture 3.53 3.84 3.87 2.80
Reasonable price 3.52 3.77 3.35 2.98
Convenience to buy 3.49 4.05 3.61 3.08
Brand most suitable for me 3.47 3.44 2.83 2.70
Recommended by friend
and family 3.46 3.24 3.11 2.84
Continuous innovative
product development 3.42 4.08 3.03 2.71
Has higher health benefits
than other brands 3.35 3.81 3.93 2.22
Contains good
microorganism 3.16 3.32 3.26 2.97
Good taste 3.06 3.79 3.72 2.78
Good package design 3.06 3.52 3.10 2.82
Have expertise in yogurt
drinks 3.03 3.45 3.04 2.98
Ref. code: 25605902040848CRN

46
APPENDIX F
FACTOR ANALYSIS
Rotated Component Matrix
Correlation of lifestyle
and attitude
Component
1 2 3 4 5
I am busy at work/school .835
I have concerns over my
health .827
I want to prolong my
longevity .475 .305 .349
I like to try a new thing .878
I have a lot of different
activities .853
When selecting food,
quality is more important
than price
.831
I have concerns over my
weight / body shape .821
Exercising is what I do
regularly and I cannot live
without it
.856
I read the label and
nutrition fact before I buy .750
When selecting food, high
nutrient is what I look for .763
I want to be healthy to
prevent serious
illness/sickness
.666
Ref. code: 25605902040848CRN

47
APPENDIX G
CLUSTER ANALYSIS
APPENDIX G-1: Cluster Analysis Result
Final Cluster Center
Factor Cluster
1 2 3 4 5
Busy worker 1.11332 -.83586 -.48142 .07470 .25622
Explorer -.76110 -.62360 -.27329 .74399 .34947
Body Focus .39652 -.66640 .88660 .45716 -.94382
Active -.51286 -.70014 .93292 -.52538 .64665
Preventive -.77608 -.17252 .03557 .64810 -.12349
Ref. code: 25605902040848CRN

48
Number of Cases in each Cluster
APPENDIX G-2: Demographic Profile of Five Clusters
Demographic
5 Cluster Number of Case
Busy Diet
Passive
User
Active
Diet
Early
Adopter
Active
Explorer
n % n % n % n % n %
Gender Female 31 72% 41 77% 45 79% 49 64% 50 70%
Male 12 28% 12 23% 12 21% 27 36% 21 30%
Age 18-20 y.o. 6 14% 9 17% 7 12% 8 11% 4 6%
21-25 y.o. 5 12% 11 21% 5 9% 11 14% 10 14%
26-30 y.o. 14 33% 7 13% 14 25% 26 34% 17 24%
31-35 y.o. 7 16% 8 15% 13 23% 16 21% 17 24%
36-40 y.o. 5 12% 9 17% 5 9% 6 8% 14 20%
41-45 y.o. 6 14% 9 17% 13 23% 9 12% 9 13%
Househo
ld
Income
More than
160,000
Baht
0 0% 0 0% 0 0% 0 0% 0 0%
85,001 -
160,000
Baht
3 7% 6 11% 3 5% 8 11% 1 1%
50,001 -
85,000
Baht
3 7% 8 15% 6 11% 12 16% 14 20%
35,001 -
50,000
Baht
18 42% 14 26% 22 39% 20 26% 32 45%
24,001 -
35,000
Baht
6 14% 14 26% 11 19% 17 22% 11 15%
18,001 -
24,000
Baht
10 23% 11 21% 14 25% 16 21% 13 18%
7,500 -
18,000 3 7% 0 0% 1 2% 3 4% 0 0%
Frequency Percentage
Cluster Busy Diet 43 14%
Passive User 53 18%
Active Diet 57 19%
Early Adopter 76 25%
Active Explorer 71 24%
Valid 300 100%
Missing 0 0%
Ref. code: 25605902040848CRN

49
Baht
Less than
7,500 Baht 0 0% 0 0% 0 0% 0 0% 0 0%
Highest
level of
educatio
n
Below high
school 5 12% 1 2% 6 11% 10 13% 4 6%
High
school 10 23% 13 25% 16 28% 16 21% 18 25%
College 9 21% 8 15% 11 19% 20 26% 7 10%
Bachelor
degree 18 42% 26 49% 22 39% 29 38% 39 55%
Graduate
degree or
higher
1 2% 5 9% 2 4% 1 1% 3 4%
Career Student/Un
i Student 5 12% 9 17% 5 9% 9 12% 3 4%
Office
Worker 13 30% 17 32% 12 21% 13 17% 28 39%
Part-
time/Freela
ncer
5 12% 11 21% 8 14% 16 21% 9 13%
Housewife 4 9% 5 9% 10 18% 8 11% 8 11%
Officer 11 26% 7 13% 12 21% 16 21% 9 13%
Self-
employed 5 12% 4 8% 10 18% 14 18% 14 20%
unemploye
d 0 0% 0 0% 0 0% 0 0% 0 0%
Ref. code: 25605902040848CRN

50
APPENDIX H
LEVEL OF IMPORTANT FOR EACH SELECTION CRITERIA
TO BUY YOGURT DRINKS
APPENDIX H-1: ANOVA Table of Five Clusters and Importance for Each Selection
Criteria to Buy High Protein Yogurt Drinks
Selection Criteria for Buying
High Protein
Yogurt Drinks
Sum of
Squares df
Mean
Square F Sig.
Superior
protein content
Between
Groups 71.440 4 17.860 20.482 .000
Within Groups 257.240 295 .872
Total 328.680 299
Rich texture Between
Groups 76.396 4 19.099 22.493 .000
Within Groups 250.484 295 .849
Total 326.880 299
Good taste Between
Groups 62.755 4 15.689 16.130 .000
Within Groups 286.925 295 .973
Total 349.680 299
Refreshing Between
Groups 81.461 4 20.365 20.139 .000
Within Groups 298.309 295 1.011
Total 379.770 299
Contains good
microorganism
Between
Groups 110.161 4 27.540 33.076 .000
Within Groups 245.626 295 .833
Total 355.787 299
Variety of
flavors
Between
Groups 93.611 4 23.403 24.829 .000
Within Groups 278.056 295 .943
Total 371.667 299
Produced by
popular brand
Between
Groups 144.446 4 36.112 46.627 .000
Within Groups 228.470 295 .774
Total 372.917 299
Good package
design
Between
Groups 17.252 4 4.313 4.027 .003
Within Groups 315.984 295 1.071
Total 333.237 299
Ref. code: 25605902040848CRN

51
APPENDIX H-2: Post Hoc Test Table of Five Clusters and Importance for Each
Selection Criteria to Buy High Protein Yogurt Drinks
Depend
ent
Variabl
e
I J Mean
Differenc
e
(I-J)
Std.
Erro
r
Sig. 95% Confidence
Interval
Lower
Bound
Upper
Bound
Superior
protein
content
Busy
Diet
Passive User -.052 .192 .999 -.58 .47
Active Diet -.363 .189 .307 -.88 .15
Early Adopter -1.253* .178 .000 -1.74 -.76
Active
Explorer
-.850* .180 .000 -1.35 -.35
Passive
User
Busy Diet .052 .192 .999 -.47 .58
Active Diet -.310 .178 .410 -.80 .18
Early Adopter -1.201* .167 .000 -1.66 -.74
Active
Explorer
-.798* .170 .000 -1.26 -.33
Active
Diet
Busy Diet .363 .189 .307 -.15 .88
Passive User .310 .178 .410 -.18 .80
Early Adopter -.890* .164 .000 -1.34 -.44
Active
Explorer
-.487* .166 .029 -.94 -.03
Early
Adopter
Busy Diet 1.253* .178 .000 .76 1.74
Passive User 1.201* .167 .000 .74 1.66
Active Diet .890* .164 .000 .44 1.34
Active
Explorer
.403 .154 .070 -.02 .83
Active
Explorer
Busy Diet .850* .180 .000 .35 1.35
Passive User .798* .170 .000 .33 1.26
Active Diet .487* .166 .029 .03 .94
Early Adopter -.403 .154 .070 -.83 .02
Rich
texture
Busy
Diet
Passive User .054 .189 .999 -.47 .57
Active Diet -.572* .186 .019 -1.08 -.06
Early Adopter -1.222* .176 .000 -1.70 -.74
Active
Explorer
-.961* .178 .000 -1.45 -.47
Passive
User
Busy Diet -.054 .189 .999 -.57 .47
Active Diet -.626* .176 .004 -1.11 -.14
Early Adopter -1.275* .165 .000 -1.73 -.82
Ref. code: 25605902040848CRN
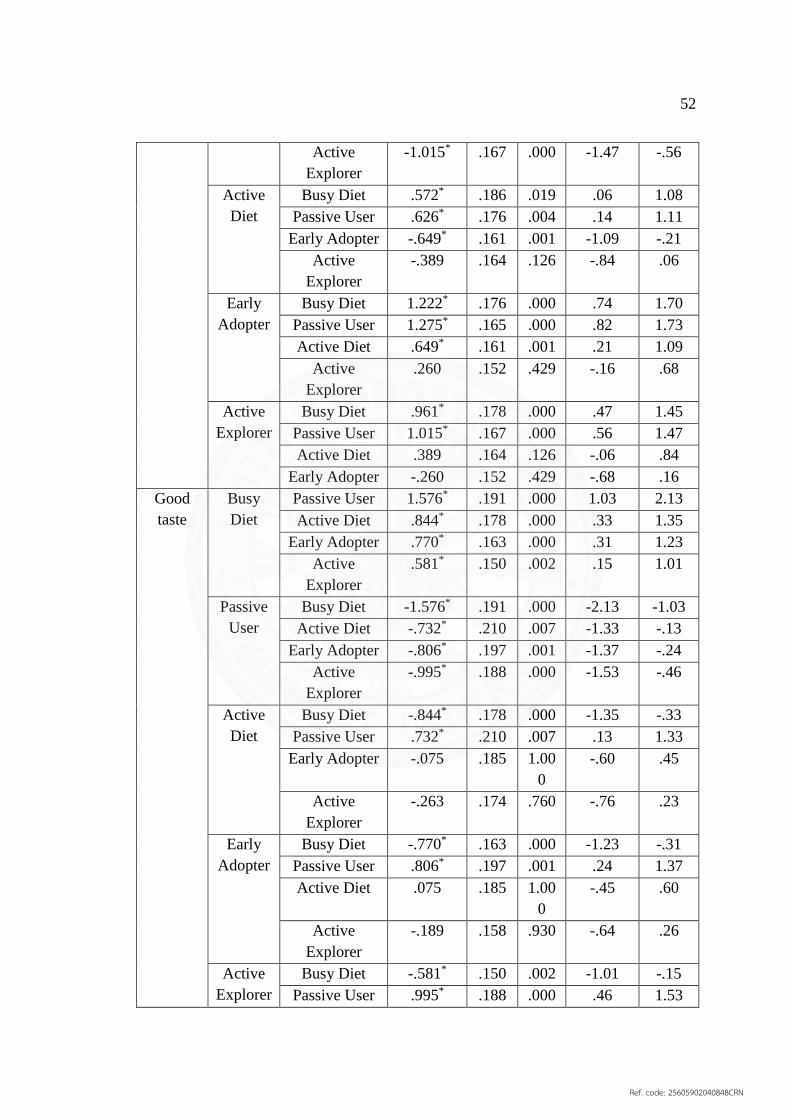
52
Active
Explorer
-1.015* .167 .000 -1.47 -.56
Active
Diet
Busy Diet .572* .186 .019 .06 1.08
Passive User .626* .176 .004 .14 1.11
Early Adopter -.649* .161 .001 -1.09 -.21
Active
Explorer
-.389 .164 .126 -.84 .06
Early
Adopter
Busy Diet 1.222* .176 .000 .74 1.70
Passive User 1.275* .165 .000 .82 1.73
Active Diet .649* .161 .001 .21 1.09
Active
Explorer
.260 .152 .429 -.16 .68
Active
Explorer
Busy Diet .961* .178 .000 .47 1.45
Passive User 1.015* .167 .000 .56 1.47
Active Diet .389 .164 .126 -.06 .84
Early Adopter -.260 .152 .429 -.68 .16
Good
taste
Busy
Diet
Passive User 1.576* .191 .000 1.03 2.13
Active Diet .844* .178 .000 .33 1.35
Early Adopter .770* .163 .000 .31 1.23
Active
Explorer
.581* .150 .002 .15 1.01
Passive
User
Busy Diet -1.576* .191 .000 -2.13 -1.03
Active Diet -.732* .210 .007 -1.33 -.13
Early Adopter -.806* .197 .001 -1.37 -.24
Active
Explorer
-.995* .188 .000 -1.53 -.46
Active
Diet
Busy Diet -.844* .178 .000 -1.35 -.33
Passive User .732* .210 .007 .13 1.33
Early Adopter -.075 .185 1.00
0
-.60 .45
Active
Explorer
-.263 .174 .760 -.76 .23
Early
Adopter
Busy Diet -.770* .163 .000 -1.23 -.31
Passive User .806* .197 .001 .24 1.37
Active Diet .075 .185 1.00
0
-.45 .60
Active
Explorer
-.189 .158 .930 -.64 .26
Active
Explorer
Busy Diet -.581* .150 .002 -1.01 -.15
Passive User .995* .188 .000 .46 1.53
Ref. code: 25605902040848CRN

53
Active Diet .263 .174 .760 -.23 .76
Early Adopter .189 .158 .930 -.26 .64
Refreshi
ng
Busy
Diet
Passive User 1.689* .197 .000 1.12 2.26
Active Diet 1.353* .166 .000 .88 1.83
Early Adopter .849* .170 .000 .36 1.33
Active
Explorer
.722* .153 .000 .28 1.16
Passive
User
Busy Diet -1.689* .197 .000 -2.26 -1.12
Active Diet -.336 .206 .675 -.93 .25
Early Adopter -.840* .209 .001 -1.44 -.24
Active
Explorer
-.967* .196 .000 -1.53 -.41
Active
Diet
Busy Diet -1.353* .166 .000 -1.83 -.88
Passive User .336 .206 .675 -.25 .93
Early Adopter -.504 .180 .058 -1.02 .01
Active
Explorer
-.631* .164 .002 -1.10 -.16
Early
Adopter
Busy Diet -.849* .170 .000 -1.33 -.36
Passive User .840* .209 .001 .24 1.44
Active Diet .504 .180 .058 -.01 1.02
Active
Explorer
-.127 .168 .998 -.60 .35
Active
Explorer
Busy Diet -.722* .153 .000 -1.16 -.28
Passive User .967* .196 .000 .41 1.53
Active Diet .631* .164 .002 .16 1.10
Early Adopter .127 .168 .998 -.35 .60
Contains
good
microor
ganism
Busy
Diet
Passive User 2.071* .155 0.00
0
1.63 2.52
Active Diet 1.095* .174 .000 .60 1.59
Early Adopter .938* .155 .000 .50 1.38
Active
Explorer
.717* .146 .000 .30 1.14
Passive
User
Busy Diet -2.071* .155 0.00
0
-2.52 -1.63
Active Diet -.975* .181 .000 -1.49 -.46
Early Adopter -1.133* .163 .000 -1.60 -.67
Active
Explorer
-1.354* .155 .000 -1.80 -.91
Active
Diet
Busy Diet -1.095* .174 .000 -1.59 -.60
Passive User .975* .181 .000 .46 1.49
Ref. code: 25605902040848CRN

54
Early Adopter -.158 .180 .992 -.67 .36
Active
Explorer
-.379 .173 .270 -.87 .12
Early
Adopter
Busy Diet -.938* .155 .000 -1.38 -.50
Passive User 1.133* .163 .000 .67 1.60
Active Diet .158 .180 .992 -.36 .67
Active
Explorer
-.221 .154 .812 -.66 .22
Active
Explorer
Busy Diet -.717* .146 .000 -1.14 -.30
Passive User 1.354* .155 .000 .91 1.80
Active Diet .379 .173 .270 -.12 .87
Early Adopter .221 .154 .812 -.22 .66
Variety
of
flavors
Busy
Diet
Passive User 1.815* .184 .000 1.29 2.34
Active Diet 1.528* .149 0.00
0
1.10 1.95
Early Adopter 1.076* .157 .000 .63 1.52
Active
Explorer
.862* .138 .000 .47 1.26
Passive
User
Busy Diet -1.815* .184 .000 -2.34 -1.29
Active Diet -.287 .199 .808 -.86 .28
Early Adopter -.739* .205 .005 -1.32 -.15
Active
Explorer
-.953* .191 .000 -1.50 -.41
Active
Diet
Busy Diet -1.528* .149 0.00
0
-1.95 -1.10
Passive User .287 .199 .808 -.28 .86
Early Adopter -.452 .174 .102 -.95 .05
Active
Explorer
-.666* .158 .000 -1.12 -.21
Early
Adopter
Busy Diet -1.076* .157 .000 -1.52 -.63
Passive User .739* .205 .005 .15 1.32
Active Diet .452 .174 .102 -.05 .95
Active
Explorer
-.214 .165 .889 -.68 .26
Active
Explorer
Busy Diet -.862* .138 .000 -1.26 -.47
Passive User .953* .191 .000 .41 1.50
Active Diet .666* .158 .000 .21 1.12
Early Adopter .214 .165 .889 -.26 .68
Produce
d by
Busy
Diet
Passive User -.959* .181 .000 -1.45 -.46
Active Diet .664* .178 .002 .18 1.15
Ref. code: 25605902040848CRN

55
popular
brand
Early Adopter .340 .168 .258 -.12 .80
Active
Explorer
-1.018* .170 .000 -1.48 -.55
Passive
User
Busy Diet .959* .181 .000 .46 1.45
Active Diet 1.623* .168 .000 1.16 2.08
Early Adopter 1.298* .157 .000 .87 1.73
Active
Explorer
-.059 .160 .996 -.50 .38
Active
Diet
Busy Diet -.664* .178 .002 -1.15 -.18
Passive User -1.623* .168 .000 -2.08 -1.16
Early Adopter -.325 .154 .221 -.75 .10
Active
Explorer
-1.682* .157 .000 -2.11 -1.25
Early
Adopter
Busy Diet -.340 .168 .258 -.80 .12
Passive User -1.298* .157 .000 -1.73 -.87
Active Diet .325 .154 .221 -.10 .75
Active
Explorer
-1.358* .145 .000 -1.76 -.96
Active
Explorer
Busy Diet 1.018* .170 .000 .55 1.48
Passive User .059 .160 .996 -.38 .50
Active Diet 1.682* .157 .000 1.25 2.11
Early Adopter 1.358* .145 .000 .96 1.76
Good
package
design
Busy
Diet
Passive User -.096 .212 .991 -.68 .49
Active Diet -.262 .209 .720 -.84 .31
Early Adopter -.222 .197 .792 -.76 .32
Active
Explorer
-.688* .200 .006 -1.24 -.14
Passive
User
Busy Diet .096 .212 .991 -.49 .68
Active Diet -.166 .197 .918 -.71 .38
Early Adopter -.126 .185 .960 -.63 .38
Active
Explorer
-.592* .188 .015 -1.11 -.08
Active
Diet
Busy Diet .262 .209 .720 -.31 .84
Passive User .166 .197 .918 -.38 .71
Early Adopter .039 .181 .999 -.46 .54
Active
Explorer
-.426 .184 .143 -.93 .08
Early
Adopter
Busy Diet .222 .197 .792 -.32 .76
Passive User .126 .185 .960 -.38 .63
Active Diet -.039 .181 .999 -.54 .46
Ref. code: 25605902040848CRN

56
Active
Explorer
-.466 .171 .053 -.93 .00
Active
Explorer
Busy Diet .688* .200 .006 .14 1.24
Passive User .592* .188 .015 .08 1.11
Active Diet .426 .184 .143 -.08 .93
Early Adopter .466 .171 .053 .00 .93
Ref. code: 25605902040848CRN

57
APPENDIX I
HIGH PROTEIN YOGURT DRINKS PURCHASE INTENTION
28.3%44.2%
24.5%35.1%
22.4% 22.5%
48.0%32.6%
49.1%42.1%
51.3% 57.7%
23.0% 23.3% 26.4% 22.8% 25.0% 18.3%
.7% 0.0% 0.0% 0.0% 1.3% 1.4%
0%
10%
20%
30%
40%
50%
60%
70%
80%
90%
100%
Total Busy Diet Passive
User
Active
Diet
Early
Adopter
Active
Explorer
Definitely would buy Probably will buy
Uncertain whether to buy probably will not buy
Ref. code: 25605902040848CRN

58
APPENDIX J
REASONS TO CONSUME HIGH PROTEIN YOGURT DRINKS
APPENDIX J-1: ANOVA Table of Five Clusters Reasons to consume High Protein
Yogurt Drinks
Sum of
Squares df
Mean
Square F Sig.
Helps with weight
management
Between Groups 17.095 4 4.274 3.942 .004
Within Groups 319.822 295 1.084
Total 336.917 299
Repair body’s
cells
Between Groups 12.024 4 3.006 5.013 .001
Within Groups 176.893 295 .600
Total 188.917 299
APPENDIX J-2: Post Hoc Test Table of Five Clusters Reasons to consume High
Protein Yogurt Drinks
I J
Mean
Differenc
e (I-J)
Std.
Erro
r Sig.
95%
Confidence
Interval
Lower
Bound
Uppe
r
Boun
d
Helps with
weight
managemen
t
Busy
Diet
Passive User -.096 .214 .992 -.68 .49
Active Diet -.279 .210 .673 -.86 .30
Early Adopter -.236 .199 .760 -.78 .31
Active
Explorer -.688* .201 .006 -1.24 -.14
Passive
User
Busy Diet .096 .214 .992 -.49 .68
Active Diet -.183 .199 .888 -.73 .36
Early Adopter -.140 .186 .945 -.65 .37
Active
Explorer -.592* .189 .016 -1.11 -.07
Active
Diet
Busy Diet .279 .210 .673 -.30 .86
Passive User .183 .199 .888 -.36 .73
Early Adopter .044 .182 .999 -.46 .54
Active
Explorer -.409 .185 .180 -.92 .10
Early Busy Diet .236 .199 .760 -.31 .78
Ref. code: 25605902040848CRN

59
Adopter Passive User .140 .186 .945 -.37 .65
Active Diet -.044 .182 .999 -.54 .46
Active
Explorer -.453 .172 .067 -.92 .02
Active
Explore
r
Busy Diet .688* .201 .006 .14 1.24
Passive User .592* .189 .016 .07 1.11
Active Diet .409 .185 .180 -.10 .92
Early Adopter .453 .172 .067 -.02 .92
Repair
body’s cells
Busy
Diet
Passive User .246 .186 .879 -.29 .78
Active Diet -.013 .181
1.00
0 -.54 .51
Early Adopter -.145 .175 .995 -.65 .36
Active
Explorer -.360 .167 .303 -.85 .13
Passive
User
Busy Diet -.246 .186 .879 -.78 .29
Active Diet -.259 .148 .583 -.68 .17
Early Adopter -.391 .141 .062 -.79 .01
Active
Explorer -.605* .131 .000 -.98 -.23
Active
Diet
Busy Diet .013 .181
1.00
0 -.51 .54
Passive User .259 .148 .583 -.17 .68
Early Adopter -.132 .134 .981 -.51 .25
Active
Explorer -.346 .124 .060 -.70 .01
Early
Adopter
Busy Diet .145 .175 .995 -.36 .65
Passive User .391 .141 .062 -.01 .79
Active Diet .132 .134 .981 -.25 .51
Active
Explorer -.215 .114 .476 -.54 .11
Active
Explore
r
Busy Diet .360 .167 .303 -.13 .85
Passive User .605* .131 .000 .23 .98
Active Diet .346 .124 .060 -.01 .70
Early Adopter .215 .114 .476 -.11 .54
Ref. code: 25605902040848CRN
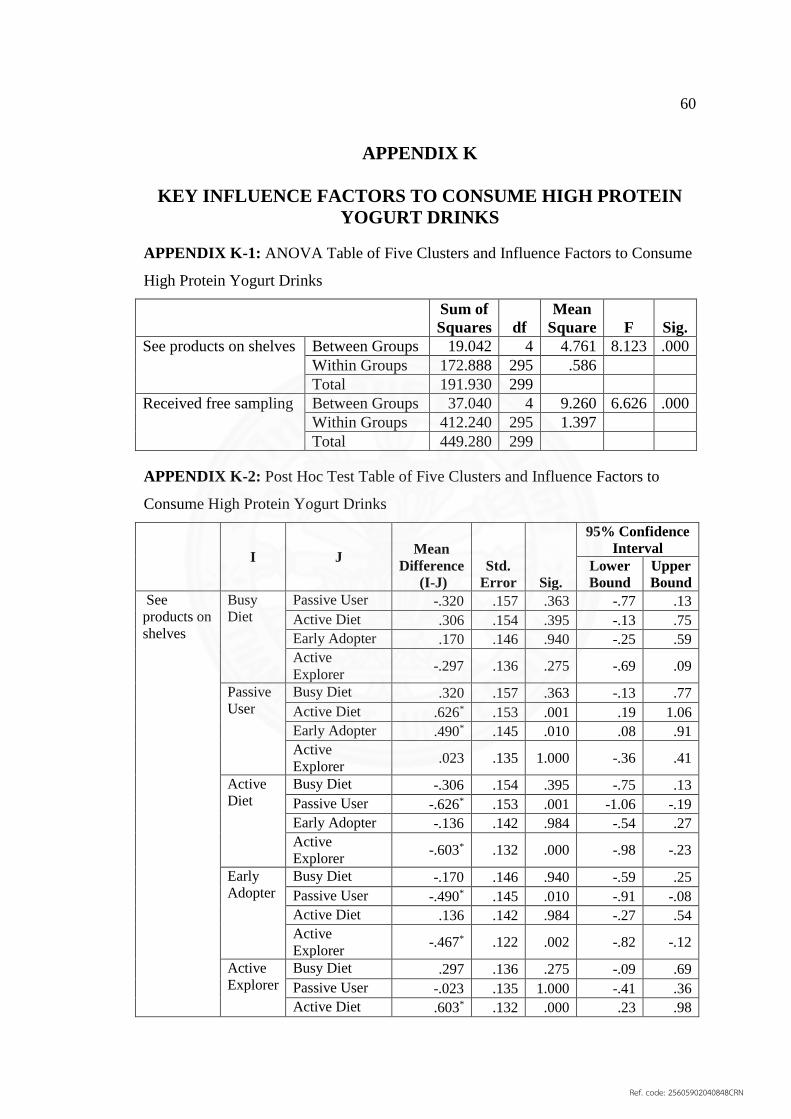
60
APPENDIX K
KEY INFLUENCE FACTORS TO CONSUME HIGH PROTEIN
YOGURT DRINKS
APPENDIX K-1: ANOVA Table of Five Clusters and Influence Factors to Consume
High Protein Yogurt Drinks
Sum of
Squares df
Mean
Square F Sig.
See products on shelves Between Groups 19.042 4 4.761 8.123 .000
Within Groups 172.888 295 .586
Total 191.930 299
Received free sampling Between Groups 37.040 4 9.260 6.626 .000
Within Groups 412.240 295 1.397
Total 449.280 299
APPENDIX K-2: Post Hoc Test Table of Five Clusters and Influence Factors to
Consume High Protein Yogurt Drinks
I J
Mean
Difference
(I-J)
Std.
Error Sig.
95% Confidence
Interval
Lower
Bound
Upper
Bound
See
products on
shelves
Busy
Diet
Passive User -.320 .157 .363 -.77 .13
Active Diet .306 .154 .395 -.13 .75
Early Adopter .170 .146 .940 -.25 .59
Active
Explorer -.297 .136 .275 -.69 .09
Passive
User
Busy Diet .320 .157 .363 -.13 .77
Active Diet .626* .153 .001 .19 1.06
Early Adopter .490* .145 .010 .08 .91
Active
Explorer .023 .135 1.000 -.36 .41
Active
Diet
Busy Diet -.306 .154 .395 -.75 .13
Passive User -.626* .153 .001 -1.06 -.19
Early Adopter -.136 .142 .984 -.54 .27
Active
Explorer -.603* .132 .000 -.98 -.23
Early
Adopter
Busy Diet -.170 .146 .940 -.59 .25
Passive User -.490* .145 .010 -.91 -.08
Active Diet .136 .142 .984 -.27 .54
Active
Explorer -.467* .122 .002 -.82 -.12
Active
Explorer
Busy Diet .297 .136 .275 -.09 .69
Passive User -.023 .135 1.000 -.41 .36
Active Diet .603* .132 .000 .23 .98
Ref. code: 25605902040848CRN

61
Early Adopter .467* .122 .002 .12 .82
Received
free
sampling
Busy
Diet
Passive User -.781* .243 .012 -1.45 -.12
Active Diet -.911* .239 .002 -1.57 -.26
Early Adopter -1.100* .226 .000 -1.72 -.48
Active
Explorer -.971* .228 .000 -1.60 -.34
Passive
User
Busy Diet .781* .243 .012 .12 1.45
Active Diet -.130 .226 .978 -.75 .49
Early Adopter -.319 .212 .558 -.90 .26
Active
Explorer -.189 .215 .903 -.78 .40
Active
Diet
Busy Diet .911* .239 .002 .26 1.57
Passive User .130 .226 .978 -.49 .75
Early Adopter -.189 .207 .893 -.76 .38
Active
Explorer -.059 .210 .999 -.64 .52
Early
Adopter
Busy Diet 1.100* .226 .000 .48 1.72
Passive User .319 .212 .558 -.26 .90
Active Diet .189 .207 .893 -.38 .76
Active
Explorer .130 .195 .964 -.41 .67
Active
Explorer
Busy Diet .971* .228 .000 .34 1.60
Passive User .189 .215 .903 -.40 .78
Active Diet .059 .210 .999 -.52 .64
Early Adopter -.130 .195 .964 -.67 .41
Ref. code: 25605902040848CRN

62
BIOGRAPHY
Name Miss Uncharee Onprom
Date of Birth November 18, 1990
Educational Attainment
2013: Bachelor Degree of Journalism and Mass
Communication, Thammasat University
Ref. code: 25605902040848CRN