a study of physiochemical parameter of … study of physiochemical parameter of... · abstrak xi...
TRANSCRIPT
A STUDY OF PHYSIOCHEMICAL PARAMETER OF DISSOLVED
OXYGEN (DO) AND BIOCHEMICAL OXYGEN DEMAND (BOD)
GENERATED FROM INDUSTRIALIZATION ACTIVITIES THAT
IMPACTED STREAM OF SANTUBONG RIVER
MIOR IZZUDDIN BIN BAHARUDDIN
A dissertation submitted
in fulfillment of the requirement for the degree of
Master of Environmental Science in Sustainable Land Use and
Water Resource Management
FACULTY OF RESOURCE SCIENCE AND TECHNOLOGY (FRST)
UNIVERSITI MALAYSIA SARAWAK
2014
i
Declaration
No portion of the work referred to in this dissertation has been submitted in support of an
application for another degree of qualification of this or any other university or institution of
higher learning.
.................................................................
MIOR IZUDDIN BIN BAHARUDDIN
Matric No : 13030027
Programme : Master of Environmental Science (Sustainable Land Use and Water
Resources Management)
Faculty : Faculty of Resources Science and Technology, UNIMAS
ii
ACKNOWLEDGEMENT
Praise to Allah S.W.T the Almighty, the Most Merciful for all the blessing and
guidance upon me throughout this study.
First and foremost, I would like to express my deepest gratitude and appreciation to
my supervisor, Dr. Samuel Lihan and Dr. Chin Suk Fun, without them this study would not
have been successful. I would also like to extend my profound gratitude and appreciation to
the SLUSE Program Coordinator, Dr. Tay Meng Guan (FRST), Dr. Wong Swee Kiong (FSS)
and also other lecturers and academicians especially Prof. Dr. Gabriel T. Noweg, Prof. Dr.
Dimbab Ngidam, Prof. Dr. Lau Seng, Prof. Dr. Mustafa Abdul Rahman, Prof. Dr. Lee
Nyanti, Prof. Dr. Andrew Alek, Associated Pofessor Dr. Awg Ahmad Sallehin Awg Hussani,
Dr. Mohd Effendi Wasli, Dr. Siti Rubiah Zainudin, Dr. Ramlah Zainudin, Dr. Samsur
Mohamad, Dr. Lim Po Teen, Mr. Kelvin Egay, Mr. Nicholas Ghani, Mr. Jong Tien Kiong
and many others lecturers from Faculty of Engineering and Faculty of Social Science for their
dedications, invaluable advices and untiring help in teaching the SLUSE Program.
I would also like to extend my profound gratitude and appreciation to my Director
General of Department of Environment (DOE), Y.Bhg. Datuk Hjh. Halimah Hassan and
DOE State Sarawak Director, Tn. Haji Ruslan Mohamad for supporting me for gaining
higher education as a part of human capital development of the department. A Special thanks
also to my Deputy Minister of Natural Resources and Environment (NRE), Yang Berhormat
Dato’ Sri Dr. James Dawos Mamit as a part of the SLUSE lecturers for teaching and sharing
the needs of environmental management in the country.
iii
I also would like to thank the following people and organizations that helps me in
making this study a success:
Department of Environment (DOE), Sarawak
Natural Resources and Environmental Board (NREB), Sarawak
Alam Sekitar Malaysia Sdn. Bhd. (ASMA)
Department of Irrigation and Drainage (DID), Sarawak
Land and Survey Department, Kuching Divisional Office
Mr. Suhadi (fishermen)
Finally, I would like to express deepest gratitude and love to my mother, my wife and
children and the rest of the family and friends who have given me all the moral support and
encouragement to bring me to where I am today. Without the presence of their support during
my studies, this project would never have been completed.
Mior Izzuddin Bin Baharuddin
April 2014
iv
TABLE OF CONTENTS
Page
Declaration i
Acknowledgement ii
Table of Contents iv
List of Appendices vi
List of Tables vii
List of Figures vii
List of Abbreviations viii
List of Symbol ix
Abstract x
Abstrak xi
Chapter 1 INTRODUCTION
1.1 Research Background 1 - 3
1.2 Problem Statement 4
1.3 Objectives 5
Chapter 2 LITERATURE REVIEW
2.1 Water Quality 6 - 8
2.2 Human Effects on Water Quality 8 – 9
2.3 Source of Water Pollution 9 – 12
2.4 Point Source and Non-Point Source Pollution 12
2.5 Definition of Waste Water 12
2.6 Blackwater and Greywater Discharge 13
2.7 Water Quality Parameters 13
2.7.1 Physical Parameters 13
2.7.1.1 Total Suspended Solids (TSS) 13 - 14
2.7.1.2 Temperature (T) 14
2.7.1.3 Conductivity 14
2.7.1.4 Turbidity 14 – 15
2.7.1.5 Total Dissolved Solids (TDS) 15
v
2.7.2 Chemical Parameters 15
2.7.2.1 Ammoniacal Nitrogen (NH3-N) 15
2.7.2.2 Biochemical Oxygen Demand (BOD) 16
2.7.2.3 Chemical Oxygen Demand (COD) 16
2.7.2.4 Dissolved Oxygen (DO) 17
2.7.2.5 Degree of Alkalinity or Acidity (pH) 17 - 18
2.8 Water Quality Index (WQI) 18
2.9 Malaysian River Classification 19 - 20
Chapter 3 MATERIALS AND METHODS
3.1 Selection of Sampling Stations 21
3.2 Description of Sampling Locations 21
3.3 Description of Study Area 22
3.4 Parameters Measured 24
3.5 Sampling Frequency 25
3.6 Sampling Technique
3.6.1 In-situ Measurement 26
3.6.2 Water Sampling 27
3.7 Laboratory Analysis 28
3.7.1 Biochemical Oxygen Demand (BOD) 5 days 28
3.7.2 Chemical Oxygen Demand (COD) 29
3.7.3 Suspended Solids (SS) 30
3.7.4 Ammoniacal Nitrogen (NH3-N) 30 – 31
3.7.5 Dissolved Oxygen (DO) 31
3.7.6 Degree of Alkalinity or Acidity (pH) 32
3.8 Statistical Analysis 32
Chapter 4 RESULTS AND DISCUSSION
4.1 Description of Study Site
4.1.1 Physical Environment 33
4.2 Water Quality Result 34
4.2.1 Dissolve Oxygen (DO) 35
vi
4.2.2 Biochemical Oxygen Demand (BOD5) 36
4.2.3 Chemical Oxygen Demand (COD) 37
4.2.4 Total Suspended Solid (TSS) 38
4.2.5 Ammoniacal Nitrogen (NH3-N) 38 - 39
4.2.6 Degree of Alkalinity or Acidity (pH) 39 - 40
4.2.7 Temperature (T) 40
4.3 River Classification 41
4.4 Overall Discussion on the Correlation Analysis 42
Chapter 5 CONCLUTION AND RECOMMENDATIONS
5.1 Conclusion 46 – 48
5.2 Recommendations / Future Work 48
REFERENCES 49 - 53
LIST OF APPENDICES
Page
Appendix 1 : The Picture of Water Quality Analysis Equipments 54 - 57
Appendix 2 : Picture of Water Sampling on the field and
Preservation 58 - 59
Appendix 3 : The Picture of Water Quality Analysis in Laboratory 60
Appendix 4 : Result of Water Quality Analysis (appendix a – d) 61 - 64
Appendix 5 : Water Quality Index Classess 65 - 66
Appendix 6 : Sampling Form Used 67
Appendix 7 : Correlational Analysis 68 – 70
Appendix 8 : Photograph from field observation at study area
of Santubong River 71 - 72
vii
LIST OF TABLES
Page
Table 2.1 : Pollutants of Relevance to the local Environment and Effects 10
Table 3.1 : Location of Sampling Stations 22
Table 3.2 : Type of Industries under Demak Laut Industrial Park River Basin 24
Table 3.3 : Date and time of sampling carried out at the Santubong River 25
Table 3.4 : List of Parameters 26
Table 3.5 : Standard Analysis Method for Water Chemical Parameters 28
Table 4.1 : The result of water quality studies at the sampling stations after
three (3) times sampling 34
Table 4.2 : The standard deviation analysis data of water quality studies at
the sampling stations for analysis 34
Table 4.3 : Statistical analysis using single factors of variance to measure
significant differences between sampling stations 35
Table 4.4 : Water quality indices (WQI) for the three (3) sampling stations 41
Table 4.5 : The correlation analysis of relationship of water quality
parameters 45
LIST OF FIGURES
Page
Figure 3.1 : Map of Sampling Location 23
Figure 4.4(a) : Graph comparison of DO and BOD after three (3) sampling 43
Figure 4.4(b) : Graph comparison of DO, BOD and COD after three (3) sampling 44
viii
LIST OF ABBREVIATIONS
NWQS - National Water Quality Standard
DOE - Department of Environment
WQI - Water Quality Index
DO - Dissolved Oxygen
BOD - Biochemical Oxygen Demand
COD - Chemical Oxygen Demand
SS - Suspended Solids
AN - Ammonia Nitrate
GPS - Geographical Positioning System
JPS - Jabatan Pengairan Dan Saliran
Fe - Iron
Pb - Lead
Cu - Copper
Zn - Zinc
Mn - Manganese
km - Kilometer
mg/L - Milligram per Litre
CO2 - Carbon Dioxide
NO3 - Nitrate
SO42-
- Sulfate
02 - Oxygen
NO2- - Nitrite
HDPE - High-density polyethylene
GPS - Global Positioning System
GIS - Geographic Information System
ix
LIST OF SYMBOLS
mg/L - Milligram per Litre
CO2 - Carbon Dioxide
NO3- - Nitrate
SO42-
- Sulfate
NO2- - Nitrite
HDPE - High-density polyethylene
GPS - Global Positioning System
GIS - Geographic Information System
x
A study of Physiochemical Parameter of Dissolved Oxygen (DO) and Biochemical
Oxygen Demand (BOD) Generated From Industrialization Activities That Impact
Stream of Santubong River
Mior Izzuddin Bin Baharuddin
Faculty of Resource Science and Technology (FRST)
Science in Sustainable Land Use and Water Resource Management
Universiti Malaysia Sarawak
ABSTRACT
Demak Laut Industrial Park is a rapidly growing industrial area located beside the Santubong
River of Sarawak. This river is being used by the fishermen to catch fish and shrimp for their food and
also their own economics. The increasing of rapid industrialization has exerted immense pressure on
water quality by introducing a large variety of chemicals into the environment. This study was carried
out to determine the water quality of Santubong River. Water samples were collected from three (3)
different strategic locations of Santubong River. The physio-chemical characteristics of water,
including temperature, pH, conductivity, dissolved oxygen (DO), biochemical oxygen demand
(BOD), chemical oxygen demand (COD), salinity, total dissolved solids (TDS), total suspended solids
(TSS), turbidity, ammoniacal nitrogen (NH3-N) and oil and grease (O&G) were measured by in-situ
water monitoring equipment and also a laboratories analysis to determine status in relation to the
health of the river ecosystem. The total data points were used to establish relationships between the
parameters and data were also subjected to statistical analysis and expressed as mean ± standard error
of mean (SEM) at the level of significance of p<0.05. The mean value of the measured parameters
was compared with National Water Quality Index Department of Environment Malaysia (DOE-WQI).
Present level concentration of ammoniacal nitrogen, biochemical and chemical oxygen demand were
under the categorization of Class I, II and III while total suspended solids were categorized in Class
III. The impact of industrial activities may cause some environmental problem to the Sungai
Santubong and adjacent areas and also the ecosystem in the rivers in the long terms. Therefore, some
sort of the integrated river water management and good industrial practice should be implemented.
Keywords: Water Quality, anthropogenic activities, industrialization activities
xi
ABSTRAK
Demak Laut Industrial Park adalah kawasan industri yang berkembang pesat terletak di
sebelah Sungai Santubong Sarawak. Sungai ini digunakan oleh nelayan untuk menangkap ikan dan
udang untuk makanan mereka dan juga ekonomi mereka sendiri. Peningkatan perindustrian yang
pesat telah memberi tekanan yang besar kepada kualiti air dengan memperkenalkan pelbagai jenis
bahan kimia ke alam sekitar. Kajian ini dijalankan untuk menentukan kualiti air Sungai Santubong.
Sampel air telah diambil dari tiga (3) lokasi strategik yang berbeza daripada sungai Santubong. Ciri-
ciri fisio- kimia air termasuk suhu, pH, konduktiviti, oksigen terlarut (DO), permintaan oksigen
biokimia (BOD), permintaan oksigen kimia (COD) , kemasinan, jumlah pepejal terlarut
(TDS), jumlah pepejal terampai (TSS), kekeruhan, nitrogen ammonia (NH3 -N) dan minyak dan gris
(O&G) diukur secara in-situ dengan peralatan pemantauan air dan juga analisis makmal untuk
menentukan status berhubung dengan kesihatan ekosistem sungai. Jumlah titik data telah digunakan
untuk hubungan antara parameter dan data juga tertakluk kepada analisis statistik dan dinyatakan
sebagai ralat min ± piawai min (SEM) pada aras signifikan p < 0.05. Nilai min parameter
dibandingkan dengan Indeks Kualiti Air Kebangsaan dari Jabatan Alam Sekitar Malaysia (DOE-
WQI). Tahap kepekatan hadir ammoniacal nitrogen, permintaan oksigen biokimia dan kimia berada
di bawah kategori Kelas I, II dan III manakala jumlah pepejal terampai dikategorikan dalam Kelas
III. Kesan aktiviti perindustrian boleh menyebabkan beberapa masalah alam sekitar kepada Sungai
Santubong dan kawasan bersebelahan dan juga ekosistem di sungai-sungai untuk jangka panjang.
Oleh itu, beberapa jenis pengurusan air sungai bersepadu dan amalan industri yang baik perlu
dilaksanakan.
Kata kunci: Kualiti Air, aktiviti antropogenik, aktiviti perindustrian
1
CHAPTER 1
INTRODUCTION
1.1 Research Background
Sarawak has a total of 55 rivers with a combined length of approximately 5000 km, of
which 3,300 km is navigable. Historically, the rivers of Sarawak have been the main, and
often the only, means of transporting passengers and goods in both urban and rural areas.
Sungai Sarawak is one of Sarawak’s well-known rivers, located at the southwestern tip of the
State. As part of a traditionally source of water supply, mode of transportation and fishery
activities that it was commonly associated with, Sungai Sarawak is now fast becoming one of
the State’s most renowned tourist-attraction and recreational center.
With a total combined length of 120 km, Sungai Sarawak traverses through the capital
of Sarawak, Kuching City, close to its estuary as it drains eastwards towards the South China
Sea. The Sungai Sarawak basin is formed by two principal tributaries: Sungai Sarawak Kiri
and Sungai Sarawak Kanan, rising in the mountain ranges to the south of Kuching City at the
border of Indonesia. The two tributaries meet near Batu Kitang, some 25 km upstream of
Kuching City. From Batu Kitang, the mainstream Sungai Sarawak meanders across a wide
coastal flood plain and the traverses Kuching City. Downstream of Pending, the industrial
area in the eastern part of Kuching, Sungai Sarawak confluences with Sungai Kuap and
further downstream at Loba Batu Belat before discharging to the South China Sea at Muara
Tebas.
The Environmental Quality Report Year 2008 indicated that, other than the two
principal tributaries mentioned above, there are seven smaller tributaries of Sungai Sarawak,
namely Sungai Kelantan, Sungai Kuap, Sungai Maong Kiri, Sungai Samarahan, Sungai
Semadang, Sungai Semenggoh and Sungai Tabuan. Further upstream of the two main
tributaries, other rivers include Sungai Selalang, Sungai Embahn, Sungai Sawah and Sungai
Staat.
2
According to the Department Of Drainage (DID), the sub-catchments of Sungai
Sarawak basin have sub-divided into 49 sub-catchments. Sungai Sarawak and its tributaries
have been and are still being used, over the years in a variety such as a source of potable and
industrial water supply, agricultural irrigation, fisheries, transports as well as eco-tourism
spot. In recent years, the river water quality of the river has deteriorated largely due to land
clearing for the establishment of mainly oil palm plantations and various industries at the
urban and suburban areas. For the purpose of this study and the consideration of limitation of
time, the proposed area will be Demak Laut sub-catchment areas. This is because Demak
Laut sub-catchment area has been added to the list of Sungai Sarawak sub-catchment due to
the considerable number of industrial premises located there. Hydrologically, the discharge
from Demak Laut sub-catchment does not flow into Sungai Sarawak after the construction of
the Kuching barrage. Its flow is directed to Sungai Santubong instead. It is important to know
the pollution loading discharge from this area especially from the industrial units in Demak
Laut Industrial Estate (DOE, 2010).
Demak Laut Industrial Estate was established in 1998 with a total planned area for
industrial/residential/commercial of 1,571 hectares to specially cater for mixed light and
medium industries. The types of industries are wood-based, food processing, metal work,
machineries assembly and shipbuilding or repair services, fabricated metal sector and many
others. Other types of industries are the plastic sector, flour and basic metal sector (DOE
Sarawak, Kajian Inventori 2010).
Industrialization has brought prosperity, and at the same time also has resulted in
many environmental problems. It has been recognized that the quality of receiving waters is
affected by human activities in a watershed via point sources, such as wastewater treatment
facilities, and non-point sources, such as runoff from urban area and farm land (Lenat and
Crawford, 1994; Hall et al., 1994).
Increasing population, rapid industrialization and rapidly intensifying human
activities have exerted immerse pressures on water quality. Whenever human and industrial
wastes are not properly managed, surface waters as well as ground waters become the sink
for receiving such wastes. Rapid industrialization has introduced a large variety of chemicals
into our environment. These chemicals enter our ecosystem and affect human, plant life,
3
aquatic organisms and materials. Some of these chemicals have beneficial uses on one and
exert serious health and ecological problems on the other. When effluents from industries are
discharged into river channels, the river water will be polluted physically, biologically and
chemically. This is due to the increased concentration of dissolved solids, toxic chemicals,
Biochemical Oxygen Demands (BOD) loadings, heavy metals and other pollutants. Pesticides
and weedicides from agricultural areas add to the increasingly polluted water sources
(Ibrahim, 2002).
A single pollutant discharge by specific industrial complex such as galvanizing
factory, food processing factory and many other types of factory without proper treatment
may cause a problem to the receiving rivers because the effluent will combine with other
materials in the natural environment. Contamination by hundreds of pollutants through
industrial discharge into the river can give bad effects to the river water as well as to the
aquatic ecosystem in the future. Water quality has been investigated to gain more
understanding on the impact of agriculture, aquaculture, sewage, household and industrial
effluents on the receiving water bodies. Industrialization has brought prosperity, and at the
same time also has resulted in many environmental problems. It has been recognized that the
quality of receiving waters is affected by human activities in a watershed via point sources,
such as wastewater treatment facilities, and non-point sources, such as runoff from urban area
and farm land (Lenat and Crowford, 1994; Hall et al., 1994)
The study will be a collecting data of industrial (point source) and non-industrial
(non-point source) at the study area while doing the in-situ collecting data for the river using
YSI 6920 Water Quality Sonde, HACH Digital Reactor Block 200 (DRB200) and using
HACH Colorimeter 890 (DR890) for water quality analysis. The sampling station will be
determined as same with the station that has been recognized by DOE for water sampling
point. The result will be predicted and compared with the National Water Quality Standard
(DOE-NWQS).
4
1.2 Problem Statement
The current environmental problems have been caused by the development of
industrial society since the industrial revolution. Successive industrial revolutions have since
increased man’s capacity to transform nature. Technological change has interacted with
socioeconomic change in the core countries of the world economy.
Water component or the hydrosphere served as a link between all the other
environmental components, namely, the atmosphere, lithosphere and the biosphere. Water
bodies are the trapping pool to all forms of pollutants. By deciphering the pathways by which
pollutants disperse through our water system, we will gain a useful insight of our
environment. Therefore, a thorough chemical analysis of the water in the environment is an
important procedure in the scientific investigations of our water system (Lau, 2010).
With the increase of industrial activity, there are many free industrial zones is
developed in our country. Sarawak region also is not behind of the industrialization, there are
now more than hundred fifty (150) of factories located in Demak Laut Industrial Park. The
types of industries are wood-based, food processing, metal work, machineries assembly and
shipbuilding or repair services, fabricated metal, chemical products, electrical and electronics,
beverages, plastic and paper products, textiles and basic metal sector (DOE Sarawak, Kajian
Inventori 2010). It has proven the problem is aggregated by hundred numbers of factories in
the Demak Laut Industrial Park. The current rate of industrialization has caused a rise in
environmental issues involving environmental mismanagement which has been associated
with unforeseen global catastrophes.
Improper understanding and discharge of wastewater from the industries to the river
continues to be a hot issue among the environmentalist, public as well as to the government.
Releases of final discharge from the factories at the Demak Laut Industrial Park, which
contain varieties of chemicals and pollutants to the river water may degrade environmental
quality and resulted in the destruction of ecosystems and their flora or fauna, bioaccumulation
of chemicals in food chains, and or short or long term human health effects to the exposed
population.
5
1.3 Objectives
The objectives of this study are listed below:
1. To determine the water quality of river behind Demak Laut Industrial Park in
upstream and downstream of Santubong River based on a physical parameters of
Dissolved Oxygen (DO), Biochemical Oxygen Demand (BOD), Chemical Oxygen
Demand (COD), Ammoniacal Nitrogen (NH3-N), Total Suspended Solids (TSS), pH
and also the Temperature (T);
2. To compare the concentration of Physiochemical Parameter of Dissolve Oxygen (DO)
and Biochemical Oxygen Demand (BOD) in upstream and downstream of the study
area with the recommended level of the National Water Quality Index (WQI) for
Malaysia.
6
CHAPTER 2
LITERATURE REVIEW
2.1 Water Quality
Water quality involves a long list characteristics and chemical constituents (Brook et
al., 1997). It has traditionally become a concern when human health considerations are at
stake. According to Ali & Murtedza (1999), water is one of the most important elements in
the environment that plays a key role in the biological, physical and chemical processes and it
is a unifying factor in most ecosystems.
Water covers some 71% of the earth’s surface and itself the medium for several
different ecosystems. All natural elements are soluble, at least in trace amounts, and all are
found in natural water at some place on the earth’s surface. Water is a major reservoir for
storing nutrients and other biologically important materials, and it is the main medium in
which these materials move from the abiotic to the biotic part of the ecosystem (Clapham,
1983). Like other natural resources, water resource is at constant risk of being further
degraded and gradually become limited.
Unlike distilled or deionized water all drinking water supplies contain a range of
dissolved chemical compounds. Even rainwater, which is the purest water found naturally,
contains a wide range of ions and cations. In the early days of chemistry, water was known as
the universal solvent as a result of its ability to slowly dissolve into solution anything it
comes into contact with, from gases to rocks. So as the rain falls through the atmosphere,
flows over and through the Earth's surface, it is constantly dissolving material, forming a
chemical record of its passage from the clouds. Therefore, water supplies have a natural
variety in quality, which depends largely on the source of the supply. All our water comes
from the water cycle and it is the process that controls our water resources.
Water quality refers to the physical, biological and chemical status of the water body.
Streams and rivers are typically diverse and biologically productive environments in their
natural form. The presence, abundance, diversity and distribution of aquatic species in
7
surface waters are dependent upon a physical and chemical factors, such as temperature,
suspended solids, pH, nutrients, chemicals and riparian habitats. Until recently, the dominant
methods of evaluating water quality are based on water, chemical and physical properties
(Wang, 2001).
However, there were no specific studies conducted on the impact of industrialization
activities on this river. Many of the studies is related to the aquaculture activities and loading
of pollutants from shrimp ponds during harvesting on the water quality of the Santubong
River (Nyanti and Norhadi, et al., 2010a).
The quality of watercourses has been altered by the impact of various human
activities and water uses. Most pollution situations have evolved gradually over time until
they have become apparent and measurable (Meybeck et al., 1989). The uptrend in
population, urbanization and industrialization in the country has brought in water related
problems such as water pollution. Urban dwellers and industrial sites are a major source of
pollution to the receiving environment. Besides that, direct sewage, untreated industrial
effluent and sediment-laden runoff has become the main pollution factors. Water pollution
seriously hinders and limits the availability of water supply resources. It endangers human
health, shortens the average life span expectancy of the country’s population and destroys
aquatic lives and its biodiversity (Keizrul, 2006).
There are many studies on the impacts of industrialization on water quality in
Malaysia. For example, Nasly et al., (2013) has studied the impact of rapid industrialization
at Gebeng, Pahang, Malaysia where there is an impact to the river water quality because of
low concentration of DO and high concentration of BOD, COD and NH3-N in midstream due
to the industrial activities. Islam et al., (2013) has studied the quality deterioration of surface
water as the results of anthropogenic activities in the study areas due to rapid
industrialization. The study was done to investigate the spatial variation of the water quality
of the Tunggak River, Johor and the surrounding area because of industrial activities.
The Department of Environment (DOE) had reported in November 1995, that two out
of three rivers in the country are polluted. Only 28% of the rivers are classified as clean.
River water quality in the country had deteriorated by 1.2% per year in the last decade.
8
Industrial waste was the major source of pollution (Sahabat Alam Malaysia (SAM), 1996).
Meanwhile, in 2007 out of 143 river basins monitored by DOE, with the number of
monitoring stations remains at 1,064. Out of these 1,064 monitoring stations, 638 (60%) were
found to be clean, 376 (35%) slightly polluted and 50 (5%) polluted. There was a significant
improvement in the river water quality in 2007 compared with 2006. The number of clean
river basins was 91 (64%) compared to 80 in 2006 and the number of slightly polluted river
basin dropped from 59 in 2006 to 45 (31%) in 2007.
However, the number of polluted river basin remains at 7 (5%). As in previous years
the major pollutants detected were Biochemical Oxygen Demand (BOD), Ammoniacal
Nitrogen (NH3-N) and Suspended Solids (SS). In line with the overall improvement in river
water quality in 2007, the number or river basins polluted by the BOD decreased from 22 in
2006 to 12 in 2007 and the number of river basins polluted by NH3-N decreased from 42 to
36 but the number of river basins polluted by SS remain at 42. High BOD can be contributed
to untreated or partially treated sewage and discharges from agro-based and manufacturing
industries. The main sources of NH3-N were domestic sewage and livestock farming, while
the sources for SS were mostly earthworks and land clearing activities (DOE, 2012).
2.2 Human Effects on Water Quality
Man-induced activities have direct impacts on the hydrologic cycle by altering the
land in many ways that change it physical, chemical and biological properties (Peter and
Meybeck, 2000). Physical changes such as urbanization, transportation, irrigation,
deforestation and forestation, land drainage, channelization and damming, mining activities,
change the hydrologic pathways and thus, may change the water quality properties by
modifying the materials with which the water interacts.
Other than that, human activities such as irrigation, landfills and mine tailings may
also as substances and wastes (for example pesticides, herbicides and fertilizers) to the
landscape and this change the land chemically. Chemical changes that associated with
anthropogenic activities are partially related to physical changes, but happens mainly through
the addition of waste (gases, liquids and solids) and other substances to the land (Peter and
Meybeck, 2000). Some of these wastes and substance are released directly to the surface
9
water (point sources) and some are distributed over a larger area (non-point sources).
According to Peter and Meybeck (2000), biological changes include forest management,
agriculture and the import of exotic species.
In Malaysia and other South East Asian countries, land use and land cover are a major
concern whereby forests are being converted to other land uses and agricultural lands are also
being altered to urban areas, both in a very pace (Syarifah, 2000). The land use and cover
changes have resulted in severe erosion, sedimentation and other water pollution problem in
water catchments particularly in downstream. In fact, according to Falkenmark and Chapman
(1989), streams from logging areas in Malaysia carry 8 to 17 times more sediment load as
compared to before logging.
2.3 Sources of Water Pollution
Water pollution is the contamination of water bodies such as lakes, rivers, oceans,
aquifers and groundwater. Water pollution occurs when pollutants directly or indirectly
discharged into water bodies without adequate treatment to remove harmful compounds.
Water pollution affects plants and organisms living in these bodies of water. In almost all
cases the effects is damaging not only to individual species and populations, but also to the
natural biological communities (http://en.wikipedia.org/wiki/Water_pollution).
Point sources pollution is a type of pollution that derived from human activities
whereby pollutants such as wastewater is directly released into receiving water body
(Ibrahim, 2000; Ongley, 1996). However, according to US-EPA (as cited by Ongley, 1996),
pollutants runoff from agriculture activities are not considered as point sources. Ongley
(1996) has clearly defined non-point sources pollution as pollution that sources originated
from a wide group of human activities for which the pollutants have no obvious point of entry
into receiving waterways. Each activity within the water catchment may contribute to non-
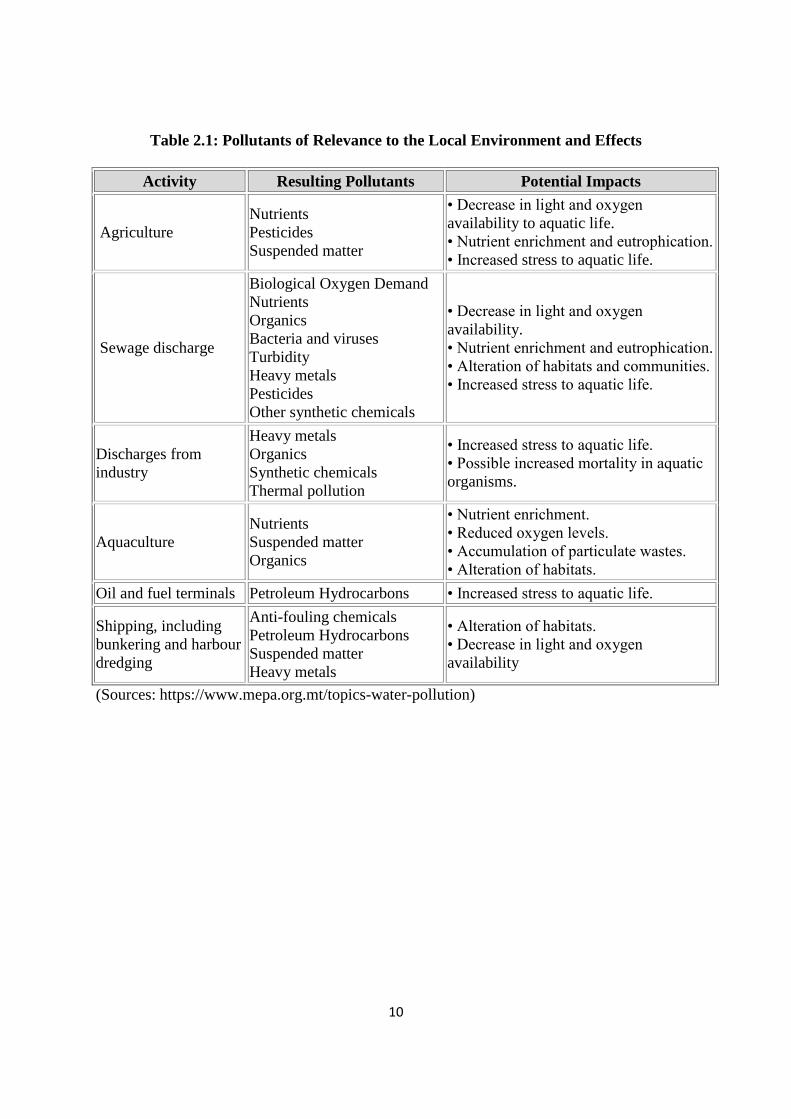
point sources pollution. Table 2.1 denotes the pollutants of relevance to the local environment
and a short description of their effects:
10
Table 2.1: Pollutants of Relevance to the Local Environment and Effects
Activity Resulting Pollutants Potential Impacts
Agriculture
Nutrients
Pesticides
Suspended matter
• Decrease in light and oxygen
availability to aquatic life.
• Nutrient enrichment and eutrophication.
• Increased stress to aquatic life.
Sewage discharge
Biological Oxygen Demand
Nutrients
Organics
Bacteria and viruses
Turbidity
Heavy metals
Pesticides
Other synthetic chemicals
• Decrease in light and oxygen
availability.
• Nutrient enrichment and eutrophication.
• Alteration of habitats and communities.
• Increased stress to aquatic life.
Discharges from
industry
Heavy metals
Organics
Synthetic chemicals
Thermal pollution
• Increased stress to aquatic life.
• Possible increased mortality in aquatic
organisms.
Aquaculture
Nutrients
Suspended matter
Organics
• Nutrient enrichment.
• Reduced oxygen levels.
• Accumulation of particulate wastes.
• Alteration of habitats.
Oil and fuel terminals Petroleum Hydrocarbons • Increased stress to aquatic life.
Shipping, including
bunkering and harbour
dredging
Anti-fouling chemicals
Petroleum Hydrocarbons
Suspended matter
Heavy metals
• Alteration of habitats.
• Decrease in light and oxygen
availability
(Sources: https://www.mepa.org.mt/topics-water-pollution)
11
In many types of land use activities, non-point source pollution is dominantly
attributed by agricultural activities due to its large extend of area, extensive soil disturbance
and application of fertilizers and pesticides (Charbonneau and Kondolf, 1993). In addition to
that, Charbonneau and Kondolf (1993) also asserted that suspended sediment as the largest
surface water non-point source pollutant (on a volumetric basis) and nutrients come next.
Sediments affect the water quality in two ways (Ibrahim, 2000; Ongley, 1996):
i. High level of turbidity impedes sunlight penetration into the water column;
subsequently hinder the growth of algae, and rooted aquatic plants. In spawning
rivers, gravel beds are covered with fine sediment that hampers spawning of fish.
Both ways can disrupt the aquatic ecosystem by destroying the habitat.
ii. High level of sedimentation in rivers contributes to physical disruption of hydraulic
characteristics of the river channel. This can cause problems in navigating due to the
reduction of the depth of the channel. Sedimentation can also cause flooding events to
increase by the reductions in capacity of the river channel to efficiently route the
water through the drainage basin.
Meanwhile, high concentration of nutrients can lead to the nuisance growth of aquatic
weeds and algal blooms. According to Kiersch (2000), high nutrient leaching losses can
occur when fertilizer is applied to short-term crops on permeable soils. As the plants die, they
contribute to the organic loading and cause organic pollution. This process of increased plant
growth and decay, the increased activity of the decomposing microorganisms, and the
depletion of dissolved oxygen, is called eutrophication (Ibrahim, 2000).
Ibrahim (2000) approximated that the designation of pollution input sources may be
based on land use. This is due the fact that land use change the drainage characteristic of the
land and the activities carried out result in new pollutants being emitted. The intensity of
drainage characteristic alteration depends on the intensity of the extend urbanization.
Generally, the amount of runoff and the speed of runoff flow will increase with the intensity
of urbanization and drainage characteristic alteration. This reduces infiltration and retention
12
of water over the ground, and with the increase of flow, the pollution carrying capacity is also
increased.
In addition to drainage alterations, the type of activity carried out will also affect
pollutant inputs. The higher intensity of activity level is, the higher the possibility of
pollutants being emitted to a watercourse. The different activities are associated with
different type of pollutants. Depending on the nature of the pollutants, some may degrade in
the environment naturally and some may persist for long periods (Ibrahim, 2000).
2.4 Point Source and Non-Point Source Pollution
The source of pollution can be differentiated into two types which are point source
pollution and non-point source pollution.
Point source pollution is when pollutants are discharged from a single identifiable
localized source of water pollution. The pollutant discharged from point source has the
highest concentration near to the source and the concentration reduces as it moves further
from the source. Point sources may include wastewater treatment plants, landfills, utility
stations and fleet maintenance facilities (DOE, 2010).
Non-point source pollution are pollutants that have no clear definition or specific
sources (DOE, 2010). The source of pollution for non-point source pollution are very diverse
and seems to flow from many different sources. Rain water or flowing water picks up many
contaminants, including motor oil, grease, sand, wastes, and agricultural chemicals from
farmland and flow to the rivers.
2.5 Definition of Wastewater
Wastewater can be divided into greywater and blackwater. Blackwater is wastewater
that originates from septic tanks while greywater refers to water that are discharged from
kitchens, bathrooms and wash areas. Greywater is more harmful to the rivers than the
blackwater (Sibon, 2010).