a study of georgia school districts’ balanced scorecard
TRANSCRIPT

A STUDY OF GEORGIA SCHOOL DISTRICTS’ BALANCED SCORECARD
ALIGNMENT TO THE COLLEGE AND CAREER READY PERFORMANCE INDEX
by
JARED BRYANT ROBINSON
(Under the Direction of Sally J. Zepeda)
ABSTRACT
The purpose of the study was to measure Georgia school superintendents’
perceived goal alignment to the College and Career Ready Performance Index (CCRPI).
The study took place during the accountability shift outlined in Georgia’s approved
waiver from the Elementary and Secondary Education Act (2012) and in the context of
many school districts using balanced scorecards to measure performance on district goals.
Within the study, perceptual data from school superintendents were collected and
analyzed on the topics of accountability alignment to the CCRPI and self-reported
demographics. Superintendents also reported about the systems that their school districts
used to manage performance goals, and alignment levels were compared.
The researcher designed a confidential survey to collect data on CCRPI alignment
levels and demographic variables of interest. Independent variables including school
district and superintendent characteristics were divided by levels or categories, while a 7-
point Likert scale was used to measure the dependent variable: perceived alignment to the
CCRPI. Survey items also targeted perceived alignment to certain subcategories in the

CCRPI (achievement, post high school readiness, progress, and achievement gap).
Internal consistency measures were implemented before and after the data collection
process.
A quantitative approach was used to display the degree to which the sample of 72
participating superintendents was representative of Georgia superintendents as a whole.
Analysis of Variance (ANOVA) calculations were used to test for mean differences
between superintendents who used balanced scorecards as compared to superintendents
who used other performance management systems, and perceived alignment was
measured across demographic and performance management categories.
While superintendents, in general, reported goal alignment to the CCRPI,
perceived alignment to the subcategory of achievement was reported at a greater level
than post high school readiness, progress, and achievement gap. When analyzing
superintendent and school district demographics, there were no differences in perceived
CCRPI alignment, and there were no significant differences between balanced scorecard
and non-balanced scorecards users.
INDEX WORDS: Accountability, Balanced Scorecard, Charter School System,
College and Career Ready Performance Index (CCRPI), Georgia’s Waiver of No Child
Left Behind, School District Balanced Scorecard

A STUDY OF GEORGIA SCHOOL DISTRICTS’ BALANCED SCORECARD
ALIGNMENT TO THE COLLEGE AND CAREER READY PERFORMANCE INDEX
by
JARED BRYANT ROBINSON
BA, Tulane University, 1998
MAED, University of Phoenix, 2007
A Dissertation Submitted to the Graduate Faculty of The University of Georgia in Partial
Fulfillment of the Requirements for the Degree
DOCTOR OF EDUCATION
ATHENS, GEORGIA
2015

© 2015
Jared Bryant Robinson
All Rights Reserved

A STUDY OF GEORGIA SCHOOL DISTRICTS’ BALANCED SCORECARD
ALIGNMENT TO THE COLLEGE AND CAREER READY PERFORMANCE INDEX
by
JARED BRYANT ROBINSON
Major Professor: Sally J. Zepeda
Committee: Allan S. Cohen
John P. Dayton
Electronic Version Approved:
Julie Coffield
Interim Dean of the Graduate School
The University of Georgia
May 2015

iv
DEDICATION
This dissertation is dedicated to Jane and Joe Robinson.

v
ACKNOWLEDGEMENTS
I would like to acknowledge the ongoing support of my inspirational family:
Heather Robinson, Ansley Robinson, and Bryant Robinson. I sincerely thank Dr. Sally
Zepeda for her outstanding guidance, and I would also like to thank Dr. Al Cohen and Dr.
John Dayton for their assistance during this process. I very much appreciate the positive
support of my colleagues at Northeast Georgia RESA, and I would also like to thank my
friend and colleague, Matt Thompson, for his tremendous insight and support.

vi
TABLE OF CONTENTS
Page
ACKNOWLEDGEMENTS .................................................................................................v
LIST OF TABLES ...............................................................................................................x
LIST OF FIGURES .......................................................................................................... xii
CHAPTER
1 INTRODUCTION .............................................................................................1
Statement of the Problem .............................................................................5
Background of the Study .............................................................................6
Purpose of the Study ....................................................................................7
Research Questions and Hypotheses ...........................................................8
Categorical Analysis ....................................................................................9
Significance of the Study ...........................................................................10
Assumptions ...............................................................................................10
Definition of Terms....................................................................................11
Limitations of the Study.............................................................................16
Overview of the Method ............................................................................16
Organization of the Dissertation ................................................................17
2 REVIEW OF RELEVANT LITERATURE ....................................................18
Research Questions and Hypotheses .........................................................18
Overview of the Balanced Scorecard .........................................................21

vii
Cascading the Balanced Scorecard ............................................................22
Balance of the Balanced Scorecard............................................................23
Challenges to the Balanced Scorecard Assumptions .................................25
Balanced Scorecards and Organizational Alignment ................................25
Balanced Scorecards as Management and Evaluation Tools .....................27
Knowledge Management and Balanced Scorecards ..................................28
Balanced Scorecards and Educational Leadership Perspectives ...............28
School Districts as Loosely Coupled Organizations ..................................30
Problems of Practice in School Districts ...................................................31
District Office Leadership..........................................................................31
Commonalities in Balanced Scorecards and School District Research .....34
School District Problem Areas and Balanced Scorecard Functions ..........35
Balanced Scorecards as Tools to Address Loose Coupling .......................37
School Accountability as a Context ...........................................................38
College and Career Ready Performance Index ..........................................39
Accountability Designations in Georgia’s Waiver of NCLB ....................40
Race to the Top Reforms and Georgia’s Education Systems ....................42
School System Governance and Charter Systems .....................................42
School Accountability and Theories of Action ..........................................43
Chapter Summary ......................................................................................44
3 METHODOLOGY ..........................................................................................46
Introduction ................................................................................................46
Research Design.........................................................................................46

viii
Research Questions ....................................................................................48
Instrumentation and Survey Development.................................................49
Target Sample for the Study ......................................................................50
Independent Variables of Interest ..............................................................54
Survey Directions and Item Samples .........................................................56
Survey Content...........................................................................................57
Validity and Use of a Focus Group............................................................58
Use of a Pilot Study for Reliability and Validity .......................................60
Data Collection Processes ..........................................................................61
Data Reporting ...........................................................................................62
Data Analysis and Interpretation ...............................................................62
Hypotheses .................................................................................................64
Chapter Summary ......................................................................................65
4 RESEARCH FINDINGS .................................................................................67
Introduction ................................................................................................67
Research Questions ....................................................................................68
Sample and Representation ........................................................................68
Self-Reported Demographics .....................................................................70
Self-Reported System-Wide Goal Measurement Processes ......................71
Descriptive Statistics and CCRPI Alignment ............................................76
Findings for Research Question 1 ..............................................................78
Findings for Research Questions 2 Through 5 ..........................................82

ix
5 DISCUSSION OF FINDINGS ........................................................................88
Overview of the Study ...............................................................................88
Summary of the Findings ...........................................................................89
Discussion of the Findings .........................................................................91
Implications for Policy ...............................................................................94
Implications for Practice ............................................................................96
Implications for Future Research ...............................................................97
Final Thoughts ...........................................................................................99
REFERENCES ................................................................................................................101
APPENDICES
A Survey Consent Forms ...................................................................................111
B Survey Items ..................................................................................................113
C Mean Response Rate for CCRPI Alignment Items........................................117
D Sample of Selected AYP Report Sections (2011)..........................................118
E Sample of Selected CCRPI Sections (2014) ..................................................120

x
LIST OF TABLES
Page
Table 2.1: School Coupling, School District, and Balanced Scorecard Literature ............35
Table 3.1: The Sample of Georgia School Superintendents ..............................................51
Table 3.2: Participating Superintendents’ Years of Experience ........................................54
Table 3.3: Student Enrollment Levels for Participating School Districts ..........................55
Table 3.4: Sample CCRPI Survey Items and Directions ...................................................56
Table 3.5: Survey Adjustments Based on Focus Group Feedback ....................................57
Table 3.6: Feedback from Pilot Study ...............................................................................60
Table 3.7: Cronbach’s Alpha for the Pilot Study ...............................................................61
Table 4.1: Participating and Non-Participating School District Comparisons ..................70
Table 4.2: Self-Reported Demographic Data from Participating Superintendents ............71
Table 4.3: Self-Reported System-Wide Goal Measurement Processes .............................72
Table 4.4: Balanced Scorecard Use in School Districts and Schools ................................73
Table 4.5: Other School District Performance Management Systems ..............................73
Table 4.6: Other School Performance Management Systems ...........................................75
Table 4.7: Self-Reported Total Alignment to the CCRPI ..................................................76
Table 4.8: Self-Reported Total Alignment to the CCRPI by Demographics ....................78
Table 4.9: Self-Reported Alignment to CCRPI Subcategories ..........................................79
Table 4.10: Test of Within Subjects Effects for CCRPI Alignment Scores ......................79
Table 4.11: Pairwise Comparisons of CCRPI Alignment to Subcategories ......................80

xi
Table 4.12: Omnibus Tests of Between-Subject Effects ...................................................82
Table 5.1: Independent and Dependent Variables Pertaining to School Districts .............91
Table 5.2: Topics for Future Balanced Scorecard Research in Education ........................98

xii
LIST OF FIGURES
Page
Figure 4.1: Geographical Representation of the Sample of Georgia Superintendents ......69
Figure 4.2: Distribution of CCRPI Alignment Frequencies ..............................................77
Figure 4.3: Mean Differences in Alignment to CCRPI Subcategories ..............................81
Figure 4.4: CCRPI Alignment Scores and Balanced Scorecard Status .............................84
Figure 4.5: CCRPI Alignment Scores and Charter System Status ....................................85
Figure 4.6: CCRPI Alignment Scores and Superintendent Experience Level...................86
Figure 4.7: CCRPI Alignment Scores and School District Enrollment Size .....................87

1
CHAPTER 1
INTRODUCTION
During the 1990s, many private sector businesses began to use balanced
scorecards to manage organizational goals and strategies more systematically
(Krumwiede, Eaton, Swain, & Eggett, 2008). The term balanced scorecard was conceived
in the work of Robert Kaplan of the Harvard business school and David Norton, a
business performance management consultant, and was characterized by its overarching
purpose of providing chief executive officers with a tool to obtain formative information
about organizational performance (Kaplan & Norton, 1992). One notable characteristic of
the balanced scorecard was its emphasis on a combination of financial and non-financial
measures (Ittner, Larcker, & Meyer, 1997). Bieker and Waxenberger (2002) further
described Kaplan and Norton’s concept of balance as an equilibrium between short-term
and long-term goals, internal and external perspectives, quantitative and qualitative data,
and leading versus lagging indicators.
Through this balanced approach, company managers could use their scorecards
systematically to monitor non-financial measures instead of waiting until quarterly
financial bottom lines to obtain data about organizational performance (Kaplan & Norton,
1996b). Norreklit (2000) described the value of balanced scorecards like this, “It contains
outcome measures and the performance drivers of outcomes, linked together in cause-
and-effect relationships, and thus aims to be a feed-forward control system” (p. 65).
Chenhall (2003) categorized the balanced scorecard as a management control system.

2
The literature on balanced scorecards also included alignment of organizational
goals to smaller units within the organization such as departments and individuals (Ittner
& Larcker, 2001; Kaplan & Norton, 1996b, 2001). To articulate alignment, the balanced
scorecard functioned as a mechanism to communicate organizational goals and to collect
data pertaining to progress on objectives across all stakeholder groups including
managers, department heads, employees, stockholders, decision-making boards, and chief
executives (Chi & Hung, 2011; Kaplan & Nagel, 2003; Ling, Giacomino, Browne, &
Akers, 2009). The number of businesses using balanced scorecards grew through the
latter half of the 1990s and continued to grow moving into the first decade of the 21st
Century (Krumwiede et al., 2008). In 2002, research indicated that approximately 50% of
all Fortune 500 companies used a balanced scorecard (Gartner Group, 2002).
Running concurrently with the balanced scorecard movement in the private sector
was the accountability movement in the public sector—particularly in K-12 public
schools. A notable event in the school accountability movement was the enactment of the
No Child Left Behind (NCLB) Act of 2001 (Elmore, 2004; McDonnell, 2005; O’Day,
2002). Within this mandate, schools and school districts were now being measured and
labeled according to their student achievement scores in mathematics and
English/language arts across multiple student subgroups on an annual basis. In response
to these expectations and reports, schools were given annual performance labels based on
whether they met numerical student achievement thresholds as outlined in NCLB. Based
on expectations for student performance on standardized tests, schools and school
districts were faced with the challenge of generating and managing student achievement

3
goals and aligning strategies to achieve their goals (Duke, 2010; Marzano & Waters,
2009).
As accountability increased in the context of standards-based reforms, schools
and school districts faced the challenge of navigating multiple layers of reform to
determine priorities and to make sense of their work (Louis, Febey, & Schroeder, 2005;
Spillane, 2004; Tyack & Cuban, 1995). While complexity accompanies any attempts to
determine the effects of organizational variables on school accountability mandates
(O’Day, 2002), researchers have found that both district and federal reforms do
concurrently impact the work of schools in the form of leadership priorities as well as the
depth of implementation of each respective reform (Hargreaves & Fullan, 2009;
McLaughlin & Mitra, 2001). As Georgia school districts faced the new accountability
expectations in the College and Career Ready Performance Index (CCRPI), balanced
scorecards were tools that were often used to manage and to track performance on school
district goals.
One theme of balanced scorecards is the alignment of goals and actions across the
organization (Kaplan & Norton, 1996a). Malina and Selto (2001) explained, “Because the
BSC explicitly focuses on links among business decisions and outcomes, it is intended to
guide strategy development, implementation, and communication” (p. 48). Cowart
(2010), a Georgia school superintendent, described the balanced scorecard
communication function, “The balanced scorecard enabled us to communicate current
performance levels to all stakeholders objectively, clearly, and continually” (p.17). When
describing the work of another Georgia school district, Kaplan and Miyake (2010)

4
explained, “It allows a district to look ahead with leading indicators, rather than always
looking back with lagging indicators” (p. 12).
When examining ethics and the balanced scorecard, a theme in both the public
and private sector literature was transparency (Cowart, 2010; Kaplan & Norton, 1996b).
Bieker and Waxenberger (2002) explained that an up-front effort is needed for corporate
leaders to foster ethics and shared governance through the balanced scorecard and “With
reference to a management system for corporate sustainability this leads to the fact that
an adequate strategic framework (involvement, mission/vision, principles, personal
commitment, etc.) has to be established in the sense of a viable ethical approach
beforehand” (p. 5). Similarly, Cowart (2010) described how his school district promoted
transparency through the balanced scorecard:
We posted the scorecard on the district’s website. We also used it in presentations
to the school board, parent groups and community audiences. We posted data
from the scorecards in prominent locations in schools, such as teacher work
rooms and ‘data rooms’ across the district that were used for meetings and
training sessions. The frequent visits of community and civic leaders to these data
rooms served as opportunities to discuss the strategic goals and connect them with
the strategies for moving the schools forward. (pp. 17-18)
Thus, transparency and communication of goals across organizational stakeholders was a
theme in both public and private sector balanced scorecard literature.
According to Louis et al. (2005), many school districts instituted internal
accountability systems to measure NCLB indicators. During the NCLB era, several
Georgia school districts began to use balanced scorecards to manage goals and to
communicate expectations to their schools. Cowart (2010) described the school district
balanced scorecard structure, “The district scorecard process set clear expectations
for schools, departments and the district through a transparent process for tracking and

5
reporting performance” (p. 16). Balance within school district scorecards has been
defined as a combination of leading and lagging indicators as well as the concurrent
implementation of both short-term and long-term goals (Kaplan & Miyake, 2010). From
a shared governance standpoint, balance in schools has been defined as the inclusion of
indicators that focus on both external accountability mandates, while also adopting and
managing measures that address perspectives of local constituents (Georgia Leadership
Institute for School Improvement, personal attendance, February 9, 2010).
The balance of balanced scorecards is a topic that has been extensively examined
in business literature (Atkinson, Banker, Kaplan, & Young, 1997; Ittner, Larcker, &
Meyer, 2003; Norreklit, 2000). In this current era of increased school accountability
(Elmore, 2004; McDonnell, 2005; McNeil, Coppola, Radigan, & Vasquez, 2008), school
districts could be swayed to focus a vast majority of their goals on external accountability
mandates such as NCLB or, in Georgia, the CCRPI. While there is a multitude of
research on the implementation of balanced scorecards in the private sector (Kaplan &
Norton, 1996b; Krumwiede et al., 2008; Malina & Selto, 2001), there is scant literature
on balanced scorecard use in school districts and public sector organizations (Karathanos
& Karathanos, 2005). Furthermore, in 2012, there was very little information on how
Georgia school districts aligned their goals to the CCRPI as outlined in the state’s
approved waiver from NCLB.
Statement of the Problem
In February of 2012, the state of Georgia was granted a waiver from the
Elementary and Secondary Education Act (2002) giving the state’s public schools
independence from the accountability expectations set forth in the provisions of the

6
NCLB legislation. Within the waiver, Georgia school officials outlined a College and
Career Ready Performance Index (2012) on which its schools would be measured. In
addition to the CCRPI, the Elementary and Secondary Education Act (ESEA) waiver in
Georgia included “District Performance Standards” (pp. 104-107). Calculations within
the CCRPI gave schools a numerical point total to be calculated on an annual basis
coupled with performance flags for the respective achievement of each subgroup and
tested subject, as well as star ratings for both financial efficiency and school climate.
Thus, school districts in Georgia—in response to accountability changes under the
NCLB waiver (2012)—were now accountable to a new set of indicators as outlined in the
CCRPI. The problem was Georgia school district balanced scorecards and strategic plans
were not aligned to the new accountability expectations set forth in the NCLB waiver. At
the time of the present study, there was little research that examined how school districts
used balanced scorecards to manage their goals (Karathanos & Karathanos, 2005).
Background of the Study
Within the CCRPI, test scores were used to identify Priority, Focus, and Alert
schools. According to Georgia’s Waiver of the Elementary and Secondary Education Act
(2012):
Beginning in 2012-2013, Georgia will provide support in three categories to
include Priority Schools, Focus Schools, and Alert Schools to address the need to
raise student achievement, close achievement gaps, and promote continual
progress toward full proficiency for all of the students in Georgia. Schools
identified for support will fall into two categories following US ED definitions,
Priority Schools and Focus Schools. (p. 37)
In August, 2012, an analysis of Georgia school district data indicated that 89 out of 180
school districts had at least one Priority, Focus, and/or Alert school (Georgia Department
of Education, 2012a). Thus, schools and school districts faced the challenge of managing

7
reform in the context of accountability mandates (McLaughlin & Mitra, 2001; Tyack &
Cuban, 1992).
Within Georgia’s public school systems, there was also a governance movement
running concurrently with the accountability movement in which school districts were
required to select from three possible governance structures by June 30, 2015: charter
school districts, investment in educational excellence (IE2) districts, or status quo
districts (Georgia Department of Education, 2014). According to the Office of the
Lieutenant Governor (2014), “Lt. Governor Cagle's Charter Systems Act gives individual
school districts the option of stepping out from state and federal mandates to adopt an
educational policy and curriculum that is right for the needs of their students” (p. 1).
Because of the provision of a flexible governance structure with respect to certain state
and federal mandates, charter system status was a variable of interest in the research
study.
Purpose of the Study
The purpose of the study was to obtain perceptual data from Georgia school
superintendents about the extent to which district balanced scorecards and performance
goals were aligned to the College and Career Ready Performance Index (CCRPI) as
outlined in Georgia’s ESEA waiver (2012). Additionally, perceptual data were
categorically analyzed to determine similarities and differences between Georgia school
superintendent responses from different district enrollment sizes, levels of superintendent
experience, and district governance structures. Each categorical variable was examined
with respect to balanced scorecard alignment to the CCRPI as outlined in Georgia’s

8
ESEA waiver (2012). An overall superintendent alignment score was also generated for
each alignment subcategory in the CCRPI.
Research Questions and Hypotheses
The study was organized around five research questions:
1. Are there differences in superintendents’ overall perceived alignment to the
following subcategories in the CCRPI: student achievement, post high school
readiness, progress, and achievement gap?
2. Is there a difference in perceived alignment to the CCRPI between
superintendents in school districts using balanced scorecards and superintendents
in school districts using other school district performance management systems?
3. Is there a difference in perceived CCRPI alignment between superintendents who
reported charter system status and superintendents who reported non-charter
system status?
4. Are there differences in perceived alignment to the CCRPI between
superintendents with different experience levels?
5. Are there differences in perceived alignment to the CCRPI between
superintendents with different levels of student enrollment?
Hypotheses
Hypotheses addressing each research question were phrased in the null.
1. There are no significant differences in superintendents’ overall perceived
alignment to the following subcategories in the CCRPI: student achievement, post
high school readiness, progress, and achievement gap.

9
2. There is no significant difference in perceived alignment to the CCRPI between
superintendents in school districts using balanced scorecards and superintendents
in school districts using other school district performance management systems.
3. There is no significant difference in perceived CCRPI alignment between
superintendents who reported charter system status and superintendents who
reported non-charter system status.
4. There are no significant differences in perceived alignment to the CCRPI between
superintendents with different levels of experience.
5. There are no significant differences in perceived alignment to the CCRPI between
superintendents with different levels of school district student enrollment.
Categorical Analysis
For research question 1, a categorical analysis (within subjects ANOVA) was
used to examine the mean differences between superintendents’ perceived alignment to
different subcategories in the CCRPI: student achievement, post high school readiness,
progress, achievement gap. For research questions 2, 3, 4, and 5, a categorical analysis
(between subjects ANOVA) was employed to examine whether there were mean
differences in perceived CCRPI alignment (the dependent variable) between the
following demographic categories (the independent variables):
superintendents using balanced scorecards and superintendents using other school
district performance management systems,
different experience levels of superintendents,
school district governance structure (self-reported charter system status and self-
reported non-charter system status), and
district student enrollment level
10
Significance of the Study
When school districts manage accountability expectations and change, district
expectations must be communicated coherently from school districts to schools (DuFour
& Marzano, 2011; Duke, 2010). Kaplan and Norton (1996b) explained that the balanced
scorecard, “… lets managers communicate their strategy up and down the organization
and link it to departmental and individual objectives” (p. 76). In the context of Georgia
school districts, Glennon (2010) described an analogous link or alignment between the
district balanced scorecard and school balanced scorecards like this:
Using the same format, with consistent strategic goal areas and performance
objectives for each school and the district, not only helped the school’s inner
workings; it also increased the capacity of school personnel to communicate with
each other and align their work. (p. 18)
Therefore, results from this research could be used to shed light on how school districts
aligned their goals in the context of changes in accountability. More specifically, the
research could provide information about how school districts in one state (Georgia)
managed the shift from NCLB accountability expectations to the CCRPI. In addition,
differences in superintendents’ perceptions of alignment when using balanced scorecards
versus those using other school district performance management systems could provide
insight into considerations for school districts as they decide what format is best to
manage performance goals in the future.
Assumptions
Some assumptions of the study were that Georgia school district superintendents
would participate in the survey, and they would report information in an accurate manner.
Another assumption of the study was that superintendents would be familiar with the
components of the CCRPI as outlined in Georgia’s Waiver of the Elementary and

11
Secondary Education Act (2012). Because language from the balanced scorecard
literature was embedded into survey items (see Appendix B for more information), an
assumption was made that the superintendents would be familiar with terminology and
would also be cognizant of their respective school district balanced scorecards or other
school district performance management system.
Given the November-December, 2014 survey administration, an assumption was
made that newly employed superintendents would have had the opportunity to become
aware of their district’s respective balanced scorecard or other school district
performance management system as it related to both goal alignment as well as the new
accountability performance measures in the CCRPI. Another assumption of the study was
that each respondent from the sample of Georgia school superintendents would be
serving on a full-time, non-interim basis.
Definition of Terms
Terms unique to the study pertained to both balanced scorecards in the public and
private sector as well as information from Georgia’s Waiver of ESEA (2012).
Alert Schools: According to Georgia’s Waiver of the Elementary and Secondary
Education Act (2012), Georgia will identify, “…Graduation Alert Schools, Subgroup
Alert Schools, and Subject Alert Schools” (p. 37). Graduation Alert Schools are “High
Schools whose subgroup graduation rate falls at or below the third standard deviation
compared to the statewide subgroup average” (p. 65). Subgroup Alert Schools are
“Schools whose subgroup performance on any statewide assessment falls at or below the
third deviation compared to the subgroup’s state average” (p. 65). Subject Alert Schools

12
are “Schools whose subject area performance on any statewide assessment falls at or
below the third deviation compared to the subject’s state average” (p. 65).
Alignment: Kaplan and Norton (2001) defined alignment as the linking and
integrating of strategies across all subgroups or departments in the organization. To
provide contrast, they explained the opposite of alignment, “Functional silos arise and
become a major barrier to strategy implementation since most organizations have great
difficulty communicating and coordinating across these specialty functions” (p. 149).
Thus, alignment was defined as the elimination of working in isolation and was
characterized by an integration of common strategies across departments and individuals
in keeping with organizational goals.
Balance: In the context of the private sector balanced scorecards, Kaplan and
Norton (1996b) defined balance as a combination of leading and lagging indicators
encompassing both financial and non-financial measures. Within the construct of balance,
Kaplan and Norton (1992) emphasized four perspectives focused on four questions, “how
do customers see us? (customer perspective); what must we excel at? (internal
perspective); can we continue to improve and create value? (innovation and learning
perspective); how do we look to shareholders? (financial perspective)” (p. 72). Balance
within Georgia school district scorecards has been defined as the inclusion of indicators
that focus on both external accountability mandates, while also looking at other aspects of
schooling that address perspectives of local constituents (Georgia Leadership for School
Improvement, personal attendance, February 9, 2010). School district balanced
scorecards also used the term balance to refer to a combination of leading and lagging
indicators including both short-term and long-term goals (Kaplan & Miyake, 2010).

13
Balanced Scorecard: When describing balanced scorecards, Kaplan and Norton
(1996a) explained, “The Balanced Scorecard translates an organization’s mission and
strategy into a comprehensive set of performance measures that provides the framework
for a strategic measurement and management system” (p. 2).
Cascading: According to Niven (2008), cascading is a process that aligns
overarching strategies in the balanced scorecard throughout an organization. The process
of cascading enables individuals and subunits of the organization to show how their daily
work is in alignment with long-term organizational objectives.
Charter School District: A charter school district can be defined as a school
system that has the flexibility to operate outside of certain state and federal guidelines to
serve students in the district (Georgia Department of Education, 2014; Office of the
Lieutenant Governor, 2014).
College and Career Ready Performance Index (CCRPI): Within Georgia’s
waiver of ESEA (2012), the CCRPI was the set of criteria on which Georgia schools were
evaluated beginning in the 2012-2013 school year. Within the CCRPI were three
categories through which schools received a numerical score, two categories which
yielded star ratings, and related performance flags that highlighted subgroup and subject
academic performance levels. The numerical score was used to reflect a composite of
three student achievement metrics: achievement score, achievement gap closure score,
and progress score. An additional category, entitled Factors for Success, enabled schools
to gain up to three more points for their documented use of researched-based practices in
their school. Star ratings were used to evaluate schools on two categories: financial
efficiency and school climate with a maximum score of five stars. The star ratings were

14
given in addition to the numerical score and did not factor into the numerical calculations
for student achievement.
Focus Schools: According to Georgia’s Waiver of the Elementary and Secondary
Education Act (2012), a Focus School was “A Title I school that has the largest within-
school gaps between the highest-achieving subgroup or subgroups and the lowest-
achieving subgroup or subgroups or, at the high school level, has the largest within-
school gaps in graduation rates (‘within-school-gaps’ focus school)” (p. 37). An
additional Focus School definition was offered, ”A Title I high school with a graduation
rate less than 60 percent over a number of years that is not identified as a priority school
(‘low-graduation-rate’ focus school)” (p. 37).
Indicator: Another name for a performance measure.
Lagging Indicator: Figge, Hahn, Schaltegger, and Wagner (2002) offered the
following definition: “Lagging indicators and long-term strategic objectives are
formulated for the strategic core issues of each perspective derived from the strategy of
the business unit. Lagging indicators thus indicate whether the strategic objectives in
each perspective were achieved” (p. 271, emphasis in the original).
Leading Indicator: Figge et al. (2002) explained leading indicators:
In contrast to the lagging indicators, the leading indicators are very firm specific.
They express the specific competitive advantages of the firm and represent how
the results—reflected by the lagging indicators—should be achieved. Based on
the specific strategy of the business unit, the key performance drivers that have
the greatest influence on the achievement of the core strategic objectives
(measured by lagging indicators) are identified for every perspective. (p. 271,
emphasis in the original)
Other School District Performance Management System: A term specific to
this study that defines a school district goal management system that is different from a

15
balanced scorecard. Examples could include school district strategic plans or school
district performance dashboards.
Priority Schools: According to Georgia’s Waiver of the Elementary and
Secondary Education Act (2012), a Priority School is defined as:
A school among the lowest five percent of Title I schools in the state based on the
achievement of the ‘all students’ group in terms of proficiency on the statewide
assessments and has demonstrated a lack of progress on those assessments over a
number of years in the ‘all students’ group; A Title I-participating or Title I-
eligible high school with a graduation rate less than 60 percent over a number of
years; or A Tier I or Tier II school under the School Improvement Grants (SIG)
program that is using SIG funds to implement a school intervention model. (p. 37)
Strategy Maps: Niven (2008) explained strategy maps as “A one-page graphical
representation of what must be done well in order to execute strategy. Strategy maps are
composed of performance objectives spanning the four perspectives and linking together
to tell the organization’s strategic story” (p. 350).
Student Enrollment: The number of students enrolled in a district or school at a
given time during the school year.
Federal Per Pupil Expenditure: The total amount of federal money spent in a
given school district divided by the total number of students enrolled in the school
district.
Transparency: In the context of the private sector, information transparency is
defined as visibility and accessibility to company information (Zhu, 2002). When
describing balanced scorecard use, Cowart (2010) explained school district transparency
as providing access to all members in the school and community with information about
school goals, operations, and performance.

16
Limitations of the Study
One limitation of the study was the sample size of Georgia school superintendents
who responded to the study and reported on their level of district performance goal
alignment (n = 72). A second limitation of the study was the relatively new and
mathematical nature of the terminology in the CCRPI from the ESEA waiver (2012), and
the use of these terms in survey items (see Appendix B for more information). When
administering the survey, there could have also been limitations based on the self-
reporting of Georgia school superintendents with respect to each variable examined.
Other limitations could be related to different levels of superintendent knowledge with
respect to balanced scorecards and the reporting of information about each district’s
specific performance goals by superintendents who were surveyed.
Overview of the Method
This study employed a quantitative, survey-based approach to examine the extent
to which Georgia school superintendents reported alignment of their balanced scorecards
or other school district performance systems in response to five research questions. In
addition, a categorical approach was used to compare perceptions of Georgia school
superintendents across each research question. When using surveys, Litwin (1995)
explained, “measurement error refers to how well or poorly an instrument performs in a
particular population” (p. 6). To limit errors and threats to validity, Fraenkel, Wallen, and
Hyun (2012) recommended “collecting additional information before a study begins” (p.
180). To minimize error, the survey was piloted on multiple district office educators who
have multiple years of experience with balanced scorecards, school district performance
17
goals, and accountability metrics. From the pilot, feedback was obtained on each item
and the survey as a whole, and adjustments were made based on the feedback.
To address research questions 1 and 2, superintendents were asked what
performance goal management system they used and the extent to which their
management system was aligned to categories in the CCRPI, “…that contribute to a
school district’s overall numerical score and star ratings” (Georgia Department of
Education, 2012a, p. 62). To address research question 3, superintendents were asked
whether or not their district had approved charter system status or not, and each group’s
perceived CCRPI alignment score was compared. Research question 4 examined the
relationships between superintendent years of experience and perceived alignment to the
CCRPI. Research question 5 examined the relationship between student enrollment in the
district and perceived alignment to the CCRPI.
Organization of the Dissertation
Chapter 1 provides both the context and rationale for the study including
statement of the problem, research questions, and hypotheses. Chapter 2 presents a
review of literature on balanced scorecard use in the private and public sector as well as
information pertaining to Georgia’s CCRPI. Chapter 3 presents the research methodology
and describes processes such as survey development and validation, sample used, and
how data were collected and analyzed. Chapter 4 presents the results of the study and
analysis of data. Chapter 5 includes a discussion of results from the study, implications,
and potential ideas for future research.

18
CHAPTER 2
REVIEW OF RELEVANT LITERATURE
The purpose of the study was to obtain perceptual data from Georgia school
superintendents about the extent to which district balanced scorecards and performance
goals were aligned to the College and Career Ready Performance Index (CCRPI) as
outlined in Georgia’s ESEA waiver (2012). Additionally, perceptual data were
categorically analyzed to determine similarities and differences between Georgia school
superintendent responses from different district enrollment sizes, levels of superintendent
experience, and district governance structures. Each categorical variable was examined
with respect to balanced scorecard alignment to the CCRPI as outlined in Georgia’s
ESEA waiver (2012). An overall superintendent alignment score was also generated for
each subcategory in the CCRPI.
Research Questions and Hypotheses
The study was organized around five research questions:
1. Are there differences in superintendents’ overall perceived alignment to the
following subcategories in the CCRPI: student achievement, post high school
readiness, progress, and achievement gap?
2. Is there a difference in perceived alignment to the CCRPI between
superintendents in school districts using balanced scorecards and superintendents
in school districts using other school district performance management systems?

19
3. Is there a difference in perceived CCRPI alignment between superintendents who
reported charter system status and superintendents who reported non-charter
system status?
4. Are there differences in perceived alignment to the CCRPI between
superintendents with different experience levels?
5. Are there differences in perceived alignment to the CCRPI between
superintendents with different levels of student enrollment?
Hypotheses
Hypotheses addressing each research question were phrased in the null.
1. There are no significant differences in superintendents’ overall perceived
alignment to the following subcategories in the CCRPI: student achievement, post
high school readiness, progress, and achievement gap.
2. There is no significant difference in perceived alignment to the CCRPI between
superintendents in school districts using balanced scorecards and superintendents
in school districts using other school district performance management systems.
3. There is no significant difference in perceived CCRPI alignment between
superintendents who reported charter system status and superintendents who
reported non-charter system status.
4. There are no significant differences in perceived alignment to the CCRPI between
superintendents with different levels of experience.
5. There are no significant differences in perceived alignment to the CCRPI between
superintendents with different levels of school district student enrollment.

20
A review of literature pertaining to balanced scorecards revealed a multitude of
business-related studies and analyses (Ittner et al., 2003; Kaplan & Norton, 1996b;
Malina & Selto, 2001; Norreklit, 2000), but few articles related to school district use of
balanced scorecards (Karathanos & Karathanos, 2005). A majority of the articles were
not research-based, and these articles ironically addressed Georgia school district
balanced scorecard implementation (Cowart, 2010; Glennon, 2010; Kaplan & Miyake,
2010). At the time of the study, there was no research examining how Georgia school
districts would manage the accountability expectations outlined in the CCRPI. Following
this literature review, a need to examine balanced scorecard use by Georgia school
districts emerged concurrently with a need to examine how districts would manage the
new accountability expectations outlined in the CCRPI.
A quantitative survey-based method was employed to obtain perceptual data from
Georgia school district superintendents addressing the level to which they aligned their
district performance goals to the CCRPI and subcategories within it. In addition,
superintendents were asked to self-report certain demographic information into
categories. The categorical variables were also studied in the context of performance goal
alignment to the CCRPI. An item pertaining to school districts also addressed which
performance goal management system schools within their district used. Following a
categorical analysis of the perceptions of superintendents using the balanced scorecard
compared to perceptions of superintendents using other school district performance
management systems, mean differences in perceived CCRPI alignment were tested for
the following variables: whether or not the district was an approved charter system,

21
number of years of experience of the superintendent, and district student enrollment
levels.
Overview of the Balanced Scorecard
The concept of the balanced scorecard was conceived by Robert Kaplan of the
Harvard business school and David Norton, a business performance management
consultant, as a tool for corporate leaders to manage non-financial measures that drive
future performance in conjunction with performance outcomes or financial measures
(Kaplan & Norton, 1992; Kaplan & Norton, 1996b). Norreklit (2000) described the
cause-and-effect relationship assumed in seminal balanced scorecard literature, “It
contains outcome measures and the performance drivers of outcomes, linked together in
cause-and-effect relationships, and thus aims to be a feed-forward control system” (p.
65). While the cause-and-effect assumption of balanced scorecards has been challenged
in scholarly literature (Ittner & Larcker, 1998), the link between financial and non-
financial measures is the central theme of the balanced scorecard as a “strategic
management system” (Kaplan & Norton, 1996a, p. 10, emphasis in the original).
When describing value creation in terms of non-financial measures used in the
balanced scorecard, Niven (2008) explained, “Today’s system must have the capabilities
to identify, describe, monitor, and fully harness the intangible assets driving
organizational success” (p. 5). Kaplan and Norton (1996a) defined how businesses have
used four drivers of future performance in their balanced scorecards:
Innovative companies are using the scorecard as a strategic management system,
to manage their strategy over their long run. They are using the measurement
focus of the scorecard to accomplish critical management processes:
1. Clarify and translate vision and strategy
2. Communicate and link strategic objectives and measures

22
3. Plan, set targets, and align strategic initiatives
4. Enhance strategic feedback and learning (p. 10, emphasis in the original)
To further articulate the focus on the human capital and innovative aspects of the
balanced scorecard, Kaplan and Norton (1996a) explained, “Information age companies
will succeed by investing in and managing their intellectual assets” (p. 18)
In addition to the four management processes, Kaplan and Norton (1996a)
outlined four perspectives to be addressed in balanced scorecards with supporting
questions:
Financial– To succeed financially, how should we appear to our stakeholders?
Customer– To achieve our vision, how should we appear to our customers?
Internal Business Process– To satisfy our shareholders and customers, what
business processes must we excel at?
Learning and Growth– To achieve our vision, how will we sustain our ability to
learn and improve? (p. 77)
A critical assumption of balanced scorecards is the linkage between these financial and
non-financial indicators (Ittner et al., 1997; Norreklit, 2000).
Cascading the Balanced Scorecard
In both public and private sector contexts, the balanced scorecard has been used
as an organizational alignment tool to be communicated using a process known as
cascading by which common language and strategies are shared from leadership teams to
individuals and subunits in the organization (Kaplan & Norton, 2001). Kaplan and
Miyake (2010) described cascading between school districts and schools, “With the
cascading of the strategy from the district level down to the schools, each level becomes
more aligned and accountable for district performance” (p. 14). Woodley (2006)
explained that cascading is a critical component in the quality of balanced scorecard
implementation and described an absence of cascading as a barrier to successful strategy

23
management. Cascading is also the role of school improvement leadership teams when
communicating school improvement goals and strategies to departments and individuals
within the school and school community (Georgia Leadership Institute for School
Improvement, personal attendance, February 9, 2010).
Balance of the Balanced Scorecard
One primary component of the balanced scorecard emphasized in business
literature is the notion of achieving balance across multiple levels that impact
organizational performance (Kaplan & Norton, 1996b). In seminal balanced scorecard
literature, one type of balance was described as the organization’s simultaneous focus on
both external and internal perspectives (Ittner et al., 2003; Kaplan & Norton, 1992).
Kaplan and Norton (2001) explained that the internal perspective should be linked to the
external or customer perspective in order to achieve quality of balanced scorecard
implementation. The idea of directly linking a company’s internal actions with outcomes
such as customer perspective (external) is consistent with the cause-and-effect chain
commonly debated in balanced scorecard literature (Malina & Selto, 2001; Norreklit,
2000). In their study of the subjectivity of the association between performance variables
and weighting, Ittner et al. (2003) explained an observed imbalance when examining
private sector balanced scorecards:
These analyses indicate that financial par scores were used more frequently and
received greater weight than nonfinancial par scores. As hypothesized, both the
financial and customer par scores, which were based on externally oriented,
quantitative results measures, received greater emphasis than the more qualitative,
internally oriented customer, people, and control par scores. (p. 742)
Thus, it appeared that many of the companies analyzed placed more emphasis on
financial bottom lines and quantitative measures than the qualitative factors emphasized

24
in the seminal balanced scorecard literature (Kaplan & Norton, 2001). Similarly, when
using balanced scorecards, school districts are faced with the task of concurrently
managing the external perspective of accountability mandates alongside the internal
perspective of local constituents (Georgia Leadership Institute of School Improvement,
personal attendance, February 9, 2010).
Another type of balance within balanced scorecards pertains to the interplay
between non-financial and financial indicators often referred to as leading (non-financial)
indicators and lagging (financial) indicators (Ittner & Larcker, 2001; Kaplan & Norton,
1996). When describing these terms in the context of a Georgia school district, Kaplan
and Miyake (2010) explained:
The balanced scorecard captures both the financial and the nonfinancial elements
of the strategy and describes the cause-and-effect linkages that drive results. It
allows a district to look ahead, with leading indicators, rather than always looking
back with lagging indicators. (p. 12)
Figge et al. (2002) further explained that leading indicators are very specific to each
respective organization. Kaplan and Norton (1996a) described leading indicators as the
drivers that translate strategy into action.
In addition, the balanced scorecard literature described another form of balance as
the inclusion of both short-term and long-term goals in balanced scorecards (Bieker &
Waxenberger, 2002; Kaplan & Miyake, 2010; Karathanos & Karathanos, 2005). Figge et
al. (2002) described short-term versus long-term strategy management in the context of
corporate balanced scorecards:
By linking operational and non-financial corporate activities with causal chains to
the firm’s long-term strategy, the Balanced Scorecard supports the alignment and
management of all corporate activities according to their strategic relevance. The
Balanced Scorecard makes it possible to take into account non-monetary strategic

25
success factors that significantly impact the economic success of a business. (p.
269)
Kaplan and Norton (1996b), in seminal balanced scorecard literature, explained the
importance of managing both short-term and long-term goals at the individual or
employee level when they shared, “Meeting short-term financial targets should not
constitute satisfactory performance when other measures indicate that the long-term
strategy is either not working or is not being implemented well” (p. 80).
Challenges to the Balanced Scorecard Assumptions
The assumed cause-and-effect relationship between leading and lagging indicators
is a cornerstone of corporate balanced scorecard strategic management (Kaplan &
Norton, 1992; 1996a; 2001). While the assumed link between long-term financial
outcomes and short-term organizational strategies is described as the driving force behind
the notion that balanced scorecards add value to organizations (Niven, 2008), researchers
have challenged the idea that any causal relationship can exist between leading and
lagging indicators (Ittner & Larcker, 2001; Malina & Selto, 2001). Despite some
skepticism from researchers about the causal chain inherent in balanced scorecards, since
its inception, a growing number of businesses (Krumwiede et al., 2008) and Georgia
school districts have adopted balanced scorecards moving into the second decade of the
21st Century (Georgia Leadership Institute for School Improvement, personal attendance,
February 9, 2010; Kaplan & Miyake, 2010).
Balanced Scorecards and Organizational Alignment
Organizational alignment to goals and relevant information was another common
theme in the balanced scorecard literature (Kaplan & Norton, 1996b, 2001; Niven, 2008).
According to Kaplan and Nagel (2003), “The company uses the scorecard to align the
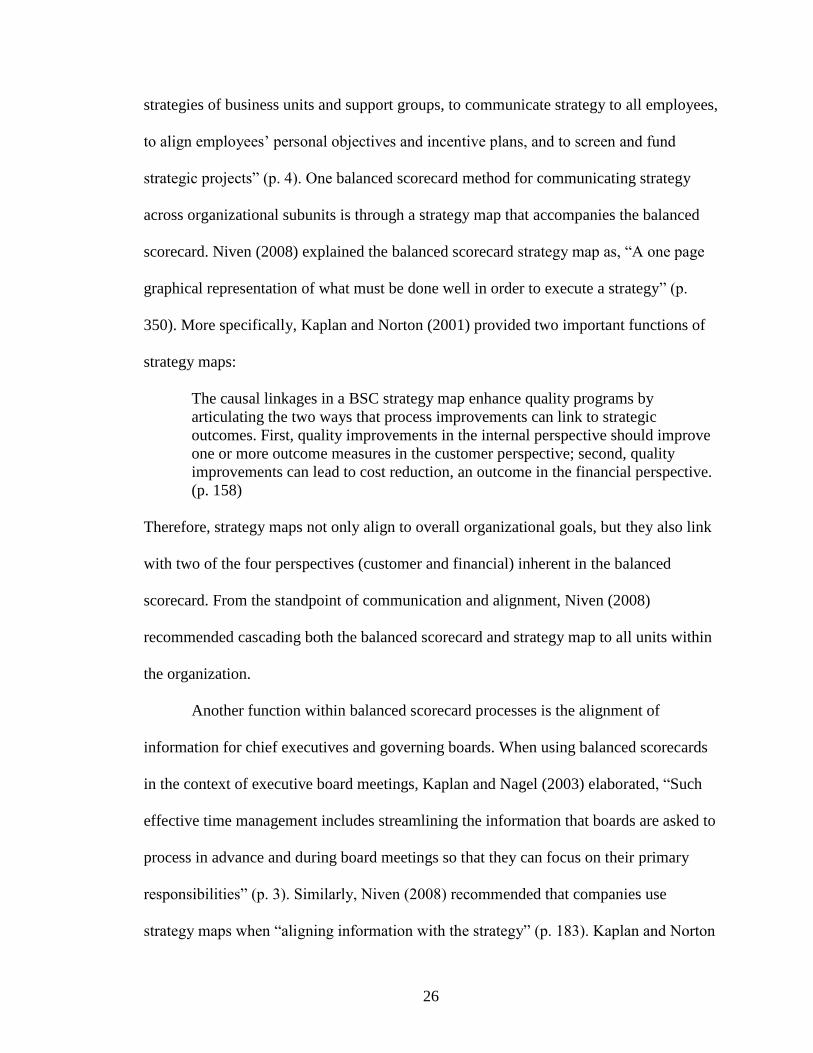
26
strategies of business units and support groups, to communicate strategy to all employees,
to align employees’ personal objectives and incentive plans, and to screen and fund
strategic projects” (p. 4). One balanced scorecard method for communicating strategy
across organizational subunits is through a strategy map that accompanies the balanced
scorecard. Niven (2008) explained the balanced scorecard strategy map as, “A one page
graphical representation of what must be done well in order to execute a strategy” (p.
350). More specifically, Kaplan and Norton (2001) provided two important functions of
strategy maps:
The causal linkages in a BSC strategy map enhance quality programs by
articulating the two ways that process improvements can link to strategic
outcomes. First, quality improvements in the internal perspective should improve
one or more outcome measures in the customer perspective; second, quality
improvements can lead to cost reduction, an outcome in the financial perspective.
(p. 158)
Therefore, strategy maps not only align to overall organizational goals, but they also link
with two of the four perspectives (customer and financial) inherent in the balanced
scorecard. From the standpoint of communication and alignment, Niven (2008)
recommended cascading both the balanced scorecard and strategy map to all units within
the organization.
Another function within balanced scorecard processes is the alignment of
information for chief executives and governing boards. When using balanced scorecards
in the context of executive board meetings, Kaplan and Nagel (2003) elaborated, “Such
effective time management includes streamlining the information that boards are asked to
process in advance and during board meetings so that they can focus on their primary
responsibilities” (p. 3). Similarly, Niven (2008) recommended that companies use
strategy maps when “aligning information with the strategy” (p. 183). Kaplan and Norton

27
(2001) also recommended using balanced scorecards to assist with presenting aligned
information about strategy implementation and to include this information in a standing
agenda item during executive meetings. Kaplan and Norton (1996a) also explained how
strategic business units (SBUs) within an organization could use their own areas of
specialization to focus on certain overall company objectives from the balanced
scorecard, and they pointed out that the company could take an aggregate total of
performance of all SBUs to generate the company’s overall performance on a given
balanced scorecard performance measure.
Balanced Scorecards as Management and Evaluation Tools
While empirical research on the balanced scorecard is scant (Boulianne, 2006),
balanced scorecards have been studied as private sector management tools (Ittner &
Larcker, 2001; Lipe & Salterio, 2000; Malina & Selto, 2001). After examining manager
and employee perceptions, Lipe and Salterio (2000) found that non-financial measures
had no effect on managers’ evaluation of employees. Based on this finding, it was
concluded that non-financial measures, a central tenet of balanced scorecard literature
(Kaplan & Norton, 1996a), were not receiving the attention by managers as they were
intended. Similarly, Ittner and Larcker (2001) found that the value-based management
aspect of balanced scorecards was problematic beginning with what content is chosen to
be measured as well as how it is measured by managers. While Malina and Selto (2001)
noted that more attention is given to financial indicators than non-financial indicators,
their research did indicate that the balanced scorecard can be an effective strategic
management tool when communication between organizational levels was perceived to
be collaborative and effective.

28
Knowledge Management and Balanced Scorecards
Within the much debated value-based management model that defines balanced
scorecards (Ittner & Larcker, 2001) is the qualitative component of employee knowledge
management—which has extensively been examined in the business literature (Arora,
2002; Teece, 1998; Woodley, 2006). When describing the ambiguity of measuring
intellectual capital—a central theme within the balanced scorecard framework—Figge et
al. (2002) positioned:
The concept of the BSC is based on the assumption that the efficient use of
investment capital is no longer the sole determinant for competitive advantages,
but increasingly soft factors such as intellectual capital, knowledge creation or
excellent customer orientation become more important. (p. 270)
Teece (1998) described this knowledge management focus by explaining that intangible
assets are critical factors that separate companies from one another, while also offering
the hypothesis that intellectual capital would be one of the “…key sources for wealth
creation in the new millennia” (p. 76). While employee learning and growth is one of the
four critical components of corporate balanced scorecards (Kaplan & Norton, 1992,
1996b, 2001), it is considered hard to measure and to link with outcomes (Ittner, Larcker,
& Randall, 2003).
Balanced Scorecards and Educational Leadership Perspectives
The initial balanced scorecard literature addressed private sector, for-profit goals,
and a top-down corporate approach (Bieker & Waxenberger, 2002). In 2012, an
abundance of balanced scorecard literature existed addressing the business perspective,
while there was very little information about balanced scorecard use in public school
districts (Karathanos & Karathanos, 2005). In this literature examination, the only
literature on school districts pertained to the balanced scorecard processes used by the

29
Chatuga School District of Anchorage, Alaska (Karathanos & Karathanos, 2005) in
conjunction with practitioner journal articles addressing the perspectives of two Georgia
school districts (Cowart, 2010; Glennon, 2010; Kaplan & Miyake, 2010).
When comparing the public sector to the private sector, there are both similarities
and differences between balanced scorecard design and implementation (Kaplan, 2008).
Differences gleaned from the literature pertained to both financial outcomes as well as
employee compensation. For example, Kaplan (2008) explained that local input, in non-
profit organizations, was of more importance than financial production. While Kaplan
and Miyake (2010) pointed out that compensation is not part of the school district
management system they studied, they did, however, state that the ongoing measurement
and communication of goals was still important to motivation and effective management
when using balanced scorecards in school districts.
Similarities observed across public and private sector balanced scorecard
literature included the use of the balanced scorecard as a communication and strategic
alignment tool with an overarching purpose of cascading goals and strategies across all
units within the organization (Kaplan & Norton, 1996a; Niven, 2008). Both public and
private sector balanced scorecards were also designed to concurrently consider short-term
and long-term goals as well as internal and external perspectives (Kaplan & Miyake,
2010; Kaplan & Norton, 1996b). Positive outcomes pertaining to both organizational
alignment and communication were reported in both private and public sector balanced
scorecard literature (Cowart, 2010; Glennon, 2010; Kaplan & Miyake, 2010; Malina &
Selto, 2001).

30
School Districts as Loosely Coupled Organizations
Weick (1982) described schools as loosely coupled organizations. Within his
description, Weick stated that when loose coupling occurs in schools, “…different people
have different goals” (p. 676). In a follow-up to this article, Orton and Weick (1990)
stated that in the context of loosely coupled organizations, “The three most frequently
recurring managerial strategies are enhanced leadership, focused effort, and shared
values” (p. 211). Some highlighted components of enhanced leadership were unification
of goals and interaction with employees. Focused effort was described as, “…ways in
which individuals can compensate for loose coupling by carefully selecting targets,
controlling resources, and acting forcefully” (Orton & Weick, 1990, p. 212). A third
compensation for loose coupling was referred to as shared values across the organization.
In total, loose coupling was communicated as a challenge for educational leaders and for
educational organizations attempting to monitor and achieve desired outcomes (Orton &
Weick, 1990; Weick, 1982).
In recent literature, Marzano and DuFour (2010) explained that when a district
office does not provide direction, site based management in schools has “proved faulty”
(p. 28). Similarly, a completely top-down district leadership approach has also failed to
foster clarity and commitment across schools (Fullan, 2007). Research instead indicated
that clear direction from the school district balanced with the provision of some latitude
at the school level when implementing district expectations was the most proven method
for school district leadership to have a positive impact on student achievement (Marzano
& Waters, 2009). Thus, in more current studies of school districts as loosely coupled

31
organizations, a call for both tighter coupling, common goal setting, and sharing of
knowledge across schools was recommended (DuFour & Marzano, 2010; Elmore, 2004)
Problems of Practice in School Districts
When describing problems that schools face as they address accountability
mandates and accompanying expectations for improvement, O’Day (2002) described
three problem areas:
Problem 1: The school is the unit of intervention, yet the individual is the unit of action.
Problem 2: External control seeks to influence internal operations.
Problem 3: Information is both problematic in schools and essential to school
improvement. (pp. 295-296, emphasis in the original)
These problem areas are closely associated with characteristics of schools addressed in
other literature past and present such as teachers working as isolated entities within the
larger school context and culture (DuFour, 2004; Lortie, 1975; Musanti & Pence, 2010),
school districts as loosely coupled organizations (Marzano & Waters, 2009; Orton &
Weick, 1990; Weick, 1975), communication breakdowns between school stakeholders
during the change process (Hargreaves & Fullan, 1992; Marzano, Waters, & McNulty,
2005), and the need for sense making while implementing reforms (Louis et al., 2005;
Spillane, 2004; Tyack & Cuban, 1995).
District Office Leadership
While a vast majority of K-12 literature addressed school level instructional
leadership practices (Hallinger & Heck, 1996; Marks & Louis, 1999; Zepeda, 2011),
research addressing the leadership behaviors of school districts was reviewed for this
study (Daily et al., 2005; Fullan, Bertani, & Quinn, 2004; Leithwood & Prestine, 2002;
Marzano & Waters, 2009; Murphy, 2007; Murphy & Hallinger, 1986; Murphy &
Hallinger, 1988). Within the school district leadership literature, many common themes

32
and best practices emerged such as collaborative goal setting, instructional focus,
monitoring of goals, board of education support, resource allocation, as well as an
emphasis on teacher quality, professional development, and the evaluation of personnel
(Zepeda, Lanoue, Price, & Jimenez, 2014). Of the studies examined, findings from four
studies were examined in depth because of their data collection, reporting, and analyses
occurring in the context of the present school accountability movement and its
relationship to the present study.
Marzano and Waters (2009) described the following five district level
“responsibilities “or “initiatives” that emerged from a meta-analysis of research:
1. Ensuring collaborative goal setting.
2. Establishing nonnegotiable goals for achievement and instruction.
3. Creating board alignment with and support of district goals.
4. Monitoring achievement and instructional goals.
5. Allocating resources to support the goals for achievement and instruction.
6. (p. 6)
The highlighted five school district actions were gleaned from multiple studies across
multiple contexts and ultimately were selected based on their positive association with
student achievement.
In a related synthesis focused on high poverty school districts with high levels of
student achievement, Daily et al. (2005) described seven prominent themes that emerged
as commonalities across high performing school districts analyzed:
1. Successful districts focus first and foremost on student achievement and
learning.
2. Successful districts have a theory of action for how to effect improvements,
and they establish clear goals.
3. Successful districts enact comprehensive, coherent reform policies.
4. Educators in successful districts accept personal responsibility for improving
student learning and receive support to help them succeed.
5. Successful districts are committed to professional learning at all levels and
provide multiple, meaningful learning opportunities.

33
6. Successful districts use data to guide improvement strategies.
7. Successful districts regularly monitor progress and intervene if necessary.
(pp. 2-5)
Following the identification of the seven prominent themes, four other secondary
themes—those occurring with less frequency, while still showing a positive association—
were also reported. Among the secondary themes emphasized were partnerships with
stakeholders, shared responsibility between the school and district, resource allocation,
and support specifically tailored to schools.
In another related study that emphasized leadership with a focus on learning in the
context of both schools and school districts, Murphy (2007) described 10 principle
actions that were observed and communicated as recommendations:
1. Develop and steward vision
2. Hire, allocate, and support quality staff
3. Maximize content coverage in an aligned curriculum
4. Monitor student progress
5. Establish positive expectations for academic learning
6. Maintain high visibility and involvement
7. Promote student and teacher incentives
8. Promote professional development and practice
9. Develop a supportive work environment
10. Forge home-school links (pp. 72-82)
When describing the context of the research, Murphy (2007) emphasized that each of the
10 principles were particularly critical during an era of increased school accountability
and school restructuring resulting from NCLB. The 10 principles described in the
research were observed in the actions of both superintendents and principals; thus the
data included both the school and district leadership contexts.
Fullan et al. (2004) synthesized a series of research findings and offered 10
recommendations for district office leaders:
1. Leading with a compelling, driving conceptualization

34
2. Collective moral purpose
3. The right bus
4. Capacity building
5. Lateral capacity building
6. Ongoing learning
7. Productive conflict
8. A demanding culture
9. External partners
10. Growing financial investments (pp. 42-46)
The “right” bus was characterized by the school district analyzing employee roles,
collaborative structures, and internal leaders within the school district to ensure that goals
have the best chance of being met. To get personnel on the right bus, Fullan et al. (2004)
described the benefits of school and district reorganization including the strategic
placement of human resources to heighten focus on the school district’s most prioritized
objectives.
Commonalities in Balanced Scorecards and School District Research
Following a review of the balanced scorecard literature (Kaplan & Miyake, 2010;
Kaplan & Norton, 1996b; 2001; Niven, 2008) and school district leadership studies
(Dailey et al., 2005; Fullan et al., 2004; Marzano & Waters, 2009; Murphy, 2007), some
common themes emerged across each. First, both balanced scorecard literature and
school district literature emphasized goal setting and clear communication of goals
throughout the organization. A second common theme was support for organizational
learning aligned with established goals. A third theme was monitoring of both formative
and summative indicators also known as leading and lagging indicators in balanced
scorecard literature (Kaplan & Norton, 2001). A fourth theme was organizational
alignment and tight coupling across subunits of the organization. Marzano and Waters
(2009) emphasized that fostering tighter coupling within school districts was the only
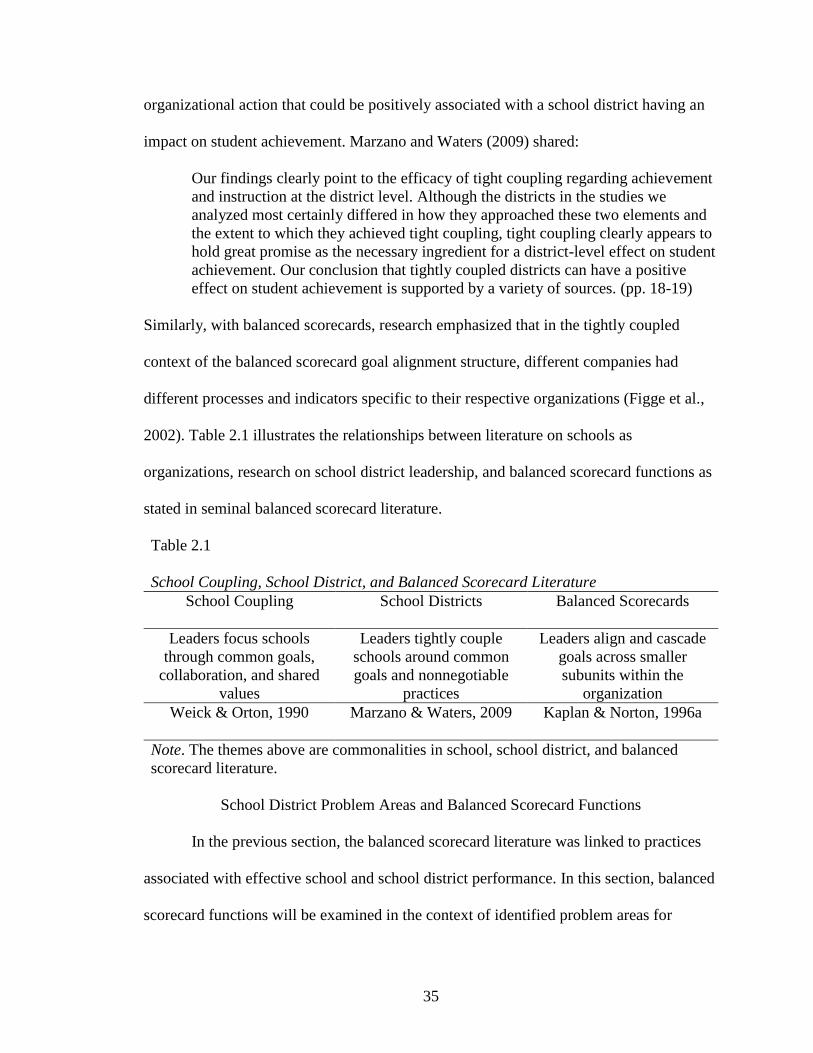
35
organizational action that could be positively associated with a school district having an
impact on student achievement. Marzano and Waters (2009) shared:
Our findings clearly point to the efficacy of tight coupling regarding achievement
and instruction at the district level. Although the districts in the studies we
analyzed most certainly differed in how they approached these two elements and
the extent to which they achieved tight coupling, tight coupling clearly appears to
hold great promise as the necessary ingredient for a district-level effect on student
achievement. Our conclusion that tightly coupled districts can have a positive
effect on student achievement is supported by a variety of sources. (pp. 18-19)
Similarly, with balanced scorecards, research emphasized that in the tightly coupled
context of the balanced scorecard goal alignment structure, different companies had
different processes and indicators specific to their respective organizations (Figge et al.,
2002). Table 2.1 illustrates the relationships between literature on schools as
organizations, research on school district leadership, and balanced scorecard functions as
stated in seminal balanced scorecard literature.
Table 2.1
School Coupling, School District, and Balanced Scorecard Literature
School Coupling School Districts Balanced Scorecards
Leaders focus schools
through common goals,
collaboration, and shared
values
Leaders tightly couple
schools around common
goals and nonnegotiable
practices
Leaders align and cascade
goals across smaller
subunits within the
organization
Weick & Orton, 1990 Marzano & Waters, 2009 Kaplan & Norton, 1996a
Note. The themes above are commonalities in school, school district, and balanced
scorecard literature.
School District Problem Areas and Balanced Scorecard Functions
In the previous section, the balanced scorecard literature was linked to practices
associated with effective school and school district performance. In this section, balanced
scorecard functions will be examined in the context of identified problem areas for

36
schools and school districts. For example, O’Day (2002) identified three problem areas
for schools in the context of the current accountability expectations. The first problem
area stated, “The school is the unit of intervention, yet the individual is the unit of action”
(p. 95, emphasis in the original). In the literature, the use of balanced scorecards and
accompanying strategy maps was intended to cascade goals across the organization
moving all the way to the individual or employee level (Niven, 2008). More specifically,
to articulate alignment, balanced scorecards functioned as vehicles to communicate
organizational goals and to collect data pertaining to progress on objectives across all
stakeholder groups including managers, department heads, employees, stockholders,
decision-making boards, and chief executives (Chi & Hung, 2011; Kaplan & Nagel,
2003; Ling et al., 2009).
O’Day (2002) also communicated a second problem area for schools, “External
control seeks to influence internal operations” (p. 295, emphasis in the original).
Glennon (2010) described an analogous link or alignment between the district balanced
scorecard and school balanced scorecards:
Using the same format, with consistent strategic goal areas and performance
objectives for each school and the district, not only helped the school’s inner
workings; it also increased the capacity of school personnel to communicate with
each other and align their work. (p. 18)
Thus, schools were able to participate in creating their own balanced scorecards by
participating in the same process, while using internal capacity and input to align to both
district processes and outcomes.
O’Day (2002) identified a third problem area for schools in the context of
increased accountability, “Information is both problematic in schools and essential to
school improvement” (p. 296, emphasis in the original). Cowart (2010), a Georgia school

37
superintendent, described the balanced scorecard communication function pertaining to
the flow of information, “The balanced scorecard enabled us to communicate current
performance levels to all stakeholders objectively, clearly, and continually” (p.17). From
the private sector perspective, one theme of balanced scorecards is the alignment of goals
and actions across the organization (Kaplan & Norton, 1996a). Malina and Selto (2001)
explained, “Because the BSC [balanced scorecard] explicitly focuses on links among
business decisions and outcomes, it is intended to guide strategy development,
implementation, and communication” (p. 48). Kaplan and Norton (1996b) shared that the
balanced scorecard, “… lets managers communicate their strategy up and down the
organization and link it to departmental and individual objectives” (p. 76). With respect
to information exchange, balanced scorecards are both intended to streamline information
for executives and managers (Kaplan & Nagel, 2003) and to cascade information aligned
to the goals of the organization to all units within the organization (Niven, 2008).
Balanced Scorecards as Tools to Address Loose Coupling
An additional problem area for schools and school districts is the notion of trying
to achieve goals and monitor performance in a loosely coupled organizational context
(Orton & Weick, 1990; Weick, 1982). A consistent theme across both public and private
balanced scorecard literature is the idea of aligning the organization to common goals and
strategies across each committee, department, and individual in the organization (Chi &
Hung, 2011; Kaplan & Nagel, 2003; Niven, 2008). When further discussing the notion of
loose coupling following an analysis of school district practices, Marzano and Waters
(2009) communicated that tighter coupling is necessary for school districts to have the
desired impact on both instruction and student achievement.
38
School Accountability as a Context
O’Day (2002) categorized the challenges of school-based accountability into three
problem areas: “collective accountability versus individual control, internal versus
external sources of control, and the nature and uses of information for school
improvement” (p. 17). With respect to balanced scorecard literature, the response to
internal relative to external factors, organizational accountability versus individual
control, and strategic use of information for improvement run parallel (Niven, 2008).
Moreover, the balanced scorecard literature illustrates direct alignment to both seminal
business balanced scorecard literature and school district balanced scorecard literature
and practice (Georgia Leadership Institute of School Improvement, personal attendance,
February 9, 2010; Kaplan & Norton, 1996b).
Other researchers examined the role of accountability mandates and described
their influence on how schools organized their work and made sense of their initiatives
and structures (McLaughlin & Mitra, 2001; Tyack & Cuban, 1992). Therefore, the
external perspective could play a major role as school districts adopt processes described
in school district meta-analyses such as the implementation of common goals and
strategies, while school districts are facing increased accountability (Marzano & Waters,
2009). From an ethical standpoint, Bieker and Waxenberger (2002) explained that
balanced scorecard use has an influence on the community, and, therefore, should
directly address this community impact factor; for example, the balanced scorecard
should be designed initially in a manner that considers both ethical and community
factors. In the context of schools facing increased external accountability (Elmore, 2004;
McDonnell, 2005; McNeil et al., 2008), the push-pull between internal and external

39
expectations could be a source of conflict as school districts are faced with the challenge
of achieving balance between internal or local expectations and external factors such as
state or national accountability mandates (Kaplan & Miyake, 2010).
College and Career Ready Performance Index
Germane to the study of balanced scorecard use in Georgia school districts is the
CCRPI. The CCRPI is the index on which each school in Georgia was measured
beginning in 2012-2013. It addresses five main components: achievement score, progress
score, gap closure score, financial efficiency, and school climate (Georgia’s Waiver of
No Child Left Behind, 2012). The Georgia Department of Education explained the first
three calculations which are numerical, “Using a three-pronged approach, Georgia will
calculate an overall CCRPI score to be used within the single statewide accountability
system. This score will reflect a school’s Achievement, Achievement Gap Closure, and
its Progress” (p. 62). The three numerical calculations culminate into an overarching
numerical index score for each school based on a 100-point scale.
In addition to the numerical calculations are two star ratings. According to the
Georgia Department of Education (2012a), “The CCRPI reporting structure will also
include a Financial Efficiency Rating and a School Climate Rating, based on one to five
stars” (p. 62). Therefore, each school will also receive a star rating based on the
categories of financial efficiency and school climate determined from analyses of
documentation and survey results used by the school to ascertain information from
stakeholders about school processes.

40
Accountability Designations in Georgia’s Waiver of NCLB
The Georgia Department of Education (2012a) outlined four school designations:
Priority Schools, Focus Schools, Alert Schools, and Reward Schools. Each of the four
designations with the exception of Reward schools was associated with a specific area or
areas to be addressed by the school. Priority, Focus, and Alert designations were initially
released by the Georgia Department of Education in the spring and summer of 2012 with
each identified school receiving targeted support in their area(s) of need. The following
definitions for Priority, Alert, and Focus schools define the calculations used to identify
each school.
According to Georgia’s Waiver of the Elementary and Secondary Education Act
(2012), a Priority School is defined as:
A school among the lowest five percent of Title I schools in the state based on the
achievement of the ‘all students’ group in terms of proficiency on the statewide
assessments and has demonstrated a lack of progress on those assessments over a
number of years in the ‘all students’ group; A Title I-participating or Title I-
eligible high school with a graduation rate less than 60 percent over a number of
years; or A Tier I or Tier II school under the School Improvement Grants (SIG)
program that is using SIG funds to implement a school intervention model. (p. 37)
Following a sequence for designating schools to receive support, the Georgia Department
of Education identified Priority Schools prior to designating its Focus and Alert Schools.
Therefore, a school, once identified as Priority, was not eligible to be selected as a Focus
or Alert School. An important distinction in the waiver was that only Title I schools were
eligible to be given Priority School status.
According to Georgia’s Waiver of the Elementary and Secondary Education Act
(2012), a Focus School was “A Title I school that has the largest within-school gaps
between the highest-achieving subgroup or subgroups and the lowest-achieving subgroup

41
or subgroups or, at the high school level, has the largest within-school gaps in graduation
rates (‘within-school-gaps’ focus school)” (p. 37). An additional Focus School definition
was offered, ”A Title I high school with a graduation rate less than 60 percent over a
number of years that is not identified as a priority school (‘low-graduation-rate’ focus
school)” (p. 37). A school already identified as Priority was not eligible to be chosen as a
Focus School. Similar to Priority Schools, an important distinction in the waiver was that
only Title I schools were eligible to be selected for Focus School status.
A third designation used in Georgia’s Waiver of NCLB was Alert Schools—
which were subdivided into three types of schools. According to Georgia’s Waiver of the
Elementary and Secondary Education Act (2012), Georgia will identify, “…Graduation
Alert Schools, Subgroup Alert Schools, and Subject Alert Schools” (p. 37). Graduation
Alert Schools are “High Schools whose subgroup graduation rate falls at or below the
third standard deviation compared to the statewide subgroup average” (p. 65). Subgroup
Alert Schools are “Schools whose subgroup performance on any statewide assessment
falls at or below the third deviation compared to the subgroup’s state average” (p. 65).
Subject Alert Schools are: Schools whose subject area performance on any statewide
assessment falls at or below the third deviation compared to the subject’s state average”
(p. 65). Since Focus Schools and Priority Schools were designated prior to Alert Schools,
they were thus ineligible to be identified as Alert Schools though they would be required
to address any alerts within their school improvement plans. Alert Schools, unlike
Priority and Focus Schools, could have either Title I or non-Title I status.

42
Race to the Top Reforms and Georgia’s Education Systems
In 2012, another major accountability and reform initiative in Georgia was Race
to the Top which was in its third year of implementation. The Georgia Department of
Education (2012b) described the funding level and reform plan:
The Race to the Top fund is a $4 billion grant opportunity provided in the
American Recovery and Reinvestment Act of 2009 (ARRA) to support new
approaches to school improvement. The funds are made available in the form of
competitive grants to encourage and reward states that are creating conditions for
education innovation and reform, specifically implementing ambitious plans in
four education reform areas:
Recruiting, preparing, rewarding, and retaining effective teachers and
principals, especially where they are needed most;
Adopting standards and assessments that prepare students to succeed in
college and the workplace and to compete in the global economy;
Building data systems that measure student growth and success, and inform
teachers and principals about how they can improve instruction;
Turning around our lowest–achieving schools. (p. 1)
In 2012, of Georgia’s 180 school districts, 26 were participants in Race to the Top and
accounted for approximately 40 percent of Georgia’s students. In the latter part of 2012,
many of the initiatives being piloted in Race to the Top school districts were being
considered by the state for full adoption or mandatory school and district participation
within three years (Georgia Department of Education, 2012c). The context of Race to the
Top, particularly the focus on data and data systems, was included in the literature review
in consideration of its context and possible impact on how school districts managed their
goals.
School System Governance and Charter Systems
Within Georgia’s public school systems, there was also a governance movement
running concurrently with the accountability movement in which school districts were
required to select from three possible governance structures by June 30, 2015: charter

43
school districts, investment in educational excellence (IE2) districts, or status quo
districts (Georgia Department of Education, 2014). According to the Office of the
Lieutenant Governor (2014), “Lt. Governor Cagle's Charter Systems Act gives individual
school districts the option of stepping out from state and federal mandates to adopt an
educational policy and curriculum that is right for the needs of their students” (p. 1). With
respect to governance, accountability, and flexibility with respect to state and federal
mandates, charter system status was adopted or explored as an option by some Georgia
school superintendents and school boards during the same time the CCRPI was adopted
as Georgia’s accountability index.
School Accountability and Theories of Action
When discussing the goal of educational accountability systems, Perie, Park, and
Klau (2007) explained, “The theory of action explicates the policymakers’ assumptions
about how the accountability system will bring about the desired changes” (p. 19). In the
words of Fullan (2007): “If a healthy respect for and mastery of the change process do
not become a priority, even well-intentioned change initiatives will continue to wreak
havoc among those who are on the firing line” (p. 8). According to Louis et al. (2005),
many school districts instituted internal accountability systems to measure NCLB
indicators; such systems typically consisted of benchmark assessments or checkpoints
throughout the school year to provide feedback on student subgroup performance from
which to respond (McDonnell, 2002). Based on these findings, this research was
designed to examine how districts aligned their goals in the context of new accountability
expectations in Georgia’s CCRPI.

44
Chapter Summary
The purpose of the study was to examine perceptual data from Georgia school
superintendents pertaining to how they addressed district goals in the context of the new
accountability expectations outlined in the College and Career Ready Performance Index
(Georgia Department of Education, 2012a). Analyses examined both differences in
superintendents using balanced scorecards as compared to superintendents using other
performance management systems with respect to the variables: perceived alignment to
accountability categories included in the CCRPI. Additional between groups analysis
addressed the relationships between the alignment variables and categorical independent
variables pertaining to demographic information: district governance structure,
superintendent experience level, and district student enrollment. Perceived levels of
alignment to different subcategories within the CCRPI were also examined.
In both public and private sector literature, data indicated that alignment was a
recurring theme with respect to implementation of the balanced scorecard as a strategic
management tool (Cowart, 2010; Kaplan & Miyake, 2010; Kaplan & Norton, 1996b;
Malina & Selto, 2001). In both empirical and in the practitioner literature, organizational
alignment emerged as a goal of organizations using balanced scorecards (Glennon, 2010;
Kaplan & Norton, 2001; Lipe & Salterio, 2002; Niven, 2008). Another common theme in
both the public and private sector balanced scorecard literature was the collective
management of both internal and external perspectives (Kaplan & Miyake, 2010; Kaplan
& Norton, 1996a).
When school and school district literature was examined, the theme of districts
achieving tighter coupling around common goals emerged in multiple sources (Marzano

45
& Waters, 2009; Orton & Weick, 1990). Inversely, researchers who analyzed problems
with schools and school district performance indicated that both communication and the
disparity between organizational goals and individuals goals was a problem for school
districts (Dailey et al., 2005; O’Day, 2002). Furthermore, there was evidence that
educational policies are theories of action to which schools and school districts are
required to respond (Anderson, 2003).
In the context of increasing school accountability (Elmore, 2004; McDonnell,
2005; McNeil et al., 2008), there is evidence in the literature that school districts are
using balanced scorecards (Cowart, 2010; Kaplan & Miyake, 2010), while there is scant
literature examining balanced scorecard implementation in school districts (Karathanos &
Karathanos, 2005). Based on the emergence of balanced scorecard alignment literature
and use of the balanced scorecard as a management tool for both internal and external
perspectives, the following research aimed to examine these themes in the context of
current accountability shifts in the state of Georgia. In addition, the research aimed to
collect data on how school districts are using balanced scorecards and other school
district performance management systems.

46
CHAPTER 3
METHODOLOGY
Introduction
The purpose of this study was to examine perceptions of Georgia school
superintendents pertaining to the alignment of school district performance goals to the
state’s accountability index: the College and Career Ready Performance Index (CCRPI).
Perceptual data were obtained about the extent to which school district balanced
scorecards or other school district performance management systems were aligned to
specific subcategories within Georgia’s CCRPI (achievement, post high school readiness,
progress, and achievement gap). Alignment levels were then examined in conjunction
with superintendents’ self-reporting on certain school district and superintendent
characteristics. The self-reported categorical data included the superintendent’s number
of years of experience, the school district’s student enrollment, the performance
management system that was used in the district, and whether or not the superintendent
reported his or her district to be an approved charter school system. The CCRPI
alignment variables were examined using a 7-point Likert scale, while demographic and
categorical variables were reported and mean perceived alignment levels compared.
Research Design
The research employed a quantitative survey design. The quantitative survey
design was selected due to its efficient administration for the target sample: Georgia
school superintendents. Within the survey, use of a 7-point Likert scale enabled the

47
researcher to yield numerical results to measure superintendents’ perceptions that could
be used to test for mean differences between groups. As recommended in quantitative
methodology literature, domains of interest in the study were gleaned from a review of
past research, and research questions were created with the purpose of examining
relationships between variables to obtain relevant data about a construct and to compare
groups (Creswell, 2002). In addition, hypotheses were generated and stated in the null for
each of the five research questions.
Each of the content categories and variables addressed in the survey pertained to
research questions in the study that were synthesized from literature addressing strategy
and goal management systems (Kaplan & Norton, 1996b; Malina & Selto, 2001), school
district literature (Dailey et al., 2005; Kaplan & Miyake, 2010; Marzano & Waters,
2009), and categories from Georgia’s CCRPI (Georgia Department of Education, 2012a).
Similarly, the impetus for examining school districts’ and superintendents’ responses to
accountability mandates was based on themes noted in the school accountability literature
(McLaughlin & Mitra, 2001; O’Day, 2002).
More specifically, categories within the survey addressed superintendents’ overall
alignment to Georgia’s CCRPI, differences between perceived alignment levels on
smaller CCRPI subcategories (achievement, career readiness, progress, and achievement
gap), and the relationships between perceived overall alignment levels and demographic
categories pertaining to the superintendent and school district. A majority of items used a
7-point Likert scale. A Likert scale was chosen because of the multiple research studies
addressing balanced scorecards in the business management and the business accounting
literature (Chen & Chen, 2006; Lipe & Salterio, 2000; Lipe & Salterio, 2002). At the

48
time of the study, there was no scholarly research addressing how school districts used
balanced scorecards in the public school or school district context.
The research sample of interest identified for the study was Georgia school
superintendents (N = 180) from public school districts in the state. Superintendents were
selected because of their positions as public school district leaders in conjunction with
their collaborative work with school board representatives from their local communities.
The target sample size was limited to current Georgia school superintendents serving in
school districts working exclusively in the context of the accountability guidelines set
forth in the CCRPI. Neither random sampling nor random assignment was used when
gathering the data due to the goal of obtaining perceptual data from as many respondents
from the target population as possible.
Research Questions
The study was organized around five research questions:
1. Are there differences in superintendents’ overall perceived alignment to the
following subcategories in the CCRPI: student achievement, post high school
readiness, progress, and achievement gap?
2. Is there a difference in perceived alignment to the CCRPI between
superintendents in school districts using balanced scorecards and superintendents
in school districts using other school district performance management systems?
3. Is there a difference in perceived CCRPI alignment between superintendents who
reported charter system status and superintendents who reported non-charter
system status?

49
4. Are there differences in perceived alignment to the CCRPI between
superintendents with different experience levels?
5. Are there differences in perceived alignment to the CCRPI between
superintendents with different levels of student enrollment?
Instrumentation and Survey Development
A survey was developed by the researcher based on domains gleaned from the
literature review and their relevance to the research questions. First, information from
balanced scorecard literature that emerged in the seminal studies and the literature was
synthesized addressing such topics as alignment, goal management, internal perspectives,
and external perspectives (Kaplan & Norton, 1996a). Secondly, seminal research on
school district leadership was used to determine practices used by district personnel to
manage performance and to communicate goals (Marzano & Waters, 2009). Thirdly,
literature from education practitioner journals relevant to district leadership was
referenced (Cowart, 2010; Glennon, 2010; Kaplan & Miyake, 2010). Fourthly, a review
of Georgia’s accountability model, the CCRPI, was examined to identify subcategories
for which schools in the state were responsible (Georgia Department of Education,
2012a). The survey was divided into three sections:
1. Self-Reported Demographics
2. Self-Reported System-Wide Goal Measurement Processes
3. Self-Reported Alignment to the CCRPI
In each section, superintendents were asked to report information about their respective
school district.
Prior to administration of the survey, feedback on the instrument was obtained
from current practitioners in the state of Georgia. The first group to whom the survey was

50
administered was a class of education doctoral students at the University of Georgia—
each of whom were practicing educators in positions that included teachers, school
administrators, school counselors, and district office administrators. The second group of
educators to review the survey was a focus group of district office leaders familiar with
school district balanced scorecards, strategic plan alignment, and Georgia’s
accountability index. Once the survey was deemed relevant, valid, and efficient by the
pilot group, the focus group, and the researcher, it was submitted to the University of
Georgia’s Internal Review Board (IRB). After being reviewed and approved by the IRB,
the survey was emailed to Georgia school superintendents (including a letter of consent
outlining the purpose of the study).
Target Sample for the Study
Of the 180 Georgia school superintendents initially identified for the study, 4
were eliminated from the email list due to their interim status. Therefore, the initial
survey link was emailed to all non-interim Georgia school superintendents (N = 176) in
November of 2014 accompanied by an attached cover letter. The timeframe was selected
based on feedback from practitioners (including the content validity focus group)
indicating that November follows the first quarter of the school year when balanced
scorecards and/or strategic plans are typically completed and revised by school and
school district teams for the respective school year that is in progress. Therefore, a
November administration date was selected. Prior to sending the initial email,
superintendents’ email addresses were collected through a search in the Georgia School
Superintendents’ Association (GSSA) website, and each address was verified using

51
individual school district websites via the internet. A spreadsheet was kept by the
researcher to track participation and to prepare for follow-up emails.
After a two-week period elapsed following the initial email, a second email was
sent only to superintendents who had not completed the initial survey. This email also
included the cover letter and survey link. The second email to superintendents occurred in
late November of 2014. A third and final email was sent to superintendents during
December of 2014. The second and third emails were only sent to superintendents who
had not responded to prior emails.
In two instances, school district officials emailed indicating that their districts
were currently reviewing policies with respect to completing outside research. In these
instances, the superintendent and school district were removed from the study and the
email list, and they did not receive any subsequent emails from the researcher. In addition
to two superintendents removed for research policy reasons, the four temporary or
interim superintendents were also removed from the sample of Georgia school
superintendents ultimately decreasing the number contacted. Table 3.1 outlines the
sampling process for the study including how many superintendents were emailed, the
number of superintendents removed from the study, the number of responses to each
email, and how many responses were usable data:
Table 3.1
The Sample of Georgia School Superintendents
Sample
Original Target Sample
N = 180
Timeline
September 2014
Action of Researcher
Internet Search of Georgia
School Superintendents
Data Base and School
District Websites to Locate
Emails

52
Table 3.1 continued
Sample Timeline Action of Researcher
Sample Size After Interim
Superintendents Were
Removed from Data Set
October 2014 Interim Superintendents
Were Removed from the
Data Set
N = 176 November 2014 176 Superintendents Were
Emailed the Survey and
Consent Letter
Number of Responses to
First Email
47 out of 176 (27%)
Respondents (n = 47) and
School Districts With
Research Policies Under
Review (n = 2) Were
Removed From the Data
Set (n = 49)
Number of Responses to
Second Email
21 out of 127 (17%)
127 Remaining
Superintendents Were
Emailed
Number of Responses to
Third Email
25 out of 106 (24%)
December 2014 106 Remaining
Superintendents Were
Emailed
Total Responses from
Target Sample
93 out of 180 (52%)
January 2014 Survey Was Closed
Usable Responses out of
Total Responses Received
72 out of 93 (77%)
Usable Reponses Were
Defined as Those from a
Georgia School District
and Reponses to All Likert
Survey Items
Usable Responses from
Target Sample of
Superintendents
72 out of 180 (40%)
Usable Data Finalized
The first round of emails was sent to non-interim Georgia school superintendents (N =
176) on November 11th, 2014. The second round of emails was sent on November 24th,
2014. A third and final round of emails was sent on December 10th, 2014. Each email
also included an unsigned consent letter attached to the email (see Appendix A) with

53
specific information about the purpose of the study, confidentiality practices, and how
data would be reported. After all rounds of emails were completed, the survey link was
closed, and, in total, the researcher collected 72 usable surveys out of 180 for a return rate
of 40%.
Within the survey, an initial section asked for self-reported demographic
information from Georgia school superintendents. Self-reported demographics included
items pertaining to the following topics:
The number of years the superintendent served in the position of
superintendent in his or her current school system;
The total number of years the superintendent has served in the position of
superintendent;
The number of students currently enrolled in the superintendent’s respective
school district;
The performance management system used by the school district;
Whether the school district was an approved charter school system or not;
The performance goal management system used by schools in the school
district.
The self-reported demographic information served multiple purposes. First, it
allowed the researcher to study exploratory variables in regard to the superintendents as
well as the school district, while also providing respondents with an opportunity to
answer some basic questions before addressing more technical content pertaining to
alignment to Georgia’s CCRPI.
Section two of the survey addressed school districts’ system-wide goal
management processes. Within these items, superintendents were asked whether or not
they used balanced scorecards to manage school district goals. For superintendents who
indicated they did not use a balanced scorecard, an additional question asked what school
district goal management system the school district used and allowed for an open-ended
response. Similarly, superintendents were also asked whether or not schools in their

54
district used a balanced scorecard. If a balanced scorecard was not used, respondents
were asked what goal management system was used by their schools (See Appendix B
for more information).
Independent Variables of Interest
To test for differences, independent variables from the superintendent and school
district data were placed into categories. In research question #2, the independent variable
of interest was whether or not the school district used a balanced scorecard. Prior to the
survey administration, there was no preexisting information about this variable. In
research question #3, the independent variable of interest was whether or not the school
district had obtained charter system status or not. Since charter system status was not
static at this time, the researcher had no clear-cut prior knowledge about this variable. In
research question #4, the independent variable of interest was superintendent years’ of
experience. For this variable, the researcher generated categories based on feedback from
the focus group with the goal of comparing means for different levels of experience.
Table 3.2 displays levels of experience in years for the superintendent data used in the
study:
Table 3.2
Participating Superintendents’ Years of Experience
Years of Experience Frequency Percent
Less than 2 Years 22 31%
2-3 Years 15 21%
4-5 Years 11 15%
6-7 Years 6 8%
More than 7 Years 18 25%

55
Table 3.2 continued
Years of Experience Frequency Percent
Total 72 100%
Notes. Percentages were calculated from the total of 72 participating superintendents
with usable data in the study.
For research question #5, the researcher generated district student enrollment categories
based on feedback from the focus group with the goal of comparing means for different
sized school districts in the state. For this variable, the researcher generated categories
prior to the study based on Georgia’s enrollment distributions. Generating categories
prior to the survey met two goals corroborated by the focus group. The first goal was to
provide participating superintendents with prescribed categories, so that they would not
have to complete the additional work of locating exact enrollment figures. The second
goal was to create equal categories to compare group means for different levels of
experience. Table 3.3 displays student enrollment levels of school districts that
participated in the study as compared to other school districts in Georgia:
Table 3.3
Student Enrollment Levels for Participating School Districts
District Student
Enrollment Levels
Participant
Frequency
Number of Districts
in Georgia
Percent out of
Georgia School
Districts
0 to 1,499 12 34 35%
1,500 to 2,999 13 40 33%
3,000 to 4,999 15 42 36%
5,000 to 14,999 21 41 51%
15,000 or More 11 23 48%
Total 72 180 40%
Notes. Percentages were calculated using the 72 participating school districts’ data in
the numerator and the number of Georgia school districts as the denominator.

56
Survey Directions and Item Samples
Following the items addressing self-reported demographics and system-wide goal
management processes, Georgia school superintendents were asked 16 Likert items
addressing their perceived alignment to the CCRPI using a 7-point scale. Individual
survey items asked the superintendent to indicate the degree to which their school district
performance goals were aligned to 4 subcategories in the CCRPI (achievement, career
readiness, progress, and achievement gap). Table 3.4 includes an example of directions
and some sample Likert items pertaining to school district alignment to the four CCRPI
subcategories:
Table 3.4
Sample CCRPI Survey Items and Directions
Self-Reported Alignment to CCRPI
DIRECTIONS: The following items pertain to school district performance goals and
their alignment with accountability categories found in the most current College and
Career Ready Performance Index (CCRPI). Please read each statement and select the
number that indicates the degree to which your school district aligns to each statement.
1. Our district has performance goals aligned to “student achievement” measures in the
CCRPI.
1 2 3 4 5 6 7
Strongly Strongly
Disagree Agree
2. Our district has performance goals aligned to “career readiness” measures in the
CCRPI.
1 2 3 4 5 6 7
Strongly Strongly
Disagree Agree
3. Our district has performance goals aligned to measures of “student progress” in the
CCRPI.
1 2 3 4 5 6 7
Strongly Strongly
Disagree Agree

57
Table 3.4 continued
4. Our district has performance goals aligned to “achievement gap” measures in the
CCRPI.
1 2 3 4 5 6 7
Strongly Strongly
Disagree Agree
Note. See Appendix B for a complete list of survey items.
To address internal consistency, the original survey (used in the pilot test)
contained 5 items within each of the 4 CCRPI subcategories for a total of 20 Likert scale
items. After receiving feedback from the focus group, the survey was narrowed to 4 items
per subcategory resulting in 16 total Likert scale items administered in the actual survey
of Georgia school superintendents. The focus group communicated a rationale that 16
items would be more manageable for the target sample, Georgia school superintendents.
Furthermore, the focus group also communicated the rationale that fewer items would
safeguard against the participant developing fatigue while responding. Table 3.5 provides
a summary of the changes made to the survey based on feedback from the focus group:
Table 3.5
Survey Adjustments Based on Focus Group Feedback
Content Format Wording
1 scaled survey item per
subcategory was removed
for a total of 4 fewer items
4 items were listed per
page in the 7-point Likert
alignment section
Performance goals replaced
the term indicators
Note: See Appendix B for a complete list of survey items and directions.
Survey Content
Providing a justification for what information is included in a survey is
recommended in the research (Creswell, 2002). For this study, the survey’s content was
gleaned from the following sources:

58
1. A review of literature pertaining to balanced scorecards, organizational
alignment, and strategic management;
2. A review of research pertaining to school districts and school accountability;
and
3. An examination of Georgia’s current school accountability system: the
CCRPI.
Additional demographic information was also collected in the data set. The demographic
data were collected and divided into categories: superintendents’ years of experience,
district student enrollment, and whether or not the school district was an approved charter
system.
The categorical variables were divided by name and examined as exploratory
variables for possible consideration in future research. These demographic data points
were also validated by the focus group as variables of interest when studying school
districts, in general. From the practitioner perspective, each focus group participant
communicated that self-reported demographic variables were relevant to his/her own
research and to the research of their colleagues when examining school district leadership
processes.
Validity and Use of a Focus Group
To address content validity prior to the administration of the survey, a review
team of practitioners was gathered as a focus group to examine the survey and provide
feedback. Consistent with recommendations from Haynes, Richard, and Kubany (1995),
a group of representatives familiar with the content (accountability, balanced scorecards,
and school district performance management) was asked to review the survey and to
review the research goals of the study in order to provide feedback to the researcher.
Three school district-level administrators from two different-sized school districts
volunteered after being asked to participate in the focus group.

59
Each of the participants had more than five years’ experience as a district-level
administrator and each participant also had practical experience with respect to the
research variables in the study. In an attempt to be consistent with research addressing
content validity, the goal of the focus group was to generate feedback on both the content
of individual survey items and to gather information on the overall format of the survey
(Fraenkel et al., 2012). An additional goal of the focus group was to obtain feedback
about the target sample of the survey: Georgia school superintendents.
To provide clarity to review team members, Hinkin (1998) recommended that the
researcher provide members of the content validity team with clear definitions related to
what is being measured within each category addressed. For this focus group, definitions
were provided to the review team by the researcher as needed. In addition, feedback on
each survey item was collected with respect to its relevance to the research purpose.
During this process, each member of the focus group was given time to individually view
the survey in its entirety and to make notes prior to discussing with the other members in
the group.
After receiving feedback from the review team members, the researcher made
slight modifications to the survey’s wording and to the number of items included in the
self-reported CCRPI alignment section. An additional goal of the researcher was to honor
the time of survey participants (Georgia school superintendents), while still maintaining
an appropriate number of items for internal consistency purposes. Feedback on this goal
was provided by the review team and, as a result, four survey items were removed (see
Table 3.2 for more information pertaining to focus group feedback).

60
Use of a Pilot Study for Reliability and Validity
The first goal of the pilot study was to receive feedback on the survey format and
readability. The pilot group consisted of 15 doctoral students from the University of
Georgia enrolled in EDAP 8000 for the summer of 2014. Each of the participating
doctoral students was a current educational practitioner in the state of Georgia. Table 3.6
summarizes feedback obtained from the pilot study with respect to survey content,
format, and readability:
Table 3.6
Feedback from Pilot Study
Content Format Word Choice Other
The content was
relevant to the
research goals.
“Achievement” and
Post High School
Readiness” should
be separated into
different alignment
categories.
The questions
should be grouped
or chunked into 4
questions per page.
Certain word
choices were
questioned with
respect to the
CCRPI alignment
questions.
The length of the
survey was
considered to be
manageable for
respondents given
the questions were
regrouped.
The second goal of the pilot study was to test for internal consistency methods of
reliability. Cronbach’s alpha was calculated to test for internal consistency of the
instrument by examining the inter-correlations of responses on items measuring the same
construct (Cronbach, 1951). The pilot group of 15 doctoral students was administered the
complete survey, and responses from each participant were collected by the researcher
for analysis. Since the CCRPI alignment items in the survey used a scale, Cronbach’s
alpha was calculated to test for internal consistency (Creswell, 2002). Internal
consistency calculations were made for each of the CCRPI subcategories as well as
overall CCRPI alignment.

61
Cronbach’s alpha was calculated two times as a reliability statistic—once with the
pilot group and again during the actual study of Georgia school superintendents. The
Statistical Package for the Social Sciences (SPSS) version 22 was used to calculate the
Cronbach coefficient alpha. Cronbach’s alpha for the pilot study was (α = 0.742), while
Cronbach’s alpha for the actual study was (α = 0.952). For the subcategories, SPSS was
used to calculate Cronbach’s alpha in each instance. Table 3.7 displays Cronbach’s alpha
for the pilot study.
Table 3.7
Cronbach’s Alpha for the Pilot Study
CCRPI
Achievement
CCRPI
Progress
CCRPI
Achievement Gap
CCRPI
ALL
0.908 0.969 0.927 0.742
Note. Data were calculated from 15 participants in the pilot study.
Though it is debatable, an alpha of 0.70 is generally considered by researchers to achieve
an appropriate degree of internal consistency in social science research (Charter, 2003).
For each of the statistics calculated from the pilot study, Cronbach’s alpha exceeded the
threshold of 0.70. In the subcategories of achievement, progress, and achievement gap,
Cronbach’s alpha exceeded 0.90 in each case.
Data Collection Processes
Permission to survey Georgia’s school superintendents for the study was
requested of the Internal Revenue Board (IRB) of the University of Georgia in October
2014. After obtaining approval from the IRB, a process was followed for distributing the
survey. The process consisted of emailing survey links, and the researcher followed
recommendations adapted from the four phases outlined by Salant and Dillman (1994).
The two goals of the process centered on providing respect to participants, while also

62
attempting to maximize the response rate (Salant & Dillman, 1994). To increase
efficiency of administration, the IRB approval also included permission to use an online
survey provider, Survey Monkey®. Each survey question as well as accompanying
directions were loaded into the Survey Monkey® platform, and within this platform, a
link was generated leading participants to each item in the survey. Following the survey
administration, results were exported to Excel spreadsheets and loaded into SPSS for
further data analysis.
Data Reporting
Confidentiality was a goal of the researcher due to the nature of the survey’s
content. Therefore, prior to analyzing the data, all school district names were de-
identified in the data set. As communicated to the superintendents in the consent letter,
participation in the survey was confidential. Because a majority of the survey items
addressed accountability measures from Georgia’s CCRPI, the researcher aimed to
implement confidentiality measures to prompt candid answers from each respondent on
perceived accountability alignment.
Data Analysis and Interpretation
First, descriptive statistics were calculated from the survey data. The descriptive
statistics included the mean and standard deviation for each of the survey items based on
data obtained from superintendent perceptions on the 7-point Likert scales for each
survey item. In addition, frequency data were also calculated including summaries of
superintendents’ self-reported demographics (i.e., number of years serving as
superintendent in the current school district and number of years serving as a
superintendent). In addition, frequency data were collected and reported across each of

63
the categories pertaining to superintendents’ self-reported system-wide goal management
processes. These responses were subdivided into categories based on whether the
balanced scorecard format was being implemented or if another goal management system
used by the district. Other categorical data were subdivided into intervals based on the
data set. These data included superintendents’ self-reporting on what management
systems were used by schools in their district.
To determine the degree to which the sample of respondents (N = 72) was
representative of the state of Georgia, statistics were provided showing comparisons of
participating superintendent to non-participating superintendents. These statistics
included student enrollment sizes, student subgroup enrollment comparisons, economic
status, revenue per pupil, and average CCRPI scores. These data included percentages
juxtaposed in tables to show comparisons and levels of representation. Similarly,
geographical representation was also examined. A map of Georgia was subdivided into
five regions and superintendent participation percentages were calculated out of the total
number of districts in the given region of the state.
To examine research question 1, a one-way within subjects ANOVA was used to
determine if mean differences in perceived alignment existed between the 4 subcategories
in the CCRPI: achievement, post high school readiness, progress, and achievement gap.
Additional inferential statistics were used to examine whether results were statistically
significant. All hypothesis tests were calculated using SPSS (version 22) software. In
addition to the mean and standard deviations for items and categories, standard error was
also calculated as well as degrees of freedom and statistical significance. Mean
differences were examined irrespective of directionality, because the researcher was not

64
concerned with higher or lower differences in perceived alignment levels — just mean
differences, in general.
Inferential statistics were also used to examine categorical data based on reported
superintendent and school district characteristics:
superintendents using balanced scorecards and superintendents using other school
district performance management systems,
different experience levels of superintendents,
school district governance structure (charter system and non-charter system
status), and
district student enrollment level
SPSS was used to determine whether or not significant differences existed between
the independent variables from research questions 2, 3, 4, and 5 using an analysis of
variance (ANOVA) and statistics to examine significance (p-values). Following these
calculations, it was determined whether to accept or reject each null hypothesis. In the
event that results were significant, additional tables and figures were used to visually
display the data. In the event that results were not significant, an explanation of why
results were insignificant was provided by the researcher.
Hypotheses
Hypotheses addressing each research question were phrased in the null.
1. There are no significant differences in superintendents’ overall perceived
alignment to the following subcategories in the CCRPI: student achievement, post
high school readiness, progress, and achievement gap.
2. There is no significant difference in perceived alignment to the CCRPI between
superintendents in school districts using balanced scorecards and superintendents
in school districts using other school district performance management systems.

65
3. There is no significant difference in perceived CCRPI alignment between
superintendents who reported charter system status and superintendents who
reported non-charter system status.
4. There are no significant differences in perceived alignment to the CCRPI between
superintendents with different levels of experience.
5. There are no significant differences in perceived alignment to the CCRPI between
superintendents with different levels of school district student enrollment.
Chapter Summary
A quantitative survey approach was used to study Georgia school
superintendents’ perceptions of balanced scorecard alignment in the context of Georgia’s
accountability system: the CCRPI. The 7-point Likert survey items were pilot tested for
content validity, revised, and emailed to 176 superintendents in the state. After surveys
were collected, both categorical data and an ANOVA were calculated to address the 5
research questions framing the study. In total, 72 superintendent responses were
completed and deemed usable in the data collection for a return rate of 40%.
Using descriptive statistics, data were calculated including the mean, standard
deviation, and frequency. Calculations were categorized into the respective domains of
study (superintendents in districts using balanced scorecards and superintendents using
other school district performance management systems). Descriptive statistics were also
calculated for the complete sample of superintendents surveyed. Trends in these data
were synthesized and grouped for reporting purposes and to show the degree to which the
sample was representative of all superintendents in Georgia. Comparisons of means,

66
standard deviations, and statistical significance calculations were also computed to test
each null hypothesis.
Through the use of inferential statistics, a one-way ANOVA was used to make
comparisons and determine statistical significance. Following the data analysis,
hypotheses were tested. The information generated from the survey results, descriptive
statistics, and inferential statistics were collected to assist the researcher in making
inferences and examining trends in the use of balanced scorecards by school districts and
perceptions of superintendents in the context of Georgia’s accountability system: the
CCRPI. Other factors were examined such as superintendents’ perceived alignment to
subcategories within the CCRPI and whether the exploratory variables such as responses
from superintendents in school districts with different demographic characteristics
showed any significant difference with respect to perceived alignment levels to the
CCRPI.
67
CHAPTER 4
RESEARCH FINDINGS
Introduction
The purpose of this study was to examine perceptions of Georgia school
superintendents pertaining to the alignment of school district performance goals to the
state’s accountability index: the College and Career Ready Performance Index (CCRPI).
Perceptual data were obtained about the extent to which district balanced scorecards or
other school district performance management systems were aligned to specific
subcategories within Georgia’s CCRPI (achievement, post high school readiness,
progress, and achievement gap). Alignment levels were then examined in conjunction
with superintendents’ self-reporting on certain school district and superintendent
characteristics. The self-reported categorical data included the superintendent’s number
of years of experience, the school district’s student enrollment, the performance
management system that was used in the district, and whether or not the superintendent
reported his or her district to be an approved charter school system. The CCRPI
alignment variables were examined using a 7-point Likert scale, while demographic and
categorical variables were reported and mean perceived alignment levels compared.

68
Research Questions
The study was organized around five research questions:
1. Are there differences in superintendents’ overall perceived alignment to the
following subcategories in the CCRPI: student achievement, post high school
readiness, progress, and achievement gap?
2. Is there a difference in perceived alignment to the CCRPI between
superintendents in school districts using balanced scorecards and superintendents
in school districts using other school district performance management systems?
3. Is there a difference in perceived CCRPI alignment between superintendents who
reported charter system status and superintendents who reported non-charter
system status?
4. Are there differences in perceived alignment to the CCRPI between
superintendents with different experience levels?
5. Are there differences in perceived alignment to the CCRPI between
superintendents with different levels of student enrollment?
Sample and Representation
Of the superintendents surveyed, 72 provided usable data for a total return rate of
40% of the target population of 180 Georgia school superintendents at the time of the
study. To examine the degree to which the respondents’ school districts were
representative of the state of Georgia, several demographic variables were included in the
reporting of data. In Figure 4.1, a map of Georgia displays five different regions and
shows the percentages of school districts in each region participating in the study:

69
Figure 4.1. Geographical Representation of the Sample of Georgia Superintendents
Participating superintendents from five different regions in the state represented between
30% and 47% of the total number of Georgia school superintendents in each respective
region. Additionally, superintendents participating in the sample, using 2013-2014 Full
Time Equivalency (FTE) numbers, served 745,814 students in the state of Georgia, while
those who did not participate in the study served 896,067 students. Thus, sampled
superintendents served approximately 45% of all Georgia public school students.
Other demographic data were calculated for Georgia school districts in the study,
and side-by-side comparisons were made with non-participating school districts. Table
4.1 shows the participant versus non-participant breakdowns across multiple school
district demographic variables including average student enrollment sizes, subgroup
enrollment percentages, average revenue per pupil, and 2014 average aggregate CCRPI
scores for the districts in each group:
Northwest GA
27 Districts
30% Return Rate
Metro Atlanta, GA
15 Districts
47% Return Rate
Southwest GA
48 Districts
42% Return Rate
Northeast GA
38 Districts
45% Return Rate
Southeast GA
52 Districts
38% Return Rate

70
Table 4.1
Participating and Non-Participating School District Comparisons
School District Characteristic Participants Non-Participants
N 72 108
Average System Size 10,967.9 8,072.7
Median System Size 3,920.00 3,110.00
Average % Students Non-White 48.48% 45.6%
Median % Students Non-White 46.04% 45.0%
Average % Students Economically
Disadvantaged
64.6% 64.9%
Median % Students Economically
Disadvantaged
67.6% 66.9%
Average Per FTE Revenue 8,630.91 8,864.70
Median Per FTE Revenue 8,486.17 8,557.77
Median Household Income of Community
Served
39,234.00 35,681.00
Average 2014 CCRPI Total Score 71.9 72.4
Self-Reported Demographics
Self-reported demographic data were collected on each participating Georgia
school superintendent. The following self-reported demographic categories were obtained
from the survey:
number of years of total experience as a school superintendent,
number of students enrolled in the superintendent’s respective school district,
and
whether or not the superintendent’s school district was an approved charter
school system.

71
Of the sample of 72 superintendents, descriptive statistics were calculated for
each of the school districts represented in the sample. The demographic data were used to
outline each of the research questions in the study and to provide aggregate data
pertaining to the sample of interest. Table 4.2 provides a summary of the self-reported
demographic data collected from Georgia school superintendents who participated in the
survey:
Table 4.2
Self-Reported Demographic Data from Participating Superintendents
Title Category Number Percent of
Participants
Total Years of Experience
as a School Superintendent
Less than 2 years 22 31%
2-3 years 15 21%
4-5 years 11 15%
6-7 years 6 8%
More than 7 years 18 25%
Number of Students
Enrolled in School District
0 to 1,499 12 17%
1,500 to 2,999 13 18%
3,000 to 4,999 15 21%
5,000 to 14,999 21 29%
15,000 or more 11 15%
Approved Charter
System Status
Yes 10 14%
No 62 86%
Note. See Appendix B for a complete list of survey items.
Self-Reported System-Wide Goal Measurement Processes
Other descriptive statistics analyzed from the survey included self-reported
system-wide goal measurement processes. Survey items in this section addressed whether
or not Georgia school superintendents reported use of a balanced scorecard.
Superintendents that indicated use of a performance management system other than a

72
balanced scorecard were asked to indicate what other format was used. In addition, items
that pertained to goal management addressed whether or not schools in the school district
used balanced scorecards. Similar to the district goal management items, superintendents
whose schools did not use balanced scorecards were asked to indicate what other
management system their schools used. Table 4.3 displays data pertaining to self-reported
system-wide goal management processes:
Table 4.3
Self-Reported System-Wide Goal Measurement Processes
Title Response Number Percent
Use of a Balanced Scorecard to
Manage School District Goals
Yes 46 64%
No 26 36%
Use of a Balanced Scorecard
by Schools to Manage Goals
Yes 41 57%
No 31 43%
Note. See Appendix B for a complete list of survey items.
Of 72 Georgia school superintendents who responded to the survey, 46 (64%) reported
that their school district used a balanced scorecard to measure goals. Twenty-six (36%) of
the Georgia school superintendents reported that their school district used some other
performance management system—not a balanced scorecard. Forty-one (57%) of the
superintendents reported that schools in their district used a balanced scorecard to
manage school goals. Thirty-one (43%) of the superintendents reported that their schools
used some other performance management system—not a balanced scorecard.
The number of respondents who reported that both their school district and
schools used a balanced scorecard was also a topic of interest in the study. Table 4.4

73
displays school district and school breakdowns as to whether or not balanced scorecards
were used to manage performance goals:
Table 4.4
Balanced Scorecard Use in School Districts and Schools
Title School Districts School Use in
School Districts
Using Balanced
Scorecards
Percent
Balanced
Scorecard Use
46 41 89%
Note. See Appendix B for a complete list of survey items.
Of the 46 school districts using balanced scorecards, 41 (89%) reported that their schools
also used balanced scorecards to manage performance goals. Inversely, 5 out of 46 (11%)
of the school districts that used a balanced scorecard did not have schools in their district
that used balanced scorecards.
When Georgia school superintendents reported use of a performance management
system other than a balanced scorecard, they were asked to indicate the name of the
performance management system their school district used. Table 4.5 lists categories for
each of the management systems reported by superintendents from school districts that
did not use a balanced scorecard:
Table 4.5
Other School District Performance Management Systems
Category Number Percent
Analysis of Data 3 12%
CCRPI 1 4%
Locally Named Plan 4 15%
Monthly Reports to Board 1 4%
New System in Development 2 8%

74
Table 4.5 continued
Category Number Percent
No Response 3 12%
System Strategic Plan 12 46%
Notes. Percentages were calculated from the total of 26 superintendents using other
school district performance management systems. See Appendix B for a complete list
of survey items.
Twenty-six Georgia school superintendents reported that their school district did
not use a balanced scorecard to manage performance goals. Of the 26 respondents, 3
(12%) of the superintendents indicated use of an analysis of data as their performance
management system. One (4%) of the respondents reported direct use of the CCRPI to
manage goals. Four (15%) superintendents reported use of a locally named management
system. One (4%) reported use of a monthly report to the school board. At the time of the
survey, two superintendents (8%) indicated that a new goal management system was in
development, but had not been finalized. Three (12%) superintendents did not respond to
the question. Of the superintendents who did not use a balanced scorecard, 12 (46%)
indicated that their school district used a system strategic plan to manage performance
goals.
With respect to the school’s performance goal management, 31 (43%) Georgia
school superintendents reported the use of a management system other than a balanced
scorecard. In these instances, superintendents were asked to indicate the name of the
other performance management system used by schools in their district. Table 4.6 lists
names of the other performance management systems used by schools as well as the
frequency and percent in which each type was reported by superintendents whose schools
did not use a balanced scorecard to manage goals:

75
Table 4.6
Other School Performance Management Systems
Category Frequency Percent
Analysis of Data 3 10%
CCRPI 2 6%
Continuous Innovation
Plan
1 3%
Locally Named Plan 4 13%
New Plans in Progress 2 6%
No Plan in Place 1 3%
Periodic Principal
Meetings
1 3%
School Improvement Plan 15 48%
Stop Light Method 1 3%
System Improvement Plan 1 3%
Notes. Percentages were calculated from the total of 31 superintendents who indicated
that schools in their district used other performance management systems (not balanced
scorecards). See Appendix B for a complete list of survey items.
Thirty-one superintendents indicated that schools in their district used
performance management systems other than a balanced scorecard. Three (10%)
superintendents used an analysis of data. Two (6%) of the superintendents directly used
the CCRPI. One (3%) used a continuous innovation plan. Four (13%) used a locally
named plan. Two (6%) had new processes that were being developed at the time of the
survey. One (3%) indicated that no plans were in place. One (3%) superintendent did not
respond. One (3%) indicated that periodic principal meetings were used to manage school
goals. Fifteen (48%) indicated that school improvement plans were used by schools in

76
their district. One (3%) indicated that a Stop Light Method was used by schools, and one
(3%) superintendent reported that schools in the district directly managed school
performance goals using the school system’s improvement plan.
Descriptive Statistics and CCRPI Alignment
Descriptive statistics were calculated using the sample of 72 respondents to
examine the degree to which Georgia school superintendents reported overall goal
alignment to the CCRPI. In the analysis, means and standard deviations were calculated
to examine total CCRPI alignment (an aggregate of all alignment subcategories). Table
4.7 shows overall statistics for superintendents’ self-reported goal alignment to the
CCRPI:
Table 4.7
Self-Reported Total Alignment to the CCRPI
Superintendent
Responses
Number of
Survey Items
Mean Percent of
Maximum
Possible
Points
Standard
Deviation
N=72 16 92.51 83% 17.57
Note. A 7-point Likert scale was used on each of the 16 survey items for a maximum
total alignment score of 112.
From the 16 survey items pertaining to Georgia school superintendents’ perceived
alignment to the CCRPI, a mean of 92.51 translated into 83% of the 112 maximum
CCRPI alignment points in the survey. Per survey item, the aggregate mean of 92.51 was
decomposed into a mean item response of 5.8 out of a maximum of 7 possible points per
CCRPI alignment survey item. Based on the average response of 5.8 out of a scale of 7
possible alignment points, superintendents indicated that district performance goals (in
aggregate) were aligned to the CCRPI.
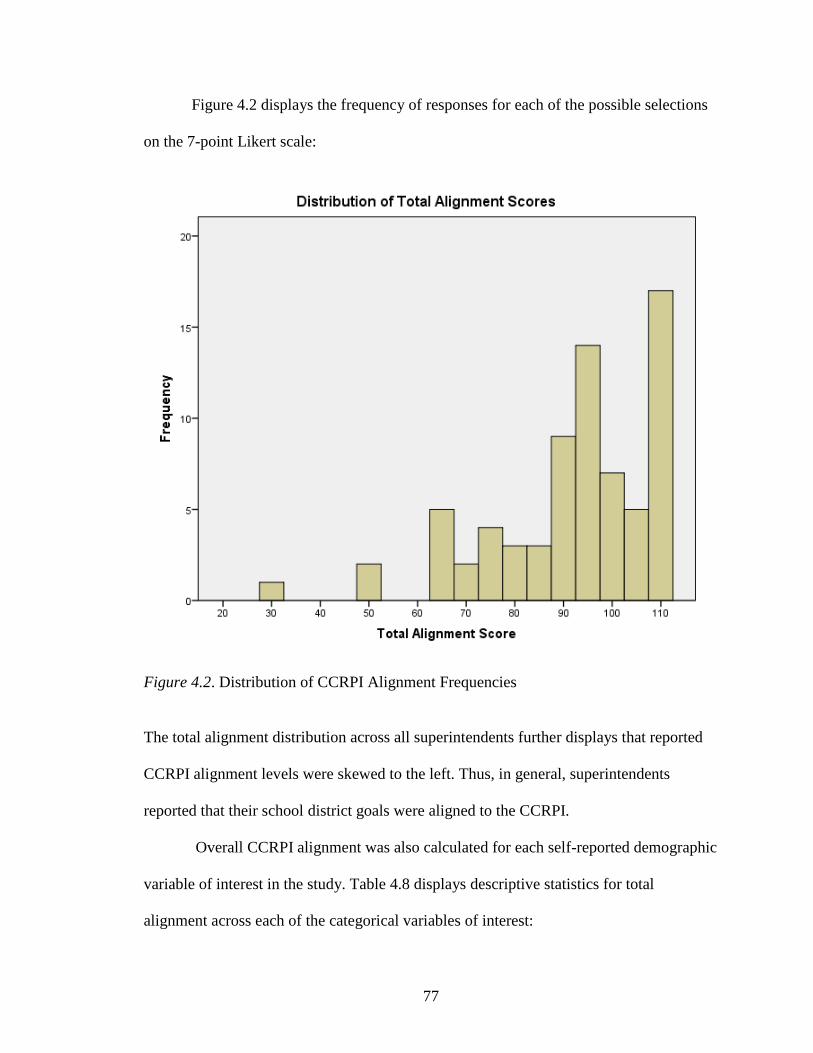
77
Figure 4.2 displays the frequency of responses for each of the possible selections
on the 7-point Likert scale:
Figure 4.2. Distribution of CCRPI Alignment Frequencies
The total alignment distribution across all superintendents further displays that reported
CCRPI alignment levels were skewed to the left. Thus, in general, superintendents
reported that their school district goals were aligned to the CCRPI.
Overall CCRPI alignment was also calculated for each self-reported demographic
variable of interest in the study. Table 4.8 displays descriptive statistics for total
alignment across each of the categorical variables of interest:

78
Table 4.8
Self-Reported Total Alignment to CCRPI by Demographics
Group N Alignment
Mean
Alignment
SD
Alignment
Min
Alignment
Max
Participating
Superintendents
72 92.51 17.57 30 112
District Governance Status
Non-Charter
Charter
62
10
98.40
91.56
9.62
18.43
84
30
112
112
Performance Management System
Balanced Scorecard
Non-Balanced
Scorecard
46
26
93.52
90.73
17.18
18.44
30
48
112
112
Superintendent Experience Levels
Less than 2 Years 22 90.68 19.11 30 112
2 to 3 Years 15 88.07 17.80 64 112
4 to 5 Years 11 92.00 18.38 51 112
6 to 7 Years 6 97.83 14.15 78 112
Greater than 7 Years 18 97.00 16.29 48 112
District Student Enrollment
0 to 1,499 12 94.42 14.76 64 112
1,500 to 2,999 13 88.50 17.84 51 110
3,000 to 4,999 15 94.87 14.74 65 112
5,000 to 14,999 21 89.00 22.82 30 112
15,000 or more 11 97.27 12.63 76 112
Findings for Research Question 1
With respect to Georgia school superintendents’ perceived alignment to each of
the four subcategories within the CCRPI (achievement, post high school readiness,

79
progress, and achievement gap), a one-way within subjects ANOVA was conducted to
determine if significant differences were apparent between the CCRPI subcategories.
Mauchly’s Test of Sphericity was non-significant (5, X=8.798, p=.117), suggesting that
the assumption of sphericity was supported. Table 4.9 displays each of the subcategories
with their means and standard deviations:
Table 4.9
Self-Reported Alignment to CCRPI Subcategories
Superintendent
Responses
Subcategory Mean Percent of
Maximum
Alignment
Points
Standard
Deviation
N=72 Achievement 24.57 88% 4.114
N=72 Post High School
Readiness
22.78 81% 4.727
N=72 Progress 22.47 80% 5.402
N=72 Achievement
Gap
22.69 81% 5.308
Notes. The survey used a 7-point Likert scale for a total of 28 points per subcategory.
Table 4.9 suggests a greater mean for Georgia school superintendents’ perceived
alignment to the subcategory of achievement relative to the three other subcategories:
post high school readiness, progress, and achievement gap. Since four items were used
per CCRPI subcategory, Cronbach’s alpha was calculated (α = 0.952) to test for the
internal consistency of survey items. Table 4.10 further details the test of within subjects
effects for CCRPI alignment:
Table 4.10
Test of Within Subjects Effects for CCRPI Alignment Scores
Source Type III
Sum of
Squares
Df Mean
Square
F Sig.
Alignment Sphericity Assumed 202.927 3 67.642 10.300 .000*

80
Table 4.10 continued
Source Type III
Sum of
Squares
Df Mean
Square
F Sig.
Greenhouse-Geisser 202.927 2.979 72.550 10.300 .000*
Huynh-Feldt 202.927 2.923 69.413 10.300 .000*
Lower-Bound 202.927 1.000 202.927 10.300 .002*
Error
(Alignment)
Sphericity Assumed 1398.823 213 6.567
Greenhouse-Geisser 1398.823 198.593 7.044
Huynh-Feldt 1398.823 207.567 6.739
Lower-Bound 1398.823 71.000 19.702
Note. *Significant at the .05 level
The within subjects ANOVA results suggest a significant effect between
alignment dimensions of the scale (3, F=11.937, p<.000). Simple main effects were
calculated using a Bonferonni correction. Table 4.11 outlines pairwise comparisons
between each subcategory.
Table 4.11
Pairwise Comparisons of CCRPI Alignment to Subcategories
95% Confidence Interval
for Difference
Alignment Alignment Mean
Difference
Std.
Error
Sig. Lower
Bound
Upper
Bound
Achievement Readiness 1.792* .364 .000 1.066 2.518
Gap 2.097* .478 .000 1.145 3.050
Progress 1.875* .451 .000 .977 2.773
Readiness Achievement -1.792* .364 .000 -2.518 -1.066
Gap .306 .396 .443 -.485 1.096
Progress .083 .417 .842 -.748 .915
Gap Achievement -2.097* .478 .000 -3.050 -1.145
Readiness -.306 .396 .443 -1.096 .485
Progress -.222 .447 .620 -1.113 .669
Progress Achievement -1.875* .451 .000 -2.773 -.977
Gap -.083 .417 .842 -.915 .748
Readiness .222 .447 .620 -.669 1.113
Note. *The mean difference is significant at the .05 level
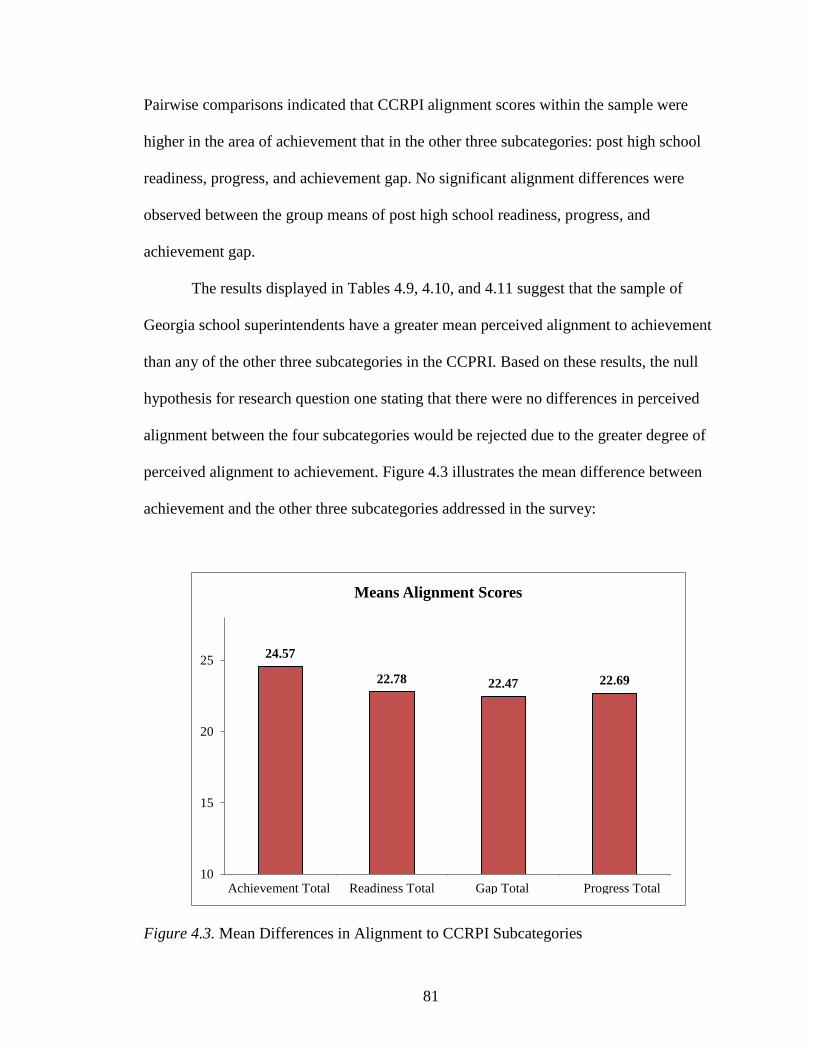
81
Pairwise comparisons indicated that CCRPI alignment scores within the sample were
higher in the area of achievement that in the other three subcategories: post high school
readiness, progress, and achievement gap. No significant alignment differences were
observed between the group means of post high school readiness, progress, and
achievement gap.
The results displayed in Tables 4.9, 4.10, and 4.11 suggest that the sample of
Georgia school superintendents have a greater mean perceived alignment to achievement
than any of the other three subcategories in the CCPRI. Based on these results, the null
hypothesis for research question one stating that there were no differences in perceived
alignment between the four subcategories would be rejected due to the greater degree of
perceived alignment to achievement. Figure 4.3 illustrates the mean difference between
achievement and the other three subcategories addressed in the survey:
Figure 4.3. Mean Differences in Alignment to CCRPI Subcategories
24.57
22.78 22.47 22.69
10
15
20
25
Achievement Total Career Total Gap Total Progress Total
Means Alignment Scores
Readiness Total Achievement Total Gap Total Progress Total

82
In each CCRPI subcategory, individual items were measured using a 7-point Likert scale
for a total of 28 points.
Findings for Research Questions 2 Through 5
For research questions 2 through 5, a factorial ANOVA was conducted using total
alignment score as the dependent variable. The independent variables of balanced
scorecard use, system charter status, district student enrollment level, and superintendent
experience level were used as fixed factors in the model. Levene’s test of equality of
error variances was significant (48,33, F=2.842, p=.001) suggesting a possible violation
of the assumption of homogeneity of variance. Therefore, the results should be
interpreted with caution. Table 4.12 includes the Omnibus tests of between subject
effects:
Table 4.12
Omnibus Tests of Between-Subject Effects
Source Sum of
Squares
df Mean Square F Sig.
Corrected Model 10886.486 46 236.663 .537 .967
Intercept 264347.059 1 264347.059 599.726 .000
Superintendent
Experience Level 916.531 4 229.133 .520 .722
District Student
Enrollment
1141.878 5 228.376 .518 .760
Balanced Scorecard
Use
32.019 1 32.019 .073 .790
Charter System 5.706 1 5.706 .013 .910
Experience * Enrollment 3550.253 14 253.590 .575 .859
Experience * Balanced
Scorecard 261.256 4 65.314 .148 .962
Experience * Charter 76.800 1 76.800 .174 .680
Enrollment * Balanced
Scorecard 1964.240 4 491.060 1.114 .372
Enrollment * Charter 128.643 2 64.321 .146 .865

83
Table 4.12 continued
Source Sum of
Squares
df Mean Square F Sig.
Experience * Enrollment
* Balanced Scorecard1595.470 5 319.094 .724 .612
Error 11019.500 25 440.780
Total 638141.000 72
Corrected Total 21905.986 71
At no level within the ANOVA was a significant difference found between groups. For
each of the fixed factors, there were no main effects observed. Thus, means were
generally equivalent on the survey across experience levels, system governance status,
district enrollment sizes, and balanced scorecard use. Therefore, the hypotheses
pertaining to research questions 2-5 could not be rejected. In addition, interactions were
tested between groups, and no significant differences were found. Furthermore, certain
levels of interaction could not be calculated, such as charter status by balanced scorecard,
due to the small numbers of respondents in the charter system status category being
subdivided too finely by other categories.
Figure 4.4 displays data showing the total perceived CCRPI alignment levels of
superintendents in school districts that use balanced scorecards and superintendents in
school districts that do not use balanced scorecards as indicated in research question #3:

84
Figure 4.4. CCRPI Alignment Scores and Balanced Scorecard Status
The box plot illustrates that perceived alignment scores were reported at a high level for
both balanced scorecard and non-balanced scorecard users.
Figure 4.5 displays data pertaining to the total perceived CCRPI alignment levels
of superintendents in approved charter systems and superintendents in non-charter system
status as indicated in research question #3:

85
Figure 4.5. CCRPI Alignment Scores and Charter System Status
The box plot illustrates that perceived alignment scores were at a high level for both
superintendents who reported charter status and those who reported non-charter status.
Figure 4.6 displays data pertaining to the total perceived CCRPI alignment levels
of superintendents with different levels of experience indicated in research question #4:
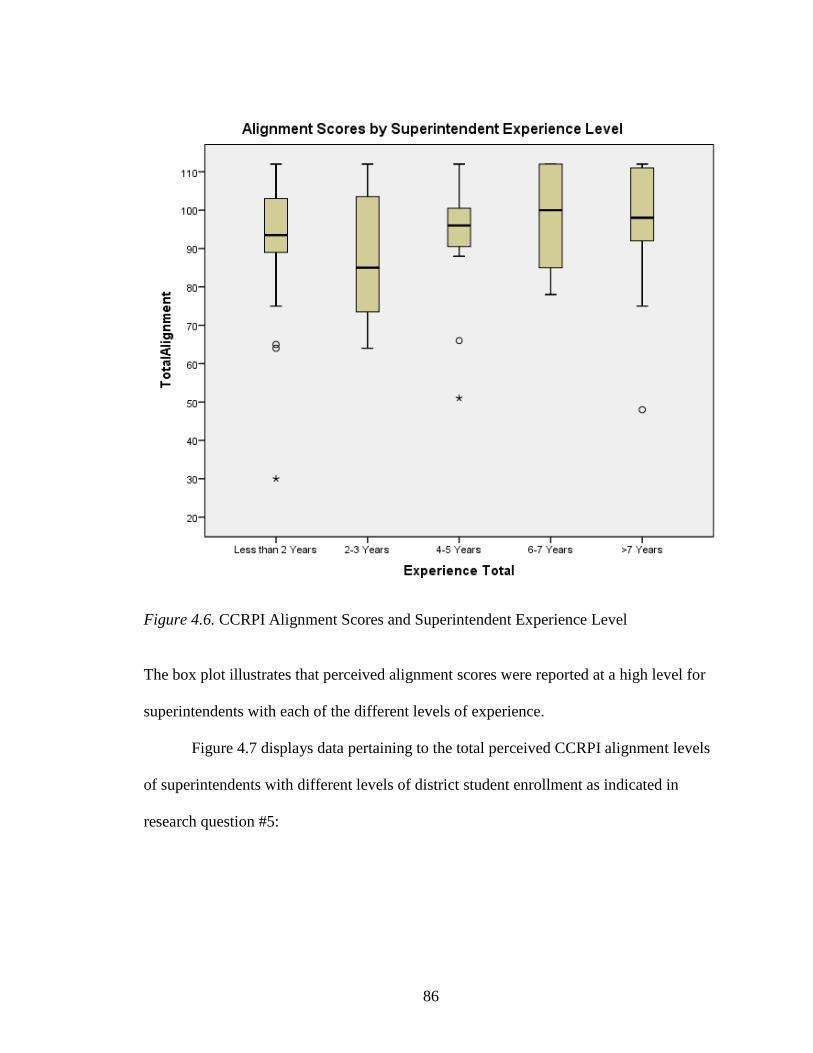
86
Figure 4.6. CCRPI Alignment Scores and Superintendent Experience Level
The box plot illustrates that perceived alignment scores were reported at a high level for
superintendents with each of the different levels of experience.
Figure 4.7 displays data pertaining to the total perceived CCRPI alignment levels
of superintendents with different levels of district student enrollment as indicated in
research question #5:

87
Figure 4.7. CCRPI Alignment Scores and School District Enrollment Size
The box plot illustrates that perceived alignment scores were reported at a high level for
each district enrollment interval. In total, for each of the fixed factors (balanced scorecard
use, system charter status, superintendent experience levels, and district student
enrollment levels), there were no main effects, and there were not any significant
interactions observed in the data for perceived CCRPI alignment.

88
CHAPTER 5
DISCUSSION OF FINDINGS
The purpose of this study was to examine perceptions of Georgia school
superintendents pertaining to the alignment of school district performance goals to
Georgia’s accountability index: the College and Career Ready Performance Index
(CCRPI). A quantitative approach was used to compare perceived CCRPI alignment
levels across different superintendent characteristics and school district demographics.
Chapter 5 provides an overview of the principle findings, a discussion of the findings,
and implications for policy, practice, and future research.
Overview of the Study
The purpose of this study was to examine perceptions of Georgia school
superintendents pertaining to the alignment of school district performance goals to the
state’s accountability index: the CCRPI. Perceptual data were obtained about the extent
to which school district balanced scorecards or other school district performance
management systems were aligned to specific subcategories within Georgia’s CCRPI
(achievement, post high school readiness, progress, and achievement gap). Overall
alignment levels were then examined in conjunction with superintendents’ self-reporting
on certain school district and superintendent characteristics. The self-reported categorical
data included the superintendent’s number of years of experience, the school district’s
student enrollment, the performance management system that was used in the district, and
whether or not the superintendent reported his or her district to be an approved charter
89
school system. The CCRPI alignment variables were examined using a 7-point Likert
scale, while demographic and categorical variables were reported and mean perceived
alignment levels compared.
The survey was developed by the researcher, and it was validated by two
educational practitioner focus groups prior to being emailed to Georgia school
superintendents in November and December of 2014. The instrument was designed to
obtain data across three categories:
1. self-reported demographics
2. self-reported system-wide goal measurement processes
3. self-reported alignment to the CCRPI
The demographic and goal measurement items produced categorical data, and the self-
reported CCRPI alignment items used a 7-point Likert scale to generate numerical data.
Data in the study were collected from 72 Georgia school superintendents who
voluntarily participated in the research. The research sample encompassed approximately
40% of all Georgia’s school districts and included superintendents from all geographical
regions in the state as well as representing a variety of student enrollment sizes and
superintendent experience levels.
Summary of the Findings
The study was organized around five research questions:
1. Are there differences in superintendents’ overall perceived alignment to the
following subcategories in the CCRPI: student achievement, post high school
readiness, progress, and achievement gap?

90
2. Is there a difference in perceived alignment to the CCRPI between
superintendents in school districts using balanced scorecards and superintendents
in school districts using other school district performance management systems?
3. Is there a difference in perceived CCRPI alignment between superintendents who
reported charter system status and superintendents who reported non-charter
system status?
4. Are there differences in perceived alignment to the CCRPI between
superintendents with different experience levels?
5. Are there differences in perceived alignment to the CCRPI between
superintendents with different levels of student enrollment?
Research question one generated significant results and a finding, while the other
research questions provided the context for two additional findings pertaining to the
independent demographic variables and dependent variable of CCRPI alignment. The
first research question asked, “Are there differences in superintendents’ overall perceived
alignment between the following subcategories in the CCRPI: student achievement, post
high school readiness, progress, and achievement gap?” In the data collection, a 7-point
Likert scale was used across four items per subcategory and 28 possible points were
generated. Across 72 superintendent survey responses, the subcategory of achievement
had a mean of 24.57 out of 28 possible alignment points (88%)—which was
approximately 8% greater than each of the alignment scores for other CCRPI
subcategories: post high school readiness, progress, and achievement gap.

91
Research questions 2 through 5 measured the dependent variable of total CCRPI
alignment across four independent variables. Table 5.1 displays the demographic and
system-wide goal management categories examined in research questions 2 through 5:
Table 5.1
Independent and Dependent Variables Pertaining to School Districts
Research Question Independent Variable Dependent Variable
#2 Balanced Scorecard Use or
No Balanced Scorecard
Use
Perceived CCRPI
alignment
#3 Approved Charter System
Status or Non-Charter
System Status
Perceived CCRPI
alignment
#4 Experience Level as a
Superintendent
Perceived CCRPI
alignment
#5 School District Student
Enrollment Level
Perceived CCRPI
alignment
Note. See Appendix B for a complete list of survey items.
For research questions 2 through 5, an ANOVA was calculated to compare CCRPI
alignment levels across each of the self-reported categories, and no significant differences
in CCRPI alignment levels were found. However, it was noted that overall CCRPI
alignment levels were reported at a high level (an average response of 5.8 using a scale of
7) across all alignment items and all superintendent responses. Therefore, it was noted
that superintendents, in general, reported a high scale level of alignment to the CCRPI.
Furthermore, superintendents reported high levels of CCRPI alignment irrespective of
their school district’s goal measurement process or demographic characteristics.
Discussion of the Findings
Finding 1: Georgia school superintendents communicated that their school
district goals were aligned to the CCRPI subcategory of achievement at a significantly

92
higher level than the other three CCRPI subcategories: post high school readiness,
progress, and achievement gap.
Survey results indicated that superintendents’ perceived alignment to achievement
was higher than any other CCRPI alignment subcategories measured in the survey. At the
time of the survey, Georgia’s Waiver of NCLB (2012) was in its second full year of
implementation. Prior to the Waiver of NCLB, student achievement was the primary
measurement within the school accountability model. Therefore, schools and school
districts had many years of experience with student achievement as a measurement.
Inversely, the CCRPI used many more categories and indicators than NCLB had used in
AYP (Adequate yearly Progress) reports and perhaps the newer CCRPI categories were
not as familiar as achievement. In the school years prior to the waiver, Georgia schools
operated within the NCLB accountability guidelines. Thus, when compared to NCLB
accountability measures, the CCRPI was more recent and perhaps could account for
achievement receiving the higher level of perceived alignment.
Finding 2: Georgia school superintendents reported that their school district
goals, in general, were aligned to the CCRPI.
While superintendents reported greater alignment levels to achievement, they
reported a high level of overall alignment to the CCRPI, in general. According to Perie,
Park, and Klau (2007), accountability presupposes that practicing educators will respond
to the accountability model that is in place. In this study, the 72 Georgia school
superintendents communicated a high level of total school district goal alignment to the
CCRPI (a mean response of 5.8 out of 7 possible points). Thus, it appeared that the
accountability model—the CCRPI in this instance—had an overall impact on perceived

93
goal alignment. However, more research would be needed to determine whether the
accountability model was the primary factor in the superintendents’ reported goal
alignment levels. In addition, more study would be needed to determine actual levels of
goal alignment versus the reported levels of goal alignment.
Finding 3: There were no significant differences in perceived CCRPI alignment
levels from superintendents with different self-reported demographics or from
superintendents who used different system-wide goal measurement processes.
First, the researcher tested for differences in perceived CCRPI alignment levels
between superintendents using balanced scorecards and superintendents who were not
using balanced scorecards. No significant differences were found, and perceived
alignment levels were relatively high for both groups. Second, the researcher tested for
differences in perceived CCRPI alignment levels between superintendents in approved
charter systems versus superintendents who did not serve in approved charter systems.
Similarly, no significant differences were found, and perceived alignment levels were
relatively high for both groups. Third, the researcher tested for differences in perceived
CCRPI alignment levels between superintendents with different levels of experience as a
superintendent. Again, no significant differences were found, and perceived alignment
levels were relatively high for all groups. Fourth, the researcher tested for differences in
perceived CCRPI alignment levels between superintendents with different district student
enrollment levels. Once again, no significant differences were found, and perceived
CCRPI alignment levels were relatively high for each of the enrollment levels measured
in the study.

94
Since there were no perceived alignment differences based on the self-reported
demographic characteristics or goal measurement systems, it is suggested that the
accountability system could be the factor that drives goal alignment irrespective of school
district and superintendent characteristics. However, more study would be needed to
examine this theory. In addition, similar to finding 2, there was a high level of perceived
alignment to the CCRPI across all superintendent groups. Again, this could give credence
to the accountability theory of action (Anderson, 2003; Perie, Park, & Klau, 2007), but
more study would be needed.
Implications for Policy
One motivating factor for conducting this research was the context of policy
change in Georgia at the time of the study. In the years preceding the study, Georgia had
obtained a waiver from NCLB and was a participant in the Race to the Top initiative that
came with many educational reforms. When characterizing education policy and schools,
Levin (2008) explained that policies govern the work that is carried out in education. In
Chapter 2, literature pertaining to school accountability outlined the accountability
context as a factor that impacts the work of schools and districts (Hargreaves & Fullan,
2009; McLaughlin & Mitra, 2001). More specific to this study was the much larger
number of accountability variables within Georgia’s accountability index, the CCRPI, as
compared to the limited number of accountability variables in the AYP reports within the
NCLB accountability model (See Appendix D and Appendix E for an example section
from each school accountability report).
Other motivating factors included a growing trend of school districts using
balanced scorecards to manage their school district goals (Kaplan & Mikake, 2010;

95
Karathanos & Karathanos, 2005). Another motivation for the research was the limited
amount of current research pertaining to the school district’s role in managing the work
of its schools though some recent studies were found (Duke, 2010; Marzano & Waters,
2009). Due to the context of increasing levels of school accountability (McNeil et al.,
2008) in conjunction with Georgia’s new accountability guidelines within its waiver of
NCLB, the study was conceived with a concurrent interest in how school district leaders
(i.e., Georgia school superintendents) responded to changes in policy.
Finding 1 stated that superintendents indicated a higher degree of goal alignment
to the subcategory of achievement relative to other subcategories that were newer and
exclusive to the CCRPI. Following an analysis of Georgia AYP reports from each year
prior to the CCRPI, achievement was the central measure used in the NCLB
accountability model and had been a consistent metric for U.S. schools and school
districts in the years prior to the CCRPI. Therefore, it was noted that superintendents
communicated a higher level of perceived alignment to achievement—a variable with a
high level of familiarity and a clearly understood formula for school districts and schools
to calculate (See Appendix D for more information on AYP reports and student
achievement).
A consideration for future policymakers might also be that schools and school
districts need time to have a clear understanding of policies and, in this case, to adjust to
accountability indicators. In addition, it may, therefore, also take time for educators to
fully align their work to new initiatives and to adjust their goals to synchronize with
accountability measures. Louis et al. (2008) stated that schools often develop internal
accountability systems to respond to external policies. Thus, an implication for

96
educational policymakers could pertain to the need to clearly communicate new
accountability measures, to consider alignment examples for practitioners, to use or
provide goal alignment tools in formats consistent with school district practice, and to
allow adequate wait time for practitioners to adjust to new guidelines. With respect to
balanced scorecards and school improvement plans, it might be of value to communicate
alignment strategies that highlight leading indicators for managing accountability
measures prior to the lagging bottom line or year-end reports included in school
accountability indices.
Implications for Practice
With respect to school district goal management, practitioner implications could
pertain to the development of internal systems or next steps that may be needed to
address the new accountability measures in the CCRPI. Based on the data collected in
this study, more work may be needed to align school district goals to the newer
subcategories within the CCRPI such as post high school (i.e., college and career)
readiness, progress (i.e., student growth percentile levels), and student achievement gap
(i.e., z-score calculations from the test performance of the lower quartile versus the
state’s mean score). Perhaps more direction is needed on the calculations themselves or
more study might be needed related to developing short-term goals for these new
accountability measurements (See Appendix E for more information about CCRPI
reports).
Additionally, alignment data from the study may provide implications for school
district organizational charts as well as decisions in regard to whether job descriptions
address the accountability shifts in the new college and career-related accountability

97
expectations in the CCRPI. Furthermore, there may need to be increased learning
opportunities for leaders, staff, media, and community members in regards to the
indicators on which schools and school districts are now being measured. Similarly,
school district leaders might benefit from a sharing of ideas pertaining to how school
districts can manage accountability goals using either balanced scorecards or other
performance management systems.
Implications for Future Research
As stated in Chapter 2, the initial balanced scorecard literature was exclusively
reported in business accountability and management practices, and it included formative
performance measures in addition to financial bottom lines (Kaplan & Norton, 1996b).
Similarly, practitioner journals indicated that Georgia school districts were implementing
balanced scorecards as tools to manage leading and lagging indicators across school
districts (Cowart, 2010; Kaplan & Miyake, 2010). In the business literature, Kaplan and
Norton (1992; 2001) emphasized the value of managing different perspectives (internal
and external), organizational learning, and qualitative goals in their original work. This
research study examined balanced scorecard use in conjunction with school district goal
alignment to a new accountability index: the CCRPI. Therefore, this research primarily
focused on alignment to an external perspective, school district accountability, and
included superintendent perceptions. Based on the review of relevant literature in
conjunction with the research questions measured in this study, future research could be
conducted to study the degree to which balanced scorecards address different
perspectives about the work of the school district. In addition, organizational learning and
qualitative measures could also be considered.

98
With respect to school district goal alignment, Marzano and Waters (2009)
described tight organizational coupling as the precursor for district leaders to have an
impact on student achievement. Therefore, additional research could be conducted to
study alignment across all units of an educational organization. In the case of the school
district, research could examine how common goals are addressed at the school board or
district level, in individual schools, and, in the classroom setting as well. While this
research did not find significant differences between perceived CCRPI alignment levels
of superintendents using balanced scorecards and those who did not, a similar study
might address whether or not the balanced scorecard users showed different perceived
alignment levels to other goals such as local input or organizational learning. Table 5.2
includes some of the themes from balanced scorecard literature and relevant research that
may be of interest to future researchers:
Table 5.2
Topics for Future Balanced Scorecard Research in Education
Balanced Scorecard Research Topics Related Literature
Management Using a Balance of Leading
and Lagging Indicators
Bieker and Waxenberger (2002)
Figge et al. (2002)
Kaplan & Miyake (2010)
Kaplan & Norton (1996b)
Strategic Alignment to Short-Term and
Long-Term Goals
Bieker and Waxenberger (2002)
Figge et al. (2002)
Kaplan & Miyake (2010)
Kaplan & Norton (1996b)
Communicating Objectives Across the
Organization (Cascading)
Kaplan & Miyake (2010)
Kaplan & Norton (1996a; 2001)
Lipe & Salterio (2000)
Niven (2008)
Response to Feedback from Internal and
External Perspectives
Ittner et al. (2003)
Kaplan (2008)
Kaplan & Norton (1992; 2001)

99
Table 5.2 Continued
Balanced Scorecard Research Topics Related Literature
Using a Combination of Quantitative and
Qualitative Measures
Ittner & Larcker (1998; 2001)
Malina & Selto (2001)
Management of Organizational Learning,
Knowledge Management, and Innovation
Strategies
Arora (2002); Kaplan & Norton (1992;
1996a; 2001) Teece (1998)
Another area for future research might be the study of internal school district
accountability systems. In Chapter 2, the trend of school districts developing internal
systems to manage external accountability mandates emerged (Louis et al., 2008). In
school district literature, Marzano and DuFour (2010) emphasized that district leadership
can have a positive impact on student learning and that site-based or school-based
management has not been effective. Furthermore, McNeil et al. (2008) pointed out that
school accountability is increasing. Therefore, more research may be needed to study
district leadership practices and internal accountability systems in an era of increased
external accountability for schools and school districts.
Final Thoughts
In educational practice and research, many variables impact a school district’s
ability to accomplish desired goals. In this research, an objective was to bring together
organizational management practices and examine them in conjunction with school
district leadership and accountability as a context. In the study, superintendents were
surveyed and perceptual data were collected and categorized by demographic
characteristics and goal management processes. In the future, as district leadership
evolves and accountability shifts, more study will be needed. And furthermore, other
perspectives will require additional research to more fully understand district office
leadership and nested educational variables that impact goal management systems and

100
measures. In closing, seminal balanced scorecard research provided companies with tools
and perspectives to broaden the factors of consideration when examining organizational
productivity (Kaplan & Norton, 1992). However, some research has shown that
businesses still focused more on the bottom line financial measures (Ittner & Larker,
1998; 2001; Malina & Selto, 2001). In the future, perhaps educators—irrespective of
what goal management system is implemented—will be able to avoid this pitfall and
achieve balance in their accountability and management processes. This researcher is
hopeful that information from this study can contribute to the dialogue and ongoing
development of a common language that will be needed to establish positive performance
cultures for educators and the students that are served in our schools and districts.

101
REFERENCES
Anderson, J.E. (2003). Public policy making. 6th ed. Boston: Houghton-Mifflin.
Arora, R. (2002). Implementing KM – A balanced scorecard approach. Journal of
Knowledge Management, (6)3, 240-9. doi: 10.1108/13673270210434340
Atkinson, A. A., Banker, R. D., Kaplan, R. S., & Young, S. M. (1997). Management
Accounting. (3rd ed.). Upper Saddle River, NJ: Prentice Hall.
Bieker, T., & Waxenberger, B. (2002). Sustainability balanced scorecard and business
ethics: Developing a balanced scorecard for integrity management.
Göteborg/Sweden: Contribution to the 10th International Conference of the
Greening of Industry Network. Retrieved from
http://www.researchgate.net/publication/36386357
Boulianne, E. (2006). Empirical analysis of the reliability and validity of balanced
scorecard measures and dimensions. Advances in Management Accounting, 15(1),
127-142. doi: 10.1016/S1474-7871(06)15006-6
Charter, R. A. (2003). A breakdown of reliability coefficients by test type and reliability
method, and the clinical implications of low reliability. The Journal of General
Psychology, 130(3), 290-304. doi: 10.1080/00221300309601160
Chen, M. Y., & Chen, A. P. (2006). Knowledge management performance evaluation: a
decade review from 1995 to 2004. Journal of Information Science, 32(1), 17-38.
doi: 10.1177/0165551506059220

102
Chenhall, R. H. (2003). Management control systems design within its organizational
context: Findings from contingency-based research and directions for the future.
Accounting, Organizations and Society, 28(2), 127-168. doi:
10.1016/S0361-3682(01)00027-7
Chi, D., & Hung, H. (2011). Is the balanced scorecard really helpful for improving
performance? Evidence from software companies in China and Taiwan. African
Journal of Business Management, 5(1), 224-239. doi: 10.5897/AJBM10.749
Cowart, S.K. (2010). Driving improvement with a balanced scorecard. The School
Administrator, 2(67), 16-19. Retrieved from http://www.aasa.org/
Creswell, J.W. (2002). Research design: Qualitative, quantitative, and mixed methods
approaches. Thousand Oaks, CA: Sage Publications.
Cronbach, L. J. (1951). Coefficient alpha and the internal structure of tests.
Psychometrika, 16(3), 297-335. doi: 10.1007/BF02310555
Dailey, D., Fleischman, S., Gil, L., Holtzman, D., O’Day, J., & Vosmer, C. (2005).
Towards more effective school districts: A review of the knowledge base.
Washington, DC: American Institutes for Research. Retrieved from
http://www.ped.state.nm.us/
DuFour, R. (2004). What is a “professional learning community”? Educational
Leadership, 61(8), 6-11. doi: www.educationalleadership-digital.com
DuFour, R., & Marzano, R. (2011). Leaders of learning: How district, school, and
classroom leaders improve student achievement. Bloomington, IN: Solution Tree
Press.

103
Duke, D.L. (2010). The challenges of school district leadership. New York, NY:
Routledge.
Elmore, R.F. (2004). School reform from the inside out: Policy, practice, and
performance. Cambridge, MA: Harvard University Press.
Figge, F., Hahn, T., Schaltegger, S., & Wagner, M. (2002). The sustainability balanced
scorecard – linking sustainability management to business strategy. Business
Strategy and the Environment, 11(5), 269–284. doi: 10.1002/bse.339
Fraenkel, J.R., Wallen, N.E., & Hyun, H.H. (2012). How to design and evaluate
research in education (8th ed.). Boston, MA: McGraw-Hill.
Fullan, M., Bertani, A., & Quinn, J. (2004). New lessons for districtwide reform.
Educational Leadership, 61(7), 42-46. Retrieved from http://www.eric.ed.gov/
Gartner Group (2002, July). Use the balanced scorecard to execute CRM strategy.
Retrieved July 1, 2012 from http://www.gartner.com/
Georgia Department of Education (2012a, February). Georgia receives waiver from No
Child Left Behind. Press Release. Author. Retrieved from
http://www.doe.k12.ga.us/External-Affairs-and-Policy/communications
Georgia Department of Education (2012b). Georgia’s Race to the Top (RT3) plan.
Author. Retrieved from http://www.doe.k12.ga.us/Race-to-the-
Top/Pages/default.aspx.
Georgia Department of Education (2014). School system flexibility in Georgia.
Author. Retrieved from http://www.gadoe.org/External-Affairs-and-
Policy/Charter-Schools/Documents/

104
Georgia’s Waiver of No Child Left Behind (2012). Elementary and Secondary Education
Act Flexibility Waiver Request. Author. Retrieved from http://www.doe.k12.ga.us
Glennon, M.C. (2010). Aligned and nested: School plans to support a balanced scorecard.
The School Administrator, 2(67), 18. Retrieved from http://www.aasa.org/
Hallinger, P., & Heck, R. H. (1996). Reassessing the principal’s role in school
effectiveness: A review of empirical research, 1980‐1995. Educational
Administration Quarterly, 32(1), 5‐44. doi: 10.1177/0013161X96032001002
Hargreaves, A., & Fullan, M. G (1992). Understanding teacher development. London:
Teachers College Press.
Hargreaves, A., & Fullan, M.G. (Ed.). (2009). Change wars. Bloomington, IN: Solution
Tree.
Haynes, S. N., Richard, D., & Kubany, E. S. (1995). Content validity in psychological
assessment: A functional approach to concepts and methods. Psychological
Assessment, 7(3), 238. doi: http://dx.doi.org/10.1037/1040-3590.7.3.238
Hinkin, T. R. (1998). A brief tutorial on the development of measures for use in survey
questionnaires. Organizational Research Methods, 1(1), 104-121. doi:
10.1177/109442819800100106
Ittner, C. D., & Larcker, D. F. (1998). Innovations in performance measurement: Trends
and research implications. Journal of Management Accounting Research, 10(1),
205-239. Retrieved from http://papers.ssrn.com/
Ittner, C.D., & Larcker, D.F. (2001) Assessing empirical research in managerial
accounting: A value-based management perspective. Journal of Accounting and
Economics, 32(1), 349–410. doi: 10.1016/s0165-4101

105
Ittner, C.D., Larcker, D.F., & Meyer, M.W. (1997). Performance compensation and the
balanced scorecard. Working Paper, University of Pennsylvania. Retrieved from
http://papers.ssrn.com/
Ittner, C.D., Larcker, D.F., & Meyer, M.W. (2003, July). Subjectivity and the weighting
of performance measures: Evidence from a balanced scorecard. The Accounting
Review, 78(3), 725-758. doi: 10.2308/accr.2003.78.3.725
Ittner, C., Larcker, D., & Randall, T. (2003). Performance implications of strategic
performance measurement in financial services firms, Accounting, Organizations
and Society, 28(7/8), 715-741. doi:10.1016/S0361-3682(03)00033-3
Kaplan, R. S. (2008). Conceptual foundations of the balanced scorecard. Handbooks of
Management Accounting Research, 3(1), 1253-1269. doi:
10.1016/S1751-3243(07)03003-9
Kaplan, R.S., & Miyake, D.N. (2010, February). The balanced scorecard. The School
Administrator, 2(67), 10-15. Retrieved from http://www.aasa.org/
Kaplan, R.S., & Nagel, M.E. (2003, December). Improving corporate governance with
the balanced scorecard. Harvard Business School Working Knowledge Paper.
Retrieved from http://hbswk.hbs.edu/
Kaplan, R.S., & Norton, D.P. (1992). The balanced scorecard – measures that drive
performance. Harvard Business Review, 70(1), 70-79. Retrieved from
https://hbr.org/
Kaplan, R.S., & Norton, D.P. (1996a). The balanced scorecard: Translating strategy into
action. Boston, MA: Harvard Business School Press.

106
Kaplan, R.S., & Norton, D.P. (1996b). Using the balanced scorecard as a strategic
management system. Harvard Business Review, 74(1), 75-85. Retrieved from
https://hbr.org/
Kaplan, R.S., & Norton, D.P. (2001). Transforming the balanced scorecard from
performance measurement to strategic management: Part I. Accounting Horizons,
15(1) 87–104. doi: 10.2308/acch.2001.15.1.87
Karathanos, D., & Karathanos, P. (2005). Applying the balanced scorecard to
education. Journal of Education for Business, 80(4), 222-230. doi:
10.3200/JOEB.80.4.222-230
Krumwiede, K.R., Eaton, T.V., Swain, M.R., & Eggett, D.L. (2008). A research note on
the effects of financial and nonfinancial measures in balanced scorecard
evaluations. Advances in Accounting Behavioral Research, 11(1), 155-177. doi:
10.1016/S1475-1488(08)11007-9
Leithwood, K., & Prestine, N. (2002). Unpacking the challenges of leadership at the
school and district level. In J. Murphy (Ed.), Challenges of school leadership
(NSSE Yearbook). Chicago, IL: University of Chicago Press.
Levin, B. (2008). Curriculum policy and the politics of what should be learned in schools.
In F.M. Connelly, He, M.F. & Phillion, J. (Eds.) The Sage handbook of
curriculum and instruction (pp. 7-24). Los Angeles, CA: Sage Publications.
Ling, Q., Giacomino, D., Browne, M., & Akers, M. (2009). An examination of the use of
the board balanced scorecard by large public corporations. Review of Business
Information Systems, 13(2), 41-49. Retrieved from
http://epublications.marquette.edu/

107
Lipe, M. G., & Salterio, S. E. (2000). The balanced scorecard: Judgmental effects of
common and unique performance measures. The Accounting Review, 75(3), 283-
298. doi: 10.2308/accr.2000.75.3.283
Lipe, M. G., & Salterio, S.E. (2002). A note on the judgmental effects of the balanced
scorecard's information organization. Accounting, Organizations and Society,
27(6), 531-540. doi: 10.1016/S0361-3682(01)00059-9
Litwin, M.S. (1995). How to measure survey reliability and validity. Thousand Oaks,
CA: Sage Publications.
Lortie, D. C. (1975). Schoolteacher: A sociological study. Chicago, IL: University of
Chicago Press.
Louis, K. S., Febey, K., & Schroeder, R. (2005). State-mandated accountability in high
schools: Teachers' interpretations of a new era. Educational Evaluation and
Policy Analysis, 27(2), 177-204. doi: 10.3102/01623737027002177
Malina, M.A., & Selto, F.H, (2001). Communicating and controlling strategy: An
empirical study of the effectiveness of the balanced scorecard. Journal of
Management Accounting Research, 13(1), 47-90. doi:
http://dx.doi.org/10.2308/jmar.2001.13.1.47
Marks, H. M., & Louis, K. S. (1999). Teacher empowerment and the capacity for
organizational learning. Educational Administration Quarterly, 35(5), 707-750.
doi: 10.1177/0013161X99355003
Marzano, R. J., Waters, T., & McNulty, B. A. (2005). School leadership that works:
From research to results. Alexandria, VA: Association for Supervision and
Curriculum Development.

108
Marzano, R.J., & Waters, T. (2009). District leadership that works: Striking the right
balance. Bloomington, IN: Solution Tree.
McLaughlin, M., & Mitra, D. L. (2001). Theory-based change and change-based theory:
Going deeper, going broader. Journal of Educational Change, 3(1), 301-323.
doi: 10.1023/A:1014616908334
McDonnell, L.M. (2005). No Child Left Behind and the federal role in education:
Evolution or revolution? Peabody Journal of Education, 80(2), 19-38. doi:
10.1207/S15327930pje8002_2
McNeil, L., Coppola, E., Radigan, J., & Vasquez, J. (2008). Avoidable losses: High-
stakes accountability and the dropout crisis. Education Policy Analysis Archives,
16(3), 1-48. doi: http://dx.doi.org/10.14507/epaa.v16n3.2008
Murphy, J., & Hallinger, P. (1986). The superintendent as instructional leader: Findings
from effective school districts. Journal of Educational Administration, 24(3), 213-
236. doi: http://dx.doi.org/10.1108/eb009917
Murphy, J., & Hallinger, P. (1988). Characteristics of instructionally effective school
districts. Journal of Educational Research, 81(3), 175-181. Retrieved from
http://www.jstor.org/stable/40539654
Murphy, J. (2007). Restructuring through learning-focused leadership. In H. J. Walberg
(Ed.), Handbook on restructuring and substantial school improvement (63–75).
Lincoln, IL: Center on Innovation and Improvement.
Musanti, S.I., & Pence, L.P. (2010, Winter). Collaboration and teacher development:
Unpacking resistance, constructing knowledge, and navigating identities. Teacher

109
Education Quarterly 37(1), 73-89. Retrieved December 19, 2014 from
http://www.jstor.org/stable/23479299
Niven, P.R. (2008). Balanced scorecard: Step-by-step for government and nonprofit
agencies. Hoboken, NJ: Wiley and Sons Publishing.
No Child Left Behind (NCLB) Act of 2001, Pub. L. No. 107-110, § 115 (2002). Author.
Retrieved from http://www2.ed.gov/nclb/landing.jhtml
Norreklit, H. (2000). The balance on the balanced scorecard – a critical analysis of some
of its assumptions. Management Accounting Research, 11(1), 65-88. doi:
10.1006rmare.1999.0121
O’Day, J. (2002). Complexity, accountability, and school improvement. Harvard
Educational Review, 72(3), 293-329. Retrieved from
http://eric.ed.gov/?id=EJ655018
Office of the Lieutenant Governor (2014). Charter systems. Author. Retrieved from
http://ltgov.georgia.gov/charter-systems
Orton, J. D., & Weick, K. E. (1990). Loosely coupled systems: A reconceptualization.
Academy of Management Review, 15(2), 203–223. Retrieved from
http://www.jstor.org/stable/258154
Perie, M., Park, J., & Klau, K. (2007). Key Elements for Educational Accountability
Models Washington, DC: Council of Chief State School Officers. Retrieved from
http://www.ccsso.org/
Salant, P., & Dillman, D. (1994). How to conduct your own survey. New York, NY:
Wiley and Sons Publishing.

110
Spillane, J.P. (2004). Standards deviation: How schools misunderstand education policy.
Cambridge, MA: Harvard University Press.
Teece, D. (1998). Capturing value from knowledge assets: the new economy, markets for
know-how, and intangible assets. California Management Review 40(3): 55-79.
Retrieved from http://connection.ebscohost.com/
Tyack, D., & Cuban, L. (1995). Tinkering toward utopia: A Century of public school
reform. Cambridge, MA: Harvard University Press.
Weick, K.E. (1976). Educational organizations as loosely coupled systems.
Administrative Science Quarterly, 21(1), 1–19. Retrieved from
http://www.jstor.org/stable/2391875
Woodley, P.M. (2006). Culture management through the balanced scorecard: A case
study (Doctoral dissertation). Retrieved from
https://dspace.lib.cranfield.ac.uk/handle/1826/2056
Zepeda, S.J. (2011). The principal as instructional leader: A handbook for supervisors.
(3rd ed.). New York, NY: Routledge.
Zepeda, S.J., Lanoue, P.D., Price, N.F., & Jimenez, A.M. (2014). Principal
evaluation – linking individual and building-level progress: Making the
connections and embracing the tensions, School Leadership & Management
34(4), 324-351. doi: 10.1080/13632434.2014.928681
Zhu, K. (2002). Information transparency in electronic marketplaces: Why data
transparency may hinder the adoption of B2B exchanges. Electronic Markets,
Special Issue on B2B E-Commerce, 12(2): 92-99. doi:
10.1080/10196780252844535

111
APPENDIX A
Survey Consent Forms
Survey Consent Form for Georgia School Superintendents
Consent Letter
November 10, 2014
Dear Georgia School Superintendent:
I am a graduate student under the direction of Dr. Sally Zepeda in the Department of
Lifelong Education, Administration, and Policy at The University of Georgia. I invite you
to participate in a research study entitled A Study of Georgia School Districts’ Balanced
Scorecard Alignment to the College and Career Ready Performance Index (CCRPI). The
purpose of this study is to examine school districts’ goal management process and
perceived alignment to accountability measures such as student achievement, student
growth, and career readiness.
Your participation will involve completing a short fixed response survey that should only
take about 10-15 minutes. Your involvement in the study is voluntary, and you may
choose not to participate or to stop at any time.
In the following research, individual school districts will not be identified to the
researcher or in the research results and reporting, because the results will remain
confidential. Internet communications are insecure and there is a limit to the
confidentiality that can be guaranteed due to the technology itself. However, once the
materials are received by the researcher, standard confidentiality procedures will be
employed. The results of the research study may be published, but your name and school
system or any identifying information will not be used. In fact, the published results will
be presented in summary form only.
The findings from this project may provide information on school district goal
management formats and perceived levels of alignment. There are no known risks or
discomforts associated with this research.
If you have any questions about this research project, please feel free to call Dr. Sally
Zepeda at (706) 542-0408 or send an email to [email protected]. Questions or concerns
about your rights as a research participant should be directed to The Chairperson,

112
University of Georgia Institutional Review Board, 609 Boyd GSRC, Athens, Georgia
30602; telephone (706) 542-3199; email address [email protected].
By completing and returning this computer survey, you are agreeing to participate in the
above described research project.
Thank you for your consideration. Please keep this letter for your records.
Sincerely,
Jared B. Robinson

113
APPENDIX B
Survey Items
Section 1: Self-Reported Demographics
1. How many years have you served as superintendent in your current school district?
Less than 2 years 2-3 years 4-5 years 6-7 years More than 7 years
2. How many total years have you served as a school superintendent?
Less than 2 years 2-3 years 4-5 years 6-7 years More than 7 years
3. Select the category that best describes the total number of students enrolled in your
school district.
0 to 1,499 1,500 to 2,999 3,000 to 4,999 5,000 to 14,999 15,000 or more
4. Is your school district currently an approved Charter district?
YES ______ NO _______
Section 2: Self-Reported System-Wide Goal Measurement Processes
DIRECTIONS: The following items pertain to the system-wide measurement of goals
and to the measurement of goals by individual schools within your district.
1. Does your school district use a balanced scorecard to measure performance on district
goals?
YES ______ NO _______
2. If you answered “no,” please indicate what format your school district uses to measure
performance on district goals.
________________________________________________________________________
3. Do schools within your district use balanced scorecards to manage school goals?
YES ______ NO _______
4. If you answered “no,” please indicate what format schools in your school district use to
measure performance on district goals.
________________________________________________________________________

114
Section 3: Self-Reported Alignment to CCRPI
DIRECTIONS: The following items pertain to school district performance goals and
their alignment with accountability categories found in the most current College and
Career Ready Performance Index (CCRPI). Please read each statement and select the
number that indicates the degree to which your school district aligns to each statement.
1. Our district has performance goals aligned to “student achievement” measures in the
CCRPI.
1 2 3 4 5 6 7
Strongly Strongly
Disagree Agree
2. Our district has performance goals aligned to “career readiness” measures in the
CCRPI.
1 2 3 4 5 6 7
Strongly Strongly
Disagree Agree
3. Our district has performance goals aligned to measures of “student progress” in the
CCRPI.
1 2 3 4 5 6 7
Strongly Strongly
Disagree Agree
4. Our district has performance goals aligned to “achievement gap” measures in the
CCRPI.
1 2 3 4 5 6 7
Strongly Strongly
Disagree Agree
5. Our district has performance goals that address student performance on standardized
tests included in the CCRPI.
1 2 3 4 5 6 7
Strongly Strongly
Disagree Agree

115
6. Our district has performance goals that address student performance on career
readiness assessments in the CCRPI.
1 2 3 4 5 6 7
Strongly Strongly
Disagree Agree
7. Our district has performance goals that address student growth percentile measures in
the CCRPI.
1 2 3 4 5 6 7
Strongly Strongly
Disagree Agree
8. Our district has performance goals that address increasing the achievement of the
lowest 25% of students as defined in the CCRPI.
1 2 3 4 5 6 7
Strongly Strongly
Disagree Agree
9. Our district has performance goals that are aligned to “content mastery” measures in
the CCRPI.
1 2 3 4 5 6 7
Strongly Strongly
Disagree Agree
10. Our district has performance goals that are aligned to post-high school readiness
measures in the CCRPI.
1 2 3 4 5 6 7
Strongly Strongly
Disagree Agree
11. Our district has performance goals that measure typical and high student growth as
defined in the CCRPI.
1 2 3 4 5 6 7
Strongly Strongly
Disagree Agree

116
12. Our district has performance goals that measure the achievement of the lower quartile
of students as defined in the CCRPI.
1 2 3 4 5 6 7
Strongly Strongly
Disagree Agree
13. Our district has performance goals that address student achievement measures in the
CCRPI.
1 2 3 4 5 6 7
Strongly Strongly
Disagree Agree
14. Our district has performance goals that address college and career-related measures
included in the CCRPI.
1 2 3 4 5 6 7
Strongly Strongly
Disagree Agree
15. Our district has performance goals that are aligned to student growth calculations
included in the CCRPI.
1 2 3 4 5 6 7
Strongly Strongly
Disagree Agree
16. Our district has performance goals that address the achievement of students scoring in
the lowest 25% on standardized tests included in the CCRPI.
1 2 3 4 5 6 7
Strongly Strongly
Disagree Agree

117
APPENDIX C
Mean Response Rate for CCRPI Alignment Items
Survey Item: CCRPI
Self-Reported Alignment
Related Subcategory Mean Response
1 Achievement 6.15
2 Post High School 5.82
3 Progress 5.96
4 Achievement Gap 5.81
5 Achievement 6.35
6 Post High School 5.61
7 Progress 5.72
8 Achievement Gap 5.78
9 Achievement 5.94
10 Post High School 5.47
11 Progress 5.52
12 Achievement Gap 5.64
13 Achievement 6.21
14 Post High School 5.96
15 Progress 5.58
16 Achievement Gap 5.63

118
APPENDIX D
Sample of Selected AYP Report Sections (2011)

119

120
APPENDIX E
Sample of Selected CCRPI Sections (2014)