a study of drought management for ben tre province …sugita/archive/201526062_le viet minh.pdf ·...
TRANSCRIPT
A Study of Drought Management for Ben Tre Province in the Mekong Delta, Vietnam
LE VIET MINH
201526062
July 2017
A Master’s Thesis Submitted to
The Graduate School of Life and Environmental Sciences,
University of Tsukuba
in Partial Fulfillment of the Requirements
for the Degree of Master of Environmental Sciences
i
Abstract
The Mekong Delta (MKD) spreads over 3.9 million ha that is the home to over 17.5
million people. The main economic activity is agriculture with 1.5 million ha of paddy and
0.39 million ha of fruits which mainly use surface water through a highly dense canal system.
In the dry season (December to April), the enhanced penetration of salinity has occurred,
possibly because of the sea-level rise and low stream level due to droughts, affected to surface
water and groundwater, and caused a water shortage for 1.4 million ha of the coastal zone of
the MKD. Recently, the delta has faced with climate change (CC) and sea level rise (SLR)
and has struggled with hydropower development and water extraction and diversion. In this
context, the occurrence of drought has happened more frequently and severely since 1998,
especially in 2004, 2010, and 2013. Specifically, in 2016, the most severe drought in the last
90 years was recorded in Vietnam. Many projects have been initiated in the Mekong Delta to
tackle with the negative impacts of CC and SLR, and saline intrusion. However, drought
study was just recommended to further studying.
The objective of this study is to seek for the holistic and appropriate approach to
drought management, and, more specifically, to figure out the suitable drought index and/or
multi-index for drought monitoring in Ben Tre, the MKD.
Currently, there are in the order of 50 popular drought indicators and indices
worldwide based on such approaches as the standardized deviation, regression analysis,
remote sensing, and hydraulic simulation. In this study, the standardized drought index based
on the standardized deviation (Z-score): ; for a variable x and its mean and
standard deviation s for a given period was examined because it is widely applied and easy to
obtain. The variable x was rainfall amount for the Standardized Precipitation Index (SPI),
discharge for the Streamflow Drought Index (SDI) and the difference between rainfall and
evapotranspiration for the Standardized Precipitation Evapotranspiration Index (SPEI). These
indices were calculated for different overlapping time periods of one month, three months, six
months, nine months, and twelve months. To figure out the promising indices, the correlation
analysis was conducted between the calculated indices with the statistics on drought damage,
and with recorded salinity data.
The results indicated that SDI for six months from January to June (SDI-6), two
months from January to February (SDI-2) and one month of April (SDI-1) were best matched
up with historical droughts years such as 1998, 2005, and 2010. Moreover, the coefficient of
determination R2 between SDI-6 and the affected areas was the highest with R
2=0.48. In the
case of SDI-1 (April) and SDI-2 (Jan.-Feb.) R2 were 0.34 and 0.37. The R
2 for other time
periods of SDI-3 (Jan.-Mar.), SDI-9 (Jan.-Sep.) and SDI-12 (Jan.-Dec.) were 0.40, 0.28, and
0.19, respectively. The results for SPI and SPEI were not as promising. Only SPI-6 (Jan.-Jun.)
had a good responded pattern to severe droughts and the highest R2 value was as low as 0.26
ii
(with the affected areas) and 0.16 (with the number of affected households). The comparison
of SPEI with the affected areas showed that the highest R2 value was only 0.14 for SPEI-6
(Jan.-Jun.) while for the others time periods the R2 values were as low as 0.02 for SPEI-3
(Feb.-Mar.); 0.11 for SPEI-9 (Jan.-Sep.); and 0.01 for SPEI-12 (Jan.-Dec.).
It is noteworthy that the number of hours recording saline concentration ≥4 ppt
(Salinity Index) in March to April clearly showed the evidence of historical drought years.
When indices were compared with the Salinity Index at Huong My Station, SDI-2 (Jan.-Feb.)
showed a good correlation (R2=0.75) with Salinity Index as 4 ppt in periods (Mar.-Apr.). To
examine thoroughly, this study added Son Doc and Tra Vinh Station located 20-30 km from
the sea to the examination. The correlation analysis was conducted between recorded hours
with salinity ≥ 4 ppt in (March and April) and those in (January to February) of these stations
and SDI in different time periods of the dry season (December to May) of Tan Chau and Chau
Doc Station. Similar to Huong My Station, SDI-2 (Jan.-Feb.) resulted in R2 ranking 0.75 to
0.81 in comparison with both stations. Ideally, SDI-2 (Jan.-Feb.) should be applied for the
drought early warning through Salinity Index.
In summary, a hybrid Drought Index as minimum [SDI-6 (Jan.-Jun.), SDI-2 (Jan.-Feb.)
and SDI-1 (Apr.)] reproduced all drought events well in Ben Tre. SPI-6 (Jan.-June.) and
SPEI-3 (Feb.-Apr.) only responded to severe drought years. Salinity Index (≥4 ppt) in the dry
season (Mar.-Apr.) clearly showed evidence of historical drought events. Moreover, SDI-2
(Jan.-Feb.) had a good correlation with recorded hours with salinity index ≥ 4 ppt in (March
and April). Thereupon, this study recommends a hybrid index including SDI-6 (Jan.-Jun.),
SDI-2 (Jan.-Feb.) and SDI-1 (Apr.) for the drought monitoring and SDI-2 (Jan.-Feb.) for the
drought early warning for Ben Tre.
Keywords: Climate change, salinity intrusion; drought monitoring and drought indices.
iii
Contents
Abstract .................................................................................................................................. i
List of Tables ......................................................................................................................... v
List of Figures ....................................................................................................................... vi
Acknowledgements ............................................................................................................. viii
1 Introduction ................................................................................................................... 1
1.1 Drought impacts ...................................................................................................... 1
1.2 Drought definition and classification ........................................................................ 1
1.3 Indices and indicators in drought management ......................................................... 2
1.3.1 Single index ...................................................................................................... 3
1.3.2 Multi-indicators ................................................................................................ 9
1.3.3 The current situation of drought indices in the Mekong River region ................ 9
1.4 The purposes of study ............................................................................................ 10
2 Study area .................................................................................................................... 11
2.1 The Mekong River Basin and Mekong Delta .......................................................... 11
2.2 Ben Tre Province ................................................................................................... 12
2.2.1 Location ......................................................................................................... 12
2.2.2 Area, population, and administrative units ...................................................... 13
2.3 Natural conditions .................................................................................................. 14
2.3.1 Climate ........................................................................................................... 14
2.3.2 Topography .................................................................................................... 16
2.4 Agricultural sector and land use ............................................................................. 17
2.5 Water use and water management .......................................................................... 19
2.5.1 Water use ........................................................................................................ 19
2.5.2 Surface water .................................................................................................. 22
2.5.3 Groundwater ................................................................................................... 23
2.6 Future projection .................................................................................................... 25
2.6.1 The socio-economic development plan-a vision towards 2020 ........................ 25
2.6.2 Climate change projection............................................................................... 26
3 Datasets and methods .................................................................................................. 28
3.1 Data collection and datasets ................................................................................... 28
3.2 Methods ................................................................................................................. 31
4 Results and discussion ................................................................................................. 33
4.1 Standardized Precipitation Index ............................................................................ 33
iv
4.1.1 Results of SPI for different periods time ......................................................... 33
4.1.2 The correlation analysis between SPI and statistical drought damage .............. 37
4.2 Streamflow Drought Index ..................................................................................... 38
4.2.1 Results of Streamflow Drought Index for Tan Chau Station ............................ 38
4.2.2 The results of Streamflow Drought Index for Chau Doc Station ...................... 42
4.2.3 The correlation analysis between SDI and affected areas................................. 47
4.3 Standardized Precipitation Evapotranspiration Index .............................................. 53
4.3.1 The results of different periods........................................................................ 53
4.3.2 The correlation analysis between SPEI and affected areas ............................... 57
4.4 Salinity Index and the correlation analysis with Streamflow Drought Index ........... 58
4.4.1 Salinity Index ................................................................................................. 58
4.4.2 The correlation analysis between Salinity Index and promising indices ........... 59
4.5 Discussion ............................................................................................................. 62
5 Conclusions and recommendations .............................................................................. 64
5.1 Conclusions ........................................................................................................... 65
5.2 Recommendations .................................................................................................. 66
References ........................................................................................................................... 68
v
List of Tables
Table 1: The summary of historically severe drought events in the world in the 21st century ............... 1
Table 2: The category of Standardized Precipitation Index ................................................................. 3
Table 3: The category of Streamflow Drought Index .......................................................................... 8
Table 4: The area and population of districts in Ben Tre Province .....................................................13
Table 5: Altitude distribution of Ben Tre Province ............................................................................16
Table 6: Statistic on land use in Ben Tre in 2015 ...............................................................................17
Table 7: The capacity of main water supply plants in Ben Tre ...........................................................19
Table 8: Domestic water demand according to the Standard TCXDVN 33:2006 ................................20
Table 9: The scale of industrial zones in Ben Tre by 2016 .................................................................20
Table 10: Livestock water demand according to the Standard 14 TCN-87 .........................................21
Table 11: The estimation of water uses for paddy and upland crops in Ben Tre in 2015 .....................21
Table 12: Dimension of main rivers in Ben Tre Province ...................................................................22
Table 13: The list and thickness of aquifers in Ben Tre ......................................................................23
Table 14: The number of wells dividing by aquifers in Ben Tre .........................................................24
Table 15: The groundwater balance estimation in 2010 for Ben Tre ...................................................24
Table 16: Groundwater quality in Ben Tre from 2005 to 2014 ...........................................................25
Table 17: The total population predicted in Ben Tre by 2020 .............................................................25
Table 18: The land use projected in Ben Tre by 2020 ........................................................................26
Table 19: Change in average temperature (oC) in the MKD in scenarios B2 .......................................26
Table 20: Change in rainfall (%) in the MDK in scenarios B2 ...........................................................27
Table 21: The data availability used to apply for Ben Tre ..................................................................29
Table 22: Historically recorded data in drought damages in Ben Tre..................................................30
Table 23: The correlation analysis between SDI and Salinity Index (R2) ............................................60
Table 24: The correlation analysis between SPI and areas affected (R2) .............................................62
Table 25: The correlation analysis between SPEI and areas affected (R2) ...........................................62
Table 26: The agreement between SDI and the historical droughts ....................................................63

vi
List of Figures
Figure 1: Administrative map of Ben Tre Province (modified from SIWRP, 2016) ............................12
Figure 2: Monthly mean temperature and the sunshine duration in Ben Tre from 2013 to 2015 ..........14
Figure 3: Annual rainfall in Ben Tre from 1978 to 2015 (Ben Tre Hydro-Meteorological Center) ......15
Figure 4: Humidity data in Ben Tre from 2012 to 2014 .....................................................................15
Figure 5: Daily maximum wind speed in the dry season in Ben Tre in 2011 ......................................16
Figure 6: Topography map of Ben Tre Province (modified from SIWRP, 2016) ................................17
Figure 7: The map of land use of Ben Tre (modified from SIWRP, 2016) ..........................................18
Figure 8: The map of rivers and main canals in Ben Tre (modified from SIWRP, 2016) ....................22
Figure 9: The institutions related to the water sector in Ben Tre and the MKD ...................................28
Figure 10: The location of observation stations..................................................................................29
Figure 11: The flow chart of the study ...............................................................................................32
Figure 12: The SPI for one-month period during January to March of Ben Tre Station ......................33
Figure 13: The SPI for one-month period during April to June of Ben Tre Station .............................33
Figure 14: The SPI for three-month period during January to May of Ben Tre Station .......................34
Figure 15: The SPI for three-month period during April to August of Ben Tre Station .......................34
Figure 16: The SPI for six-month period during January to August of Ben Tre Station ......................35
Figure 17: The SPI for nine-month period during January to November ............................................35
Figure 18: The SPI for twelve-month period from January to December ............................................36
Figure 19: The correlation analysis between SPI for Ben Tre Station and areas affected ....................37
Figure 20: The SDI for one-month period during January to March of Tan Chau Station ...................38
Figure 21: The SDI for one-month period during April to June of Tan Chau Station ..........................38
Figure 22: The SDI for one-month period during October to December of Tan Chau Station .............39
Figure 23: The SDI for three-month period during January to May of Tan Chau Station ....................39
Figure 24: The SDI for three-month period during April to August of Tan Chau Station ....................40
Figure 25: The SDI for six-month period during January to August of Tan Chau Station ...................40
Figure 26: The SDI for six-month period during April to November of Tan Chau Station ..................41
Figure 27: The SDI for nine-month period during January to December of Tan Chau Station ............41
Figure 28: The SDI for Twelve-month period from January to December of Tan Chau Station ..........41
Figure 29: The SDI for one-month period during January to March of Chau Doc Station ...................42
Figure 30: The SDI for one-month period during April to June of Chau Doc Station..........................42
Figure 31: The SDI for one-month period during July to September of Chau Doc Station ..................43
Figure 32: The SDI for one-month period during October to December of Chau Doc Station .............43
Figure 33: The SDI for three-month period during January to May of Chau Doc Station ....................44
Figure 34: The SDI for three-month period during April to August of Chau Doc Station ...................44
Figure 35: The SDI for six-month period during January to August of Chau Doc Station ...................44
Figure 36: The SDI for six-month period during April to November ..................................................45
vii
Figure 37: The SDI for nine-month period from January to December ...............................................45
Figure 38: The SDI for twelve-month period of Chau Doc Station .....................................................46
Figure 39: The correlation analysis between one-month SDI for Tan Chau and areas affected ...........47
Figure 40: The correlation analysis between 3 and 4-month SDI for Tan Chau and areas affected ......48
Figure 41: The correlation analysis between 6 and 9-month SDI for Tan Chau and areas affected ......49
Figure 42: The correlation analysis between one-month SDI for Chau Doc and areas affected ...........50
Figure 43: The correlation analysis between 3-month SDI for Chau Doc and areas affected ...............51
Figure 44: The correlation analysis between 4 and 6-month SDI for Chau Doc and areas affected .....52
Figure 45: The SPEI for one-month period during January to March of Ben Tre Station ....................53
Figure 46: The SPEI for one-month period during April to June of Ben Tre Station ...........................53
Figure 47: The SPEI for one-month period during July to September of Ben Tre Station ...................54
Figure 48: The SPEI for three-month period during January to May of Ben Tre Station .....................54
Figure 49: The SPEI for three-month period during April to August of Ben Tre Station .....................54
Figure 50: The SPEI for six-month period during January to August of Ben Tre Station ....................55
Figure 51: The SPEI for six-month period during April to November of Ben Tre Station ...................55
Figure 52: The SPEI for nine-month period during January to November of Ben Tre Station .............56
Figure 53: The SPEI for twelve-month period during January to December of Ben Tre Station ..........56
Figure 54: The correlation analysis between SPEI and areas affected.................................................57
Figure 55: Salinity Index for Huong My Station ................................................................................58
Figure 56: The correlation between SDI for Tan Chau and Salinity Index at Huong My ....................59
Figure 57: The location map of additional salinity observation stations for analysis ...........................60
Figure 58: The correlation analysis between SDI and salinity Tra Vinh, Son Doc, and Huong My .....61
Figure 59: The correlation analysis between a hybrid index and affected areas ..................................64

viii
Acknowledgements
I am deeply grateful to my supervisor, Professor Sugita Michiaki for his instructions,
assistances, and valuable suggestions during my study of master degree. My study could not
be done without his guidance. He also gave me a lot of motivations to overcome challenges
during my study.
The valuable assistance and support from Japan International Cooperation Center and Japan
Development Scholarship program are valuable to me in order to carry out my study. I really
want to express my many thanks to all.
I also would like to express my deep gratitude to all teachers in University of Tsukuba who
taught me in environmental and hydrological courses and encouraged me in sharpening my
skill. Also, thank for the staff here, I have a warm atmosphere and a great environment to
study.
I would like to thank my colleagues, classmates and friends for their support and help during
my study.
1
1 Introduction
1.1 Drought impacts
Drought is one of the natural disasters which cause severe damage to human beings,
and it is one of a mega-crisis. Globally, in the 20th
century, many droughts occurred
worldwide with the huge casualties; for example, China in 1959-1961, India in 1965-1967 and
Africa in 1980 (Helsloot, et al., 2012). The drought has long-lasting effects on large regions
(UNISDR, 2009).
In the 21st century, droughts have happened more frequently with the tendency of
higher magnitude due to climate change, and some drought events hit historical records such
as the Millennium Drought in Australia in 2010 and the worst drought year in California,
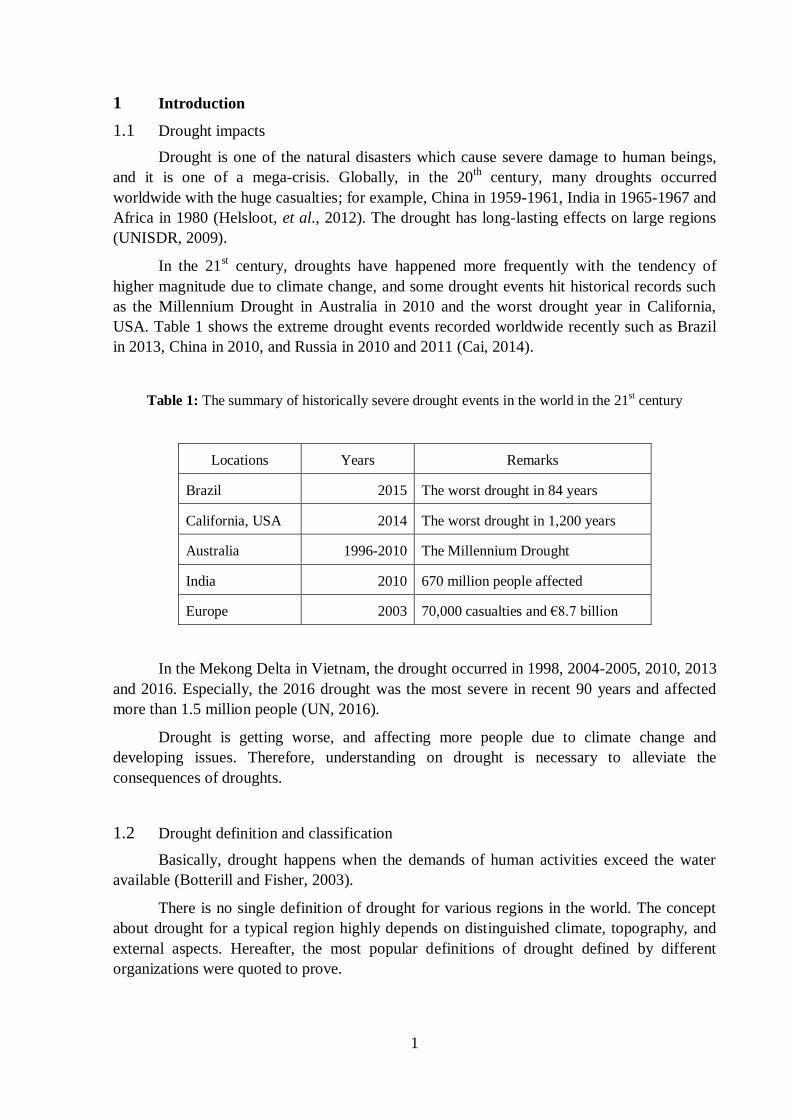
USA. Table 1 shows the extreme drought events recorded worldwide recently such as Brazil
in 2013, China in 2010, and Russia in 2010 and 2011 (Cai, 2014).
Table 1: The summary of historically severe drought events in the world in the 21st century
Locations Years Remarks
Brazil 2015 The worst drought in 84 years
California, USA 2014 The worst drought in 1,200 years
Australia 1996-2010 The Millennium Drought
India 2010 670 million people affected
Europe 2003 70,000 casualties and €8.7 billion
In the Mekong Delta in Vietnam, the drought occurred in 1998, 2004-2005, 2010, 2013
and 2016. Especially, the 2016 drought was the most severe in recent 90 years and affected
more than 1.5 million people (UN, 2016).
Drought is getting worse, and affecting more people due to climate change and
developing issues. Therefore, understanding on drought is necessary to alleviate the
consequences of droughts.
1.2 Drought definition and classification
Basically, drought happens when the demands of human activities exceed the water
available (Botterill and Fisher, 2003).
There is no single definition of drought for various regions in the world. The concept
about drought for a typical region highly depends on distinguished climate, topography, and
external aspects. Hereafter, the most popular definitions of drought defined by different
organizations were quoted to prove.

2
“a sustained, extended deficiency of precipitation” (WMO, 1986)
“the naturally occurring phenomenon that exists when precipitation has been
significantly below normal recorded levels, causing serious hydrological
imbalances that adversely affect land resource production system (UN, 1994),
“the percentage of years when crops fail from the lack of moisture” (FAO,
1993).
To clarify the definition of drought in order to approach drought study, Glantz and
Wilhite (1985) classified the drought by four types that have been accepted and followed by
researchers around the world. These can be summarized below:
Meteorological drought happens when the lack of rainfall in a long period, in
other words, is rainfall deficit. It also combines changes in seasonal pattern,
increased temperature, and evaporation;
Hydrological drought refers to shortages in both surface and groundwater,
including reduction in surface water availability, reservoir drawdown,
groundwater levels;
Agricultural drought is about soil moisture deficit due to meteorological and
hydrological droughts and causes impact upon crop production and livestock;
Socioeconomic drought is associated with an imbalance of water due to the
natural phenomenon. It happens when the water demand exceeds the water
availability.
1.3 Indices and indicators in drought management
Drought management includes drought assessment, drought monitoring and
countermeasures. Among these, drought monitoring is an essential step (Wilhite, 2005; Rossi,
2013). Drought indices are tools to monitor and assess drought timing, severity, and duration
and many types of indices have been introduced already.
Some reviews on drought indicators and indices which have contributed the clear
views on drought monitoring were made by Mishra and Singh (2010) and Heim (2002). It is
noteworthy that the World Meteorology Organization (WMO) published the handbook in
2016 covering 50 popular drought indicators and indices around the world (Svoboda, 2016)
with suggested references. Moreover, indices were grouped, discussed and each analyzed
including advantages and disadvantages. The information mainly extracted from the
handbook of WMO above. The WMO (2016) defined drought indicators and indices:
“Drought indicators are variables as precipitation, temperature, groundwater,
soil moisture, reservoir levels, streamflow, and snowpack used to describe
drought conditions.”
“Drought indices are calculated values to describe the severity and qualitative
state of droughts for a target period utilizing climatic inputs that including the
indicators above. Indices are also technical indicators.”
3
1.3.1 Single index
In the early days, the indices which cooperated with precipitation such as Munger’s
Index were introduced in 1916, followed by Kincer’s Index in 1919, Marcovitch’s Index in
1930, Blumenstock’s Index in 1942, and Antecedent Precipitation Index in 1953 (Jr., 2002).
In recent years, development of technology and improvement of availability observed data
have allowed researchers to develop other indices from variables such as temperature,
evaporation, groundwater level, streamflow, and soil moisture.
a) Meteorological drought indices
Various meteorological drought indices have been introduced and applied to different
regions. However, this part only discusses and introduce the most typical and widely applied
indices. Most of the meteorological drought indices were generated from precipitation, with
some indices involving temperature.
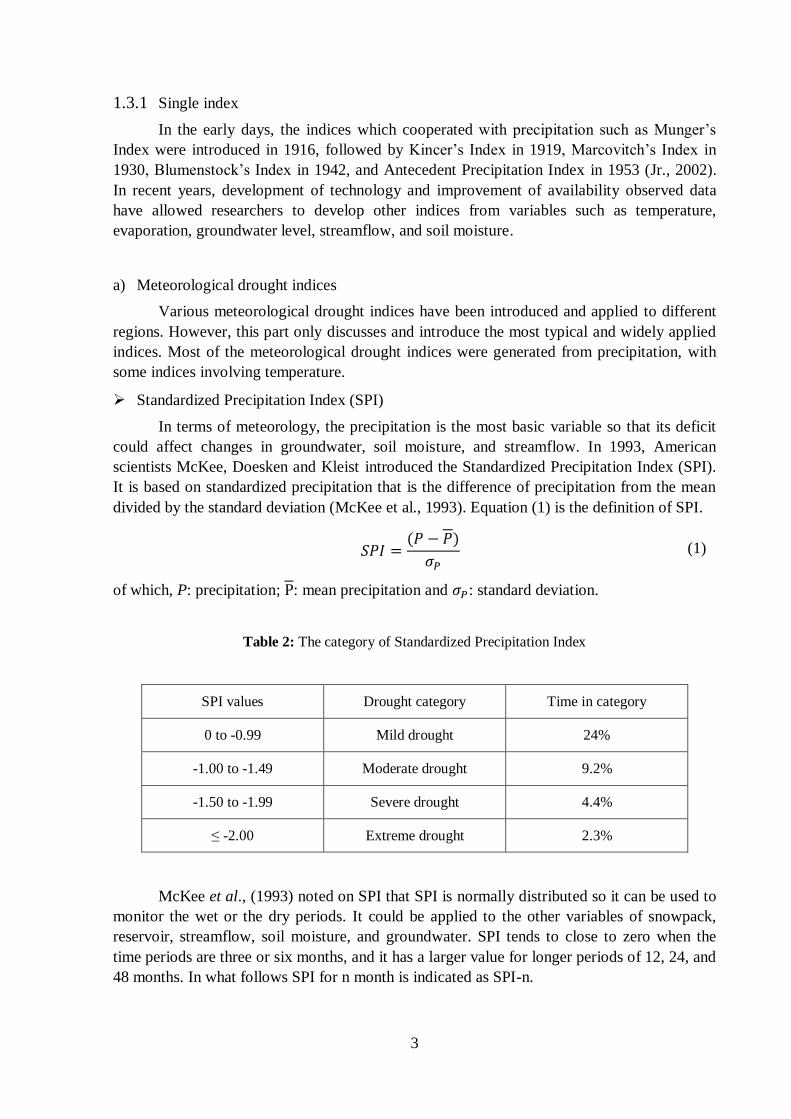
Standardized Precipitation Index (SPI)
In terms of meteorology, the precipitation is the most basic variable so that its deficit
could affect changes in groundwater, soil moisture, and streamflow. In 1993, American
scientists McKee, Doesken and Kleist introduced the Standardized Precipitation Index (SPI).
It is based on standardized precipitation that is the difference of precipitation from the mean
divided by the standard deviation (McKee et al., 1993). Equation (1) is the definition of SPI.
(1)
of which, P: precipitation; : mean precipitation and : standard deviation.
Table 2: The category of Standardized Precipitation Index
SPI values Drought category Time in category
0 to -0.99 Mild drought 24%
-1.00 to -1.49 Moderate drought 9.2%
-1.50 to -1.99 Severe drought 4.4%
≤ -2.00 Extreme drought 2.3%
McKee et al., (1993) noted on SPI that SPI is normally distributed so it can be used to
monitor the wet or the dry periods. It could be applied to the other variables of snowpack,
reservoir, streamflow, soil moisture, and groundwater. SPI tends to close to zero when the
time periods are three or six months, and it has a larger value for longer periods of 12, 24, and
48 months. In what follows SPI for n month is indicated as SPI-n.
4
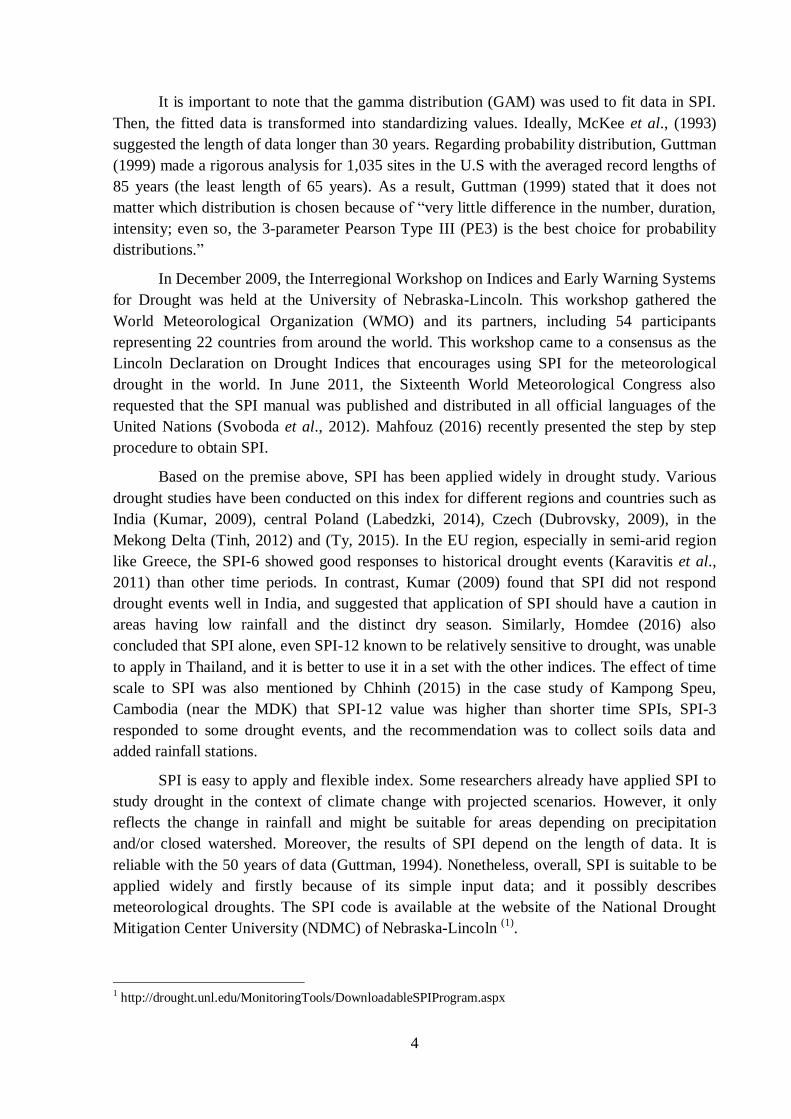
It is important to note that the gamma distribution (GAM) was used to fit data in SPI.
Then, the fitted data is transformed into standardizing values. Ideally, McKee et al., (1993)
suggested the length of data longer than 30 years. Regarding probability distribution, Guttman
(1999) made a rigorous analysis for 1,035 sites in the U.S with the averaged record lengths of
85 years (the least length of 65 years). As a result, Guttman (1999) stated that it does not
matter which distribution is chosen because of “very little difference in the number, duration,
intensity; even so, the 3-parameter Pearson Type III (PE3) is the best choice for probability
distributions.”
In December 2009, the Interregional Workshop on Indices and Early Warning Systems
for Drought was held at the University of Nebraska-Lincoln. This workshop gathered the
World Meteorological Organization (WMO) and its partners, including 54 participants
representing 22 countries from around the world. This workshop came to a consensus as the
Lincoln Declaration on Drought Indices that encourages using SPI for the meteorological
drought in the world. In June 2011, the Sixteenth World Meteorological Congress also
requested that the SPI manual was published and distributed in all official languages of the
United Nations (Svoboda et al., 2012). Mahfouz (2016) recently presented the step by step
procedure to obtain SPI.
Based on the premise above, SPI has been applied widely in drought study. Various
drought studies have been conducted on this index for different regions and countries such as
India (Kumar, 2009), central Poland (Labedzki, 2014), Czech (Dubrovsky, 2009), in the
Mekong Delta (Tinh, 2012) and (Ty, 2015). In the EU region, especially in semi-arid region
like Greece, the SPI-6 showed good responses to historical drought events (Karavitis et al.,
2011) than other time periods. In contrast, Kumar (2009) found that SPI did not respond
drought events well in India, and suggested that application of SPI should have a caution in
areas having low rainfall and the distinct dry season. Similarly, Homdee (2016) also
concluded that SPI alone, even SPI-12 known to be relatively sensitive to drought, was unable
to apply in Thailand, and it is better to use it in a set with the other indices. The effect of time
scale to SPI was also mentioned by Chhinh (2015) in the case study of Kampong Speu,
Cambodia (near the MDK) that SPI-12 value was higher than shorter time SPIs, SPI-3
responded to some drought events, and the recommendation was to collect soils data and
added rainfall stations.
SPI is easy to apply and flexible index. Some researchers already have applied SPI to
study drought in the context of climate change with projected scenarios. However, it only
reflects the change in rainfall and might be suitable for areas depending on precipitation
and/or closed watershed. Moreover, the results of SPI depend on the length of data. It is
reliable with the 50 years of data (Guttman, 1994). Nonetheless, overall, SPI is suitable to be
applied widely and firstly because of its simple input data; and it possibly describes
meteorological droughts. The SPI code is available at the website of the National Drought
Mitigation Center University (NDMC) of Nebraska-Lincoln (1)
.
1 http://drought.unl.edu/MonitoringTools/DownloadableSPIProgram.aspx
5
b) Agricultural drought indices
Palmer Drought Severity Index (PDSI)
Palmer (1965) introduced, described, and applied Palmer Drought Severity Index
(PDSI, and proposed Crop Drought Index (CDI) in (1968) for the drought monitoring in
America. Briefly, CDI is based on the difference between actual evapotranspiration under soil
water deficit (mm) and potential evapotranspiration (PET) under sufficient soil moisture
content (mm). Unfortunately, such indices are difficult to apply in most Asian countries due
to the lack of moisture data.
Standardized Precipitation Evapotranspiration Index (SPEI)
Some indices were employed from the difference between precipitation (P) and
evapotranspiration; for example, Reconnaissance Drought Index (RDI) that was proposed by
Tsakiris and Vengelis (2005). RDI is calculated from a method of dividing potential
evapotranspiration by precipitation (the ratio of P to PET). Similarly, Climatic Water Balance
(CWB) has been used in Poland for meteorological drought monitoring. CWB is also obtained
from the difference between precipitation and evapotranspiration (Labedzki, 2014).
Herein, SPEI that was proposed by Vicente-Serrano (2010) was discussed because it
eliminates the limitation of RDI in the case of PET=0. SPEI was calculated from the
difference between precipitation (P) and potential evapotranspiration (PET). Vicente-Serrano
(2010) explained and examined factor analysis. Another advantage is that SPEI code is freely
available and the calculations procedure is also described in the literature (2)
.
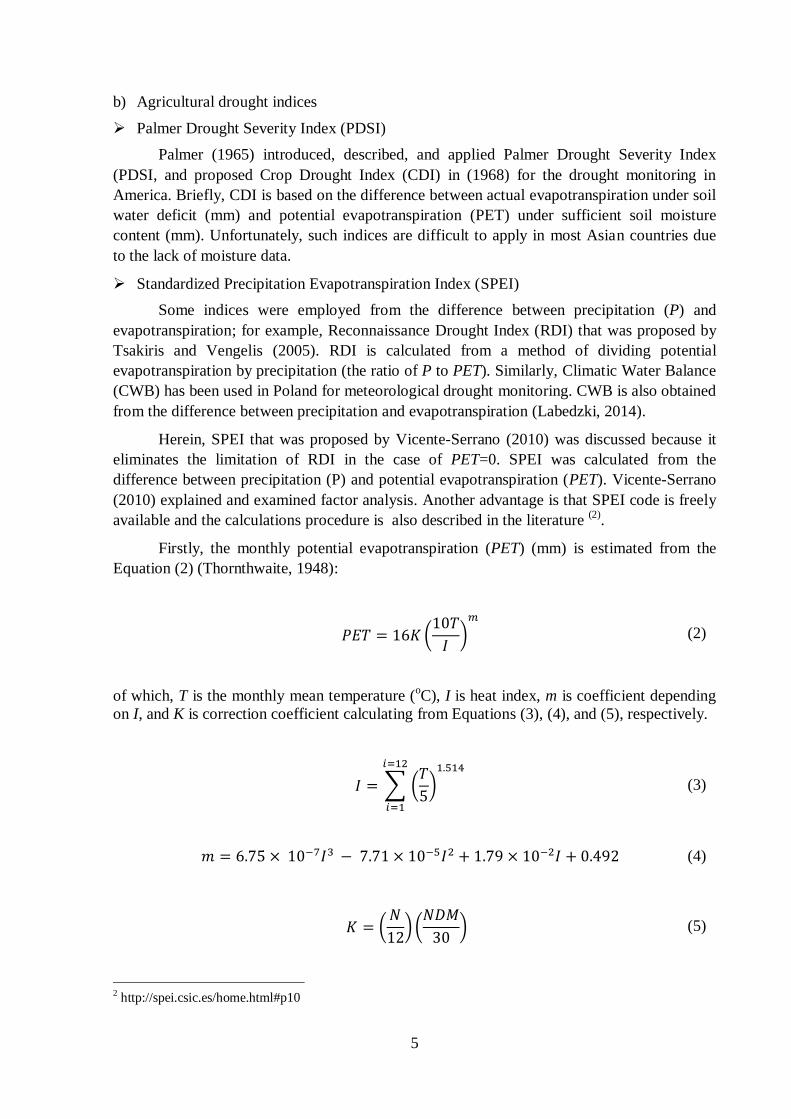
Firstly, the monthly potential evapotranspiration (PET) (mm) is estimated from the
Equation (2) (Thornthwaite, 1948):
(2)
of which, T is the monthly mean temperature (oC), I is heat index, m is coefficient depending
on I, and K is correction coefficient calculating from Equations (3), (4), and (5), respectively.
(3)
(4)
(5)
2 http://spei.csic.es/home.html#p10
6
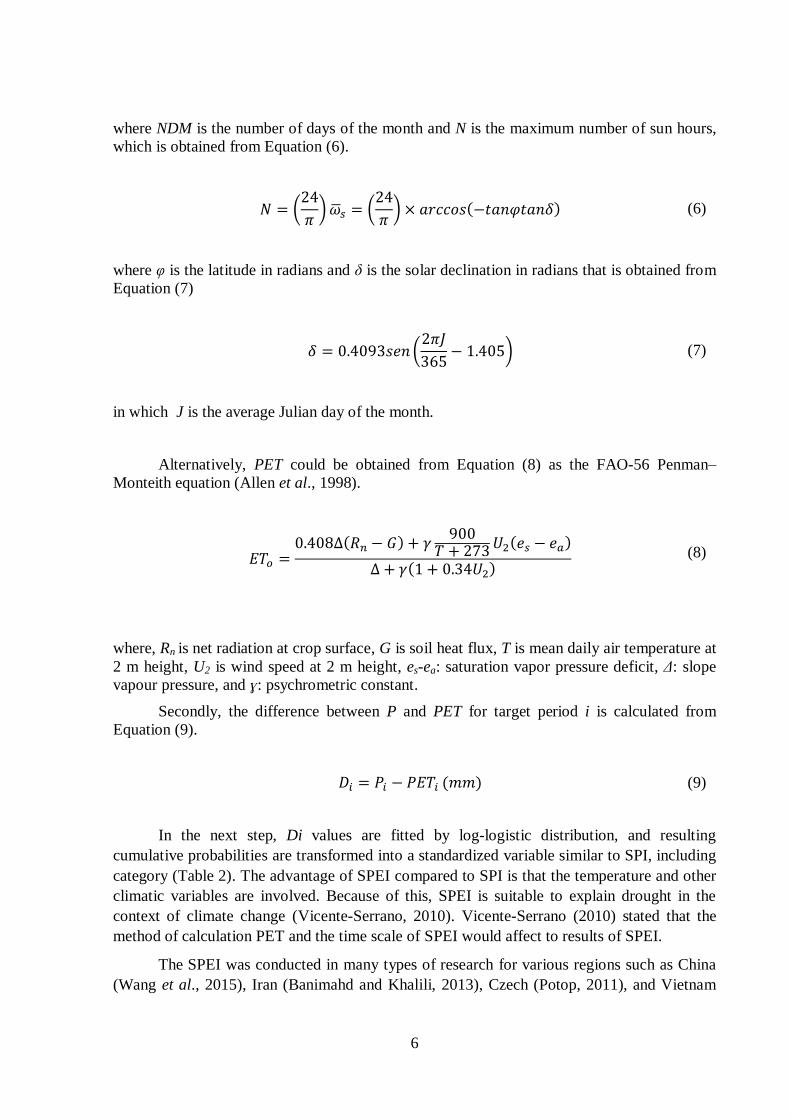
where NDM is the number of days of the month and N is the maximum number of sun hours,
which is obtained from Equation (6).
(6)
where φ is the latitude in radians and δ is the solar declination in radians that is obtained from
Equation (7)
(7)
in which J is the average Julian day of the month.
Alternatively, PET could be obtained from Equation (8) as the FAO-56 Penman–
Monteith equation (Allen et al., 1998).
(8)
where, Rn is net radiation at crop surface, G is soil heat flux, T is mean daily air temperature at
2 m height, U2 is wind speed at 2 m height, es-ea: saturation vapor pressure deficit, Δ: slope
vapour pressure, and ɣ: psychrometric constant.
Secondly, the difference between P and PET for target period i is calculated from
Equation (9).
(9)
In the next step, Di values are fitted by log-logistic distribution, and resulting
cumulative probabilities are transformed into a standardized variable similar to SPI, including
category (Table 2). The advantage of SPEI compared to SPI is that the temperature and other
climatic variables are involved. Because of this, SPEI is suitable to explain drought in the
context of climate change (Vicente-Serrano, 2010). Vicente-Serrano (2010) stated that the
method of calculation PET and the time scale of SPEI would affect to results of SPEI.
The SPEI was conducted in many types of research for various regions such as China
(Wang et al., 2015), Iran (Banimahd and Khalili, 2013), Czech (Potop, 2011), and Vietnam
7
(Nguyen, 2015). Wang et al., (2015) concluded that SPEI-3 and SPEI-6 are accurate indices
in drought assessment for the Luanhe River Basin, China, and the limitation of SPEI might be
the use of the Thornthwaite to calculate evaporation. In a similar manner, Banimahd and
Khalili (2013) pointed out that SPEI-3 and SPEI-6 detected droughts well in Iran. In contrast,
Nguyen (2015) stated that SPEI only responded to droughts for the wet periods in the central
Vietnam.
In general, SPEI is a good index involving more climatic variables than SPI.
Therefore, it is suggested to use SPEI in the context of global warming studies.
c) Hydrological drought indices
For hydrological drought, indices have been used and generated from streamflow,
groundwater level, and reservoir storage data. For example, Van (2015) fully described the
concept of hydrological drought in the recent research that introduced main indices.
Regarding streamflow index, various approaches have been introduced such as low
flow, the Streamflow Drought Index (Nabaltis and Tsakiris, 2009), the Standardized Runoff
Index (Shukla and Wood, 2008), the Standardized Streamflow Index (Serrano et al., 2012),
the daily flow duration curve (exceedance probability) and mean annual flow (Sharma, 2008).
These indices employ similarly standard deviation.
Cautiously, it is needed to check the consistency of the streamflow data. This situation
likely happens in the case of major changes in water use, the method of collecting data, and
store (USGS, 1996).
Streamflow Drought Index (SDI)
Nalbantis and Tsakiris (2009) proposed Streamflow Drought Index (SDI) based on Equation
(10) for the drought monitoring.
(10)
of which, is the cumulative streamflow of referenced period k of the i-hydrological year,
and are respectively the mean and the standard deviation of .
One further, Yeh (2015) and Nalbantis (2008) suggested Equations (11) and (12), and
the use of natural logarithms of the streamflow, for the estimation of SDI in small basins.
(11)
(12)
8
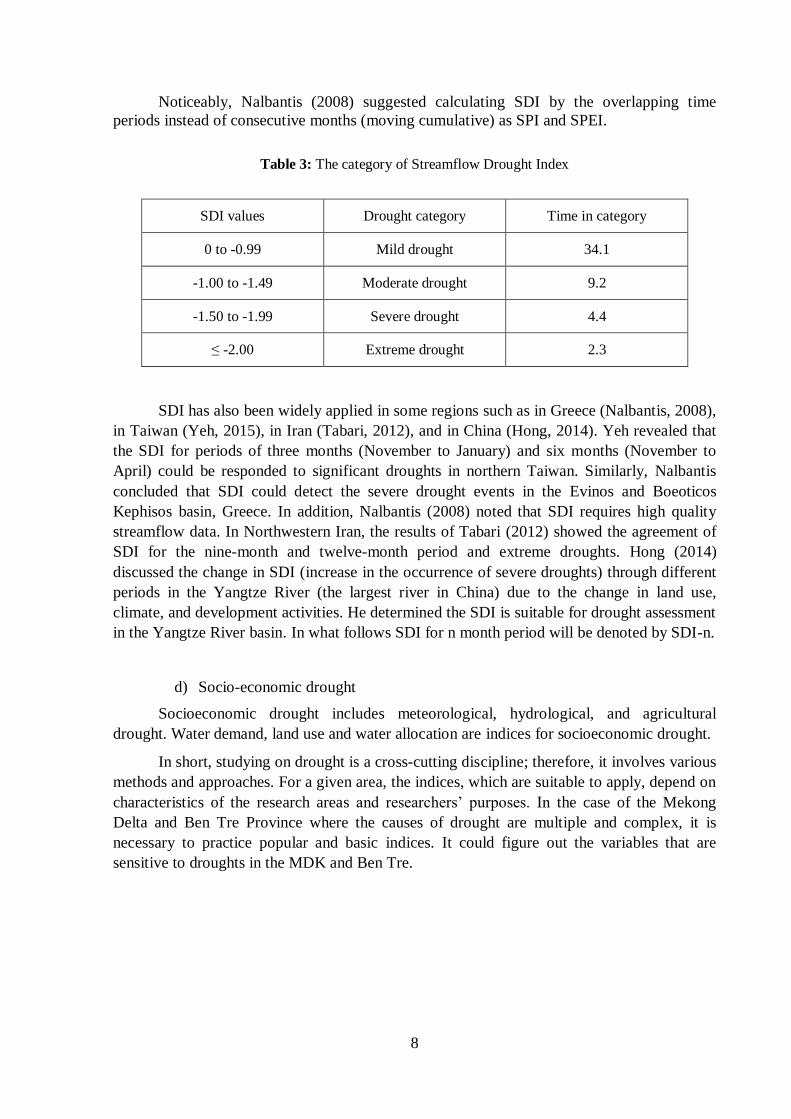
Noticeably, Nalbantis (2008) suggested calculating SDI by the overlapping time
periods instead of consecutive months (moving cumulative) as SPI and SPEI.
Table 3: The category of Streamflow Drought Index
SDI values Drought category Time in category
0 to -0.99 Mild drought 34.1
-1.00 to -1.49 Moderate drought 9.2
-1.50 to -1.99 Severe drought 4.4
≤ -2.00 Extreme drought 2.3
SDI has also been widely applied in some regions such as in Greece (Nalbantis, 2008),
in Taiwan (Yeh, 2015), in Iran (Tabari, 2012), and in China (Hong, 2014). Yeh revealed that
the SDI for periods of three months (November to January) and six months (November to
April) could be responded to significant droughts in northern Taiwan. Similarly, Nalbantis
concluded that SDI could detect the severe drought events in the Evinos and Boeoticos
Kephisos basin, Greece. In addition, Nalbantis (2008) noted that SDI requires high quality
streamflow data. In Northwestern Iran, the results of Tabari (2012) showed the agreement of
SDI for the nine-month and twelve-month period and extreme droughts. Hong (2014)
discussed the change in SDI (increase in the occurrence of severe droughts) through different
periods in the Yangtze River (the largest river in China) due to the change in land use,
climate, and development activities. He determined the SDI is suitable for drought assessment
in the Yangtze River basin. In what follows SDI for n month period will be denoted by SDI-n.
d) Socio-economic drought
Socioeconomic drought includes meteorological, hydrological, and agricultural
drought. Water demand, land use and water allocation are indices for socioeconomic drought.
In short, studying on drought is a cross-cutting discipline; therefore, it involves various
methods and approaches. For a given area, the indices, which are suitable to apply, depend on
characteristics of the research areas and researchers’ purposes. In the case of the Mekong
Delta and Ben Tre Province where the causes of drought are multiple and complex, it is
necessary to practice popular and basic indices. It could figure out the variables that are
sensitive to droughts in the MDK and Ben Tre.
9
1.3.2 Multi-indicators
Drought is complex; therefore, a single index may not be able to reflect it. For this
reason, many researchers have attempted to find out better approaches for solving it. As a
result, multi-indicators and/or integrated drought index have been developed worldwide.
Steinemann (2006) fully explained available approaches to obtain multiple indicators.
Some popular methods have been used to obtain a desired multi-indicator is weighted factor
analysis (Balint et al., 2013), principal components analysis (PCA) (Zoljoodi, 2013; Nguyen,
2015) and regression analysis.
Regarding PCA, Nguyen (2015) examined the Integrated Drought Index (IDI) based
on three indices calculated. This index employed three indices of Standard Precipitation Index
(SPI), Standardized Precipitation Evapotranspiration Index (SPEI), and Standardized Soil
Moisture Index (SSI). Equations (13), (14) and (15) define IDI.
(13)
(14)
(15)
of which, SPI, SPEI and SSI corresponded to , respectively; are the values
of the first and second main components; c, d, e and f, g, h are contribution rates.
Then, Equation (16) shows the function to obtain Standardized IDI.
(16)
The determination of IDI is based on the principal components analysis (PCA)
introduced by Pearson (1901) and developed by Hotelling (1933). This method was quite
good in grouping indices to obtain a better hybrid indicator.
1.3.3 The current situation of drought indices in the Mekong River region
The process of drought in the Lower Mekong Basin (Thailand, Laos, and Cambodia) is
similar to the other regions as it occurs when the deficiency of rainfall takes place (GIZ, 2013).
On the contrary, the process of drought in the Mekong Delta is more complicated due to the
domination of salinity intrusion. It mostly occurs in the dry season from January to June. It
starts with the low level of rain in the upstream (Laos and Cambodia) causing the reduction in
the water volume flowing into the MKD via Tan Chau and Chau Doc at the end of the flood
season (November to December) and/or the dry period (January to April). At the same time,
10
the low water level in the downstream also happens in combination with no rain causing
droughts in the MKD. The drought induces the saline intrusion further inland and then salinity
intrusion inverts its role to exacerbate the drought situation. This clarification is the most
important point to analyze and select the drought indices forwards.
In the Mekong Basin, Terink et al. (2011) estimated SPI, NDVI and streamflow and it
is one of the rare researches on drought in the Mekong Basin. In this research, the authors also
pointed out that the lack of data has imposed a challenge on drought studies in the Mekong
Basin. Because of this, this study only used the 11 years data instead of 30 years or 50 years
which were recommended by McKee et al., (1993) and Guttman (1999). Additionally, MRC
(2005) recommended applying streamflow for the drought study in the Mekong River Basin.
Yet, in both cases, there was no examination of the MKD.
In the MDK, there were estimations of the meteorological drought by calculating SPI
(Tinh, 2012; Ty et al., 2015). Results from these studies showed the high frequency of
drought in the Mekong Delta. SPI could not describe drought well, with the reason being that
the most agricultural areas are irrigated agriculture while the SPI is more suitable for the
rainfed agriculture areas. However, it should be remembered that some areas highly depend
on rainfall for domestic use, including three coastal districts of Ben Tre. These areas are far
from fresh water sources and lack of groundwater so that rainfall harvesting has played a
crucial role in the dry season for domestic use.
Officially, the Decree No. 44/2014/QĐ-TTg issued on 15/8/2014 is the main document
related to the classification of drought in Vietnam. In this document, deficiency of the
monthly rainfall for periods of three and six months is the main indicator for drought
monitoring. The other indicator is the water availability but it is unclear. Furthermore, it
mentioned that saline intrusion is an aspect needed to consider for drought monitoring.
The review given above is the basis for the selection of indices calculated in this study.
Additional consideration includes the fact that SPI, SDI and SPEI represent different types of
the drought and obtained in the same manner based on standard deviation. Ideally, they
should be evaluated separately, compared, and combined into a hybrid indicator for drought
monitoring in Ben Tre. It is essential to point out that these indices obtained from the monthly
input data that could turn to be a disadvantage. This is because drought could occur in the
short period or/and in the middle of two consecutive months.
1.4 The purposes of study
The purpose of this study is to gain more knowledge in drought study in order to
suggest an appropriate method for drought management and measures to alleviate drought
consequences in the Mekong Delta in Vietnam. Through a literature review on drought study,
river basin characteristic analysis, and data collection this study aims at the following two
specifics purposes:
To seek the suitable index and/or indicators for ensuring timely and accurate
assessment of the impacts of drought;
To define an inventory of data for Drought Management.
11
2 Study area
2.1 The Mekong River Basin and Mekong Delta
The Mekong River originates in Tibetan Plateau, China and runs through six countries
with the total length of 4,800 km via the Mekong Delta, Vietnam before ending at the East
Sea. The total area of the basin is about 795,000 km2 and is divided into two parts of Upper
Mekong Basin (China, Myanmar) and Lower Mekong Basin (LMB) including Laos,
Thailand, Cambodia, and Vietnam (MRC, 2009). The character of the Mekong River is that
the flood discharge is 30 times higher than that in the dry season.
The Mekong River Committee (MRC) classified Lower Mekong Basin into 10 sub-
areas, and the Mekong River Delta, the final part, spreads over 5.850 million ha including
2.334 million ha of Cambodia and 3.515 million ha of Vietnamese part (MRC, 2011).
In the Vietnamese administrative system, the Mekong Delta is located in the southern
Vietnam within the total area of 3.9 million ha and its population is about 17.5 million. It has
a naturally suitable condition for agricultural cultivation with 1.9 ha of agricultural land; it has
contributed up to 50% of paddy production, and 70% of aquacultural production (SIWRP,
2011). For these reasons, the Mekong Delta plays an important role in the agricultural sector
and food security of the Vietnam. In addition, it has a distinguished ecosystem of mangrove
forests and wetlands.
The Mekong Delta is predicted to be one of the most vulnerable areas to climate
change and sea-level rise in the world (IPCC, 2007). One of the reason is that it has a low
terrain with nearly 600 km of the seashore and its main source income comes from
agricultural activities. Specifically, in the climate change and sea level rise scenarios carried
out by Ministry of Natural Resource and Environment (MONRE) stated that 40-50% of the
Mekong Delta would be affected by sea water with saline concentration ≥ 4 parts per
thousand (ppt) and inundation when sea level rise by 12 cm and 30 cm in 2020 and in 2030
respectively (MONRE, 2009).
Ben Tre is a typical case of the Mekong Delta with its large portion of land use used
for agricultural activities (80%). Ben Tre is the most vulnerable to climate change and sea
level rise among thirteen provinces in the MKD (JICA, 2013). Recently, it has faced water
shortage and salinity intrusion more frequently and severely. Historically, the Mekong Delta
and Ben Tre Province recorded droughts in 1998, 2004-2005, 2010, 2013, and especially in
2016 when the worst drought event in 90 years occurred. The information about drought in
the MKD before 1998 is limited. Some drought events occurred in 1981, 1983, 1984, 1985,
1987, 1992, 1994 and 1998 during summer from April to June (ADPC, 2007). However, it is
difficult to find the information related to the statistical damages.
12
To date, Ben Tre has received efforts from various projects and studies in order to deal
with climate change and sea-level rise and water management issues. However, drought is
only recommend for further study. There are various reasons for the difficulty in studying
drought in the Mekong Delta and Ben Tre, and the complexly hydrological regime is one of
the reasons.
In the short term, the embankments and sluice gates that are under construction could
control saline intrusion. Nevertheless, the water shortage in the prolonged dry season is the
main challenge. There seems to be a consensus that drought will happen in the Mekong Delta
more frequently and severely due to climate change and development activities.
2.2 Ben Tre Province
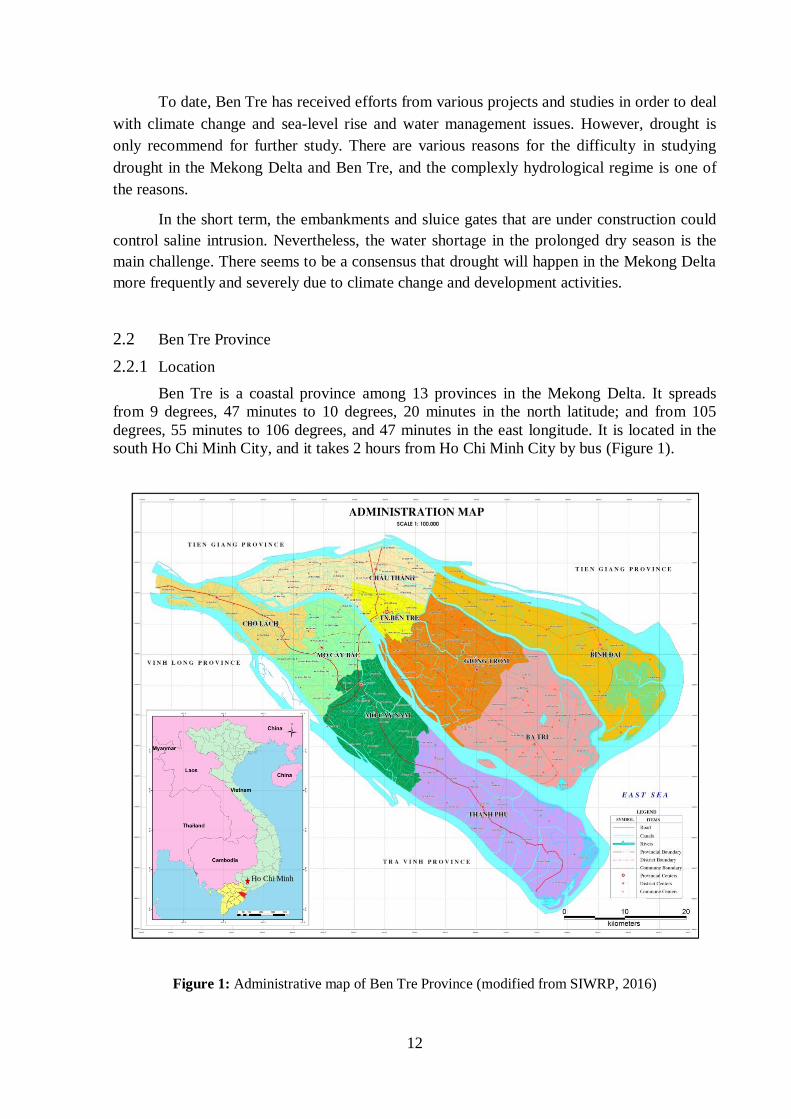
2.2.1 Location
Ben Tre is a coastal province among 13 provinces in the Mekong Delta. It spreads
from 9 degrees, 47 minutes to 10 degrees, 20 minutes in the north latitude; and from 105
degrees, 55 minutes to 106 degrees, and 47 minutes in the east longitude. It is located in the
south Ho Chi Minh City, and it takes 2 hours from Ho Chi Minh City by bus (Figure 1).
Figure 1: Administrative map of Ben Tre Province (modified from SIWRP, 2016)
Ho Chi Minh
13
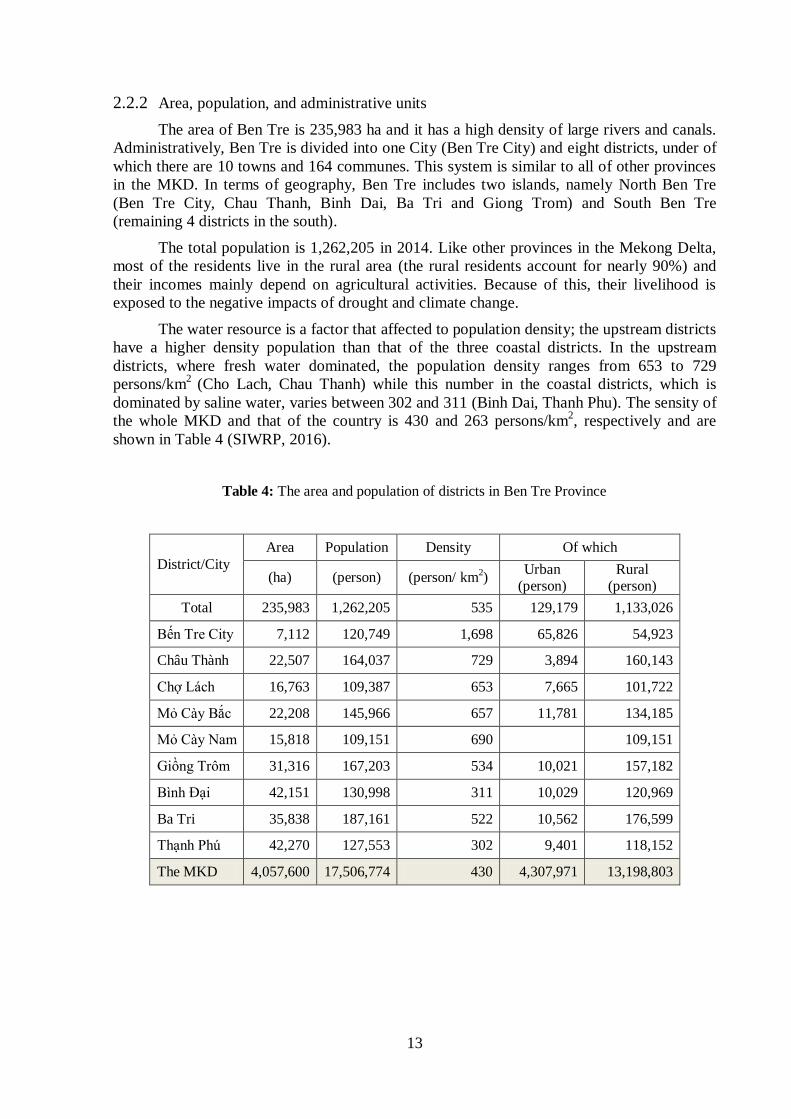
2.2.2 Area, population, and administrative units
The area of Ben Tre is 235,983 ha and it has a high density of large rivers and canals.
Administratively, Ben Tre is divided into one City (Ben Tre City) and eight districts, under of
which there are 10 towns and 164 communes. This system is similar to all of other provinces
in the MKD. In terms of geography, Ben Tre includes two islands, namely North Ben Tre
(Ben Tre City, Chau Thanh, Binh Dai, Ba Tri and Giong Trom) and South Ben Tre
(remaining 4 districts in the south).
The total population is 1,262,205 in 2014. Like other provinces in the Mekong Delta,
most of the residents live in the rural area (the rural residents account for nearly 90%) and
their incomes mainly depend on agricultural activities. Because of this, their livelihood is
exposed to the negative impacts of drought and climate change.
The water resource is a factor that affected to population density; the upstream districts
have a higher density population than that of the three coastal districts. In the upstream
districts, where fresh water dominated, the population density ranges from 653 to 729
persons/km2
(Cho Lach, Chau Thanh) while this number in the coastal districts, which is
dominated by saline water, varies between 302 and 311 (Binh Dai, Thanh Phu). The sensity of
the whole MKD and that of the country is 430 and 263 persons/km2, respectively and are
shown in Table 4 (SIWRP, 2016).
Table 4: The area and population of districts in Ben Tre Province
District/City Area Population Density Of which
(ha) (person) (person/ km2)
Urban (person)
Rural (person)
Total 235,983 1,262,205 535 129,179 1,133,026
Bến Tre City 7,112 120,749 1,698 65,826 54,923
Châu Thành 22,507 164,037 729 3,894 160,143
Chợ Lách 16,763 109,387 653 7,665 101,722
Mỏ Cày Bắc 22,208 145,966 657 11,781 134,185
Mỏ Cày Nam 15,818 109,151 690 109,151
Giồng Trôm 31,316 167,203 534 10,021 157,182
Bình Đại 42,151 130,998 311 10,029 120,969
Ba Tri 35,838 187,161 522 10,562 176,599
Thạnh Phú 42,270 127,553 302 9,401 118,152
The MKD 4,057,600 17,506,774 430 4,307,971 13,198,803
14
2.3 Natural conditions
2.3.1 Climate
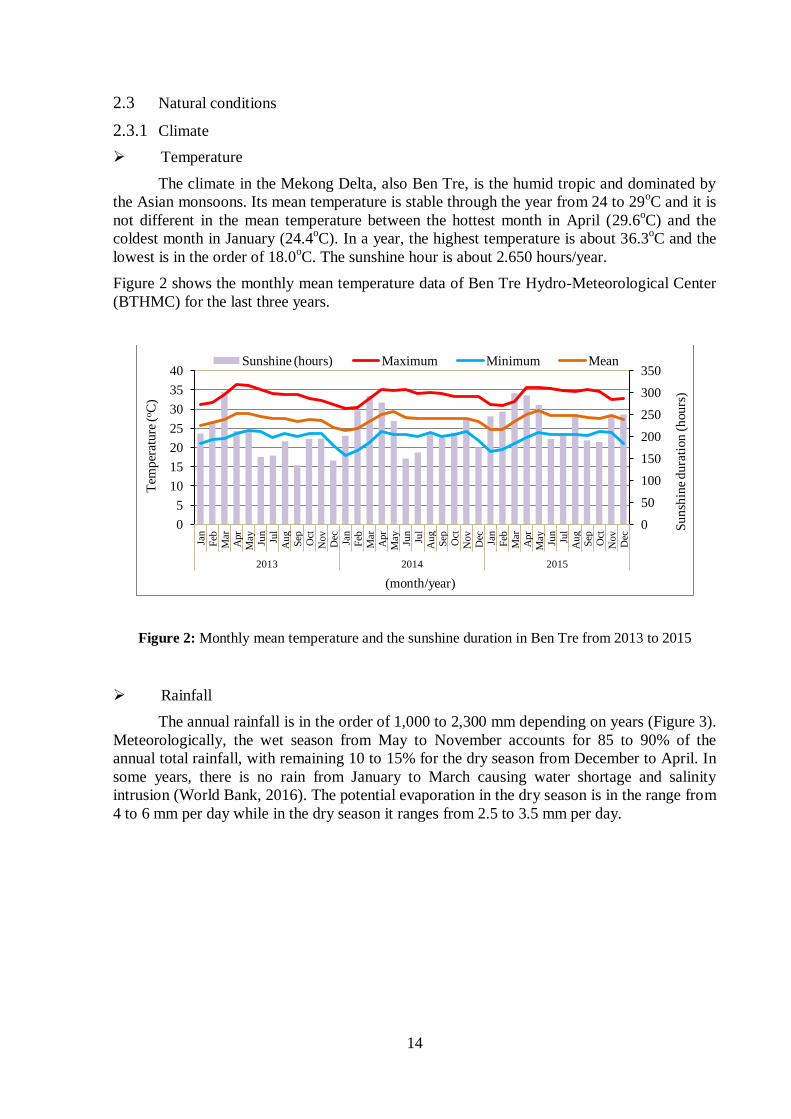
Temperature
The climate in the Mekong Delta, also Ben Tre, is the humid tropic and dominated by
the Asian monsoons. Its mean temperature is stable through the year from 24 to 29oC and it is
not different in the mean temperature between the hottest month in April (29.6oC) and the
coldest month in January (24.4oC). In a year, the highest temperature is about 36.3
oC and the
lowest is in the order of 18.0oC. The sunshine hour is about 2.650 hours/year.
Figure 2 shows the monthly mean temperature data of Ben Tre Hydro-Meteorological Center
(BTHMC) for the last three years.
Figure 2: Monthly mean temperature and the sunshine duration in Ben Tre from 2013 to 2015
Rainfall
The annual rainfall is in the order of 1,000 to 2,300 mm depending on years (Figure 3).
Meteorologically, the wet season from May to November accounts for 85 to 90% of the
annual total rainfall, with remaining 10 to 15% for the dry season from December to April. In
some years, there is no rain from January to March causing water shortage and salinity
intrusion (World Bank, 2016). The potential evaporation in the dry season is in the range from
4 to 6 mm per day while in the dry season it ranges from 2.5 to 3.5 mm per day.
0
50
100
150
200
250
300
350
0
5
10
15
20
25
30
35
40
Jan
Feb
Mar
Apr
May
Jun
Jul
Au
g
Sep
Oct
Nov
Dec
Jan
Feb
Mar
Apr
May
Jun
Jul
Au
g
Sep
Oct
Nov
Dec
Jan
Feb
Mar
Apr
May
Jun
Jul
Au
g
Sep
Oct
Nov
Dec
2013 2014 2015
Su
nsh
ine
du
rati
on
(h
ou
rs)
Tem
per
atu
re (
oC
)
(month/year)
Sunshine (hours) Maximum Minimum Mean

15
Figure 3: Annual rainfall in Ben Tre from 1978 to 2015 (Ben Tre Hydro-Meteorological Center)
Humidity
The humidity is relatively high and the monthly average ranges from 76 to 86%.
Figure 4 illustrates the monthly data from 2012 to 2014 measured at BTHMC. It also changes
seasonally. In the rainy season, humidity is higher than in the dry season by about 15%.
Figure 4: Humidity data in Ben Tre from 2012 to 2014
0
500
1,000
1,500
2,000
2,500
1978
1979
1980
1981
1982
1983
1984
1985
1986
1987
1988
1989
1990
1991
1992
1993
1994
1995
1996
1997
1998
1999
2000
2001
2002
2003
2004
2005
2006
2007
2008
2009
2010
2011
2012
2013
2014
2015
Rai
nfa
ll (
mm
/yea
r)
year
Rainy season Dry season
0 10 20 30 40 50 60 70 80 90
100
Jan
Feb
Mar
Apr
May
Jun
Jul
Au
g
Sep
Oct
Nov
Dec
Jan
Feb
Mar
Apr
May
Jun
Jul
Au
g
Sep
Oct
Nov
Dec
Jan
Feb
Mar
Apr
May
Jun
Jul
Au
g
Sep
Oct
Nov
Dec
2012 2013 2014
Mon
th ly
hu
mid
ity
(%
)
(month/year)
Mean humidity Minimum humidity
16
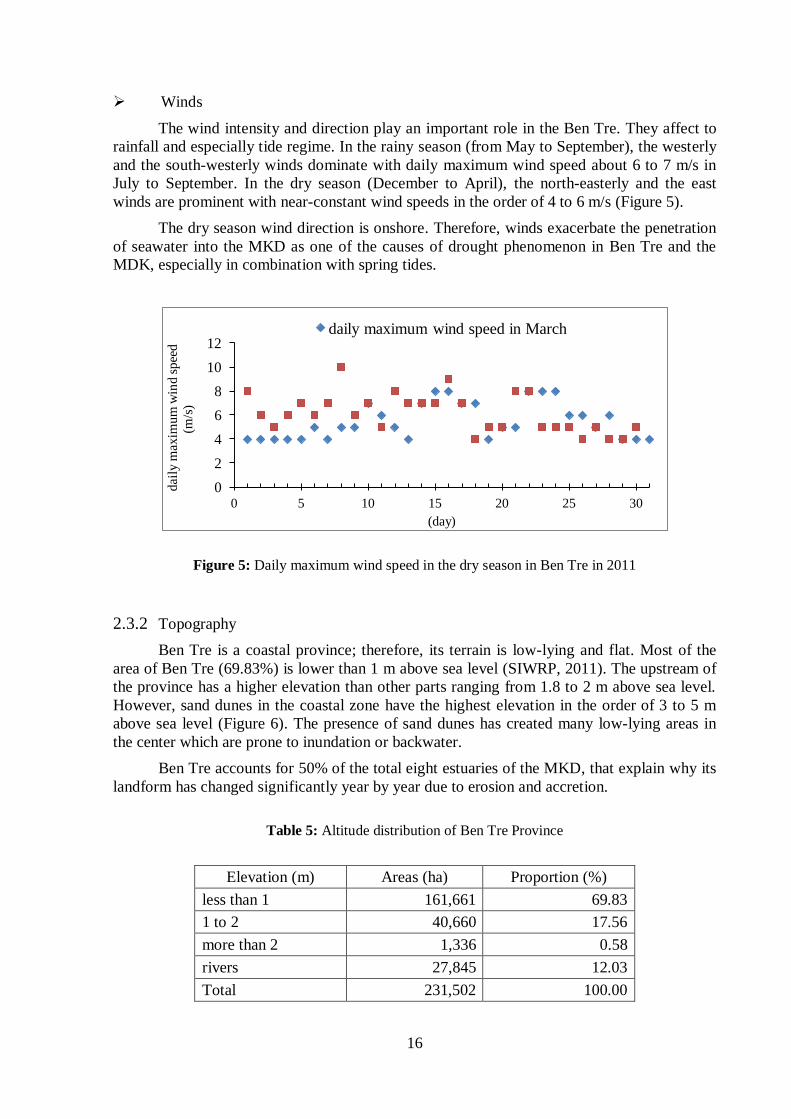
Winds
The wind intensity and direction play an important role in the Ben Tre. They affect to
rainfall and especially tide regime. In the rainy season (from May to September), the westerly
and the south-westerly winds dominate with daily maximum wind speed about 6 to 7 m/s in
July to September. In the dry season (December to April), the north-easterly and the east
winds are prominent with near-constant wind speeds in the order of 4 to 6 m/s (Figure 5).
The dry season wind direction is onshore. Therefore, winds exacerbate the penetration
of seawater into the MKD as one of the causes of drought phenomenon in Ben Tre and the
MDK, especially in combination with spring tides.
Figure 5: Daily maximum wind speed in the dry season in Ben Tre in 2011
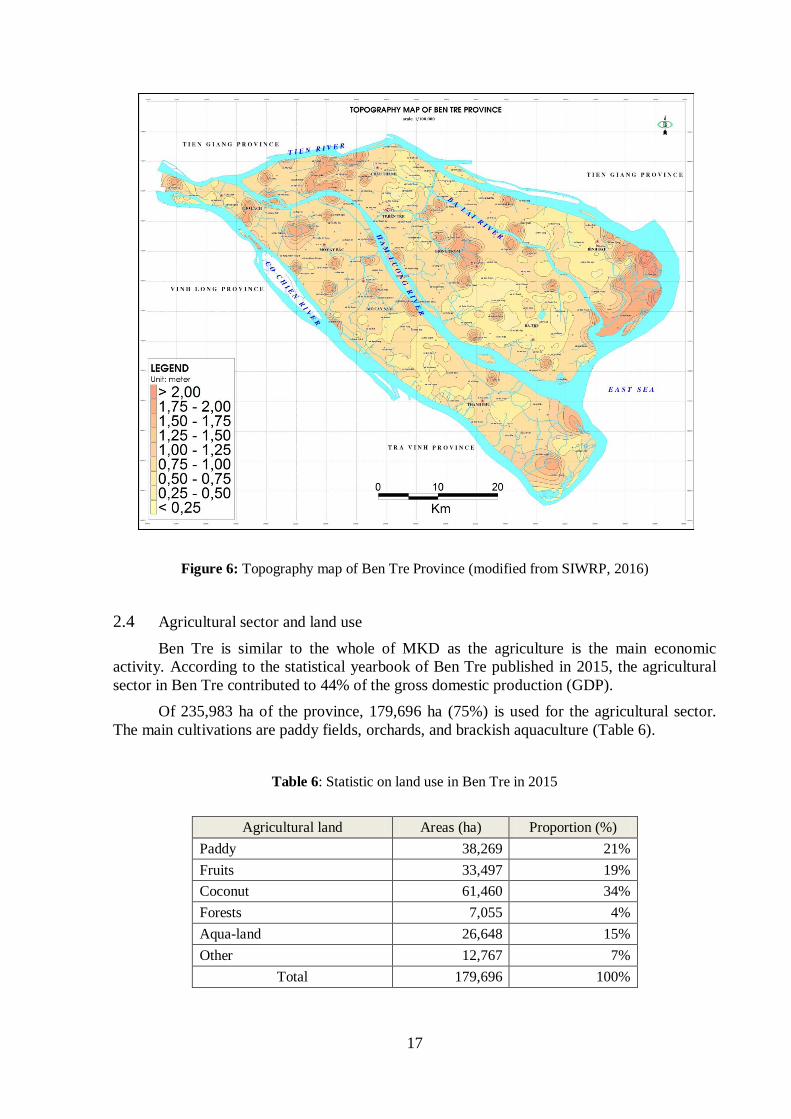
2.3.2 Topography
Ben Tre is a coastal province; therefore, its terrain is low-lying and flat. Most of the
area of Ben Tre (69.83%) is lower than 1 m above sea level (SIWRP, 2011). The upstream of
the province has a higher elevation than other parts ranging from 1.8 to 2 m above sea level.
However, sand dunes in the coastal zone have the highest elevation in the order of 3 to 5 m
above sea level (Figure 6). The presence of sand dunes has created many low-lying areas in
the center which are prone to inundation or backwater.
Ben Tre accounts for 50% of the total eight estuaries of the MKD, that explain why its
landform has changed significantly year by year due to erosion and accretion.
Table 5: Altitude distribution of Ben Tre Province
Elevation (m) Areas (ha) Proportion (%)
less than 1 161,661 69.83
1 to 2 40,660 17.56
more than 2 1,336 0.58
rivers 27,845 12.03
Total 231,502 100.00
0
2
4
6
8
10
12
0 5 10 15 20 25 30
dai
ly m
axim
um
win
d s
pee
d
(m/s
)
(day)
daily maximum wind speed in March
17
Figure 6: Topography map of Ben Tre Province (modified from SIWRP, 2016)
2.4 Agricultural sector and land use
Ben Tre is similar to the whole of MKD as the agriculture is the main economic
activity. According to the statistical yearbook of Ben Tre published in 2015, the agricultural
sector in Ben Tre contributed to 44% of the gross domestic production (GDP).
Of 235,983 ha of the province, 179,696 ha (75%) is used for the agricultural sector.
The main cultivations are paddy fields, orchards, and brackish aquaculture (Table 6).
Table 6: Statistic on land use in Ben Tre in 2015
Agricultural land Areas (ha) Proportion (%)
Paddy 38,269 21%
Fruits 33,497 19%
Coconut 61,460 34%
Forests 7,055 4%
Aqua-land 26,648 15%
Other 12,767 7%
Total 179,696 100%
18
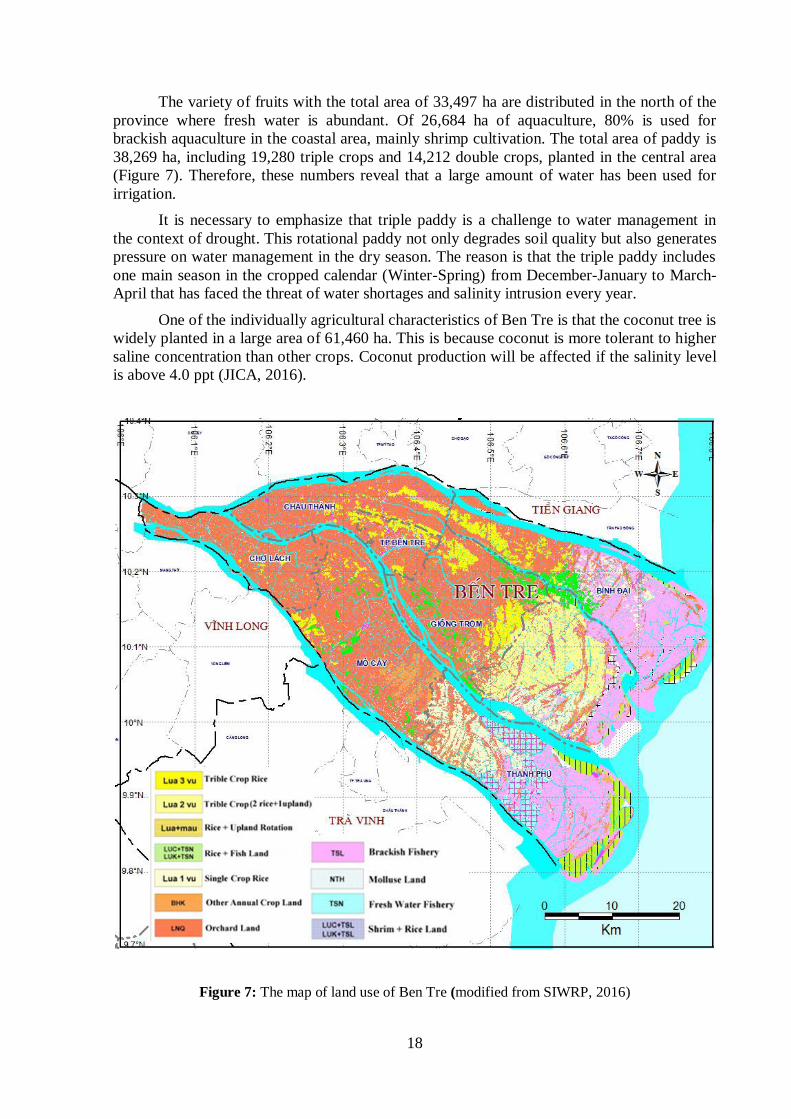
The variety of fruits with the total area of 33,497 ha are distributed in the north of the
province where fresh water is abundant. Of 26,684 ha of aquaculture, 80% is used for
brackish aquaculture in the coastal area, mainly shrimp cultivation. The total area of paddy is
38,269 ha, including 19,280 triple crops and 14,212 double crops, planted in the central area
(Figure 7). Therefore, these numbers reveal that a large amount of water has been used for
irrigation.
It is necessary to emphasize that triple paddy is a challenge to water management in
the context of drought. This rotational paddy not only degrades soil quality but also generates
pressure on water management in the dry season. The reason is that the triple paddy includes
one main season in the cropped calendar (Winter-Spring) from December-January to March-
April that has faced the threat of water shortages and salinity intrusion every year.
One of the individually agricultural characteristics of Ben Tre is that the coconut tree is
widely planted in a large area of 61,460 ha. This is because coconut is more tolerant to higher
saline concentration than other crops. Coconut production will be affected if the salinity level
is above 4.0 ppt (JICA, 2016).
Figure 7: The map of land use of Ben Tre (modified from SIWRP, 2016)
19
2.5 Water use and water management
2.5.1 Water use
Domestic use
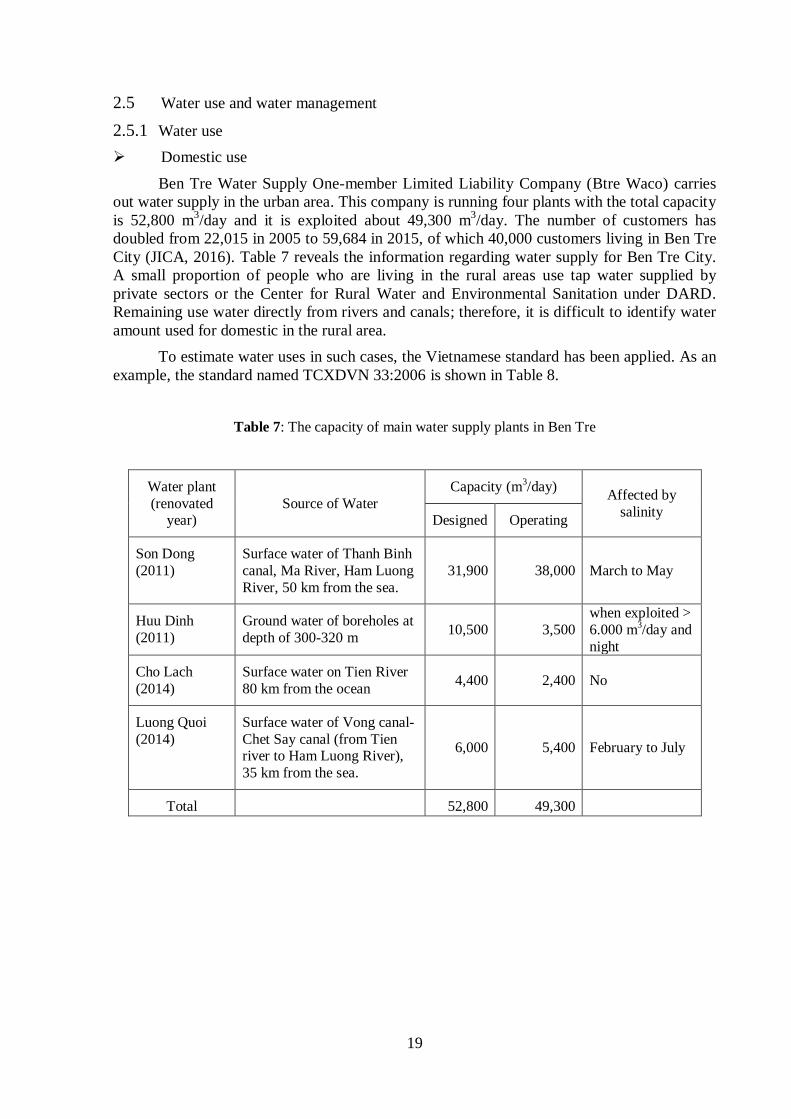
Ben Tre Water Supply One-member Limited Liability Company (Btre Waco) carries
out water supply in the urban area. This company is running four plants with the total capacity
is 52,800 m3/day and it is exploited about 49,300 m
3/day. The number of customers has
doubled from 22,015 in 2005 to 59,684 in 2015, of which 40,000 customers living in Ben Tre
City (JICA, 2016). Table 7 reveals the information regarding water supply for Ben Tre City.
A small proportion of people who are living in the rural areas use tap water supplied by
private sectors or the Center for Rural Water and Environmental Sanitation under DARD.
Remaining use water directly from rivers and canals; therefore, it is difficult to identify water
amount used for domestic in the rural area.
To estimate water uses in such cases, the Vietnamese standard has been applied. As an
example, the standard named TCXDVN 33:2006 is shown in Table 8.
Table 7: The capacity of main water supply plants in Ben Tre
Water plant
(renovated year)
Source of Water Capacity (m3
/day) Affected by
salinity Designed Operating
Son Dong
(2011) Surface water of Thanh Binh
canal, Ma River, Ham Luong
River, 50 km from the sea. 31,900 38,000 March to May
Huu Dinh
(2011) Ground water of boreholes at
depth of 300-320 m 10,500 3,500
when exploited >
6.000 m3/day and
night
Cho Lach
(2014) Surface water on Tien River
80 km from the ocean 4,400 2,400 No
Luong Quoi
(2014) Surface water of Vong canal-
Chet Say canal (from Tien river to Ham Luong River),
35 km from the sea.
6,000 5,400 February to July
Total 52,800 49,300
20
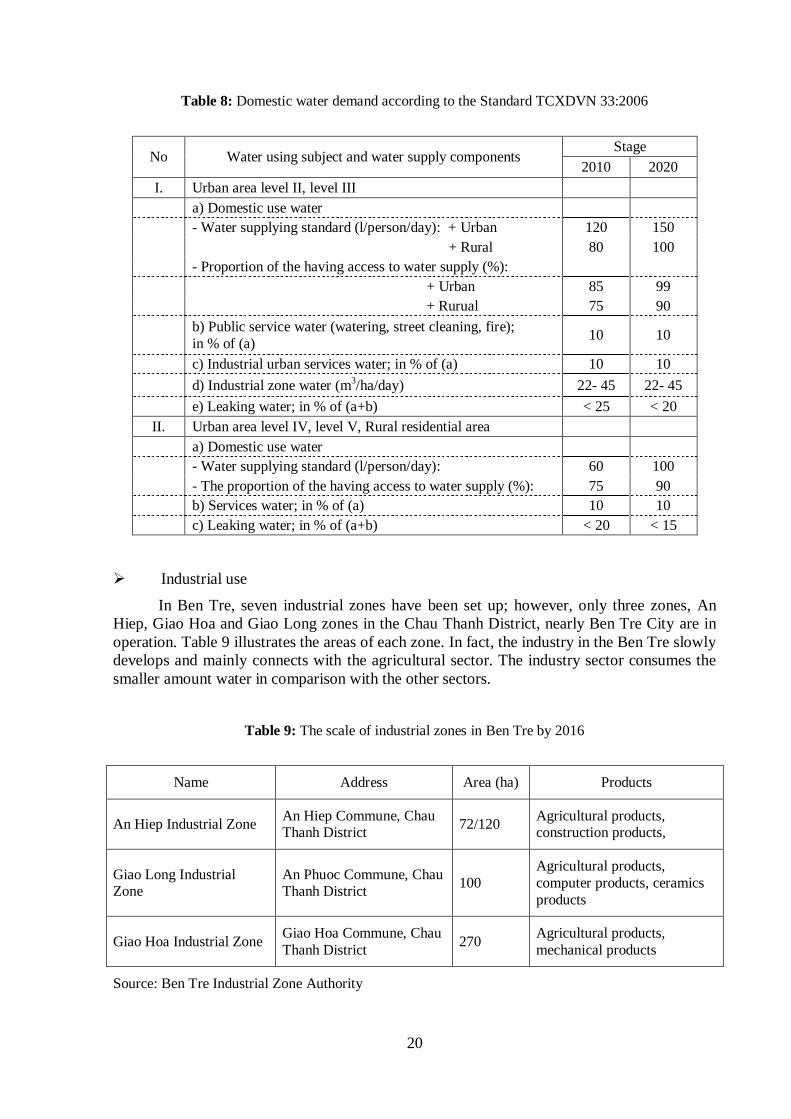
Table 8: Domestic water demand according to the Standard TCXDVN 33:2006
No Water using subject and water supply components Stage
2010 2020
I. Urban area level II, level III
a) Domestic use water
- Water supplying standard (l/person/day): + Urban 120 150
+ Rural 80 100
- Proportion of the having access to water supply (%):
+ Urban 85 99
+ Rurual 75 90
b) Public service water (watering, street cleaning, fire);
in % of (a) 10 10
c) Industrial urban services water; in % of (a) 10 10
d) Industrial zone water (m3/ha/day) 22- 45 22- 45
e) Leaking water; in % of (a+b) < 25 < 20
II. Urban area level IV, level V, Rural residential area
a) Domestic use water
- Water supplying standard (l/person/day): 60 100
- The proportion of the having access to water supply (%): 75 90
b) Services water; in % of (a) 10 10
c) Leaking water; in % of (a+b) < 20 < 15
Industrial use
In Ben Tre, seven industrial zones have been set up; however, only three zones, An
Hiep, Giao Hoa and Giao Long zones in the Chau Thanh District, nearly Ben Tre City are in
operation. Table 9 illustrates the areas of each zone. In fact, the industry in the Ben Tre slowly
develops and mainly connects with the agricultural sector. The industry sector consumes the
smaller amount water in comparison with the other sectors.
Table 9: The scale of industrial zones in Ben Tre by 2016
Name Address Area (ha) Products
An Hiep Industrial Zone An Hiep Commune, Chau Thanh District
72/120 Agricultural products, construction products,
Giao Long Industrial Zone
An Phuoc Commune, Chau Thanh District
100 Agricultural products,
computer products, ceramics
products
Giao Hoa Industrial Zone Giao Hoa Commune, Chau
Thanh District 270
Agricultural products,
mechanical products
Source: Ben Tre Industrial Zone Authority
21
In An Hiep Industrial Zone includes nine companies using 47,000 m3/day in total.
There are still vacant lots in this zone and the areas used are 72 of the 120 ha total area.
The Giao Long Industrial Zone has 22 companies that using more than 103,000 m3/
day in total (JICA, 2016). Giao Long zone does not have data so its water use could be
estimated by means of the standard in Table 3.2. However, the number used from statistics
above is 8 to 14 times higher than the standard.
Agricultural use
In the MDK and Ben Tre, there is no data on the amount of water used by the
agricultural sector, including irrigation for paddy fields, orchards, livestock, and fresh
aquaculture. The main reason is that water is free to all the people excluding tap water.
Farmers who use surface water directly from rivers, canals and groundwater are not being
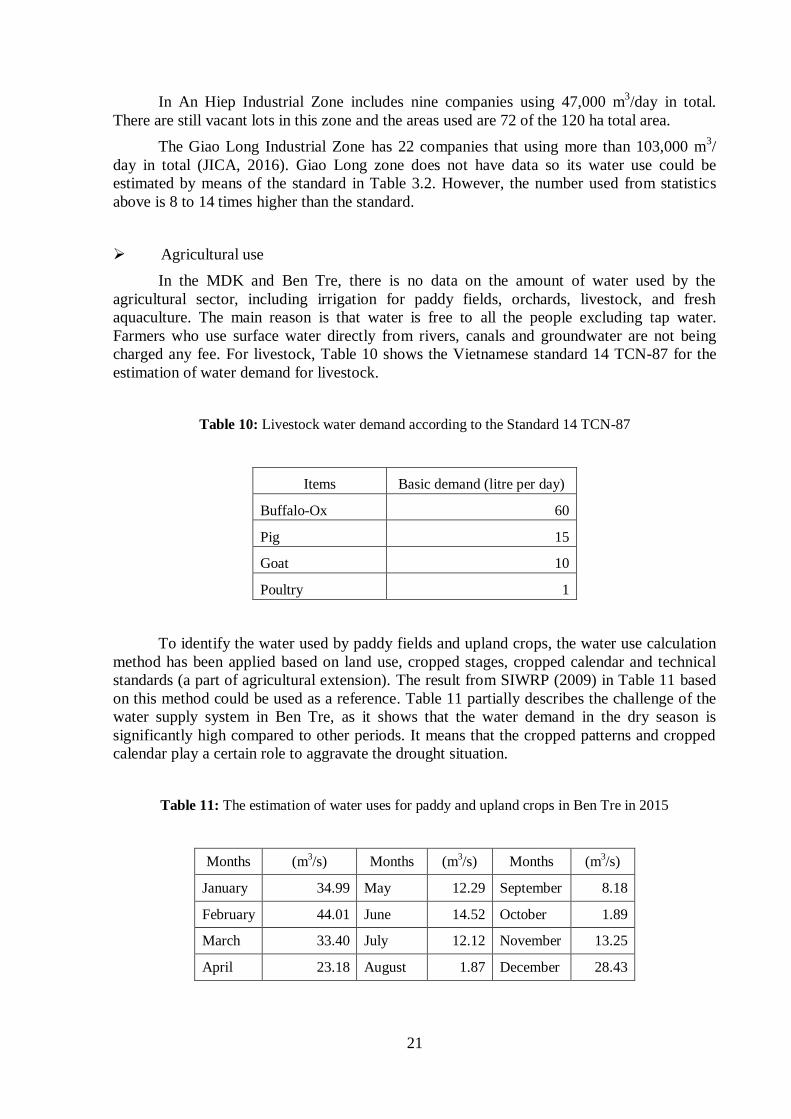
charged any fee. For livestock, Table 10 shows the Vietnamese standard 14 TCN-87 for the
estimation of water demand for livestock.
Table 10: Livestock water demand according to the Standard 14 TCN-87
Items Basic demand (litre per day)
Buffalo-Ox 60
Pig 15
Goat 10
Poultry 1
To identify the water used by paddy fields and upland crops, the water use calculation
method has been applied based on land use, cropped stages, cropped calendar and technical
standards (a part of agricultural extension). The result from SIWRP (2009) in Table 11 based
on this method could be used as a reference. Table 11 partially describes the challenge of the
water supply system in Ben Tre, as it shows that the water demand in the dry season is
significantly high compared to other periods. It means that the cropped patterns and cropped
calendar play a certain role to aggravate the drought situation.
Table 11: The estimation of water uses for paddy and upland crops in Ben Tre in 2015
Months (m3/s) Months (m
3/s) Months (m
3/s)
January 34.99 May 12.29 September 8.18
February 44.01 June 14.52 October 1.89
March 33.40 July 12.12 November 13.25
April 23.18 August 1.87 December 28.43

22
2.5.2 Surface water
Regarding hydrology, the hydrological season for the Lower Mekong Basin is
determined based on the discharge at Kratie Station, and the dry season lasts from late
November to late May while flood season is from the end of June to early November. There
are two transitional seasons alternate between these periods (Beilfuss and Triet, 2014).
However, the hydrological season in the Mekong Delta is still a matter of argument.
It is similar to the Mekong Delta; Ben Tre has a high density of rivers, canals because
of their advantages in surface water availability. In the MKD, the Mekong River splits into
and generates eight estuaries at the end points (in the past it was nine as Nine Dragons in
Vietnamese). Four in eight estuaries are in Ben Tre Province, which are My Tho (Tien), Co
Chien, Ham Luong, and Ba Lai River. Additionally, there are many main, secondary, and
interior field canals (Mekong Delta canal classification) connecting with these rivers to create
the complicated channel network. This system allows surface water to reach to fields easily;
however, it also brings salinity into agricultural lands in the dry season.
Table 12: Dimension of main rivers in Ben Tre Province
Rivers Length (km) Width (m) Deep (m)
My Tho 90 1,500 ÷ 2,000
Co Chien 80
Ham Luong 70 1,200 ÷ 3,000 12 ÷ 15
Ba Lai 55 200 ÷ 300 3 ÷ 5
Figure 8: The map of rivers and main canals in Ben Tre (modified from SIWRP, 2016)
23
In the dry season (December to April), the discharge of Mekong River flows to Ben
Tre via My Tho River and Co Chien River are 1,598 m3/s and 1,480 m
3/s, respectively (Figure
8). This amount of water would exceed the water demand. However, the combination of
incoming spring tide and strong onshore winds could dominate and generate the inverse flows
that bring salinity to inland. Consequently, in the dry season (especially March and/or April)
90% of the areas of Ben Tre is surrounded by saline water with a concentration above 1 ppt.
In flood seasons (May to November), the discharge of My Tho River and Co Chien River are
6,840 and 6,000 m3/s. This surplus of water puts salinity back to sea so that ends salinity
intrusion and the dry periods.
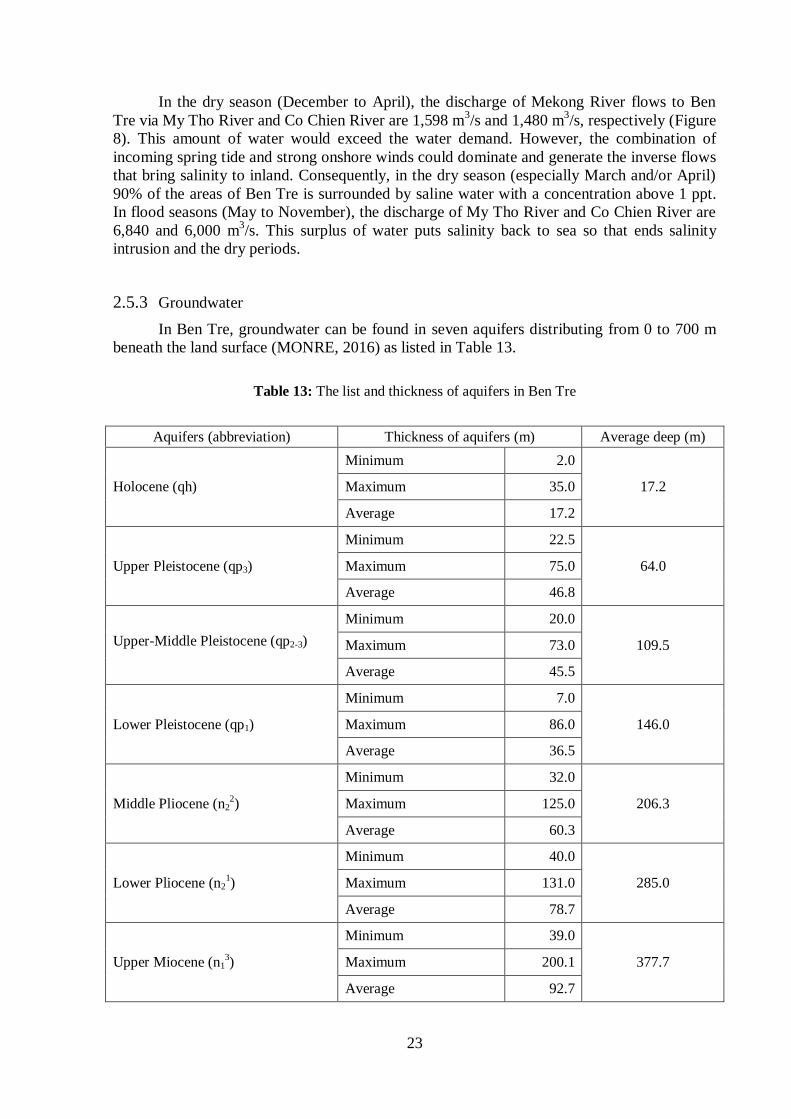
2.5.3 Groundwater
In Ben Tre, groundwater can be found in seven aquifers distributing from 0 to 700 m
beneath the land surface (MONRE, 2016) as listed in Table 13.
Table 13: The list and thickness of aquifers in Ben Tre
Aquifers (abbreviation) Thickness of aquifers (m) Average deep (m)
Holocene (qh)
Minimum 2.0
17.2 Maximum 35.0
Average 17.2
Upper Pleistocene (qp3)
Minimum 22.5
64.0 Maximum 75.0
Average 46.8
Minimum 20.0
109.5 Upper-Middle Pleistocene (qp2-3) Maximum 73.0
Average 45.5
Lower Pleistocene (qp1)
Minimum 7.0
146.0 Maximum 86.0
Average 36.5
Middle Pliocene (n22)
Minimum 32.0
206.3 Maximum 125.0
Average 60.3
Lower Pliocene (n21)
Minimum 40.0
285.0 Maximum 131.0
Average 78.7
Upper Miocene (n13)
Minimum 39.0
377.7 Maximum 200.1
Average 92.7
24
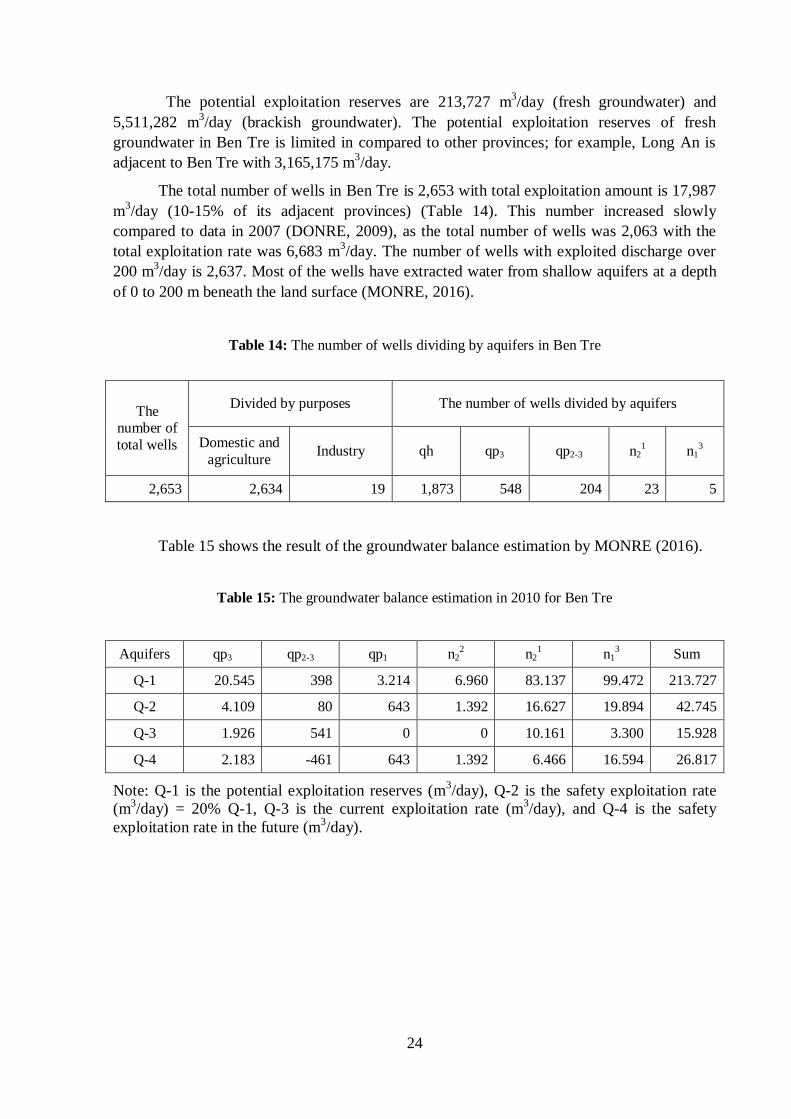
The potential exploitation reserves are 213,727 m3/day (fresh groundwater) and
5,511,282 m3/day (brackish groundwater). The potential exploitation reserves of fresh
groundwater in Ben Tre is limited in compared to other provinces; for example, Long An is
adjacent to Ben Tre with 3,165,175 m3/day.
The total number of wells in Ben Tre is 2,653 with total exploitation amount is 17,987
m3/day (10-15% of its adjacent provinces) (Table 14). This number increased slowly
compared to data in 2007 (DONRE, 2009), as the total number of wells was 2,063 with the
total exploitation rate was 6,683 m3/day. The number of wells with exploited discharge over
200 m3/day is 2,637. Most of the wells have extracted water from shallow aquifers at a depth
of 0 to 200 m beneath the land surface (MONRE, 2016).
Table 14: The number of wells dividing by aquifers in Ben Tre
The number of
total wells
Divided by purposes The number of wells divided by aquifers
Domestic and
agriculture Industry qh qp3 qp2-3 n2
1 n1
3
2,653 2,634 19 1,873 548 204 23 5
Table 15 shows the result of the groundwater balance estimation by MONRE (2016).
Table 15: The groundwater balance estimation in 2010 for Ben Tre
Aquifers qp3 qp2-3 qp1 n22 n2
1 n1
3 Sum
Q-1 20.545 398 3.214 6.960 83.137 99.472 213.727
Q-2 4.109 80 643 1.392 16.627 19.894 42.745
Q-3 1.926 541 0 0 10.161 3.300 15.928
Q-4 2.183 -461 643 1.392 6.466 16.594 26.817
Note: Q-1 is the potential exploitation reserves (m3/day), Q-2 is the safety exploitation rate
(m3/day) = 20% Q-1, Q-3 is the current exploitation rate (m
3/day), and Q-4 is the safety
exploitation rate in the future (m3/day).
25
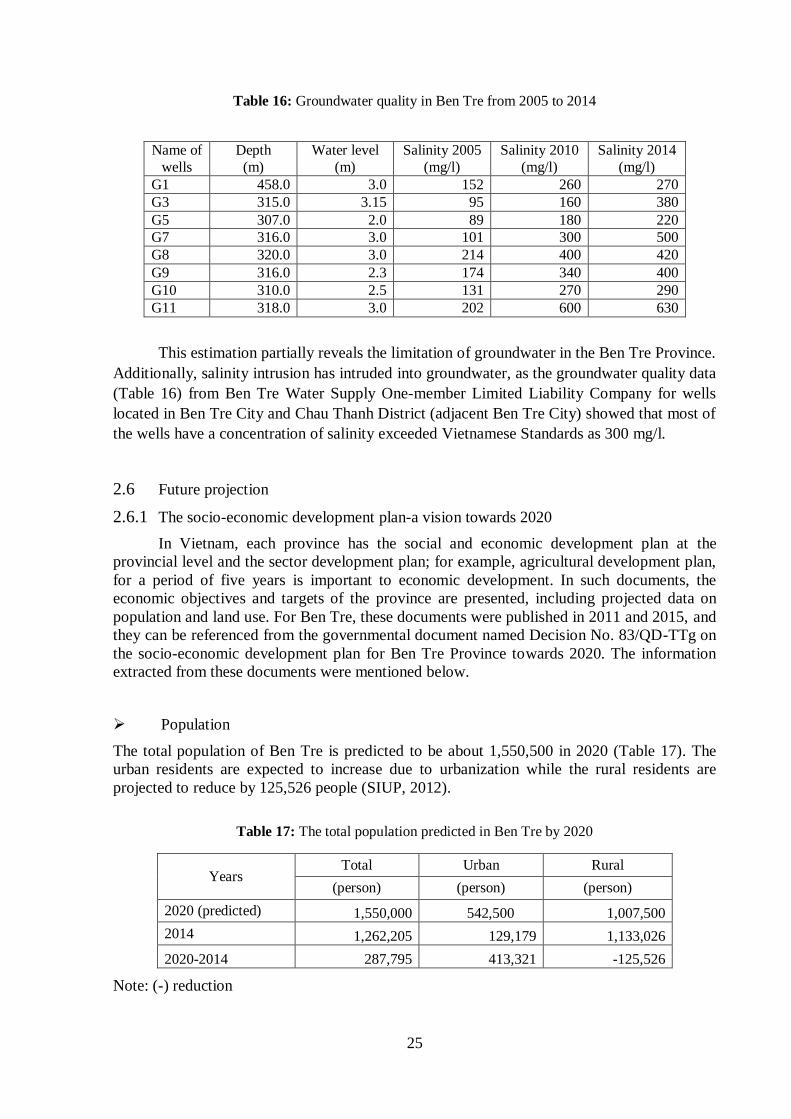
Table 16: Groundwater quality in Ben Tre from 2005 to 2014
Name of
wells Depth
(m) Water level
(m) Salinity 2005
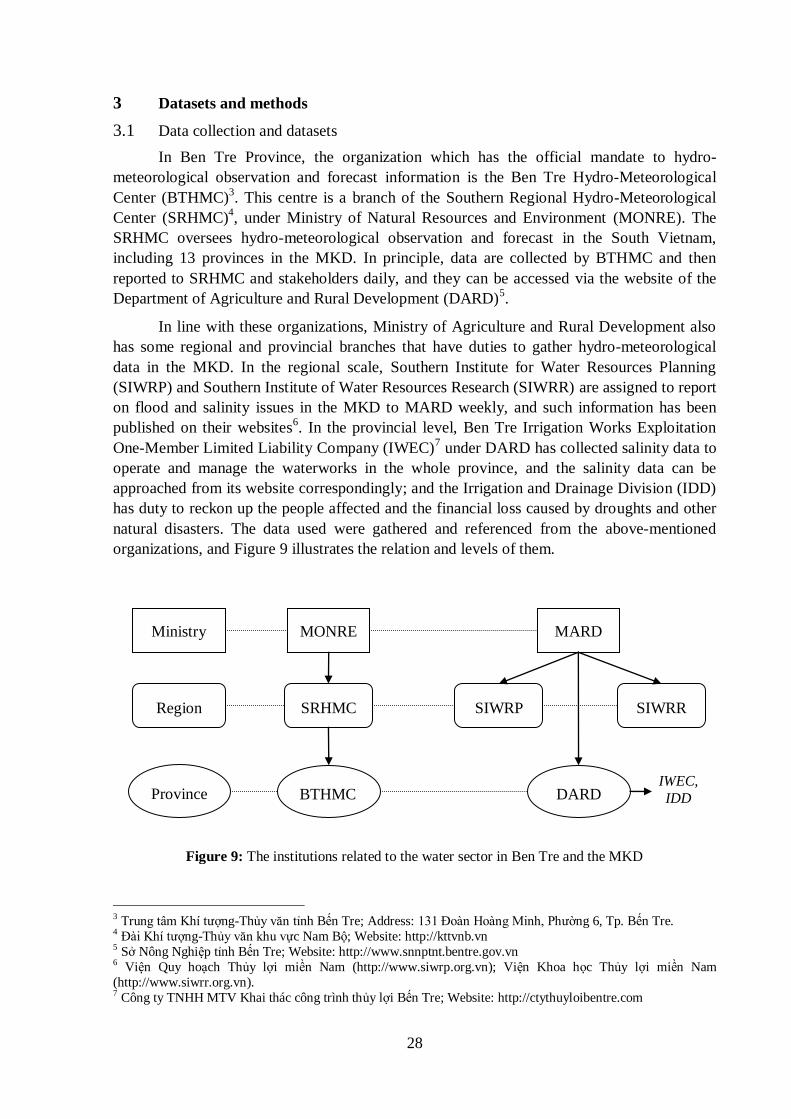
(mg/l) Salinity 2010
(mg/l) Salinity 2014
(mg/l) G1 458.0 3.0 152 260 270 G3 315.0 3.15 95 160 380 G5 307.0 2.0 89 180 220 G7 316.0 3.0 101 300 500 G8 320.0 3.0 214 400 420 G9 316.0 2.3 174 340 400 G10 310.0 2.5 131 270 290 G11 318.0 3.0 202 600 630
This estimation partially reveals the limitation of groundwater in the Ben Tre Province.
Additionally, salinity intrusion has intruded into groundwater, as the groundwater quality data
(Table 16) from Ben Tre Water Supply One-member Limited Liability Company for wells
located in Ben Tre City and Chau Thanh District (adjacent Ben Tre City) showed that most of
the wells have a concentration of salinity exceeded Vietnamese Standards as 300 mg/l.
2.6 Future projection
2.6.1 The socio-economic development plan-a vision towards 2020
In Vietnam, each province has the social and economic development plan at the
provincial level and the sector development plan; for example, agricultural development plan,
for a period of five years is important to economic development. In such documents, the
economic objectives and targets of the province are presented, including projected data on
population and land use. For Ben Tre, these documents were published in 2011 and 2015, and
they can be referenced from the governmental document named Decision No. 83/QD-TTg on
the socio-economic development plan for Ben Tre Province towards 2020. The information
extracted from these documents were mentioned below.
Population
The total population of Ben Tre is predicted to be about 1,550,500 in 2020 (Table 17). The
urban residents are expected to increase due to urbanization while the rural residents are
projected to reduce by 125,526 people (SIUP, 2012).
Table 17: The total population predicted in Ben Tre by 2020
Years Total Urban Rural
(person) (person) (person)
2020 (predicted) 1,550,000 542,500 1,007,500
2014 1,262,205 129,179 1,133,026
2020-2014 287,795 413,321 -125,526
Note: (-) reduction
26
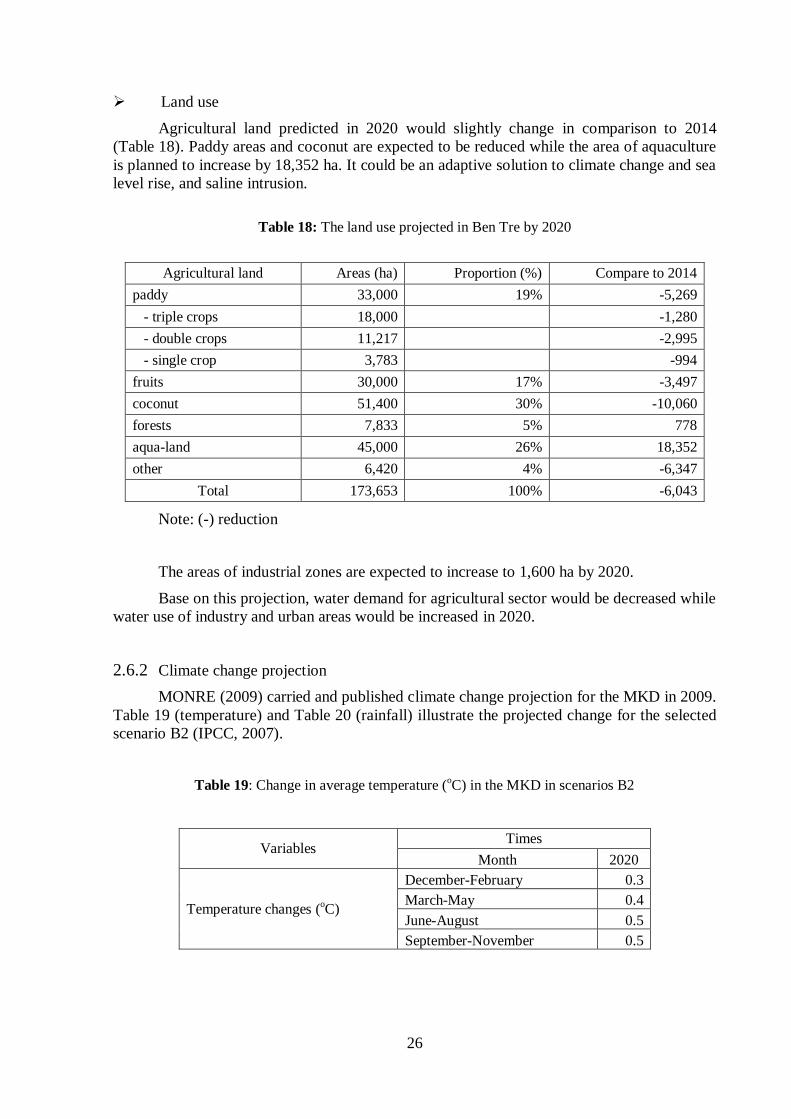
Land use
Agricultural land predicted in 2020 would slightly change in comparison to 2014
(Table 18). Paddy areas and coconut are expected to be reduced while the area of aquaculture
is planned to increase by 18,352 ha. It could be an adaptive solution to climate change and sea
level rise, and saline intrusion.
Table 18: The land use projected in Ben Tre by 2020
Agricultural land Areas (ha) Proportion (%) Compare to 2014
paddy 33,000 19% -5,269
- triple crops 18,000 -1,280
- double crops 11,217 -2,995
- single crop 3,783 -994
fruits 30,000 17% -3,497
coconut 51,400 30% -10,060
forests 7,833 5% 778
aqua-land 45,000 26% 18,352
other 6,420 4% -6,347
Total 173,653 100% -6,043
Note: (-) reduction
The areas of industrial zones are expected to increase to 1,600 ha by 2020.
Base on this projection, water demand for agricultural sector would be decreased while
water use of industry and urban areas would be increased in 2020.
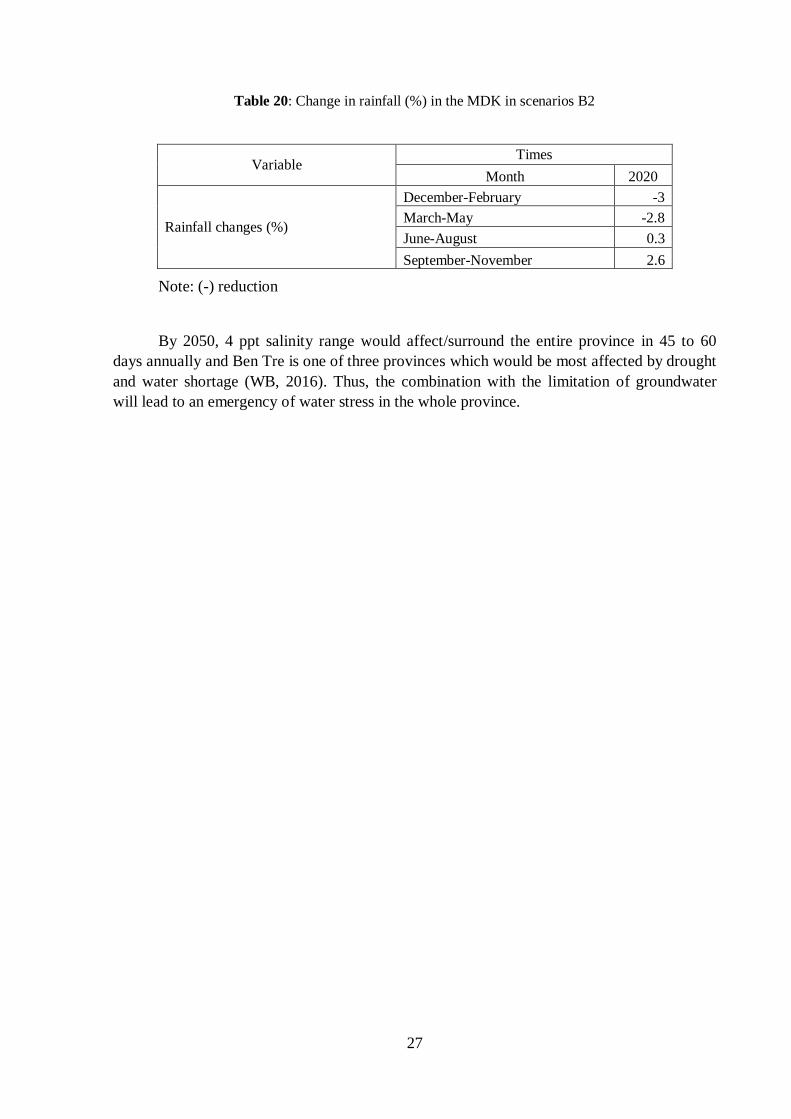
2.6.2 Climate change projection
MONRE (2009) carried and published climate change projection for the MKD in 2009.
Table 19 (temperature) and Table 20 (rainfall) illustrate the projected change for the selected
scenario B2 (IPCC, 2007).
Table 19: Change in average temperature (oC) in the MKD in scenarios B2
Variables Times
Month 2020
Temperature changes (oC)
December-February 0.3
March-May 0.4
June-August 0.5
September-November 0.5
27
Table 20: Change in rainfall (%) in the MDK in scenarios B2
Variable Times
Month 2020
Rainfall changes (%)
December-February -3
March-May -2.8
June-August 0.3
September-November 2.6
Note: (-) reduction
By 2050, 4 ppt salinity range would affect/surround the entire province in 45 to 60
days annually and Ben Tre is one of three provinces which would be most affected by drought
and water shortage (WB, 2016). Thus, the combination with the limitation of groundwater
will lead to an emergency of water stress in the whole province.
28
3 Datasets and methods
3.1 Data collection and datasets
In Ben Tre Province, the organization which has the official mandate to hydro-
meteorological observation and forecast information is the Ben Tre Hydro-Meteorological
Center (BTHMC)3. This centre is a branch of the Southern Regional Hydro-Meteorological
Center (SRHMC)4, under Ministry of Natural Resources and Environment (MONRE). The
SRHMC oversees hydro-meteorological observation and forecast in the South Vietnam,
including 13 provinces in the MKD. In principle, data are collected by BTHMC and then
reported to SRHMC and stakeholders daily, and they can be accessed via the website of the
Department of Agriculture and Rural Development (DARD)5.
In line with these organizations, Ministry of Agriculture and Rural Development also
has some regional and provincial branches that have duties to gather hydro-meteorological
data in the MKD. In the regional scale, Southern Institute for Water Resources Planning
(SIWRP) and Southern Institute of Water Resources Research (SIWRR) are assigned to report
on flood and salinity issues in the MKD to MARD weekly, and such information has been
published on their websites6. In the provincial level, Ben Tre Irrigation Works Exploitation
One-Member Limited Liability Company (IWEC)7 under DARD has collected salinity data to
operate and manage the waterworks in the whole province, and the salinity data can be
approached from its website correspondingly; and the Irrigation and Drainage Division (IDD)
has duty to reckon up the people affected and the financial loss caused by droughts and other
natural disasters. The data used were gathered and referenced from the above-mentioned
organizations, and Figure 9 illustrates the relation and levels of them.
3 Trung tâm Khí tượng-Thủy văn tỉnh Bến Tre; Address: 131 Đoàn Hoàng Minh, Phường 6, Tp. Bến Tre. 4 Đài Khí tượng-Thủy văn khu vực Nam Bộ; Website: http://kttvnb.vn 5 Sở Nông Nghiệp tỉnh Bến Tre; Website: http://www.snnptnt.bentre.gov.vn
6 Viện Quy hoạch Thủy lợi miền Nam (http://www.siwrp.org.vn); Viện Khoa học Thủy lợi miền Nam
(http://www.siwrr.org.vn). 7 Công ty TNHH MTV Khai thác công trình thủy lợi Bến Tre; Website: http://ctythuyloibentre.com
Ministry MONRE MARD
Region
Province
SRHMC SIWRP
BTHMC DARD
SIWRR
IWEC,
IDD
Figure 9: The institutions related to the water sector in Ben Tre and the MKD
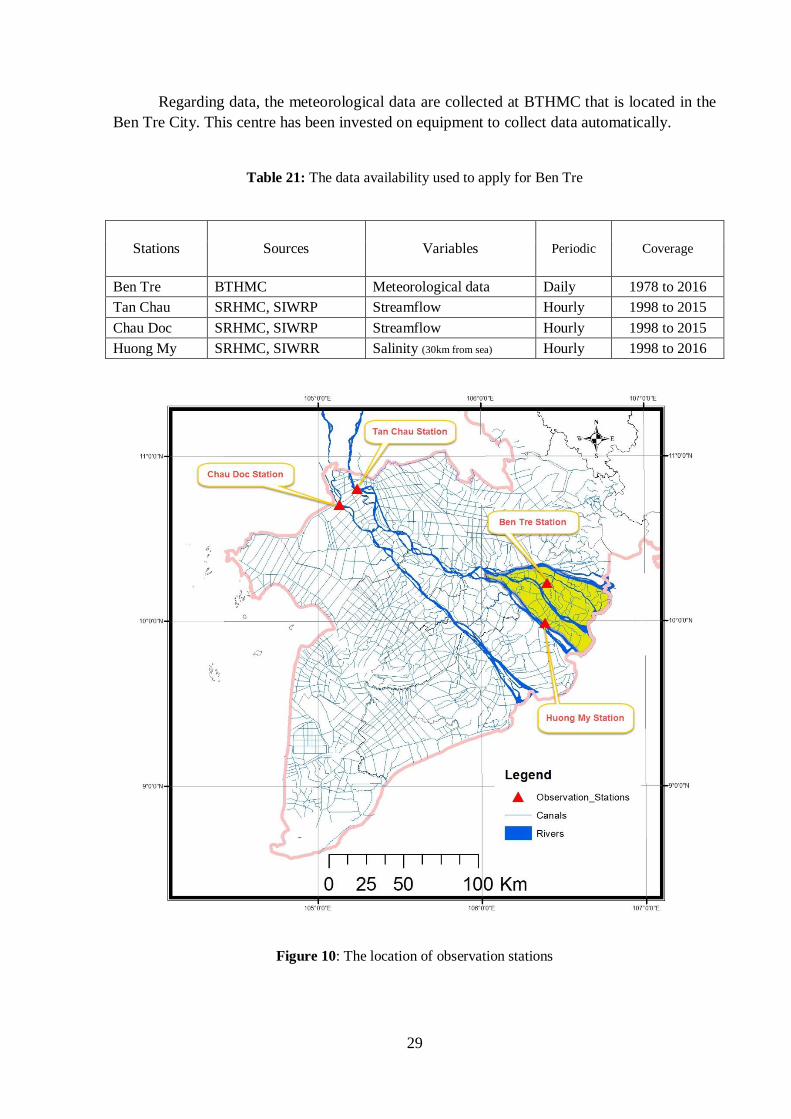
29
Regarding data, the meteorological data are collected at BTHMC that is located in the
Ben Tre City. This centre has been invested on equipment to collect data automatically.
Table 21: The data availability used to apply for Ben Tre
Stations Sources Variables Periodic Coverage
Ben Tre BTHMC Meteorological data Daily 1978 to 2016
Tan Chau SRHMC, SIWRP Streamflow Hourly 1998 to 2015
Chau Doc SRHMC, SIWRP Streamflow Hourly 1998 to 2015
Huong My SRHMC, SIWRR Salinity (30km from sea) Hourly 1998 to 2016
Figure 10: The location of observation stations
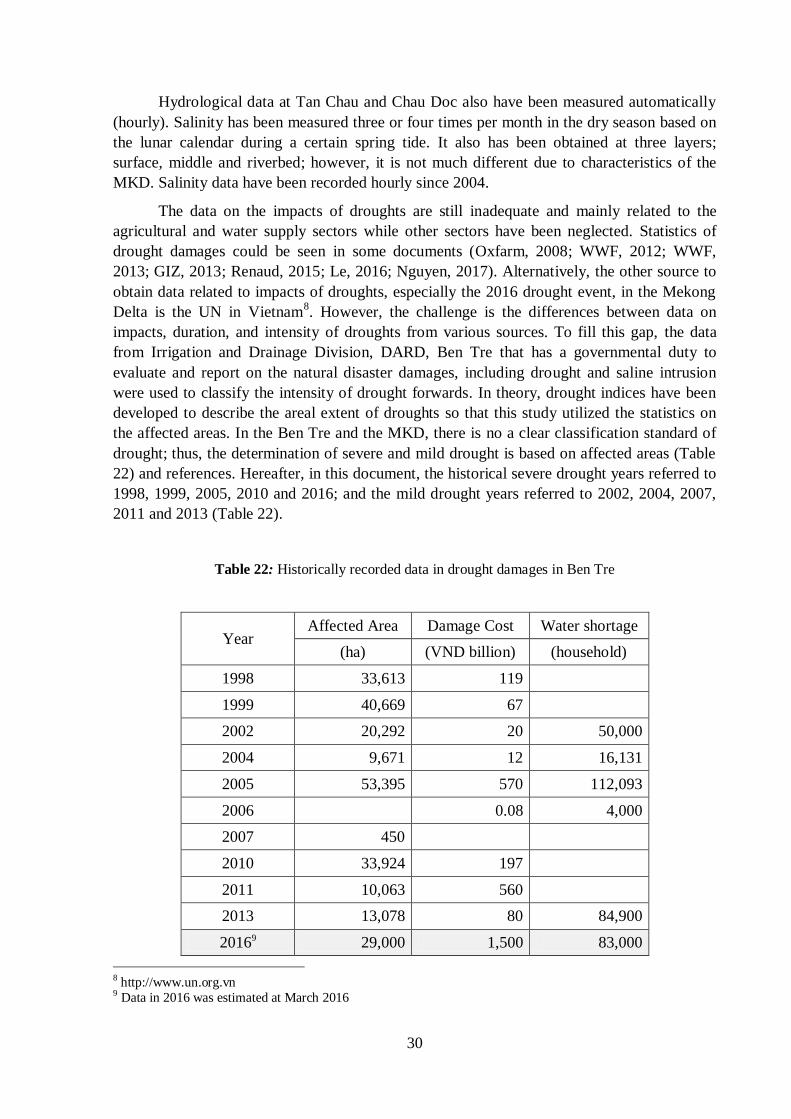
30
Hydrological data at Tan Chau and Chau Doc also have been measured automatically
(hourly). Salinity has been measured three or four times per month in the dry season based on
the lunar calendar during a certain spring tide. It also has been obtained at three layers;
surface, middle and riverbed; however, it is not much different due to characteristics of the
MKD. Salinity data have been recorded hourly since 2004.
The data on the impacts of droughts are still inadequate and mainly related to the
agricultural and water supply sectors while other sectors have been neglected. Statistics of
drought damages could be seen in some documents (Oxfarm, 2008; WWF, 2012; WWF,
2013; GIZ, 2013; Renaud, 2015; Le, 2016; Nguyen, 2017). Alternatively, the other source to
obtain data related to impacts of droughts, especially the 2016 drought event, in the Mekong
Delta is the UN in Vietnam8. However, the challenge is the differences between data on
impacts, duration, and intensity of droughts from various sources. To fill this gap, the data
from Irrigation and Drainage Division, DARD, Ben Tre that has a governmental duty to
evaluate and report on the natural disaster damages, including drought and saline intrusion
were used to classify the intensity of drought forwards. In theory, drought indices have been
developed to describe the areal extent of droughts so that this study utilized the statistics on
the affected areas. In the Ben Tre and the MKD, there is no a clear classification standard of
drought; thus, the determination of severe and mild drought is based on affected areas (Table
22) and references. Hereafter, in this document, the historical severe drought years referred to
1998, 1999, 2005, 2010 and 2016; and the mild drought years referred to 2002, 2004, 2007,
2011 and 2013 (Table 22).
Table 22: Historically recorded data in drought damages in Ben Tre
Year Affected Area Damage Cost Water shortage
(ha) (VND billion) (household)
1998 33,613 119
1999 40,669 67
2002 20,292 20 50,000
2004 9,671 12 16,131
2005 53,395 570 112,093
2006 0.08 4,000
2007 450
2010 33,924 197
2011 10,063 560
2013 13,078 80 84,900
20169 29,000 1,500 83,000
8 http://www.un.org.vn 9 Data in 2016 was estimated at March 2016
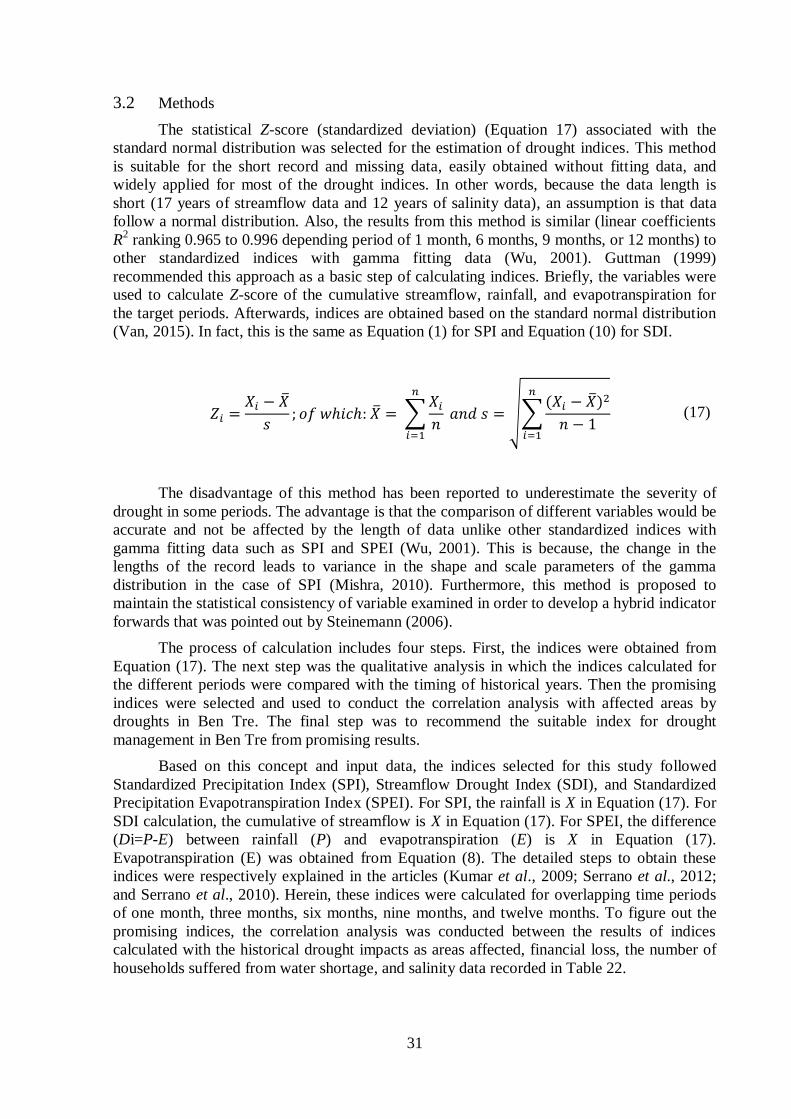
31
3.2 Methods
The statistical Z-score (standardized deviation) (Equation 17) associated with the
standard normal distribution was selected for the estimation of drought indices. This method
is suitable for the short record and missing data, easily obtained without fitting data, and
widely applied for most of the drought indices. In other words, because the data length is
short (17 years of streamflow data and 12 years of salinity data), an assumption is that data
follow a normal distribution. Also, the results from this method is similar (linear coefficients
R2 ranking 0.965 to 0.996 depending period of 1 month, 6 months, 9 months, or 12 months) to
other standardized indices with gamma fitting data (Wu, 2001). Guttman (1999)
recommended this approach as a basic step of calculating indices. Briefly, the variables were
used to calculate Z-score of the cumulative streamflow, rainfall, and evapotranspiration for
the target periods. Afterwards, indices are obtained based on the standard normal distribution
(Van, 2015). In fact, this is the same as Equation (1) for SPI and Equation (10) for SDI.
(17)
The disadvantage of this method has been reported to underestimate the severity of
drought in some periods. The advantage is that the comparison of different variables would be
accurate and not be affected by the length of data unlike other standardized indices with
gamma fitting data such as SPI and SPEI (Wu, 2001). This is because, the change in the
lengths of the record leads to variance in the shape and scale parameters of the gamma
distribution in the case of SPI (Mishra, 2010). Furthermore, this method is proposed to
maintain the statistical consistency of variable examined in order to develop a hybrid indicator
forwards that was pointed out by Steinemann (2006).
The process of calculation includes four steps. First, the indices were obtained from
Equation (17). The next step was the qualitative analysis in which the indices calculated for
the different periods were compared with the timing of historical years. Then the promising
indices were selected and used to conduct the correlation analysis with affected areas by
droughts in Ben Tre. The final step was to recommend the suitable index for drought
management in Ben Tre from promising results.
Based on this concept and input data, the indices selected for this study followed
Standardized Precipitation Index (SPI), Streamflow Drought Index (SDI), and Standardized
Precipitation Evapotranspiration Index (SPEI). For SPI, the rainfall is X in Equation (17). For
SDI calculation, the cumulative of streamflow is X in Equation (17). For SPEI, the difference
(Di=P-E) between rainfall (P) and evapotranspiration (E) is X in Equation (17).
Evapotranspiration (E) was obtained from Equation (8). The detailed steps to obtain these
indices were respectively explained in the articles (Kumar et al., 2009; Serrano et al., 2012;
and Serrano et al., 2010). Herein, these indices were calculated for overlapping time periods
of one month, three months, six months, nine months, and twelve months. To figure out the
promising indices, the correlation analysis was conducted between the results of indices
calculated with the historical drought impacts as areas affected, financial loss, the number of
households suffered from water shortage, and salinity data recorded in Table 22.
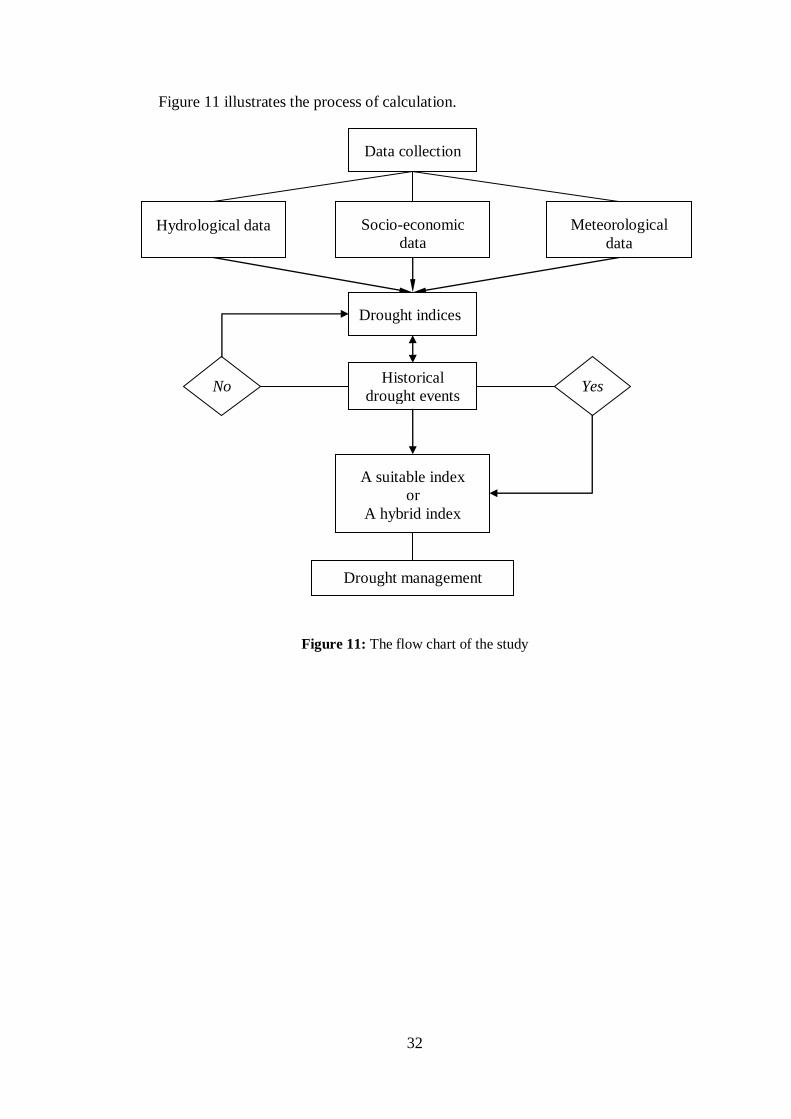
32
Data collection
Hydrological data Socio-economic
data
Meteorological
data
Drought indices
Historical
drought events
A suitable index
or
A hybrid index
No Yes
Drought management
Figure 11 illustrates the process of calculation.
Figure 11: The flow chart of the study
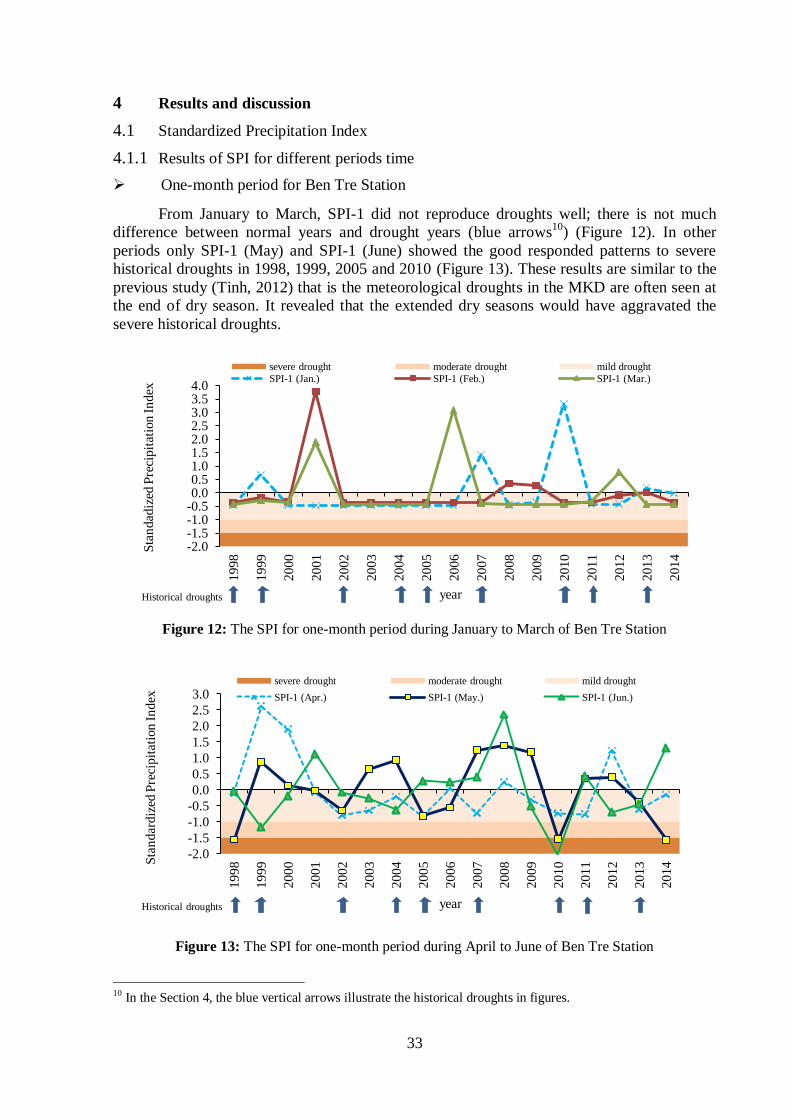
33
4 Results and discussion
4.1 Standardized Precipitation Index
4.1.1 Results of SPI for different periods time
One-month period for Ben Tre Station
From January to March, SPI-1 did not reproduce droughts well; there is not much
difference between normal years and drought years (blue arrows10
) (Figure 12). In other
periods only SPI-1 (May) and SPI-1 (June) showed the good responded patterns to severe
historical droughts in 1998, 1999, 2005 and 2010 (Figure 13). These results are similar to the
previous study (Tinh, 2012) that is the meteorological droughts in the MKD are often seen at
the end of dry season. It revealed that the extended dry seasons would have aggravated the
severe historical droughts.
Figure 12: The SPI for one-month period during January to March of Ben Tre Station
Figure 13: The SPI for one-month period during April to June of Ben Tre Station
10 In the Section 4, the blue vertical arrows illustrate the historical droughts in figures.
-2.0 -1.5 -1.0 -0.5 0.0 0.5 1.0 1.5 2.0 2.5 3.0 3.5 4.0
19
98
19
99
20
00
20
01
20
02
20
03
20
04
20
05
20
06
20
07
20
08
20
09
20
10
20
11
20
12
20
13
20
14
Sta
nd
adiz
ed P
reci
pit
atio
n In
dex
year
severe drought moderate drought mild drought
SPI-1 (Jan.) SPI-1 (Feb.) SPI-1 (Mar.)
Historical droughts
-2.0
-1.5
-1.0
-0.5
0.0
0.5
1.0
1.5
2.0
2.5
3.0
1998
1999
2000
2001
2002
2003
2004
2005
2006
2007
2008
2009
2010
2011
2012
2013
2014
Sta
ndar
diz
ed P
reci
pit
atio
n In
dex
year
severe drought moderate drought mild drought
SPI-1 (Apr.) SPI-1 (May.) SPI-1 (Jun.)
Historical droughts
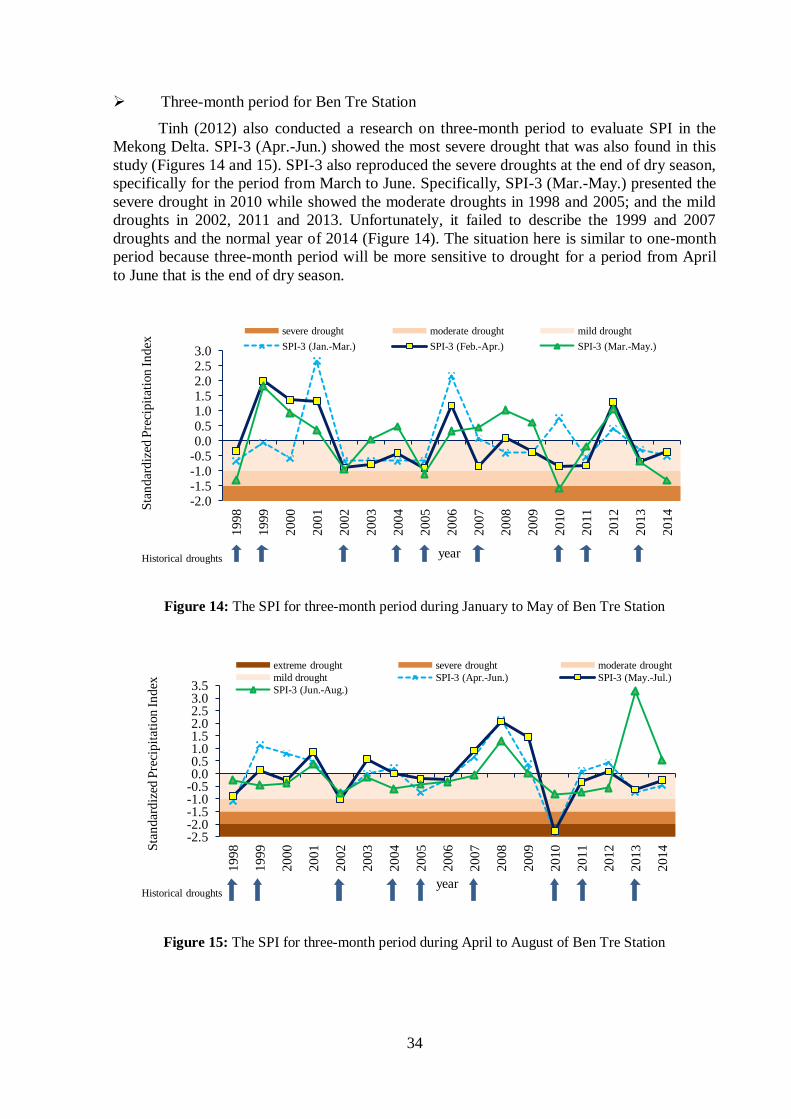
34
Three-month period for Ben Tre Station
Tinh (2012) also conducted a research on three-month period to evaluate SPI in the
Mekong Delta. SPI-3 (Apr.-Jun.) showed the most severe drought that was also found in this
study (Figures 14 and 15). SPI-3 also reproduced the severe droughts at the end of dry season,
specifically for the period from March to June. Specifically, SPI-3 (Mar.-May.) presented the
severe drought in 2010 while showed the moderate droughts in 1998 and 2005; and the mild
droughts in 2002, 2011 and 2013. Unfortunately, it failed to describe the 1999 and 2007
droughts and the normal year of 2014 (Figure 14). The situation here is similar to one-month
period because three-month period will be more sensitive to drought for a period from April
to June that is the end of dry season.
Figure 14: The SPI for three-month period during January to May of Ben Tre Station
Figure 15: The SPI for three-month period during April to August of Ben Tre Station
-2.0 -1.5 -1.0 -0.5 0.0 0.5 1.0 1.5 2.0 2.5 3.0
19
98
19
99
20
00
2001
20
02
20
03
20
04
20
05
20
06
20
07
20
08
20
09
2010
20
11
20
12
20
13
20
14 Sta
nd
ard
ized
Pre
cipit
atio
n In
dex
year
severe drought moderate drought mild drought
SPI-3 (Jan.-Mar.) SPI-3 (Feb.-Apr.) SPI-3 (Mar.-May.)
Historical droughts
-2.5 -2.0 -1.5 -1.0 -0.5 0.0 0.5 1.0 1.5 2.0 2.5 3.0 3.5
1998
1999
2000
2001
2002
2003
2004
2005
2006
2007
2008
2009
2010
2011
2012
2013
2014
Sta
ndar
diz
ed P
reci
pit
atio
n In
dex
year
extreme drought severe drought moderate drought
mild drought SPI-3 (Apr.-Jun.) SPI-3 (May.-Jul.)
SPI-3 (Jun.-Aug.)
Historical droughts
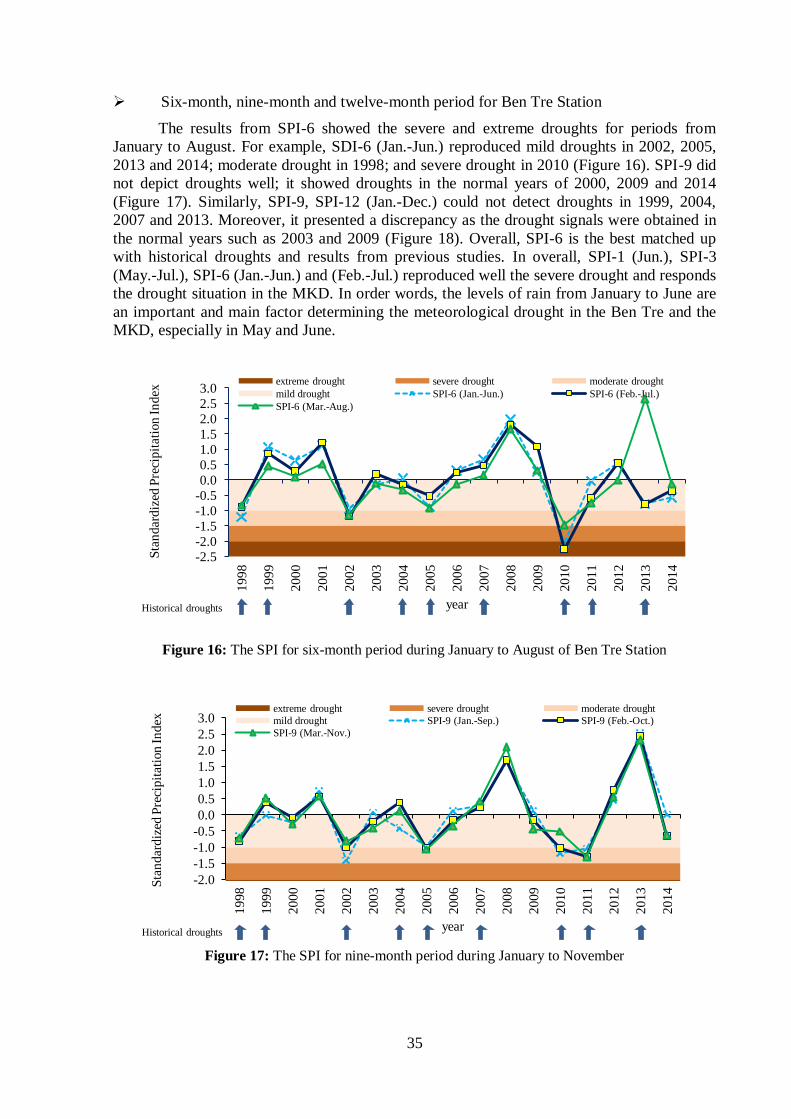
35
Six-month, nine-month and twelve-month period for Ben Tre Station
The results from SPI-6 showed the severe and extreme droughts for periods from
January to August. For example, SDI-6 (Jan.-Jun.) reproduced mild droughts in 2002, 2005,
2013 and 2014; moderate drought in 1998; and severe drought in 2010 (Figure 16). SPI-9 did
not depict droughts well; it showed droughts in the normal years of 2000, 2009 and 2014
(Figure 17). Similarly, SPI-9, SPI-12 (Jan.-Dec.) could not detect droughts in 1999, 2004,
2007 and 2013. Moreover, it presented a discrepancy as the drought signals were obtained in
the normal years such as 2003 and 2009 (Figure 18). Overall, SPI-6 is the best matched up
with historical droughts and results from previous studies. In overall, SPI-1 (Jun.), SPI-3
(May.-Jul.), SPI-6 (Jan.-Jun.) and (Feb.-Jul.) reproduced well the severe drought and responds
the drought situation in the MKD. In order words, the levels of rain from January to June are
an important and main factor determining the meteorological drought in the Ben Tre and the
MKD, especially in May and June.
Figure 16: The SPI for six-month period during January to August of Ben Tre Station
Figure 17: The SPI for nine-month period during January to November
-2.5
-2.0
-1.5
-1.0
-0.5
0.0
0.5
1.0
1.5
2.0
2.5
3.0
19
98
19
99
20
00
20
01
20
02
20
03
20
04
20
05
20
06
20
07
20
08
20
09
20
10
20
11
20
12
20
13
20
14
Sta
nd
ard
ized
Pre
cip
itat
ion
In
dex
year
extreme drought severe drought moderate drought
mild drought SPI-6 (Jan.-Jun.) SPI-6 (Feb.-Jul.)
SPI-6 (Mar.-Aug.)
Historical droughts
-2.0
-1.5
-1.0
-0.5
0.0
0.5
1.0
1.5
2.0
2.5
3.0
1998
1999
2000
2001
2002
2003
2004
2005
2006
2007
2008
2009
2010
2011
2012
2013
2014
Sta
ndar
diz
ed P
reci
pit
atio
n In
dex
year
extreme drought severe drought moderate drought
mild drought SPI-9 (Jan.-Sep.) SPI-9 (Feb.-Oct.)
SPI-9 (Mar.-Nov.)
Historical droughts
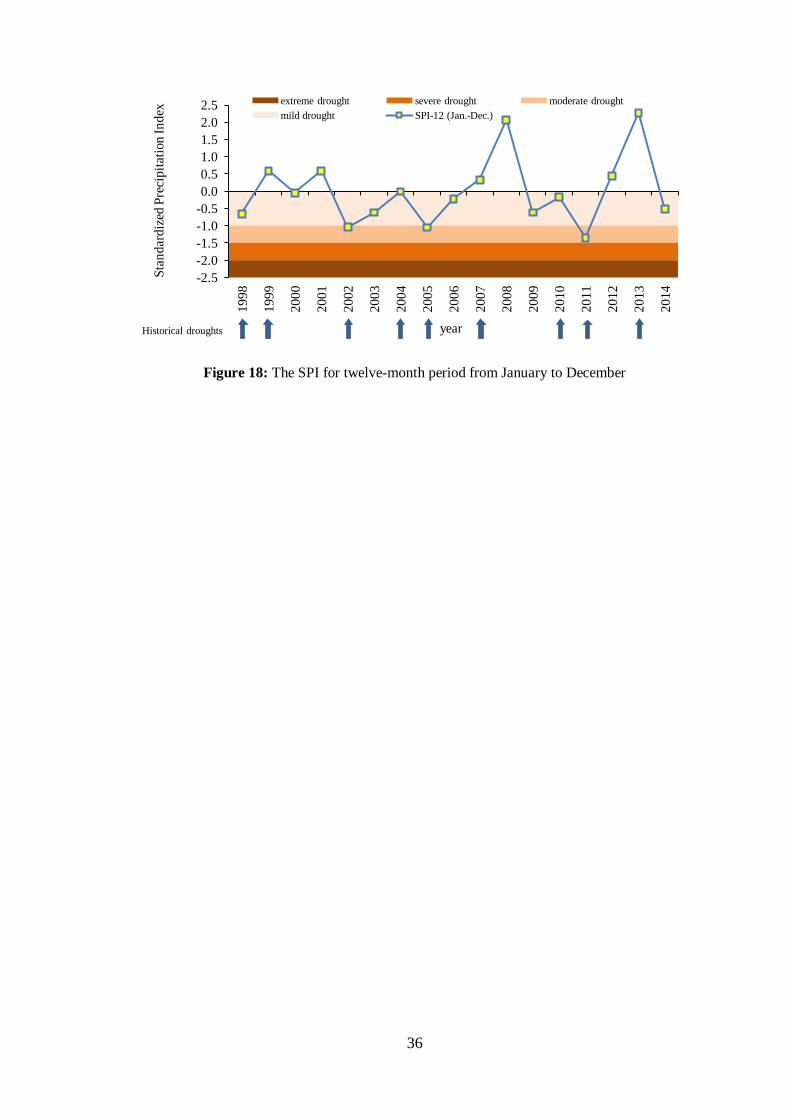
36
Figure 18: The SPI for twelve-month period from January to December
-2.5
-2.0
-1.5
-1.0
-0.5
0.0
0.5
1.0
1.5
2.0
2.5
1998
1999
2000
2001
2002
2003
2004
2005
2006
2007
2008
2009
2010
2011
2012
2013
2014
Sta
ndar
diz
ed P
reci
pit
atio
n In
dex
year
extreme drought severe drought moderate drought
mild drought SPI-12 (Jan.-Dec.)
Historical droughts
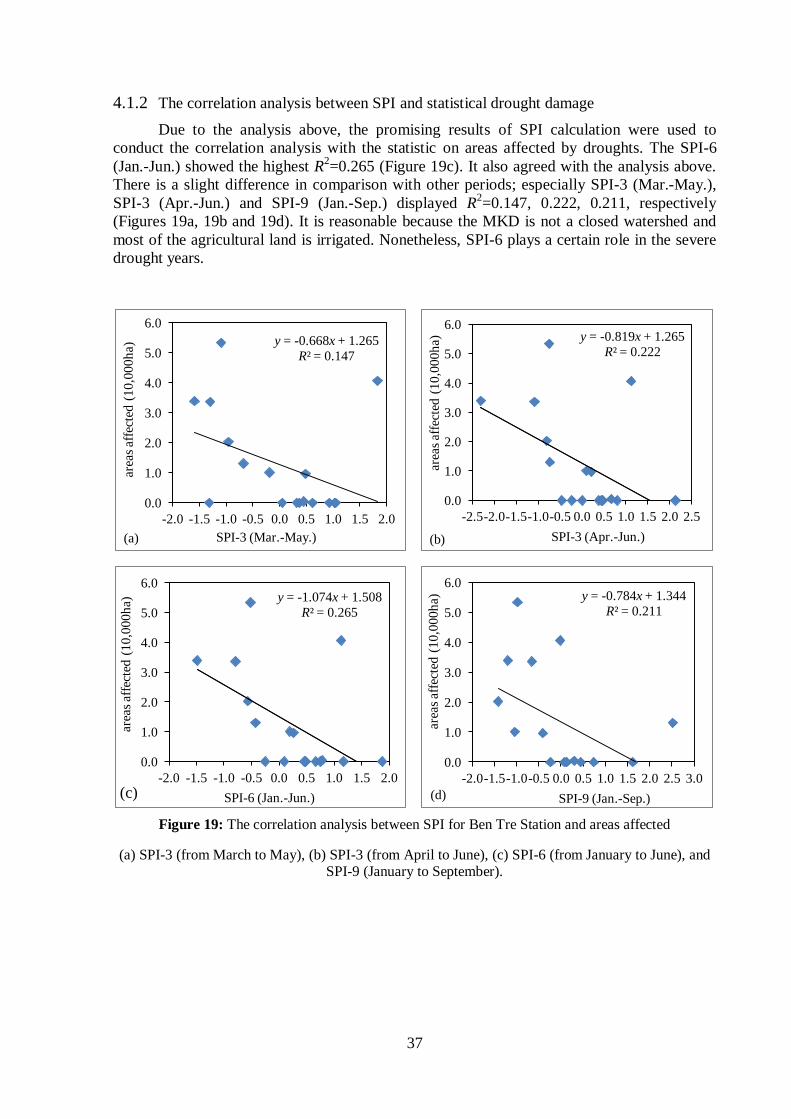
37
4.1.2 The correlation analysis between SPI and statistical drought damage
Due to the analysis above, the promising results of SPI calculation were used to
conduct the correlation analysis with the statistic on areas affected by droughts. The SPI-6
(Jan.-Jun.) showed the highest R2=0.265 (Figure 19c). It also agreed with the analysis above.
There is a slight difference in comparison with other periods; especially SPI-3 (Mar.-May.),
SPI-3 (Apr.-Jun.) and SPI-9 (Jan.-Sep.) displayed R2=0.147, 0.222, 0.211, respectively
(Figures 19a, 19b and 19d). It is reasonable because the MKD is not a closed watershed and
most of the agricultural land is irrigated. Nonetheless, SPI-6 plays a certain role in the severe
drought years.
Figure 19: The correlation analysis between SPI for Ben Tre Station and areas affected
(a) SPI-3 (from March to May), (b) SPI-3 (from April to June), (c) SPI-6 (from January to June), and SPI-9 (January to September).
y = -0.668x + 1.265
R² = 0.147
0.0
1.0
2.0
3.0
4.0
5.0
6.0
-2.0 -1.5 -1.0 -0.5 0.0 0.5 1.0 1.5 2.0
area
s af
fect
ed (
10,0
00h
a)
SPI-3 (Mar.-May.) (a)
y = -0.819x + 1.265
R² = 0.222
0.0
1.0
2.0
3.0
4.0
5.0
6.0
-2.5 -2.0 -1.5 -1.0 -0.5 0.0 0.5 1.0 1.5 2.0 2.5
area
s af
fect
ed (
10,0
00h
a)
SPI-3 (Apr.-Jun.) (b)
y = -1.074x + 1.508
R² = 0.265
0.0
1.0
2.0
3.0
4.0
5.0
6.0
-2.0 -1.5 -1.0 -0.5 0.0 0.5 1.0 1.5 2.0
area
s af
fect
ed (
10
,00
0h
a)
SPI-6 (Jan.-Jun.) (c)
y = -0.784x + 1.344
R² = 0.211
0.0
1.0
2.0
3.0
4.0
5.0
6.0
-2.0 -1.5 -1.0 -0.5 0.0 0.5 1.0 1.5 2.0 2.5 3.0
area
s af
fect
ed (
10
,00
0h
a)
SPI-9 (Jan.-Sep.) (d)
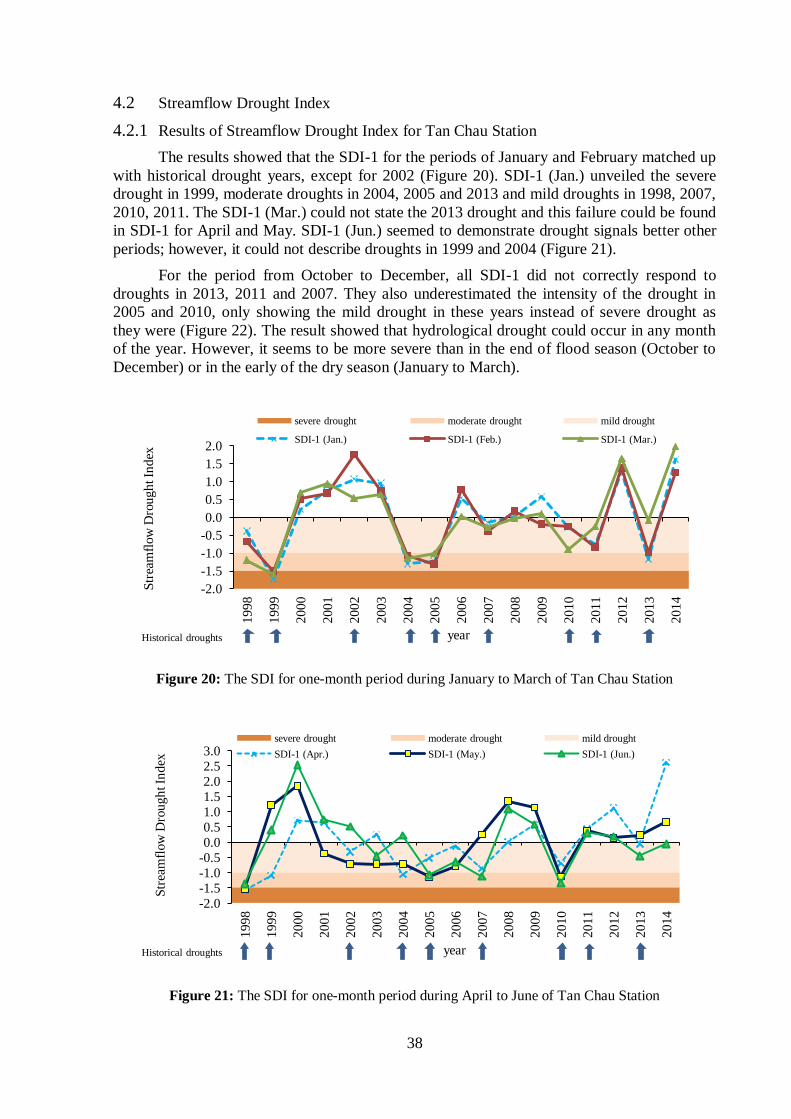
38
4.2 Streamflow Drought Index
4.2.1 Results of Streamflow Drought Index for Tan Chau Station
The results showed that the SDI-1 for the periods of January and February matched up
with historical drought years, except for 2002 (Figure 20). SDI-1 (Jan.) unveiled the severe
drought in 1999, moderate droughts in 2004, 2005 and 2013 and mild droughts in 1998, 2007,
2010, 2011. The SDI-1 (Mar.) could not state the 2013 drought and this failure could be found
in SDI-1 for April and May. SDI-1 (Jun.) seemed to demonstrate drought signals better other
periods; however, it could not describe droughts in 1999 and 2004 (Figure 21).
For the period from October to December, all SDI-1 did not correctly respond to
droughts in 2013, 2011 and 2007. They also underestimated the intensity of the drought in
2005 and 2010, only showing the mild drought in these years instead of severe drought as
they were (Figure 22). The result showed that hydrological drought could occur in any month
of the year. However, it seems to be more severe than in the end of flood season (October to
December) or in the early of the dry season (January to March).
Figure 20: The SDI for one-month period during January to March of Tan Chau Station
Figure 21: The SDI for one-month period during April to June of Tan Chau Station
-2.0
-1.5
-1.0
-0.5
0.0
0.5
1.0
1.5
2.0
19
98
19
99
20
00
20
01
20
02
20
03
20
04
20
05
20
06
20
07
20
08
20
09
20
10
20
11
20
12
20
13
20
14
Str
eam
flow
Dro
ug
ht In
dex
year
severe drought moderate drought mild drought
SDI-1 (Jan.) SDI-1 (Feb.) SDI-1 (Mar.)
Historical droughts
-2.0
-1.5 -1.0 -0.5
0.0 0.5
1.0 1.5 2.0
2.5 3.0
1998
1999
2000
2001
2002
2003
2004
2005
2006
2007
2008
2009
2010
2011
2012
2013
2014
Str
eam
flow
Dro
ugh
t In
dex
year
severe drought moderate drought mild drought
SDI-1 (Apr.) SDI-1 (May.) SDI-1 (Jun.)
Historical droughts
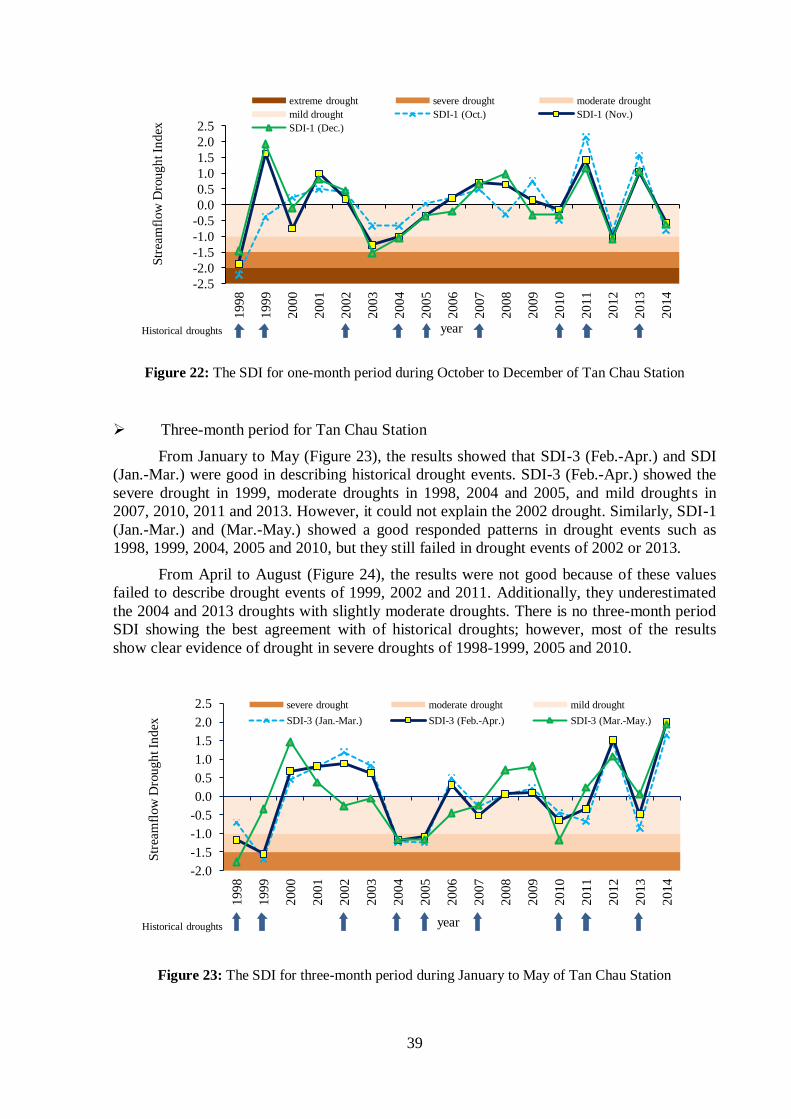
39
Figure 22: The SDI for one-month period during October to December of Tan Chau Station
Three-month period for Tan Chau Station
From January to May (Figure 23), the results showed that SDI-3 (Feb.-Apr.) and SDI
(Jan.-Mar.) were good in describing historical drought events. SDI-3 (Feb.-Apr.) showed the
severe drought in 1999, moderate droughts in 1998, 2004 and 2005, and mild droughts in
2007, 2010, 2011 and 2013. However, it could not explain the 2002 drought. Similarly, SDI-1
(Jan.-Mar.) and (Mar.-May.) showed a good responded patterns in drought events such as
1998, 1999, 2004, 2005 and 2010, but they still failed in drought events of 2002 or 2013.
From April to August (Figure 24), the results were not good because of these values
failed to describe drought events of 1999, 2002 and 2011. Additionally, they underestimated
the 2004 and 2013 droughts with slightly moderate droughts. There is no three-month period
SDI showing the best agreement with of historical droughts; however, most of the results
show clear evidence of drought in severe droughts of 1998-1999, 2005 and 2010.
Figure 23: The SDI for three-month period during January to May of Tan Chau Station
-2.5
-2.0
-1.5
-1.0
-0.5
0.0
0.5
1.0
1.5
2.0
2.5
1998
1999
2000
2001
2002
2003
2004
2005
2006
2007
2008
2009
2010
2011
2012
2013
2014
Str
eam
flow
Dro
ugh
t In
dex
year
extreme drought severe drought moderate drought
mild drought SDI-1 (Oct.) SDI-1 (Nov.)
SDI-1 (Dec.)
Historical droughts
-2.0
-1.5
-1.0
-0.5
0.0
0.5
1.0
1.5
2.0
2.5
1998
1999
2000
2001
2002
2003
2004
2005
2006
2007
2008
2009
2010
2011
2012
2013
2014
Str
eam
flow
Dro
ug
ht In
dex
year
severe drought moderate drought mild drought
SDI-3 (Jan.-Mar.) SDI-3 (Feb.-Apr.) SDI-3 (Mar.-May.)
Historical droughts
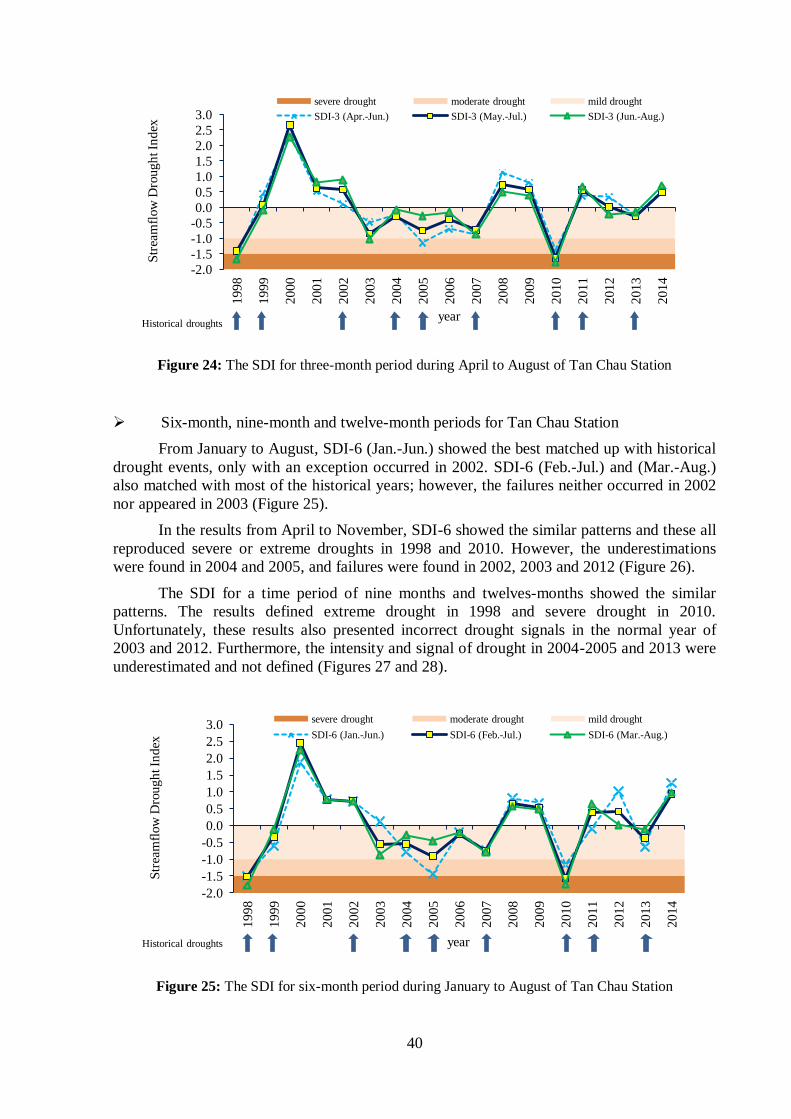
40
Figure 24: The SDI for three-month period during April to August of Tan Chau Station
Six-month, nine-month and twelve-month periods for Tan Chau Station
From January to August, SDI-6 (Jan.-Jun.) showed the best matched up with historical
drought events, only with an exception occurred in 2002. SDI-6 (Feb.-Jul.) and (Mar.-Aug.)
also matched with most of the historical years; however, the failures neither occurred in 2002
nor appeared in 2003 (Figure 25).
In the results from April to November, SDI-6 showed the similar patterns and these all
reproduced severe or extreme droughts in 1998 and 2010. However, the underestimations
were found in 2004 and 2005, and failures were found in 2002, 2003 and 2012 (Figure 26).
The SDI for a time period of nine months and twelves-months showed the similar
patterns. The results defined extreme drought in 1998 and severe drought in 2010.
Unfortunately, these results also presented incorrect drought signals in the normal year of
2003 and 2012. Furthermore, the intensity and signal of drought in 2004-2005 and 2013 were
underestimated and not defined (Figures 27 and 28).
Figure 25: The SDI for six-month period during January to August of Tan Chau Station
-2.0
-1.5
-1.0
-0.5
0.0
0.5
1.0
1.5
2.0
2.5
3.0
1998
1999
2000
2001
2002
2003
2004
2005
2006
2007
2008
2009
2010
2011
2012
2013
2014
Str
eam
flow
Dro
ugh
t In
dex
year
severe drought moderate drought mild drought
SDI-3 (Apr.-Jun.) SDI-3 (May.-Jul.) SDI-3 (Jun.-Aug.)
Historical droughts
-2.0
-1.5
-1.0
-0.5
0.0
0.5
1.0
1.5
2.0
2.5
3.0
1998
1999
2000
2001
2002
2003
2004
2005
2006
2007
2008
2009
2010
2011
2012
2013
2014
Str
eam
flow
Dro
ug
ht In
dex
year
severe drought moderate drought mild drought
SDI-6 (Jan.-Jun.) SDI-6 (Feb.-Jul.) SDI-6 (Mar.-Aug.)
Historical droughts
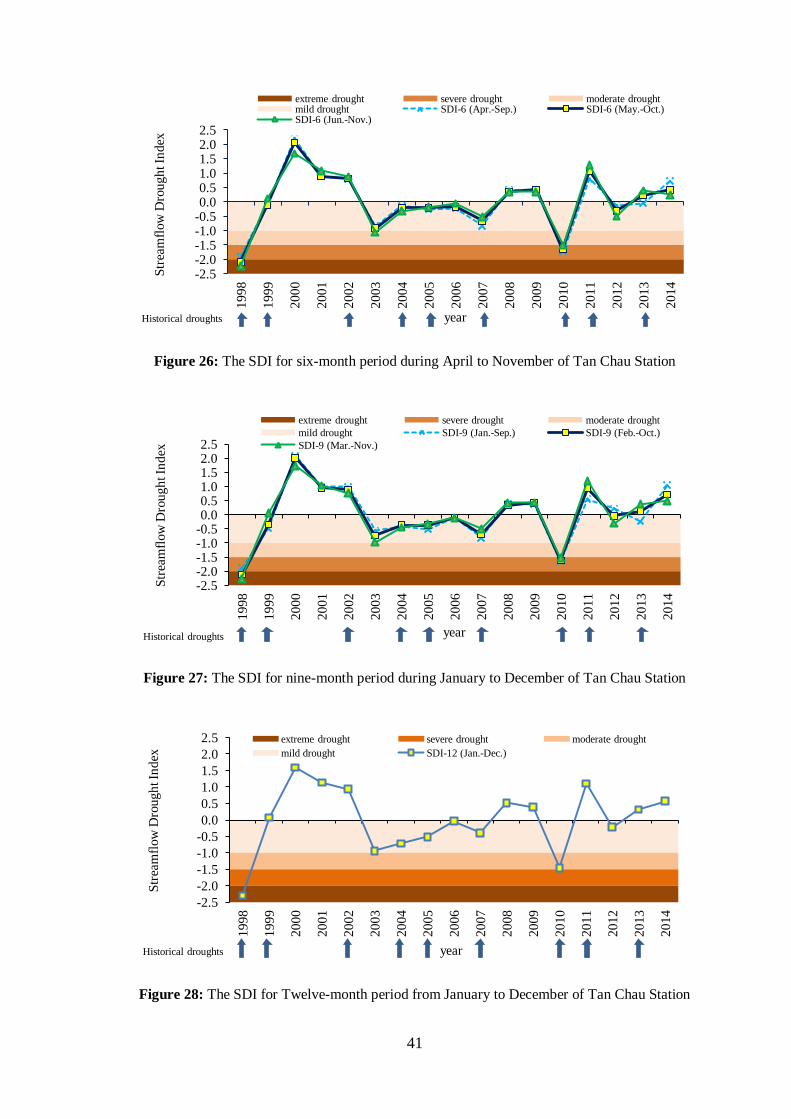
41
Figure 26: The SDI for six-month period during April to November of Tan Chau Station
Figure 27: The SDI for nine-month period during January to December of Tan Chau Station
Figure 28: The SDI for Twelve-month period from January to December of Tan Chau Station
-2.5 -2.0 -1.5 -1.0 -0.5 0.0 0.5 1.0 1.5 2.0 2.5
1998
1999
2000
2001
2002
2003
2004
2005
2006
2007
2008
2009
2010
2011
2012
2013
2014
Str
eam
flow
Dro
ugh
t In
dex
year
extreme drought severe drought moderate drought mild drought SDI-6 (Apr.-Sep.) SDI-6 (May.-Oct.) SDI-6 (Jun.-Nov.)
Historical droughts
-2.5 -2.0 -1.5 -1.0 -0.5 0.0 0.5 1.0 1.5 2.0 2.5
1998
19
99
20
00
20
01
20
02
20
03
2004
20
05
20
06
20
07
20
08
20
09
2010
20
11
20
12
20
13
20
14
Str
eam
flow
Dro
ug
ht In
dex
year
extreme drought severe drought moderate drought
mild drought SDI-9 (Jan.-Sep.) SDI-9 (Feb.-Oct.)
SDI-9 (Mar.-Nov.)
Historical droughts
-2.5
-2.0
-1.5
-1.0
-0.5
0.0
0.5
1.0
1.5
2.0
2.5
1998
1999
2000
2001
2002
2003
2004
2005
2006
2007
2008
2009
2010
2011
2012
2013
2014
Str
eam
flow
Dro
ugh
t In
dex
year
extreme drought severe drought moderate drought
mild drought SDI-12 (Jan.-Dec.)
Historical droughts
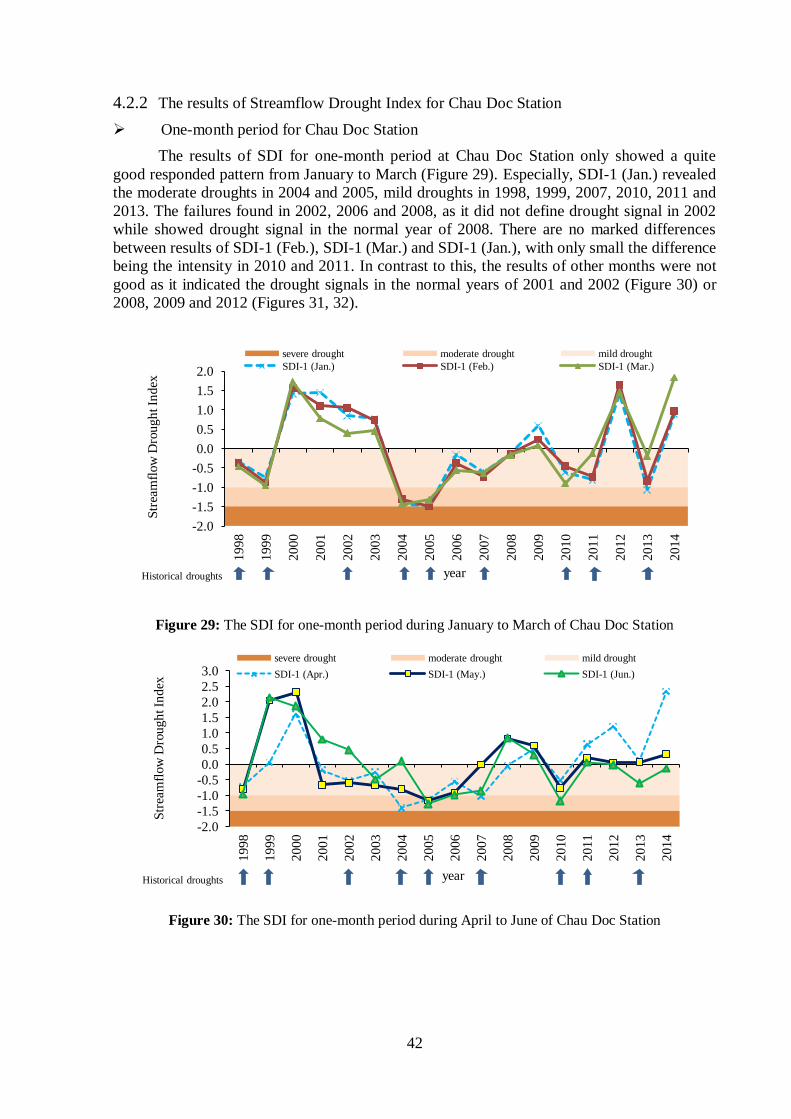
42
4.2.2 The results of Streamflow Drought Index for Chau Doc Station
One-month period for Chau Doc Station
The results of SDI for one-month period at Chau Doc Station only showed a quite
good responded pattern from January to March (Figure 29). Especially, SDI-1 (Jan.) revealed
the moderate droughts in 2004 and 2005, mild droughts in 1998, 1999, 2007, 2010, 2011 and
2013. The failures found in 2002, 2006 and 2008, as it did not define drought signal in 2002
while showed drought signal in the normal year of 2008. There are no marked differences
between results of SDI-1 (Feb.), SDI-1 (Mar.) and SDI-1 (Jan.), with only small the difference
being the intensity in 2010 and 2011. In contrast to this, the results of other months were not
good as it indicated the drought signals in the normal years of 2001 and 2002 (Figure 30) or
2008, 2009 and 2012 (Figures 31, 32).
Figure 29: The SDI for one-month period during January to March of Chau Doc Station
Figure 30: The SDI for one-month period during April to June of Chau Doc Station
-2.0
-1.5
-1.0
-0.5
0.0
0.5
1.0
1.5
2.0
19
98
19
99
2000
20
01
20
02
2003
20
04
20
05
20
06
20
07
20
08
20
09
20
10
20
11
20
12
20
13
20
14
Str
eam
flow
Dro
ugh
t In
dex
year
severe drought moderate drought mild drought
SDI-1 (Jan.) SDI-1 (Feb.) SDI-1 (Mar.)
Historical droughts
-2.0
-1.5
-1.0
-0.5
0.0
0.5
1.0
1.5
2.0
2.5
3.0
1998
1999
2000
2001
2002
2003
2004
2005
2006
2007
2008
2009
2010
2011
2012
2013
2014
Str
eam
flow
Dro
ug
ht In
dex
year
severe drought moderate drought mild drought
SDI-1 (Apr.) SDI-1 (May.) SDI-1 (Jun.)
Historical droughts

43
Figure 31: The SDI for one-month period during July to September of Chau Doc Station
Figure 32: The SDI for one-month period during October to December of Chau Doc Station
Three-month and six-month periods for Chau Doc Station
For the three months periods from January to May (Figure 33), SDI-3 (Jan.-Mar.) and
(Feb.-Apr.) had a good response to historical droughts, these indices showed the negative
values in drought years except for 2002. It presented moderate droughts in 2004 and 2005;
and mild droughts in 1998, 1999, 2006, 2007, 2010, 2011 and 2013. SDI-3 (Mar.-May.) could
not define the 2013 drought or showed drought signals in the normal years of 2001 and 2002.
SDI-3 (Apr.-Jun.), (May.-Jul.) and (Jun.-Aug.) neither correctly defined droughts in
2003 and 2012 nor described the drought years of 2002 and 2011 (Figure 34).
In the six-month period, it is similar to Tan Chau Station and SDI-6 (Jan.-Jun.) was the
best matched up with historical droughts (Figure 35). It presented the severe drought in 2005,
moderate drought in 2010, and mild droughts in 1998, 2004, 2007, 2011 and 2013. However,
it could not indicate the 1999 and 2002 droughts. Other periods revealed the moderate and
severe historical severe of 1998 and 2005 drought, but they showed the drought signals in the
normal years of 2003, 2006 and 2012. In addition, they could not state the historical 1999 and
2002 droughts (Figure 36).
-2.5 -2.0 -1.5 -1.0 -0.5 0.0 0.5 1.0 1.5 2.0 2.5 3.0
1998
1999
2000
2001
2002
2003
2004
2005
2006
2007
2008
2009
2010
2011
2012
2013
2014
Str
eam
flow
Dro
ug
ht In
dex
year
extreme drought severe drought moderate drought mild drought SDI-1 (Jul.) SDI-1 (Aug.) SDI-1 (Sep.)
Historical droughts
-2.5 -2.0 -1.5 -1.0 -0.5 0.0 0.5 1.0 1.5 2.0 2.5 3.0
19
98
19
99
20
00
2001
20
02
20
03
20
04
20
05
20
06
20
07
2008
20
09
20
10
20
11
20
12
20
13
20
14
Str
eam
flow
Dro
ug
ht In
dex
year
extreme drought severe drought moderate drought
mild drought SDI-1 (Oct.) SDI-1 (Nov.)
SDI-1 (Dec.)
Historical droughts
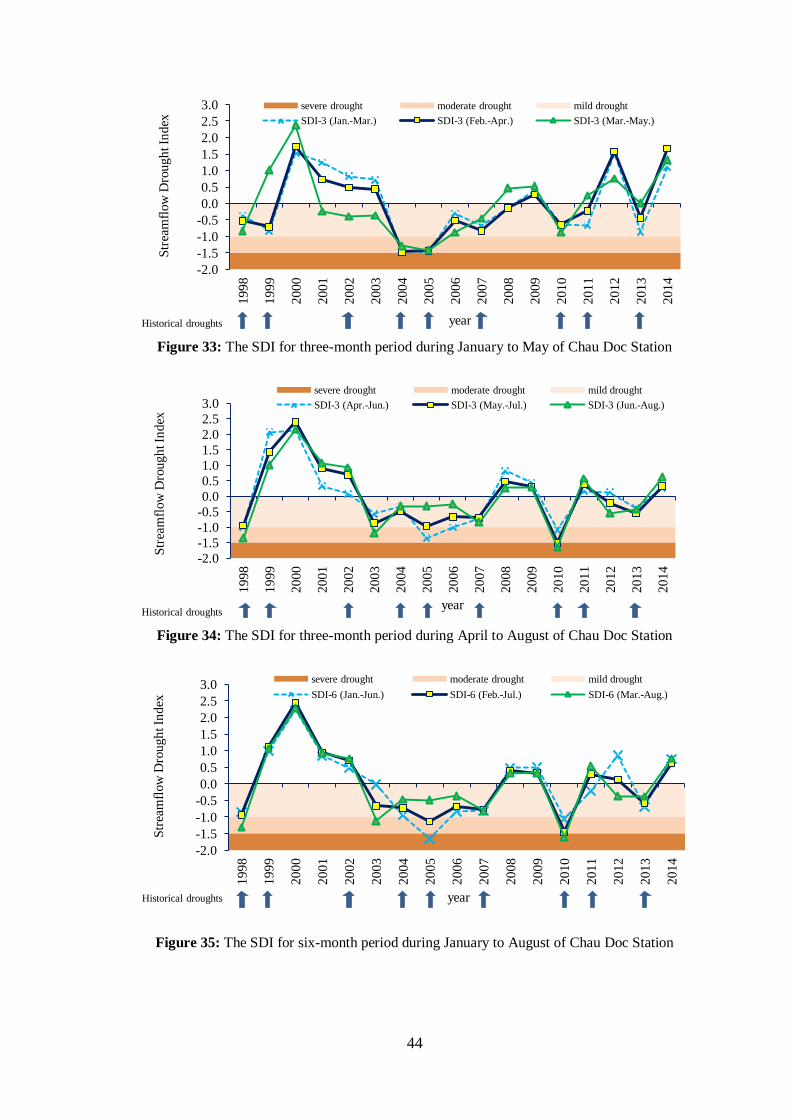
44
Figure 33: The SDI for three-month period during January to May of Chau Doc Station
Figure 34: The SDI for three-month period during April to August of Chau Doc Station
Figure 35: The SDI for six-month period during January to August of Chau Doc Station
-2.0
-1.5
-1.0
-0.5
0.0
0.5
1.0
1.5
2.0
2.5
3.0
1998
1999
2000
2001
2002
2003
2004
2005
2006
2007
2008
2009
2010
2011
2012
2013
2014
Str
eam
flow
Dro
ugh
t In
dex
year
severe drought moderate drought mild drought
SDI-3 (Jan.-Mar.) SDI-3 (Feb.-Apr.) SDI-3 (Mar.-May.)
Historical droughts
-2.0
-1.5
-1.0
-0.5
0.0
0.5
1.0
1.5
2.0
2.5
3.0
19
98
19
99
20
00
20
01
20
02
20
03
20
04
20
05
20
06
20
07
20
08
20
09
20
10
20
11
20
12
20
13
20
14
Str
eam
flow
Dro
ug
ht In
dex
year
severe drought moderate drought mild drought
SDI-3 (Apr.-Jun.) SDI-3 (May.-Jul.) SDI-3 (Jun.-Aug.)
Historical droughts
-2.0
-1.5
-1.0
-0.5
0.0
0.5
1.0
1.5
2.0
2.5
3.0
1998
1999
2000
2001
2002
2003
2004
2005
2006
2007
2008
2009
2010
2011
2012
2013
2014
Str
eam
flow
Dro
ug
ht In
dex
year
severe drought moderate drought mild drought
SDI-6 (Jan.-Jun.) SDI-6 (Feb.-Jul.) SDI-6 (Mar.-Aug.)
Historical droughts
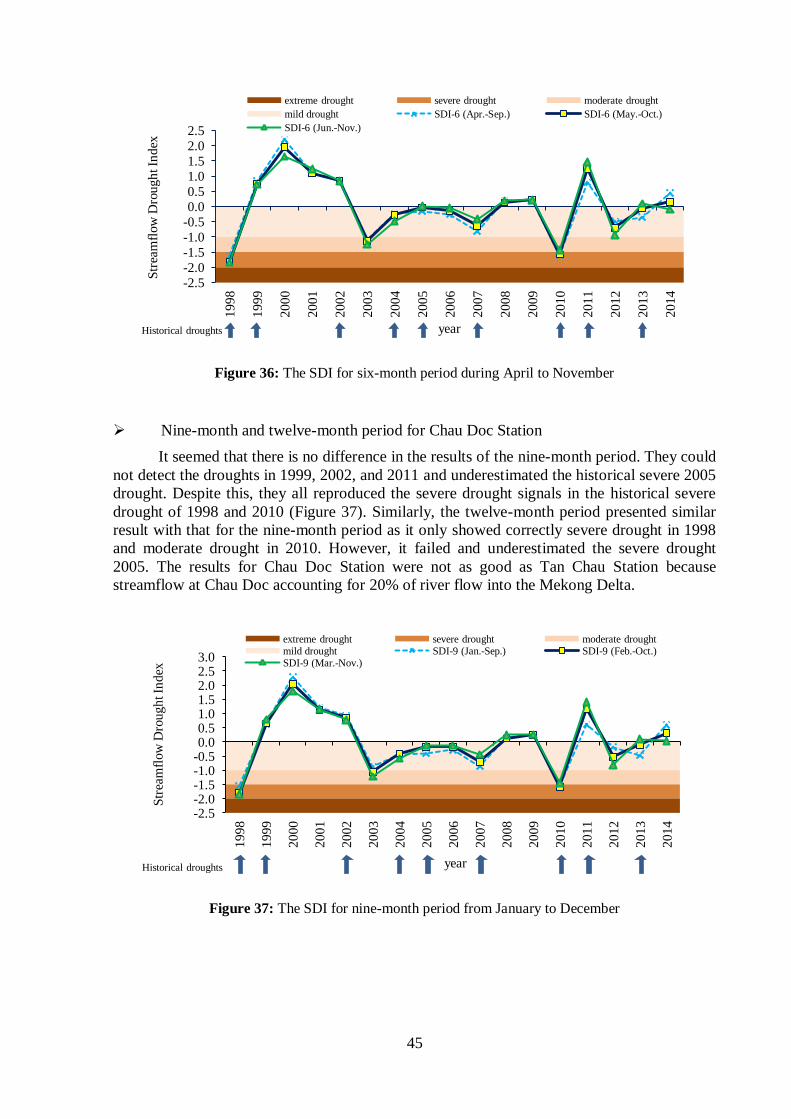
45
Figure 36: The SDI for six-month period during April to November
Nine-month and twelve-month period for Chau Doc Station
It seemed that there is no difference in the results of the nine-month period. They could
not detect the droughts in 1999, 2002, and 2011 and underestimated the historical severe 2005
drought. Despite this, they all reproduced the severe drought signals in the historical severe
drought of 1998 and 2010 (Figure 37). Similarly, the twelve-month period presented similar
result with that for the nine-month period as it only showed correctly severe drought in 1998
and moderate drought in 2010. However, it failed and underestimated the severe drought
2005. The results for Chau Doc Station were not as good as Tan Chau Station because
streamflow at Chau Doc accounting for 20% of river flow into the Mekong Delta.
Figure 37: The SDI for nine-month period from January to December
-2.5 -2.0 -1.5 -1.0 -0.5 0.0 0.5 1.0 1.5 2.0 2.5
1998
1999
2000
2001
2002
2003
2004
2005
2006
2007
2008
2009
2010
2011
2012
2013
2014
Str
eam
flow
Dro
ugh
t In
dex
year
extreme drought severe drought moderate drought
mild drought SDI-6 (Apr.-Sep.) SDI-6 (May.-Oct.)
SDI-6 (Jun.-Nov.)
Historical droughts
-2.5 -2.0 -1.5 -1.0 -0.5 0.0 0.5 1.0 1.5 2.0 2.5 3.0
1998
1999
2000
2001
2002
2003
2004
2005
2006
2007
2008
2009
2010
2011
2012
2013
2014
Str
eam
flow
Dro
ug
ht In
dex
year
extreme drought severe drought moderate drought mild drought SDI-9 (Jan.-Sep.) SDI-9 (Feb.-Oct.) SDI-9 (Mar.-Nov.)
Historical droughts
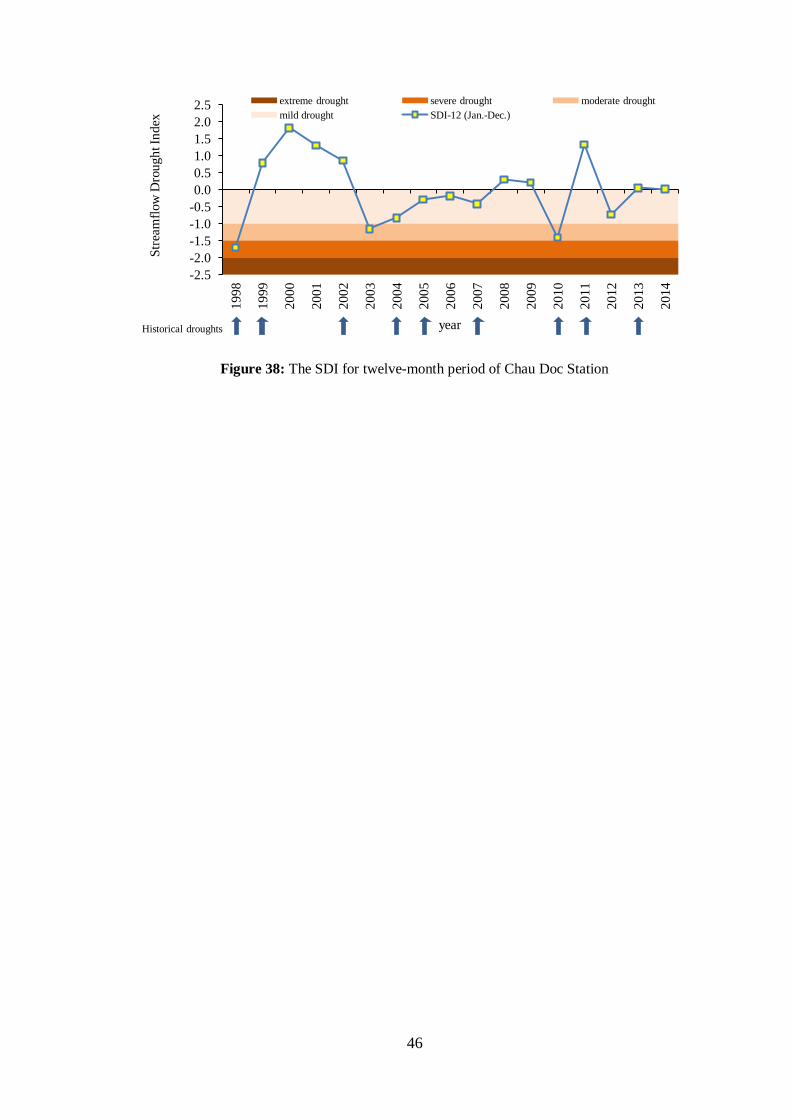
46
Figure 38: The SDI for twelve-month period of Chau Doc Station
-2.5
-2.0
-1.5
-1.0
-0.5
0.0
0.5
1.0
1.5
2.0
2.5
1998
1999
2000
2001
2002
2003
2004
2005
2006
2007
2008
2009
2010
2011
2012
2013
2014
Str
eam
flow
Dro
ugh
t In
dex
year
extreme drought severe drought moderate drought
mild drought SDI-12 (Jan.-Dec.)
Historical droughts
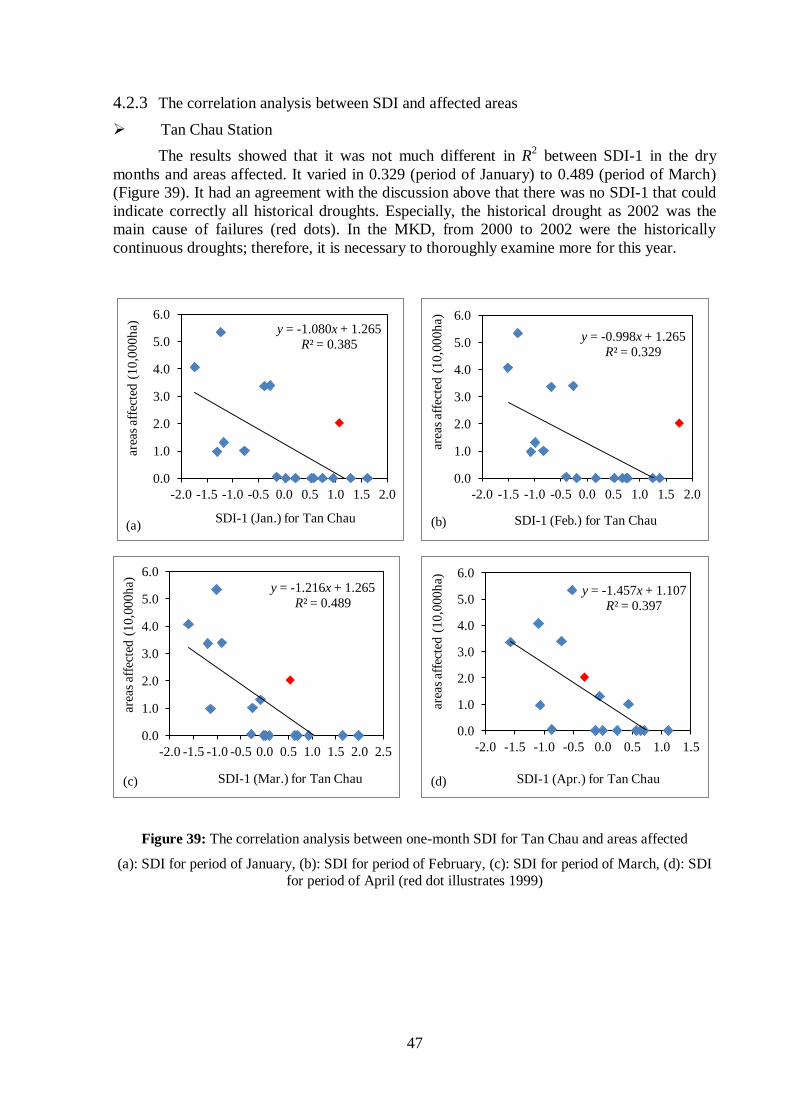
47
4.2.3 The correlation analysis between SDI and affected areas
Tan Chau Station
The results showed that it was not much different in R2 between SDI-1 in the dry
months and areas affected. It varied in 0.329 (period of January) to 0.489 (period of March)
(Figure 39). It had an agreement with the discussion above that there was no SDI-1 that could
indicate correctly all historical droughts. Especially, the historical drought as 2002 was the
main cause of failures (red dots). In the MKD, from 2000 to 2002 were the historically
continuous droughts; therefore, it is necessary to thoroughly examine more for this year.
Figure 39: The correlation analysis between one-month SDI for Tan Chau and areas affected
(a): SDI for period of January, (b): SDI for period of February, (c): SDI for period of March, (d): SDI
for period of April (red dot illustrates 1999)
y = -1.080x + 1.265
R² = 0.385
0.0
1.0
2.0
3.0
4.0
5.0
6.0
-2.0 -1.5 -1.0 -0.5 0.0 0.5 1.0 1.5 2.0
area
s af
fect
ed (
10,0
00h
a)
SDI-1 (Jan.) for Tan Chau (a)
y = -0.998x + 1.265
R² = 0.329
0.0
1.0
2.0
3.0
4.0
5.0
6.0
-2.0 -1.5 -1.0 -0.5 0.0 0.5 1.0 1.5 2.0
area
s af
fect
ed (
10,0
00h
a)
SDI-1 (Feb.) for Tan Chau (b)
y = -1.216x + 1.265
R² = 0.489
0.0
1.0
2.0
3.0
4.0
5.0
6.0
-2.0 -1.5 -1.0 -0.5 0.0 0.5 1.0 1.5 2.0 2.5
area
s af
fect
ed (
10
,00
0h
a)
SDI-1 (Mar.) for Tan Chau (c)
y = -1.457x + 1.107
R² = 0.397
0.0
1.0
2.0
3.0
4.0
5.0
6.0
-2.0 -1.5 -1.0 -0.5 0.0 0.5 1.0 1.5
area
s af
fect
ed (
10
,00
0h
a)
SDI-1 (Apr.) for Tan Chau (d)
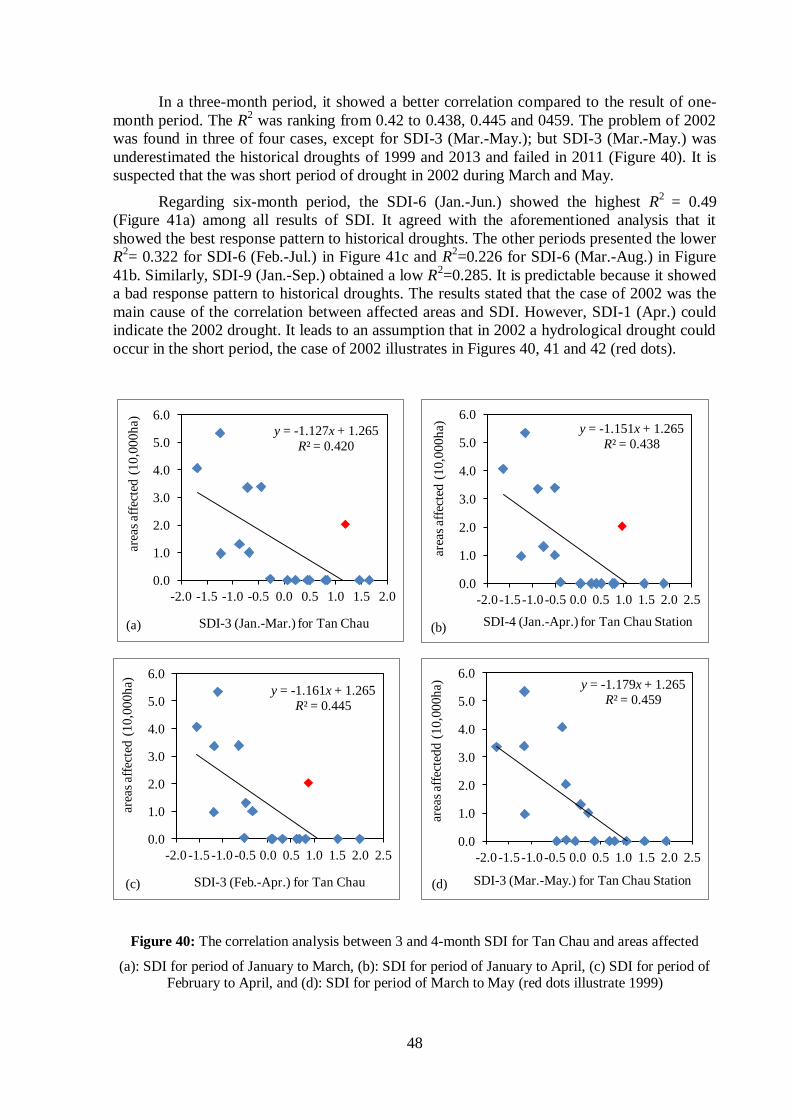
48
In a three-month period, it showed a better correlation compared to the result of one-
month period. The R2 was ranking from 0.42 to 0.438, 0.445 and 0459. The problem of 2002
was found in three of four cases, except for SDI-3 (Mar.-May.); but SDI-3 (Mar.-May.) was
underestimated the historical droughts of 1999 and 2013 and failed in 2011 (Figure 40). It is
suspected that the was short period of drought in 2002 during March and May.
Regarding six-month period, the SDI-6 (Jan.-Jun.) showed the highest R2
= 0.49
(Figure 41a) among all results of SDI. It agreed with the aforementioned analysis that it
showed the best response pattern to historical droughts. The other periods presented the lower
R2= 0.322 for SDI-6 (Feb.-Jul.) in Figure 41c and R
2=0.226 for SDI-6 (Mar.-Aug.) in Figure
41b. Similarly, SDI-9 (Jan.-Sep.) obtained a low R2=0.285. It is predictable because it showed
a bad response pattern to historical droughts. The results stated that the case of 2002 was the
main cause of the correlation between affected areas and SDI. However, SDI-1 (Apr.) could
indicate the 2002 drought. It leads to an assumption that in 2002 a hydrological drought could
occur in the short period, the case of 2002 illustrates in Figures 40, 41 and 42 (red dots).
Figure 40: The correlation analysis between 3 and 4-month SDI for Tan Chau and areas affected
(a): SDI for period of January to March, (b): SDI for period of January to April, (c) SDI for period of February to April, and (d): SDI for period of March to May (red dots illustrate 1999)
y = -1.127x + 1.265
R² = 0.420
0.0
1.0
2.0
3.0
4.0
5.0
6.0
-2.0 -1.5 -1.0 -0.5 0.0 0.5 1.0 1.5 2.0
area
s af
fect
ed (
10
,00
0h
a)
SDI-3 (Jan.-Mar.) for Tan Chau (a)
y = -1.151x + 1.265
R² = 0.438
0.0
1.0
2.0
3.0
4.0
5.0
6.0
-2.0 -1.5 -1.0 -0.5 0.0 0.5 1.0 1.5 2.0 2.5
area
s af
fect
ed (
10
,00
0h
a)
SDI-4 (Jan.-Apr.) for Tan Chau Station (b)
y = -1.161x + 1.265
R² = 0.445
0.0
1.0
2.0
3.0
4.0
5.0
6.0
-2.0 -1.5 -1.0 -0.5 0.0 0.5 1.0 1.5 2.0 2.5
area
s af
fect
ed (
10
,00
0h
a)
SDI-3 (Feb.-Apr.) for Tan Chau (c)
y = -1.179x + 1.265
R² = 0.459
0.0
1.0
2.0
3.0
4.0
5.0
6.0
-2.0 -1.5 -1.0 -0.5 0.0 0.5 1.0 1.5 2.0 2.5
area
s af
fect
edd
(1
0,0
00h
a)
SDI-3 (Mar.-May.) for Tan Chau Station (d)
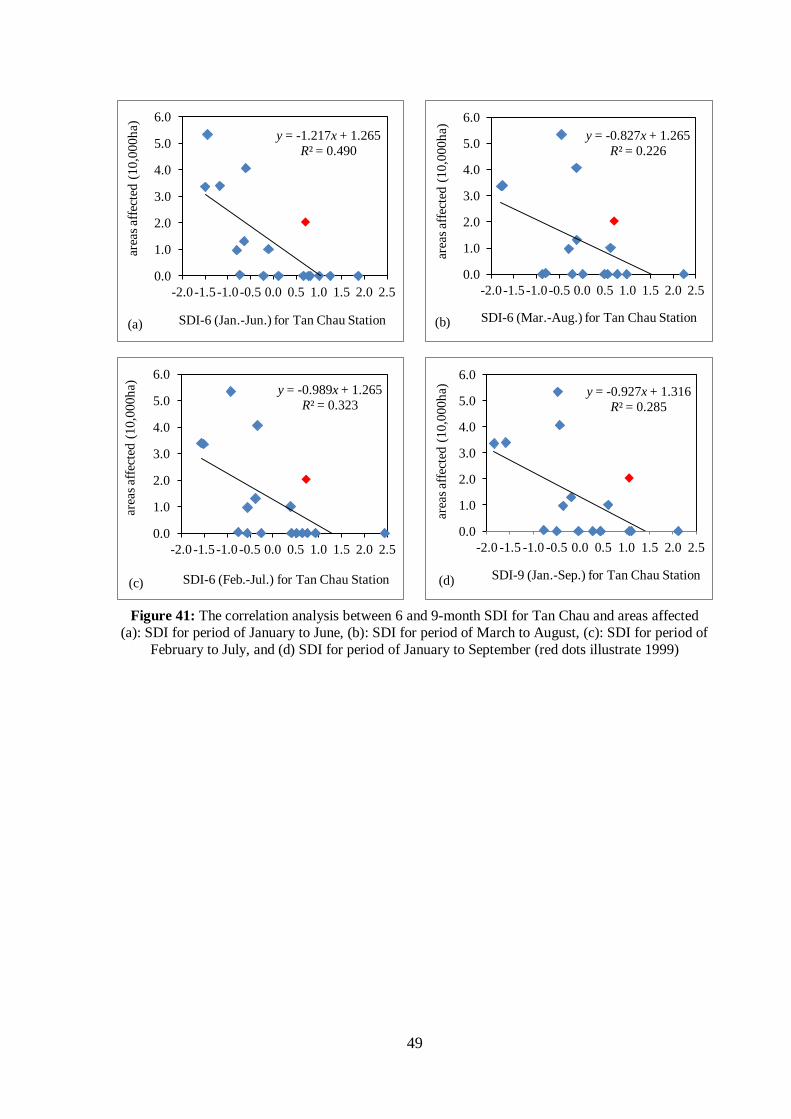
49
Figure 41: The correlation analysis between 6 and 9-month SDI for Tan Chau and areas affected
(a): SDI for period of January to June, (b): SDI for period of March to August, (c): SDI for period of
February to July, and (d) SDI for period of January to September (red dots illustrate 1999)
y = -1.217x + 1.265
R² = 0.490
0.0
1.0
2.0
3.0
4.0
5.0
6.0
-2.0 -1.5 -1.0 -0.5 0.0 0.5 1.0 1.5 2.0 2.5
area
s af
fect
ed (
10,0
00h
a)
SDI-6 (Jan.-Jun.) for Tan Chau Station (a)
y = -0.827x + 1.265
R² = 0.226
0.0
1.0
2.0
3.0
4.0
5.0
6.0
-2.0 -1.5 -1.0 -0.5 0.0 0.5 1.0 1.5 2.0 2.5
area
s af
fect
ed (
10,0
00h
a)
SDI-6 (Mar.-Aug.) for Tan Chau Station (b)
y = -0.989x + 1.265
R² = 0.323
0.0
1.0
2.0
3.0
4.0
5.0
6.0
-2.0 -1.5 -1.0 -0.5 0.0 0.5 1.0 1.5 2.0 2.5
area
s af
fect
ed (
10
,00
0h
a)
SDI-6 (Feb.-Jul.) for Tan Chau Station (c)
y = -0.927x + 1.316
R² = 0.285
0.0
1.0
2.0
3.0
4.0
5.0
6.0
-2.0 -1.5 -1.0 -0.5 0.0 0.5 1.0 1.5 2.0 2.5
area
s af
fect
ed (
10,0
00h
a)
SDI-9 (Jan.-Sep.) for Tan Chau Station (d)
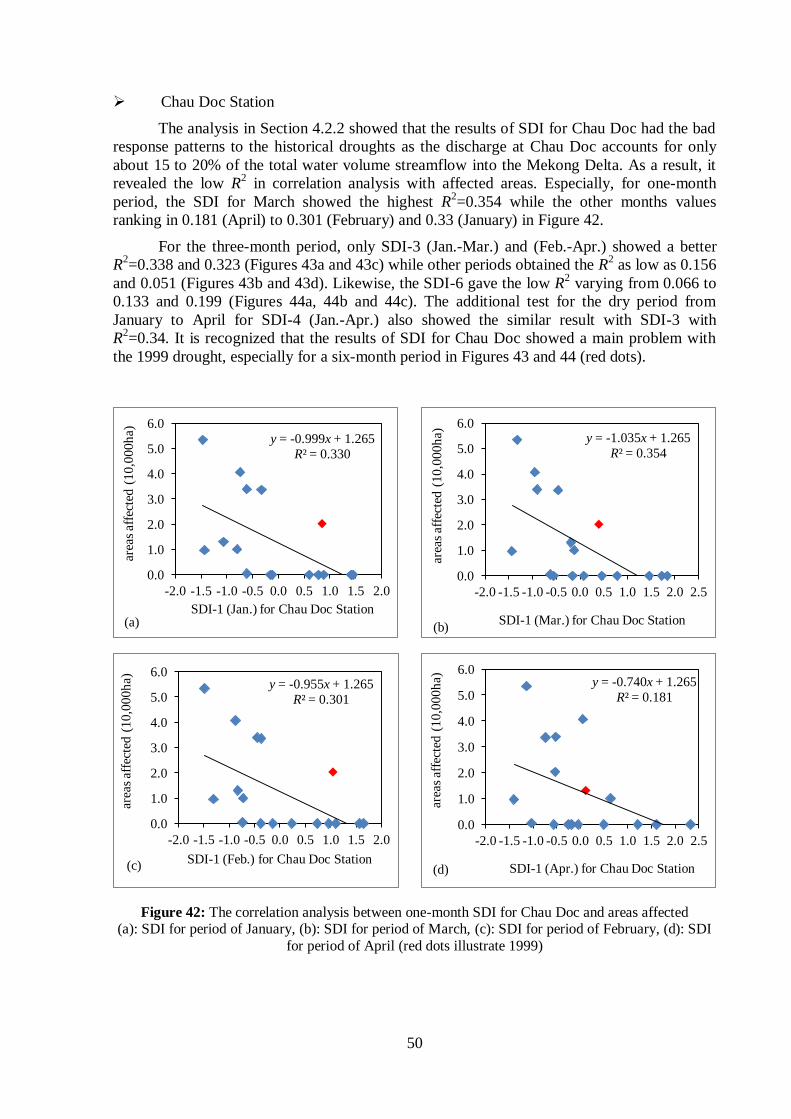
50
Chau Doc Station
The analysis in Section 4.2.2 showed that the results of SDI for Chau Doc had the bad
response patterns to the historical droughts as the discharge at Chau Doc accounts for only
about 15 to 20% of the total water volume streamflow into the Mekong Delta. As a result, it
revealed the low R2 in correlation analysis with affected areas. Especially, for one-month
period, the SDI for March showed the highest R2=0.354 while the other months values
ranking in 0.181 (April) to 0.301 (February) and 0.33 (January) in Figure 42.
For the three-month period, only SDI-3 (Jan.-Mar.) and (Feb.-Apr.) showed a better
R2=0.338 and 0.323 (Figures 43a and 43c) while other periods obtained the R
2 as low as 0.156
and 0.051 (Figures 43b and 43d). Likewise, the SDI-6 gave the low R2 varying from 0.066 to
0.133 and 0.199 (Figures 44a, 44b and 44c). The additional test for the dry period from
January to April for SDI-4 (Jan.-Apr.) also showed the similar result with SDI-3 with
R2=0.34. It is recognized that the results of SDI for Chau Doc showed a main problem with
the 1999 drought, especially for a six-month period in Figures 43 and 44 (red dots).
Figure 42: The correlation analysis between one-month SDI for Chau Doc and areas affected (a): SDI for period of January, (b): SDI for period of March, (c): SDI for period of February, (d): SDI
for period of April (red dots illustrate 1999)
y = -0.999x + 1.265
R² = 0.330
0.0
1.0
2.0
3.0
4.0
5.0
6.0
-2.0 -1.5 -1.0 -0.5 0.0 0.5 1.0 1.5 2.0
area
s af
fect
ed (
10
,00
0h
a)
SDI-1 (Jan.) for Chau Doc Station (a)
y = -1.035x + 1.265
R² = 0.354
0.0
1.0
2.0
3.0
4.0
5.0
6.0
-2.0 -1.5 -1.0 -0.5 0.0 0.5 1.0 1.5 2.0 2.5
area
s af
fect
ed (
10
,00
0h
a)
SDI-1 (Mar.) for Chau Doc Station (b)
y = -0.955x + 1.265
R² = 0.301
0.0
1.0
2.0
3.0
4.0
5.0
6.0
-2.0 -1.5 -1.0 -0.5 0.0 0.5 1.0 1.5 2.0
area
s af
fect
ed (
10
,00
0h
a)
SDI-1 (Feb.) for Chau Doc Station (c)
y = -0.740x + 1.265
R² = 0.181
0.0
1.0
2.0
3.0
4.0
5.0
6.0
-2.0 -1.5 -1.0 -0.5 0.0 0.5 1.0 1.5 2.0 2.5
area
s af
fect
ed (
10
,00
0h
a)
SDI-1 (Apr.) for Chau Doc Station (d)
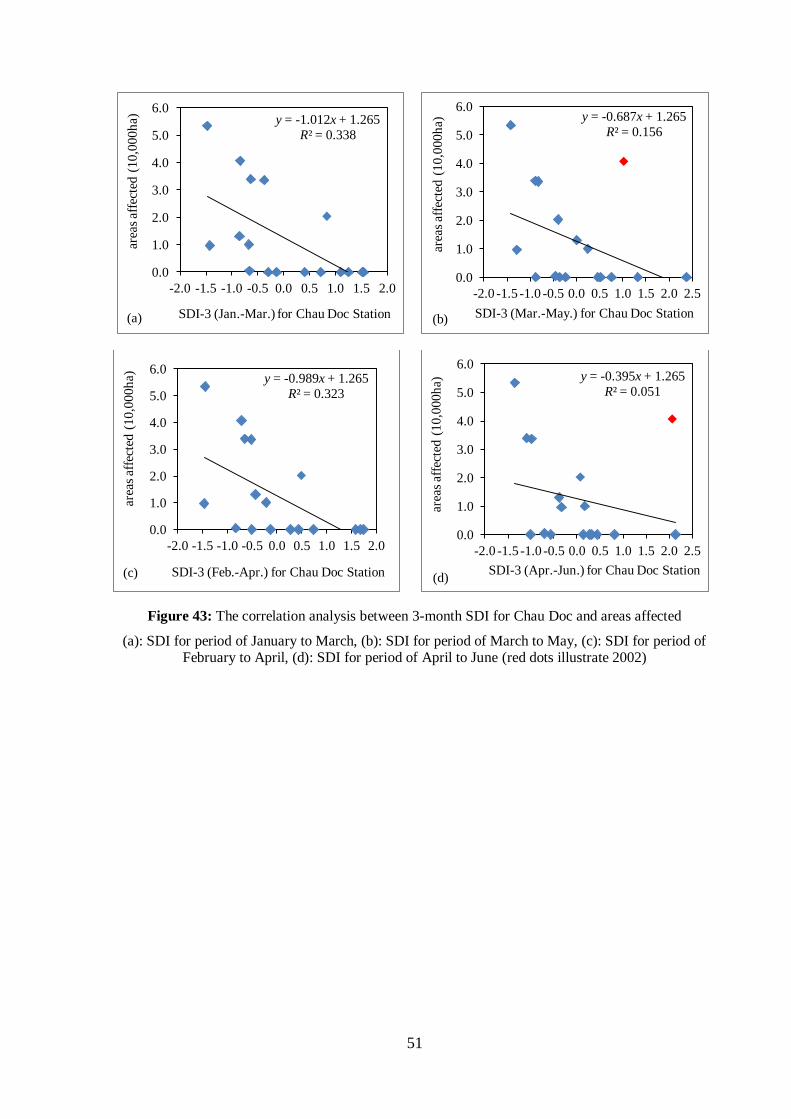
51
Figure 43: The correlation analysis between 3-month SDI for Chau Doc and areas affected
(a): SDI for period of January to March, (b): SDI for period of March to May, (c): SDI for period of February to April, (d): SDI for period of April to June (red dots illustrate 2002)
y = -1.012x + 1.265
R² = 0.338
0.0
1.0
2.0
3.0
4.0
5.0
6.0
-2.0 -1.5 -1.0 -0.5 0.0 0.5 1.0 1.5 2.0
area
s af
fect
ed (
10,0
00h
a)
SDI-3 (Jan.-Mar.) for Chau Doc Station (a)
y = -0.687x + 1.265
R² = 0.156
0.0
1.0
2.0
3.0
4.0
5.0
6.0
-2.0 -1.5 -1.0 -0.5 0.0 0.5 1.0 1.5 2.0 2.5
area
s af
fect
ed (
10,0
00h
a)
SDI-3 (Mar.-May.) for Chau Doc Station (b)
y = -0.989x + 1.265
R² = 0.323
0.0
1.0
2.0
3.0
4.0
5.0
6.0
-2.0 -1.5 -1.0 -0.5 0.0 0.5 1.0 1.5 2.0
area
s af
fect
ed (
10
,00
0h
a)
SDI-3 (Feb.-Apr.) for Chau Doc Station (c)
y = -0.395x + 1.265
R² = 0.051
0.0
1.0
2.0
3.0
4.0
5.0
6.0
-2.0 -1.5 -1.0 -0.5 0.0 0.5 1.0 1.5 2.0 2.5
area
s af
fect
ed (
10,0
00h
a)
SDI-3 (Apr.-Jun.) for Chau Doc Station (d)
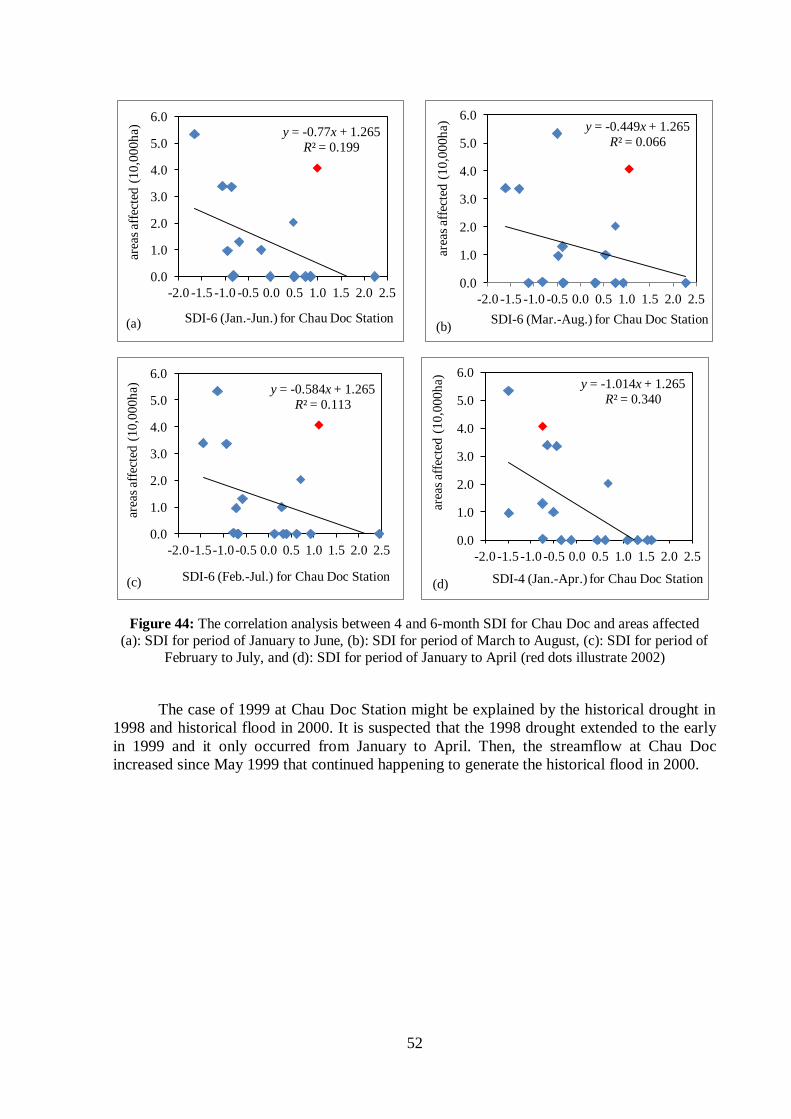
52
Figure 44: The correlation analysis between 4 and 6-month SDI for Chau Doc and areas affected
(a): SDI for period of January to June, (b): SDI for period of March to August, (c): SDI for period of
February to July, and (d): SDI for period of January to April (red dots illustrate 2002)
The case of 1999 at Chau Doc Station might be explained by the historical drought in
1998 and historical flood in 2000. It is suspected that the 1998 drought extended to the early
in 1999 and it only occurred from January to April. Then, the streamflow at Chau Doc
increased since May 1999 that continued happening to generate the historical flood in 2000.
y = -0.77x + 1.265
R² = 0.199
0.0
1.0
2.0
3.0
4.0
5.0
6.0
-2.0 -1.5 -1.0 -0.5 0.0 0.5 1.0 1.5 2.0 2.5
area
s af
fect
ed (
10,0
00h
a)
SDI-6 (Jan.-Jun.) for Chau Doc Station (a)
y = -0.449x + 1.265
R² = 0.066
0.0
1.0
2.0
3.0
4.0
5.0
6.0
-2.0 -1.5 -1.0 -0.5 0.0 0.5 1.0 1.5 2.0 2.5
area
s af
fect
ed (
10
,00
0h
a)
SDI-6 (Mar.-Aug.) for Chau Doc Station (b)
y = -0.584x + 1.265
R² = 0.113
0.0
1.0
2.0
3.0
4.0
5.0
6.0
-2.0 -1.5 -1.0 -0.5 0.0 0.5 1.0 1.5 2.0 2.5
area
s af
fect
ed (
10,0
00h
a)
SDI-6 (Feb.-Jul.) for Chau Doc Station (c)
y = -1.014x + 1.265
R² = 0.340
0.0
1.0
2.0
3.0
4.0
5.0
6.0
-2.0 -1.5 -1.0 -0.5 0.0 0.5 1.0 1.5 2.0 2.5
area
s af
fect
ed (
10,0
00h
a)
SDI-4 (Jan.-Apr.) for Chau Doc Station (d)
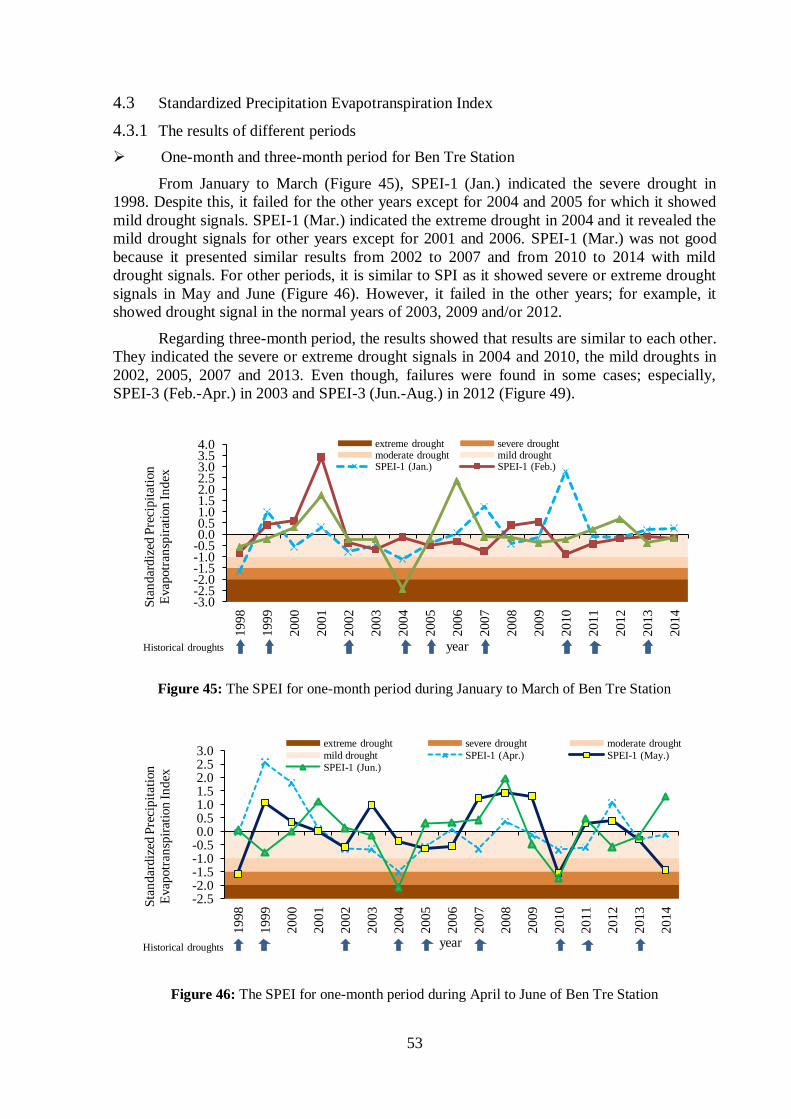
53
4.3 Standardized Precipitation Evapotranspiration Index
4.3.1 The results of different periods
One-month and three-month period for Ben Tre Station
From January to March (Figure 45), SPEI-1 (Jan.) indicated the severe drought in
1998. Despite this, it failed for the other years except for 2004 and 2005 for which it showed
mild drought signals. SPEI-1 (Mar.) indicated the extreme drought in 2004 and it revealed the
mild drought signals for other years except for 2001 and 2006. SPEI-1 (Mar.) was not good
because it presented similar results from 2002 to 2007 and from 2010 to 2014 with mild
drought signals. For other periods, it is similar to SPI as it showed severe or extreme drought
signals in May and June (Figure 46). However, it failed in the other years; for example, it
showed drought signal in the normal years of 2003, 2009 and/or 2012.
Regarding three-month period, the results showed that results are similar to each other.
They indicated the severe or extreme drought signals in 2004 and 2010, the mild droughts in
2002, 2005, 2007 and 2013. Even though, failures were found in some cases; especially,
SPEI-3 (Feb.-Apr.) in 2003 and SPEI-3 (Jun.-Aug.) in 2012 (Figure 49).
Figure 45: The SPEI for one-month period during January to March of Ben Tre Station
Figure 46: The SPEI for one-month period during April to June of Ben Tre Station
-3.0 -2.5 -2.0 -1.5 -1.0 -0.5 0.0 0.5 1.0 1.5 2.0 2.5 3.0 3.5 4.0
19
98
19
99
20
00
20
01
20
02
20
03
20
04
20
05
2006
20
07
20
08
20
09
2010
20
11
20
12
20
13
2014 S
tan
dar
diz
ed P
reci
pit
atio
n
Evap
otr
ansp
irat
ion
In
dex
year
extreme drought severe drought moderate drought mild drought SPEI-1 (Jan.) SPEI-1 (Feb.)
Historical droughts
-2.5 -2.0 -1.5 -1.0 -0.5 0.0 0.5 1.0 1.5 2.0 2.5 3.0
1998
1999
2000
2001
2002
2003
2004
2005
2006
2007
2008
2009
2010
2011
2012
2013
2014
Sta
ndar
diz
ed P
reci
pit
atio
n
Evap
otr
ansp
irat
ion
In
dex
year
extreme drought severe drought moderate drought
mild drought SPEI-1 (Apr.) SPEI-1 (May.)
SPEI-1 (Jun.)
Historical droughts
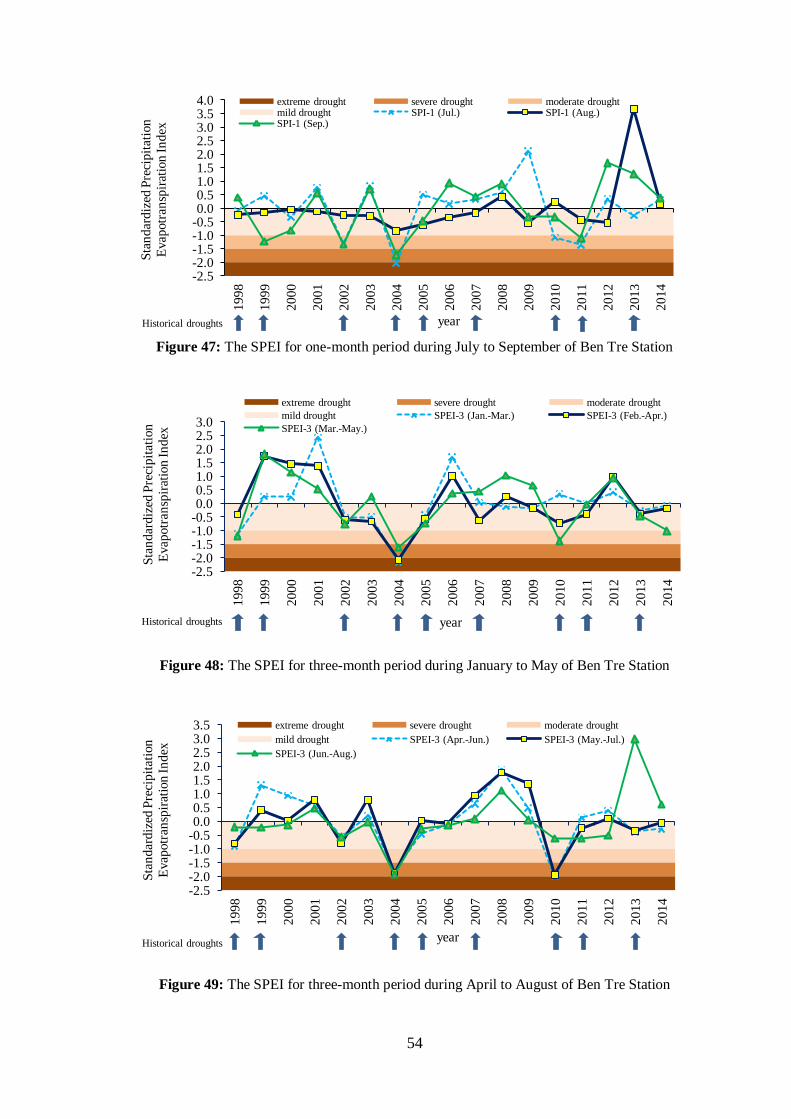
54
Figure 47: The SPEI for one-month period during July to September of Ben Tre Station
Figure 48: The SPEI for three-month period during January to May of Ben Tre Station
Figure 49: The SPEI for three-month period during April to August of Ben Tre Station
-2.5 -2.0 -1.5 -1.0 -0.5 0.0 0.5 1.0 1.5 2.0 2.5 3.0 3.5 4.0
1998
1999
2000
2001
2002
2003
2004
2005
2006
2007
2008
2009
2010
2011
2012
2013
2014
Sta
ndar
diz
ed P
reci
pit
atio
n
Evap
otr
ansp
irat
ion
In
dex
year
extreme drought severe drought moderate drought mild drought SPI-1 (Jul.) SPI-1 (Aug.) SPI-1 (Sep.)
Historical droughts
-2.5 -2.0 -1.5 -1.0 -0.5 0.0 0.5 1.0 1.5 2.0 2.5 3.0
19
98
19
99
20
00
20
01
20
02
20
03
20
04
20
05
20
06
20
07
20
08
20
09
2010
20
11
20
12
2013
20
14
Sta
nd
ard
ized
Pre
cip
itat
ion
Evap
otr
ansp
irat
ion
In
dex
year
extreme drought severe drought moderate drought
mild drought SPEI-3 (Jan.-Mar.) SPEI-3 (Feb.-Apr.)
SPEI-3 (Mar.-May.)
Historical droughts
-2.5 -2.0 -1.5 -1.0 -0.5 0.0 0.5 1.0 1.5 2.0 2.5 3.0 3.5
1998
1999
2000
2001
2002
2003
2004
2005
2006
2007
2008
2009
2010
2011
2012
2013
2014
Sta
ndar
diz
ed P
reci
pit
atio
n
Evap
otr
ansp
irat
ion
In
dex
year
extreme drought severe drought moderate drought
mild drought SPEI-3 (Apr.-Jun.) SPEI-3 (May.-Jul.)
SPEI-3 (Jun.-Aug.)
Historical droughts
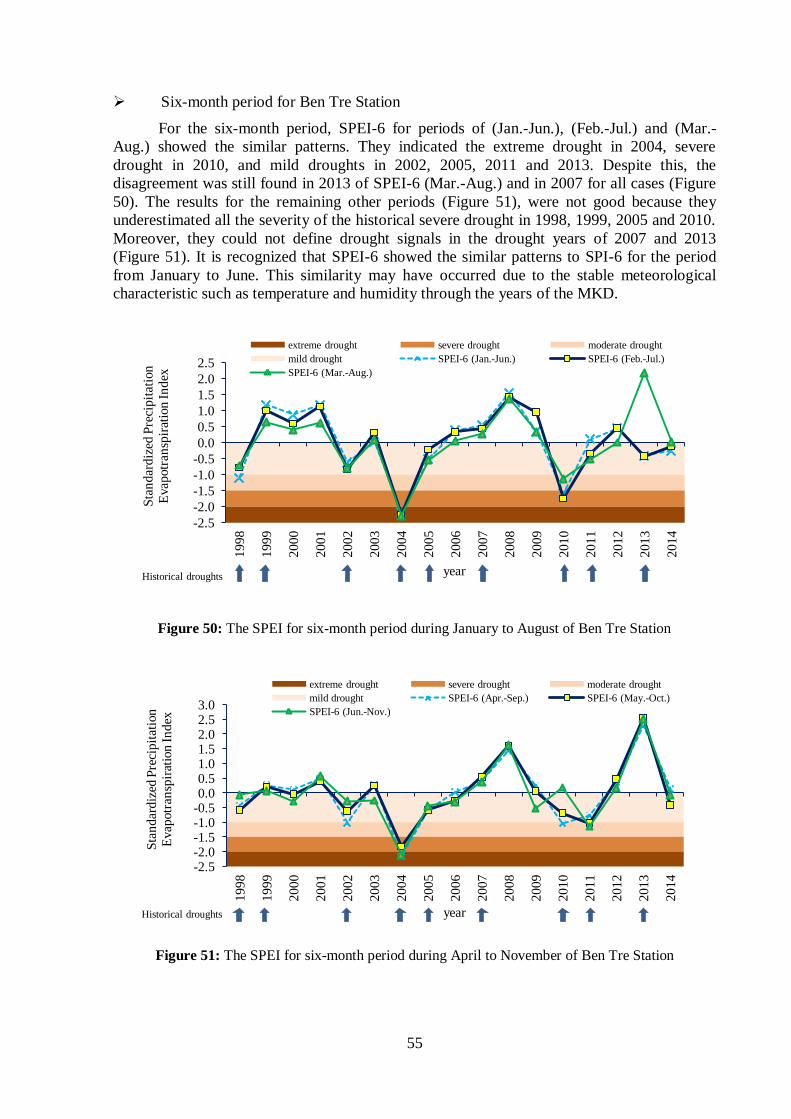
55
Six-month period for Ben Tre Station
For the six-month period, SPEI-6 for periods of (Jan.-Jun.), (Feb.-Jul.) and (Mar.-
Aug.) showed the similar patterns. They indicated the extreme drought in 2004, severe
drought in 2010, and mild droughts in 2002, 2005, 2011 and 2013. Despite this, the
disagreement was still found in 2013 of SPEI-6 (Mar.-Aug.) and in 2007 for all cases (Figure
50). The results for the remaining other periods (Figure 51), were not good because they
underestimated all the severity of the historical severe drought in 1998, 1999, 2005 and 2010.
Moreover, they could not define drought signals in the drought years of 2007 and 2013
(Figure 51). It is recognized that SPEI-6 showed the similar patterns to SPI-6 for the period
from January to June. This similarity may have occurred due to the stable meteorological
characteristic such as temperature and humidity through the years of the MKD.
Figure 50: The SPEI for six-month period during January to August of Ben Tre Station
Figure 51: The SPEI for six-month period during April to November of Ben Tre Station
-2.5
-2.0
-1.5
-1.0
-0.5
0.0
0.5
1.0
1.5
2.0
2.5
19
98
1999
20
00
2001
20
02
20
03
20
04
20
05
20
06
20
07
20
08
20
09
20
10
20
11
20
12
20
13
20
14
Sta
nd
ard
ized
Pre
cipit
atio
n
Evap
otr
ansp
irat
ion
In
dex
year
extreme drought severe drought moderate drought
mild drought SPEI-6 (Jan.-Jun.) SPEI-6 (Feb.-Jul.)
SPEI-6 (Mar.-Aug.)
Historical droughts
-2.5 -2.0 -1.5 -1.0 -0.5 0.0 0.5 1.0 1.5 2.0 2.5 3.0
1998
1999
2000
2001
2002
2003
2004
2005
2006
2007
2008
2009
2010
2011
2012
2013
2014
Sta
ndar
diz
ed P
reci
pit
atio
n
Evap
otr
ansp
irat
ion
In
dex
year
extreme drought severe drought moderate drought
mild drought SPEI-6 (Apr.-Sep.) SPEI-6 (May.-Oct.)
SPEI-6 (Jun.-Nov.)
Historical droughts
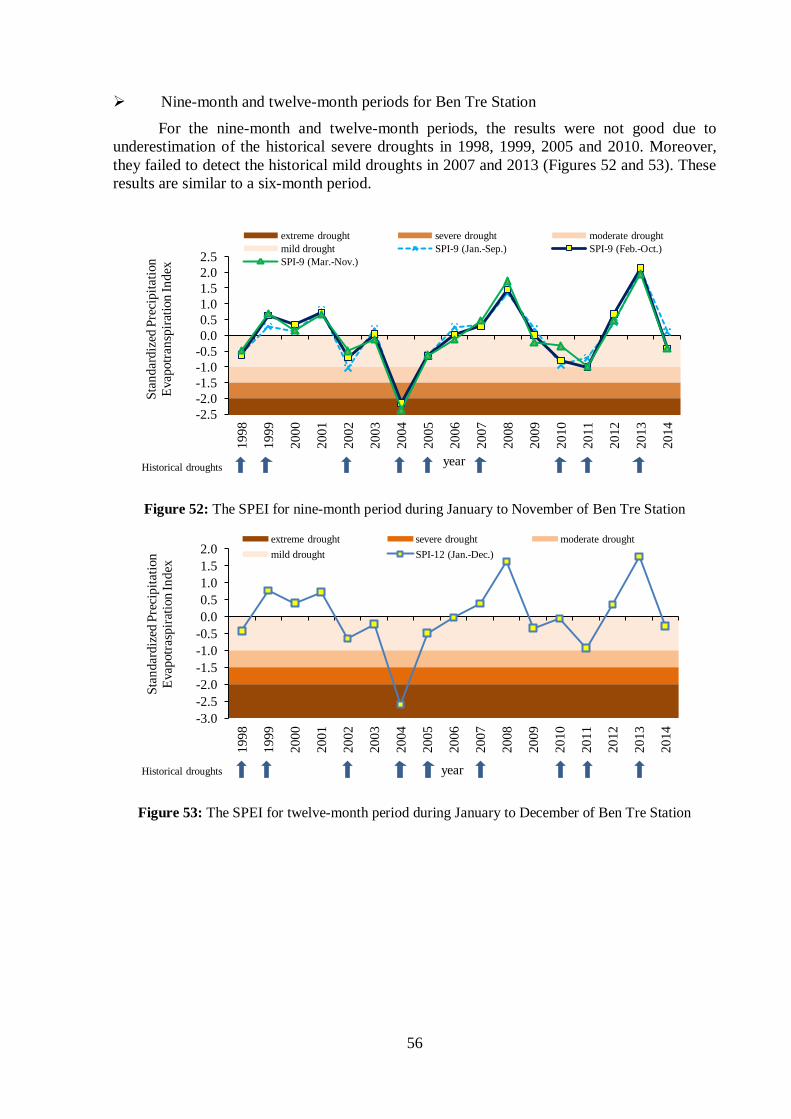
56
Nine-month and twelve-month periods for Ben Tre Station
For the nine-month and twelve-month periods, the results were not good due to
underestimation of the historical severe droughts in 1998, 1999, 2005 and 2010. Moreover,
they failed to detect the historical mild droughts in 2007 and 2013 (Figures 52 and 53). These
results are similar to a six-month period.
Figure 52: The SPEI for nine-month period during January to November of Ben Tre Station
Figure 53: The SPEI for twelve-month period during January to December of Ben Tre Station
-2.5
-2.0
-1.5
-1.0
-0.5
0.0
0.5
1.0
1.5
2.0
2.5
1998
1999
2000
2001
2002
2003
2004
2005
2006
2007
2008
2009
2010
2011
2012
2013
2014
Sta
ndar
diz
ed P
reci
pit
atio
n
Evap
otr
ansp
irat
ion
In
dex
year
extreme drought severe drought moderate drought
mild drought SPI-9 (Jan.-Sep.) SPI-9 (Feb.-Oct.)
SPI-9 (Mar.-Nov.)
Historical droughts
-3.0
-2.5
-2.0
-1.5
-1.0
-0.5
0.0
0.5
1.0
1.5
2.0
19
98
1999
20
00
20
01
20
02
20
03
20
04
20
05
20
06
20
07
20
08
20
09
20
10
20
11
2012
20
13
20
14
Sta
nd
ard
ized
Pre
cip
itat
ion
Evap
otr
asp
irat
ion
In
dex
year
extreme drought severe drought moderate drought
mild drought SPI-12 (Jan.-Dec.)
Historical droughts
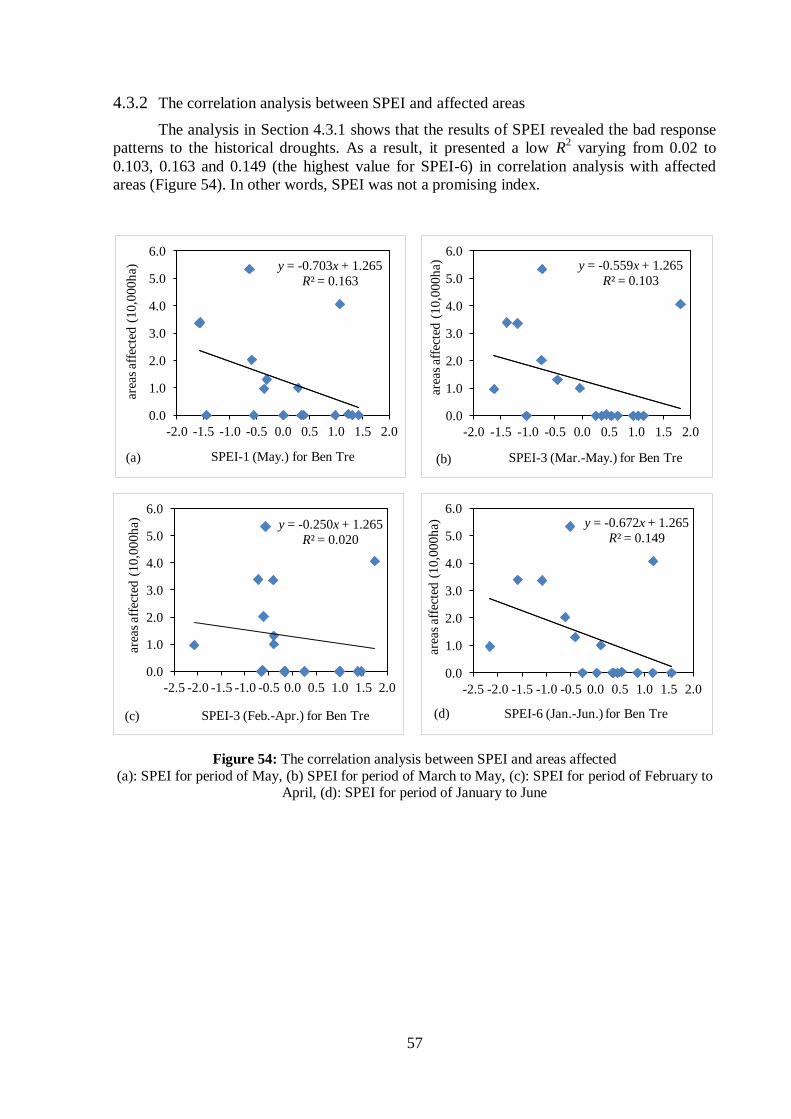
57
4.3.2 The correlation analysis between SPEI and affected areas
The analysis in Section 4.3.1 shows that the results of SPEI revealed the bad response
patterns to the historical droughts. As a result, it presented a low R2 varying from 0.02 to
0.103, 0.163 and 0.149 (the highest value for SPEI-6) in correlation analysis with affected
areas (Figure 54). In other words, SPEI was not a promising index.
Figure 54: The correlation analysis between SPEI and areas affected
(a): SPEI for period of May, (b) SPEI for period of March to May, (c): SPEI for period of February to April, (d): SPEI for period of January to June
y = -0.703x + 1.265
R² = 0.163
0.0
1.0
2.0
3.0
4.0
5.0
6.0
-2.0 -1.5 -1.0 -0.5 0.0 0.5 1.0 1.5 2.0
area
s af
fect
ed (
10,0
00h
a)
SPEI-1 (May.) for Ben Tre (a)
y = -0.559x + 1.265
R² = 0.103
0.0
1.0
2.0
3.0
4.0
5.0
6.0
-2.0 -1.5 -1.0 -0.5 0.0 0.5 1.0 1.5 2.0 ar
eas
affe
cted
(10,0
00h
a)
SPEI-3 (Mar.-May.) for Ben Tre (b)
y = -0.250x + 1.265
R² = 0.020
0.0
1.0
2.0
3.0
4.0
5.0
6.0
-2.5 -2.0 -1.5 -1.0 -0.5 0.0 0.5 1.0 1.5 2.0
area
s af
fect
ed (
10
,00
0h
a)
SPEI-3 (Feb.-Apr.) for Ben Tre (c)
y = -0.672x + 1.265
R² = 0.149
0.0
1.0
2.0
3.0
4.0
5.0
6.0
-2.5 -2.0 -1.5 -1.0 -0.5 0.0 0.5 1.0 1.5 2.0
area
s af
fect
ed (
10
,00
0h
a)
SPEI-6 (Jan.-Jun.) for Ben Tre (d)

58
4.4 Salinity Index and the correlation analysis with Streamflow Drought Index
4.4.1 Salinity Index
A Salinity Index as the number of hours recording saline concentration higher than 1
ppt or 4 ppt (hereafter referred to as S1 and S4) in April or in March and April clearly showed
the agreement with drought events (2004-2005, 2007, 2010, 2011, 2013 and 2016), especially
in March and in March to April (Figures 55b and 55c).
Figure 55: Salinity Index for Huong My Station
(a): S1 in April, (b): S4 in March, and (c): S4 in March and April.
0
40
80
120
160
200 2003
2004
2005
2006
2007
2008
2009
2010
2011
2012
2013
2014
2015
2016
Sal
init
y in
dic
ator
(S1)
in
Apri
l at
Huon
g M
y S
tati
on
(hours
)
Year (a)
historical drough years
0
40
80
120
160
200
20
03
20
04
2005
20
06
20
07
20
08
20
09
20
10
20
11
20
12
20
13
20
14
2015
20
16
Sal
init
y in
dic
ator
(S4
) in
Mar
ch a
t H
uon
g M
y S
tati
on
(hou
rs)
Year (b)
0
50
100
150
200
250
2003
2004
2005
2006
2007
2008
2009
2010
2011
2012
2013
2014
2015
2016
Sal
init
y in
dic
ator
(S4
) (M
ar-
Apr)
at
Huon
g M
y S
tati
on
(hours
)
Year (c)

59
4.4.2 The correlation analysis between Salinity Index and promising indices
The Salinity Index showed clear evidence of the historical droughts. On the other hand,
the SDI showed good response patterns to droughts. Moreover, the salinity intrusion reaching
its peak synchronizes with the drought in March or April. Therefore, this study conducted the
analysis between Salinity Index and SDI to figure out an index for the drought early warning.
The correlation analysis showed the high correlation between SDI for dry periods and
Salinity Index. Salinity Index 1 ppt (S1) and SDI-3 (Jan.-Mar.) presented R2=0.755 (Figure
56a) while SDI-1 (Mar.) and SDI-2 (Feb.-Mar.) revealed R2=0.817 and 0.788, respectively
(Figures 56b and 56c). Especially, R2 was higher in the case of S4, SDI-2 (Jan.-Feb.) and SDI-
1 (Feb.) respectively produced R2=0.844 and 0.816 (Figures 56d and 56e). Huong My is just
one of saline observation stations in Ben Tre. To examine thoroughly, the salinity of other
stations of Son Doc and Tra Vinh Stations were tested. Figure 57 shows the locations of these
stations.
Figure 56: The correlation between SDI for Tan Chau and Salinity Index at Huong My
(a): SDI-3 (January to March) and S1 in April, (b): SDI-1 (January) and S1 in April, (c): SDI-2
(February to March) and S1 in April, (d): SDI-2 (January-February) and S4 in March, and (e) SDI-1 (February) and S4 in March.
y = -0.025x + 3.111
R² = 0.755
-1.5
-1.0
-0.5
0.0
0.5
1.0
1.5
2.0
2.5
0 50 100 150 200 SD
I-3
(Ja
n-M
ar) fo
r T
an C
hau
hours recording saline concentration ≥ 1 ppt in April at Huong My Station (hours) (a)
y = -0.026x + 3.276
R² = 0.817
-1.5
-1.0
-0.5
0.0
0.5
1.0
1.5
2.0
2.5
0 50 100 150 200
SD
I-1
(M
ar)
for
Tan
Ch
au
hours recording saline concentration ≥ 1 ppt in April at Huong My Station (hours) (b)
y = -0.025x + 3.088
R² = 0.788
-1.5
-1.0
-0.5
0.0
0.5
1.0
1.5
2.0
0 50 100 150 200 SD
I-2 (
Feb
-Mar
) fo
r T
an C
hau
hours recording saline concentration ≥1 ppt in April at Huong My Station (hours) (c)
y = -0.021x + 0.994
R² = 0.844
-1.5
-1.0
-0.5
0.0
0.5
1.0
1.5
2.0
0 20 40 60 80 100 120
SD
I-2 (
Jan
-Feb
) fo
r T
an C
hau
hours recording saline concentration ≥ 4 ppt in March at Huong My Station (hours) (d)
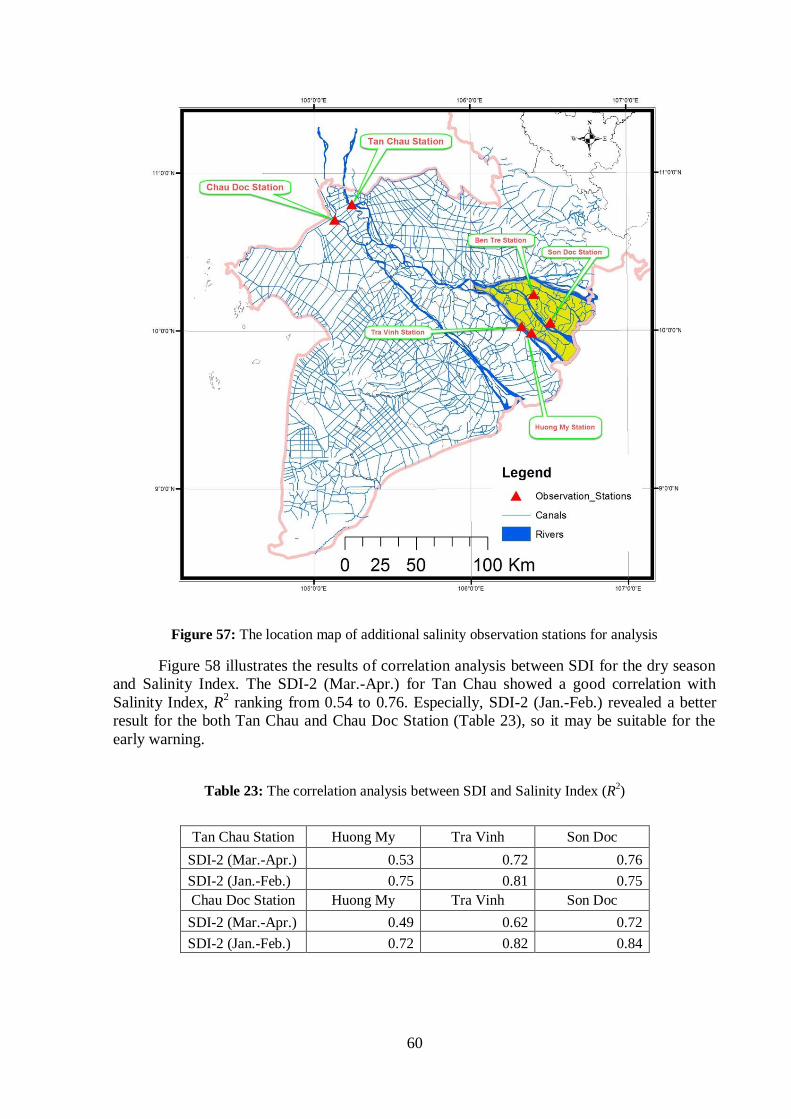
60
Figure 57: The location map of additional salinity observation stations for analysis
Figure 58 illustrates the results of correlation analysis between SDI for the dry season
and Salinity Index. The SDI-2 (Mar.-Apr.) for Tan Chau showed a good correlation with
Salinity Index, R2 ranking from 0.54 to 0.76. Especially, SDI-2 (Jan.-Feb.) revealed a better
result for the both Tan Chau and Chau Doc Station (Table 23), so it may be suitable for the
early warning.
Table 23: The correlation analysis between SDI and Salinity Index (R2)
Tan Chau Station Huong My Tra Vinh Son Doc
SDI-2 (Mar.-Apr.) 0.53 0.72 0.76
SDI-2 (Jan.-Feb.) 0.75 0.81 0.75
Chau Doc Station Huong My Tra Vinh Son Doc
SDI-2 (Mar.-Apr.) 0.49 0.62 0.72
SDI-2 (Jan.-Feb.) 0.72 0.82 0.84
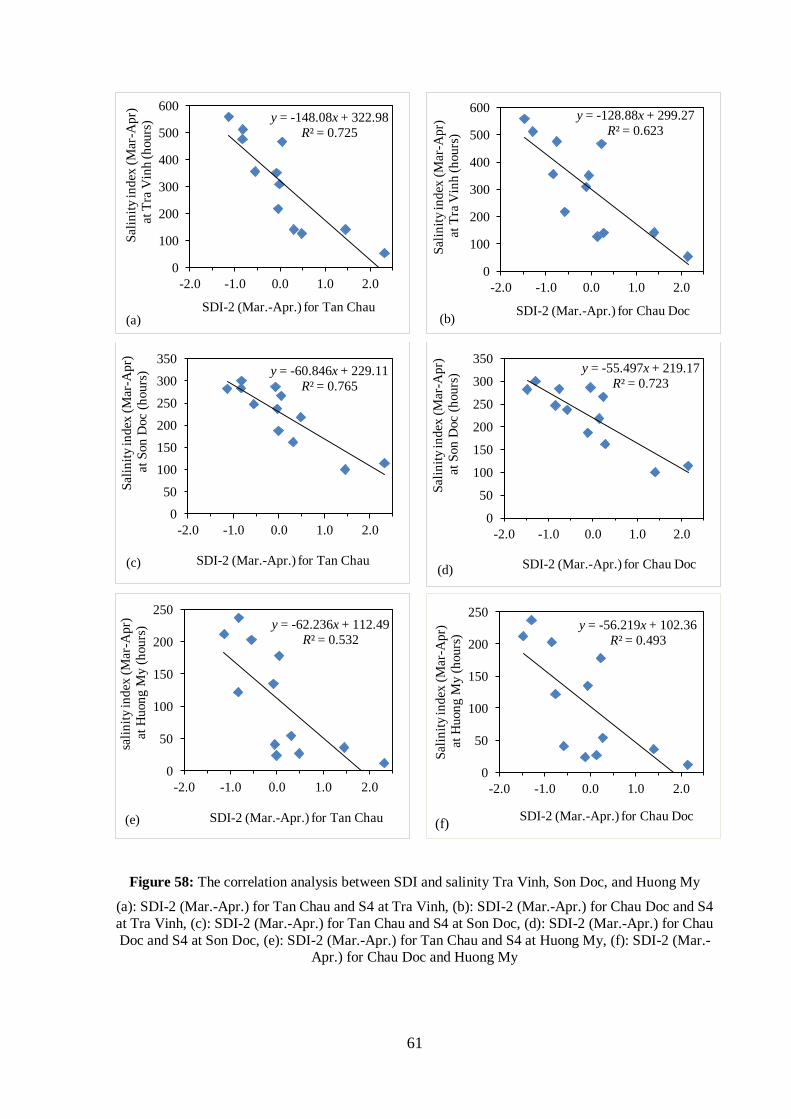
61
Figure 58: The correlation analysis between SDI and salinity Tra Vinh, Son Doc, and Huong My
(a): SDI-2 (Mar.-Apr.) for Tan Chau and S4 at Tra Vinh, (b): SDI-2 (Mar.-Apr.) for Chau Doc and S4
at Tra Vinh, (c): SDI-2 (Mar.-Apr.) for Tan Chau and S4 at Son Doc, (d): SDI-2 (Mar.-Apr.) for Chau
Doc and S4 at Son Doc, (e): SDI-2 (Mar.-Apr.) for Tan Chau and S4 at Huong My, (f): SDI-2 (Mar.-Apr.) for Chau Doc and Huong My
y = -148.08x + 322.98
R² = 0.725
0
100
200
300
400
500
600
-2.0 -1.0 0.0 1.0 2.0
Sal
init
y in
dex
(M
ar-A
pr)
at
Tra
Vin
h (h
ours
)
SDI-2 (Mar.-Apr.) for Tan Chau (a)
y = -128.88x + 299.27
R² = 0.623
0
100
200
300
400
500
600
-2.0 -1.0 0.0 1.0 2.0
Sal
init
y in
dex
(M
ar-A
pr)
at
Tra
Vin
h (
hours
)
SDI-2 (Mar.-Apr.) for Chau Doc (b)
y = -60.846x + 229.11
R² = 0.765
0
50
100
150
200
250
300
350
-2.0 -1.0 0.0 1.0 2.0
Sal
init
y in
dex
(M
ar-A
pr)
at
Son
Doc
(hours
)
SDI-2 (Mar.-Apr.) for Tan Chau (c)
y = -55.497x + 219.17
R² = 0.723
0
50
100
150
200
250
300
350
-2.0 -1.0 0.0 1.0 2.0
Sal
init
y in
dex
(M
ar-A
pr)
at
Son
Doc
(hours
)
SDI-2 (Mar.-Apr.) for Chau Doc (d)
y = -62.236x + 112.49
R² = 0.532
0
50
100
150
200
250
-2.0 -1.0 0.0 1.0 2.0
sali
nit
y in
dex
(M
ar-A
pr)
at
Hu
on
g M
y (h
ou
rs)
SDI-2 (Mar.-Apr.) for Tan Chau (e)
y = -56.219x + 102.36
R² = 0.493
0
50
100
150
200
250
-2.0 -1.0 0.0 1.0 2.0
Sal
init
y in
dex
(M
ar-A
pr)
at
Hu
on
g M
y (h
ou
rs)
SDI-2 (Mar.-Apr.) for Chau Doc (f)

62
4.5 Discussion
Standardized Precipitation Index
The SPI-6 (Jan.-Jun.) showed the best responded patterns to severe drought events
such as 1998, 2002, 2005, 2010 and 2013. The correlation analysis between SPI-6 (Feb.-Jul.)
and areas affected revealed the highest R2 of 0.283 while SPI-6 (Jan.-Jun.) only showed low
R2 value of 0.265. The other periods had smaller R
2 in comparison with SPI-6 (Jan.-Jun.). The
results showed that rainfall in the dry season has a certain role on the severe droughts. In other
words, the level of rainfall in May, June and July partially contribute to the intensity of
droughts. Hence, the drought monitoring for Ben Tre should consider this point.
Table 24: The correlation analysis between SPI and areas affected (R2)
Index SPI-3 SPI-3 SPI-3 SPI-6 SPI-6 SPI-9
Periods Jan.-Mar. Feb.-Apr. Mar.-May. Jan.-Jun. Feb.-Jul. Jan.-Sep.
R2 0.067 0.028 0.148 0.265 0.283 0.211
Standardized Precipitation Evapotranspiration Index
SPEI-6, especially SPEI-6 (Jan.-Jun.) had quite good response patterns to severe
droughts of 1998, 2004 and 2010. It had a similar trend to SPI. It is understandable because
the temperature, humidity, sunshine, and wind speed in the MKD are stable during a year.
However, SPEI showed the low R2 in the correlation analysis with areas affected by droughts.
The highest R2 was obtained by SPEI-6 as 0.149 while the other periods showed very low R
2
values. Therefore, SPEI was not a good index to detect droughts.
Table 25: The correlation analysis between SPEI and areas affected (R2)
Index SPEI-3 SPEI-3 SPEI-3 SPEI-6 SPEI-6 SPEI-9
Periods Jan.-Mar. Feb.-Apr. Mar.-May. Jan.-Jun. Feb.-Jul. Jan.-Sep.
R2 0.071 0.02 0.103 0.149 0.137 0.116
Streamflow Drought Index and Salinity Index
Salinity Index clearly showed the evidence of droughts, especially in Son Doc Station
that located in Ham Luong River running through Ben Tre Province. In the severe drought
events of 2004-2005, 2010 and 2013, the maximum salinity was always higher than 15 ppt in
both March and April. Additionally, the number of hours recording salinity higher than 4 ppt
in both March and April at Son Doc Station are significantly higher than normal years.
The correlation analysis between SDI-2 (Jan.-Feb.) and (Mar.-Apr.), and Salinity Index
(Mar.-Apr.) revealed a good correlation (Table 23). Overall, SDI-2 (Jan.-Feb.) is suitable for
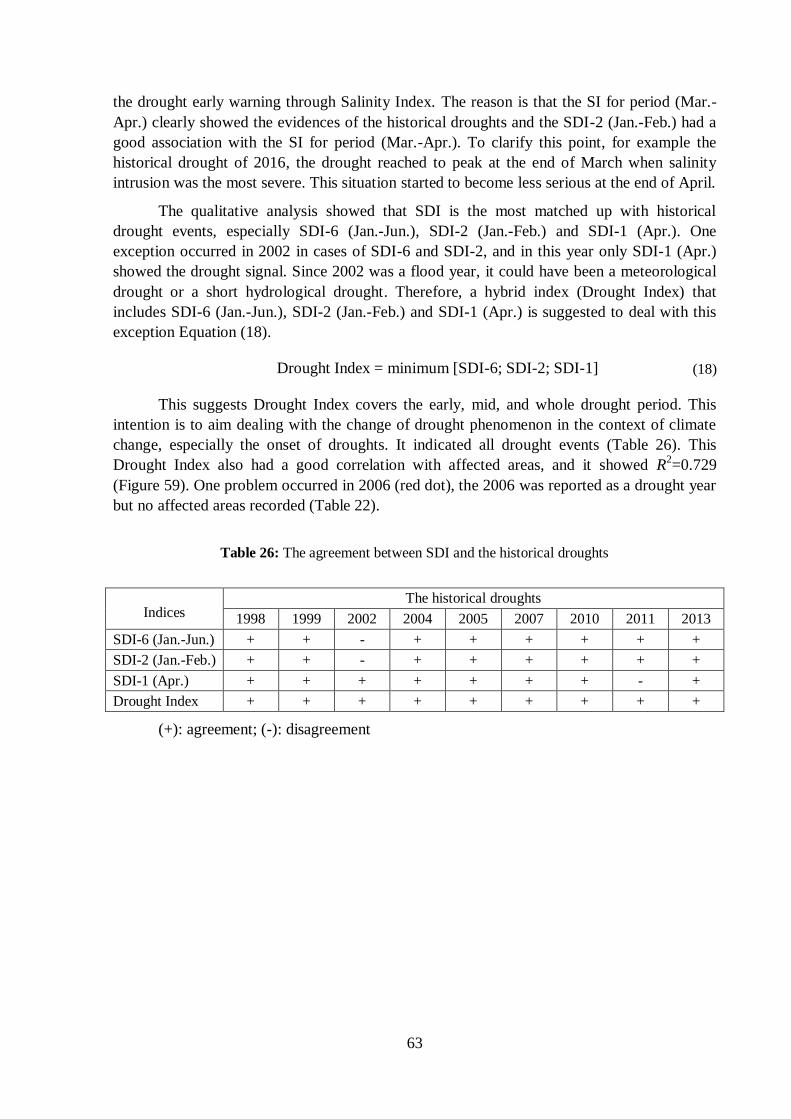
63
the drought early warning through Salinity Index. The reason is that the SI for period (Mar.-
Apr.) clearly showed the evidences of the historical droughts and the SDI-2 (Jan.-Feb.) had a
good association with the SI for period (Mar.-Apr.). To clarify this point, for example the
historical drought of 2016, the drought reached to peak at the end of March when salinity
intrusion was the most severe. This situation started to become less serious at the end of April.
The qualitative analysis showed that SDI is the most matched up with historical
drought events, especially SDI-6 (Jan.-Jun.), SDI-2 (Jan.-Feb.) and SDI-1 (Apr.). One
exception occurred in 2002 in cases of SDI-6 and SDI-2, and in this year only SDI-1 (Apr.)
showed the drought signal. Since 2002 was a flood year, it could have been a meteorological
drought or a short hydrological drought. Therefore, a hybrid index (Drought Index) that
includes SDI-6 (Jan.-Jun.), SDI-2 (Jan.-Feb.) and SDI-1 (Apr.) is suggested to deal with this
exception Equation (18).
Drought Index = minimum [SDI-6; SDI-2; SDI-1] (18)
This suggests Drought Index covers the early, mid, and whole drought period. This
intention is to aim dealing with the change of drought phenomenon in the context of climate
change, especially the onset of droughts. It indicated all drought events (Table 26). This
Drought Index also had a good correlation with affected areas, and it showed R2=0.729
(Figure 59). One problem occurred in 2006 (red dot), the 2006 was reported as a drought year
but no affected areas recorded (Table 22).
Table 26: The agreement between SDI and the historical droughts
Indices The historical droughts
1998 1999 2002 2004 2005 2007 2010 2011 2013
SDI-6 (Jan.-Jun.) + + - + + + + + +
SDI-2 (Jan.-Feb.) + + - + + + + + +
SDI-1 (Apr.) + + + + + + + - +
Drought Index + + + + + + + + +
(+): agreement; (-): disagreement
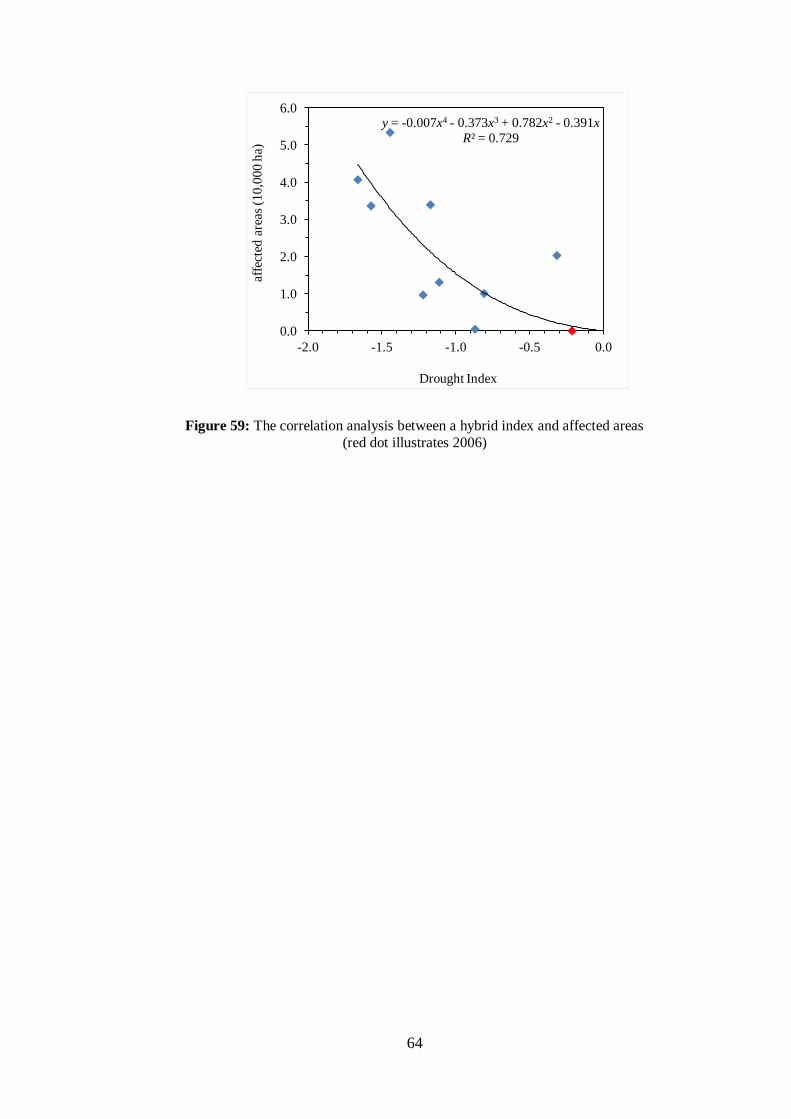
64
Figure 59: The correlation analysis between a hybrid index and affected areas
(red dot illustrates 2006)
y = -0.007x4 - 0.373x3 + 0.782x2 - 0.391x
R² = 0.729
0.0
1.0
2.0
3.0
4.0
5.0
6.0
-2.0 -1.5 -1.0 -0.5 0.0
affe
cted
are
as (
10,0
00 h
a)
Drought Index
65
5 Conclusions and recommendations
5.1 Conclusions
It was aforementioned in Section 1.3.4 and Section 2.5.1 that the drought in the MKD
occurs in the dry season (January to June) associated with salinity intrusion. The process of
drought in the MDK starts when the low level of rainfall in the upstream in the early dry
season. Then, it results in the reduction in streamflow at Tan Chau and Chau Doc Station. At
the same time, the low water level period happens in the downstream of MKD. In addition,
there is no rain and the water demand is the significantly high in this time. Consequently, the
salinity intrusion occurs and inverts its role in affecting and aggravating back to the drought
phenomenon. The importance of this point is to classify the role of each factor to droughts in
the MKD. There has been confusion over the role and contribution of streamflow and salinity
intrusion to droughts in the MKD. This clarification is a basic premise of the selection
drought indices for monitoring and early warning.
In this study, the results from calculation were tested by the severity of the historical
droughts. There is no clear classification standard of drought in the MDK; hence, the severity
of the historical droughts was classified based on the affected areas and references. Based on
the affected areas in Table 22 and references, this study classified the severity of historical
droughts into two types. The severe drought years were in 1998, 1999, 2005, 2010 and 2016,
and the mild drought years in 2002, 2004, 2007, 2011 and 2013. This step is important
because it could lead to the unintended biases on the evaluation and selection of indices.
The monthly rainfall data of Ben Tre Station was used to calculate SPI for different
period and time scales. Specifically, it was calculated for one-month period (SPI-1), three-
month period (SPI-3), six-month period (SPI-6), nine-month period (SPI-9) and twelve-month
period (SPI-12). Then, the results were tested by the historical droughts. SPIs only showed
good results in the severe drought years, especially SPI-6 (Jan.-Jun.); this finding was similar
to Terink (2011) for the Low Mekong Basin. It did not describe drought well for a specific
area like the Mekong Delta; however, it is necessary to measure due to some areas highly
depending on rainfall. Moreover, it is essential to consider SPIs for the upstream of the
Mekong Delta.
The monthly rainfall (P) and potential evapotranspiration (PE) data of Ben Tre Station
were used to calculate the difference between them (Di=P-PE). The PE had obtained from the
FAO-56 Monteith equation as Equation (8). Then, Di was used to calculate SPEI. Similar to
SPI, SPEI was calculated for different period and time scales. The results showed that SPEI
only responded to some of the severe drought events. In fact, only rainfall significantly
changes in the MDK due to seasons, the other factors such as temperature, potential
evaporation, humidity, and wind speed slightly changes through the years. That is why the
results of SPEI were similar to SPI. The results of SPEI and SPI are not good is reasonable
because the MDK are not closed watershed. It highly depends on the hydrological regime at
upstream. Furthermore, 80% of the Mekong Delta areas are agricultural land, mainly irrigated
areas.
The hourly salinity data of Huong My, Son Doc and Tra Vinh were used to calculate
the Salinity Index (SI). The Salinity Index was obtained from the number of hours recording

66
salt concentration above 4 ppt. This is because; a drought index is developed to describe not
only severity but also duration of droughts. Moreover, the salt concentration changes
significantly following the changes in water level in rives during tidal periods. In addition, in
the future, the severity of salinity intrusion could be controlled by constructing hydraulic
system; however, the duration of salinity intrusion is important. Specifically, the sluice gates
will be closed to prevent salinity intrusion but it could not be closed for a long time that
causing environmental degradation due to trapped wastewater. In addition, the number of
hours recording salt concentration enables Salinity Index to be calculated the cumulative total
for target periods. The results showed that the SI in March and April clearly indicated the
historical droughts. Specifically, the SI in the normal years were about 50 hours or less than
while these values in the historical droughts were all higher than 120 hours. Hence, Salinity
Index is suitable and good index for the drought management in Ben Tre.
Streamflow data at Tan Chau and Chau Doc Station were utilized to obtain Streamflow
Drought Index (SDI) for different periods as one-month period (SDI-1), three-month period
(SDI-3), and six-month period (SDI-6) as SPI. SDI showed the best result in comparison to
SPI and SPEI. It is the best matched up with historical drought events as timing. Especially,
SDI-6 (Jan.-Jun.), SDI-2 (Jan.-Feb.), and SDI-1 (Apr.) almost responded to the historical
droughts. Therefore, a hybrid index (Drought Index) that was developed from these indices
indicating all historical droughts. As a result, the Drought Index had the highest R2=0.729 in
correlation analysis with the statistic on drought damage. In the other words, it fully explains
the drought phenomenon in Ben Tre Province among indices examined. SDI is good index to
conduct the drought study in Ben Tre. Streamflow data is suggested to apply for the drought
management in the Ben Tre.
In the future, the hydraulic infrastructure system that are under construction would
alleviate the affected areas of droughts and change to the drought phenomenon. The salinity
data have observed in the main rives from stations that are located outside the hydraulic
infrastructure system will be less affected. Therefore, it is better to utilize the streamflow and
salinity data in the drought management in Ben Tre because both of these data clearly showed
the historical droughts in this study. To strengthen this argumentation, the correlation analysis
between SDI and salinity was conducted to figure out an index for the early warning. This is
because the number of hours recording saline concentration higher than 4 ppt in the period of
March to April clearly showed the drought signals in the historical drought years. Following
this concept, the regression analysis showed that SDI-2 (Jan.-Feb.) of both Tan Chau and
Chau Doc Station had a good association with Salinity Index as 4 ppt (Feb.-Jun.) at Huong
My, Tra Vinh and Son Doc Station. The R2 for these cases were 0.76, 0.84 and 0.84
respectively. As a result, SDI-2 (Jan.-Feb.) is possible to apply for the drought early warning.
5.2 Recommendations
In this study, the length of data was only 17 years (1998-2014) and only standard
normal distribution was considered; therefore, the results might be affected. A rigorous
analysis with the longer length of data (ideally 30 years) and different probability distributions
may contribute a better view. This reason is that in Section 2.1 mentioned it is that historical
droughts occurred five times in the period from 1981 to 1987. Hence, it is suspected that the
67
cycle of the hydrology is in the other of 30 years; therefore, there was the high frequency of
the occurrence of drought in the period from 2004 to 2013 with six times.
Based on the discussion above, this study recommends applying SDI-6 (Jan.-Jun.)
together with SDI-2 (Jan.-Feb.) and SDI-1 (Apr.) of Tan Chau and Chau Doc for drought
monitoring in Ben Tre. SDI-2 (Jan.-Feb.) not only describes droughts well but also associates
with a Salinity Index (4 ppt) from March to April in saline observation gauges in Ben Tre
Province. However, it is needed to examine with the longer data set and other gauges in the
upstream of the province (40-50 km from the sea). In Ben Tre, there is a growing tendency of
salinity intrusion with an increase in severity so that many additional salinity observation
gauges are suggested to install. The involvement of the new gauges may contribute a better
view on the association between streamflow in upstream and salinity intrusion in the
downstream. The change in salt concentration of surface water along rivers associated with
the change in streamflow is crucial for the drought monitoring and early warning. Lastly, a
hybrid index includes the SDI-6 (Jan.-Jun.), SDI-1 (Apr.) and SDI-2 (Jan.-Feb.) is
recommended for drought management in Ben Tre while SDI-2 (Jan.-Feb.) is suggested for
the drought early warning.
Furthermore, the application of drought indices requires an essential step in which the
indices should be tested on a certain drought and the explanation of water supply system
during this drought. In Ben Tre, many sluice gates and river embankments are under
construction, and these facilities may affect the river flow and the concentration of brackish
water when they are completed. Therefore, the operational procedure for the water works
system in the Ben Tre has not been proposed yet. In the future, the severity of salinity
intrusion could be controlled by constructing hydraulic system; however, the duration of
salinity intrusion is important. Specifically, the sluice gates will be closed to prevent salinity
intrusion but it could not be closed for a long time that causing environmental degradation due
to trapped wastewater. It is necessary to open periodically for fresh water intake and
wastewater disposal. In other words, there is no index could accurately explain drought event
because water availability depending on water supply system (Karavitis et al., 2011: Rossi,
2008).
The meteorological data from only Ben Tre Station was utilized therefore it would
occur the biases due to various reasons. For example, the renovation of the Ben Tre Station in
2011 with the new facilities and equipment may affect data. Hence, it is necessary to explain
and collect the information related to the history of stations.
The triple paddy is a major challenge in the context of drought to water management.
From environment and water management’s point of view, triple paddy should be restricted or
gradually replaced by others with less water demand. Since 2017, Ben Tre has applied double
paddy to avoid risk from salinity from February to April, specifically Winter-Spring Paddy
(from early November to late February) and Summer-Autumn Paddy (from early June to early
October).
68
References
ADB. (2011). Preparing The Greater Mekong Sub-region Flood and Drought Risk Management and
Mitigation Project: Final main report for Viet Nam. Regional Technical Assistance Report
Project Number: 40190. New Delhi, India.
ADPC. (2007). Drought Information Booklet for Vietnam. Asian Disaster Preparedness Center.
http://www.adpc.net/v2007/Programs/DMS/PROGRAMS/FPP/Downloads/4GoodPracticeDocuments/Drought%20Booklet%20vietnam%20.En.pdf.
Allen, R. G., Pereira, L. S., Raes, D., & Smith, M. (1998). FAO 56: Crop Evapotranspiration (guidelines
for computing crop water requirements). FAO Irrigation and Drainage Paper, 300(56), 300.
https://doi.org/10.1016/j.eja.2010.12.001.
Balint, Z., Mutua, F., Muchiri, P., & Omuto, C. T. (2013). Monitoring Drought with the Combined
Drought Index in Kenya. Developments in Earth Surface Processes, 16, 341–356.
https://doi.org/10.1016/B978-0-444-59559-1.00023-2
Banimahd, S. A., & Khalili, D. (2013). Factors Influencing Markov Chains Predictability Characteristics,
Utilizing SPI, RDI, EDI and SPEI Drought Indices in Different Climatic Zones. Water Resources
Management,27(11), 3911-3928. doi:10.1007/s11269-013-0387-z.
Beilfuss, R. and Triet, T. (2014). Climate Change and Hydropower in the Mekong River Basin: A
Synthesis Research. Vientiane, Lao PDR: Mekong River Commission-GIZ Cooperation Programme
Ben Tre Statistical Office. (2015). Ben Tre Statistical Yearbook 2014. Ben Tre, Vietnam.
Cai, W., Purich, A., Cowan, T., van Rensch, P., & Weller, E. (2014). Did climate change-induced rainfall
trends contribute to the Australian millennium drought? Journal of Climate, 27(9), 3145-3168.
https://doi.org/10.1175/JCLI-D-13-00322.1.
Chhinh, N & Millington, A.C. (2015). Drought monitoring for rice production in Cambodia. Climate,
3(4), 792–811. https://doi.org/10.3390/cli3040792
Christos A. Karavitis, Stavros Alexandris, Demetrios E. Tsesmelis, & George Athanasopoulos. (2011).
Application of the Standardized Precipitation Index (SPI) in Greece. Water, 3(4), 787-805.
Dubrovsky, M., Svoboda, M. D., Trnka, M., Hayes, M. J., Wilhite, D. A., Zalud, Z., & Hlavinka, P.
(2009). Application of relative drought indices in assessing climate-change impacts on drought conditions in Czechia. Theoretical and Applied Climatology, 96(1), 155-171.
Fisher, M., & Botterill, L. C. (2003). Beyond Drought: People, Policy and Perspectives. Collingwood,
Vic: CSIRO.
Geological Survey (U.S.). (1960). General Introduction and Hydrologic Definitions: Manual of
Hydrology: Part 1. General Surface-water Techniques. Washington, D.C: GPO.
Guttman, N. B. (1994). On the sensitivity of sample L-moments to sample size. Journal of Climate, 7(6),
1026-1029.
Guttman, N. B. (1999). Accepting the Standardize Precipitation Index: A calculation algorithm 1. JAWRA
Journal of the American Water Resources Association, 35(2), 311–322.
https://doi.org/10.1111/j.1752-1688.1999.tb03592.x.
Hayes M. (2000). Revisiting the SPI: clarifying the process. Drought Network News, 12(1), 13–14
[available online at http://enso.unl.edu.ndmc/center/dnn/winspr.pdf].
Heim, J. R. R. (2002). A Review of Twentieth-Century Drought Indices Used in the United
69
States. Bulletin of the American Meteorological Society, 83(8), 1149-1165.
Helsloot, I. (2012). Mega-crises: Understanding the Prospects, Nature, Characteristics, and the Effects of
Cataclysmic Events. Springfield, Ill: Charles C Thomas, Publisher.
Homdee, T., Pongput, K., & Kanae, S. (2016). A comparative performance analysis of three standardized
climatic drought indices in the Chi River Basin, Thailand. Agriculture and Natural
Resources, 50(3), 211-219.
Hong, X., Guo, S., Zhou, Y., & Xiong, L. (2015). Uncertainties in assessing hydrological drought using
streamflow drought index for the upper Yangtze River basin. Stochastic Environmental Research
and Risk Assessment, 29(4), 1235-1247. doi:10.1007/s00477-014-0949-5
ICEM. (2010). MRC Strategic Environmental Assessment (SEA) of Hydropower on the Mekong
Mainstream: Summary of the Final Report. Hanoi, Vietnam: Ministry of Natural Resources and Environment.
Intergovernmental Panel on Climate Change (IPCC). (2007). Climate Change 2007: Impacts, adaptation
and vulnerability, Contribution of Working Group II to the Fourth Assessment Report of the
IPCC, Parry ML, Canzaniani OF, Palutikof JP, van der Linden P J, Hanson CE (Eds.):
Cambridge University Press, Cambridge, UK.
JICA. (2013). Project for Climate Change Adaptation for Sustainable Agriculture and Rural
Development in the Coastal Mekong Delta in Vietnam. Technical report.
JICA. (2016). The Preparatory Survey for Ben Tre Water Management Project. Technical report.
Keskinen, M., Someth, P., Salmivaara, A., & Kummu, M. (2015). Water-energy-food nexus in a
transboundary river basin: The case of Tonle Sap Lake, Mekong River Basin. Water
(Switzerland), 7(10), 5416–5436. https://doi.org/10.3390/w7105416.
Łabędzki, L., & Bąk, B. (2014). Meteorological and agricultural drought indices used in drought
monitoring in Poland: a review. Meteorology Hydrology and Water Management, 2(2), 1–12.
Retrieved from: yadda.icm.edu.pl/yadda/element/labedzki_bak_meteorological_2_2014.pdf.
Le, T. T.H., Nguyen, K. A. T., Jolly, C. M. (2016). Perception, preparedness and severity of climate
change triggered events in Ben Tre Province, Vietnam. International Journal of Food and
Agricultural Economics. Economics, 4(4), 29-44.
Mahfouz, P., Mitri, G., Jazi, M., & Karam, F. (2016). Investigating the Temporal Variability of the
Standardized Precipitation Index in Lebanon. Climate, 4(2), 27.
McKee, T. B., Doesken, N. J., Klleist, J. (1993). The Relationship of drought frequency and duration to
time scales. Paper Presented at AMS 8th Conference on Applied Climatology. American
Meteorological Society, Anaheim, CA. 179–184. https://doi.org/citeulike-article-id:10490403
MDP. (2013). Mekong Delta Plan. Vietnam-Netherlands Co-operation, Water Sector Synthesis, Hanoi, Vietnam, February 2013.
Mekong River Commission (MRC). (2005). Overview of the Hydrology of the Mekong Basin. Vientiane,
Lao PDR: Mekong River Commission.
Mekong River Commission (MRC). (2012). The Impact and Management of Floods and Droughts in the
Lower Mekong Basin and the Implication of Possible Climate Change. Vientiane, Lao PDR:
Mekong River Commission.
Mekong River Commission and Ministry of Water Resources of the People's Republic of China (2016).
Technical Report – Joint Observation and Evaluation of the Emergency Water Supplement from
70
China to the Mekong River. Mekong River Commission, Vientiane, Lao PDR.
Mishra, A. K., & Singh, V. P. (2010, September). A review of drought concepts. Journal of Hydrology,
391(1), 202-216 https://doi.org/10.1016/j.jhydrol.2010.07.012.
Mishra, A. K., & Singh, V. P. (2011). Drought modelling – A review. Journal of Hydrology, 403(1), 157-
175. http://dx.doi.org/10.1016/j.jhydrol.2011.03.049.
MONRE. (2009). Climate Change and Sea Level Rise, Scenarios for Viet Nam. Ministry of Natural
Resources and Environment, Vietnam.
MONRE. (2016). Groundwater in Long An, Tien Giang and Ben Tre, Viet Nam. Ministry of Natural
Resources and Environment, Vietnam.
MRC. (2009a). Economic, Environmental and Social Impact Assessment of Basin-wide Water Resources
Development Scenarios, Assessment Methodology. Mekong River Commission (MRC) technical note, Vientiane Laos. Retrieved from: www.mrcmekong.org/assets/Other-Documents/BDP/Tech-
Note2-Scenarioassessment-methodology-complete-Report091104.pdf
MRC. (2011). Planning Atlas of the Lower Mekong River Basin. Mekong River Commission (MRC)
technical note, Vientiane Laos.
Nalbantis, I. (2008). Evaluation of a Hydrological Drought Index. European Water, 23(24), 67–77.
Nalbantis, I., & Tsakiris, G. (2009). Assessment of hydrological drought revisited. Water Resources
Management, 23(5), 881–897. https://doi.org/10.1007/s11269-008-9305-1
Naresh Kumar, M., Murthy, C. S., Sesha Sai, M. V. R. and Roy, P. S. (2009), On the use of Standardized
Precipitation Index (SPI) for drought intensity assessment. Meteorological Applications, 16(3),
381–389. https://doi.org/10.1002/met.136.
Nguyen, K.A.T.; T.T.H. Le; C.N.P.T. Bui; T.A.T. Nguyen; and C.M. Jolly. (2017). Climate change impact and vulnerability assessment and economic analysis of climate change adaptation
strategies in Ben Tre province, Vietnam. EEPSEA Research Report No. 2017-RR14. Economy
and Environment Program for Southeast Asia, Laguna, Philippines.
Nguyen, L.B., Li, Q. F., Ngoc, T. A., Hiramatsu, K. (2015). Drought assessment in cai river basin,
Vietnam: A comparison with regard to SPI, SPEI, SSI, and SIDI. Food Weekly Focus,60(2), 417-
425.
Oxfam International. (2008). Vietnam: Climate Change, Adaptation and Poor People. Oxfam
International.
Palmer, W. C. (1965). Meteorological Drought. U.S. Weather Bureau, Res. Pap. No. 45.
Retrieved from https://www.ncdc.noaa.gov/temp-and-precip/drought/docs/palmer.pdf.
Palmer, W.C. (1968). Keeping track of crop moisture conditions, nationwide: The new crop moisture
index. Weatherwise, 21(4), 156–161. https://doi.org/10.1080/00431672.1968.9932814.
Pearson, K. (1901). On lines and planes of closest fit to systems of points in space. Philosophical
Magazine Series 6, 2(11): 559-572. https://doi.org/10.1080/14786440109462720.
Potop, V. (2011). the Application a New Drought Index - Standardized Precipitation Evapotranspiration
Index in the Czech Republic. Mikroklima a Mezoklima Krajinnych Struktur an Antropogennnich
Prostredi, 2(2010), 4.2.
Rasanen, T. A., Kummu, M., Koponen, J., & Lauri, H. (2012). Downstream Hydrological Impacts of
Hydropower Development in the Upper Mekong Basin. Water Resources Management, 26(12),
71
3495–3513. https://doi.org/10.1007/s11269-012-0087-0.
Renaud, F.G., Le, T.T.H., Lindener, C., Guong, V.T., Sebesvari, Z., 2015. Resilience and shifts in agro-
ecosystems facing increasing sea-level rise and salinity intrusion in Ben Tre Province, Mekong
Delta. Climatic Change, 133(1), 69-84. http://dx.doi.org/10.1007/s10584-014-1113-4.
Ribbe, L., Nauditt, A., Meinardi, ., Morbach, M., Becker, ., & eutsche Gesellschaft f r Internationale
Zusammenarbeit (GIZ). (2013). Comparison of key drivers regarding their significance for
Hydro-meteorological Extremes and Their Impacts on Selected Hotspots within the Mekong
River Basin. Vientiane, Lao PDR: Mekong River Commission.
Rossi, G., & Cancelliere, A. (2013). Managing drought risk in water supply systems in Europe: a
review. International Journal of Water Resources Development, 29(2), 272-289. http://dx.doi.org/10.1080/07900627.2012.713848
Rossi, G., Nicolosi, V., & Cancelliere, A. (2008). Recent methods and techniques for managing
hydrological droughts. Drought Management: Scientific and Technological Innovations, 251 266. Retrieved:http://om.ciheam.org/article.php?IDPDF=800450http://www.ciheam.org/
Sharma, T. C., & Panu, U. S. (2008). Drought analysis of monthly hydrological sequences: A case study
of Canadian rivers. Hydrological Sciences Journal, 53(3), 503-518. doi:10.1623/hysj.53.3.503.
Shukla, S., & Wood, A. W. (2008). Use of a standardized runoff index for characterizing hydrologic
drought. Geophysical Research Letters, 35(2).
Retrieved from https://doi.org/10.1029/2007GL032487.
SIUP. (2012). The Urban and Rural Planning for Ben Tre Province towards 2030. Ho Chi Minh,
Vietnam: Sub-Institute for Urban and Rural Planning. (in Vietnamese).
SIWRP. (2016). Water Resources Planning for the Agricultural Restructuring in the Mekong Delta. Ho
Chi Minh, Vietnam: Southern Institute for Water Resources Planning. (in Vietnamese).
SIWRP. (2009). Water Resources Planning for the Area Between Tien and Hau River in the Mekong
Delta. Ho Chi Minh, Vietnam: Southern Institute for Water Resources Planning. (in Vietnamese).
SIWRP. (2011a). Water Resources Planning of Ben Tre Province Toward 2020. Technical report. Ho Chi
Minh, Vietnam: Southern Institute for Water Resources Planning (in Vietnamese).
SIWRP. (2011b). Water Resources Planning of the Mekong Delta under the context of climate change
and sea level rise. Technical report. Ho Chi Minh, Vietnam: Southern Institute for Water
Resources Planning (in Vietnamese).
Steinemann, A. C., & Cavalcanti, L. F. N. (2006). Developing Multiple Indicators and Triggers for
Drought Plans. Journal of Water Resources Planning and Management, 132(3), 164–174.
https://doi.org/10.1061/(ASCE)0733-9496(2006)132:3(164)
Svoboda M., Hayes M. and Wood D. (2012). Standardized Precipitation Index User Guide. WMO-No.
1090. https://doi.org/10.1175/2007JCLI1348.1
Tabari, H., Nikbakht, J., & Hosseinzadeh Talaee, P. (2013). Hydrological Drought Assessment in Northwestern Iran Based on Streamflow Drought Index (SDI). Water Resources
Management, 27(1), 137–151. https://doi.org/10.1007/s11269-012-0173-3
Terink, W., Immerzeel, W.W. and Droogers, P. (2011). Drought Monitoring and Impact Assessment in
the Mekong River Basin. Report Future Water: 104, Wageningen.
The United Nations Secretariat of the International Strategy for Disaster Reduction (UNISDR).
(2009). Drought Risk Reduction Framework and Practices: Contributing to the Implementation

72
of the Hyogo Framework for Action. Geneva: United Nations.
Tinh, N. D. (2012). Evaluation and Assessment the Meteorological Drought in the Mekong Delta. Water
Resources Journal. Ha Noi, Vietnam: University of Thuy Loi.
Tsakiris, G., & Vangelis, H. (2005). Establishing a drought index incorporating
evapotranspiration. European Water, 9(10), 3–11.
Tsakiris, G., Pangalou, D., & Vangelis, H. (May 01, 2007). Regional Drought Assessment Based on the
Reconnaissance Drought Index (RDI). Water Resources Management: an International Journal -
Published for the European Water Resources Association, 21 (5), 821-833.
https://doi.org/10.1007/s11269-006-9105-4
Ty, T. V., Hoai, D. T. V., and Minh, H. T. V.(2015). Drought Mapping of the Mekong Delta in the
Context of Climate Change. Can Tho University, Scientific Journal. Can Tho, Vietnam: Can Tho University.
United Nation (UN). (2016). Viet Nam Drought and Saltwater Intrusion Rapid Assessment Report. Ha
Noi, Vietnam: The United Nations in Vietnam.
Van Loon, A. F. (2015). Hydrological drought explained. Wiley Interdisciplinary Reviews: Water, 2(4),
359–392. https://doi.org/10.1002/wat2.1085
Vicente-Serrano, . M., L pez-Moreno, . I., Beguería, ., Lorenzo-Lacruz, ., Azorín-Molina, C., &
Morán-Tejeda, E. (2012). Accurate Computation of a Streamflow Drought Index. Journal of
Hydrologic Engineering, 17(2), 318–332. https://doi.org/10.1061/(ASCE)HE.1943-
5584.0000433
Vicente-Serrano, S., Beguería, S., & López-Moreno, J. I. (2010). A multiscalar drought index sensitive to
global warming: The standardized precipitation evapotranspiration index. Journal of Climate, 23(7), 1696-1718. doi:10.1175/2009JCLI2909.1
Villarreal, M. L., Norman, L. M., Buckley, S., Wallace, C. S. A., & Coe, M. A. (2016). Multi-index time
series monitoring of drought and fire effects on desert grasslands. Remote Sensing of
Environment, 183, 186-197. doi:http://dx.doi.org/10.1016/j.rse.2016.05.026.
Vreugdenhil, H., Hoang, B., Offermans, A. (2012). Perspectives on Water Management in the
Vietnamese Mekong Delta. In Proceedings of the 2nd World Sustain. Sciforum Electronic
Conference Series, Vol. 2, 2012.
Wang, K., Li, Q., Yang, Y., Zeng, M., Li, P., & Zhang, J. (2015). Analysis of spatio-temporal evolution
of droughts in Luanhe River Basin using different drought indices. Water Science and
Engineering, 8(4), 282–290. https://doi.org/10.1016/j.wse.2015.11.004
Wilhite, D. A., & Glantz, M. H. (1985). Understanding the drought phenomenon: The role of
definitions. Water International, 103, 111-120. https://doi.org/10.1080/02508068508686328.
Wilhite, D. A., & Pulwarty, R. S. (2005). Drought and Water Crises: Lessons learned and the road ahead.
In D. A. Wilhite (Ed.), Drought and Water Crises (pp. 389– 398). Boca Raton, FL: Taylor &
Francis.
Wilhite, D. A., Botterill, L., & Monnik, K. (2005). National Drought Policy: Lessons Learned from
Australia, South Africa and the United States. In D. A. Wilhite (Ed.), Drought and water crises
(pp. 137– 172). Boca Raton, FL: Taylor & Francis.
Wilhite, D. A., Hayes, J. M., & Knutson, L. C. (2005). Drought Preparedness Planning: Building
Institutional Capacity. In D. A. Wilhite (Ed.), Drought and Water Crises: Science, Technology,
and Managment Issues (p. 402).
73
World Bank. (2016). Vietnam - Mekong Delta Integrated Climate Resilience and Sustainable Livelihoods
(MD-ICRSL) Project: environmental assessment. Vietnam;
Retrieved from: http://documents.worldbank.org/curated/en/855731468312052747/Regional-
environmental-assessment-report.
World Meteorological Organization (WMO) and Global Water Partnership (GWP). (2016). Handbook of
Drought Indicators and Indices. (Svoboda, M., Fuchs, B. A.,). Integrated Drought Management
Programme (IDMP), Integrated Drought Management Tools and Guidelines Series 2. Geneva.
Wu, H., Hayes, M. J., Weiss, A., & Hu, Q. (2001). An evolution of the standardized precipitation index,
the China-Z index and the statistical Z-score. International Journal of Climatology, 21(6), 745–
758. https://doi.org/10.1002/joc.658.
WWF. (2012). Rapid Vulnerability Assessment and Adaptation Options for Ben Tre province. Project report. Completed under the ‘Global Cooperation on Water esource Management’ and the
‘Capacity Building and ustainable Production’ programme by World Wildlife Fund for Nature.
WWF. (2013). Ecosystem-based Adaptation to Climate change in Ben Tre province, Vietnam. Project
completion report. Department of Natural Resources and Environment of Ben Tre and World
Wildlife Fund.
Yeh, C. F., Wang, J., Yeh, H. F., & Lee, C. H. (2015). SDI and Markov chains for regional drought
characteristics. Sustainability (Switzerland), 7(8), 10789–10808.
Zoljoodi, M., & Didevarasl, A. (2013). Evaluation of spatial-temporal variability of drought events in Iran
using Palmer drought severity index and its principal factors (through 1951-2005). Atmospheric
and Climate Sciences, 3(2), 193-207. doi:10.4236/acs.2013.32021