a study of acoustic reflections in full-scale rotor low
TRANSCRIPT

1
A Study of Acoustic Reflections in Full-Scale Rotor Low Frequency Noise Measurements Acquired in Wind Tunnels
Natasha L. Barbely Ben W. Sim Cahit Kitaplioglu Pat Goulding II Aerospace Engineering UARC/AFDD Aeromechanics Branch NFAC/Jacobs Technology Inc. Georgia Institute of Technology Ames Research Center NASA Ames Research Center NASA Ames Research Center Atlanta, GA Moffett Field, CA Moffett Field, CA Moffett Field, CA
ABSTRACT
Difficulties in obtaining full-scale rotor low frequency noise measurements in wind tunnels are addressed via residual sound reflections due to non-ideal anechoic wall treatments. Examples illustrated with the Boeing-SMART rotor test in the National Full-Scale Aerodynamics Complex (NFAC) 40- by 80-Foot Wind Tunnel facility demonstrated that these reflections introduced distortions in the measured acoustic time histories that are not representative of free-field rotor noise radiation. A simplified reflection analysis, based on the method of images, is used to examine the sound measurement quality in such “less-than-anechoic” environment. Predictions of reflection-adjusted acoustic time histories are qualitatively shown to account for some of the spurious fluctuations observed in wind tunnel noise measurements.
INTRODUCTION
Quiet rotorcraft are essential for mission survivability in twenty-first century warfare. Rotorcraft offer strategic opportunities for mobile, close-in observation, support, and attack on either manned or unmanned platforms. However, to be truly effective, the vehicle must not be detectable by the enemy via any means. One necessary condition stipulates that the far-field noise, generated by the unshielded rotors on these vehicles, must be low enough (relative to the background levels) to avoid aural detection. This constraint implies that the low frequency contents of the vehicle’s acoustic radiations must be suppressed, owing to their ability to propagate over long distances in the atmosphere. In contrast, mid-to-high acoustic frequency content is readily absorbed by the atmosphere, and is, therefore, not important for aural detection considerations. Several advanced rotor designs with active “on-blade” or blade root controls are currently in the works to mitigate low frequency, in-plane (LFIP) noise known to govern aural detection of open rotors1-4.
Developments of these advanced rotor designs are demanding, challenging and costly undertakings. In many cases, proof-of-concept testing are conducted with full-scale rotors to facilitate hardware designs and to yield more representative aeromechanics solutions with full-scale rotor blade structural properties. As such, these full-scale rotors typically have critical aural detection components that manifest as multiple, discrete harmonic acoustic tones in sound frequency regimes below 100 Hz. In addition, full-scale rotor experiments are mostly performed in wind tunnel facilities that offer a controlled, isolated and safe
Presented at the American Helicopter Society Specialists’ Conference on Aeromechanics, San Francisco, California, January 20-22, 2010. This is a work of the U.S. Government and is not subject to copyright protection in the U.S.
environment to assess and identify the benefits of new rotor designs. These facilities must be large enough to house the rotor and to allow microphones to be installed in the rotor’s acoustic far-field. For noise evaluations, sound absorbing wall treatment must be present as well, to provide an anechoic (no echoes) space for “true” rotor noise signatures, with adequate signal-to-noise ratio, to be identified without significant contaminations from reflections/reverberations.
The requirement for an anechoic space adequate for low frequency noise measurement of full-scale rotors generates conflicting demands. Full-scale rotors tend to operate in the range of 200 to 400 rotor RPM. In conjunction with the number of blades, these rotors tend to emit low frequency noise in the form of discrete harmonic tones near and below 100 Hz. In turn, these frequencies demand sizable wall treatments to offer the appropriate acoustic impedance for adequate absorption. In order for testing facilities to be “anechoic” at frequencies 100 Hz and below, wall surfaces must be treated with sound absorbing treatments that are on the order of several feet thick. Naturally, due to size and expense limitations, only a handful of facilities word-wide can afford to meet this stringent requirement, and in most cases, only doing so marginally. For this reason, the fidelity of low frequency noise measurements, obtained in these facilities, must be examined to identify any adverse effects due to the inadequate sound absorption treatment.
This paper provides a qualitative overview of acoustics data obtained from a recent Boeing-SMART Rotor experiment5 tested in the NFAC 40- by 80-Foot Wind Tunnel, with emphasis on the sound measurement quality of low frequency noise obtained within the test section enclosure. Measured noise data will be carefully scrutinized to examine their conformity and relevance to a rotor’s “true” far-field noise characteristics. In the process, the effects of residual reflections due to non-ideal sound treatment will also be identified.

Report Documentation Page Form ApprovedOMB No. 0704-0188
Public reporting burden for the collection of information is estimated to average 1 hour per response, including the time for reviewing instructions, searching existing data sources, gathering andmaintaining the data needed, and completing and reviewing the collection of information. Send comments regarding this burden estimate or any other aspect of this collection of information,including suggestions for reducing this burden, to Washington Headquarters Services, Directorate for Information Operations and Reports, 1215 Jefferson Davis Highway, Suite 1204, ArlingtonVA 22202-4302. Respondents should be aware that notwithstanding any other provision of law, no person shall be subject to a penalty for failing to comply with a collection of information if itdoes not display a currently valid OMB control number.
1. REPORT DATE JAN 2010 2. REPORT TYPE
3. DATES COVERED 00-00-2010 to 00-00-2010
4. TITLE AND SUBTITLE A Study of Acoustic Reflections in Full-Scale Rotor Low Frequency NoiseMeasurements Acquired in Wind Tunnels
5a. CONTRACT NUMBER
5b. GRANT NUMBER
5c. PROGRAM ELEMENT NUMBER
6. AUTHOR(S) 5d. PROJECT NUMBER
5e. TASK NUMBER
5f. WORK UNIT NUMBER
7. PERFORMING ORGANIZATION NAME(S) AND ADDRESS(ES) Army Research, Development & EngineeringCommand,Aeroflightdynamics Division,Ames Research Center,Moffett Field,CA,94035
8. PERFORMING ORGANIZATIONREPORT NUMBER
9. SPONSORING/MONITORING AGENCY NAME(S) AND ADDRESS(ES) 10. SPONSOR/MONITOR’S ACRONYM(S)
11. SPONSOR/MONITOR’S REPORT NUMBER(S)
12. DISTRIBUTION/AVAILABILITY STATEMENT Approved for public release; distribution unlimited
13. SUPPLEMENTARY NOTES
14. ABSTRACT Difficulties in obtaining full-scale rotor low frequency noise measurements in wind tunnels are addressedvia residual sound reflections due to non-ideal anechoic wall treatments. Examples illustrated with theBoeing-SMART rotor test in the National Full-Scale Aerodynamics Complex (NFAC) 40- by 80-Foot WindTunnel facility demonstrated that these reflections introduced distortions in the measured acoustic timehistories that are not representative of free-field rotor noise radiation. A simplified reflection analysis,based on the method of images, is used to examine the sound measurement quality in such?less-than-anechoic? environment. Predictions of reflection-adjusted acoustic time histories arequalitatively shown to account for some of the spurious fluctuations observed in wind tunnel noise measurements.
15. SUBJECT TERMS
16. SECURITY CLASSIFICATION OF: 17. LIMITATION OF ABSTRACT Same as
Report (SAR)
18. NUMBEROF PAGES
8
19a. NAME OFRESPONSIBLE PERSON
a. REPORT unclassified
b. ABSTRACT unclassified
c. THIS PAGE unclassified
Standard Form 298 (Rev. 8-98) Prescribed by ANSI Std Z39-18

2
LOW FREQUENCY NOISE MEASUREMENTS IN ENCLOSURES
The notion of measuring low frequency sound in a wind tunnel, surrounded by wall panels, is a delicate problem. Clearly, the objective of such undertakings is to enable the low frequency sound characteristics to be measured in a manner representative of the rotor’s true sound radiation in a free-field environment. Enclosing the rotor with sound absorbing wall is one plausible solution. Ideally, this requires a large enclosure, with wall panels capable of absorbing sound energy directed at the surfaces, so that all reflections are suppressed and only the “direct” source-to-microphone signals are preserved in the measurement space. In reality, this is difficult to achieve, especially for low frequency sounds, due to an assortment of reasons that are discussed below:
Spatial Requirements
Low frequency sounds from full-scale rotors have relatively long acoustic wave-lengths and large source dimensions that necessitate a sizeable measurement space for the acoustic waves to evolve into their representative far-field state. Typically, this constraint stipulates a spatial volume with dimensions corresponding to at least one wavelength6 associated with the lowest frequency of interest. For open rotors, these requirements are further augmented by the need to avoid near-field pressure waves7 due to the aerodynamic flow-field (downwash) of the rotor. Because these near-field aerodynamic pressure waves do not propagate into the far-field, noise measurement must be made at least sufficiently far away to avoid picking up near-field characteristics. In most cases, a source-to-microphone distance of at least one rotor diameter is necessary to meet these requirements.
Sound Reflections
Wall panels of wind tunnel enclosures provide the opportunity for acoustic waves, originating from a sound source, to be reflected into the measurement space. This is most pronounced when the wall panels are not ideally treated for sound frequencies of interest. The net result is a distortion in the measured time history where the (desired) “direct” noise pulse is contaminated by reflected noise pulses. Note that reflections can be effectively reduced simply by operating in an enclosure of dimension much greater that the source-to-microphone distance. This is primarily due to a greater distance that the incident and reflected signals must travel in comparison to the direct noise pulse. For this reason, reflections are attenuated to a greater extent, as they are subjected to more inverse-square law noise decay with increased distance of travel.
For an omni-directional source with a single wall surface as shown in Figure 1a, the reflected pulse tends to be phase-lagged and have smaller amplitudes, compared to the “direct” pulse, due to longer distance of travel prior to arriving at the microphone. While the process appears to be
a simple linear summation of two separate signals, it is very difficult to extract the direct pulse once the measurement is contaminated by reflections, particulary at low frequencies where the signals tend to overlap each other.
In the presence of two parallel walls, the opposing surfaces generate a more complex reflection sound field. In addition to first bounce signals resulting from reflections off only a single wall surface, the parallel geometry allows reflections with two or more bounces, where the reflected signals encounters wall surfaces multiple times (Fig. 1b). Each of these reflected signals has a different phase-lag and amplitude depending on the actual distance of travel from the source to the microphone. While the number of bounces is physically infinite, only the first few are usually significant for acoustics considerations. Note that Figure 1b only illustrates the acoustic reflections due to the right wall. A similar set of reflections (not shown) must also be considered for the left wall.
Figure 1. Simplified illustrations of sound reflections due
to: a) single wall surface, b) parallel wall surfaces.
Parallel walls create an additional sound measurement quality issue associated with the excitation of standing wave patterns between opposing surfaces (Fig. 1b). These standing wave patterns are locked into a discrete modal frequencies (fundamental, plus higher-order harmonics) governed by the distance between the walls. When a modal frequency is excited, spurious pressure fluctuations at the modal frequency are generated at locations in the measurement space (except at a nodal point). Conventional use of multiple rotor revolutions-averaging can alleviate some of these standing-wave issues, provided that the modal

3
frequencies do not coincide with the rotor harmonic frequencies. As such, it is pertinent to avoid having rotor harmonic tones at or near standing wave modal frequencies. Unfortunately, due to size limitations, most full-scale rotor experiments tend to be housed in an enclosure where the standing wave modal frequencies are excited in the same frequency range as the rotor harmonic tones. When this occurs, the walls must be equipped with adequate sound absorption treatment to “soften” the interface to discourage standing wave formations.
While the discussions so far have been limited to simplified two-dimensional geometries and omni-directional sound sources, the problem becomes much more difficult in a three-dimensional environment with highly-directional rotor sound radiation. Not only will there be more opportunities for reflections to occur (from three parallel surfaces), the myriad number of standing wave modes, associated with a volumetric space, may render these modal frequencies impossible to avoid. The countless reflections, each with their own amplitude and phase distortions, will inevitably distort the desirable “direct” pulse and produce “false” noise readings. For this reason, it is imperative that low frequency rotor noise measurement be conducted in a suitably treated anechoic space, with wall absorption treatments targeted for the frequency range of interest.
Sound Absorption Treatment
Typical anechoic treatments8 in wind tunnels are comprised of porous foams or fiber-glass materials that are designed to transform sound to thermal energy via friction between the air molecules and the open air-filled pores. The process usually breaks down at a certain cut-off frequency in the lower frequency regime. Below this cut-off frequency, sound absorbing capabilities are generally less effective and more of the sound energy is reflected into the measurement space.
The ability of the sound absorption treatment to attenuate noise, at a frequency band, is characterized by the absorption coefficient, α (Eq. 1), which is defined by the ratio of the reflection signal’s amplitude (Preflected) to the incident signal’s amplitude (Pincident). This ratio can, in turn, be prescribed as a sound attenuation factor (Sa) as shown in Equation (2).
€
α =1−Preflected
Pincident
2
(Eq. 1)
€
Sa = −20 ⋅ logPreflected
Pincident
= −20 ⋅ log 1−α( ) (Eq. 2)
Figure 2 illustrates the absorption coefficients necessary to attenuate the reflected sound energies by a desired dB factor. For practical purposes, an attenuation of 12 dB or more is typically necessary to attain a clean, acceptable “direct” pulse with low reflections content. To meet this
requirement, it is shown that an absorption coefficient of 0.937 or greater must be achieved by the sound absorption treatment. This is equivalent to having an acoustic pulse, of amplitude 25% or less than the incident pulse, reflected back into the measurement space.
While it is not difficult to find acoustic treatments that meet these absorption coefficient requirements at mid-to-high frequencies, ensuring the same absorption criteria at low frequencies can be quite a formidable challenge. Even with state-of-the-art anechoic materials, it is known that the sound absorbing treatment must be of dimensions on the order of the wavelength of the low frequency to be effective. At 100 Hz or below, typical of full-scale helicopters, this translates to very large sound absorption treatments on the order of several feet in depth.
Figure 2. Significance of sound absorption coefficient
SMART ROTOR TESTING IN NFAC 40- BY 80-FT WIND TUNNEL
Results from a joint DARPA/NASA/Army-funded program5,9 utilizing the Boeing’s Smart Material Actuated Rotor Technology (SMART) rotor, tested in the 40- by 80-Foot Wind Tunnel of the National Full- Scale Aerodynamic Complex (NFAC) at NASA Ames Research Center in 2008 (Fig. 3), will be used to illustrate the difficulties of obtaining high-fidelity low frequency noise measurements in an enclosed wind tunnel.
The Boeing SMART rotor is a 34-ft diameter, full-scale, bearingless, five-bladed main rotor modified from an existing MD-902 Explorer rotor system. Nominal rotation speed of the rotor is 392 RPM resulting in a tip speed of 695 ft/sec. In conjunction with five rotating blades, the resulting acoustics waves from the rotor, in the non-rotating frame, are dominated by strong harmonic contents at discrete tones corresponding to integer multiples of the blade-passing frequency (BPF) of 32.7 Hz.
An array of microphones was strategically placed around the full-scale model to capture the rotor noise (Fig. 3). The general layout of microphone placement in the wind tunnel is illustrated in Figure 4 – with details of their location coordinates listed in Table 1. For present study, this
4
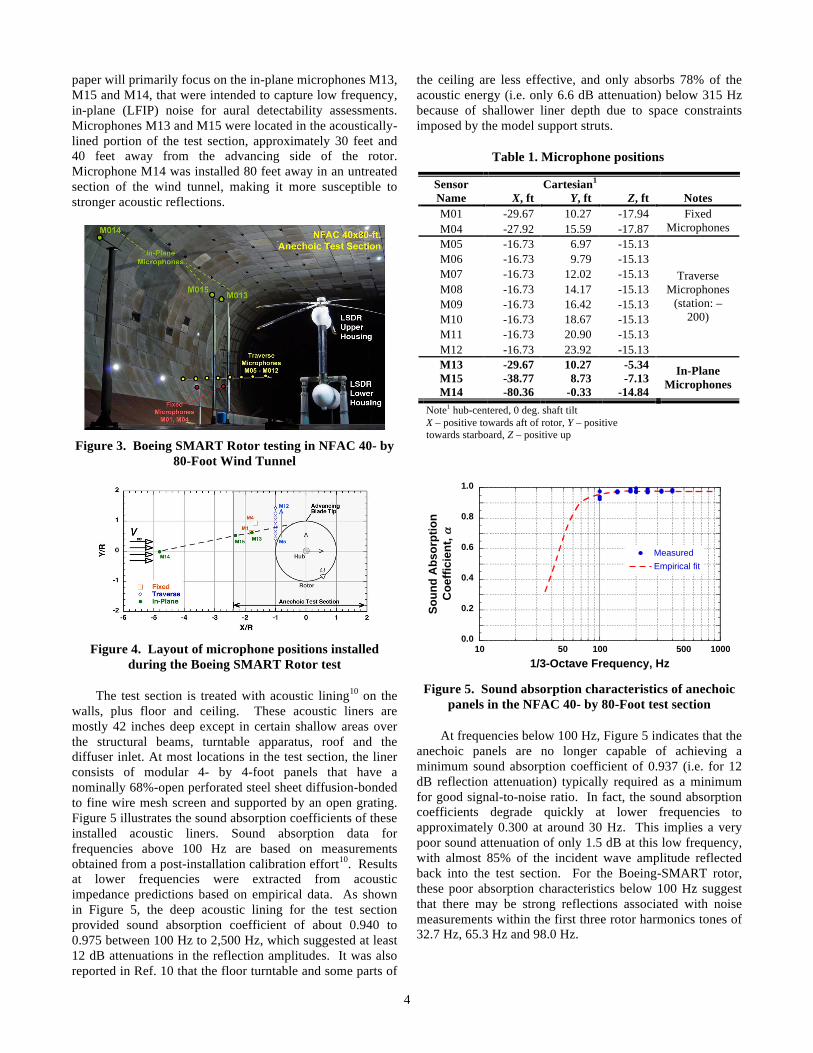
paper will primarily focus on the in-plane microphones M13, M15 and M14, that were intended to capture low frequency, in-plane (LFIP) noise for aural detectability assessments. Microphones M13 and M15 were located in the acoustically-lined portion of the test section, approximately 30 feet and 40 feet away from the advancing side of the rotor. Microphone M14 was installed 80 feet away in an untreated section of the wind tunnel, making it more susceptible to stronger acoustic reflections.
Figure 3. Boeing SMART Rotor testing in NFAC 40- by
80-Foot Wind Tunnel
Figure 4. Layout of microphone positions installed
during the Boeing SMART Rotor test
The test section is treated with acoustic lining10 on the walls, plus floor and ceiling. These acoustic liners are mostly 42 inches deep except in certain shallow areas over the structural beams, turntable apparatus, roof and the diffuser inlet. At most locations in the test section, the liner consists of modular 4- by 4-foot panels that have a nominally 68%-open perforated steel sheet diffusion-bonded to fine wire mesh screen and supported by an open grating. Figure 5 illustrates the sound absorption coefficients of these installed acoustic liners. Sound absorption data for frequencies above 100 Hz are based on measurements obtained from a post-installation calibration effort10. Results at lower frequencies were extracted from acoustic impedance predictions based on empirical data. As shown in Figure 5, the deep acoustic lining for the test section provided sound absorption coefficient of about 0.940 to 0.975 between 100 Hz to 2,500 Hz, which suggested at least 12 dB attenuations in the reflection amplitudes. It was also reported in Ref. 10 that the floor turntable and some parts of
the ceiling are less effective, and only absorbs 78% of the acoustic energy (i.e. only 6.6 dB attenuation) below 315 Hz because of shallower liner depth due to space constraints imposed by the model support struts.
Table 1. Microphone positions
Sensor Cartesian1 Name X, ft Y, ft Z, ft Notes M01 -29.67 10.27 -17.94 M04 -27.92 15.59 -17.87
Fixed Microphones
M05 -16.73 6.97 -15.13 M06 -16.73 9.79 -15.13 M07 -16.73 12.02 -15.13 M08 -16.73 14.17 -15.13 M09 -16.73 16.42 -15.13 M10 -16.73 18.67 -15.13 M11 -16.73 20.90 -15.13 M12 -16.73 23.92 -15.13
Traverse Microphones
(station: –200)
M13 -29.67 10.27 -5.34 M15 -38.77 8.73 -7.13 M14 -80.36 -0.33 -14.84
In-Plane Microphones
Note1 hub-centered, 0 deg. shaft tilt X – positive towards aft of rotor, Y – positive towards starboard, Z – positive up
0.0
0.2
0.4
0.6
0.8
1.0
10 100 1000
MeasuredEmpirical fit
Soun
d Ab
sorp
tion
Coef
ficie
nt, α
1/3-Octave Frequency, Hz50050
Figure 5. Sound absorption characteristics of anechoic
panels in the NFAC 40- by 80-Foot test section
At frequencies below 100 Hz, Figure 5 indicates that the anechoic panels are no longer capable of achieving a minimum sound absorption coefficient of 0.937 (i.e. for 12 dB reflection attenuation) typically required as a minimum for good signal-to-noise ratio. In fact, the sound absorption coefficients degrade quickly at lower frequencies to approximately 0.300 at around 30 Hz. This implies a very poor sound attenuation of only 1.5 dB at this low frequency, with almost 85% of the incident wave amplitude reflected back into the test section. For the Boeing-SMART rotor, these poor absorption characteristics below 100 Hz suggest that there may be strong reflections associated with noise measurements within the first three rotor harmonics tones of 32.7 Hz, 65.3 Hz and 98.0 Hz.

5
Figure 6 illustrates the measured acoustics time history for microphone M13 in the wind tunnel at a condition corresponding to 123 knots airspeed (NFAC Run 57, Point 68, advance ratio of 0.299, shaft tilt of -9.1 degrees, and rotor thrust-to-solidity ratio of 0.075). At this in-plane microphone location, the acoustic time history shows five distinct pulses associated with acoustics radiations from each of the five blades. Each of these pulses has a negative pressure peak that is classical of in-plane noise signatures due to a combination of thickness and in-plane loading noise mechanisms7. Comparisons to flight test data* obtained from a MD-902 helicopter11 show that these negative pressure peaks and the general trends are well captured, with the exception of additional acoustic pressure fluctuations in between adjacent negative pressure peaks. These distortions are suspected to be cause by reflections associated with inadequate sound absorption treatment in the wind tunnel at low frequencies.
Figure 6. Comparisons of wind tunnel noise
measurements to equivalent flight test noise data
PREDICTION METHODOLOGIES
To gain insights to these distortions, a prediction method was developed to enable the effects of sound reflections in the wind tunnel to be studied. The objective was to derive a qualitative understanding, rather than attempting to make accurate quantifications and exact predictions. Components of this prediction tool are described below.
Rotor Aeromechanics
Aeromechanics modeling is obtained from the CAMRAD-II12 code to simulate steady-state response of an isolated rotor operating in the wind tunnel. Within the analysis, CAMRAD-II couples blade structural dynamics, rotor wake, blade aerodynamics and flight dynamics to obtain the blade airloads/motions associated with the “trim”
* Pertains to data (Flight Number 100, Run Number 205) obtained from a 2007 flight test of the MD-902 helicopter at Eglin AFB. Ground noise measurements were de-dopplarized and back-propagated to a position equivalent to microphone M13 in the wind tunnel.
state of the rotor. For the purpose of simulating SMART rotor operations during wind tunnel testing, CAMRAD-II is configured to trim to a pre-defined rotor thrust with zero longitudinal and zero lateral blade flapping.
The aerodynamic model uses a free-wake analysis to calculate rotor non-uniform induced velocities. The free-wake model consists of a rolled-up wake model based on the formation of a single concentrated tip vortex formed at the blade tip due to span-wise variations in the blade bound circulation. Local blade aerodynamics are accounted for using a second-order lifting line model, including effects of the wake-induced velocities, compressibility, yawed flow, blade sweep, Reynolds number, reverse flow and dynamic stall. Blade aerodynamic surfaces are represented by twenty panels located from 0.15R to the tip, with panel widths varying from 0.10R inboard to 0.02R at the tip. These panels are more densely distributed at the outboard (tip) region of the rotor blade to accurately simulate the dominant region important for sound radiation. The static terms of the airloads are computed using airfoil tables, which account for steady viscous and compressible loads. Unsteady lift and moment in the attached flow are calculated based on compressible thin-airfoil theory.
Rotor Aeroacoustics (Free-Field)
The predicted airloads and blade motions are passed into PSU-WOPWOP13 to generate time domain-based acoustics predictions of the low frequency sound emitted by the Boeing-SMART rotor. PSU-WOPWOP utilize the acoustic analogy-based equation known as Farassat’s Formulation 1A to relate blade geometry and predicted airloads to acoustic pressures in both the near and the far-field. For this effort, PSU-WOPWOP is configured to simulate a single isolated rotor operating in a steady, free-field environment. Only the linear thickness noise source and “on-surface” loading noise source terms are included in the acoustic modeling. Non-linear quadrupole effects commonly associated with High-Speed Impulsive (HSI) noise radiation at higher advancing tip Mach number are excluded. In addition, microphone positions in the wind tunnel are assumed to be in close enough proximity to the rotor such that atmospheric propagation effects are negligible.
Sound Reflections
The method of images14,15 is used to examine effects of sound reflections associated with the presence of wind tunnel walls. While this approach is generally used in conjuction with high frequencies (geometrical acoustics), it is, nonetheless, useful to extrapolate to low frequencies here to provide qualitative insights as to how reflections affect the sound measurement quality in the wind tunnel.
Acoustics reflections are modeled with four flat walls surrounding the rotor as shown in Figure 7. This modeling assumption ignores the effects of surface curvature on both the left and right wind tunnel walls (Fig. 3). The turning

6
vane sets upstream and downstream of the test section are not considered as well. These vane sets are located much further away from the rotor model (approximately 421 feet and 447 feet for the front and rear wall, respectively) such that any reflections that occur are of little or no significance due to inverse square law.
Figure 8a demonstrates how the method of images is implemented to account for reflections from a single wall at a distance, d, from the rotor. The wall is interpreted as a mirror that casts an image of the rotor (opposite in rotation). Reflections are accounted for by the sounds radiating from this image system, causing the total acoustic pressure waves arriving at the “direct” microphone to be effectively due to the two counter-rotating rotors. Alternatively, this problem can be viewed as the sum of acoustic pressures, arriving at both the “direct” and “reflected” microphones, that originated from a single rotor. This second interpretation lends itself to be more suitable and efficient for computational studies with the need to set up only one rotor in the analysis. However, it is important to ensure that the summation is exercised at the same physical arrival times (phase-locked to the one-per-rev) to correctly account for the phase-lags associated with the reflection pulse. It is also duly noted that the method of images assumes a rigid wall interface (i.e. fully reflective wih infinite acoustic impedance). This requirement is consistent with the relatively low sound absorptions at the low frequency harmonic tones of interest in this study. Note that the predicted acoustic pressures associated with the “reflected” microphones in the analysis are corrected for sound absorptions (Fig. 5) whenever sound energy is reflected off the wall interface.
The method of images can handle multiple bounces that occur within parallel walls, as well. To consider only the first bounce reflections, only one image needs to be accounted for per wall. Each additional bounce, due to multiple reflections, creates an extra rotor image (of opposite rotation) as shown in Figure 8b. Although the number of bounces is theoretically infinite between parallel walls, it is only necessary to consider the first few that have typically the largest amplitudes. For present study, it was found that up to eight bounces (per wall) was sufficient to obtain a representative state of the reflection sound field.
RESULTS & DISCUSSION
Results for microphones M13 and M14 are presented in this section to illustrate the effects of sound reflections in the wind tunnel. Acoustic time histories shown, correspond to a nominal operating condition of 123 knots airspeed (NFAC Run 57, Point 68, advance ratio of 0.299, shaft tilt of -9.1 degrees, and rotor thrust-to-solidity ratio of 0.075).
Figure 7. Simplification of the wall geometry in
prediction tool
Figure 8. Implementation of the method of images in
acoustics predictions for left and right walls
Microphone M13
Figure 9 first shows the predicted free-field time history at microphone M13 without considering any wall reflections. This microphone is situated within the acoustically-treated portion of the test section (Fig. 4). Compared to wind tunnel measurements, the overall features of the acoustic signature appears to be well represented, with predicted peak negative pressures conforming to wind tunnel data in both amplitudes and pulse-widths. However, similar to the flight test data shown in Fig. 6, small pressure fluctuations that manifest between adjacent pulses are not picked up by this free-field prediction.

7
Figure 9. Comparisons of wind tunnel noise
measurements (microphone M13) to free-field rotor noise predictions
Results from exercising the method of images to account for wind tunnel wall reflections are shown in Figure 10. These results are grouped into acoustic time histories associated with the four surfaces surrounding the rotor. Due to inadequate sound absorptions at the low frequencies, the reflected signals are primarily dominated by the first several rotor harmonic tones, resulting primarily in a sinnusoidal five-per-rev acoustic time history profile. It is of interest to note that most of the reflections originated from floor and ceiling, with relatively insignicant contributions from the left and right walls. Figure 10 also depicts that the first bounce reflection dominates the phenomenon.
Figure 10. Predicted noise reflections from individual
walls at microphone M13
Efforts to predict acoustic time histories in a reflection sound field are shown in Figure 11. This is accomplished by summing the predicted free-field time history (blue) with the predicted reflections previously illustrated in Figure 10. The net is an adjusted time history (red) that is representative of the actual noise measurement in the presence of reflections due to the wind tunnel walls. As shown in Figure 10, the reflection-adjusted time history indicates a “dip” between adjacent peak negative pressure pulses consistent with the measured data (black). While the shape and amplitudes are not well predicted, these results, nonetheless, suggest that these distortion are likely due to sound reflections in the wind tunnel.
Figure 11. Comparisons of wind tunnel noise
measurement with free-field predictions and with reflection-adjusted predictions for microphone M13
Microphone M14
Reflections at microphone M14 are also examined. This microphone requires special attention in the analysis as it was located at the untreated portion of the wind tunnel. Sound absorption coefficients, applied to the acoustic time histories, are tailored accordingly to the location where the reflection bounce occurs. If the bounce occurs at an untreated wall, it is assumed to be fully reflective (i.e. sound absorption coefficients of zeros across all frequencies). Otherwise, sound absorption coefficients described in Figure 5 applies.
Figure 12 illustrates the reflections associated with the four walls at this microphone M14 location. While the general trends are quite similar to previous discussions for microphone M13, the net contribution is no longer only due to the floor and ceiling. Contributions from the left and right walls are found to be significant as well, with amplitudes comparable to those due to the floor and ceiling. When the free-field predictions (blue) are augmented with these reflections, the adjusted time history (red) appears to match the general charcteristics of the measured data (black). Additional oscillations, not observed in the free-field predictions, are predicted by introducing reflections.
Figure 12. Predicted noise reflections from individual
walls at microphone M14

8
Figure 13. Comparisons of wind tunnel noise
measurement with free-field predictions and with reflection-adjusted predictions for microphone M14
CONCLUDING REMARKS
Results from the Boeing-SMART rotor test in the NFAC’s 40- by 80-Foot Wind Tunnel provided insights on the impact of non-ideal sound treatments on low frequency noise measurements in wind tunnel enclosures. The wall interface creates opportunities for acoustic pressure waves to be reflected, particularly at lower frequencies. Subsequent distortions in the acoustics time histories can be prevalent when these spurrious acoustics waves, not absorbed by wall treatments, are reflected into the measurement space. Use of a simplified reflection analysis, based on method of images, demonstrated that these distortions can be, at times, quite significant and may render full-scale rotor noise measurements, below 100 Hz, to be unfeasible for scientific studies.
ACKNOWLEDGMENTS
The first author would like to acknowledge NASA Ames’s Co-op program for providing the opportunity to perform this research. In addition, the authors would like to acknowledge many personnels from NASA, NFAC and Air Force for their helpful discussions and insights. This also includes Mr. Mike Watts (NASA Langley) and Mr. Dave Conner (U.S. Army) for providing the MD-902 flight test data. Many thanks also to Prof. Lakshmi Sankar, Mr. Jeremy Bains, Dr. Kyle Collins, Dr. Nischint Rajmohan (Georgia Institute of Technology) and Dr. Wayne Johnson, Dr. William Warmbrodt (NASA Ames) for their encouragement, advice and support.
REFERENCES
1. Yu, Y. H., Tung, C., van der Wall, B. G., Pausder, H., Burley, C., Brooks, T., Beaumier, P., Delrieux, Y., Mercker, E. and Pengel, K., “The HART II Test: Rotor Wakes and Aeroacoustics with Higher-Harmonic Pitch Control (HHC) Inputs – The Joint German/French/Dutch/US Project”, Proceedings of the 58th Annual Forum of the American Helicopter Society, Montreal, Canada, June 11-13, 2002.
2. Jacklin, S. A., Haber A., de Simone G., Norman, T. R., Shinoda P., “Full-Scale Wind Tunnel Test of an Individual Blade Control System for a UH-60 Helicopter”, Proceedings of the 58th Annual Forum of the American Helicopter Society, Montreal, Canada, June, 2002.
3. Booth, E. R. Jr. and Wilbur, M. L., “Acoustic Aspects of Active-Twist Rotor Control”, Proceedings of the 58th Annual Forum of the American Helicopter Society, Montreal, Canada, June, 2002.
4. Splettstoesser, W. R., Schultz, K. J., van der Wall, B. G., Buchholz, H., Gembler, W. and Niesl, G., “The Effect of Individual Blade Control on BVI Noise- Comparisons of Flight Test and Simulation Results’, Proceedings of 24th European Rotorcraft Forum, Marseilles, France, 1998.
5. Straub, F. K., Vaidyanathan, A. R., Birchette, T., and Lau, B. H., “Wind Tunnel Test of the SMART Active Flap Rotor”, Proceedings of the 65th Annual Forum of the American Helicopter Society, Grapevine, Texas, May 27-29, 2009.
6. Beranek, L. L., Acoustic Measurements, Published by John Wiley & Sons, Inc., New York, 1950.
7. Schmitz, F. H., “Rotor Noise,” Chapter 2 in book authored by Hubbard, H. H., Aeroacoustics of Flight Vehicles, Theory and Practice, Vol. 1: Noise Sources, Published for the Acoustical Society of America through the American Institute of Physics, 1995
8. Soderman, P. T., Schmitz, F. H., Allen, C. S., Jaeger, S. M., Sacco, J. N., Mosher, M., and Hayes, J. A., “Design and Development of a Deep Acoustic Lining for the 40- by 80-Foot Wind Tunnel Test Section,” NASA/TP-2002-211850.
9. Sim, B. W., JanakiRam, R. D., Barbely, N. L., Solis, E., ”Reduced In-Plane Low Frequency Noise of an Active Flap Rotor”, Proceedings of the 65th Annual Forum of the American Helicopter Society, Grapevine, Texas, May 27-29, 2009.
10. Soderman, P. T., Jaeger, S. M., Hayes, J. A. and Allen, C. S., “Acoustic Quality of the 40- by 80-Foot Wind Tunnel Test Section After Installation of a Deep Acoustic Lining,” NASA TP-2002-211851, November 2002.
11. Watts, M. E., Conner, D. A. and Smith, C. D., “Joint Eglin Acoustic Week III Data Report,” NASA TM-2009-XXXX, To be released, 2009
12. Johnson, W. R., “Rotorcraft Aerodynamics Models for a Comprehensive Analysis,” Proceedings of the 54th Annual Forum of American Helicopter Society, Washington, D.C., May 1998
13. Shirey, J. S., Brentner, K. S., Chen, H.-N., “A Validation Study of the PSU-WOPWOP Rotor Noise Prediction System,” 45th AIAA Aerospace Sciences Meeting and Exhibit, Reno, Nevada, January 8-11, 2007.
14. Gibbs, B. M. and Jones, D. K., “A Simple Image Method for Calculating the Distribution of Sound Pressure Levels within an Enclosure,” Acustica, Vol. 26, 1972, pp. 24 – 32.
15. Allen, J. B. and Berkley, D. A., “Imaged Method for Efficiently Simulating Small-Room Acoustics,” J. Acoust. Soc. Am., Vol. 65(4), April, 1979, pp. 943 – 950.