a study into the effect of indoor air temperature on the
TRANSCRIPT

A study into the effect of indoor air temperature on the thermal comfort, health and performance of users in selected naturally ventilated schools in Nigeria.
Charles Yakubu Makun
A thesis submitted to Newcastle University for the Degree of Doctor of Philosophy
School of Architecture, Planning and Landscape Faculty of Humanities and Social Sciences
Newcastle University
October, 2019


i
Abstract
This study investigated the effect of the indoor air temperature in the classrooms of 11 schools in Minna, Nigeria on: (1) the thermal comfort, health and academic performance of a sample of pupils (2) the thermal comfort and productivity of a sample of teachers.
The study involved key literature review into: (a) the contributions of some design features to the indoor air temperature of school buildings (b) the relationship between indoor air temperature, thermal comfort, health and academic performances. Following the literature review, a series of field experiments were conducted in which the thermal comfort, health and academic performance of the pupils from the schools were evaluated at mean air temperature of 25.60C and 34.50C between November-December 2016.Similarly, field surveys of the 11 schools were carried out between March-April 2017 where the thermal comfort and perceived productivity of teachers (respondents) were evaluated at mean air temperatures of 27.70C and 360C. Furthermore, physical surveys of the design features of the classrooms were carried out.
The data from the field experiments were analysed using t-test and Wilcoxon signed rank test, these tests were used to compare the thermal comfort, health and academic performance of the samples at indoor air temperatures of 25.60C and 34.50C. Results of the t-tests and Wilcoxon signed rank test showed that in comparison to the air of temperature of 25.60C, the air temperature of 34.50C significantly affected the thermal comfort, health and academic performance of the samples (pupils) in the mathematics based test .In contrast, there was no significant effect observed in the English language based test. As well, using the data from the field surveys, the study compared the thermal comfort and productivity of teachers (respondents) at 27.70C and 360C. The results showed that; in comparison to the air temperature of 27.70C, the air temperature of 360C significantly affected the thermal comfort and perceived productivity of the respondents.
A descriptive analysis of the data collected from the physical surveys of classrooms suggest that the design features of the classrooms have the propensity of contributing to heat gain and elevated air temperatures indoors. Further analysis of the data from the physical surveys through simulations of the annual thermal performance using IESVE software showed that; the naturally ventilated classrooms procured for public schools in Minna cannot moderate the air temperatures all year round to fall within the standards suggested in previous research for promoting thermal comfort and performances indoors.
Overall, the findings from this study suggests that relatively high indoor air temperatures can have negative effect on the thermal comfort, health and performance of users of school buildings even if the users are presumed to be acclimatised to the tropical climate of Nigeria. Furthermore, the findings from this study provides evidence based data that may be used to promote best practices, policies and funding in the provision of public schools in Nigeria for the sake of the wellbeing and performance of teachers and pupils. Also, the findings from this study which was conducted in a natural setting of a tropical climate strengthens previous research concerning the link between indoor air temperature and performance which were mostly conducted in temperate climates and climatic chambers. Lastly, based on the findings from this study, recommendations that aims to promote thermal comfort and performance in classrooms of public schools in Nigeria were suggested.

ii
Dedication
This thesis is dedicated to my late mum (Mrs. T.T Makun) and my sister (Antonia): both of them passed on within the short period of this study. May their soul rest in peace, Amen.

iii
Acknowledgements
First, I thank God, the Almighty, for His providence in my life throughout the PhD programme. I was most privileged to have the fusion of Dr. John Kamara and Dr. Neveen Hamza as my supervisors. I am very grateful for the high-quality supervision I received from them as evident in their guidance; support, thought-provoking questions and constructive feedback which helped refine my ideas at various stages of the PhD programme. The objective reviews and feedback I received from Prof. Andrew Ballantyne and Prof. Rachael Armstrong at every Annual review Panel that assisted in shaping this work cannot but be mentioned. I also want to extend my appreciation to the Postgraduate Research Secretary, Newcastle University, Mrs. Marian Kyte for her administrative support right from the beginning of the programme. As well, I sincerely appreciate my wife (Mrs. Olayinka Makun) and my son (Mark Mawo Makun) for their immense sacrifice of allowing me to pursue this programme, without their cooperation in all aspects it would have been impossible for me to complete this study as a self-sponsored student. Additionally, I would like to thank the management of the Federal University of Technology, Minna for the study fellowship granted to me in respect of this PhD programme. Also, a very special thanks to Mrs. V.N Kolo the former registrar FUT Minna. I also thank my senior colleagues at FUT Minna for the administrative role they played at various levels and periods as regards the study fellowship for this PhD programme. Particularly: Prof. M.G. Kolo, Prof. S.N Zubairu, Prof. M. Jinadu, Prof. R.E. Olangunju, Dr. P. Ayuba, Dr. Shakirudeen. Mr. E. Gbadafu and Late Mrs Hannah Tsado. Thanks also to the Ministry of Education, Minna, for permitting me to use public schools for the research samples in this PhD study. Many thanks to Dr. S. Kometa for the statistical guidance in this study. Great regards also to Dr. A. Zulfikar for the scholarly contributions during the PhD programme. I acknowledge the immense contributions of the research assistants in this study, Etim, I, Abubarkar, S and Kelechi, O. Similarly, I want to acknowledge the contributions of Babatunde Lanre and Ali Salih in the area of Building Performance Simulation. I also want to express my heart-felt gratitude to Dr. Felix Ogele for his technical and pastoral support all through the length of the PhD programme. Furthermore, I sincerely acknowledge my colleagues for their support in diverse areas (e.g. Wellbeing/academic supports) throughout this PhD programme. Particularly, the following: Arc. Lateef Lawal, Dr. J. M. Musa, Dr. Nor Chiahemba, Dr. Femi Olubogi, Dr. Mohamed Mohammed, Dr Oluwatoyin, Dr Maimuna Saleh-Bala, TPL Julius Nchor, Dr Goran Erfani, Mitra Cheraghi, Idris Yakubu, Felix. D, Thomas Ijere and Harith Omar. Finally, words are inadequate to express my gratitude to Dr Augustine Adamu for his notable contributions towards this PhD study. I also want to appreciate the love and prayers from my entire brothers and sisters.

iv
Table of Contents
Abstract ...................................................................................................................................... i
Dedication ................................................................................................................................. ii
Acknowledgements ................................................................................................................. iii
Table of Contents .................................................................................................................... iv
List of Figures ........................................................................................................................ xiv
List of Tables ....................................................................................................................... xviii
List of Abbreviations ............................................................................................................ xxi
Chapter 1. Introduction ........................................................................................................... 1
1.1 Background to the study ................................................................................................... 1
1.2 The link between design features of buildings, environmental conditions, comfort,
health and performance of users. ............................................................................................ 2
1.3 Overview of previous related studies (effect of air temperatures on thermal comfort,
health and performance) ......................................................................................................... 2
1.4 Problem statement ............................................................................................................ 3
1.5 The aim and objective ...................................................................................................... 4
1.6 The key research questions in this study .......................................................................... 5
1.7 Overview of the key steps in the research design of this study ........................................ 5
1.8 Justification and significance of this study....................................................................... 8
1.9 Scope of the study. ........................................................................................................... 9
1.10 The structure of this thesis .............................................................................................. 9
Chapter 2: Literature Review ............................................................................................... 11
2.1 Introduction .................................................................................................................... 11
2.2 The contributions of some design features of naturally ventilated schools in the tropics
to the air temperatures. ......................................................................................................... 11
2.2.1 Orientation ............................................................................................................... 12
2.2.2 Window strategy (Cross and single sided ventilation) ............................................ 13
2.2.3 The area of window opening ................................................................................... 14
2.2.4 The vertical position of windows ............................................................................ 15

v
2.2.5 Shading devices ........................................................................................................ 16
2.2.6 Verandahs ................................................................................................................. 16
2.2.7 Plants ........................................................................................................................ 17
2.2.8 Depth to height ratio ................................................................................................. 17
2.2.9. Thermal properties of building fabric ..................................................................... 18
2.2.10 .The colour of walls and roofs of buildings ........................................................... 19
2.2.11 Roof vents (openings in the space of pitch roofs) .................................................. 19
2.2.12 Thermal loads from Occupancy and equipment .................................................... 20
2.2.13 Section Summary ................................................................................................... 20
2.3 Effect of indoor air temperature and other related factors on the thermal comfort of
persons .................................................................................................................................. 22
2.3.1 Definition of thermal comfort. ................................................................................. 22
2.3.2 Environmental factors affecting thermal comfort .................................................... 23
2.3.4 Personal factors affecting thermal comfort .............................................................. 26
2.3.5 Other factors affecting thermal comfort ................................................................... 28
2.3.6 Thermal comfort indices .......................................................................................... 30
2.3.7 Thermal comfort standards. ..................................................................................... 31
2.3.8 Thermal comfort studies in the tropics with children in classrooms ....................... 33
2.3.9 Section summary ...................................................................................................... 33
2.4 The effect of indoor air temperature on health of persons .............................................. 34
2.5 The effect of indoor air temperature on academic performance ..................................... 36
2.5.1 The mechanisms by which high air temperatures affects the performance of
academic task. ................................................................................................................... 38
2.6 The effect of some other key environmental and non-environmental factors on the
performance of academic tasks in school environments. ...................................................... 39
2.6.1 Ventilation rate and academic performance ............................................................. 39
2.6.2 Daylighting and academic performance ................................................................... 40
2.6.3 Noise and academic performance ............................................................................ 41
2.6.4 Overcrowding and academic performance ............................................................... 42

vi
2.6.5 Colour in classroom and academic performance ..................................................... 42
2.6.6 Seating arrangement in classroom and academic performance ............................... 43
2.6.7 Socio Economic Status (SES) and student performance in schools ........................ 43
2.6.8 Effect of time of the day on performances .............................................................. 44
2.7 Overview of some standards used for the design of public schools in Nigeria.............. 45
2.7.1 The design approach ................................................................................................ 45
2.7.2 The form of the classrooms and seating arrangement. ............................................ 45
2.7.3 Classroom size and capacity .................................................................................... 46
2.7.4 Site planning ............................................................................................................ 46
2.7.5 Indoor air temperature ............................................................................................. 47
2.7.6 Daylighting .............................................................................................................. 47
2.7.7 Ventilation ............................................................................................................... 47
2.7.8 Noise ........................................................................................................................ 48
2.8 Analytical model deduced from the key themes of literature review in this chapter ..... 48
2.9 Chapter summary ........................................................................................................... 50
Chapter 3. Research Methodology ....................................................................................... 51
3.1 Introduction .................................................................................................................... 51
3.2 Overview of methods employed for research ................................................................. 51
3.3 The research methods utilised for this study and the rationale for their use in this study
.............................................................................................................................................. 52
3.4 Review of research methods commonly used to investigate causal relationships. ........ 56
3.5 Description of the process used for data collection and analysis in respect of the field
experimental research method utilised in this study. ........................................................... 58
3.5.1 Permissions for the field work ................................................................................. 58
3.5.2 The study area .......................................................................................................... 58
3.5.3 The context of public schools in Nigeria ................................................................. 60
3.5.4 Target population ..................................................................................................... 61
3.5.5 The Samples ............................................................................................................ 61

vii
3.5.6 The sample of schools .............................................................................................. 61
3.5.7 Sample size ............................................................................................................... 62
3.5.8 Design features of the classrooms ............................................................................ 62
3.5.9 Measurement of air temperatures in the classroom (Independent factor of study) .. 63
3.5.10 Evaluation of thermal comfort, health, and academic performance (Dependent
factors) ............................................................................................................................... 64
3.5.11 Control of some environmental and Non – environmental factors at each field
experiment in a school. ..................................................................................................... 66
3.5.12 Clothing insulation value (clo value) and metabolism (met) of the samples ......... 69
3.5.13 Design of the field experiment in this study .......................................................... 70
3.5.14. The statistical tests used to analyse data from the field experiments with pupils . 72
3.5.15 Method used for analysing data from the field experiments as regards the effect of
indoor air temperature on the thermal comfort of the samples (pupils) ............................... 75
3.5.16 Method for analysing data from the field experiments in respect the effect of indoor
air temperature on the health of the samples. ....................................................................... 77
3.5.17 Method used for analysing data from the field experiments as regards the effect of
indoor air temperature on the academic performance of pupils (samples). .......................... 79
3.6 Description of the process utilised for data collection and analysis for field survey
research method .................................................................................................................... 81
3.6.1 The schools, sampling strategy and size .................................................................. 82
3.6.2 Instrument used for data collection at the field surveys ........................................... 82
3.6.3 Guide used to construct the questionnaire ............................................................... 82
3.6.4 The research assistants, their role and training for the field surveys with teachers . 83
3.6.5 Pilot survey ............................................................................................................... 83
3.6.6 Description of the items on the questionnaire used for the field surveys ................ 84
3.6.7 The design of the field survey .................................................................................. 84
3.6.8 Procedure for administering the field survey in each school ................................... 85
3.6.9 Control measures ...................................................................................................... 86

viii
3.6.10 Method for analysing data from the field surveys in respect of the effect air of
indoor temperature on the thermal comfort of the respondents (teachers). ...................... 87
3.6.11 Method for analysing data from the field surveys in respect of the effect air indoor
temperature on the productivity of teachers (respondents)............................................... 88
3.6.12 Method for analysing other data collected from the field surveys with teachers .. 90
3.7 The physical survey research method: description of steps used for data collection and
analysis ................................................................................................................................. 90
3.7.1 Data collection from the physical surveys of classroom ......................................... 90
3.7.2 Method used to analyse data from the physical survey of classrooms via descriptive
analysis. ............................................................................................................................ 90
3.7.3 Method used to analyse data from the physical survey of classrooms using the
Building Performance Simulation .................................................................................... 91
3.8 Chapter summary. .......................................................................................................... 95
Chapter 4. Findings from the physical survey of classrooms ............................................ 96
4.1 Introduction .................................................................................................................... 96
4.2 The plan and size of the classrooms. .............................................................................. 96
4.3 The ventilation system, equipment and fittings in the classrooms ................................. 98
4.4 Orientation of the classrooms ......................................................................................... 98
4.5 Plantings (vegetation) ................................................................................................... 101
4.6 The windows ................................................................................................................ 102
4.6.1 The window strategy in classrooms ....................................................................... 102
4.6.2 The opening area of windows ................................................................................ 102
4.6.3 The vertical position of windows .......................................................................... 103
4.6.4 Material used for the windows .............................................................................. 103
4.7 Shading devices ............................................................................................................ 104
4.8 Veranda ..................................................................................................................... 104
4.9 The floor to ceiling height of the classrooms ........................................................... 106
4.10 The depth / height ratio .............................................................................................. 106
4.11 The roof plane ............................................................................................................ 107

ix
4.11.1 The roofing material and the colour ..................................................................... 107
4.11.2 Ventilation of the space beneath the roof and the ceiling ........................................ 107
4.11.3 The ceiling. ........................................................................................................... 107
4.12 The walls and the colour ............................................................................................. 107
4.13 The floors .................................................................................................................... 108
4.14 Key inferences from the findings of the physical surveys. ......................................... 108
4.15 Chapter summary. ....................................................................................................... 110
Chapter 5. Results of data analysis from the field experiments in respect of the effect of
indoor air temperature on the thermal comfort, health and performance of pupils ..... 111
5.1 Introduction ................................................................................................................... 111
5.2 Descriptive analysis of the data from the field experiments ..................................... 111
5.2.1 School and sample size .......................................................................................... 111
5.2.2 Descriptive analysis of samples excluded from the data sets used for the statistical
analysis in this chapter .................................................................................................... 112
5.2.3 Gender / ethnicity of the samples ........................................................................... 113
5.2.4 Age ......................................................................................................................... 113
5.2.5 Insulation value of the school uniform worn by samples (clo value) .................... 114
5.2.6 The values of the air temperatures at the periods when the thermal comfort, health
and academic performance of the samples were evaluated in the 11 classrooms ........... 115
5.3 Results: effect of indoor air temperature on the thermal comfort of pupils .................. 116
5.4 Results: effect of indoor air temperature on the health of pupils (samples) ................. 121
5.5 Results: effect of indoor air temperature on the academic performance in the area of
Mathematics ........................................................................................................................ 123
5.6 Results: effect of indoor air temperature on the academic performance of pupils in the
area of English Language.................................................................................................... 125
5.7 Chapter summary. ......................................................................................................... 127
Chapter 6. Results from analysis of data from the field surveys in respect of the effect of
indoor air temperature on thermal comfort and productivity of teachers ..................... 128
6.1 Introduction ................................................................................................................... 128

x
6.2 The size of the respondents (sample of teachers) ......................................................... 128
6.3 Age and ethnicity.......................................................................................................... 130
6.4 Clo and met values (clothing insulation and metabolism) ........................................... 130
6.5 Respondents (teachers) excluded from the data set and analysis ................................. 130
6.6 The ranges of air temperatures in the classroom during the field surveys with teachers in
schools from group A and B. .............................................................................................. 130
6.7 Result: effect of indoor air temperature on the thermal comfort of (respondents) teachers
............................................................................................................................................ 131
6.7.1 Result of predicted percentage Dissatisfied (PPD) ................................................ 131
6.7.2 Result of predicted mean vote analysis (PMV) ..................................................... 132
6.7.3 Independent t- test result (effect of high temperature on thermal comfort of the
respondents) .................................................................................................................... 133
6.7.4 Gender difference in the effect of indoor air temperatures of 27.70C and 360C on the
thermal comfort of the respondents. ............................................................................... 134
6.8. Effect of indoor air temperature on the productivity of respondent (teachers) ........... 135
6.9 Results from field surveys concerning the views of teachers about symptoms that may
be linked to how high air temperatures affect pupils’ academic performances. ................ 135
6.9.1. Sleepiness ............................................................................................................. 136
6.9.1. Tiredness ............................................................................................................... 137
6.9.3. Restlessness .......................................................................................................... 138
6.9.4. Displeasure to do class work ................................................................................ 139
6.10 Results concerning the views of teachers about the performance the classrooms used
for this study in terms of air temperature, noise, daylighting and air flow ........................ 140
6.10.1 The views of Teachers about the performance the classrooms in the schools used for
this study in terms of air temperature ................................................................................. 140
6.10.2 The views of teachers about the performance the classrooms in the schools used for
this study in terms noise ..................................................................................................... 141
6.10.3 Result: teachers’ views about the performance the classrooms in the schools used for
this study in terms daylighting ........................................................................................... 142

xi
6.10.4 Result: teachers’ views about the performance the classrooms in the schools used for
this study in terms of air flow ............................................................................................. 144
6.11 Chapter summary ........................................................................................................ 145
Chapter 7. Analysis from the building performance simulation ..................................... 146
7.1 Introduction ................................................................................................................... 146
7.2 The rationale for using a typical classroom for carrying out the building performance
simulation. ........................................................................................................................... 146
7.3 Descriptive summary of physical characteristics of the classroom model used for the
building performance simulation. ....................................................................................... 148
7.4 Estimation of the extent to which pupils (samples) do academic task under indoor air
temperatures that are outside the ranges that could affect their performance in classrooms
over an academic year. ........................................................................................................ 150
7.5 Comparison between the measured indoor air temperatures at the field work with that of
the building performance simulation. ................................................................................. 151
7.6. The ranges of air temperatures in the classrooms used for this study during exam
periods in the three academic terms. ................................................................................... 151
7.7 The CO2 concentration levels in classroom .................................................................. 154
7.8 The relative humidity levels in classrooms ................................................................... 156
7.9 The component of the simulated classroom model that is likely to contribute most to
elevated air temperatures indoors ....................................................................................... 158
7.9.1 The U values of the components of the classroom. ................................................... 158
7.9.2 The surface temperatures of the envelope of the simulated classroom model ....... 159
7.10 Chapter summary ........................................................................................................ 160
Chapter 8. Discussions of key findings ............................................................................... 162
8.1 Introduction ................................................................................................................... 162
8.2 Effect of indoor air temperature on thermal comfort .................................................... 162
8.3 Effect of indoor air temperature on health .................................................................... 165
8.4 Effect of indoor air temperature on performance ......................................................... 166
8.5 Chapter summary .......................................................................................................... 169
Chapter 9. Summary of key findings and Conclusion ...................................................... 171

xii
9.1 Introduction .................................................................................................................. 171
9.2 Limitations.................................................................................................................... 171
9.3 Key findings and Conclusions ...................................................................................... 172
9.4. Contributions of the findings from this study ............................................................. 173
9.5 Recommendation for future study from the findings of this study. ............................. 176
9.6 Recommendations of design features that may promote thermal comfort in the
classrooms of public schools. ............................................................................................. 176
Appendices ............................................................................................................................ 179
Appendix A: Permission letter from Niger state Ministry of Education to conduct field
work. ................................................................................................................................... 179
Appendix B: Sample of consent form for parents of the pupils ......................................... 180
Appendix C: Sample of consent form for the pupils .......................................................... 181
Appendix D: Sample of consent form for the teachers ...................................................... 182
Appendix E: Questionnaire used to collect data for control variables ............................... 183
Appendix F: Questionnaire used to evaluate the thermal comfort and health of the samples
............................................................................................................................................ 184
Appendix G: Sample of questions used to evaluate the academic performance of the
samples in the area of mathematics at the field experiments conducted at mean air
temperatures of 25.6 0C in the mornings. ........................................................................... 185
Appendix H: Sample of questions used to evaluate the academic performance of the
samples in mathematics at the field experiments conducted at mean air temperatures of
34.50C in the Afternoons .................................................................................................... 186
Appendix I: Sample of questions used to evaluate the academic performance of the samples
in the area of English language at the field experiments conducted at mean air temperatures
of 25.6 0C in the mornings ................................................................................................. 187
Appendix J: Sample of questions used to evaluate the academic performance of the samples
in the area of English language at the field experiments conducted at mean air temperatures
of 34.5 0C in the afternoons ................................................................................................ 189
Appendix K: Questionnaire used to evaluate the thermal comfort and productivity of the
teachers at the field surveys................................................................................................ 191

xiii
Appendix L: The ranges of air temperatures (7.30am-1.30pm) that could be found in the
classrooms of public schools in Minna on around end of September (beginning of first
term): this is from the building performance simulation results. ........................................ 192
Appendix M: The ranges of air temperatures (7.30am-1.30pm) that could be found in the
classrooms of public schools in Minna around in October (first term): this is from the
building performance simulation results. ............................................................................ 192
Appendix N: The ranges of air temperatures (7.30am-1.30p) that could be found in the
classrooms of public schools in Minna around in November (first term), based on the
building performance simulation results. ............................................................................ 193
Appendix O: The ranges of air temperatures (7.30am-1.30pm) that could be found in the
classrooms of public schools in Minna around early December (about end of first term):
this is from the building performance simulation results.................................................... 193
Appendix P: The ranges of air temperatures (7.30am-1.30pm) that could be found in the
classrooms of public schools in Minna around early January (second term): this is from the
building performance simulation results. ............................................................................ 194
Appendix Q: The ranges of air temperatures (7.30am-1.30pm) that could be found in the
classrooms of public schools in Minna around February (second term): this is from the
building performance simulation results. ............................................................................ 194
Appendix R: The ranges of air temperatures (7.30am-1.30pm) that could be found in the
classrooms of public schools in Minna around March (second term): this is from the
building performance simulation results. ............................................................................ 195
Appendix S: The ranges of air temperatures (7.30am-1.30pm) that could be found in the
classrooms of public schools in Minna around May (Third term): this is from the building
performance simulation results. .......................................................................................... 195
Appendix T: The ranges of air temperatures (7.30am-1.30pm) that could be found in the
classrooms of public schools in Minna around June (Third term): this is from the building
performance simulation results. .......................................................................................... 196
Appendix U: The ranges of air temperatures (7.30am-1.30pm) that could be found in the
classrooms of public schools in Minna around July (Third term): this is from the building
performance simulation results. .......................................................................................... 196
References ............................................................................................................................. 197

xiv
List of Figures
Figure 1.2. Map of Africa showing the position of Nigeria ....................................................... 6
Figure1.4.Overview of research design of the study. ................................................................ 7
Figure 2.1.Literature review map of this study ........................................................................ 11
Figure 2.2 Ilustration showing the orientation of a building with the longest sides on the East-
West axis. ................................................................................................................................. 12
Figure 2.3.Ilustration showing the orientation of a building with the shortest sides on the East-
West axis. ................................................................................................................................. 13
Figure 2.4.An ilustration depicting cross ventilation in buildings. .......................................... 14
Figure 2.5.An ilustration depicting single sided ventilation in buildings ................................ 14
Figure 2.6. Illusration showing how windows are placed within occupancy height 0.9 -2.1m in
buildings. .................................................................................................................................. 15
Figure 2.7. Showing the mode of direct and reflected solar heat transmission through
windows without shading devices............................................................................................ 16
Figure 2.8.Illustration of how trees could limit the penetration of solar radiation incident on
buildings. .................................................................................................................................. 17
Figure 2.9. Ilustration of depth/ height ratio as regards cross ventilation in buildings. .......... 18
Figure 2.10.Visual expression of clo. ...................................................................................... 26
Figure 2.12.The analytical frame work deveoped from the literature review related to the key
aim of this study ....................................................................................................................... 50
Figure 3.1. Summary research methods utilised in this study. ................................................ 55
Figure 3.3.Mean monthly maximum air temperatures in Minna for 2005. ............................. 59
Figure 3.4.The 6-3-3-4 system of education in Nigeria. ......................................................... 60
Figure 3.5.Typical plan of the classroom used for the field experiments in this study . ......... 63
Figure 3.6.The Exitech 445815 thermo/hygrometer used to measure the air temperatures .... 63
Figure 3.7.The Light Meter YK-2005LX used for the field experiments in this study ........... 68
Figure 3.8 ................................................................................................................................. 68
Figure 3.9.The Noise meter used for the experiments in this study ......................................... 69
Figure 3.10. Steps used to analyse data in respect of the effect of indoor air temperature on
thermal comfort of a sample of pupils used for this study ....................................................... 77
Figure 3.11. Steps utilised to analyse data in respect of the effect of indoor air temperature on
the health of a sample of pupils used for the field experiments in this study. ......................... 79
Figure 3.12. Steps used to analyse data in respect of the effect of indoor air temperature on the
academic performance of a sample of pupil utilised for this study. ........................................ 81

xv
Figure 3.13. Steps used to analyse data in respect of the effect of indoor air temperature on the
thermal comfort of a sample of teachers utilised for this study................................................ 88
Figure 3.14.Summary of method used analyse data in respect of the effect of indoor air
temperature on the productivity of a sample of teachers utilised for this study. ...................... 89
Figure 3.15.The axonometric view of a typical classroom used for the simulation in this study
generated from IESVE software. .............................................................................................. 92
Figure 3.16.The 3D model of a typical classroom used in this study generated by IESVE
sotware ...................................................................................................................................... 92
Figure 4.1.Typical plan of a block of classroom in public schools. ......................................... 96
Figure 4.2.Typical plan of a three block of classrooms............................................................ 97
Figure 4.3.Typical plan of a block of four classrooms in public schools in Nigeria. ............... 97
Figure 4.5. Architectural sketch showing the layout of school 1 used for the study. ............... 98
Figure 4.6. Architectural sketch showing the layout of school 3 used for the study ................ 99
Figure 4.7.Architectural sketch showing the layout of school 5 used for the study. ................ 99
Figure 4.8.Architectural sketch showing the layout of school 6 used for the study. .............. 100
Figure 4.9. Architectural sketch showing the layout of school 8 used for the study. ............. 100
Figure 4.10. Architectural sketch showing the layout of school 11 used for the study. ......... 101
Figure 4.12.The positioning of windows on two opposite walls in the classrooms surveyed.
................................................................................................................................................ 102
Figure 4.13.Showing the vertical positioning of windows within the seating heights of the
pupils ...................................................................................................................................... 103
Figure 4.14.The metal sashes of the windows of the classrooms surveyed in this study Source.
Fieldwork by author (2017). ................................................................................................... 103
Figure 4.15. Back side of the classrooms surveyed. ............................................................... 104
Figure 4.16.IIustration suggesting that veradahs could reduce direct solar penetration in to
classrooms during school periods in situations when classrooms are facing the east directly .
................................................................................................................................................ 105
Figure 4.17. IIustration suggesting that veradahs may not be able to protect classrooms from
penetration of solar radiation after schools periods in situations when classrooms are facing
the west directly . .................................................................................................................... 105
Figure 4.18. Cross section showing the floor to ceiling height of a typical classroom surveyed
in this study ............................................................................................................................. 106
Figure 4.19.Cross section of a typical classroom surveyed showing the depth as well as the
height . .................................................................................................................................... 106
Figure 4.20.The external colour of walls of classrooms in public schools. ........................... 108

xvi
Figure 5.1.Distribution of the 18 pupils (samples) excluded from the data analysis in this
study. ...................................................................................................................................... 113
Figure 5.2. Distribution of boys and girls in the sample used for the field experiments ....... 113
Figure 5.3.Age distribution of the samples used for the field experiments ........................... 114
Figure 5.4. Distribution of clo values of uniform worn by the samples used for the field
experiments. ........................................................................................................................... 114
Figure 6.2. Distribution of respondents from schools in group B ......................................... 129
Figure 6.3.Result of the descriptive statistics from respondents in group A with respect to
symptoms of sleepiness exhibited by pupils at high air temperatures ................................... 136
Figure 6.4.Result of the descriptive statistics from respondents in group B with respect to
symptoms of sleepiness exhibited by pupils at high air temperatures. ................................. 137
Figure 6.5.Result of the descriptive statistics from respondents in group A as regards
symptoms of tiredness exhibited by pupils at high air temperatures . ................................... 137
Figure 6.6.Result of the descriptive statistics from respondents in group B as regards
symptoms of tiredness exhibited by pupils at high air temperatures. .................................... 138
Figure 6.7.Result of the descriptive statistics from respondents in group A as regards
symptoms of restlessness exhibited by pupils at high air temperatures. ................................ 138
Figure 6.8. Result of the descriptive statistics from respondents in group B as regards
symptoms of restlessness exhibited by pupils at high air temperatures. ................................ 139
Figure 6.9. Result of the descriptive statistics from respondents in group A as regards
symptoms of restlessness exhibited by pupils at high air temperatures. ................................ 139
Figure 6.12.Result of the descriptive statistics from schools in group B with respect to the
performance of classrooms used for the field surveys in terms of air temperature. .............. 141
Figure 6.13.Result of the descriptive statistics from respondents in group A with respect to the
performance of classrooms in public schools of Minna in terms of noise. ............................ 142
Figure 6.14. Result of the descriptive statistics from respondents in group B with respect to
the performance of classrooms in public schools of Minna in terms of noise ....................... 142
Figure 6.15. Result of the descriptive statistics from respondents in group A with respect to
the performance of classrooms in public schools of Minna in terms of daylthing . .............. 143
Figure 6.16. Result of the descriptive statistics from respondents in group B with respect to
the performance of classrooms in public schools of Minna in terms of daylthing . .............. 143
Figure 6.17.Result of the descriptive statistics from respondents in group A with respect to the
performance of classrooms in public schools of Minna in terms of airflow. ......................... 144
Figure 6.18. Result of the descriptive statistics from respondents in group B with respect to
the performance of classrooms in public schools of Minna in terms of airflow. ................... 144

xvii
Figure 7.1. Mean hourly indoor air temperatures for 180 school days for a typical classroom
used for this study. .................................................................................................................. 148
Figure 7.2.The plan of the block of classroom used for the building performance simulation
................................................................................................................................................ 149
Figure 7.3.The axonometric view of the block of classroom used for the building performance
simulation ............................................................................................................................... 149
Figure 7.4.Mean hourly indoor and out door air temperatures in the sample of schools used
for this study. .......................................................................................................................... 150
Figure 7.5.The ranges of air temperatures in the classroom of public schools in Minna for 10
school days corresponding to the first term examination periods around early December. ... 152
Figure 7.6.The ranges of air temperatures in the classroom of public schools in Minna for 10
school days corresponding to the second term examination periods around early April. ...... 152
Figure 7.7.The ranges of air temperatures in the classroom of public schools in Minna for 10
school days corresponding to the third term examination period around the end of July. ..... 153
Figure 7.8. The ranges of CO2 concentration levels in a classroom of public schools in Minna
for school days in October (part of first term) ........................................................................ 155
Figure 7.9.The ranges of CO2 concentration levels in a classroom of public schools in Minna
for school days in February (part of second term).................................................................. 155
Figure 7.10.The ranges of CO2 concentration levels in a classroom of public schools in Minna
for school days in June (part of third term) ............................................................................ 156
Figure 7.11.The ranges of humidity levels in a classroom of public schools in Minna for
school days in October (First term) ........................................................................................ 157
Figure 7.13.The ranges of humidity levels in a classroom of public schools in Minna for
school days in June (part of third term) .................................................................................. 158
Figure 7.14. surface temperatures of the components a classrooms for a typical school day in
November. (Part of first term) ................................................................................................ 159
Figure 7.15.The surface temperatures of the components a classroom for a typical school day
in March (part of second term). .............................................................................................. 160
Figures 7.16. Surface temperatures of the components of classrooms for a typical school day
in June ( part of third term). .................................................................................................... 160

xviii
List of Tables
Table 1.1.Summary of previous studies related to the effect of air temperature on thermal
comfort and performance. .......................................................................................................... 3
Table 2.1.Summary of the contribution of some design features to the indoor of naturally
ventilated school buildings to the indoor air temperatures. ..................................................... 22
Table 2.2.The speed of air using fan and the thermal comfort range achieved from the study of
Mallick (1996). ........................................................................................................................ 25
Table 2.3. The clo values of some clothing worn by men and women usually considered in
thermal comfort studies as adopted from ASHRAE (2004). ................................................... 27
Table 2.4. Metabolic rates of humans usually considered in assessing the thermal comfort of
humans as adopted from ASHRAE (2004). ............................................................................. 27
Table 2.5. Summary of studies suggesting that no differences between the thermal comfort
conditions between the young and old. .................................................................................... 28
Table 2.6. Thermal sensation scale often used to measure the thermal comfort of persons
indoors. ..................................................................................................................................... 31
Table 2.7.The ranges air temperatures specified by some standards for thermal comfort
indoors ...................................................................................................................................... 33
Table 2.8.Thermal comfort temperatures identified by authors in the classrooms of schools in
tropical climates ....................................................................................................................... 33
Table 3.1. Code name of schools generated for the study ....................................................... 62
Table 3.2. Sample size from the 11 schools used for this study .............................................. 62
Table 3.3.The 7 point ASHRAE (2004) thermal sensation voting scale used measure thermal
comfort in this study ................................................................................................................ 64
Table 3.4.The five point Likert scale used to measure the pupil perception to some symptoms:
.................................................................................................................................................. 64
Table 3.5. Example of the table used to collate the result of the academic performance tests
for each of the 11 schools. ....................................................................................................... 66
Table 3.6.The breakdown of the estimated clo value of uniform worn by the samples used for
this study. ................................................................................................................................. 70
Table 3.7.The procedure for conducting each field experiment in the morning (low temp) at
the classroom of the 11 schools used as samples in this study. ............................................... 71
Table 3.8.The model procedure for conducting each field experiment in the afternoon (high
temp) at the classroom of the 11 schools used as samples...................................................... 72
Table 3.9. Result of Skew and kurtosis tests on thermal comfort votes. ................................. 76
xix
Table 3.10. Result of Skew and kurtosis tests on data concerning perceptions of thirst,
headache, fatigue, sweating and displeasure. ........................................................................... 78
Table 3.11.Result of normality test for Mathematics and English scores of the samples utilised
for the field experiments in this study. ..................................................................................... 80
Table 3.12. The randoml distribution of the 11 schools into group A and B . ....................... 85
Table 3.13.The estimated clo values of the clothing worn by the respondents of the field
surveys as adopted from ASHRAE (2004). ............................................................................. 86
Table 3.14. Result of Skew and kurtosis tests on thermal comfort votes of the respondents of
the ield surveys. ........................................................................................................................ 87
Table 3.15. Descrption of the basic construction matreials utilised for creating the base case
model for the building performance simulation in this study. .................................................. 93
Table 3.16.The descrption of the profiles used for the building performance simulation in this
study . ....................................................................................................................................... 94
Table 5.1.Distributions of samples from the 11 schools used for the field experiments ........ 111
Table 5.2. The values of the air temperatures in the classrooom when the thermal comfort,
health, and academic performance of the sample were assesed at field the experiments ...... 115
Table 5.3. Result from the analysis of PMV( statistical averages of the thermal sensation votes
used to measure the thermal comfort of the samples at 25.6 and 34.50C at the field
experiments) ........................................................................................................................... 116
Table 5.4.Result of the descriptive analysis of PPD .............................................................. 117
Table 5.5. Dependent t-test results:effect of indor air temperature on the thermal comfort of
pupils ...................................................................................................................................... 118
Table 5.6. Dependent t-test results showing the output where data was obtained for calculating
the effect size .......................................................................................................................... 119
Table 5.7 Independent t-test result (Gender difference in the effect of mean air temperature of
25.6 0C and 34.50C on the thermal comfort of the samples used for the field experiments). 120
Table 5.8.Result of dependent t-tests in Mathematics for each of the 11 schools.................. 124
Table 5.9.Part of SPSS 24 t-test output where the values of M and SD used to calculate the
effect size in the area of mathematics were obtained. ............................................................ 124
Table 5.10. Result: gender effect in the academic performance of pupils in mathematics) ... 125
Table 5.11. Result of dependent t-tests in English for each of the 11 schools. ...................... 126
Table 5.12.Result of independent t-tests (Gender difference in the performance samples in
English at 25.60C (low temp) ................................................................................................. 126
Table 5.13.Result of independent t-tests (Gender difference in the performance samples in
English at 34.50C (high temp). ............................................................................................... 127

xx
Table 6.1. Distribution of samples by gender from group A and B ....................................... 129
Table 6.2. Distribution of respondents by gender from schools in group A .......................... 129
Table 6.3. Distribution of respondents by gender from schools in group B .......................... 129
Table 6.4. distribution of samples by age (group A and B) ................................................... 130
Table 6.5.Mean air temperatures in the classrooms during the field survey with respondents in
schools in group A. ................................................................................................................ 131
Table 6.6. Mean air temperatures in the classrooms during the field survey with respondents
in schools in group B. ............................................................................................................ 131
Table 6.7.Result of the PPD analysis of samples from schools in group A at mean air
temperatures of 27.7 0C. ......................................................................................................... 132
Table 6.8.Result of the PPD analysis of samples from schools in group B at mean air
temperatures of 360C. ............................................................................................................. 132
Table 6.10.Perceived productivity vote used to evaluate the productivity of the respondents of
at the field surveys ................................................................................................................. 135
Table 6.11.The item used to collect the data at the field surveys of this study concerning the
views of teachers about symptoms exhibited by pupils when the air temperatures turns hot in
classrooms .............................................................................................................................. 136
Table 6.12Table showing the questionaire used to survey the views of teachers about the
performance of classrooms in the public schools used for field surveys ............................... 140
Table 7.1.Values of mean hourly indoor air temperatures for 180 school days in a typical
classroom used for this study during occpancy and non occupancy periods . ...................... 147
Table 7.2. Values of mean hourly indoor air temperatures for 180 school days during daily
occupancy period(07.30- 13.30) for a typical classroom used for this study as deduced from
................................................................................................................................................ 147
Table 7.3. Summary of the comparison between the indoor air temperature measured at the
field work and that of the building performance simulation. ................................................. 151
Table 7.4.U values of the materials that make up the envelope of a typical classroom used for
this study from the simulation output in this study. ............................................................... 158

xxi
List of Abbreviations
The abbreviations and symbols used within this thesis are presented in full as follows:
C02: Carbon dioxide
Clo: Clothing insulation value
JSS3: Junior Secondary School level 3
M/Sec: Meter per Second
PMV: Predicted Mean Vote
PPD: Predicted Percentage Dissatisfied
PPM: Person Per Million
NMOE: Niger state Ministry OF Education
UBE: Universal Basic Education
WHO: World Health Organisation


1
Chapter 1. Introduction
1.1 Background to the study
After the return of the democratic rule in Nigeria and the launch of the Universal Basic
Education (UBE) programme in 1999, the federal government of Nigeria has continued to
invest in the provision of public schools that usually depend on natural ventilation across the
36 states and the federal capital city of the country. These schools are often delivered across the
country in the form of classrooms blocks with similar design features. Given this background,
I have had the privilege as a professional from the built environment to participate in the
supervision of the construction of some of the classrooms provided for public schools in some
locations of Niger state which is one of the 36 states in Nigeria.
Following my participation in the supervision mentioned above and my background knowledge
of the works of some authors (Wargocki and Wyon, 2007; Barrett and Zhang, 2009; Barrett et
al., 2015), I became motivated towards developing a research topic around examining whether
the naturally ventilated classrooms provided for pupils to learn in public schools of Nigeria
promotes or negates their comfort, health and performance. Interestingly, the works of several
authors which were mostly conducted in temperate climates suggests that school design
features( e.g. Location, orientation and layout) and the indoor environmental conditions (e. g.
air temperature, noise, lighting, ventilation and air quality) could be detrimental to the comfort,
health and performance of users (Heschong, 2002; Shield and Dockrell, 2004; Mendell and
Heath, 2005; Wargocki and Wyon, 2007; Barrett and Zhang, 2009; Barrett et al., 2015).
However, limited by scope, time and resources, this study is focused on investigating the
relationship between one of the indoor environmental conditions (air temperature) in
classrooms of public schools in Nigeria and the thermal comfort, health and performance of the
users (teachers and pupils).This was mainly due to the fact that, amongst the physical conditions
that are required for student achievement in school environments, Earthman (2004) ranks
temperature as the first. Similarly, studies by Sonne et al. (2006) and Barrett et al. (2016)
suggest that elevated air temperature is the most problematic variable to the of work teachers
and pupils in comparison to other physical variables (e.g. humidity, air quality, light, and noise)
in school environments.

2
1.2 The link between design features of buildings, environmental conditions, comfort, health and performance of users.
Design features of buildings could directly influence the environmental conditions indoors,
Figure 1.1. In turn, the environmental conditions created as a result of the design features could
directly influence the health and comfort and performance of users (Mendell and Heath,
2005).The mechanism behind how indoor environmental conditions of buildings affects the
performance of task is collectively or individually by, arousal, discomfort, distraction, fatigue
and displeasure, (Mendell and Heath, 2005; Wargocki and Wyon, 2017). Figure1.1 below
summarises the link between design features of buildings, environmental conditions, comfort,
health and performance of users.
Figure1.1.The link between design features of buildings, comfort, health and performance
Source. Adopted from Mendell and Heath (2005).
1.3 Overview of previous related studies (effect of air temperatures on thermal comfort, health and performance)
There are studies spanning over four decades with evidences to show that relatively high or low
indoor air temperatures have adverse effect on the thermal comfort, health and performance of
tasks in schools and offices (Auliciems, 1972; Wyon et al., 1979; Wargocki and Wyon, 2007;
Zeiler and Boxem, 2009; Lan et al., 2010; Lan et al., 2011; Cui et al., 2013; Porras‐Salazar et
al., 2018). Against this background, find in Table 1.1 a summary of previous studies related to
the effects of indoor air temperatures on the thermal comfort, health and performance of
persons.
Reference/country Climate Findings Peccolo (1962). USA Temperate The performance of academic task was significantly
better for pupils at indoor air temperatures in the range of 15-230C in comparison to the range of 22-270C.
Pepler and Warner (1971)/USA
Temperate The academic test scores of pupils were higher at air temperatures of 230C in comparison to 260C.

3
Schoer and Shaffran (1973)/USA
Temperate The academic performance of the pupils were significantly higher at indoor air temperatures of 22.50C in comparison to 260C
Wyon et al. (1975) .Demark
Temperate (climatic chamber experiment)
The authors reported no significant difference in the cognitive performance of the students between indoor air temperatures of about 18.70C and 23.20C.
Humphreys (1977).UK Temperate Thermal discomfort of the samples was positively related to rise of indoor air temperatures.
Jaakkola et al. (1989) Finland
Temperate Rise of indoor air temperature correlated positively with some Sick building syndromes.
(Nelson et al., 1984).Canada
Temperate (climatic chamber experiment)
Air temperature of 300C exacerbated symptoms of tiredness and performance decrements in the task administered to the subjects.
Kahl (2005).USA Temperate No significant performance decrement was reported amongst the subjects exposed to different indoor air temperatures of about 15, 20, 22 and 26.60C.
(Wyon et al., 1979).Denmark
Temperate (climatic chamber) experiment)
The speed by which multiplication task was performed by the male subjects at the experiment was significantly reduced at 280C.
Pilcher and Huffcutt (1996).USA
Temperate (meta –analytic review)
High air temperatures of about 32.220C and low air temperatures of 100C below have negative consequences on performance of cognitive tasks.
Mäkinen et al. (2006).Finland
Temperate Exposures to cold air temperatures of about 10 0C have negative effects on cognitive performance.
Wargocki and Wyon (2007).Demark
Temperate Performance of school work by pupils was significantly higher at indoor air temperatures of 200C than at 250C.
Melikov et al. (2013).Denmark
Temperate (climatic chamber experiment)
Health, comfort and performance of the samples significantly decreased at 260C and 280C in comparison to 230C
Park (2016) USA Temperate Temperatures above 260C is detrimental to the performance of academics task by students
Porras‐Salazar et al. (2018).Costa Rica
Tropical Reducing air temperature in the classroom from 300C to 250C increased the performance of cognitive related tasks by pupils
Choi et al. (2019) China
Sub-tropical (Climatic chamber experiment)
Relatively high temperatures is detrimental to the attention span of persons during the performance of academic task.
Table 1.1.Summary of previous studies related to the effect of air temperature on thermal
comfort and performance. Source. Author of this thesis.
1.4 Problem statement
Since the return of the democratic rule in Nigeria in 1999, the Federal government has invested
billions of Naira (Nigerian currency) into the public school sector (Universal Basic Education,
2018).Part of the billions of Naira mentioned here are often used for the procurement of

4
infrastructure for learning which includes the procurement of public schools that usually depend
on natural ventilation irrespective of the tropical climate of Nigeria .
Given the amounts used in the procurement of schools that usually depends on natural
ventilation earlier mentioned above, one problem in this study is that; there appears to be no
published data that reveals whether the naturally ventilated classrooms procured for learning in
public schools of Nigeria promotes or negates the thermal comfort, health and performances of
the users (teachers and pupils). Another problem in this study is that, previous studies
summarised in Table 1.1 suggest that there are few studies that are related to the effects of air
temperatures on performance of tasks in schools, however most of them (e.g. Wargocki and
Wyon (2007) ; Melikov et al. (2013) have been conducted in the temperate climates and in
artificial chambers ; an investigation that considers the natural setting of schools in a tropical
climate is therefore needed.
1.5 The aim and objective
Therefore, propelled by the two problems earlier presented in the past section, this study aims
to investigate the effect of indoor air temperature in select public schools of Nigeria on:
1. The thermal comfort, health and academic performance of pupils.
2. The thermal comfort and productivity of teachers.
In respect to the aim of this study, the objectives are as follows.
1. To investigate how building design features contributes to the indoor air temperatures of
naturally ventilated school buildings in the tropics.
2. To investigate how air temperatures within buildings impacts on thermal comfort, health
and academic performance of users.
3. To analyse the relationship between indoor air temperatures of a sample of public schools
in Nigeria and; (a) the thermal comfort, health and performance pupils (b) the thermal
comfort and productivity of teachers.
4. To make recommendations for the design of classrooms to enhance thermal comfort and
performance in public schools of Nigeria.
However, it is in this study noted that academic performances is not only influenced by physical
factors such as air temperature indoor air quality, day lighting, acoustics, classroom size and
furniture. There are equally other factors that affect academic performances beyond these
physical factors. For instance, the psychosocial factors that relate to socio economic - status

5
(SES) and personal attributes such as wellbeing and mood. However limited by scope and time
this study will not lay emphasises on the psychosocial factors that affect academic
performances.
1.6 The key research questions in this study
With respect to the aim and objectives of this study, the key research questions which this
study anticipates to answer are listed below.
1. What design features are likely to contribute to high indoor air temperatures in the
classrooms of public school buildings in Nigeria?
2. To what extent do the air temperatures in classrooms of public schools affect the thermal
comfort, health and academic performance of pupils?
3. To what extent do the air temperatures in classrooms of public schools affect the thermal
comfort and productivity of teachers?
4. Do the ranges of indoor air temperatures in the classrooms public schools in Nigeria fall
within: (a) the ranges prescribed by some international thermal comfort standards? (b) The
ranges suggested by some authors for optimum performance of task?
1.7 Overview of the key steps in the research design of this study
The first major step towards responding to the aim and objectives of this study was the review
of related literatures that was informed by the link between, design features, environmental
conditions, comfort and performance, Figure 1.1. The literature review ends up with an
analytical model in chapter 2 (section 2.8, Figure 2.12). Following the first step (literature
review) and the establishment of an analytical model earlier mentioned here, the second major
step in this study was the conduction of field studies (i.e. Field experiments, field surveys,
physical surveys). The field studies were conducted in the tropical climate of Nigeria, which is
unlike previous studies that focused on temperate climates and laboratory settings.
Nigeria is the macro study area of the present study. The country is a tropical country that is
posited along the west coast of Africa between latitudes 40 and 140 N, Figure 1.2. Places or
countries with tropical climates are generally characterised by warm air temperatures most time
of the year (McGregor and Nieuwolt, 1998). In Nigeria, outdoor air temperatures in cities that
are close to the coast (e.g. Lagos) could read up to 350C and above 400C in towns like Yola that
are further away from the coast (Nigerian Metrological Agency, 2016). See Figure 1.3 for the
temperature profiles of some towns in the country. Nigeria is characterised by two distinct
seasons, the wet and dry seasons. The wet season is approximately between April to September

6
and the dry seasons is between October and March(IIoeje, 1999).Also, Nigeria has a land mass
of about 923,768 square kilometers and it comprises of 36 states and one federal capital city
called Abuja.
In view of the key steps as regards the research of this study highlighted in the first paragraph
of this section, Figure 1.4 illustrates the research design in this study.
Figure 1.2. Map of Africa showing the position of Nigeria
Source.https://www.worldatlas.com/webimage/countrys/africa/ng.htm
Figure 1.3.Average outdoor air temperatures of three locations in Nigeria between 1980-
2001as adopted from Adeniyi et al. (2009)
05
10152025303540
Out
door
air
tem
pera
ture
0 C
Sokoto Nguru Maiduguri

7
Figure1.4.Overview of research design of the study. Source. Author

8
1.8 Justification and significance of this study
The justification for carrying out this study lies on the strength that most of the studies earlier
summarised in Table 1.1 of this chapter concerning the relationship between air temperature,
thermal comfort and performances suggests that they have been carried out strictly in temperate
countries as well as in laboratories (Climatic chambers). As such, there are possibilities that the
findings from studies carried temperate climates and laboratories may not have any relevance
to people that live in tropical climates and performing real work in their natural environment,
this is for two main reasons. Firstly, findings from some authors (Nicol, 2004; Wijewardane
and Jayasinghe, 2008; Baruah et al., 2014; Hamzah et al., 2018) suggest that people living in
the tropics can tolerate relatively high air temperatures indoors, as such there are tendencies
that high temperatures may not be in any way detrimental to their thermal comfort and the
performances. Secondly, the result of studies conducted in laboratory settings may not be
applicable pupils in real live settings partly because of contextual difference between laboratory
settings and real live settings.
By investigating the effect of indoor air temperatures in public schools of Nigeria on the thermal
comfort, health and academic performance (scores) of users, this study may be able to estimate
the extent to which the thermal comfort, health and academic performance of pupils can be
affected by high air temperatures. In turn, this could be utilised as evidence based findings that
may stimulate the adoption of best design practices and policies in the construction of public
schools in Nigeria.
Also, the findings of this study hopes to contribute to the scanty studies with evidences showing
the effect of indoor air temperature on the thermal comfort, health and performance of pupils
in tropical climates. This is because much of the studies conducted by some authors with respect
to indoor environmental factors (air temperatures and ventilation) in the tropics tends to have
focused on determining optimum conditions for indoor air temperatures and ventilation as well
as strategies for achieving the optimum conditions (Kwok et al., 1998; Wong and Khoo, 2003;
Feriadi and Wong, 2004; Wafi and Ismail, 2010).
Finally, the findings of this study may contribute to strengthen the findings of previous research
of by some authors concerning the effect of indoor environmental conditions in classrooms on
the performance of academic task by pupils (Wargocki and Wyon, 2007; Zeiler and Boxem,
2009; Haverinen‐Shaughnessy et al., 2011; Bakó-Biró et al., 2012; Toftum et al., 2015).

9
1.9 Scope of the study.
In view of the aim and objectives of this study stated in chapter 1, this study is centered on how
design features of naturally ventilated buildings in the tropics contributes to the indoor air
temperatures and the thermal comfort of occupants. Also, the study is centered on how indoor
air temperature affects the thermal comfort, health and academic performances of pupils in
school environments. This does not suggest that the present did not consider how other
environmental and non-environmental factors affects the academic performances of pupils in
schools.
1.10 The structure of this thesis
This thesis is divided into nine chapters as follows:
Chapter one: The chapter provides: The background of the study, summary of previous
research on indoor air temperature/performance, the problem statement, aim and objectives of
the study, overview of the research design, justification and significance of the study, scope of
the study. The chapter ends up with this section which provides an overview of the contents in
each of the nine chapters of this thesis.
Chapter 2. This chapter presents a review of relevant literatures. The first section of chapter 2
provides the introduction to the chapter. The second section focuses on literature review
concerning the contributions of design features of naturally ventilated school buildings in the
tropics to the indoor air temperatures. This review was carried out in order to understand how
design features influences the air temperature and thermal comfort of occupants in naturally
ventilated school buildings in the climatic context where the study was under taken.
Furthermore, the third section of chapter 2 focuses on a literature review concerning the effect
of indoor air temperature and other related factors on the thermal comfort of person’s indoors.
The third section of the literature review in this chapter focusses on the effects of indoor air
temperature on the health and performance of academic task in schools. The fourth section of
this chapter presents a literature review concerning the effects of other key environmental and
non-environmental factors on the performance of academic task by pupils in schools. The fifth
section of the literature review in this chapter presents an overview of the key standards often
utilised for the construction of public schools in Nigeria. Lastly, chapter 2 ends up with an
analytical model and a chapter summary.

10
Chapter 3.The contents of this chapter is devoted to the methodology. In view of this, the
chapter includes the following key themes: the epistemological view point of this study,
overview of the research methods utilised in this study and the rationale for their use, and lastly
description of the process used to collect and analyse data for each of the research methods
utilised for this study.
Chapter 4, presents the findings from the physical survey of the design features of the schools
(classrooms) used for this study. Findings from the physical survey of the classrooms aims to
reveal the potential contributions of the design features of the classrooms used for this study to
the indoor air temperature.
Chapter 5, presents the results from the analysis of data from the field experimental research
method used in this study. Overall, the results in this chapter (5) are related to the effect of
indoor air temperature on the thermal comfort, health and academic performances of the
samples (pupils) used for this study.
Chapter 6, provides the results from the field survey research method utilised in this study.
The main results in this chapter concerns the effect of indoor air temperatures on the thermal
comfort and productivity of teachers in the schools used as samples. Also, this chapter presents
result as regards the views of teachers about the signs often exhibited by pupils when the air
temperatures turns relatively high in classrooms. This result is an attempt to gain insight of how
high air temperatures affects the performance of tasks by pupils in classrooms. Furthermore
chapter 6, presents the results concerning the views of teachers about the performance of
classrooms in the schools used for this study in terms of the following: air temperature, noise,
and daylighting and air flow.
Chapter 7, presents the analysis from the building performance simulation (dynamic thermal
study). Chapter 8 discusses the findings from the results in chapter 4, 5 and 6 and 7 with respect
to the aim and key research questions posed by the analytical model in this study. Chapter 9,
provides the followings: limitations, summary of key findings from this study, conclusions, and
recommendations.

11
Chapter 2: Literature Review 2.1 Introduction
This chapter presents a review of relevant literature that is focused on the following key themes.
(1) The potential contribution of design features of naturally ventilated school buildings in the
tropics to the indoor air temperature. (2)The effect of indoor air temperature and other related
factors on the thermal comfort of occupants. (3)The effect of indoor air temperature on health.
(3)The effect of indoor air temperature on academic performance. (5) Effect of some other key
environmental and non-environmental factors on academic performance in school
environments. Also, a review of standards utilised for the design of public schools in Nigeria is
presented in this chapter. In view of the background of this chapter provided here, the chapter
is divided into nine sections as shown in the literature review map in Figure 2.1.
Figure 2.1.Literature review map of this study
2.2 The contributions of some design features of naturally ventilated schools in the tropics to the air temperatures.
In line with the literature map in Figure 2.1, this section considers how some key design features
(e.g. orientation, windows, and shading) of naturally ventilated school buildings in the tropics
contributes to the indoor air temperatures.

12
2.2.1 Orientation
Orientation as a design feature may contribute to the indoor air temperatures of a naturally
ventilated school building in the tropics in two main ways.
Firstly, a naturally ventilated school building (e.g. classroom) without appropriate shading
strategies that is oriented with the length (longest sides) along the East - West axis (Figure 2.2)
has the potential of exposing a relatively large surface area of the walls and openings to solar
heat gain during day time. Consequently, this may contribute to the development of elevated
air temperatures in the classroom and thermal discomfort for the occupants. Secondly, orienting
a naturally ventilated classroom in the tropics with its breadth (shortest sides) on the East-West
axis has the potentials of reducing the amount solar heat gain indoors. By extension, this may
promote to low air temperatures in the classroom during day times and thermal comfort
(Kukreja, 1978; Givoni, 1994; Rabah and Mito, 2000; Tantasavasdi et al., 2001; Ling et al.,
2007; Liping and Hien, 2007; Sharma, 2016; Zahiri and Altan, 2016).
From above, in order to promote relatively low air temperatures in school buildings of the
tropics particularly in classrooms, it may be desirable to orientate the classrooms with the
longest sides along the North – South axis and the shortest sides along the East – West axis,
Figure 2.3.
Figure 2.2 Ilustration showing the orientation of a building with the longest sides on the East-West axis. Source. Author.

13
Figure 2.3.Ilustration showing the orientation of a building with the shortest sides on the East-
West axis. Source. Author
2.2.2 Window strategy (Cross and single sided ventilation)
The main function of windows in buildings is to provide ventilation and day lighting as well as
visual and auditory continuity between indoor and outdoor. However as regards ventilations,
windows positioned on two different sides of the walls (cross ventilation) of a naturally
ventilated classroom in the tropics has the inclination of enhancing the rate at which hot air
indoors may be transported outdoors depending on the prevailing wind speed and direction.
Consequently, this could contribute to lowering of the air temperatures indoors as well as
promoting the thermal comfort of the users particularly during hot seasons (Awbi, 1994;
Givoni, 1994; Garde et al., 2001; Tantasavasdi et al., 2001). See Figures 2.4 for an illustration
concerning cross ventilation in buildings.
In contrast, positioning windows on only one side of the wall of a classroom that depends
strictly on natural ventilations in the tropics (single sided ventilation) could lead to lower rate
of dissipation of hot air from indoors. Consequently, this can promote elevated air temperatures
in the classroom with the capability of impairing the thermal comfort of the users. Broadly, in
terms of thermal comfort, single sided ventilation is not often suitable for occupants in naturally
ventilated of buildings in the tropics, but it may be suitable for buildings in temperate climates
as mentioned by (Awbi, 1994). See Figure 2.5 for an illustration of single sided ventilation in
buildings.

14
Figure 2.4.An ilustration depicting cross ventilation in buildings. Source: Guedes (2019)
Figure 2.5.An ilustration depicting single sided ventilation in buildings. Source: Author
2.2.3 The area of window opening
The area of opening could contribute to the indoor air velocity of naturally ventilated school
buildings in the tropics as well as the thermal comfort of the occupants .This is because
windows with relatively large openable surface areas of inlet and outlet that are positioned away
from direct sunlight in naturally ventilated buildings of the tropics has the potentials of
enhancing the rate at air exchanges indoors. Consequently, this may contribute towards
lowering air temperatures indoors (Givoni, 1994).
Furthermore, windows with small openable areas are features of tropical vernacular houses as
a means of limiting solar heat gain during the day times. However at night, windows with small
openable areas have been documented not to be effective in flushing stratified hot air outdoors.

15
This has the tendencies of influencing the air temperatures indoors towards being high. This
view is supported by the notion that occupants living in some vernacular houses of the tropics
with small windows often experience thermal discomfort at night time, therefore they often
sleep in courtyards or on decked roofs as a means of achieving thermal comfort(Givoni, 1998).
In sum, for the sake of enhancing thermal comfort in a naturally ventilated buildings (e.g. school
buildings) , it has been suggested that the window to wall area ratio (W/R) should be about 25%
(Al-Tamimi et al., 2011).Also, in order to promote low air temperatures in naturally ventilated
buildings , the percentage of window to floor area should be in the range of 20% -25%(Kukreja,
1978; Tantasavasdi et al., 2001).
2.2.4 The vertical position of windows
The vertical Positioning of windows in a naturally ventilated school building (e.g. classroom)
in hot regions within seating and standing heights (e.g. occupancy heights, 0.9 -2.1m) have the
tendency of enhancing the dissipating the heat surrounding the human body indoors to the
outdoors. Consequently, this can promote physiological cooling of the body and relatively low
air temperatures in the classroom. On the other hand, when the windows of a naturally
ventilated school building (e.g. classroom) is positioned above occupancy heights, there is the
tendency that the air flow may not be effective in transporting hot air surrounding the human
body from inside to the outdoors. By extension this can contribute to elevated air temperatures
in the classroom. See Figure 2.6 for an illustration of the positioning of window within
occupancy heights in buildings.
Figure 2.6. Illusration showing how windows are placed within occupancy height 0.9 -2.1m in
buildings. Source. Author

16
2.2.5 Shading devices
Solar penetration through windows is a major source of heat gain in naturally ventilated
buildings (Chenvidyakarn, 2007). This might be the one reason that lead to the development of
shading devices in buildings. Shading devices generally assist in curtailing the transmission of
direct and reflected rays from the sun in to buildings (Kukreja, 1978). This suggest that shading
devices have the potentials of limiting the amount of indoor solar heat gain into naturally
ventilated classrooms in the tropics which may in turn contribute to lowering of the indoor air
temperatures particularly during hot periods (Ralegaonkar and Gupta, 2010).
Drawing from past paragraph, it can be deduced that a naturally ventilated school building in
the tropic that the windows are designed without appropriate shading devices have the potential
of contributing to solar heat gain and elevated air temperatures indoors. See Figure 2.7 for an
illustration of a mode by which solar heat could be transmitted indoors via windows of buildings
without shading devices.
Figure 2.7. Showing the mode of direct and reflected solar heat transmission through windows
without shading devices. Source. Author
2.2.6 Verandahs
Verandahs generally have the potential of preventing the interiors of naturally ventilated
buildings of the tropics from the adverse effect of solar radiation and rainfalls (Givoni 1998).
In this way, verandah can contribute towards lowering the indoor air temperatures in a school
building. In contrast, when verandahs are not employed as design features of school buildings

17
in the tropics particularly when the openings are positioned on the east and west facades, this
can contribute to excessive solar heat gain and elevated air temperatures indoors.
2.2.7 Plants
Trees, tall shrubs, grasses and vines have the potentials to absorb relatively large amount of
direct and reflected solar radiation that may be incident on the fabric of buildings and the
interiors (Huang et al., 1987; Givoni, 1998; Gomez-Muñoz et al., 2010; Shashua‐Bar et al.,
2011; de Abreu-Harbich et al., 2015; Ridha et al., 2018).This attribute of plants mentioned here
have the possibility of limiting the amount of solar heat gain into naturally ventilated school
buildings in the tropics there by contributing to low air temperatures indoors. On the other hand,
when plants(e.g. trees, tall shrubs, grasses) are not integrated as design features of naturally
ventilated school buildings particularly in very hot areas of the tropics, the fabric (openings,
roofs and walls) of such school buildings are likely to be exposed to direct and reflected heat
gain. This may contribute to the development elevated air temperatures indoors. See Figure 2.8
for an illustration of how trees can limit solar heat gain incident on buildings.
Figure 2.8.Illustration of how trees could limit the penetration of solar radiation incident on
buildings. Source: Author
2.2.8 Depth to height ratio
In order for a building to be effectively ventilated, the depth (width) between two opposite walls
that have windows should not exceed five times the floor to ceiling height of the interior space
as given by the formular d<5xh(DfES, 2006b). This suggests that the ability of transporting
heat from indoors to outdoors via the windows may be retarded when the depth (width) between

18
two windows on the opposite walls of a naturally ventilated school building in the tropics is
greater than five times of the floor to ceiling height. By extension, his could contribute to heat
buildup and rise in air temperatures in the school building. See Figure 2.9 concerning
depth/height
d<5xh
Figure 2.9. Ilustration of depth/ height ratio as regards cross ventilation in buildings. Source. Adopted from DfES (2006b).
2.2.9. Thermal properties of building fabric
The fabric of a building consist of components such as, roof, walls and floors. Generally the
fabric of buildings could influence the air temperatures in naturally ventilated buildings because
of two main physical attributes, thermal mass (heat capacity) and thermal resistance property
of the fabric. These attributes are discussed below with respect to how they may contribute to
the indoor air temperatures of naturally ventilated school buildings in the tropics.
Thermal mass
Naturally ventilated school buildings (e.g. classrooms) in the tropics which have their fabric
made up of materials with high thermal mass have the capacity to absorb relatively large amount
of solar heat gain without transmitting them indoors at daytimes. This could limit the
occurrences of elevated air temperatures indoors of school buildings during the daytimes
(Cheng et al., 2005).
From paragraph above, it could be deduced that naturally ventilated school building (e.g.
classrooms) in the tropics which have their fabric made of materials with high thermal masses
have the tendency to curtail the development of relatively high temperatures indoors at
daytimes. Generally, the thermal mass attribute of mud walls and roofs accounts for the reason

19
behind their extensive use in many African traditional houses as sustainable solution for thermal
comfort indoors during daytimes.
Thermal resistance
Thermal resistance (U value) of a building’s fabric is another attribute that can influence the
indoor air temperatures of naturally ventilated buildings in the tropics. The thermal resistance
often referred to as U value is a measure of the amount of heat passing through a building
material or component , such as concrete walls, glazed windows and walls (Al-Homoud, 2005)
(Al –Homoud 2005).Generally buildings (e.g. school buildings) with fabrics made from
material of low U values have the potentials to resist or frustrate the rate of solar heat gain
indoors particularly during hot periods thereby curtailing the development relatively high
indoor air temperatures(Givoni, 1976; Kukreja, 1978; Al-Jabri et al., 2005).
From above, it could be deduced that naturally ventilated school buildings (e.g. classrooms) in
the tropics that have their fabric made from materials of high U values have the tendencies of
accelerating the rate by which solar heat could be gained indoors. In turn, this may contribute
to elevated air temperatures in the classrooms if natural ventilation fails.
2.2.10 .The colour of walls and roofs of buildings
It has been demonstrated by experiments that dark coloured surfaces of walls and roofs have
the capacity to absorb solar heat indoors in comparison to lightly coloured surfaces of walls and
roofs (Givoni and Hoffman, 1968; Bansal et al., 1992). Thus, in view of the findings from the
experiments reported here, it can be inferred that naturally ventilated school buildings (e.g.
classrooms) in the tropics with dark coloured roofs and walls could promote solar heat gain into
the classrooms which may in turn contribute to elevated air temperatures. Inversely, naturally
ventilated school buildings (e.g. classrooms) in the tropics which have the surfaces of their
walls and roofs lightly coloured have potentials of reflecting heat gain incident indoors and
promoting relatively lower air temperatures indoors in the school buildings.
2.2.11 Roof vents (openings in the space of pitch roofs)
There are studies with evidence concerning the effect of roof vents on the air temperatures of
buildings. For example, (Givoni, 1976) reported that the findings of Van Stratten et al. (1957)
tends to show that buildings with roof vents that are located in hot regions could be beneficial
towards limiting the rise of ceiling and indoor air temperatures. The finding of Van Stratten et
al. (1957) reported here appears to suggest that roof vents could be beneficial to the design of

20
naturally ventilated classrooms in the tropics for the sake of lowering the indoor air
temperatures.
2.2.12 Thermal loads from Occupancy and equipment
Heat gain from peoples and equipment in a building can contribute to the thermal loads in the
same building (Awbi, 1994).Also, findings from a study by Ding et al. (2016) suggests that
reasonable amount of heat can be gained indoors of buildings from lighting, occupants and
equipment. In sum, the review in this subsection suggest that occupants and heat generating
appliances in school buildings that depends strictly on natural ventilation in the tropics can
also contribute to the heat gain indoors and elevated air temperatures.
2.2.13 Section Summary
The summary of the literature reviewed in the preceding sub-sections are presented in Table 2.1
below. Table 2.1 brings the first part of the literature review in this chapter to an end.
No Design features of naturally
ventilated school buildings in the
tropics that may contribute to
elevated air temperatures indoors
Design features of naturally ventilated school
buildings in the tropics that may contribute
to lowering of the air temperatures indoors
1. Orienting the longer sides on East –
West axis may promote heat gain and
high air temperatures indoors.
Orienting the shortest sides on the East-West
axis may reduce indoor heat gain and high air
temperature.
2. Single sided ventilations frustrates the
rates at which hot air could be
transported from indoors to outdoors,
this could contribute to the development
of high air temperatures
Cross ventilation assist to enhance the rate of
transporting hot air from indoors to outdoors,
thus contributing towards promoting low air
temperature and thermal comfort in buildings.
3 Windows with relatively small openable
areas limits air exchanges between
Windows with large openable surfaces areas
have the tendencies speed up the rate air

21
indoors and outdoors. Also windows
positioned at high levels may limit the
transportation of hot air surrounding the
human body. Both design features
mentioned here can contribute to high
air temperatures in tropical buildings
exchanges between indoors, thus enhancing low
air temperatures.
Windows positioned within occupancy heights
have potentials to enhance the transportation of
hot air surrounding the human body outdoors.
Both design features mentioned here can
contribute to low air temperatures in tropical
buildings
4 Naturally ventilated school buildings in
the tropics without shading devices and
appropriate orientation strategies may
encourage the penetration of direct and
reflected solar radiations into the
interiors of building.
Shading devices reduces the penetration of solar
radiations incident on the interiors, this has the
potential of contributing to low air temperatures
indoors during hot seasons.
5 Naturally ventilated school buildings
without verandas in the tropics may
encourage direct solar gain indoors and
high air temperature
Verandas have the potentials to curtail the
amount of solar radiations that may penetrate
the interiors of schools buildings, thus
contributing towards lowering the air
temperatures.
6 Naturally ventilated school buildings
without plants around them have
potentials for huge solar heat gains and
high air temperatures.
Plants (trees, tall shrubs, vines and lawns)
planted around naturally ventilated buildings of
the tropics have the potentials to curtail heat
gain indoors and high air temperatures.
7 Depth of indoor spaces in naturally
ventilated school buildings greater than
5 times the floor to ceiling height may
inhibit the rate of ventilation and
promote elevated air temperatures
indoors.
Cross ventilated indoor spaces less with the
width less than five times the floor to ceiling
height have tendencies of promoting air
exchanges between indoors and outdoors. This
promotes heat loss from the interiors and
lowering of air temperatures indoors.
8 Fabrics of school buildings with low
thermal mass have capabilities for heat
gain and high air temperatures indoors.
Fabrics of school buildings of high thermal
masses have the potentials to delay heat gain
indoors during day times.

22
9 Naturally ventilated school buildings
with fabrics of low thermal resistance
values have the inclination to promote
the rate of solar heat gain indoors and
high air temperatures
Fabric of naturally ventilated school buildings
in the tropics with high thermal resistance
values have potentials to curtail the rate of heat
gain in to the indoor spaces with the tendencies
reducing day time air temperatures indoors.
10 Dark coloured surfaces of roofs and
walls of schools buildings can promote
heat gain indoors and elevated indoor air
temperatures.
Lightly coloured surfaces of the roofs and walls
of naturally ventilated school buildings in the
tropics can curtail solar heat gain solar and high
indoor air temperatures.
11 Naturally ventilated school buildings of
the tropics without roof vents may
contribute to solar heat gain and high air
temperatures.
Roof vents in naturally ventilated schools
buildings of the tropics have the capability to
curtail high indoor air temperatures.
12 High occupancy density and radiant
heat generating equipment have the
potential of contributing to heat gain and
elevated air temperatures in school
buildings in the tropics.
Naturally ventilated School buildings in the
tropics with appropriate daylighting strategy
and occupancy density can reduce heat gain and
high air temperatures.
Table 2.1.Summary of the contribution of some design features to the indoor of naturally ventilated school buildings to the indoor air temperatures. Source. Author
2.3 Effect of indoor air temperature and other related factors on the thermal comfort of persons
This section (2.3) presents a literature review that is focused on the effect of air temperature
and other related factors on the thermal comfort of persons indoors.
2.3.1 Definition of thermal comfort. Thermal comfort is the condition in which a person or group of persons expresses satisfaction
with the thermal environment(Standard, 1994; ASHRAE 55, 2010). Also, thermal comfort
refers to the state that person feels neither cold nor hot (Fanger, 1973) .In the same light Givoni
(1976) refers to thermal comfort in terms of how hot or cold a person feel. The definition of
thermal comfort by Fanger (1973) and Givoni (1976) mentioned here may be more applicable
to peoples who do not belong to the world of building science. This is because people in their
daily lives commonly express their thermal comfort in terms of how hot or cold an environment
is to them. In view of the definition of thermal comfort provided here, find in the subsequent
subsections of this section (2.3) factors that affect the thermal comfort of persons indoors.

23
2.3.2 Environmental factors affecting thermal comfort
Air temperature
Air temperature refers to the temperature of air surrounding an occupant in a space (Parson,
2003; ASHRAE 55, 2010). Air temperature is the most significant individual thermal factor
that affects the thermal comfort of human beings(CIBSE, 2006; Auliciems and Szokolay,
2007). The mechanism behind how air temperatures can affect the thermal comfort of human
beings can be explained in two ways.
Firstly, exposures to relatively low (cold) air temperatures could lead to reduced skin
temperatures and shivering as signs of thermal discomfort. If the exposures continues and the
body fails to restore the core temperature to normal, the fingers, toes and ear lobes of a person
may be starved of blood supply. This could in turn result to manual dexterity and pains in those
parts of the body, and in extreme exposures to cold for a long period, hypothermia and death
may occur. Secondly, when the human body is exposed to relatively warm or hot air, blood
supply to the skin increases as well as skin temperatures. This may be followed by feeling of
warmth on the skin and sweating: in severe exposures to hot air temperatures, the health of a
person can be impaired, even death may occur(Auliciems and Szokolay, 1997; Parson, 2003).
Coming back to the main subject of this subsection which is the effect of air temperature on
thermal comfort, there are studies with demonstrable evidences of the effect of relatively high
and low air temperatures on thermal the comfort of humans. For instance, a thermal comfort
study conducted by Webb (1959) in Singapore suggests that temperatures between 27 0C (800F)
to 310C (880F) resulted to thermal discomfort due warmth for approximately 30 -100% percent
of the subjects used for the study.
Similarly, Lan et al. (2010) reported from their investigation carried in an office building that
relatively low and high air temperatures of about 170C and 280C respectively resulted to thermal
discomfort for the subjects. This means the subjects felt cold when they were exposed to the air
temperature of 170C during the investigations and hot when they exposed to air temperatures
of about 280C. Also, the result of a climatic chamber study by Cui et al. (2013) indicates that
the subjects were thermally uncomfortable at air temperatures of 290C and 320C.Their result
suggest that high air temperatures in the range of 290C and 320C can affect the thermal comfort
of persons in doors.
More recently, and of direct relevance to school environment is the experiment by Porras‐
Salazar et al. (2018). The authors examined the thermal comfort and performance of 11 years
old pupils in Costa Rica at indoor air temperatures of about 300C and 250C. The result of the

24
experiment by Porras‐Salazar et al. (2018) showed that about 60% of pupils were thermally
dissatisfied at air temperature of 300C . In sum, their findings suggest that indoor air temperature
of 300C affected the thermal comfort of most of the pupils used as samples for their experiment.
On the whole, the studies of the authors reviewed above tends to show that indoor air
temperatures that are lower or higher than what World Health Organisation (1984) prescribes
for thermal comfort indoors is detrimental to the thermal comfort of humans. Ormandy and
Ezratty (2012) documented that the World Health Organisation (1984) prescribes temperatures
of 180C -240C for the thermal comfort and wellbeing of humans indoors. Also, the studies of
the authors reviewed above tends to agree with the hypothesis of Humphreys (1977), the author
hypothesised from his work that feelings of warmth correlated positively with rise of indoor air
temperatures. The hypothesis of the author mentioned here suggest that as indoor temperature
increases, the feeling of warmth and thermal discomfort is likely to increase.
Relative Humidity
The percentage of water vapor in the air is referred to as relative humidity (ASHRAE 55, 2010).
The mechanism behind how relative humidity affects thermal comfort is as follows: at high air
temperatures and high relative humidity, the rate of evaporation of sweat from the human body
is likely to be frustrated (slow). In turn, this can result to thermal discomfort due increased skin
temperature and skin wettedness (Bauman et al., 1996).
As regards the effect of relative humidity on thermal comfort, Atmaca and Yigit (2006)
examined the impact of humidity on skin wettedness and skin temperature. Their finding
showed that high relative humidity (70 -90 %) and high air temperatures (300C and above) can
result to thermal discomforts. In the same light, Berglund (1998) reported that thermal
discomfort is likely to increase with relative humidity. The report by Berglund (1998) here
appears to show that a linear relationship exists between thermal discomfort and humidity.
Furthermore, findings from a climatic chamber study by Jing et al. (2013) suggests that high
air temperatures of about 300C and high relative humidity of about 80-84% affected the thermal
comfort of subjects used for their study. In contrast , Fountain et al. (1999) reported that high
humidity in the range of 60 - 90% and high air temperatures between 200C - 260C had no
marked effect on the thermal comfort of the pupils.
To conclude, most of the work of the authors in the literature review presented in this sub-
section suggests that a combination of high air temperatures (300C above) and humidity (90%
above) in buildings have the potential to affect the thermal comfort of persons indoors.

25
Air speed (Air velocity)
The rate at which air moves regardless of the direction is referred to as air speed ASHRAE 55
(2004). The mechanism by which air speed influences the thermal comfort of a person are in
two ways. The first, reasonable air speed assists in the effective transportation of heat from the
human body (skin) at elevated temperatures via accelerating the rate evaporation of sweat from
the skin. The second, relatively high air speed have the potential of enhancing the rate by which
the heat surrounding a human body indoors can be transported outdoors by convection. The
mechanisms reported here by which air speed influences the thermal comfort of humans
probably accounts for why Sodagar (1991) mentioned that heat and moisture must be
transported away from the body and its surrounding by reasonable air speed for thermal comfort
to be achieved.
In addition to the above, there are several studies with evidence that reveals the effect of air
speed on thermal comfort. For example, Indraganti et al. (2012) showed that, increasing the air
speed via the use of fans increased the thermal comfort of the subjects used for their
experiments at air temperatures of about 31.5 0C. The finding of Indraganti et al. (2012)
suggests that if the wind speed in an indoor space is increased by mechanical means, people
living in hot regions of the world could still be thermally comfortable at relatively high air
temperatures. In the same light Mallick (1996) conducted a study on thermal comfort in
Bangladesh, the findings of Mallick (1996) showed that increasing air movement by the use of
ceiling fans increased the thermal comfort range of the subjects used for the study, Table 2.2.
Similar findings to the works of the authors reviewed in the past paragraph of this subsection
have been reported by several authors (Srivajana, 2003; Toftum, 2004; Arens et al., 2013;
Simone and Olesen, 2013).
In sum, the literature reviewed in this subsection, suggest that relatively high air speeds have
the capability of enhancing the rate of heat loss from the human body thereby boosting the
thermal comfort of humans at high air temperatures indoors.
S/No Speed of fan m/sec Comfort range(0C) 1 0 24-33
2 0.15 24-33
3 0.30 26.4-35.2
4 0.45 27-35.8
Table 2.2.The speed of air using fan and the thermal comfort range achieved from the study of
Mallick (1996).

26
Radiant heat
Radiant heat refers to the heat that radiates from the surfaces of warm objects (HSE). In
buildings located in tropical climates, radiant heat can be emitted from the surfaces of heated
walls and floors as well as from equipment and appliances as well as the occupants themselves.
This can contribute to high air temperatures indoors and thermal discomfort. Furthermore, in
cold climates radiant heat in buildings can be gained from heating appliances, however if
heating appliances are not managed or regulated appropriately it can result to overheating of
the interior which may in turn affect the thermal comfort of the occupants.
2.3.4 Personal factors affecting thermal comfort
Clothing
Clothing is a form of barrier to heat flow between man and the environment (Havenith, 2002;
Tiwari, 2010; Kwon and Choi, 2013).Clothing can affect the thermal comfort of a person in
two ways as presented here. Firstly, when a person feels cold, clothing with relatively high clo
values has the likelihood of insulating the body from gaining cold air from outside as well as
preventing the body from losing heat, thus keeping the person thermally comfortable. Secondly,
when a person becomes hot in an environment, clothing with relatively low clo values can
promote heat loss from the body in order to restore thermal comfort. For example, wearing light
T- shirt and short pant could help restore thermal comfort on very hot days. Furthermore, the
thermal insulation values of clothing is expressed in clo (Gagge et al., 1941).As regards clo,
Find in Figure 2.10 the visual expressions of clo as well as in Table 2.3 the clo values of some
common clothing worn by males and females.
Figure 2.10.Visual expression of clo. Source. Auliciems and Szokolay (1997)

27
Male clo Female clo Trousers thin 0.15 Skirt thin 0.14 Trousers thick 0.24 Skirt thick 0.23 Shorts 0.06 Short sleeve shirt dress 0.29 Overalls 0.30 Long sleeve shirt dress 0.33 Coveralls 0.49 Sleeveless blouse 0.13 Men’s brief 0.04 Panties 0.03 T shirt 0.08 Bra 0.01 Long sleeve dress shirt 0.23 Sleeveless short gown 0.18 Short sleeve shirt 0.19 Sleeveless long gown 0.20 Long sleeved sweat shirt,
0.34 Long sleeve gown 0.46
Ankle socks 0.02 Knee socks 0.06 shoes 0.02 Shoes 0.02 Sandals 0.02 Sandals 0.02 Boots 0.10 Boots 0.10 Slippers 0.03 Slippers 0.03
Table 2.3. The clo values of some clothing worn by men and women usually considered in
thermal comfort studies as adopted from ASHRAE (2004).
Metabolic rate (M)
The rate at which heat is being produced and released by oxidation processes from the human
body per unit time is referred to as metabolic rate (M). The amount of heat produced by human
beings depends on the activity level of the individual (ASHRAE 2004; CIBSE, 2006). This
suggest the thermal comfort of a person can be affected by the activity level of the individual.
By extension, this may account for the reason why the thermal comfort requirements for
buildings differ because of the nature of activities that takes place in them. Find in Table 2.4
the metabolic rates often considered in thermal comfort studies.
Activity Metabolic rate Sleeping 0.7 Reclining 0.8 Sedentary work (office or school) 1.2 Sawing 1.8 Walking about 1.7 Steady medium work(social dancing) 2.4 - 4.4 Heavy work 4.0
Table 2.4. Metabolic rates of humans usually considered in assessing the thermal comfort of
humans as adopted from ASHRAE (2004).

28
2.3.5 Other factors affecting thermal comfort
Age
Metabolic rate (rate of heat production by the body) in humans tends to decline with age
(Fanger1973). This suggest that it is expected that the thermal comfort temperatures or
conditions between young and old peoples should differ. Interestingly, under the same
conditions (i.e. same clo value and metabolic rate) there exist no significant difference in the
thermal comfort and skin temperatures of the young and old as summarised in Table 2.5 by
Fanger (1973). Ellis (1953) share similar view. The author (Ellis, 1953) reported that there is
no significant difference observed in the thermal comfort conditions of the subjects used for the
study due differences in age. Thus far, the main idea from the works of authors discussed here
is that provided the activity and metabolic rates are same, there is likely not to be any differences
in the thermal comfort temperatures or conditions between the young and old.
Author Mean age
Preferred temperature 0C
skin temperature 0C
Nevins et al (1966) 21 25.6 No record Fanger (1970) 23 25.7 No record Fanger (1970) 68 25.7 No record Rohles and Johnson(1972) 74 24.5 No record Technical university of Denmark 1972
24 25.4 33.5
Technical university of Denmark 1972
84 25.4 33.2
Table 2.5. Summary of studies suggesting that no differences between the thermal comfort conditions between the young and old. Source. Fanger (1973)
Gender
An early field study by Ellis (1953) in Singapore reported that there is no marked difference in
the thermal comfort condition of the male and female subjects used in the study. Humphreys
(1977) reported similar findings from a field study with pupils in some elementary schools in
the UK. The author reported that there was no gender difference in thermal comfort condition
of boys and that of the girls used as samples for the study.
A more recent field study in Israel by Becker and Paciuk (2009) also documents that there is
no significant difference in the thermal comfort of the males and females used as subjects for
the study. Likewise the findings from a recent study by Liu et al. (2011) also suggest that there
is no significant gender difference in the thermal comfort of the male and female students used
for their study. Similarly, the findings of two different field surveys of thermal comfort

29
conducted with elderly peoples suggest that there is no significant difference in the thermal
comfort of the male and female subjects (Wong et al., 2009; Hwang and Chen, 2010).
In contrast to the findings of the authors previously reviewed in the last two paragraphs above,
the findings of some authors suggest that significant gender differences do exist in thermal
comfort. For example, Lan et al. (2008) observed that there was a significant gender difference
in the thermal comfort temperatures in a sample of Chinese peoples used for their study.
Additionally, a literature review concerning thermal comfort and gender by Karjalainen (2012)
reported that over half of the studies reviewed suggests that females are more significantly
dissatisfied than males under the same thermal environments. The finding from the literature
review by Karjalainen (2012) suggest that gender difference do exist in thermal comfort.
However, a reason for gender difference in thermal comfort as noted by Lan et al. (2008) is
often due to differences in clothing insulation values worm by males and females. This study
tends to agree with the view offered by Lan et al. (2008) concerning a reason for gender
difference in thermal comfort. This is because in some cultures the average clo value of the
clothing worn by women could be higher than that worn by males and vice versa. To conclude,
evidences from literatures presented in this subsection concerning gender differences in thermal
comfort appears to reveal that inconsistencies do exist. This is suggests an area for future studies
by researchers.
Personality, culture and Illness
There are tendencies that people who are “notable” in the society could be restricted to a
particular kind of thermal environment for the sake of security, this suggests that such calibre
of people have little chances of modifying their thermal comfort by adaptive means. The
implication here is that the thermal comfort requirements for such kinds of people with high
personality could differ from persons who are living without restrictions. In this way,
personality could affect the thermal comfort of a person.
As regards the effect of culture on thermal comfort, in some cultures of the world the customary
way by which men and women are mandated to dress could play a role on their thermal comfort.
For example in some cultures women are mandated to dress in Burqa at home and public in
places. This suggest that culture is likely to play a role in the thermal comfort requirements of
women in such cultures.
Illness and some form of medical disabilities are conditions that could affect the thermal
comfort of persons. In a situation where a person is ill or disabled the adaptive opportunities

30
that are available to a person in such conditions may be limited, therefore this may have some
consequences on the thermal comfort of that person. Also, some long term illness may require
a person to be on some medications that may often elevate the core body temperatures of that
person above the normal (370C), in this way illness has the potential of affecting the thermal
comfort of a person.
Behavioural response
It has been suggested that people tend not to be passive in their thermal environment, because
they often react to thermal discomfort by exhibiting some behavioural responses towards
restoring their thermal comfort (Humphreys and Nicol, 1998; Nicole et al. 2012). This suggests
that if people have the tendencies to apply behavioural traits in restoring their thermal comfort,
behavioural traits could then be attributed to the factors that can affect the thermal comfort of
a person. Some of behavioural traits by which peoples often tend to influence their thermal
comfort indoors include but are not limited to the followings: taking a cold drink when it is hot,
sleeping in courtyards during hot periods or staying indoors or cold days, opening and closing
of windows and the control of mechanical ventilating and heating systems at homes or offices.
Psychological and physiological traits of a person
Psychological traits of a person can affect thermal comfort, this is based on the idea that person
who has lived or accustomed to a particular thermal environment for a long period tend to be
psychologically accustomed to accepting the prevailing level of heat or cold in that
environment. Also, the physiological traits of a person could possibly lead to the increased
resistance to stresses that some environmental variables may impose on a person .This implies
that someone who is a native of a tropical climate and has lived there for a long period is likely
to be physiologically adapted to tolerate relatively high air temperatures (Nicol and Humphreys,
1998).
2.3.6 Thermal comfort indices
Predicted Mean Vote (PMV) and Predicted Percentage Dissatisfied (PPD)
The PMV and the PPD are thermal comfort indices commonly used for assessing the thermal
comfort of a person or groups of persons. The PMV indices suggests that in a thermal comfort
assessment , a person voting outside -1, 0, and +1 on the seven point ASHRAE-55 thermal
sensation scale presented in Table 2.6 is thermally dissatisfied with the indoor environment (air
temperature). This means a person voting within the range of -1, 0, and +1 during a thermal
comfort assessment indicates that the person is thermally comfortable in the particular
environment.

31
-3 -2 -1 0 +1 +2 +3
Cold Cool Slightly
cool
Neutral Slightly
warm
Warm Hot
Table 2.6. Thermal sensation scale often used to measure the thermal comfort of persons indoors. Source. ASHRAE (2004).
The PPD indices suggests that in a thermal comfort assessment when more than 20% of the
persons in an indoor space are voting in the range outside -1, 0, and +1 on the thermal sensation
scale shown above, the persons are thermally dissatisfied. This means for a group of persons to
be referred to as thermally comfortable in a space, 80% their votes is expected to fall within -
1, 0, and +1 on the ASHRAE (2004) thermal comfort scale shown in the Table 2.6.
The adaptive indices
The adaptive thermal comfort indices was developed based on the idea that in naturally
ventilated buildings people can tolerate a wide range of thermal conditions the thermal comfort
conditions (De Dear and Brager, 2002; Santamouris, 2006; Roaf et al., 2010) Based on this
idea, ASHRAE established an equation as an additional indices to the PMV and PPD for
assessing the thermal comfort of persons indoors, the equation is shown below.
Tcomf = 0.31 x Taout + 17.8 (equation 1)
Tcomf = Thermal comfort temperature,
0.31and 17.8 are derived constants
Taout = the mean out door air temperatures measured during the adaptive survey.
2.3.7 Thermal comfort standards.
In the course of the nineteenth century researches focused on the establishment of standards
that guides the health and safety of peoples working under severe conditions such as coal mines,
mills, factories. This is because of the relatively high rate of illness and death that were
discovered to be related to working in the aforementioned environments during the nineteenth
century. However, due to the increasing use of the air conditioning systems in the twentieth
century, a new focus for standards emerged. This lead to standards focusing on defining
temperatures at which people could best perform various task in several air conditioned spaces
(Ackermann, 2010; Nicol et al., 2012).

32
From above, the main point is that the existing standards for indoor environments today are
meant to ensure that peoples are safe, healthy, comfortable and productive in the different
thermal environments where they live, travel or work.
Thus far, as regards standards for thermal comfort indoors, three widely known standards exist
today. The three standards are discussed briefly in the next three paragraphs of this section.
ASHRAE-55(American Society of Heating Refrigeration and Air conditioning Engineers) is an
international thermal comfort standard. The key purpose of ASHARE 55 is to specify the
conditions by which the combinations of the key six thermal comfort factors would create the
thermal condition acceptable to 80-90% people in a setting. The thermal comfort factors
considered by this standard are, air temperature, wind speed, humidity, radiant temperature,
clothing, and metabolic rate. Recently, ASHRAE 55 has included the adaptive model as part of
the method for determining the acceptable thermal conditions indoors.
ISO 7730 (International Standard Organisation) is an international standard for specifying and
determining conditions for thermal comfort indoors for existing and new buildings. ISO 7730
is similar to ASHRAE-55 because they both specify and determine thermal conditions by the
use of PMV and PPD indices employing the key six thermal comfort factors earlier mentioned
above. PMV and PPD means Predicted Mean Vote and Predicted Percentage Dissatisfied
respectively.
EN15251 (European standard) is an indoor environmental standard that is established to
specify optimum conditions for thermal comfort, lighting, noise and indoor air quality in
buildings for the sake of performance buildings in the areas of energy ,comfort and wellbeing.
The main difference between EN15251 from the other two standards earlier discussed above is
as follows. The scope of EN15251 covers the specifications for indoor air quality, acoustics and
lighting while ASHRAE 55 and ISO 7730 focusses mainly on thermal comfort. Nevertheless,
EN 15251 have been noted to follow similar direction to ASHRAE 55 in the specification of
thermal comfort conditions based on the PMV and the adaptive indices (Nicol et al 2012).
In sum, the main idea from the three standards discussed above is that they are all utilised for
specifying the acceptable thermal comfort conditions in buildings as well as the methods to be
used for determining the thermal comfort conditions. Adding to this, find in Table 2.7 the ranges
of acceptable operative indoor air temperatures specified by the three standards discussed in
this subsection.

33
Standard Summer 0C Winter 0C
ASHRAE 55 (2004) 23-28 20-25.5
ISO 7730 22 - 27 19-25
EN 15251 22 - 27 19-25 Table 2.7.The ranges air temperatures specified by some standards for thermal comfort indoors. Source. (Charles et al., 2005; Roaf et al., 2010)
2.3.8 Thermal comfort studies in the tropics with children in classrooms
Table 2.8 provides a summary concerning the ranges of thermal comfort temperatures reported
from past research in classrooms located in the tropics. In sum, the findings of the research
summarised in Table 2.8 tends to show that school children in tropical climates can tolerate
temperatures that reads relatively higher than what some international thermal comfort
standards specifies for thermal comfort indoors. This may be attributed to the psychological
and physiological adaption of the children to the prevailing climate in their respective countries
as postulated by several authors such as Nicol (2004). Also, the literature review summarised
in Table 2.8 suggest that persons living in tropical climates could be thermally comfortable at
relatively high indoor air temperatures, this does not suggest that the cognitive abilities of
children are maintained at relatively high air temperatures.
Author location Thermal comfort temperature identified by the study
Kwok (1997) Hawaii (USA) 22-29 0C Wong and Khoo (2003) Singapore 27.1 -29.30C Hwang et al. (2009) Taiwan 30 0C Liang et al. (2012) Taiwan 29.20C Mishra and Ramgopal (2015).
India 31.50C
Le et al. (2017) Vietnam 29.90C - 32.80C. Hamzah et al. (2018), Makassar (Indonesia) 290C Singh et al. (2018) India 29.80C
Table 2.8.Thermal comfort temperatures identified by authors in the classrooms of schools in
tropical climates
2.3.9 Section summary
The past section 2.3 reviewed literature as regards to how some factors affects the thermal
comfort of humans indoors. These factors are: indoor air temperature, relative humidity, air
speed, radiant temperature, clothing, metabolic rate, age, gender ,culture, personality, illness,
behavioural traits, Psychological and physiological traits of a person. Furthermore, a review of

34
thermal comfort indices and standards as well as previous studies of thermal comfort with
children in the tropics are presented in this section (2.3). The next section 2.4 of this chapter
provides a literature review concerning the effect of indoor air temperature on the health of
persons indoors.
2.4 The effect of indoor air temperature on health of persons
Health refers to the physical, mental and social wellbeing of a person and not only the absence
of disease or sickness (WHO, 2006). The review in this section aims to identify some of the
common health symptoms that are directly associated with high or low air temperatures indoors.
However it is acknowledged here that some other environmental factors (low ventilation, air
pollution, noise, lighting and humidity) could be exacerbate some of the health symptoms
reviewed in this section. Against this background, find in the remaining part of this section a
review of studies concerning the effects of indoor air temperature on the health of persons
indoors.
Jaakkola et al. (1989) investigated the link between indoor air temperatures and sick building
syndrome (SBS) in an eight floor mechanically ventilated office building. The result from their
investigation suggests that there is a linear correlation between some SBS symptoms and rise
in indoor air temperatures above 22 0C. Some of the SBS symptoms observed to be linearly
correlated to the rise in air temperatures from the study by Jaakkola et al. (1989) are feelings of
dryness of skin, eye, throat and nose. They also observed symptoms of headache and itchy skin
to be linearly correlated to the rise of indoor air temperatures. Each of these symptom is capable
of affecting, the mental, physical and social wellbeing of a person indoors.
As regards the investigation by Jaakkola et al. (1989) above, a reason that may account for why
the workers experienced symptoms of dryness was that they may have lost moisture by
evaporation from their body. The loss of moisture mentioned here could be due to rise in the
indoor air temperature and the low relative humidity levels (10-15%) reported in the office
building used for the investigation. Also the headache reported to have been felt by the workers
may have been caused by thermal overload due to high air temperatures.
Similarly, some health symptoms were associated with high air temperatures as reported from
a study by Fang et al. (2002). Fang et al. (2002) studied the effect of air temperatures and
humidity on: perceived air quality, symptoms of health and performance. The finding from the
study of Fang et al. (2002) revealed that symptoms of fatigue, headache and difficulty in
concentration significantly increased at 260C and 60% relative humidity in comparison to the

35
200C and 40% relative humidity. By extension, the findings by Fang et al. (2002) suggest that
relatively high air temperature generally, have the potentials to affect the health of persons
indoors, including school environments.
Also, Wargocki and Wyon (2007) associated some symptoms of headache to high air
temperatures as part of their findings from the field experiments conducted with children in an
elementary school in Denmark. The authors reported that as the air temperature was reduced
from 250C to 220C during the field experiments, the children felt significantly less symptoms
of headache. This suggest that the children used as samples for the experiments significantly
felt the symptoms of headache at higher air temperatures of 250C in comparison to 220C.
Likewise, the findings from a controlled investigation by Lan et al. (2011) in an office space
indicated that the subjects experienced symptoms of tiredness, displeasure and negative mood
when they were exposed to air temperature of 30 0C . The finding from the investigation of
Lan et al. (2011) suggests that high air temperatures that reads up to 300C can negatively affect
a person’s health. This based on the notion that the symptoms (tiredness, and negative mood)
reported by the authors are related to the mental, physical and social wellbeing of a person. The
findings of Lan et al. (2011) reported here is consistent with the previous work of Lan et al.
(2010). Lan et al. (2010) reported that the discomfort due to warmth experienced by the
samples used for their study negatively affected their wellbeing.
Furthermore, Clements-Croome (2014) noted that temperature is amongst the factors that can
significantly influence the mood and wellbeing of persons after an extensive report that
examined how the built environment affects wellbeing and performance. This suggest that the
health of persons could also be affected by air temperature. The view of Clements-Croome
(2014) reported here tends to be in agreement with the findings from a more recent climatic
chamber study conducted by Liu et al. (2017). The authors reported from their study that a
combination of high indoor air temperature and carbon dioxide provoked the feelings of
sleepiness and some health symptoms on the subjects used for their study. Also a field
experiment by Barbic et al. (2019) showed an increase in indoor air temperature from 22-260C
could affect the health of the subjects used for their experiments by exacerbating some heart
related symptoms.
Thus far, the studies reviewed in this section suggests that relatively high or low indoor air
temperatures have the capabilities of affecting the mental, physical and social wellbeing of a
person, all these (mental, physical and social wellbeing) are related to the health of a person.

36
2.5 The effect of indoor air temperature on academic performance
A meta-analytic review by Pilcher et al. (2002) suggest that hot and cold air temperatures have
negative effects on the performance of cognitive related tasks. Specifically the authors reported
that hot temperatures that reads above 32.220C have detrimental effect on the performance of
cognitive tasks. For example, an early investigation by Peccolo (1962): the author investigated
the effect of thermal environment on the academic performances of a sample fourth grade pupils
(10-11years) from two elementary schools in the temperate climate of Iowa (USA). The
investigation was conducted in two purpose built laboratories similar to their usual classrooms.
The two classrooms had differed thermal conditions. The thermal conditions in the two purpose
built classrooms are: (220C air temperature ,50% relative humidity ,0.15m/s air speed ) and
(250C, air temperature 51% relative humidity,0.05m/s air speed). Additionally, during the
investigation the pupils in the two laboratories performed the same kind of pencil and paper
based academic task similar to their usual school work. The findings from the investigation by
Peccolo (1962) showed that the academic performance of pupils in the purpose built classroom
with air temperatures of 250C was significantly lower than for the pupils in classroom with air
temperatures of 220C. In short, the findings from the investigation of the author mentioned here
suggest that, elevated air temperatures in classrooms can affect the academic performance of
pupils. As well, the findings of Peccolo (1962) tends to agree with the conclusion reached from
an early climatic chamber study conducted by Wyon et al. (1979) . Wyon et al. (1979)
concluded that heat stress above the optimum values have the potentials to affect the
performance of mental task (e.g. multiplication task)
In the investigation by Peccolo (1962) reported above, the subjects had similar socio-economic
dimensions. This increases the chances that the difference found in performance of the children
at the investigation is likely to have been attributed to the differences in the thermal conditions
between the two classrooms used for the investigation. Also, it can be deduced that the
difference in academic performance reported by piccolo (1962) may not have been due to
difference in task difficulty, this is because the pupils in both classrooms used for the
investigation performed the same tasks at the same time. One limitation that may be attributed
to the findings from the investigation of Peccolo (1962) is that, the experiments did not take
place in the natural setting (classrooms) where the pupils normally take their lessons. Therefore,
some factors which have psychosocial dimensions such as, shock, tension and anxiety could
have had effect on the findings observed by Peccolo (1962). Also, an early study cited in
Wargocki and Wyon (2007) was carried out by Schoer and Shaffran (1973) . Schoer and
Shaffran (1973) compared the academic performance of children (ages 10-12) in two purpose

37
built classrooms with temperatures of 22.50C and 260C.Their finding (Schoer and Shaffran)
showed to that the performance of the children in the classroom with air temperature of 22.50C
was significantly better in comparison with the performance of the children in the classrooms
with air temperature of 260C.The findings from the early study of Schoer and Shaffran (1973)
shows that high air temperature can affect the performance of task by children.
Furthermore, recent field experiments by Wargocki and Wyon (2007) in Demark suggests that
reducing air temperature from 250C to 200C improved the pupil’s performance in arithmetic
and language based tasks. The findings of Wargocki and Wyon (2007) suggest that high air
temperature have effect on the performance of academic task by pupils in classrooms. Similarly,
the findings of Porras‐Salazar et al. (2018) from a more recent field experiment conducted in
the tropical climate of Costa Rica showed that; reducing air temperature from 30 to 250C
significantly improved the performance of academic task of pupils. The finding of (Porras‐
Salazar et al., 2018) shows that high air temperature can affect the performance of academic
task, this findings is in agreement with the findings from the study of Jiang et al. (2018). The
findings from the study of Jiang et al. (2018) shows that the performance of task by elementary
school pupils in the subtropical climate of China was significantly better at indoor air
temperature of 140C in comparison to 200C.
In addition to the studies of the authors earlier reviewed in the past paragraphs of this section,
is a climatic chamber study by Liu et al. (2017) in Denmark. The authors exposed six male and
six female subjects to a temperature of 260C and 350C.The findings of Liu et al. (2017) suggest
that the performance of task related to addition and subtraction was significantly affected by air
temperature of 350C in comparison to 260C. The findings by Liu et al. (2017) also agrees with
the findings from a climatic chamber study conducted by Choi et al. (2019), they reported that
high air temperature affected the attention span of subjects used for their study. Also, climatic
chamber study by Zhang and de Dear (2017) in Australia showed that the performance of
academic related task under high temperature is dependent on the nature of the task performed
by subjects: they (Zhang and de Dear, 2017) reported that “simpler cognitive task are less
susceptible to temperature effects than more complex tasks”. Lastly, there are authors which
there studies also suggest that high temperatures have the potentials to affect the performance
of academic related tasks (Park, 2016; Schiavon et al., 2017).
In contrasts to the findings previously reviewed in this section concerning the negative effect
of high air temperatures on the academic performance of pupils, there are few studies with
evidences which tends to show that relatively high air temperatures have no negative effects on

38
the performance of academic task. For example, a controlled climatic chamber experiment by
Wyon et al. (1979).They (Wyon et al , 1979) reported that there was no improvement in the
academic performance of the samples used for their study in the area of word memory and cue-
utilisation tests at relatively elevated air temperature of 260C.
Likewise, Kahl (2005) reported that there was no significant difference in the performance of
174 University of La Crosse (USA) students who took math, English and memory tests at four
different classroom air temperatures . The classroom air temperatures when the test were taken
are: 15 0C, 200C, 22.50C and 260C. However, the lack of significant difference in the academic
performance of the students in the experiment reported by Kahl (2005) could be attributed to
motivation, Kahl (2005) reported that the students were motivated to do their best at the
experiments as they were promised extra credit for participating. Furthermore, a climatic
chamber study in Australia showed that there is no significant difference in the performance of
the samples in the cognitive test administered to them at 22 and 250C(Zhang et al., 2017).
To conclude, the studies of most of the authors reviewed in the past paragraphs of this section
shows that relatively high indoor air temperatures have the potentials to affect the performance
of academic task by children in schools. Broadly, the review in this section tends to show the
adverse effect of high air temperatures on the performance of cognitive related task is not often
a straight forward phenomena (inconsistent).
Lastly, the works of the authors reviewed in this section suggests that most of the studies
concerning the effects of high air temperatures on academic performances were previously and
mostly performed in countries with temperate climates and in climatic chambers. Therefore
how applicable are findings from studies conducted in temperate climates and climatic
chambers to pupils who are performing academic task in natural schools environments in the
tropics? This question suggest that there is a gap in knowledge that this study hopes to respond
to.
2.5.1 The mechanisms by which high air temperatures affects the performance of academic task.
The mechanism that underpins how the performance of academic task is affected by relatively
high air temperatures are in the two ways presented here. Firstly, when a person is subjected to
relatively high air temperatures during the performance of academic task indoors, the person
may experience warmth and a rise in core body temperature above the normal (37.50C). Warmth
and rise in core body temperature has the capabilities to cause thermal discomfort resulting to
distraction in the performance of an academic task at hand. Secondly, relatively high air

39
temperatures indoors during the performance of academic tasks could exacerbate end–tidal C02
which decreases oxygen concentration in the blood and increases its C02 amount, these
physiological changes could result to headache, fatigue and difficulty in processing academic
task at hand(Lan et al., 2013; Wargocki and Wyon, 2017).
2.6 The effect of some other key environmental and non-environmental factors on the performance of academic tasks in school environments.
This section presents a literature concerning the effect of other key environmental and non-
environmental factors on academic performances in school environments.
2.6.1 Ventilation rate and academic performance
A number of studies associates ventilations rates and the performance of tasks in offices and
schools. For example, Wargocki and Wyon (2007) reported from a series of field experiments
conducted in two classrooms of a Danish school that increasing ventilation rate from 3 to 8l/s
significantly increased the pupils performances in a wide range of academic tasks (Arithmetic,
comprehension and logical reasoning).The findings from the field experiments provided here
suggests that ventilation rates have tendencies to affect pupils academic performances.
Bakó-Biró et al. (2012) investigated the effect of ventilation rates on pupils’ academic
performances in some primary schools in the UK. The findings of Bakó-Biró et al. (2012)
suggests that pupils’ academic performance could be significantly impaired by low ventilation
rates in classrooms. However an idea that is noteworthy to this study from the field experiments
of Bakó-Biró et al. (2012) is that they controlled for the effect of some psychosocial factors
that could affect the results from their study. The psychosocial factors controlled by the authors
mentioned here are: mood, hunger, health and quality of sleep. This measure of control carried
out by Bakó-Biró et al. (2012) in their investigation can be useful to the method of carrying out
the investigations in this present study. This means, this study will control for the effects of
some psychosocial factors at the field experiments to be carried out in this study.
Furthermore, two different studies have reported similar findings to the works of the author
reviewed in the past paragraphs of this section. The studies are the works of Haverinen‐
Shaughnessy et al. (2011) and Toftum et al. (2015) conducted in USA and Denmark
respectively. The findings of the two authors mentioned here suggest that low ventilation rates
have negative consequences on the performance of academic tasks in schools. In addition, a
study by Haverinen-Shaughnessy et al. (2015) conducted in the USA suggests that ventilation
rates have effect on the performance of task by pupils. Specifically, the findings of Haverinen-

40
Shaughnessy et al. (2015) show that there is a significant increase observed in the performance
of mathematics based task by the pupils used for their study as a result of increase in ventilation
rates to 7.1l/s per person. The findings by Haverinen-Shaughnessy et al. (2015) corresponds
with the findings from a study by Petersen et al. (2016).The findings from the study of Petersen
et al. (2016) showed that there was a significant improvement in the academic performance of
the pupils used in their study due to increase in ventilation rate from 1.7 to 6.6 l/s per person.
In sum, previous research (studies) reviewed in this section shows that ventilations rates have
significant effects on the performance of academic task by pupils in school environments. Also
the studies reviewed in this section suggest that high ventilation rates in classrooms can
significantly improve the performance of academic based task by pupils in schools. Lastly, the
studies reviewed in this section suggest that low ventilation rates in classrooms can significantly
negate the performance of academic based task by pupils in schools.
2.6.2 Daylighting and academic performance
Daylighting can generally be referred to the use of natural light from the sun to illuminate the
interior of buildings. Before the 1940s natural light was the primary source of light in buildings
(Edwards and Torcellini, 2002). It has been demonstrated that most people prefer natural light
from the sun indoors. This is probably due to the fact that natural light consist of a balanced
spectrum of colours required to enhance biological processes in humans(Liberman, 1990;
Hathaway, 1992).
However, as regards the effect of daylighting in schools on academic performance, Earthman
(2004) mentioned that several studies have shown that, sufficient daylighting (300 -500 lux),
has been demonstrated to impact positively on pupils achievement and performances in schools,
while insufficient (less than 300 lux), impacts negatively on pupils academic performances. For
example, a study by Heschong (1999):the author showed that students in schools with sufficient
daylighting achieved an average of 20% higher in test scores than students in schools with
insufficient daylighting. Part of the reason behind why pupil’s performances in well day lit
schools could be higher than those with insufficient daylighting may be attributed to the idea
that natural light enhances biological processes which stimulates greater mental alertness and
memory retention in humans (Heschong, 2002; Leslie, 2003). Similar to the findings of
Heschong (1999) documented in this section, is the study by Nicklas and Bailey (1996) in
North Carolina. The findings from the study by Nicklas and Bailey (1996) showed that students
in day lit schools performed better by about 11% in their annual achievement scores in
comparison to pupils in non-day lit schools.

41
In sum, findings works of the authors reviewed in this section suggests that daylighting can
affect the academic performances of children in classrooms. Also the findings from the works
of the authors reviewed in this section has an implication on the method to be employed for the
investigations in this study. The implication is that, there is the need to ensure that the
classrooms used for the investigations in this study are sufficiently lit with respect to the
required standards needed for classroom tasks.
2.6.3 Noise and academic performance
In classrooms, noise is generally generated from two sources .The first is external noise, this
refers to noise that is generated from outside the classrooms, for example, noise generated from,
cars, trains and airplanes that are transmitted by air into the classroom. The second, internal
noise, this refers to the noise that is generated within the classroom from sources such as heating
,lighting ,cooling equipment as well as the children themselves (Shield and Dockrell, 2008).
Interestingly, the two sources of noise mentioned here has been generally investigated and
demonstrated to have negative effect on teaching and learning as shown by the research of the
authors presented in next paragraph of this section.
Crook and Langdon (1974) conducted a study into the effect of noise on learning in schools
around Heathrow Airport in the UK. Cohen et al. (1980) conducted similar study in schools
near Los Angelis airport in the USA. The findings of the two authors revealed that high level
of noise have detrimental effect on pupils’ mood, health and ability to comprehend. By
extension the findings of Cohen et al. (1973) as well as that of Crook and Langdon, (1974)
suggest that high level of noise have the propensity to affect the academic performances of
pupils. Similarly, reading and listening tasks by children have been reported to be affected by
high level of noise (64 to 89 dB) from train and road traffic (Cohen et al., 1973; Bronzaft, 1981;
Sanz et al., 1993). Furthermore, findings from the recent works of several authors suggest that
high level of noise could be detrimental to the performance of task by children in schools.
(Evans and Lepore, 1993; Maxwell and Evans, 2000; Hygge, 2003; Clark et al., 2005; Shield
and Dockrell, 2008; Stansfeld et al., 2010; Klatte et al., 2013). As well, more recent findings
from studies carried out by some authors also suggest that the performance of academic tasks
by pupils in school environments could be affected by noise (Connolly et al., 2019; Sousa et
al., 2019; Wen et al., 2019).
To conclude, the findings from the studies reviewed in the past paragraph of this subsection
tends to show that high level of external and internal noise have negative effect on the
performance of school related task by children.

42
2.6.4 Overcrowding and academic performance
Overcrowding in classrooms is defined in terms of too many pupils’ occupying a classroom
than it was designed for (Earthman, 2002). This suggests that when more than 30 pupils in a
reception class in the UK occupy a classroom space of about 70m2 sqm, it could be termed as
overcrowding. 70m2 is the recommended space by for 30 pupils in a reception class in the UK
(Education, 2014) . Studies concerning the effect of overcrowded classrooms on learning and
academic performance are limited (Weinstein, 1979; Earthman, 2002).
However, of the few studies that exists, the works of some authors generally point out that
overcrowded classrooms have negative consequences on pupils’ performances and academic
achievements in schools. For instance, Paulus et al. (1976) found evidence suggesting that
academic performance can be affected by overcrowding. Also, overcrowding in classrooms and
schools often results to stressful teaching environment for teachers and students(Cotton,
1996).The finding by (Cotton, 1996) reported here have the potentials of affecting the
performance of tasks by pupils in classrooms. Inversely, there exist studies which their findings
tend to show that overcrowding do not have any negative consequences on the performance of
task (Freedman et al., 1971).
Taken together, the findings of the authors presented in this section tends to show that
inconsistencies still exist on the subject matter concerning the effect of overcrowding on the
performance of task by pupils in school environments. However, what is most important to the
researcher from the literature review in this subsection is that there is the need to control for
overcrowding at the field experiments to be performed with a sample of pupils in this study.
2.6.5 Colour in classroom and academic performance
There are studies with evidence to suggest that colours of classrooms does have effect on the
emotion and wellbeing of students directly. This suggest that indirectly colours have the
potentials of affecting pupils’ academic performance. The associations between colours and
children’s emotion was investigated by Boyatzis and Varghese (1994) at St Joseph‘s elementary
school in Santa Ana California. In the investigation sixty children were exposed individually to
different colours presented on a paper. The colours were pink, red, yellow, black, grey, green,
blue, purple and brown. The findings from the investigation by Boyatzis and Varghese (1994)
revealed that children were happy and excited with bright colours such as pink, red and blue,
while they expressed displeasure to dark colours such as black, grey and brown. Also,
Wohlfarth (1984) reported that bright colours have the potentials to enhance mental and
emotional wellbeing in classrooms. In sum, it can be deduced from the review in this section

43
that colours in classroom have the tendency to affect pupil’s emotional and mental wellbeing
directly, and by extension it may have effect on the performance of academic task by pupils in
schools.
2.6.6 Seating arrangement in classroom and academic performance
Findings from a study by Wheldall and Lam (1987) suggests that when children seat in rows in
on –task behaviours (engagement) is often better in classrooms when compared to children
seating in groups or semi- circles .This means that children will be more engaged and attentive
to academic task at hand in classrooms when they seat in rows in comparison to sitting in groups
and semi- circles . Similar findings were reported by Bennett and Blundell (1983).The authors
compared the quality and quantity of work performed by 10-11 old children that were seated in
rows and groups. The authors reported that the quality of work performed did not differ between
the children seated in rows and that of the children seated in groups, however, there was
significant difference observed in the quantity of work performed between the children seated
in rows and groups. The findings of Bennett and Blundell (1983) suggest that the quantity of
work a child can do is dependent on the seating arrangement in classroom. Likewise, the
findings of several authors suggest that row seating arrangement could be beneficial to
engagement by pupils in classrooms than other forms of seating arrangements (Axelrod et al.,
1979; Hastings and Schwieso, 1995) .In sum, the review of previous research in this section
suggest that: (1) seating comfortably in classrooms during the performance of tasks could be
beneficial to the academic performance of children.(2) seating in rows have the potentials of
promoting engagement of pupils in an ongoing academic tasks in classrooms which may in
turn boost their academic performances.
2.6.7 Socio Economic Status (SES) and student performance in schools
Socio Economic Status (SES) is probably the most commonly considered factor in educational
research (Sirin, 2005). In the same light, Hobbs and Vignoles (2010) mentioned that SES of
pupils is an important factor that can influence the achievement (performance) of pupils. To be
specific, findings from the studies of some authors suggest that SES have significant link with
educational achievements of pupils and students (Bradley and Corwyn, 2002; Considine and
Zappalà, 2002; Schulz, 2005; Farooq et al., 2011).
In view the background concerning SES mentioned in the past paragraph, two dimensions of
SES (the income of Parents and the educational level of Parents) are reviewed in this section of
this study. This is because measures concerning the income of parents and their educational

44
level are often used and defined as SES in most studies examining the relationship between
SES and educational achievements, (White 1982). Furthermore, as regards the two common
SES factors (income of Parents and the educational level of Parents), find in the subsequent
paragraphs how they affect the academic achievement of pupils.
As regards family income, Schulz (2005) mentioned that family income or financial investment
in educating a child have been consistently linked with academic achievements of students. For
example, a literature review by Blanden and Gregg (2004) reports that the works of Rowntree
(1901) and Glennerster (1995) suggest that there is a link between poor educational outcome of
students and low parental income. I tend to agree with the findings of the authors mentioned in
this paragraph. This is because the investment in the education of a child from a low income
parent could differ from that of high income parent in the area of quality of school attended by
the child as well as neighbourhood in which the parents of the child lives.
As regards to educational level of parents, there are studies associating the educational level of
parent with children’s academic performance (Haveman and Wolfe, 1995; Desforges and
Abouchaar, 2003; Davis-Kean, 2005; Hartas, 2011).These studies found that the level of
education attained by the parent of a child positively correlates with the academic performance
(attainments/achievements) of a child. This suggests that children from parents with relatively
high educational backgrounds are more likely to perform better academically when compared
to parents with low level of educational backgrounds. However, one reason that may account
for the positive correlation between the educational level of a child’s parent and the child’s
academic performance is as follows. Parent’s with high educational background tends create
more positive learning environment at home and are more likely to be actively involved a
child’s learning activities at home than parents with low educational background level (Davis-
Kean, 2005).
2.6.8 Effect of time of the day on performances
There are studies dating back to the nineteenth century with data to suggest that performances
in a range of tasks (including cognitive tasks) tends to increase with time of the day (Blake,
1967; Folkard, 1975; Andrade and Menna-Barreto, 1996). In contrast, there are evidences from
authors which tend to show that performance of academic task decreases with time of the day
(Biggers, 1980; Hartley and Nicholls, 2008).Furthermore ,the finding of some authors tend to
show that the performance of task is not affected by time of the day(Folkard and Monk, 1980;
Davis, 1987; Song and Stough, 2000). On the whole, some researchers have generally agreed
that the performance of most tasks increases from morning to early evening with the possibility

45
of a post lunch-dip occurring in the mid-afternoon, however this depend on the individual and
other factors (Blake, 1967; Monk, 2005). See Figure 2.11 from the study of Folkard (1975) of
how performance increases over the day and drops sharply during the period of post lunch-dip
(1400 to 1700). The key importance of the literature review in this section is that there is the
need to control for the effect of time of the day on the field experiments to be performed with
a sample of pupils in this study.
Figure 2.11.Variation of performance over the day from the study of Folkard (1975).
2.7 Overview of some standards used for the design of public schools in Nigeria 2.7.1 The design approach
The Universal Basic Education Commision (2010) generally specifies the use of prototype
design for the construction of public schools in Nigeria .This approach somehow runs parallel
to the view posited by UNICEF (2009). UNICEF (2009)posited that a standardised approach
to school design usually does not respond to the uniqueness of a place and culture, it (Child
further mentioned that child friendly schools should be able respond to the environmental and
cultural context of the location.
2.7.2 The form of the classrooms and seating arrangement.
In general, there are three common types of seating arrangement which determines the form of
a classroom. These seating arrangements are as follows. The traditional classroom seating
arrangement which involves seating in rows and often associated with rectilinear forms

46
(Rectangular or square). The U-and Circle seating arrangement are commonly associated with
curvilinear forms (circles or semicircles).
Against the background above, Universal Basic Education Commision (2010) specifies the use
rectangular forms seating in rows and of for the design of classrooms in public schools of
Nigeria. The choice of rectangular forms and seating in rows for the design of classrooms in
public schools of Nigeria may probably be due to the findings by some authors (Hastings and
Schwieso, 1995; Wannarka and Ruhl, 2008).Their findings suggests that there is some positive
correlations between the traditional class room seating arrangements and academic outcomes.
2.7.3 Classroom size and capacity
The classroom size specified by for public schools in Nigeria is 7m wide by 8m long with a
total area 56m2 and a capacity of 40 pupils (Universal Basic Education Commision, 2010) .This
suggests the space estimated for a pupil in public schools is approximately 1.4m2 per pupil.
This is similar to the amount of space recommended per pupil in government owned schools in
South Africa. Classrooms in government owned schools in South Africa have sizes ranging
from 48m2 to 60m2. (Deparment Of Public Education, 2012). In contrast, (DfES, 2006a) in the
UK specifies an area of about 70m2 for a class capacity of 30 pupils, this is approximately 2,3m2
per pupil. One reason that may have led to the specification of a larger classroom space for
schools in the UK by (DfES, 2006a) than that specified for schools in Nigeria is to allow enough
space for children that may be using wheel chairs in the UK.
2.7.4 Site planning
With respect to site planning within public schools of Nigeria, it is recommended that noisy
zones should be separated from quiet zones(Universal Basic Education Commision, 2010). In
view of this, it is recommended that administrative and classrooms area should fall within the
quiet zone while play and parking areas should fall within the noisy zones of a school (Universal
Basic Education Commision, 2010). Also, it is recommended that classrooms in public schools
should be orientated with due considerations to the prevailing climate of location of a school.
Similarly the planting of trees and shrubs is recommended within each school environment of
public schools in Nigeria. Interestingly, (DfES, 2006a) similarly recommends the use of
plantings (shrubs and tree) in schools of the UK for the sake enhancing outdoor shading.

47
2.7.5 Indoor air temperature
As regards to the values of minimum and maximum temperatures required in a classroom for
thermal comfort, no data was found in respect of this in the specification document by Universal
Basic Education Commision (2010) .On the other hand, CIBSE (2006) in the UK recommends
180C for thermal comfort in naturally ventilated in schools during summer. Broadly, the 180C
recommended for UK schools falls within the range of indoor air temperatures (180C -240C)
recommended by WHO (1984) as documented in Ormandy and Ezratty (2012)for thermal
comfort indoors. Excitingly, it has been reported that people work best at indoor environments
such as offices and schools at temperatures between 160C to 240C, (Health and safety Briefing:
High Temperatures, 2010).Also, for learning to take place in classrooms towards ensuring
positive outcomes, temperatures in classrooms is to be in the range of 20- 240C (Kevan and
Howes, 1980).
Drawing from above, the main point is that environmental designers should aim at designing
school buildings to achieve indoor air temperatures in the range 160C to 240C for the sake of
the promoting the thermal comfort and performance of pupils.
2.7.6 Daylighting
Public schools in Nigeria mainly depend on natural light for carrying out classroom tasks.
Surprisingly, in the Universal Basic Education Commision (2010) there is no specification of
the amount of daylighting required in the classrooms of public schools in Nigeria. In contrast,
Deparment (2012) in South Africa specified 200-300 lux for daylighting in classrooms in
schools. Interestingly, this is in the same range (200 -300 lux) required for teaching and learning
spaces (CIBSE, 2006; Bruin-Hordijk and Groot, 2010). The main idea here is that for
daylighting to be adequate for the performance of task in classrooms it is desirable to be within
the range of 200-300 lux.
2.7.7 Ventilation
The Universal Basic Education Commision (2010) in Nigeria recommends the sole use of
natural ventilation for classroom in public schools of Nigeria. This is probably for the several
benefits that may be associated with the use of natural ventilation in buildings. The benefits of
natural ventilations in schools are : reduced capital and running costs, individual control, low
noise and environmental friendliness (DfES, 2006b). Unfortunately, the Minimum Standard for
Bsaic Education in Nigeria (2010) did not specify the ventilation rate required in classrooms
of public schools in Nigeria. Nevertheless, as regards ventilation rate required in schools,

48
ASHRAE (2010) specifies about 6-7 l/sec. DfES (2006b)specifies a minimum of 5 l/sec with
an expectation of 8 l/sec. All the recommended ventilation rates documented from the authors
here is an attempt to keep the level of carbon dioxide in classrooms relative low (less than
1000ppm).
2.7.8 Noise
As regards to noise, the minimum and maximum amount of noise level required in classrooms
of public schools in Nigeria is not specified by Universal Basic Education Commision (2010).
Although, Universal lay emphasis on the need to zone classrooms away from areas that are
prone to high level noise in schools. This is probably because increasing evidence from some
authors demonstrates that relatively high noise from the environment and indoors (classrooms)
could severe learning (Dockrell and Shield, 2006; Klatte et al., 2013). In view of the detrimental
effect of noise to pupils learning, it is recommended to limit the noise level in classrooms to
35dB as prescribed by WHO (1999). This subsection brings section 2.7 to an end. The next
section presents the analytical model deduced from the key literature review in this chapter.
2.8 Analytical model deduced from the key themes of literature review in this chapter
In respect of the aim and objectives of this study stated in chapter 1, literature review was
carried in this chapter that focused on the following key themes; (a) The potential contribution
of design features of naturally ventilated school buildings in the tropics to the indoor air
temperature, (section 2.2). (b)The effect of indoor air temperature and other related factors on
the thermal comfort of occupants, (section 2.3). (c)The effect of indoor air temperature on
health (section 2.4). (d) The effect of indoor air temperature on academic performance (section
2.5). (e) Effect of some other key environmental and non-environmental factors on academic
performance, (section 2.6).
From the literature review documented in section 2.2, it can be deduced that some physical
design features have the potentials to influence the indoor air temperature of naturally ventilated
school buildings in the tropics. Such design features are: Orientation, window, shading devices,
verandahs, depth/ height ratio of, thermal property of the building materials, colour of walls,
roof vents and thermal load from occupancy and equipment.
Furthermore, from the review in section 2.3, it could be inferred that besides indoor air
temperature, other related factors have effect on the thermal comfort of humans indoors. These
factors are: humidity, mean radiant, temperature, air speed, gender, age, culture, clothing,
metabolic rate as well as the behavioural, physiological and psychical traits of a person

49
Similarly, it could deduced from the literature review in section 2.4 that indoor air temperature
have effect on the health of occupants. As well, the literature review in section 2.5 and 2.6
respectively shows that the performance of academic tasks in schools can be affected by indoor
air temperature and other environmental and non-environmental factors.
On the whole, the individual parts of the literature review highlighted above in this section can
be linked together to form an analytical model, Figure 2.12.This model could serve as a guide
towards investigating the effect of indoor air temperature on the thermal comfort, health and
performance of users which is the key aim of this study. Additionally, the analytical model in
Figure 2.12 suggest need for the control of some factors during the collection and analysis of
data in respect of investigating the effect of indoor air temperature on the performance of the
sample of pupils used for this study. The factors to be controlled are; noise, daylighting,
ventilation, overcrowding, colour of walls, seating arrangement, socio-economic status and
time of the day.
Finally, the studies of the authors in the literature review concerning the link between indoor
air temperature, thermal comfort, health and performance that was used to develop the
analytical model in this chapter appears to have been mostly carried out in temperate
climates/chambers. In view of this, some questions related to the key aim of this study that
could be asked a regards the analytical model developed from the literature review in this study
are;
1. To what extent do indoor temperature have effect on the thermal comfort of persons that
are acclimatised to tropical climate?
2. To what extent do indoor temperature have effect on the health of persons that are
acclimatised to tropical climate?
3. To what extent do indoor temperature have effect on the performance of persons that are
acclimatised to tropical climate?

50
Figure 2.12.The analytical frame work deveoped from the literature review related to the key aim of this study
2.9 Chapter summary
The literature review documented in this chapter shows that some physical design features have
the potentials to influence the indoor air temperature of naturally ventilated buildings in the
tropics positively and negatively. Also, the literature review in this chapter shows that indoor
air temperature and some other related factors have effect on the thermal comfort of humans
indoors. It was also documented in the literature review in this chapter that indoor air
temperature can independently affect the health of humans indoors as well as the performance
of academic related tasks in schools. Furthermore, the literature in this chapter suggest that
apart from indoor air temperature, there are other environmental and non-environmental factors
that have the potentials to affect the performance of academic task in school environments.
Lastly, this chapter provides an overview of some of the basic standards employed for the
design of public schools in Nigeria.

51
Chapter 3. Research Methodology
3.1 Introduction
This chapter presents an overview of the research methods commonly used to perform research
in section 3.2. Consequently, the research methods utilised for this present study is discussed
in section 3.3. Thereafter, a review of research methods related to the aim of this study is
presented in section 3.4. Lastly, this chapter describes the procedure for data collection and
analysis for each of the research method utilised for this study in sections 3.5, 3.6 and 3.7
respectively.
3.2 Overview of methods employed for research
Various research methods exist that are based on some philosophical viewpoints, these research
methods can be classified under three groups. The three groups are: qualitative research method
quantitative research method and the mixed method.
The qualitative method is based on the philosophical view point of constructivism. Qualitative
research method refers to the means by which research is carried out in order to explore the
meaning that humans in the social world ascribe to a phenomena or the social world. This
research method focuses on the use of words in the collection and analysis of data rather
quantification. One of the goal of using qualitative research method is to explore rather than to
quantify or measure variables. Qualitative research methods often emphasises on the
understanding of feelings, perceptions and experiences in the social world rather than their
measurement. Furthermore ,qualitative research method is characterised by carrying out
research in a relatively flexible and unstructured manner (Creswell, 2009; Matthews and Ross,
2010).Examples of qualitative research methods are, phenomenology, ethnography and
grounded theory studies(Creswell, 2009).
The quantitative research method is based on the philosophical view point of positivism.
Quantitative research method is the means by which research is carried out by focusing on the
quantification (measurement) of variables with respect to data collection and analysis. This
research method is usually carried out with a predetermined set of procedures. Quantitative
research method is characterised by examining and quantifying the relationship between
variables in an empirical manner. Statistical tests are often employed for the analysis of data
when quantitative research method is employed in a research. Examples of quantitative methods
often used in research are, Experiments, surveys and correlational studies. Lastly, the mixed
research method is based on the philosophical view point of pragmatism. The mixed method is

52
a research strategy that combines the qualitative and the quantitative methods in carrying out
research in order to respond to the aim and objectives set out by a particular study (Remenyi et
al., 1998; Creswell, 2012; Kumar, 2014; Bryman, 2016; Cohen et al., 2018).
Drawing on the research methods discussed above, this study adopts the use of the quantitative
research methods in carrying out this study. This is because the aim of this study stated in
chapter 1 and the research questions deduced from the analytical model in chapter 2 (section
2.8,Figure 2.13) seeks to examine the relationship between indoor air temperature, thermal
comfort, health and performance. Examining causal relationships is often empirically
determined by quantitative research methods. Another reason why this study adopts the use of
quantitative research method is that; the review of methods presented in section 3.4 of this
chapter suggest that quantitative method is the method often used in previous research to
examine the effect of indoor environmental factors on thermal comfort and performance.
However, qualitative research methods is another method that could have been used to carry
out this study, but it may be a challenge to empirically demonstrate the effect of indoor air
temperature on the thermal comfort and performance of pupils and teachers employed for this
study. Also, the use of qualitative research method in this study could pose a challenge in the
area of empirically quantify the extent to which indoor air temperature have effect on the
performances of teachers and pupils from the results in this study. Furthermore, loss of lesson
time was a concern raised by the principals before granting the permission to do the field work
in each of the schools used for this study. This concern mentioned here limited the use of the
mix method for collecting data by quantitative and qualitative means in this study.
3.3 The research methods utilised for this study and the rationale for their use in this study
In view of the quantitative research method adopted for this study for reasons earlier mentioned
in section 3.2, three quantitative research methods were employed in responding to the aim,
objectives and research questions arising from the analytical model in this study. The three
quantitative research methods utilised in this study are: experimental, field survey and physical
survey. Thus, in respect of the three quantitative research methods mentioned here, find in the
subsequent paragraphs of this section the role of played by each research method and the
rationale for their use in this study.
The field experimental research method was used to investigate the effect of indoor air
temperature on the thermal comfort, health and performance of pupils in this study. This was
done by assessing the thermal comfort, health and academic performance of a sample of pupils

53
at two different air temperature levels of 25.6 and 34.5 0C via series of field experiments in
classrooms. The values of air temperature of 25.6 and 34.5 0C were the averages of the lowest
and highest indoor air temperatures in the classrooms during field experiments. Consequently,
the data from the assessments at the field experiments were used to statistical compare the
thermal comfort, health academic performance of the samples between the air temperatures of
25.6 and 34.50C.
The rationale for the use of the field experimental method is based on the idea that experimental
research method conducted either in the field or laboratories is the method often used to
empirically examine if one factor X has effect on another Y (Hakim, 2000). The attribute of
experimental research method mentioned here corresponds with what the aim of this study and
the analytical model in chapter 2 seeks to examine. Another rationale for the use of experimental
research method in this study was to control for the effect of some extraneous factors (e.g. noise,
daylighting, ventilation and mood): these factors can affect the result concerning the effect of
indoor air temperature on the academic performance of the samples reported in this study:
control for the effects of extraneous factors, is one key advantage of experimental research
methods over other types of quantitative research methods.
Specifically, the field experimental research method was used in this study rather than the
laboratory experimental research method for the sake of avoiding the introduction of artificial
environment and variables during the measurements of the thermal comfort and academic
performance of the samples. Introducing artificial environments and variables in this study may
not represent the natural (true) settings of the schools where the pupils (samples) usually
perform their academic task.
Another research method utilised in this study is the field survey research method. The field
survey research method was used for investigating the effect of indoor air temperature on the
thermal comfort and productivity of teachers instead of the field experimental research method.
The use of the field survey method instead of the field experimental method is based on the idea
that teachers do not naturally carry out academic task in groups of persons with similar
attributes as students do. Thus, it could be a challenge to match the attributes of teachers to
form experimental groups that can be used to examine the effect of indoor air temperature on
the thermal comfort and productivity of the sample of teachers used for this study. As well, the
field survey research method was used to survey the views of teachers about signs associated
to how high indoor air temperature affects pupils’ performance in classrooms.

54
Generally, one drawback of the survey research method is that there is less control for the effect
of several factors that may affect the data collected. Another drawback of survey research
method is that the questionnaire used to collect data are structured, this can affect the depth of
the data collected (Hakim, 2000; Kothari, 2004). Positively, survey research method has the
advantage of collecting large amount of quantitative data within a limited time.
The last (third) research method utilised in this study is the physical survey method. The
physical survey method was used to measure the physical characteristics of the sample of
classrooms used for this study. In turn, the data from the physical surveys was used to examine
the potential contributions of the design features of the classrooms used for this study to the
indoor air temperature in order to make recommendations for the design of future classrooms
in public schools of Nigeria.
Also, the data from physical surveys of the physical characteristics of the classrooms
mentioned above were used as raw input data for the building performance simulation in this
study. The output from the building performance simulation predicts the ranges of indoor air
temperatures that exist in the classrooms used for this study for over an academic year.
Consequently, the output from the building performance simulation mentioned here was used
to extrapolate the results obtained from the field experiments across academic year. This
extrapolation was done in order to estimate the extent (duration) by which high air temperatures
could affect the performance of the samples used for this study over an academic year; this is
because the performance of the samples were measured under specific indoor air temperatures
at a point in time during the field experiments. In addition, other outputs from the building
performance simulation in this study were used for the following:
a) To validate the values of the indoor air temperatures in the classrooms that were measured
during the field experiments with pupils and field surveys with teachers in this study
b) To identify the ranges of CO2 and humidity levels that exists in the classrooms of the schools
used for this study over an academic year. In turn, the CO2 levels mentioned here were used
to discount for the effect of CO2 on the result concerning the effect of indoor air temperature
on the pupils’ health and academic performance reported in this study.
The rationale for utilising the physical survey method to evaluate the physical characteristics
of the classrooms used for this study is based on the idea that, physical survey is an in situ
method commonly used by authors for collecting and analysing data about the physical
characteristics of buildings in some research concerning the built environment. In view of the
three research methods discussed in this section find in Figure 3.1 a flow chart showing the

55
links between the research methods used in this study and key results obtained from the
investigations in this study.
Figure 3.1. Summary research methods utilised in this study.Source. Author

56
3.4 Review of research methods commonly used to investigate causal relationships.
Wyon et al. (1979) investigated the effect of heat stress on the mental performance of 72 Danish
high school pupils. The authors randomly exposed the subjects in groups of four to three
different air temperature conditions in a climatic chamber. The three air temperature conditions
are: (20 – 230C, 20-260C and 23-290C). Three different prevailing temperature conditions were
chosen to create the basis for comparing their cognitive performances. The investigation by
Wyon et al. (1979) here is a clear example of how experiments are used to collect data from
subjects. The cognitive performance of the subjects in the study by Wyon et al. (1979) were
measured by the use of tasks in the area of numeracy and literacy. Although, Wyon et al. (1979)
did not mentioned how they controlled for the effect of other psychosocial factors on the result
of their experiments. However, it is assumed that the authors controlled for the effect of some
physical factors such as daylighting, noise and ventilations. This is based on the idea that the
climatic chamber used for their experiment may have been standardised with respect to the
physical factors mentioned here. Wyon et al. (1979) utilised analysis of variance (ANOVA) to
analyse the data collected from the subjects used for their investigation, this is probably because
ANOVA can be used to compare the performances (scores) of the subjects used for their
investigation in the three air temperature conditions mentioned above.
Similarly, in order to demonstrate that thermal environments have effect on pupils academic
performances, Peccolo (1962) used experimental research method similar to the one used by
Wyon et al. (1979) to collect and analyse data. However, the contrast between the experiments
of the two authors mentioned here is that, the experiment by Peccolo (1962) was conducted in
the field using the classroom similar to where the subjects usually take their lessons. Whereas,
the experiment by Wyon et al. (1979) was conducted in a climatic chamber which is completely
different from where the subjects normally take their lessons. In my view, conducting
experiments in climatic chambers may have some limitations in is applicability in the real
world. Nonetheless, the experiments by the authors here seem to be similar in terms of the
method used for the analysis of data, both authors used ANOVA to analyse data and report their
findings.
Another study by Wargocki and Wyon (2007),they employed experimental research method to
examine the association between air temperature ,ventilation and pupil’s academic performance
in some schools at Denmark. The pupils were of ages 10-12 years old. In the experiment of the
authors mentioned here, the repeated measures design was used to collect data from the pupils.
Also, in the experiment of Wargocki and Wyon (2007) the pupil’s academic performances were

57
assessed via several numerical (Mathematics) and language-based tasks (reading and
comprehension). Furthermore, Biro et al. (2012) used experimental research method to
evaluate the effect of ventilation rate on the performance of school work in some primary
schools in the UK. One idea useful to this study from the experiment of Biro et al. (2012) is
that the authors appear to have controlled for the possible effect of some psychosocial factors
(e.g. quality of sleep, mood and hunger) on the result of their findings. This was done by
measuring the quality of sleep, mood and state of hunger of the samples used for their
experiment. Lastly, t-tests, ANOVA and the Wilcoxon matched pair test were used to analyse
the data.
In addition, to the experimental research methods reviewed above, Barrett et al. (2015) utilised
survey research method to examine the relationship between the physical design features of
school and pupils learning progress in some primary schools in the UK. Learning progress was
assessed via the pupil’s grade in Mathematics, English and writing. Multilevel statistical
modelling and bivariate analysis were used to analyse the data, after controlling for the effects
of some environmental and non-environmental factors.
The experimental research methods reviewed past paragraph of this section, is similar in three
main ways to experimental method utilised for investigating the effect indoor air temperature
on the thermal comfort, health and academic performance of samples in this study. Firstly, the
experiments performed by the authors reviewed in this section and the field experiments carried
out in this study examined causal relationship by exposing subjects to pre-test and a post-test
conditions. Secondly, statistics is often used to analyse data as reported in the works of the
authors reviewed above, similarly, in this study statistics was used to analyse and report the
findings. Thirdly, mathematics and English tests were often used by the authors reviewed in
this section to assess pupils’ academic performance, likewise, mathematics and English tests
was employed in assessing pupils’ academic performance in the experiments conducted in this
study.
However, the experimental research method reviewed in this section differs from that used for
this study in two main areas. Firstly, the experimental research methods earlier reviewed in this
section are true experiments, this means that the participants were often randomly selected,
while that used in this study is the field experimental research method (Quasi-experiment). In
field or quasi-experiments participants are often not randomly selected, they are usually
selected (used) as intact group (naturally formed), (Adams and Schvaneveldt, 1991; Cohen et
al. 2000). Second, the design of the experiments of the authors reviewed in past section were

58
mainly between-groups design, while the design field experiments conducted in this study was
the repeated measures design also known as the within-group experimental design.
To conclude, the review in this section shows that experimental research methods have
commonly been utilised for examining the relationship between indoor environmental factors
and performance. Also, the method review documented in this section tends to show that
mathematics and English test are often used as the dependent variables for assessing academic
performances in experiments concerning the effect of indoor environmental factors and pupils
performances in schools. As well, the review in this section tends to show that inferential
statistics (ANOVA, t-test, and Wilcoxon-matched pairs test) are mostly used in the analysis of
data concerning the effect of indoor air temperature on academic performance.
3.5 Description of the process used for data collection and analysis in respect of the field experimental research method utilised in this study.
This section (3.5) describes the process utilised for data collection and analysis as regards the
field experimental research method, the role and rationale for the use of the field experimental
method in this study has been provided in section 3.4 of this chapter. The next section (3.6)
describes the process utilised for data collection and analysis as regards the field survey research
method. Afterwards, section (3.7) describes the process utilised for data collection and analysis
as regards the physical survey research method
3.5.1 Permissions for the field work
Obtaining permission is an important step towards the collection of data in many research .In
this study, the permission to conduct the field work was first obtained from the ethical review
committee of Newcastle University, UK. Also, permission was obtained from the Ministry of
Education in Minna, Appendix A. This ministry oversees the activities and programmes of
public schools within Niger state. Furthermore, permission was obtained from the principals of
the 11 schools used for this study as well as from the parents of the pupils and the pupils
themselves via a sample of the consent form attached in Appendix B and C respectively .Lastly
permission was sought from the teachers that were used for the field surveys in this study via a
consent form, Appendix D.
3.5.2 The study area
The fieldwork of this study was carried out in the city of Minna, Niger state of Nigeria. The
rationale for selecting Minna for the fieldwork of this study is based on the idea that the city is
a place that I have lived and worked for over twenty years, as such there is assurance of gaining

59
permission as regards the collection of data from the authorities in charge of public schools in
Minna. Minna is the capital city of Niger state, Figure 3.2.Niger state is one of the 36 states in
Nigeria. Minna lies within latitudes 80 to110N and longitudes 30 to 70 E with a population of
about 390.000 as at the last census of 2006.Furthermore, Minna is characterised by relatively
high outdoor air temperatures most times of the year, Figure 3.3.From the Figure 3.3, it could
be deduced that outdoor air temperatures in Minna could read as much as 400C in the month of
March and above 300C most times of the year 0C. Also, relative humidity could read up to 60-
70 % during the peak of rainy seasons in most places located within northern Nigeria which
includes towns such as Minna,(IIoeje, 1999; Omalu et al., 2015).
Figure 3.2. Map of Nigeria showing the location of Minna (Site of field work). Source.
https://www.dhsprogram.com/pubs/pdf/FR222/FR222.pdf
Figure 3.3.Mean monthly maximum air temperatures in Minna for 2005. Source. Data used to
plot the graph was obtained from Niger State Agricultural Statistics 2012 .
05
1015202530354045
Out
door
ait
tem
pera
ture
0 C

60
3.5.3 The context of public schools in Nigeria
The current educational system in Nigeria is the 6-3-3-4, Figure 3.4. This system means, 6years
primary education, 3years junior secondary education, 3years senior secondary education and
4 years tertiary education. Broadly, public schools in Nigeria consist of the 6 years primary, 3
years junior secondary school and the 3 years senior secondary school education that is provided
and overseen by the federal government and the state governments. However, in order to
promote literacy amongst the citizens of Nigeria, the federal government established the
Universal Basic Education (UBE) act of 2004.This act (UBE) makes it mandatory for every
child in Nigeria to attend the 6 and 3 years primary and junior secondary school education. The
establishment of the UBE act of 2004 lead to the development of a standard educational
curriculum and building design approach that are applicable to public primary and junior
secondary schools in all the 36 states of Nigeria. The standard educational curriculum and
building design approach applicable to schools under UBE (public primary and junior
secondary) prompted this study in adopting pupils in public primary and junior secondary
schools as the target population for this study as discussed in the next subsection.
Furthermore, the medium of instruction often used in public schools in Nigeria is English
Language while academic task and assessments are usually paper based. School terms in public
schools in Nigeria are usually from September – early December (First term), early January -
early April (second term) , May – July (Third term). As well, pupils in public schools are
formally assessed via test at midterms and by examination that often takes place around two
weeks to the end each term. Additionally, the recommended teacher / pupil ratio for primary
schools is 1.35 while that for junior secondary schools is 1:40 (Universal Basic Education
Commision, 2010) .
Figure 3.4.The 6-3-3-4 system of education in Nigeria.

61
3.5.4 Target population
The target population for this study are pupils attending public primary and junior secondary
schools in Minna. This is because as earlier mentioned in the last subsection (3.5.3), public
Primary and Junior Secondary Schools in Nigeria are strictly under the Universal Basic
Education (UBE) programme. UBE programme is a ‘compulsory’ educational programme for
children that usually specifies similar (standardised) curriculum and building design features
for educating primary and junior secondary school children across Nigeria. Generally, primary
and junior secondary schools belong to the 6-3 level educational system in Nigeria as earlier
mentioned in section 3.5.3, Figure 3.4.
3.5.5 The Samples
Thus, amongst the target population (public primary and juniour secondary school pupils in
Minna), the present study purposely selected pupils in the final year of the 3 years Juniour
Secondary School as the samples for this study.Pupils in final year of the 3 years Juniour
Secondary School education in Nigeria are usually refered to as JSS3 pupils.The JSS3 pupils
were selected as samples for this study because as at the time of this study they are the pupils
with ages 13 and above, their brains are likely to be more developed in comparison to pupils
with lesser ages in target population selected for this study. This is supported by the fact that
recent discoveries from neuroscience of the brain suggests that 12 years is literally when the
brain of a child becomes fully organised with parts of it still to become more organised as the
teen years increases,(Brain Developement and Early Learning, 2007).
3.5.6 The sample of schools
Following the permission granted by the Niger state Ministry of Education (NMOE) erlier
mentioned in section 3.5.1, prelimanary surveys were made to 31 public schools within Minna
that have Juniour secondary school pupils (JSS3). The goal of the preliminary surveys was to
identify schools that the principals would readily grant the reseacher permissions to conduct the
field experiments in their schools using the JSS3 pupils. At the end of the preliminary surveys
11 schools were adopted to be used as samples for the field work of this study. These (11) were
the schools that the principals in agreement with the teachers gave the permissions for the field
work of this study to take place in their schools following the preliminary surveys erlier
mentioned in this section. Thus for the sake of anonymity, the 11 schools adopted for the field
work of this study were given given code names as presented in Table 3.1. The code were
generated based on the chronological manner in which the field experiments were conducted in
the schools.

62
Code name of schools used for the study School 1 School 7 School 2 School 8 School 3 School 9 School 4 School10 School 5 School11 School 6
Table 3.1. Code name of schools generated for the study
3.5.7 Sample size
The adoption of the 11 schools mentioned in the paragraph above resulted to using 407Juniour
Secondary School pupils (JSS3 pupils) as the sample size for this study. These 407 JSS3 pupils
are existing members (existing pupils) from 11 JSS3 classrooms in the 11 schools utilised for
this study. Find in Table 3.2, the distribution of the 407 pupils from the 11 schools utilised for
this study. Interestingly, the sample size (407) used for the field experiments of this study is
higher than the sample size (300) used by Wargocki and Wyon (2007) in a similar study.
School code Number of pupils School 1 36 School 2 42 School 3 34 School 4 39 School 5 32 School 6 40 School 7 35 School 8 41 School 9 38 School 10 33 School 11 37 Total 407
Table 3.2. Sample size from the 11 schools used for this study
3.5.8 Design features of the classrooms
Each classroom used for the field experiments in this study is rectangular in form with an
approximate floor area of 56 m2 (7x8m). Pupils usually seat in rows as depicted in Figure 3.5.
Also, the walls of the classroom are built with 225mm hollow sandcrete blocks, plastered with
cement/sand and finished internally with a bright colour (light cream colour). Furthermore, the
classrooms operates strictly on natural ventilations and daylighting. Chapter 4 presents a more
detailed descriptions of the design features of the classrooms used for this study.

63
Figure 3.5.Typical plan of the classroom used for the field experiments in this study .
3.5.9 Measurement of air temperatures in the classroom (Independent factor of study)
The Exitech 445815 thermo/hygrometer was used to measure the air temperatures in the
classroom at each field experiment that was conducted in the 11 schools. This instrument
measures air temperatures in the ranges of – 100C to 600C and has an accuracy level of -+ 0. 21
from 0 to 50 o C. During each field experiment , the instrument was placed at the middle of the
classroom on a wooden pedestal of approximately1.1 m high, Figure 3.6.Authors often measure
environmental factors indoors within heights of 1.1 to 1.2m (Feriadi and Wong, 2004; Zeiler
and Boxem, 2009). At each field experiment conducted in the classroom of a school, the air
temperatures were measured thrice when the thermal comfort, health and academic
performance of the samples were concurrently measured in the morning (low temp) and also in
the afternoon (high temp). The average was used as the representative air temperatures in the
classroom at the period the when the thermal comfort, health and academic performance of the
samples were measured in this study.
Figure 3.6.The Exitech 445815 thermo/hygrometer used to measure the air temperatures

64
3.5.10 Evaluation of thermal comfort, health, and academic performance (Dependent factors)
Evaluation of thermal comfort (Dependent factor 1)
At each field experiment conducted in a sample of school, the thermal comfort of the pupils’
were evaluated via a thermal sensation vote questionnaire adopted from ASHRAE (2004). The
questionnaire has a section with a seven point thermal sensation voting scale where the samples
were requested to vote about their thermal comfort, Table 3.3. Instructions of how to fill the
thermal comfort vote questionnaire was often narrated to the samples by the researcher at each
field experiment conducted in the 11 schools. Please mark X in one of the boxes below on how hot or cold you feel right now with respect to the air temperatures in the classroom.
Cold -3
Cool -2
Slightly cool -1
Neutral 0
Slightly warm +1
Warm +2
Hot +3
Table 3.3.The 7 point ASHRAE (2004) thermal sensation voting scale used measure thermal
comfort in this study
Evaluation of pupils’ health (Dependent factor 2)
At each field experiment conducted in the 11 schools, a five point Likert scale designed as a
questionnaire was used to evaluate the health of the samples via their perceptions to symptoms
of: thirst, tiredness, headache, sweating and displeasure to do classwork. The 5 point Likert
scale was adopted from Lan et al. (2011).The aim of collecting the data mentioned here is to
use it as the means to statistically determine if high temperatures in classrooms of public schools
in Minna have effect on the pupils’ health. See Table 3.4 for the five point Likert scale
mentioned here.
Please indicate the extent to which you are experiencing (feeling) any of the symptoms in the table below with respect to nature of the air temperature in this classroom right now. Tick X in a row of the table below.
Symptoms Responses I don’t know Not at all A little Much Very much
Thirst Headache Sweating Tiredness Displeasure to do classwork
Table 3.4.The five point Likert scale used to measure the pupil perception to some symptoms: Source: adopted from Lan et al. (2011).

65
Evaluation of academic performance (dependent factor 3)
Numerical tasks (Mathematics test) and literacy tasks (English test) was identified to be
commonly used by the authors reviewed in section 3.4 of this study to measure pupils’ academic
performance. In view of this, at each field experiment conducted in the 11 schools, two paper
based tests in the area of Mathematics and English were administered to the samples in their
classrooms in the morning (low temp) and also in the afternoon (high temp). However, the
questions of the two paper based tests administered in the morning (low temp) and afternoon
(high temp) have different questions in terms of structure (how they were phrased and ordered)
but of equal level of difficulties, see Appendix G-J for the paper based test questions. These
paper based tests mentioned here were jointly prepared and vetted by the mathematics and
English teachers from the 11 schools used for experiments based on what they have previously
learnt in their schools. Also, these tests were administered at the field experiments by a teacher
in the usual manner by which the samples take their term tests and examinations.
The mathematics test consists of 15 short answer questions (i.e.15 marks, 1 mark for each
correct answer) and 1 moderately long answer question (5marks). The total score expected to
be achieved by a pupil (sample) in the mathematics test is 20. Likewise the English test consists
of 15 multiple choice questions and 5 questions from a short passage. Each correct answer in
the English test weighs 1 mark, therefore the total score that is expected to be earned by a
sample in the English test is 20 marks. Academic performance in each field experiment was
measured by the mean score earned by the samples in the mathematics and English test taken
in the morning (low temp) and afternoon (high temp). Additionally, the two tests were allowed
40 minutes to be completed. For example, Mathematics (20 minutes) and English (20 minutes)
at each experiment that was conducted in the morning (low temp) and also in the afternoon
(high temp). The 40 minutes time allowed to answer the tests questions was specified by the
teachers who set the test questions previously mentioned in this section. Finally the answer
scripts were marked by the teachers from each of the 11 schools that prepared and vetted the
academic tests questions based on a harmonised marking scheme. Afterwards the raw scores of
the samples from each of the 11 schools were collated and handed over to the researcher. An
example of the table used to collate the result tests from a field experiment in a school is shown
Table 3.5.

66
School code
Name of sample/ experimental code no
Score of each sample in the 20 marks maths test taken in the morning(low temp)
Score of each sample in the 20 marks maths test taken at noon(high temp)
Score of each sample in the 20 marks English test taken in the morning (low temp)
Score of each sample in the 20 marks English test taken at noon (high temp)
School 1
School 1
School 1
School 1
--------------------
Average score Average score Average score Average score
Table 3.5. Example of the table used to collate the result of the academic performance tests
for each of the 11 schools.
3.5.11 Control of some environmental and Non – environmental factors at each field experiment in a school.
The control non-physical factors (health, hunger, emotions and SES status)
This study controlled for the effect of some non-physical factors that may affect the academic
performance of the samples in the tests taken at each field experiment conducted in the 11
schools. This was done by subjectively assessing the state of health, hunger and emotions of
the samples on a dichotomous scale via a short questionnaire designed by the researcher, see
appendix E. The assessment mentioned here was often carried before the start of each field
experiment. However the data of samples whom indicated they were sick, hungry or not happy
before taking the tests at the field experiments were not used for the statistical analysis in this
study. The rationale for controlling for the effect of the three non-physical factors earlier
mentioned is based on the idea that physical and emotional wellbeing are pre-conditions that
can enhance or impede learning(Blackmore et al., 2011). Lastly, it was assumed in this study
that all the sample used for this study have similar SES status (Socio Economic Status).
The control non-physical factors (post lunch dip)
This study controlled for the effect of the post lunch-dip on the result of the academic
performance tests administered to the samples at the field experiments by ensuring that each
field experiments conducted in a school ends at approximately 1.30pm. Thus, no field
experiment was conducted after 1.30 pm.The post lunch –dip is the period that occurs around
2pm and 4pm when human performance generally tends to decrease sharply as previously
shown in chapter 2, Figure 2.12 (Folkard, 1975; Monk, 2005) .

67
Questionnaire assessment for the control of physical factors (Daylighting, Noise and
Ventilation).
Daylighting, noise and ventilation have been demonstrated to have effect on pupils’ academic
performance as earlier reviewed in chapter 2. Against this background, this study controlled for
the possible effect of these factors on the result of the pupils academic performance at each
field experiment conducted in the 11 schools utilised for this study. The assessment was done
by subjectively evaluating the levels of daylighting, noise and ventilations in the classroom at
each field experiment via use a short questionnaire adopted from Kwok (1999), appendix E.
The short questionnaire requested the samples (pupils’) to provide their perception of the
daylighting and noise levels in the classroom at the end of the academic performance tests in
Mathematics and English Language at each field experiment. Also, the questionnaire requested
the samples to indicate if they have any difficulties in breathing the air around them at the end
of the tests mentioned above at each field experiment. Thus, as regards the subjective
assessments mentioned here, the samples (pupils) who indicated that the daylighting levels in
their classrooms were too low or too high during the tests at each field experiment were
excluded from statistical analysis in this study. Also, the samples whom indicated that they had
difficulties in breathing the air around them at end of each tests were excluded from the
statistical analysis in this study.
The idea behind the use subjective means via questionnaire to assess daylighting and noise
levels in this study is to strengthen the reliability of the objective measurements of daylighting
and noise levels measured at the field experiments. Increasing evidences from some authors
(Leaman et al., 2010) suggests that users of buildings are becoming reliable indicators that can
be used to determine how well a building performs with reference to some indoor environment
factors, such as temperature, noise, daylighting and ventilation.
Objective control for daylighting and noise (control factor)
Before the beginning of each field experiment in a school, measurements of the daylighting
levels falling on the desks of the pupils (samples) was carried out. The instrument that was used
to measure the daylighting levels is the light meter YK-2005LX, Figure 3.7.The light meter has
an accuracy level of +- 4%, and also it measures daylight levels in the range of 200 Lux to
100,000. The measurements were carried out on the desks of the samples as shown in Figure
3.8. Fortunately, in the 11 classrooms used for the field experiment the daylight in each of the
classes were in the range of 275 and 480 lux, However, 300 lux is the recommended daylight
level required for reading, drawing and writing in schools (Hordijk and Groot; 2010 EN 12464).

68
Similarly, measurements of the noise level in the classrooms were carried out using CEM 8850
sound level meter, Figure 3.9. The noise level measurements were taken along the perimeters
of the walls in the classrooms at a level of about 1.2 m above the floor level before the beginning
of each field experiment. Unfortunately, the noise level measured in all the classrooms used for
the field experiments were a bit higher than the 35 dBA recommended by WHO (1999). The
ranges of noise level in the classrooms measured at the field experiments in this study were
between 40 dBA to 57dBA. However this study relied on the subjective assessment of noise
level to control for noise in the statistical analysis. This is because habituation may allow for
the pupils to accommodate higher noise levels than what standards recommends.
Figure 3.7.The Light Meter YK-2005LX used for the field experiments in this study
Figure 3.8.The positions where the daylighting measurements were carried out in the classroom
during the experiments in this study. Source. Author’s Fieldwork (2016)

69
Figure 3.9.The Noise meter used for the experiments in this study. Source. Author’s Field work
(2016)
Control for seating arrangement, classroom density (crowding) and colour
Seating arrangement and classroom density have some influence on the performance of learning
tasks in classrooms as earlier documented in the literature review in chapter 2. In view of this,
it was ensured that the classrooms used for the field experiments had the seating arrangement
in rows. It was also ensured that the pupils in the classrooms used for the field experiments in
this study did not exceed 40. As earlier mentioned in section 3.5.3, 40 pupils is maximum
amount of pupils required to occupy a classroom in public schools of Nigeria as specified by
Minimum Standard for Basic Education (2010). Fortunately, the interiors of all the classrooms
used for the field experiments in this study are brightly coloured (light cream) as such this may
not affect the emotional state of the samples used for this study. The mood of children can be
affected by relatively dark colours as earlier documented in chapter 2 (2.6.5) (Boyatzis and
Varghese, 1994)
3.5.12 Clothing insulation value (clo value) and metabolism (met) of the samples
The clothing insulation values worn by the samples in this study may have effect on their
thermal comfort. In view of this, the researcher found it reasonable to document the nature of
clothing worn by the samples as well as the corresponding clo values during the field
experiments. Most (81%) of the samples used for the experiments wore school uniforms with
clo values centered around 0.5 while 19% of the samples wore uniform with clo value of about
0.8 See Table 3.6 for the breakdown of clothing insulation values estimated for the samples
used for this study as deduced from ASHRAE (2004) .The metabolic rate of the all samples

70
used for the field experiments in this study was estimated to be 1.2 met from ASHRAE (2004).
This value corresponds to that of a person that is performing sedentary activity in schools and
offices as earlier documented in chapter 2 (subsection 2.3.4, Table 2.3).
Clothing for
boys
clo
values
Clothing for girls
without veils
clo
values
Clothing for girls
with veils
clo values
Short sleeve
shirt
0.19 short sleeve dress 0.29 Short sleeve dress 0.29
Trouser 0.15 Trousers 0.15 Trousers 0.15
T- shirt 0.08 Bra 0.01 Bra 0.01
Briefs 0.04 Panties 0.03 Panties 0.03
Socks/socks 0.05 Shoes and socks 0.05 Shoes and socks 0.05
---------------- -------- -------------------------- --------
---
Veil (it was assumed
to be the same value
with that of the short
sleeve dress)
0.29
Total 0.51 0.53 0.82
Table 3.6.The breakdown of the estimated clo value of uniform worn by the samples used for this study. Source. Adopted ASHRAE (2004)
3.5.13 Design of the field experiment in this study
In each of JSS3 classroom of the 11 schools used for the field experiments in this study, the
repeated measures experimental design was used to simultaneously evaluate the thermal
comfort, health and performances of the samples in the morning at average indoor air
temperatures of 25.6 0C and in the afternoon at 34.5 0C. This means that, the first simultaneous
evaluation of the thermal comfort, health and academic performances of the samples in each
field experiment in the classroom of a school was carried out in the morning at average indoor
temperature of 25.6 0C. The second evaluation of the thermal comfort, health and academic
performances of the same samples in the same classroom was performed the same day in the
afternoon when the air temperatures in the classroom is likely to be hot (average of 34.5 0C).
Overall, 11 field experiments were performed in the 11 schools used as samples for this study.
Furthermore, the values of the air temperatures recorded in the morning experiments in this
study was referred to as low temp and that in the afternoon high temp. The breakdown of the
model procedure used for data collection at low temp and high temp at each field experiment
are summarised in the Table 3.7 and 3.8 respectively.

71
Time of the day
Descriptions of activities in the classroom
7.20am - 8.00am
Equipment setting up/testing in the classroom as well as the submission of
consent forms by pupils. This was closely followed by the objective
measurements of daylighting and noise levels in the classroom (control factor).
8.00am - 8.30am
Briefing by the researcher concerning the overview (processes/instructions) of
the field experiment. Afterwards, the state of hunger, health and emotion of the
samples were assessed via a questionnaire (control factors).
8.30am – 9. 40am
Assessment of the thermal comfort and health of the samples via a
questionnaire (dependent factors). This was immediately followed by assessing
the academic performances (dependent factor) of the samples via administering
the 40 minutes paper based tests in mathematics and English Language. During
this period the air temperature (independent factor) was measured three times (i.e.
every 20 minutes), the average was used as the value representing the air
temperature in the classroom when the three dependent factors mentioned here
were assessed at each field experiment. Immediately after the assessment of the
thermal comfort, health and academic performance of the samples, a subjective
assessment of the daylighting, ventilation and noise levels in the classroom were
performed.
9.40am - 10 am
Questions from pupils and vote of thanks by researcher.
10am- 10.30am
Break period for pupils
10.30 am – 11.40
Free period for the samples to undertake any task on their own in the
classroom(e.g. reading, copying notes, discussions or asking general questions)
Table 3.7.The procedure for conducting each field experiment in the morning (low temp) at
the classroom of the 11 schools used as samples in this study.
Time of the day Descriptions of activities in the classroom
11.40pm- 12.00 Objective measurements of the daylighting levels and noise levels in the
classrooms.
12.00 pm –12.20pm Brief by researcher as well as the subjective assessment of the state of
hunger, health and emotion of the samples were performed.
12.20pm – 1.30pm Assessment of the thermal comfort and health of the samples via a
questionnaire (dependent factors). This was immediately followed by
assessing the academic performances (dependent factor) of the samples

72
via administering the 40 minutes paper based tests in mathematics and
English Language. During this period the air temperature (independent
factor) in the classroom was measured three times (i.e. every 20 minutes).
The average was used as the value representing the air temperature and in
the classroom when the three dependent factors mentioned here were
assessed at each field experiment. This was closely followed by the
subjective assessment of daylighting, ventilation and noise level in the
classroom.
1.30pm-1.40pm Vote of thanks
Table 3.8.The model procedure for conducting each field experiment in the afternoon (high
temp) at the classroom of the 11 schools used as samples.
3.5.14. The statistical tests used to analyse data from the field experiments with pupils
Normality test
Determining normality by visual means such as the use of histograms or Q-Q plots can be
subjective and unreliable as noted by Ghasemi and Zahediasl (2012).This study tends to agree
with the view of Ghasemi and Zahediasl (2012) mentioned here. This is because a researcher
could decide based on his personal eye view that a data is normally distributed a Q-Q plot
whereas it is not. This provides an opportunity for this study to rely on the use of objective
(numeric) means for the determining normality. Two sets of tests commonly used by
researchers in educational studies for determining normality based on objective (numeric)
means are: (a) the Skew and Kurtosis (b) Shapiro-Wilk and Kolmogorov- Smirnov test. In
view of the aforementioned tests, the Skew and Kurtosis test was used for determining
normality in this study. This is because authors (De Vaus, 2002; Field et al., 2012) have pointed
out a limitation associated with the use of Shapiro-Wilk and Kolmogorov- Smirnov test for
determining normality of data coming from large samples ( usually above 30). They (De Vaus,
2002; Field et al., 2012) pointed out that the Shapiro-Wilk and Kolmogorov- Smirnov test often
tends to show that data coming from large samples are not normally distributed even with a
negligible deviation from normality.
Dependent and independent t-tests
With respect to the data from the field experiments in this study, the dependent t-test was used
to determine if there is a significant difference between the means of the thermal sensation votes
used to measure the thermal comfort of the samples at 25.60C (low temp) and 34.50C (high
temp).The dependent t- was performed in order to report the effect of indoor air temperature of

73
34.50C (high temp) on the thermal comfort of the samples (pupils) used for the field experiments
in this study. Similarly, with respect to the data from the field experiments in this study, the
dependent t-test was used to determine if there is a significant difference between the mean
score of the samples in the mathematics and English tests taken at 25.60C (low temp) and 34.50C
(high temp).This test was carried out in order to report the effect of indoor air temperature of
34.50C (high temp) on the academic performance of the samples (pupils) used for the field
experiments in this study. The rationale for the use of the dependent t- test for the analysis
mentioned above are itemised below.
a) The thermal comfort and academic performance of the samples were measured at 25.60C
(low temp) and 34.50C (high temp) by repeated measures at the field experiments. This
means that the thermal comfort and academic performance of the samples were measured
at 25.60C (low temp) and 34.50C (high temp) using the same samples and procedures at the
field experiments.
b) The data concerning the thermal comfort and academic performance of the samples used
for the field experiments in this study are normally distributed as shown from the results
of the normality test reported in subsections 3.5.15(Table 3.9) and 3.5.17(Table 3.11).
Broadly, in order to show the effect of one factor on another, the dependent t-test is often utilised
to determine if there is a significant difference between the means of two data that normally
distributed and are collected via repeated measures experiments (Cook and Campbell, 1979;
Kinnear and Gray, 1999; Pallant, 2005; Gaur and Gaur, 2006; Cleophas and Zwinderman, 2012;
Miller, 2017).
Furthermore, the independent t-test was used to determine if there is significant gender
differences in the effects of indoor air temperatures of 25.60C (low temp) and 34.50C (high
temp) on the thermal comfort and academic performance of the samples. Similarly, the
independent t -test was used to identify if there is significant differences in the effect of indoor
air temperatures of 25.60C (low temp) and 34.50C (high temp) on the thermal comfort of the
samples as a result of the difference of the clothing insulation values worn by the samples.
Generally, independent t-test is often utilised to determine if there is significant difference
between the means of data collected from two different entities, samples or groups,(Field,
2009; Field, 2018).
Wilcoxon-signed ranked test
In respect of the data from the field experiments, the Wilcoxon-signed ranked test was used to
determine if there is a significant difference in the perceptions of the samples to symptoms of
headache, tiredness, sweating, thirst and displeasure to do classwork between 25.6 0C (low

74
temp) and 34.50C (high temp). This test was used to report the effect of indoor air temperature
on the health of the samples (pupils) utilised for field experiments in this study. The Wilcoxon-
signed ranked test was used in this study for two reasons. Firstly, the data concerning the
perceptions of the samples to the symptoms highlighted in bold in this subsection were collected
by repeated measures at the field experiments. Secondly, the data concerning the perceptions
earlier mentioned in this subsection are not normally distributed as shown by the results of
normality tests reported 3.5.16 (Table 3.10). Broadly, the Wilcoxon-signed ranked test is the
recommended test for comparing the means between two data in order to show the effect of
one factor on another, particularly in situations where the data coming from the samples are
not normally distributed and the data is collected via repeated measures (Field, 2009; Field,
2018).
The statistical significance level (p value)
A 95% confidence interval with a p value set at p<0.05 was used to determine statistical
significance in the results from the data analysis in this study. This because p<0.05 is the
frequently used value in ‘modern statistics’ to determine if one factor or group significantly
differs from another(De Vaus, 2002; Field et al., 2012) (De Vaus 2002; Field 2012). p<0.05
has been used by several authors in their recent works concerning the effects of indoor
environmental factors on pupils’ academic performances (Lan et al., 2010; Haverinen‐
Shaughnessy et al., 2011).
The effect size formulas
Cohen’s d and the Pearson’s correlations coefficient were used to calculate and report the effect
sizes in this study. This is because they have been noted to be the most commonly used formular
by researchers in calculating effect size as reported by an extensive review on effect size by
Peng et al. (2013) . Another rationale for the use of the aforementioned effect size formula in
this study was that they are fairly understood by the researcher as demonstrated by the worked
examples in Field Field et al. (2012) . Find below the formulas discussed here.
Cohen’s d= M ÷ SD …………………………………………………………………………1
Pearson correlation coefficient r=Z ÷ √N…………………………………………………... 2
Specifically, Cohen’s d was used to calculate the effect size in the case of results from
dependent t-tests. This is because all the parameters (M, and SD) needed for the calculation
comes simultaneously with the SPSS 24 output of dependent t-tests results.

75
The Pearson’s correlations coefficient was used to calculate the effect size where the Wilcoxon
signed-rank test was used to conduct analysis in this study. This is because all the parameters
(Z and √N) needed for the calculation comes simultaneously with the SPSS 24 output of the
Wilcoxon signed-rank test results.
3.5.15 Method used for analysing data from the field experiments as regards the effect of indoor air temperature on the thermal comfort of the samples (pupils)
In respect of the thermal sensation votes used to measure the thermal comfort of the samples
at the field experiments in this study, the goal of the data analysis described in this section is to
evaluate the differences (changes) in thermal comfort of the samples between the air
temperatures of 25.60C (low temp) and 34.50C (high temp). Consequently, the results from the
analysis in this section was used to report the effect of indoor air temperature on the thermal
comfort of the samples. The steps used for the data analysis is provided below and the results
are reported in chapter 5 (5.3.3).
Step 1: Creation of a data set and exclusion of some samples
The first step for analysing data as regards the thermal comfort of the samples in this study was
the creation of a data set in SPSS 24 using the key data listed below. The data were collected
from the field experiments.
a) The thermal sensation votes used to measure the thermal comfort all the 407 samples from
the 11 schools at mean air temperature of 25.6 0C (low temp)
b) The thermal sensation votes used measure the thermal comfort of all the 407 samples
from the 11 schools at mean air temperature of 34.50C (high temp)
c) The personal characteristics of the samples (e.g. Age ,clo value , gender)
Thus, following the creation of the data set using the key data listed above, the data of 18
samples out of the 407 samples were manually excluded for the sake of control. The reasons
for their exclusions is described fully in chapter 5(5.2.2).
Step 2: Normality test
After the manual exclusion of the 18 samples mentioned above, a normality test was performed
on the thermal sensation votes of the remaining 389 samples in the data set using the Skew and
Kurtosis test. The result of the Skew and Kurtosis test suggest that the thermal comfort votes
used as the measure of the thermal comfort of the samples at the field experiments are normally
distributed. This is because the values of the Skew and Kurtosis from the normality tests carried

76
out on the thermal sensation votes are in the range of -1 to +1, Table 3.8. Data with Skew and
Kurtosis values in the range of-1 to +1 are usually considered to be normally distributed (de
Vaus; 2002; Field et al., 2012).
Data used for the Skew and Kurtosis tests Skew Kurtosis Thermal sensation votes used to assess the thermal comfort of the samples from the 11 schools at mean air temp of 25.60C
0.07 0.41
Thermal sensation votes used to assess the thermal comfort of the samples from the 11 schools at mean air temp 34.50C
- 0.19 -0.62
Table 3.9. Result of Skew and kurtosis tests on thermal comfort votes.
Step 3: Descriptive analysis of the Predicted Percent Dissatisfied (PPD) and Predicted Mean Vote (PMV) of the respondents.
Following the normality test carried out on the data set mentioned above, descriptive analysis
(statistics) of the PPD and PMV of the samples were performed in order to report the effect of
indoor air temperature of 25.6 and 34.50C on the thermal comfort of the samples of pupils used
for the field experiments in this study.
Step 4: Dependent and independent t-tests
Further to step 3 above, a dependent t –test was used to compute the difference between the
means of the thermal sensation votes used to measure the thermal comfort of the samples at
25.60C (low temp) and 34.50C (high temp).In this way, it was possible to report the result
concerning the effect of the indoor air temperature of 25.60C (low temp) and 34.50C (high temp)
on the thermal comfort of the samples used for this study in chapter 5(5.3.3).
Also, using the same data set created in step 1 above, an independent t-test was used to compare
the mean of the thermal sensation votes of the boys to that of the girls .In this way, the study
was able to report gender differences in thermal comfort of the samples used for this study as a
result of indoor air temperature.
Furthermore, an independent t-test was used to compare the difference between the means of
the thermal sensation votes of the samples that wore school uniforms with clo values of 0.5
with the samples that wore school uniforms with clo values of 0.86 .This was done in order to
report if there is significant difference in the thermal comfort of the samples used for this study
as a result of the clothing insulation values worn by the samples at the field experiments.
Step 5: Results (effect of indoor air temperature on the thermal comfort of pupils). In view of
the method described in this subsection, find in Figure 3.10 a summary of the method.

77
Figure 3.10. Steps used to analyse data in respect of the effect of indoor air temperature on
thermal comfort of a sample of pupils used for this study
3.5.16 Method for analysing data from the field experiments in respect the effect of indoor
air temperature on the health of the samples.
Step 1: Creation of a data set and manual exclusions of some samples
With respect to the data collected from 407 samples at the field experiments performed in the
11 schools used for this study, a data set was created in SPSS 24 using the key data listed below.
a) The Perception (feelings) of the 407 samples to symptoms of thirst at mean air temperatures
of 25.6 0C (low temp) and 34.5 0C (high temp)
b) The Perception of the 407 samples to symptoms of headache at mean air temperatures of
25.6 0C (low temp) and 34.5 0C (high temp)
c) The Perception of the 407 samples to symptoms of sweating at mean air temperatures of
25.6 0C (low temp) and 34.5 0C (high temp)
d) The Perception of the 407 samples to symptoms of tiredness at mean air temperatures of
25.6 0C (low temp) and 34.5 0C (high temp)
e) The Perception of the 407 samples to symptoms of displeasure to do class work at mean
air temperatures of 25.6 0C (low temp) and 34.5 0C (high temp)
f) The personal characteristics of the 407 samples (Age, gender, clo , )
After the creation of the data set using the key data listed above, the data of the same 18 samples
mentioned in the past subsection were manually excluded.

78
Step 2: Normality test
Thus, following the creation of the data set and the manual exclusion mentioned in step 1,
normality test was performed using the data listed a - e above, the normality test was performed
via the Skew and Kurtosis tests. The result of the Skew and Kurtosis tests points out that some
of the data listed a-e above in the data set created for the analysis in this section are not normally
distributed. This is because the values of the Skew and kurtosis of some of the data listed a-e in
the data set created in step 1 are not in the range of -1and +1,Table 3.10 . Data with Skew and
kurtosis values not in the range of -1and +1 are considered not normally distributed (de Vaus;
2002; Field et al., 2012).
Data used for the Skew and Kurtosis tests Skew result
Kurtosis result
Perception to symptoms of thirst at 25.60C 0.342 2.775 Perception to symptoms of thirst at 34.50C -0.637 -0.342 Perception to symptoms of headache at 25.60C -1.518 23.494 Perception to symptoms of headache at 34.5 0C 2.106 10.600 Perception to symptoms of sweating at 25.60C -1.405 4.023 Perception to symptoms of sweating at 34.50C -0.455 0.769 Perception to symptoms of tiredness at 25.60C -2.066 2.282 Perception to symptoms of tiredness at 34.50C 0.850 4.669 Perception to symptoms of displeasure to do classwork at 25.60C
-0.543 1.536
Perception to symptoms of displeasure to do classwork at 34.50C
-374 -816
Table 3.10. Result of Skew and kurtosis tests on data concerning perceptions of thirst,
headache, fatigue, sweating and displeasure.
Step 3: Wilcoxon-signed rank test
In view of the nature of the distribution of the data observed from the result of the normality
test mentioned in step 2 above, the Wilcoxon-signed rank test was used to carryout comparative
analysis with each of the data concerning the symptoms listed a-e in step 1 above (e.g.
comparison of the perception of thirst of the samples at 25.6 0C with their perception of thirst
at 34.5 0C).
Step 4: Results: effect of indoor air temperature on the health of the samples (pupils).
In view of the steps described in this subsection, Figure 3.11 presents a summary of the method
used to analyse the data concerning the effect of indoor air temperature on the health of the
samples. The results from this analysis are reported in chapter 5, section 5.4.

79
Figure 3.11. Steps utilised to analyse data in respect of the effect of indoor air temperature on
the health of a sample of pupils used for the field experiments in this study.
3.5.17 Method used for analysing data from the field experiments as regards the effect of indoor air temperature on the academic performance of pupils (samples).
With respect to the data concerning the mathematics and English test used to measure the
academic performance of the samples at the field experiments, the main goal of the data analysis
in described in this subsection are two:
a) To compare the mean score achieved by all the samples in the Mathematics test taken at
25.6 0C (low temp) with their mean score in mathematics the test taken at 34.5 0C (high
temp).
b) To compare the mean score achieved by all the samples in the English test taken at 25.6 0C (low temp) with their mean score in the English test taken at 34.5 0C (high temp).
By the comparisons mentioned above via a dependent t-test, it was possible to report the effect
of high air temperature on the academic performances of the samples used for this study in the
area of mathematics and English language. Also, the data analysis described in this subsection
was used to report gender effect in the performance of the samples as result of indoor air
temperature. Find below a description of steps used to conduct the analysis concerning the
effect of indoor air temperature on the performance of the samples used for this study.
Step 1: Creation of a data set and manual exclusion of 18 samples
With reference to the scores from the 20 marks academic performance tests taken by the
samples at the field experiments conducted in the 11 schools used for this study, a data set was
created in SPSS 24. The data set created consists of the following key data itemised below.
a) The scores of all the 407 samples in the mathematics test taken at air temperatures of 25.6 0C (low temp) and 34.5 0C (high temp).

80
b) The scores of all the 407 samples in the English language tests taken at air temperatures of
25.6 0C (low temp) and 34.5 0C (high temp).
c) The personal characteristics of the samples (Age, gender, clo, identity of the schools )
After the creation of the data set using the key data listed a-c in step 1 above, the data of the
same 18 samples previously mentioned in subsection 3.5.15 were manually excluded.
Step 2: Normality tests
Following the creation of the data set created in the past section, a normality test was performed
on the data set using the Skew and Kurtosis test. The result of the normality tests revealed that
the academic performance tests scores (mathematics and English) in the data set were normally
distributed. This is because the values of skew and kurtosis of the tests scores in mathematics
and English were in the range of -1 and + 1,(De Vaus, 2002; Field et al., 2012). Find in Table
3.11 below the values of the skew and kurtosis from the normality test carried out on the
academic performance scores. Also, the analysis here relied on the central limit theorem to
assume that the academic performance scores under discussion here were normally distributed.
This is because the central limit theorem states that as samples size increases (often above 30),
the nature of distribution of the data is always approximately normal (Nurusis 1987; Norusis;
2008). Field, (2009) shares the same view as he reported that ‘clever’ statisticians have
demonstrated that as samples get larger (usually greater than 30) the distributions are
approximately normal.
Mean temperatures at which test were taken 0C
Skew Kurtosis
Mathematics 25.6 0.80 -0.47 Mathematics 34.5 0.47 0.15 English 25.6 0.34 -0.75 English 34.5 0.24 0.20
Table 3.11.Result of normality test for Mathematics and English scores of the samples utilised
for the field experiments in this study.
Step 3: Dependent and independent t-test
With respect to the result of the normality test mentioned in step 2 above, a dependent t- test was used to perform the followings:
1. Comparison of the mean score of all the samples in Mathematics taken at indoor air
temperature of 25.6 0C (low temp) with their mean score in the Mathematics that taken at
34.5 0C (high temp).

81
2. Comparison of the mean score of the samples in the English test taken at indoor air
temperature of 25.6 0C (low temp) with their mean score in the English test taken at 34.5 0C (high temp).
Step 4: Results, from the result of the dependent t-test performed in step 3 above, the study
reported the effect of indoor air temperature on the academic performance of the samples used
for this study in chapter 5, section 5.5 and5.6. Similarly an independent t-test was performed in
step 3 and it was possible in chapter 5 to report gender differences in the performance of the
samples as a result of the effect of indoor air temperature of 25.6 0C (low temp) and 34.5 0C
(high temp). In view of the method used for the data analysis provided in this section, find a
summary of the steps used to conduct the analysis in Figure 3.12. Figure 3.12 brings to and end
the description of the method used to collect and analyse data for the field experimental research
method. The next section (3.6) describes the method of data collection and analysis for the field
survey research method.
Figure 3.12. Steps used to analyse data in respect of the effect of indoor air temperature on the
academic performance of a sample of pupil utilised for this study.
3.6 Description of the process utilised for data collection and analysis for field survey research method
The immediate past section (3.5) presented the description of the method of collecting and
analysing data in respect of the field experimental research method. This section (3.6) presents
a description of the method used for collecting and analysing data in respect of the field survey
research method. The survey research method was mainly used as a step of investigating and
reporting the effect of indoor air temperature on the thermal comfort and productivity teachers.

82
3.6.1 The schools, sampling strategy and size
Samples (teachers) were drawn from the 11 schools previously used for the field experiments
of this study described in the past section (3.5).As regards the sampling strategy, it was a
challenge to obtain the list that contains the personal information of teachers that could be used
as a sampling frame to select teachers based on random sampling strategy in the 11 schools.
Therefore, the study relied on the convenient sampling strategy. This suggests that the teachers
were voluntarily requested participate in the field survey in this study. The voluntary
participation of teachers from each of the 11 schools resulted to a sample size of 368 teachers
used for the field surveys in this study). However, the sample size (368) may be relatively small
compared to the population of teachers employed in public schools of Minna: nevertheless the
sample size of 368 used in this study is slightly bigger than the sample size (350) often required
to conduct surveys in educational studies as documented by Creswell (2012). Furthermore, the
samples of teachers used for the field surveys are natives of Nigeria, the samples consist of 211
males and 157 females in the age range of 27-51 years.
3.6.2 Instrument used for data collection at the field surveys
Generally in field surveys, the instruments often used to collect data are interviews and
questionnaires. Questionnaires are forms administered to participants in order to collect data,
while interview is an instrument for data collection via recording the responses of participants.
Questionnaires generally have the advantage of collecting data from a large number of samples
within a relatively short amount of time than the quantitative interviews. A disadvantage that
may be associated with the use of questionnaire is that, if it is not properly constructed following
some guides, the respondents can potentially misinterpret some items in the questionnaire.
However, in order to collect relatively large amount of data within a short period from the
teachers (respondents), the structured questionnaire was used as the instrument for data
collection for the field surveys in this study.
3.6.3 Guide used to construct the questionnaire
Constructing questionnaires from the scratch can sometimes be problematic. Two ideas could
help researchers overcome the construction of questionnaires in a study. The first, is to search
previous related studies to identify if there are existing questionnaires that could be modified
or adopted to collect the data required. The second, directly use the questionnaires of previous
authors as a guide to create a new one(Creswell, 2012). In this study, the questionnaires of some
authors were used as a guide to construct the questionnaire used for the field surveys. The
authors which their questionnaires were used as guide to construct the questionnaire used at the

83
field surveys with teachers in study are: Kwok (1997), ASHRAE (2004), Leaman and Bordass
(1999), Nicol et al. (2012) . This study ensured that the questionnaires constructed for the field
surveys employed clear means of communication in English with relatively short and direct
questions.
3.6.4 The research assistants, their role and training for the field surveys with teachers
Request was made to a personal contact at the zonal office of the National Youth Service
Scheme (NYSC) in Minna for research assistants that will assist in distributing questionnaires
at the field surveys in this study. NYSC is a one year mandatory job experience programme for
graduates from higher institutions in Nigeria. Thus, following the request earlier mentioned
here, two first degree holders in the field of building and land survey respectively and a master
degree holder in architecture under the NYSC scheme voluntarily accepted to assist in
becoming research assistants for this study. Further to the acceptance of the three graduates
earlier mentioned in this section as research assistants, series of training spanning over 10 days
were conducted for them. The training for the research assistants included the following:
(a) Talking the research assistants through what the field survey is all about as well as what
every item in the questionnaire to be distributed to the respondents at the field surveys
aims to achieve.
(b) Understanding the protocol of carrying out the field surveys in this study as described in
subsection 3.6.8.
(c) Understanding the need to be polite to the respondents during the Feld surveys.
(d) Understanding how to estimate the clo values of the clothes worn by the respondents
Additionally, during the training received by the research assistants they were prompted not to
have any interaction with the pupils in the schools. Also, during the training of the research
assistants they were advised not to engage the respondent in any questions outside the context
of the field survey questionnaire. Lastly, the researcher and the research assistants took part in
the pilot survey discussed in the next subsection as a step in familiarising them with how to
administer the questionnaires at the field surveys.
3.6.5 Pilot survey
Prior to the field surveys in March –April 2017, the questionnaire to be used for the field survey
were voluntarily administered in November 2016, to a sample of 30 teachers from 3 public
schools located in different parts of Minna. The researcher requested the sample of teachers to
comment on areas that they do not understand in the questionnaires administered to them. Less

84
than 10% of the samples advised that the word perception in the questionnaire should be
changed to views or feelings. Happily, analysis of the questionnaires returned by the 30 samples
used for the pilot survey suggest that about 75% of them do understand the items in the pilot
questionnaire. However, it was ensured that the items on the questionnaires were usually
explained to respondents (teachers) before they were requested to complete it during the field
surveys carried out in the 11 schools.
3.6.6 Description of the items on the questionnaire used for the field surveys
The questionnaire consist of two sections, the first section concerns the personal data of the
respondents (teachers). The second section consists of four (4) questions. In view of this, find
itemised below the descriptions of the 4 items in the questionnaire used to collect data from the
respondents (samples) at the field surveys.
1. The first item requested the respondents (teachers)to vote about how hot or cold they feel
with respect to the air temperature in the classrooms on a 7 point thermal sensation scale
adopted from AHSRAE (2004).
2. The second item requested the respondents to rate their productivity with respect to air
temperatures in the classroom on a 5 point Likert scale.
3. The third item required the respondents to provide their view about signs commonly
exhibited by pupils in classrooms when the air temperatures turns hot
4. The fourth item requested the respondents to rate the performance of the classrooms in
their schools with respect to air temperatures, daylighting, noise and airflow.
Furthermore, refer to Appendix K for details of the questionnaire described in this subsection.
3.6.7 The design of the field survey
Teachers move from class to class during a school day, thus there is no assurance that a teacher
(sample) can be surveyed by repeated measures. This means it may be a challenge to survey a
teacher in the same space (classroom) at two different periods of a school day having two
different air temperature conditions. In view this, the study randomly distributed the 11 schools
adopted for the field surveys in to two groups, A and B. The random distribution resulted to
having 6 schools in group A and 5 schools in group B as shown in Table 3.12. At each field
survey conducted within a school day, the survey was administered to respondents (teachers)
from schools in group A in the morning at mean indoor air temperatures of 27.7 0C(low temp)
and to respondents from schools in group B in the afternoon at mean indoor air temperature of
360C(high temp).

85
Schools in group A after the random distribution
Schools in group B after the random distribution
School 11 School 7 School 3 School 1 School 9 School 8 School 10 School 4 School 6 School 5 School 2
Table 3.12. The randoml distribution of the 11 schools into group A and B . Source. Author
3.6.8 Procedure for administering the field survey in each school
Prompt to conduct field survey at each school.
Following the permission granted by the principals of the 11 schools discussed subsection 3.5.1,
the researcher and the research assistants visited the principal each school to be surveyed a day
before the field survey takes place. The purpose of each visit was to prompt the principal to
inform the teachers and pupils that a survey is likely to take place while lessons are going on in
the next school day in their school. Also, in each visit, the researcher appealed to the principal
to nominate a staff of the school that will act as a gate keeper.
Protocol for each field Survey conducted in the morning at low air temperatures with respondents (teachers) from schools in group A
Following the resumption of daily school activities, the researcher and three assistants
voluntarily request the teachers (respondents) from schools in group A to fill questionnaire
designed for the field surveys in this study. Specifically, the respondents were voluntarily
requested to fill the questionnaires while they are teaching in the classrooms between 8.am and
9.30 pm.The items on the field survey questionnaires has been described in section 3.6.6 and in
Appendix K. Also, within 8.am and 9.30 when the respondents are filling the questionnaires
administered to them, the air temperatures in three randomly selected classrooms were
measured every 30 minutes using Exitech 445815 thermo/hygrometer from a height 1.2m above
the floor level of the classroom. The average was used as the representative of the air
temperature when the thermal comfort and the productivity of the teachers (respondents) from
schools in group A were evaluated in the morning at average indoor air temperatures of 27.7 0C.

86
Protocol for each field Survey conducted in the afternoon at high air temperatures with
samples from schools in group B
Approximately between 12 pm and 1.30pm, the researcher and three assistants voluntarily
request the teachers (respondents) from schools in group B to fill in the field survey
questionnaire designed for this study while they are teaching in the classrooms. Also, between
12.pm and 1.30pm when the respondents are filling the questionnaires administered to them,
the air temperatures in three randomly selected classrooms were measured every 30 minutes
using Exitech 445815 thermo/hygrometer from a height 1.2m above the floor level. The average
was used as the representative of the air temperature when the thermal comfort and the
productivity of the teachers (respondents) from schools in group B were evaluated in the
afternoon at average indoor air temperatures of 360C.
3.6.9 Control measures
In this study, there was control for some factors that may affect the results of the field surveys.
The first control measures was that the questionnaires were administered strategically to
samples with similar clothing insulation values and metabolic rates. Based on ASHRAE-55
2004, the clo value of the samples surveyed was observed and estimated to be approximately
0.56 men and 0.56. Women. The analysis of the clo values of the respondents is shown in Table
3.13. Also the met value of the respondents was estimated to be 1.6 (light activity standing) in
accordance with ASHRAE-55 2004.The second control measure was that, the study ensured
that the respondents are not on medications .This was done by asking the samples directly
before administering the survey to them. It was assumed in the field survey of this study that
the respondents were not sick. This is because a teacher who is sick is likely not to attend school.
Men’s clothing Clo values Women’s clothing
Clo values
Men’s brief 0.04 Bra 0.01 Long sleeve /short sleeve shirt
0.20 Panties 0.03
Trousers 0.15 Under wear 0.02 Shoes 0.15 Long skirt 0.15 Socks 0.02 Sandals/slippers 0.02 --------------------------- ---------- Long-sleeved
shirt dress 0.33
Total 0.56 -------------------- 0.56 Table 3.13.The estimated clo values of the clothing worn by the respondents of the field
surveys as adopted from ASHRAE (2004).

87
3.6.10 Method for analysing data from the field surveys in respect of the effect air of indoor temperature on the thermal comfort of the respondents (teachers).
Step 1: Creation of Data set and exclusion of some respondents
A data set was created in SPSS 24 with the data listed 1-3 below.
1. The thermal comfort votes used to measure the thermal comfort of teachers (respondents)
from schools in group A in the mornings at average air temperatures of 27.7 0C
2. The thermal comfort votes used to measure the thermal comfort of teachers (respondents)
from schools in group B in the afternoons at mean air temperatures of 36.5 0C.
3. Personal data of the respondents (e.g. Age and sex, clo value of uniform).
The data listed 1-3 above were collected from the field surveys with teachers via the
questionnaire described in subsection 3.6.6 and Appendix K. However, 41 respondents
(teachers) were excluded from the data set mentioned in step 1 above for reasons provided in
chapter 6, section 6.5.
Step 2: Normality test.
Following the creation of the data set mentioned step 1 above, normality tests (Skew and
Kurtosis tests) were conducted on the thermal comfort votes in the data set. The result showed
that the key data listed 1and 2 in data set created in step 1 above are normally distributed as the
skew and Kurtosis values are less than 1, Table 3.14. The rationale for the use of the skew and
Kurtosis in this study has been earlier discussed in subsection 3.5.14 of this present chapter.
Data used for the Skew and Kurtosis tests Skew Kurtosis Thermal sensation votes used to assess the thermal comfort of the respondents from schools in group A at mean air temp of 27.70C
0.226 -0.672
Thermal sensation votes used to assess the thermal comfort of the respondents from schools in group B at mean air temp of 36.00C
- 0.384 -0.692
Table 3.14. Result of Skew and kurtosis tests on thermal comfort votes of the respondents of
the ield surveys.
Step 3: Descriptive analysis of the Predicted Percent Dissatisfied (PPD) and Predicted Mean Vote (PMV) of the respondents (sample of teachers).
Following the normality test mentioned above, descriptive analysis (statistics) of the PPD and
PMV of the samples were carried out in order to report the effect of indoor air temperature of
27.7(low temp) and 360C (high temp) on the thermal comfort of the respondents.

88
Step 4: Independent t-test.
After the descriptive analysis mentioned above, an independent t-test was used to compare the
mean between the two data listed 1 and 2 in step 1 above. The comparison was done in order
to report the effect of indoor air temperature of 27.7(low temp) and 360C (high temp) on the
thermal comfort of the respondents used for the field surveys. Additionally, an independent t-
test was performed to determine gender difference in the thermal comfort of the respondents
(sample of teachers).
Step 5: Reporting the results from the PPD and PMV analysis in step 3 above as well as the
results of the independent t-test performed in step 4 above. Find a summary of the steps used
to analyse the data described in this subsection in Figure 3.13.The results from the analysis
described in this section are reported in chapter 6,section 6.7
Figure 3.13. Steps used to analyse data in respect of the effect of indoor air temperature on the
thermal comfort of a sample of teachers utilised for this study.
3.6.11 Method for analysing data from the field surveys in respect of the effect air indoor temperature on the productivity of teachers (respondents).
Step 1: Creation of a data set and exclusion of some samples
A data set was created in SPSS 24 with the data listed a, b and c below. The data were collected
at the field surveys with teachers using the questionnaire described in subsection 3.6.6 and
Appendix K. However, the same 41 respondents mentioned in the past subsection were
excluded from the data set for reasons provided in section 6.5
a. The perceived productivity vote used to measure the productivity of the respondents from
schools in group A at mean air temperatures of 27.7 0C (low temp)

89
b. The perceived productivity vote used to measure the productivity of the respondents
from schools in group B at mean air temperatures of 36.0 0C (high temp)
c. The personal data samples (e.g. Age and sex)
Step 2: Normality tests
After the creation of the data set mentioned in step 1, normality tests were performed on the
perceived productivity votes listed a and b in the data set mentioned in step 1. The result of the
normality tests (skew and kurtosis test) showed that the; skew value is 0.236 and the kurtosis is
-0.882.This result suggest that the perceived productivity votes in the data set created in step 1
are normally distributed. This is because the skew (0.236) and kurtosis (-0.882) values reported
here is not greater than 1(De Vaus, 2002; Field et al., 2012) .
Step 3: Independent t-test
Following the normality test carried out on the data set mentioned above, an independent t-test
was conducted. The test was used to compare: the mean of the perceived productivity vote used
to measure the productivity of the respondents from schools in group A at 27.7 0C (low temp)
with the mean of the perceived productivity vote used to measure the productivity of the
respondents from schools in group B at 36.0 0C (high temp).The independent t-test was
performed in order to report the effect of indoor air temperature on the productivity of teachers
(respondents).
Step 4: Reporting the results from the independent t-test performed in step 3. Figure 3.14
presents a summary of the steps described in this subsection. The results for the analysis
described in this section are presented in chapter 6, section 6.8.
Figure 3.14.Summary of method used analyse data in respect of the effect of indoor air
temperature on the productivity of a sample of teachers utilised for this study.

90
3.6.12 Method for analysing other data collected from the field surveys with teachers
With respect to some other data collected from respondents used for the field surveys in this
study, descriptive statistics in SPSS 24 was utilised for analysing the data listed a and b below.
(a) The views of teachers concerning of symptoms commonly exhibited by pupils in classrooms
when the air temperature turns hot, this data was used to identify how high air temperature
affects performance of pupils in the schools used for this study.
(b) The views of teachers about the performance of the classrooms used for this study in terms
of noise, daylighting, air temperature and airflow.
The results of the descriptive analysis mentioned in this subsection are reported in chapter
6.section 6.9 and 6.10 respectively.
3.7 The physical survey research method: description of steps used for data collection and analysis
The past section (3.6) describes the steps used for collecting and analysing data in respect of
the field surveys with teachers conducted in this study. This section (3.7) provides a description
of the steps used to collect and analyse data in respect of the physical survey research method.
3.7.1 Data collection from the physical surveys of classroom
The physical design features of the classrooms of the 11 schools used for the field experiments
and field surveys in this study were physically surveyed. The physical surveys were mainly
carried out via linear measurements, visual observations and photographs. The design features
of the classrooms physically surveyed in this study are: the plan, orientations, windows,
plantings(vegetation cover), roof vents, shading devices, floors, thermal properties of the walls,
floors and roofs, the floor to ceiling height, depth to height ratio. These design features were
physically surveyed because literature review in chapter 2 (section 2.2) of this study suggest
that they have the potential of influencing the indoor air temperature of naturally ventilated
buildings in the tropics.
3.7.2 Method used to analyse data from the physical survey of classrooms via descriptive analysis.
Using descriptive analysis, the study reports in chapter 4 the physical characteristics of the
classrooms and the surroundings of the schools used for the physical surveys in this study. The
descriptive analysis, of the physical characteristic of the classrooms and the surroundings
reported in chapter 4 includes the followings: plan, orientations, windows, plantings (vegetation

91
cover), roof vents, shading devices, the floor to ceiling height, depth to height ratio, thermal
properties of the walls and floors.
3.7.3 Method used to analyse data from the physical survey of classrooms using the Building Performance Simulation
Utilising some of the data collected from the physical surveys of the classrooms presented in
subsection 3.7.1, several building performance simulation were performed using the IESVE
(Integrated Environmental Solutions) software. The IESVE software was used in this study to
perform the building performance simulations because the training and skills required to use
the software is readily accessible in the school where this study was undertaken. However, other
building performance simulation software exists as cited in Hamza (2004), these software
includes the following: ESP –r, HTB2, Apache, DEROB and Energy Plus. In view of the
building performance simulation discussed in this subsection, find below the steps used for
conducting the building performance simulation in this study using the data from the physical
survey of classrooms.
Step 1: Weather file and the generation of a classroom model
An Energy Plus Weather data (EPW File) of Abuja was imported in to IESVE and utilised for
running the simulations in study. This is because as at the time of this study IESVE does not
have weather files for running simulations in towns located in Nigeria .Thus, the EPW weather
data (file)for Abuja was used because it is the only building performance simulation weather
data available for locations in Nigeria as at the time of this study. However, Abuja is the federal
capital of Nigeria and it is one of the closest city to Minna. The EPW file for Abuja was
requested and obtained for free as a researcher via an email to Meteonorm. Metoenorm is based
in Switzerland and is a widely known global climatic data source for running computer
simulations.
Following the import of the weather files mentioned above, the plans (floor and roof) of an
existing classroom in the sample of schools used for this study was reproduced in IESVE. The
floor plans were produced using the dimensions obtained from the physical survey of the
classrooms mentioned in the past subsection. After reproducing the drawing of a typical
classroom in IESVE, the software automatically generates the 3D model representing an
existing block of classroom, this model is referred to as base case model in this study. See
Figure 3.15 and 3.16 for the axonometric view and 3D model of the classroom used for the
simulation in this study.

92
Figure 3.15.The axonometric view of a typical classroom used for the simulation in this study
generated from IESVE software.
Figure 3.16.The 3D model of a typical classroom used in this study generated by IESVE
sotware .
Step 2: Construction materials
After the creation of the base case model mentioned in step 1, the study created a data base in
IESVE which consists of the specifications as regards the materials/ components that makes up
the envelope of a typical classroom used for this study. The specifications as regards the

93
materials/ components used to create the data base for materials were obtained from the physical
survey of classrooms carried out in this study. Thus, closely following the creation of a material
data base, the study used the assign construction command in IESVE to assign the materials/
components in the data base to the base case model of the classroom created in step 1. See Table
3.15 for details of the items used for creating the material/component data used for the building
performance simulation under discussion in this section.
Material Description Representation. Roof covering 0.55mm long span corrugated
aluminium roofing sheets
Celling 5mm thick hard board ceiling
Walls 225 x225 x450 mm hollow
sandcrete blocks finished with 25mm cement/ sand plaster internally and externally
Floor 150 mm thick concrete floor
finished with 25mm terrazzo
Windows 1.2wide x1.2 high metal casement windows (5 mm thick metal sashes)
Doors doors 1.2 m wide x 2.1high
double hinged metal doors (5mm thick metal door leaves)
Table 3.15. Descrption of the basic construction matreials utilised for creating the base case
model for the building performance simulation in this study.

94
Step 3: Creation of simulation profiles
The study created two profiles in IESVE. These are the occupancy profiles and the window
opening profiles. Occupancy and window opening profiles provides the IESVE software the
data concerning the periods when the pupils are in the classrooms as wells as the periods when
the windows and doors of the classrooms are open during the day, week and year. In view of
this, find in the Table 3.16 below occupancy profiles of the pupils as well as the window/doors
opening profiles used for the study.
S/no Description Period Remarks 1 Daily occupancy profile 7.30am –
13.30pm
2 Weekly occupancy profile Monday - Friday 3 Annual occupancy profile Term periods September-December(first term), January –
early April(second term),May- July(third term) s/no Description Period Remarks 1 Daily window and door
opening profile 7.30am – 13.30pm
2 Weekly window and door opening profile
Monday - Friday
3 Annual window and door opening profile
Term periods First term: September- December. Second term: January- early April .Third term: May-July
Table 3.16.The descrption of the profiles used for the building performance simulation in
this study .
Step 5: Other relevant input data used for running the simulation of the base case model.
In order to run the simulations in this study, the sources of cooling and heating were turned off.
This is because the classrooms used for public schools in Nigeria usually depend strictly on
ventilation. Also, the source of internal heat gains was assumed to be from the pupils themselves
as there were no equipment or lighting fittings in classrooms that could generate heat as reported
from the result of the physical survey of classrooms in chapter 4(section 4.3).The air exchange
rate specified for the simulations was set to 5 air exchange/hour (5ac/h) .Also, the windows of
the classroom model used for the simulation were set in IESVE to open on the window opening
profile at a maximum swing angle of 900. This is the maximum angle of swing that the IES
software considers to be openable for windows and doors. However in reality, the windows and
doors of the classrooms used for this study can swing open to an angle of about 1800C.Lastly,
the simulation weather used as input data for running the simulation has been earlier mentioned
in step 1 of this subsection.

95
After the processes discussed in steps 1-5 were completed, the study conducted series of
dynamic thermal simulations using the Apache interphase in IESVE software. The key output
from the dynamic thermal simulations mentioned here identifies the following key outputs:
(a) The ranges of indoor air temperatures, C02, and humidity levels in the classrooms of public
schools in Minna across an academic year.
(b) The component of the building fabric that is likely to contribute most to heat gain and high
air temperatures.
3.8 Chapter summary.
The methods commonly used to conduct research has been discussed in this chapter as well as
the rationale for the use of quantitative research methods in this study. Consequently, the three
research methods utilised as a step towards responding to the aim and objectives posed by this
study were discussed in this chapter. The research methods utilised in this study are: The field
experimental research method, the field survey research method and the physical survey
research method. Also, a review of the methods commonly used to investigate causal
relationship has been reviewed in this chapter. Finally, under three different sections 3.5, 3.6
and 3.7 respectively, this chapter discussed in detail the steps used to collect and analyse data
for each of the research methods utilised in this study.

96
Chapter 4. Findings from the physical survey of classrooms
4.1 Introduction
This chapter presents the findings from the physical survey of the design features of classrooms
in the 11 schools used for this study. The physical surveys were mainly carried out by the use
of visual observations and physical measurements (e.g. quantity, length, breadth, height and
textures). The design features of classrooms that were physically surveyed and reported in this
chapter are as follows : The plan of the classrooms; ventilation systems; equipment and fittings;
orientation, the windows; shading devices; the roof plane; the floor to ceiling height;
Depth/height ratio; the walls; the floors. These design features were selected for the physical
survey, because the literature review in section 2.2 of this study suggests that they are common
design features that have the tendencies of influencing the air temperatures and the thermal
comfort of occupants in naturally ventilated school buildings (e.g. classrooms) in the tropics.
In view of the background above, the findings in this chapter are presented in two parts, the
first part (4.2 to 4.13) presents a descriptive analysis of findings from the physical surveys. The
second part (4.14) discusses the inferences from the findings from the physical surveys with
respect to how the design features of the classrooms could contribute to the indoor air
temperatures.
4.2 The plan and size of the classrooms.
The physical survey carried out on the 11 sample of schools shows that the plan of the
classrooms are rectangular in terms of form. Field measurement during the physical survey
shows that the area of each classroom in the 11 schools is on the average 56m2 (i.e.7meters
wide and 8 meters long). The classrooms also have a verandah of 2.0m wide. See Figures 4.1,
4.2, 4.3 for the floor plans of the typical classrooms surveyed in this study. Furthermore, Figure
4.4, also shows the pictorial view of classrooms.
Figure 4.1.Typical plan of a block of classroom in public schools. Source. Fieldwork (2017)

97
Figure 4.2.Typical plan of a three block of classrooms. Source. Author’ fieldwork (2017)
Figure 4.3.Typical plan of a block of four classrooms in public schools in Nigeria. Source. Author’s fieldwork (2017)
Figure 4.4. Pictorial view of the classrooms of punlic schools in Minna. Source. Fieldwork by author (2017)

98
4.3 The ventilation system, equipment and fittings in the classrooms
It was observed from the physical surveys of the classrooms in the 11 sample of schools that
the main source of ventilating classrooms for the sake of providing thermal comfort for the
pupils is by the use of the natural ventilation. Also, findings from the physical surveys of the
11 schools indicated that, computers, projectors, artificial lightings and heaters are not fittings
and equipment that can be found in the classrooms.
4.4 Orientation of the classrooms
Figures 4.5 to 4.10 presents the architectural sketch of the layout of the classrooms blocks in
six (6) schools out of the 11 schools used for the physical surveys in this study. The orientations
were determined using a magnetic compass. From Figures 4.5 to 4.10 it could be deduced that
most of classroom blocks in the six schools are orientated with their shortest sides on the east-
west axis. In short, about 40 out of the 58 classrooms blocks in Figures 4.5-4.10 were are
orientated with their shortest sides on the east-west axis. This suggest that there was an attempt
to protect the longest sides of most of the classroom blocks from the impact of direct solar
radiation during the design and construction of the classroom blocks in the six schools under
consideration in Figures 4.5 to 4.10.
Figure 4.5. Architectural sketch showing the layout of school 1 used for the study. Source.
Fieldwork by author (2017)

99
Figure 4.6. Architectural sketch showing the layout of school 3 used for the study. Source.
Fieldwork by author (2017)
Figure 4.7.Architectural sketch showing the layout of school 5 used for the study. Source.
Fieldwork by author (2017)

100
Figure 4.8.Architectural sketch showing the layout of school 6 used for the study. Source.
Fieldwork by author (2017)
Figure 4.9. Architectural sketch showing the layout of school 8 used for the study. Source.
Fieldwork by author (2017)

101
Figure 4.10. Architectural sketch showing the layout of school 11 used for the study. Source. Fieldwork by author (2017).
4.5 Plantings (vegetation)
Figure 4.11 suggests that the use of the plants in the surroundings of the 11 schools surveyed is
scant. Specifically, Figure 4.11 suggest that the landscape of the sample of schools surveyed in
this study is mostly characterised by sandy soil.
Figure 4.11.Showing the nature of the landscape in some of the schools surveyed.Source. Fieldwork by author (2017)

102
4.6 The windows
4.6.1 The window strategy in classrooms
It was observed from the physical surveys in this study that the windows in each classroom
were positioned on two opposite walls as shown by the section provided in Figure 4.12. This is
probably an attempt to promote the rate of air flow via cross ventilation. Authors, have
suggested that in order to promote ventilation in naturally ventilated buildings it is desirable to
provide windows on at least two opposite or adjacent walls of the rooms or indoor spaces
(Awbi, 1994; Rabah and Mito, 2000; Hatamipour and Abedi, 2008) .
Figure 4.12.The positioning of windows on two opposite walls in the classrooms surveyed. Source.Fieldwork by author (2017)
4.6.2 The opening area of windows
The percentage of window area to floor area in the classroom of each of the school surveyed is
about 13%. This is because each classroom has a floor area of about 56m2 with 5 windows.
Each window has an area of 1.44m2 (a window measures 1.2 m x 1.2 m). The total area of
windows in each classroom is (5x1.44 m2= 7.2 m2). Therefore the percentage of window to floor
area ratio was evaluated as follows. 7.2 m2 (total area of windows) x 100% ÷ 56 m2 total (floor
area of classroom) = 12.85 %, approximately 13%.
Also, it was evaluated from findings of the physical survey that the percentage of window/ wall
area ratio at the front side is approximately 12% and that for the back side is 18%. This suggest
that on the average, the percentage of window/ wall area ratio in each classroom of the11 sample
of schools surveyed in this study is approximately 30% of the exterior envelope.
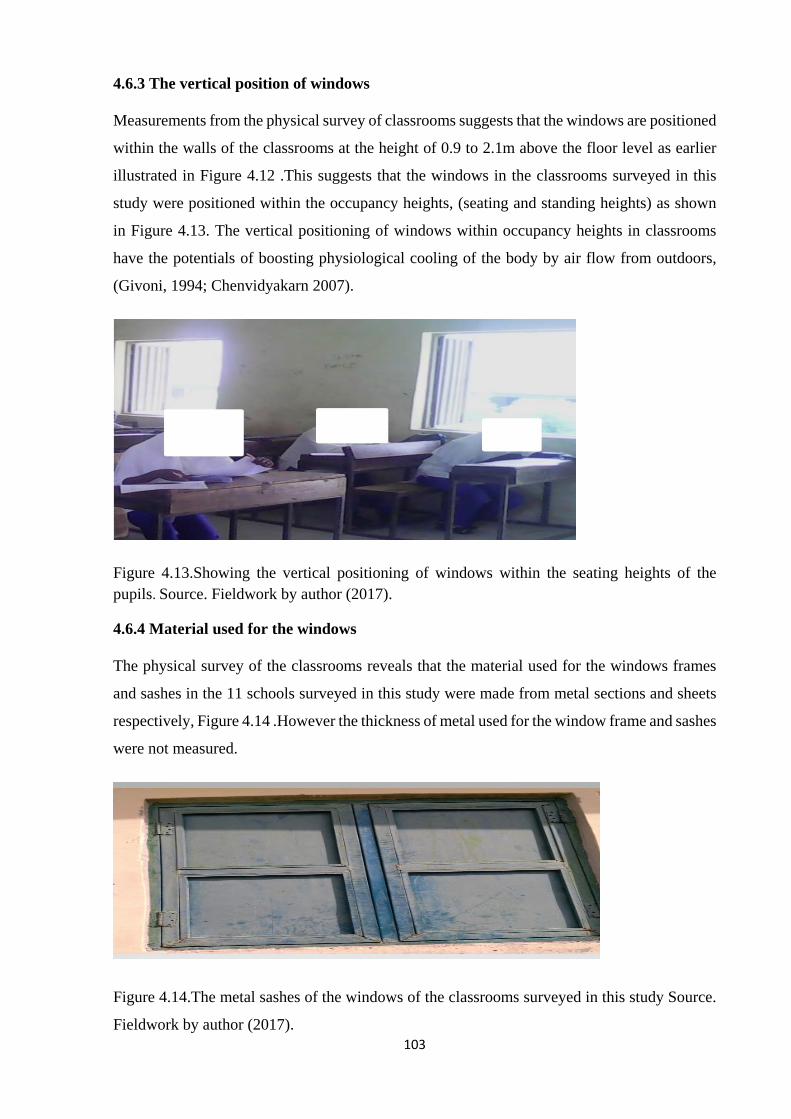
103
4.6.3 The vertical position of windows
Measurements from the physical survey of classrooms suggests that the windows are positioned
within the walls of the classrooms at the height of 0.9 to 2.1m above the floor level as earlier
illustrated in Figure 4.12 .This suggests that the windows in the classrooms surveyed in this
study were positioned within the occupancy heights, (seating and standing heights) as shown
in Figure 4.13. The vertical positioning of windows within occupancy heights in classrooms
have the potentials of boosting physiological cooling of the body by air flow from outdoors,
(Givoni, 1994; Chenvidyakarn 2007).
Figure 4.13.Showing the vertical positioning of windows within the seating heights of the pupils. Source. Fieldwork by author (2017).
4.6.4 Material used for the windows
The physical survey of the classrooms reveals that the material used for the windows frames
and sashes in the 11 schools surveyed in this study were made from metal sections and sheets
respectively, Figure 4.14 .However the thickness of metal used for the window frame and sashes
were not measured.
Figure 4.14.The metal sashes of the windows of the classrooms surveyed in this study Source.
Fieldwork by author (2017).

104
4.7 Shading devices
Shading devices generally assist in protecting and minimising the amount of solar radiation that
is incident on a building via openings (doors and windows). However, findings from the
physical survey of the sample of schools used for this study show that there are no shading
devices on the entire stretch of windows at the back side of the classrooms, Figure 4.15. Also,
it was observed from the physical surveys that no form of blinds are attached to the windows
of the classrooms that may assist pupils in regulating the amount of sun light received in the
classrooms during occupancy hours.
Figure 4.15. Back side of the classrooms surveyed. Source. Fieldwork by author (2017)
4.8 Veranda
It was observed from the physical surveys that each classroom has a veranda running through
the entire front side. Generally, verandahs have the potential to limit the penetration of solar
radiation into buildings via openings (Kukreja, 1978; Givoni, 1994). During the physical
surveys (March-April 2017) ,it was visually observed that during school hours (7.30am-1.30
pm); the verandahs of the classrooms surveyed appears to be protecting the interior of the
classroom from impact of solar radiation in situations where the classrooms are facing the east
directly, Figure 4.16.The finding here, suggest that the veranda used as design features of the
schools surveyed in this study have some potentials to limit the penetration of solar radiation
into the classrooms. However, after school hours towards sun set period, it was observed that

105
the verandahs may not be able to protect the classrooms surveyed from the impact of direct
solar radiation in cases where the classrooms are facing the west, Figure 4.17
Figure 4.16.IIustration suggesting that veradahs could reduce direct solar penetration in to
classrooms during school periods in situations when classrooms are facing the east directly
.Source. Fieldwork by author (2017).
Figure 4.17. IIustration suggesting that veradahs may not be able to protect classrooms from
penetration of solar radiation after schools periods in situations when classrooms are facing the
west directly .Source. Fieldwork by author (2017).

106
4.9 The floor to ceiling height of the classrooms
From the physical surveys carried out, it was observed that the average measured floor to ceiling
height of the classrooms in the sample of 11 schools used for the surveys is approximately 2.9m
(2900mm), Figure 4.18.
Figure 4.18. Cross section showing the floor to ceiling height of a typical classroom surveyed in this study. Source. Fieldwork by author (2017).
4.10 The depth / height ratio
In order for a space to be effectively ventilated for the sake of providing thermal comfort for
the occupants, it has been suggested as a rule of thumb that the depth of that space should be
less than 5 times the floor to ceiling height, as given by formular d<5xh (DfES, 2006b) . In
view of this, the height and depth ratio of the classrooms in the schools surveyed in this study
is on the average 7< 14.5 as computed from the dimensions in Figure 4.19. This suggests that
the depth/height ratio of the classrooms surveyed in this study is within the range of the formular
d<5xh earlier mentioned in this section. The depth (d) in this case represents the width between
the two walls of each classroom with windows and the height (h) represents the floor to ceiling
height of the classrooms, Figure 4.19.
Figure 4.19.Cross section of a typical classroom surveyed showing the depth as well as the height . Source. Fieldwork by author (2017).

107
4.11 The roof plane
4.11.1 The roofing material and the colour
It was observed from the physical surveys in the 11 sample of schools that the material used for
the roof covering is corrugated aluminium sheets. However, what is known about the thickness
of the aluminium roofing sheets was obtained from the building project unit of State Universal
Basic Education Board (SUBEB) in Minna. The thickness of the aluminium roofing mentioned
here was identified to be about 0.55mm from the project unit of SUBEB. Also, it was visually
observed that the colour of the aluminium roofing sheets used for the classrooms surveyed is
usually dark green or light blue. Additionally, it was observed that the roofing sheets were often
not installed with insulation panels that could help reduce the absorption of solar radiation via
the roof in to the classrooms.
4.11.2 Ventilation of the space beneath the roof and the ceiling The roof structure of classrooms in the 11 sample of schools surveyed is the hip type. This
suggests that the roof structure has a space (void) between the, roofing sheets and the ceiling.
However the key concern here is that, it was observed from the physical surveys that there are
no vents provided in the roof of the classrooms that may assist in ventilating the space between
the roofing sheets and the ceiling.
4.11.3 The ceiling. Ceiling could assist to limit the amount of solar heat that may be transferred via the roof in to
the interiors of buildings, as such ceiling have some influence on the indoor air temperatures as
well as the thermal comfort of the occupants (Taylor et al., 2000; Wang et al., 2012).Against
this background, it was observed from the physical survey of the classrooms in the 11 schools
that the ceilings are hard board sheets .
4.12 The walls and the colour
Hollow sandcrete blocks appears to be widely used as walling units in the construction of
buildings in Nigeria (Abdullahi, 2005). Two sizes of sandcrete blocks that are often used in
building constructions in Nigeria, are, 225mm wide, 225mm high and 450mm long and 150mm
wide, 225mm high and 450mm long. In view of this, it was observed from the physical surveys
that the walls of the classrooms in the 11 schools were constructed with the 225mm wide,
225mm high and 450mm long hollow sandcrete blocks. Nevertheless, the mix and the strength
of these blocks could not be evaluated at physical surveys, this is because determining mix and
strength of materials is beyond the scope of the methods used in this study. However, the main
concern here is that, the sandcrete blocks used for the construction of the walls of the classrooms

108
surveyed in this study can be classified as walling units with relatively high thermal mass
(Reardon et al., 2013). Additionally, the colour of the walls of the classrooms surveyed were
observed to be cream (off-white), Figure 4.20.
Figure 4.20.The external colour of walls of classrooms in public schools. Source. Fieldwork by author (2017). 4.13 The floors
Observations from the physical surveys showed that the floors of the classrooms in the sample
of schools used for this study were made from mass concrete and finished with terrazzo. The
thickness is usually 150mm thick mass concrete with a 25mm thick terrazzo floor finish. The
measures of the floor provided here is as specified in the bill of quantities often used to construct
the classrooms. The finding concerning the floor of the classrooms reported here suggest they
are made from materials with high thermal mass. Mass concrete is generally classified under
building materials with relatively high thermal mass (Reardon et al., 2013).
The past sections of this chapter presented the findings (results) from the physical surveys
carried out in this study while the next section (4.14) presents the key inferences from the
findings. The inferences from the findings presented in section 4.14 is with respect to how the
design features of the classrooms surveyed may contribute to the indoor air temperature.
4.14 Key inferences from the findings of the physical surveys.
Findings from the physical survey shows that the classrooms used for public schools in Minna
were designed and constructed based on a prototype. This means that the classrooms are
identical with respect to some physical design features such as: size, plan, window, floor, and
wall, roof, and landscape characteristics. Also, findings, from the physical survey shows that
the main source of ventilating the classrooms in public schools in Minna is by the use of natural
ventilation. The findings as regards the use of natural ventilations mentioned here suggest that

109
at peak periods there is no mechanical means of moderating the air temperatures in the
classrooms of public schools in Minna. By extension, this means when it is hot outside the
classrooms it could be also be hot inside the classrooms. To substantiate this, Givoni (1998)
asserts that buildings that are not mechanically cooled have the tendencies for the indoor air
temperatures to vary directly with that of the outdoor air temperatures.
Similarly, findings from the physical surveys shows that the use plantings (e.g. trees, vines,
shrubs and lawns) is scant and non-existence in most of the schools evaluated at the physical
surveys, Figure 4.11.The findings mentioned here as regards the nature of plantings in the
schools surveyed have the potential of boosting the penetration of direct and reflected solar
radiation in to the classrooms. In turn, this may contribute to high air temperatures in classrooms
with the risks of thermal discomforts for the teachers and pupils.
Furthermore, findings from the physical surveys revealed that metals sheets were used as the
sashes of the windows of the classrooms, Figure 4.14. The use of metal sheets as the sashes of
windows as reported here have the inclinations of accelerating the rate of solar heat gain into
the classrooms of public schools in Minna. In turn, this may contribute to the developments
high air temperatures in the classrooms particularly during hot periods.
Likewise, findings from the physical survey indicated that the percentage of window to floor
area ratio in the classrooms of public schools in Minna is approximately 13%. This value (13
%.) is relatively small in comparison to the 20-25% window to floor area ratio suggested by
some authors for promoting natural ventilation in the tropics, (Kukreja, 1978; Tantasavasdi et
al., 2001; Al-Tamimi et al., 2011).The findings reported here concerning the small window to
floor area ratio observed in classrooms have the potential of retarding the rate by which hot air
dissipates from inside the classrooms to the outside. In turn, this could contribute to the
occurrences of high air temperatures in the classrooms.
As well, findings from the physical surveys shows that the entire stretch of windows at the
back side (rear side) of the classrooms in the 11 schools surveyed have no shading devices,
Figure 4.15.The lack of shading devices at the rear side of the classrooms reported here from
the findings of the physical surveys have the inclinations of promoting the penetration of direct
and reflected solar radiations in to the classrooms: this may in turn promote high air
temperatures particularly in situations when the rear sides of a classroom faces the east directly.
Again, findings from the physical surveys indicates that aluminium is the material often used
as roofing sheets for the classrooms of public schools in Minna. It was also observed from the

110
findings of the physical surveys that the aluminium roofing sheets used for the roof coverings
of the classrooms are installed without insulating panels. Thus far, the findings reported here as
regards the roof of the classrooms surveyed in this study could promote solar heat gain and high
air temperatures in the classrooms of public schools in Minna. Adding to this, findings from the
physical survey suggest that the roof structure of the classrooms in the 11 sample of schools are
often not ventilated via the use of roof vents. This could contribute towards increase in the
surface temperatures of the ceiling and in turn elevated air temperatures in classrooms.
Lastly, findings from the physical surveys reveals that some of the classroom blocks are
orientated with their longest sides on the east-west axis. This form of orientation reported here
could increase solar heat gain and elevated air temperatures in the classrooms of the 11 sample
of schools particularly when there is no means of shading the openings located on the east-west
axis.
4.15 Chapter summary.
The findings from the physical surveys carried out on the 11sample of schools used for this
study has been reported in the various sections of this chapter. The findings from the physical
surveys shows that the classrooms of public schools in Minna are prototypical irrespective of
the locations of the schools. The classrooms also depends strictly on natural ventilation in
providing thermal comfort for the users. The use of trees as a design feature to could limit the
penetration of solar radiations in to the classrooms appears to be very scant as reported from
the findings of the physical surveys. Furthermore, findings from the physical surveys shows
that metals sheets were used as the sashes of the windows of the classrooms, the use of metals
for sashes of windows can contribute to heat gain indoors and thermal discomforts for the users.
The findings from the physical surveys suggest that the window to floor ratio of the classrooms
is relatively small in comparison the window to wall area ratio suggested by some authors in
previous research. There is evidence from the physical surveys that there is no shading device
at the rear side of the classrooms even in situations when the rear side of classrooms is
positioned along the east axis. As well, there is evidence that the roof covering of the classrooms
are metal sheets with no insulation panels, also the roofs do not also have vents for dissipation
of heat.
On the whole, the findings from the physical surveys of classrooms from the 11 sample of
schools presented in this chapter suggests that many physical design features of the classrooms
can contribute heat gain and high indoor air temperatures indoors.

111
Chapter 5. Results of data analysis from the field experiments in respect of
the effect of indoor air temperature on the thermal comfort, health and
performance of pupils
5.1 Introduction
This chapter presents the results from the analysis of data collected from the field experiments
in respect of the effect of indoor air temperature on the thermal comfort, health and academic
performances of a samples of pupils used for this study. The method used for the analysis has
been described in subsections 3.5.15, 3.5.16 and 3.5.17. In view of the results in this chapter,
section 5.1 introduces the contents in this chapter. Section 5.2 presents a descriptive analysis of
the data collected from the field experiments conducted at the 11sample of schools used for this
study. Section 5.3, presents the results concerning the effect of indoor air temperature on the
thermal comfort of the samples. Section 5.4 presents the results concerning the effect of indoor
air temperature health of the samples. Section 5.5 presents the results concerning the effect of
indoor air temperature on the academic performance of the samples. Lastly, section 5.6 provides
the summary of this chapter.
5.2 Descriptive analysis of the data from the field experiments
5.2.1 School and sample size
As previously discussed in section 3.5.6 and 3.5.7 respectively the number of schools used for
the field experiments in this study are 11, with a sample size of about 407 pupils. However, 18
pupils (samples) were excluded from further statistical analysis, this is for reasons discussed in
the next sub section (5.2.1). In view of the exclusions of samples mentioned here, find in Table
5.1 the distribution of the sample size from the 11 schools before and after the exclusions.
School code Sample size before exclusion Sample size after exclusion School 1 36 35 School 2 42 40 School 3 34 32 School 4 39 38 School 5 32 29 School 6 40 37 School 7 35 34 School 8 41 39 School 9 38 38 School 10 33 31 School 11 37 36 Total 407 389
Table 5.1.Distributions of samples from the 11 schools used for the field experiments

112
5.2.2 Descriptive analysis of samples excluded from the data sets used for the statistical analysis in this chapter
Analysis of the control questionnaire used to collect data from the samples at the field
experiments as regards to hunger, emotions, and sickness showed that; none (0%) of the 407
pupils (samples) indicated they were hungry during the field experiments. This is probably
because the samples might have had breakfast at home before the beginning of the morning
experiments and refreshments at short break before the beginning of the afternoon experiments.
Also, none (0%) of the 407 the samples indicated that they were unhappy. Sadly, from the
analysis of the same questionnaire mentioned here, 4 (1%) of the 407 pupils (samples) indicated
they were feeling sick during to the field experiments.
Furthermore, analysis of the control questionnaire used to collect data from the samples
concerning their views to daylighting, noise, and ventilation at the field experiments revealed
that none (0%) of the pupils was affected by the noise and daylighting levels in the classrooms
during the field experiments. Possibly because the samples have been habituated to the noise
and daylighting levels in their classrooms. However, 2 (0.5%) of the pupils (samples) indicted
they find it difficult to breathe the air around them in their classrooms during the field
experiments. One reason that may account for why a negligible percent (0.5%) of the samples
indicated that they could not breathe freely during the field experiments may be attributed the
idea that the windows and door of the classrooms were 100% open during each field experiment
to enhance the rate of air exchanges between indoors and outdoors.
As well, 12 (3%) of the pupils (samples) had missing data. These missing data were attributed
to some errors in the area of filling the thermal comfort vote questionnaire and the health survey
questionnaires. Both of these (questionnaire) are described in the methodology section. There
are two reasons why this study recorded a relatively low percentage (3%) of missing data.
Firstly, during each field experiment, the researcher and the class teacher in charge each of the
field experiments took time to ensure that each section of the questionnaire administered to the
pupils’ (samples) were completed. Secondly, the pupils were allowed to ask questions in respect
to areas which they do not understand in the questionnaires administered to them.
In summary, the data of 18 (4%) out of the 407 pupils used as samples for the field experiments
were excluded from the data sets and statistical analysis used to determine the effect of high
temperatures on the thermal comfort, health and academic performance of pupils. This is for
the reasons previously documented the past paragraphs of this section. This means it was the
data of 389 pupils (samples) that was used for the statistical analysis to determine the effect of

113
indoor air temperature 25.6 and 34.50C on the thermal comfort, health and academic
performance of pupils used for this study. See Figure 5.1 for the distribution of the number of
samples excluded from the data analysis discussed in this section.
Figure 5.1.Distribution of the 18 pupils (samples) excluded from the data analysis in this study.
5.2.3 Gender / ethnicity of the samples
The 407 samples comprises of 231 boys and 176 girls, boys constitute 57% of the samples and
girls 43%. This suggests that the number of boys slightly exceeds that of girls in the samples
used for the field experiments, Figure 5.2. Also the samples all had ethnic background as
Nigerians
Figure 5.2. Distribution of boys and girls in the sample used for the field experiments
5.2.4 Age
The age of the pupils used for the field experiment in this study ranged between 13 to16. In
view of this, Figure 5.3 shows that out of the sample size of 407 pupils, a quarter and majority
percentage of the samples were 13 years 14 years old respectively, while less than a quarter and
0
2
4
6
8
10
12
14
Missingdata
Sick Breathingdifficulties
Unhappy Hungry Affected bynoise
Affected bydaylithing
Num
ber o
f pup
ils (s
ampl
es)
57%
43%
0%
10%
20%
30%
40%
50%
60%
70%

114
a small percentage were 15 and 16 years old respectively. The result in Figure 5.3 below
suggests that the major proportion of the samples used for the field experiment was around age
14.The mean of the age of the samples is M=14.5 and the standard deviation and 95%
confidence interval respectively are: Sd =0.88 and CI =14.65.
Figure 5.3.Age distribution of the samples used for the field experiments
5.2.5 Insulation value of the school uniform worn by samples (clo value)
Figure 5.4 shows the distributions of the clo values worn by the samples, the result in Table
5.4 shows that on the average most (57% and 24%) of the samples used for the field experiments
in the 11 schools wore school uniforms with similar clo values of 0.5 clo while less than a
quarter (19%) of the sample wore school uniforms with about 0.82 clo.
Figure 5.4. Distribution of clo values of uniform worn by the samples used for the field
experiments.
25%
53%
16%
6%0%
10%
20%
30%
40%
50%
60%
AGE 13 AGE 14 AGE 15 AGE 16
57%
24%19%
0%
10%
20%
30%
40%
50%
60%
0.51 clo Boys 0.53 clo Girls 0.82 clo Girls

115
5.2.6 The values of the air temperatures at the periods when the thermal comfort, health and academic performance of the samples were evaluated in the 11 classrooms
Table 5.2 presents the values of the indoor air temperatures in the classrooms of the schools
when the thermal comfort of the samples were measured at the field experiments. In short,
Table 5.2 shows that the mean value of the indoor air temperatures in the classrooms of the 11
schools is 25.6 0C when the thermal comfort, health and academic performances of the samples
were evaluated at the field experiments in the mornings. Similarly the Table 5.2 shows that the
mean value of the indoor air temperatures in the 11 classrooms of the 11 schools is 34.5 0C
when the thermal comfort, health and academic performances of the samples were re-evaluated
at the field experiments in the afternoons.
School ID Mean air temp in classrooms Measured between 8.30 and 9.40 am
Mean air temp in classrooms Measured between 12.20 and 1.30 Pm
Dates of field experiment
Orientations of the block of classroom where measurements were taken at each field experiment
School 1 25.6 34.5 15/11/2016 School 2 24.7 35.2 16/11/2016 School 3 25.8 33.3 17/11/2016 School 4 26.4 33.1 21/11/2016
School 5 25.2 33.4 22/11/2016 School 6 26.0 36.3 23/11/2016
School 7 25.4 35.7 24/11/2016 School 8 26.3 33.0 28/11/2016
School 9 25.7 35.8 29/11/2016 School 10 24.9 33.2 30/11/2016
School 11 25.3 35.6 1/12/2016
Mean 25.6 34.5 --------------------
-----------------------------
Table 5.2. The values of the air temperatures in the classrooom when the thermal comfort,
health, and academic performance of the sample were assesed at field the experiments

116
5.3 Results: effect of indoor air temperature on the thermal comfort of pupils Find in three subsections below the results from the data analysis concerning the effect of indoor
air temperature of 25.6 and 34.50C on the thermal comfort of the sample of pupils used for the
field experiments in this study.
5.3.1 Result of the descriptive analysis of Predicted Mean Vote (PMV) in respect of the
effect of indoor air temperature on the thermal comfort of pupils (samples)
With respect to the analysis of data from the field experiments carried out with the method
described in subsection 3.5.15, Table 5.3 presents a summary of the descriptive analysis of the
PMV (average thermal sensation) votes used to measure the thermal comfort of the samples at
25.6 (low temp) and 34.50C (high temp).
School ID No of samples
PMV of the samples at mean air temperatures of 25.60C (low temp)
PMV of the samples at mean air temperatures of 34.50C (high temp)
School 1 35 0.5 2.3 School 2 40 0.5 2.4 School 3 32 0.6 2.3 School 4 38 0.7 2.1 School 5 29 0.7 2.3 School 6 37 0.6 2.6 School 7 34 0.7 2.5 School 8 39 0.7 2.3 School 9 38 0.5 2.5 School 10 31 0.5 2.3 School 11 36 0.4 2.3
The 11 schools 389 0.6 2.4
Table 5.3. Result from the analysis of PMV( statistical averages of the thermal sensation votes
used to measure the thermal comfort of the samples at 25.6 and 34.50C at the field
experiments)
From the result in Table 5.3 it could be deduced that the PMV (average thermal sensation votes)
of the samples from the 11 schools is 0.6 when their thermal comfort were assessed at the field
experiments at mean air temperature of 25.60C.This result suggest that the samples were
thermally comfortable at 25.60C and that their thermal comfort was not affected. PMV votes of
persons within the ranges of -1, 0 and +1 on the seven point ASHRAE (2004) thermal sensation
scale are generally considered to be thermally comfortable.
In contrast , the result in Table 5.3 shows that the PMV (average thermal sensation) of the
samples from the 11 schools is 2.4.when their thermal comfort were measured during the field

117
experiments at mean air temperature of 34.50C.This result proposes that the samples were
thermally uncomfortable at 34.50C and that their thermal comfort was affected. This because
PMV votes of persons outside the ranges of -1, 0 and +1 on the seven point ASHRAE (2004)
thermal sensation scale are generally considered to be thermally uncomfortable.
5.3.2 Result of descriptive analysis of PPD in respect to the effect of indoor air
temperature on the thermal comfort of pupils (samples)
With respect to the analysis of data from the field experiments carried out with the method
described in subsection 3.5.15, Table 5.4 presents a summary of the result of the descriptive
analysis in respect of Predicted Percent Dissatisfied (PPD) of the samples.
ASHRAE Thermal sensation voting scale
Predicted Percent Dissatisfied at 25.6 0C N=389
Predicted Percent Dissatisfied at 34.5 0C N=389
Hot +3 0 38 Warm + 2 10 56 Slightly warm +1 46 6 Neutral 0 42 0 Slightly cool -1 1 0 Cool -2 1 0 Cold -3 0 0
Table 5.4.Result of the descriptive analysis of PPD
From Table 5.4 column 2, it can be deduced that 89 % of the samples (pupils) were thermally
comfortable at mean air temperatures 25.6 0C when their thermal comfort were evaluated at the
field experiments. This is because the PPD result in Table 5.4 column 2 shows that most(1, 42
and 46%=89%,) of the thermal sensation votes of the samples are in the range of -1, 0 and +1
on the ASHRAE (2004) thermal sensation voting scale used to measure their thermal comfort
at the field experiments . In sum, this results suggests that the air temperatures of 25.6 0C did
not affect the thermal comfort of the samples from the 11 schools. Broadly persons voting in
the range -1, 0 and +1 on the ASHRAE (2004) thermal sensation voting scale are considered
to be thermally comfortable.
Conversely, the PPD result in Table 5.4 column 3 suggest that most 94% (56% and 38%) of
samples were thermally dissatisfied when their thermal comfort were measured at 34.5 0C the
field experiment. This is because the thermal sensation votes of most (94%) of the samples in
Table 5.4 are in the range of +2 and +3. Generally persons voting outside -1, 0 and +1on the
ASHRAE (2004) thermal sensation voting scale are considered to be thermally uncomfortable.

118
Overall, this result suggest that the thermal comfort of the samples was affected by the indoor
air temperature of 34.5 0C (high temp).
5.3.3 Result of the dependent t-test in respect of the effect of indoor air temperature on
the thermal comfort of pupils (samples)
With respect to the analysis of data from the field experiments carried out with the method
described in subsection 3.5.15, a dependent t-test was conducted. The dependent t-test
compared; the mean of the thermal sensation votes used to assess the thermal comfort of the
samples from the 11 schools at 25.6 0C (low temp) with the mean of the thermal sensation votes
used to assess their thermal comfort at 34.5 0C (high temp). The result of the dependent t-test
showed that on the average the thermal sensation of the samples from the 11 schools were
significantly higher at 34.5 0C (M=2.4) in comparison to 25.60C, (M=0.6), p= 0.01. This result
suggest that the air temperature of 34.5 0C (high temp) in the classrooms of the public schools
used for field experiments in this study affected the thermal comfort of the samples. In view of
this result, find in Table 5.5 below a summary of the results of the dependent t-tests for each of
the 11 schools and all the schools put together.
School ID No of samples Mean of the thermal sensation votes of the samples at indoor air temperature of 25.60C (low temp)
Mean of the thermal sensation votes of the samples at indoor air temperatures of 34.50C (high temp)
P value
School 1 35 0.5 2.3 0.01 School 2 40 0.5 2.4 0.01 School 3 32 0.6 2.3 0.01 School 4 38 0.7 2.1 0.01 School 5 29 0.7 2.3 0.01 School 6 37 0.6 2.6 0.01 School 7 34 0.7 2.5 0.01 School 8 39 0.7 2.3 0.01 School 9 38 0.5 2.5 0.01 School 10 31 0.5 2.3 0.01 School 11 36 0.4 2.3 0.01 All the 11 schools
389 0.6 2.4 0.01
Table 5.5. Dependent t-test results:effect of indor air temperature on the thermal comfort of
pupils
The effect size (Magnitude of the effect)
Cohen’s d formula, d= M ÷ SD was used to compute the effect size of indoor air temperature
of 34.5 0C (high temp) on the thermal comfort of the samples in this study. M, is the mean of the

119
paired difference between the thermal sensation votes used to evaluate the thermal comfort of
the samples at 25.6 0C (low temp) and 34.5 0C (high temp) respectively. SD is the standard
deviation of the paired difference between the thermal sensation votes used to evaluate the
thermal comfort of the samples at 25.6 0C (low temp) and 34.5 0C (high temp). These values M
and SD were obtained directly from the SPSS output of the dependent t-test result earlier
reported in section, Table 5.6. Thus, using some of the output in Table 5.6, the effect size of
indoor air temperature of 34.50C on the thermal comfort of the samples was evaluated as
follows: d=-1.75÷0.89 =approximately 2.0.The value of d=2.0 from the computation here
corresponds to large effect size. This means that the effect of indoor air temperature of 34.50C
on the thermal comfort of the samples used for this study is large based on Cohen’s d formula.
Effect sizes with Cohen’s d value of 0.8 and above is considered to be large in statistics (Cohen,
1998; Field, 2018).
95% Confidence interval of the difference
Mean (M)
Std. Deviation (SD)
Std. Error Mean
Lower Upper t df Sig.(2-tailed)
-1.758 0.89 0.45 -1.847 -1.670 -38.970 388 0.00 Table 5.6. Dependent t-test results showing the output where data was obtained for calculating
the effect size
Gender difference in the effect of the mean air temperatures of 25.6 0C and 34.5 0C on the
thermal comfort of the samples
With respect to the analysis of data from the field experiments carried out with the method
described in subsection 3.5.13, an independent t-test was conducted. The independent t-test was
used to determine if there is gender difference in the effect of the mean air temperatures of 25.6 0C (low temp) and 34.5 0C (high temp) on the thermal comfort of the samples. The result of the
independent t-test showed there is no significant difference between the thermal comfort of
boys and that of the girls used as samples when their thermal comfort were measured at 25.6 0C
(low temp) at the field experiments, M=0.5 for boys, M=0.6 for girls, p=0.14. See Table 5.7 for
the summary of the result.
On the other hand, the result of independent t-test showed that there was significant gender
difference in the thermal sensation of boys from that of girls when their thermal comfort were
measured at mean air temperature of 34.5 0C, (p= 0.00).The mean of the thermal sensation of
the girls was observed from the result of the independent t-test to be (M=2.5) and that for boys
(M=2.3), Table 5.7. This result suggests that on the average girls were more thermally

120
uncomfortable than the boys at air temperatures of 34.5 0C (high temp) at the field experiments.
In sum, this result show that there is significant gender difference when the thermal comfort of
the samples were evaluated at 34.5 0C (high temp).The significant gender difference reported
from the result here may be attributed to the fact that some of girls used as samples for the field
experiments in this study wore school uniforms with are relatively high clo value of 0.82, this
is higher than the 0.5 clo uniform worn by most of the samples. See subsection 5.2.5, Figure
5.4 for the descriptive analysis of clo values of the uniform worn by the samples used for the
field experiments in this study.
Gender difference at mean air temperature of 25.6 0C
Gender Number of samples
PMV P value
Girls 167 0.6 p= 0.14 Boys 222 0.5
Gender difference at mean air temperature of 34.50C
Girls 167 2.5 p= 0.00 Boys 222 2.3
Table 5.7 Independent t-test result (Gender difference in the effect of mean air temperature of
25.6 0C and 34.50C on the thermal comfort of the samples used for the field experiments).
Clo difference in the effect of indoor air temperature on the thermal comfort of the samples
(pupils) used for the field experiments.
Further to the method described in 3.5.15, an independent t-test was conducted. The
independent t-test compared the PMV (average thermal sensation vote) of the samples that wore
school uniforms with clo value of 0.82 with the PMV of the samples that wore school uniforms
with clo values of 0.5 when their thermal comfort were assessed at 25.6 0C (low temp). The
result of the independent t-test revealed that there is no significant difference in PMV (average
thermal sensation vote) of the samples that wore uniforms with clo value of 0.8 and 0.5, (p =
0.63).This result points out that there is no significant difference in the effect of air temperatures
of 25.6 0C (low temp) as a result of differences in the clothing insulation values of the uniform
worn by the samples at the field experiments. This result also points out that at lower indoor air
temperatures differences in the clo values of the uniform worn by the samples used for this
study does not have any significant effect on their thermal comfort.
Also, an independent t-test was used to compare the PMV (average thermal sensation vote) of
the samples that wore school uniforms with clo value of 0.8 with the PMV the samples that
wore school uniforms with clo values of 0.5 when their thermal comfort were assessed at 34.5 0C (high temp). The result of the independent t-test showed that at high air temperature of 34.5 0C (high temp), the PMV (average thermal sensation vote) of the samples that wore school
uniforms with clo value of 0.82 was significantly higher than that of the samples that wore
school uniform with clo value of 0.5, (p = 0.02). This result points out that there is a significant

121
difference in the effect of the mean air temperatures of 34.5 0C (high temp) as a result of
differences in the clothing insulation values (clo values) of the uniform worn by the samples at
the field experiments.
Overall, the result of the independent t-test reported in the past two paragraphs suggest that;
when pupils put on school uniforms with clothing insulation values that are in the range of 0.8
clo and above, their thermal comfort is likely to be significantly affected by high air
temperatures of about 34.5 0C in classrooms. The practical implication of this result is that the
use of uniforms with clothing insulation values of 0.5clo could be more desirable for the thermal
comfort of pupils in public schools of Minna, this is in comparison to the use of uniforms with
clo value of 0.8.
5.4 Results: effect of indoor air temperature on the health of pupils (samples)
Find in the subsections of this section the results concerning the effect of indoor air temperature
of 25.6 0C (low temp) and 34.50C (high temp) on the health of the sample of pupils used for the
field experiments in this study. The health of the samples were measured at the field
experiments in this study via their perception to some symptoms. The method used to analyse
the data has been provided subsection 3.5.16 in chapter 3.
5.4.1 Perception of pupils (samples) to the symptoms of thirst
With respect to analysis of data collected from the samples used for the field experiments in
this study, a Wilcoxon-signed rank test was used to compare their perceptions to symptoms of
thirst at 25.6 0C (low temp) and 34.50C (high temp).The result of the Wilcoxon-signed rank test
showed that there is significant increase in the perception (feelings) of symptoms of thirst at
mean air temperatures of 34.50C (high temp) in comparison to 25.6 0C (low temp), Z= -14,p =
0.01.
The effect size was calculated using the formula r= Z ÷ √N, r is the Pearson correlation
coefficient, Z is the standard deviation from the SPSS 24 output of the Wilcoxon-signed rank
test, while N is the number of observations, usually the total number of samples used for the
field experiments multiplied by 2 (i.e. N means 389 x 2= 778).Thus, using the formula above
the effect size was evaluated to be 0.50, (r = -14÷√778= 0.50). Effect sizes (r) in the range 0.50
are considered to be large (Cohen, 1998; Field et al., 2012). The result here suggest that the
indoor air temperature of 34.50C significantly provoked the symptoms of thirst on the pupils
used for this study to a large extent.

122
5.4.2 Perception of pupils (samples) to the symptoms of Headache
With respect to analysis of data collected from the samples of pupils employed for the field
experiments in this study, a Wilcoxon-signed rank test was used to compare their
perceptions(feeling) of symptoms headache at 25.6 0C (low temp) and 34.50C (high temp). The
result of the Wilcoxon-signed rank test showed that there is no significant difference in the
feeling of symptoms of headache between air temperatures of 25.6 0C (low temp) and 34.5 0C
with respect to the samples used for the field experiments , Z= -1.4, p = 0.16. The result here
proposes high indoor air temperatures did not significantly cause symptoms of headache as
regards the sample of pupils used for the field experiments in this study.
5.4.3 Perception of pupils (samples) to the symptoms of sweating
A Wilcoxon-signed rank test was performed using the data collected from the samples used for
the field experiments in this study, the Wilcoxon-signed rank test compared their perceptions
of symptoms thirst at 25.6 0C (low temp) and 34.50C (high temp). The result of the Wilcoxon-
signed rank test revealed that the samples from the 11 schools used for the field experiments
significantly felt symptoms of sweating at mean air temperature of 34.50C in comparison to 25.6 0C, Z = -17, p = 0.00). The effect size was evaluated to be 0.6 using the Pearson effect size
formular (r = Z ÷ √N). The effect size reported here is observed to be large. Effect sizes with r
values greater than 0.5 is considered to be large (Field et al., 2012). Overall, this result suggest
that high air temperature can provoke symptoms of sweating on pupils to a large extent in the
classrooms of public schools in Minna.
5.4.4 Perception of pupils (samples) to the symptoms of tiredness
In respect of the analysis of data collected from the samples utilised for the field experiments
in this study, a Wilcoxon-signed rank test was conducted. the Wilcoxon-signed test compared
the perceptions of symptoms of tiredness of the samples at 25.6 0C (low temp) and 34.50C (high
temp).The result of the Wilcoxon-signed rank test showed that there is no significant difference
in the perception (feeling) of symptoms of tiredness concerning the samples between indoor air
temperatures of 25.6 0C (low temp) and 34.5 0C (high temp), (Z= -1.77, p = 0.07). This result
suggest that high indoor air temperature did significantly exacerbate the symptoms of tiredness
as regards the samples used for the field experiments in this study.
5.4.5 Perception of pupils (samples) to the symptoms of displeasure to do class work.
In respect of the analysis of data collected from the samples used for the field experiments in
this study, a Wilcoxon-signed rank test was performed; the Wilcoxon-signed rank compared
their perceptions of symptoms displeasure to do classwork at 25.6 0C (low temp) and 34.50C

123
(high temp).The result of the Wilcoxon-signed rank test revealed that the symptoms of
displeasure to do class work concerning the samples from the 11 schools is significantly higher
at 34.5 0C (high temp) in comparison to 25.6 0C (low temp), Z= -14, p =0.00. The effect size was
computed using the Pearson effect size formula, r= Z ÷ √N and the computation showed that
the effect size is large (r = 0.5).
On the whole, the result of the Wilcoxon-signed rank test reported in the past subsections
showed the samples from the 11 schools significantly felt the symptoms of thirst, sweating and
displeasure to do classwork at mean air temperature of 34.5 0C (high temp) in comparison to 25.6 0C (low temp). By extension, these results suggests that relatively high air temperatures of about
34.50C in classrooms of public schools in Minna has the potential to affect the health of pupils.
Health is not the mere absence of sickness ,but the complete physical, social and mental
wellbeing of persons (WHO, 2006).
Surprisingly, the result from the Wilcoxon-signed rank tests reported in the past subsections
showed that the air temperatures of 34.50C did not significantly provoke the feelings of
headache and tiredness on the samples used for this study.
5.5 Results: effect of indoor air temperature on the academic performance in the area of Mathematics
Analysis of data collected from the samples used for the field experiments in this study was
performed with the method described in subsection 3.5.17, the analysis was performed using a
dependent t-test. The dependent t-test compared difference between the mean score achieved
by all the samples in the 20 marks mathematics test taken at 25.6 0C (low temp) and 34.5 0C
(high temp). The result of the dependent t-test revealed that on the average there was a
significant difference in the mean scores of samples in the mathematics test taken at 34.5 0C
(M=8.4) in comparison to the mathematics test taken at 25.6 0C (M=9.0), p=0.01.This results
show that the air temperature of 34.5 0C (high temp) had significant effect on the academic
performance of the samples from the 11 schools in the mathematics test taken at the field
experiments in this study. See the Table 5.8 for the summary of the results of the dependent t-
test from each of the 11 schools used for the field experiments in this study.
Furthermore, it can be deduced from Table 5.8 that in 7 out of the 11 schools, there was
significant decrease observed in the academic performance of the samples in mathematics at
34.5 0C (high temp). Interestingly, from Table 5.8 it can be seen that in schools 1 and 5 the
average performance of the samples were a bit higher at 34.5 0C (high temp) in comparison to
25.6 0C. Overall, the findings from the dependent t-test reported in this section (5.5) and

124
summarised in Table 5.8 suggests that relatively high air temperatures can be significantly
detrimental to the performance of mathematics based tasks by pupils that are presumed to be
acclimatised to tropical climates .
School ID Number of pupils
Mean scores of the samples at Mean temperatures of 25.6 0C
Mean scores of the samples at Mean temperatures of 34.50C
p values
School 1 35 9.4 9.7 0.62 School 2 40 9.3 8.4 0.03* School 3 32 8.1 7.2 0.04* School 4 38 9.0 8.2 0.82 School 5 29 9.3 9.8 0.26 School 6 37 10.4 9.6 0.04* School 7 34 8.3 7.5 0.08 School 8 39 10.4 9.6 0.04* School 9 38 7.6 6.8 0.05* School 10 31 10.0 9.0 0.02* School 11 36 7.7 6.8 0.03* All the 11 schools 389 9.0 8.4 0.01*
Table 5.8.Result of dependent t-tests in Mathematics for each of the 11 schools.*Significant
difference observed
The effect size (Magnitude of the effect) and % decrease
Cohen’s d formula d= M / SD was used to calculate the effect size of air temperature of 34.50C
on the academic performance of the samples in the area of mathematics, it was observed that
the effect size is small, d= 0.26.The effect size reported here was calculated as shown in bracket
(d= 0.66 / 2.51 = 0.26),the M and SD used to calculate the effect size were read from part of
the SPSS 24 output of the dependent t-test analysis performed in respect of the mathematics
test under consideration here, Table 5.9. Additionally, the percentage decrease in the academic
performance of the samples in mathematics was evaluated in this study to be about 7%.
95% Confidence interval of the difference
Mean (M)
Std. Deviation (SD)
Std. Error Mean
Lower Upper t df Sig.(2-tailed)
0.6581 2.5156 0.1275 0.4073 0.9088 5.160 388 0.000 Table 5.9.Part of SPSS 24 t-test output where the values of M and SD used to calculate the
effect size in the area of mathematics were obtained.

125
Gender difference in the academic performances of the samples in mathematics
With respect to the analysis of data from the field experiments carried out with the steps
described in subsection 3.5.17, an independent t-test was performed. The test was utilised to
determine if there is gender difference in the academic performance of the samples in the
mathematics test taken at 34.50C (high temp). This was done by comparing the mean scores
achieved by the boys in the mathematics test taken at indoor air temperature of 34.50C (high
temp) with mean score achieved by the girls at 34.50C (high temp). The result of the independent
t-test showed that there is no significant difference between the academic performance of the
boys from that of the girls, p=0.26.
Similarly, the result of an independent t-test conducted as regards gender difference in the
performance of the samples in mathematics taken by the samples at air temperature of 25.6 0C
(low temp) showed that there is no significant gender difference in the performance of the
samples, p=0.13. This result shows that the performance of boys and that of girls used as
samples for the field experiments in this study does not significantly differ in the mathematics
test taken at 25.6 0C (low temp).
Overall, the result reported in this subsection suggest that the performance of numerical based
tasks in schools by pupils who are presumed to be acclimatised to tropical climate is not
dependent on gender.
Gender Number of samples
Mean score in mathematics at 34.5 0C
p values
Boys 222 8.6 p = 0.26 Girls 167 8.2
Total 389 ----------------- Table 5.10. Result: gender effect in the academic performance of pupils in mathematics)
5.6 Results: effect of indoor air temperature on the academic performance of pupils in the area of English Language
A dependent t-test was conducted with the data collected from the samples used for the field
experiments in this study, the method used to conduct the test has been described in subsection
3.5.17. The dependent t-test compared the difference between the mean score of the samples in
the 20 marks English test taken at 25.6 0C and 34.5 0C .The result of the dependent t-test
revealed that there is no significant difference between the mean scores of the samples in the
English taken at 25.6 0C (low temp) and 34.5 0C (high temp), (p=0.100).This result suggests
that the air temperature of 34.5 0C (high temp) did not affect the academic performance of the
samples in the English test taken at the field experiments in this study. Table 5.11 presents a
summary of the results of the dependent t-test reported in this section. The result presented in

126
Table 5.11 suggest that; overall there is a slight decrease in the average performance of the
samples in the English language test taken at high air temperature (34.50C) in comparison to the
average score at 25.6 0C, however the decrease is not statistically significant. On the whole, the
results from this study that is reported in this section shows that high air temperature did not
significantly affect the performance of pupils in the area of English language based task.
School ID Number of pupils
Mean scores of the samples at Mean temperatures of 25.6 0C
Mean scores of samples at Mean temperatures of 34.5 0C
p values
School 1 35 11.5 11.0 0.19 School 2 40 9.8 10.4 0.08 School 3 32 10.0 9.6 0.13 School 4 38 11.3 10.5 0.01* School 5 29 10.3 10.0 0.64 School 6 37 12.0 11.2 0.01* School 7 34 10.0 10.4 0.38 School 8 39 11.0 11.7 0.93 School 9 38 9.6 9.3 0.38 School 10 31 11.4 11.0 0.12 School 11 36 9.4 10.0 0.09 All the 11 schools
389 10.6 10.4 0.10
Table 5.11. Result of dependent t-tests in English for each of the 11 schools.
Gender difference in the academic performances of the samples in English
Further to the result reported above, an independent t-test was used to compare the
performances of the boys and girls used as samples in the English language test taken 25.6 0C
(low temp) and 34.5 0C (high temp). The result of the independent t-test showed that there is no
significant difference between in the performance of boys and girls in the English language
taken at air temperatures of 25.6 0C (low temp) and 34.5 0C (high temp).See Table 5.12 and 5.13
for details of the results reported here.
Gender Number of pupils
Mean score at 25.60C (low temp)
p values
Boys 222 10.6 p = 0.684
Girls 167 10.5 Total 389 -----------------
Table 5.12.Result of independent t-tests (Gender difference in the performance samples in
English at 25.60C (low temp)

127
Gender Number of pupils
Mean score at 34.5 0C (high temp)
p values
Boys 222 10.5 p = 0.863 Girls 167 10.4
Total 389 ----------------- Table 5.13.Result of independent t-tests (Gender difference in the performance samples in
English at 34.50C (high temp).
5.7 Chapter summary.
The results from the analysis of data collected from the field experiments conducted in this
study has been presented in this chapter. The result from the field experiments concerns the
effect of indoor air temperature on the thermal comfort, health and performance of a sample of
pupils in select public schools in Minna. Against this background, the key summary of the
results presented in this chapter is provided in the subsequent paragraphs of this section.
Descriptive statistics of the data collected from the field experiments showed that 407 pupils
from 11 public schools within Minna and the outskirts were used as samples for the field
experiments in this study. The samples were made up of 57% boys and 43% girls of mean ages
of about 14 years. However, it was the data of 389 samples that was finally used to conduct the
data analysis and report the results in this chapter, this is for reasons earlier discussed in
subsection 5.2.2.
Furthermore, physical measurements of the air temperatures in the classrooms indicated that
the mean air temperatures in the classrooms when the thermal comfort, health and academic
performance of the samples from each of the 11 schools were evaluated in the mornings is about
25.6 0C referred in this study to as low temp. Similarly, the mean air temperatures in the
classrooms when the thermal comfort, health and academic performance of the samples from
each of the 11 schools were re-evaluated in the afternoon is 34.5 0C referred to in this study
as high temp.
Thus far, the main point from the summary of the results in this chapter is that, relatively high
indoor air temperature can significantly affect the thermal comfort, health and academic
performance of pupils in public schools of Minna. Widely, the results in this chapter shows that
relatively high indoor air temperatures have the potential to affect the thermal comfort, health
and academic performance of pupils that are presumed to be acclimatised to tropical climate.
Lastly, the results from in this chapter shows that the thermal comfort and performance of task
by pupils under similar air temperatures is not dependent on Gender.

128
Chapter 6. Results from analysis of data from the field surveys in respect of
the effect of indoor air temperature on thermal comfort and productivity of
teachers
6.1 Introduction
The previous chapter (5) reported the results from the analysis of data collected from the field
experiments conducted in this study on a sample of pupils. This chapter reports the result from
the data analysis collected from the field surveys with teachers The method used to collect and
analyse the data from the field surveys with teachers is discussed in chapter 3(section 3.7). The
field surveys were conducted in this study with the key aim of examining the effect of indoor
air temperature on the thermal comfort and productivity of teachers in the naturally ventilated
classrooms of select public schools in Nigeria. Furthermore, other results from the field surveys
with teachers are reported in this chapter.
6.2 The size of the respondents (sample of teachers)
The size of respondents used for the field surveys is approximately 368 teachers, Although the
sample size of the respondents (368) used for the field surveys in this study may be relatively
small compared to the population of teachers employed in public schools in Minna.
Nonetheless, the size of the respondents used for the field survey (368) is slightly larger than
the minimum (350) that is required to conduct surveys in educational research as suggested by
Creswell (2012). In view of the size of the respondents, used for the field surveys, find in Figure
6.1 and 6.2 the distributions of the respondents from the 11 schools used for the field surveys
in this study. See section 3.6.7 for details of why the respondents were distributed into group A
and B.
Figure 6.1.Distribution of respondents from schools in group A
35 36 35 3439
43
05
101520253035404550
School 11 School 3 School 9 School 10 School 6 School 2

129
Figure 6.2. Distribution of respondents from schools in group B
6.2.2 Gender
Tables 6.1, 6.2, and 6.3 below shows the distribution of the respondents by gender from schools
in groups A and B. Taking account of Tables 6.1, 6.2, and 6.3, it can be deduced that the
percentage of males whom responded to the questionnaire during the field survey were more
than females.
Gender Frequency Percent %
Males 211 57
Females 157 43
Total 368 100
Table 6.1. Distribution of samples by gender from group A and B
Gender Frequency Percent % Male 128 57 Female 88 43 Total 216 100
Table 6.2. Distribution of respondents by gender from schools in group A
Gender Frequency Percent % Male 83 54.6 Female 69 45.4 Total 152 100
Table 6.3. Distribution of respondents by gender from schools in group B
33
27
41
22
29
0
5
10
15
20
25
30
35
40
45
School 7 School 1 School 8 School 4 School 5

130
6.3 Age and ethnicity.
Find in Table 6.4 the age distribution of the respondents from school in groups A and B used
for the field surveys. From Table 6.4 it can be inferred that the age of the respondents used for
the field surveys is centred on 30 -40. Furthermore, all the samples used for the field surveys
were black Africans born and domiciled in Nigeria.
Age range Frequency Percent % 24-30 80 21.7 30-40 179 48.7 40-50 109 29.6 Total 368 100
Table 6.4. distribution of samples by age (group A and B)
6.4 Clo and met values (clothing insulation and metabolism)
Based on ASHRAE (2004) the clo value worn by the respondents (teachers) at the field surveys
was observed and estimated to be approximately 0.56 for male and 0.56 for female. See
subsection chapter 3(subsection 3.6.9, Table 3.13) for details of the clo values mentioned here.
Also the met value of the teachers was estimated to be 1.6. This corresponds to the metabolic
rate specified by ASHRAE (2004) for persons performing light activity while standing.
6.5 Respondents (teachers) excluded from the data set and analysis
After data input in SPSS version 24, the data of 41 respondents out 368 respondents were
excluded from further statistical analysis. Out of the 41 respondents excluded, 28 did not
respond to any of the items in the questionnaire administered to them, the remaining 13 had
cases of missing data in many sections of their questionnaire. In sum, the 41 respondents
excluded resulted in using the data of 327(186 males and 141 females) respondents for the
analysis of data from the field surveys. These 327 respondents (teachers) were those that
appropriately completed all sections of the questionnaire administered to them at the field
surveys.
6.6 The ranges of air temperatures in the classroom during the field surveys with teachers in schools from group A and B.
Find in Table 6.5 and 6.6 the values of the air temperatures in the classrooms during the field
surveys with the respondents in each of the schools from group A and B respectively. In short,
Table 6.5 shows that the average air temperatures when the thermal comfort and productivity
of the respondents (teachers) from schools in group A were measured at the field surveys is
27.70C (low temp). Similarly, Table 6.6 shows that the average air temperatures when the

131
thermal comfort and productivity of the respondents (teachers) from schools in group B were
measured at the field surveys is 360C (high temp).
Schools in group A Mean air temp in classrooms (low temp) 0C
Time of measurements
School11 26.3 8.00am – 9.30 am School 3 26.1 8.00am – 9.30 am School 9 27.0 8.00am – 9.30 am School 10 26.9 8.00am – 9.30 am School 6 26.4 8.00am – 9.30 am School 2 27.1 8.00am – 9.30 am Mean 27.7 8.00am – 9.30 am
Table 6.5.Mean air temperatures in the classrooms during the field survey with respondents in
schools in group A.
Schools in group B Mean air temp in classrooms (low temp) 0C
Time of measurements
School 7 35.1 12pm – 1.30 pm School 1 36.3 12pm – 1.30 pm School 8 36.0 12pm – 1.30 pm School 4 36.6 12pm – 1.30 pm School 5 36.2 12pm – 1.30 pm Mean 36.0 12pm – 1.30 pm
Table 6.6. Mean air temperatures in the classrooms during the field survey with respondents
in schools in group B.
6.7 Result: effect of indoor air temperature on the thermal comfort of (respondents) teachers
6.7.1 Result of predicted percentage Dissatisfied (PPD)
With respect to the analysis of data from the field surveys performed as described in subsection
3.6.10, a descriptive analysis of PPD was conducted. The result of the PPD analysis showed
that about 87% of the respondents from schools in group A indicated that they were thermally
comfortable when their thermal comfort were measured during the field surveys at mean air
temperatures of 27.7 0C (low temp). This is because from the result in Table 6.7, it can be
deduced that 87% of the thermal sensation votes of the respondents from schools in group A
falls in the range of 0 and +1. Thermal sensation votes in the range of 0 and +1 suggest that the
persons are thermally comfortable (ASHRAE 2004). Overall, this result shows that the mean
air temperature of 27.7 0C did not affect the thermal comfort of the respondents from schools
in group A when their thermal comfort were evaluated at the field surveys.

132
ASHRAE thermal comfort vote scale Frequency of vote at 27.7 0C
Percent %
Cold -3 0 0 Cool -2 0 0 Slightly cool -1 0 0 Neutral 0 64 33 Slightly warm 1 104 54 Warm 2 24 13 Hot 3 0 0 192 100
Table 6.7.Result of the PPD analysis of samples from schools in group A at mean air
temperatures of 27.7 0C.
On the other hand, the PPD analysis concerning respondents from schools in group B showed
that about 95% of the respondents were thermally uncomfortable at mean air temperatures of
36.0 0C when their thermal comfort were evaluated. This is because 95% the respondents from
schools in group B voted in the range of +2 and +3 on the ASHRAE (2004) thermal sensation
scale used to measure their thermal comfort at the field surveys, Table 6.8. This result shows
that the air temperature of 36. 0C affected the thermal comfort of the respondents from schools
in group B.
ASHRAE thermal comfort vote scale Frequency of vote at 36.0 0C
Percent %
Cold -3 0 0 Cool -2 0 0 Slightly cool -1 0 0 Neutral 0 0 0 Slightly warm 1 7 5 Warm 2 67 50 Hot 3 61 45 Total 192 100
Table 6.8.Result of the PPD analysis of samples from schools in group B at mean air
temperatures of 360C.
6.7.2 Result of predicted mean vote analysis (PMV)
With respect to the analysis of data from the field surveys described with the method in
subsection 3.6.10, a descriptive analysis of the thermal sensation votes used to measure the
thermal comfort of the respondents from schools in group A at 27.7 0C (low temp) was
conducted. The result indicated that the average thermal sensation votes (PMV) of the
respondents from schools in group A is 0.8.The result of the PMV analysis reported here
suggests that the respondents from schools in group A were thermally comfortable at 27.7 0C

133
(low temp) when their thermal comfort were evaluated at the field surveys. PMV of 0.8 is still
within the range of comfort zone prescribed by ASHRAE (2004) thermal sensation scale. By
extension, this result implies that the mean air temperature of 27.70C (low temp) had no effect
on the thermal comfort of the respondents.
In contrast, a descriptive analysis of the thermal sensation votes used to evaluate the thermal
comfort of respondents from schools in group B at 36.00C (high temp) was performed. The
result shows that the PMV of the respondents from schools in group B is 2.4 when their thermal
comfort were evaluated at 36.00C (high temp). This result suggests that the air temperatures of
36.00C (high temp) affected the thermal comfort of the respondents from schools in group B.
PMV of 2.4 on the ASHRAE (2004) thermal sensation scale suggest that a person or group of
persons are thermally uncomfortable.
6.7.3 Independent t- test result (effect of high temperature on thermal comfort of the respondents)
With respect to the analysis of data from the field surveys carried out with the steps described
in subsection 3.6.10, an independent t-test was used to compute the difference between the
average thermal comfort vote of the respondents from schools in group A and B. The thermal
comfort of the respondent from schools in group A were assessed at mean air temperature of
27.70C: and the thermal comfort of the respondents from schools in group B were assessed at
mean air temperature of 360C during the field surveys in this study. The result of the
independent t-test shows that mean of the thermal comfort votes used to evaluate the thermal
comfort of respondents from schools in group B was significantly higher (M =2.4) than that of
the respondents from schools in group A (M= 0.79), p=0.00. This result suggest that the mean
air temperature of 36.0 0C affected the thermal comfort of the respondents from schools in
group B. By extension, this result suggest that the thermal comfort of teachers whom are
acclimatised to the tropical climate of Minna can be affected by relatively high air temperature
in classrooms. The effect size of mean air temperature of 36.00C on the thermal comfort of the
respondents was computed to be 0.1, (large effect size).The effect size was evaluated using the
formula presented below as cited in Field et al. (2012) .
r = √t2/ t2 + df ……………………………………………………………………………………… 6.1
r = √-22.99 2/ -22.99 2+ 325 = …….. 0.10
The values of t and df were read from the SPSS 24 output of the independent t –test conducted
in this section, Table 6.9.

134
Table 6.9.Result of the independent t-test concerning the effect of indoor air temperature on
the thermal comfort of respondents(teachers)used for the field surveys
6.7.4 Gender difference in the effect of indoor air temperatures of 27.70C and 360C on the thermal comfort of the respondents.
An independent t-test was conducted to determine if there is gender difference in the effect of
indoor air temperatures of 27.70C on the thermal comfort of respondents from schools in group
A. The result of the independent t-test showed that the mean of the thermal comfort votes for
male (M=0.84) did not significantly differ from that of females (M=0.72), p =0.217.This result
shows that there is no gender difference observed in the thermal comfort of the respondents
from schools in group A when their thermal comfort were evaluated at 27.7 0C during the field
surveys performed in this study.
Similarly an independent t-test was performed in order to determine if there is gender difference
in the thermal comfort of the respondents from schools in group B when their thermal comfort
were evaluated at 360C. The result indicated that the thermal comfort votes of males (M=2.41)
did not significantly differ from that of females (M=2.39), p=0.816.This result shows that there
is no gender difference observed in the thermal comfort of the respondents from schools in
group B when their thermal comfort were assessed at mean air temperature of 360C during the
field surveys. However, one reason that may account for why the thermal comfort of the
respondents from schools in group A and B did not significantly differ as a result of gender
according the results reported in this subsection. The reason is that, the male and female
respondents used for the field surveys dressed in clothing with similar clo (insulation) values.
See chapter 3(subsection 3.6.9, Table 3.13) for the clo values worn by males and female
respondents used for the fields surveys in this study.

135
6.8. Effect of indoor air temperature on the productivity of respondent (teachers)
An independent t-test was performed with the data from the field surveys .The method used to
analyse the data is provided in subsection 3.6.11.The independent t-test compared the
productivity of teachers from schools in group A and B. The productivity of respondents from
schools in group A were assessed at mean air temperatures of 27.7 0C (low temp) while the
productivity of respondents from schools in group B were assessed at 36.0 0C (high temp)
during the field surveys. The result of the independent t-test showed that the mean of the
productivity votes of the respondents from schools in group A was significantly higher
(M=3.79) than for respondents from schools in group B (M= 2.14), p=0.001. On the whole, this
result suggests, that high air temperature have the potentials of affecting the productivity
teachers in public schools of Minna. Find in Table 6.10 below the perceived productivity voting
scale used evaluate the productivity of the respondents at the field surveys. By extension, this
result suggest teachers in public schools of Minna are likely do teaching task in public schools
of Minna qualitatively and quantitatively at a lower indoor air temperatures in comparison a
relatively high indoor air temperatures.
Kindly rate your productivity with respect how hot or cold you feel right now with respect to the air temperature in this classroom? Tick one response from the boxes below.
I don’t know 0
Low 1
Average 2
high 3
Very high 4
Table 6.10.Perceived productivity vote used to evaluate the productivity of the respondents of
at the field surveys
6.9 Results from field surveys concerning the views of teachers about symptoms that may be linked to how high air temperatures affect pupils’ academic performances.
In order to identify how high temperatures affects pupils’ academic performance, this study
examined the views of respondents (teachers) from schools in group A and B about some
symptoms commonly exhibited by pupils when the air temperature turns hot in classrooms. Hot
here and other part of the results in this section refers temperature at which a person feels
thermally uncomfortable due to elevated air temperatures. In view of this background, find in
Table 6.11 the item used to survey the views of the respondents (teachers) at the field surveys.
Afterwards, the results concerning the views of the respondents is presented under four
subsections.

136
Question: Based on your view, how often do pupils exhibit the signs (symptoms) listed below when the temperatures turns hot in classrooms during lessons? Please tick x as a response in a row of the table below. Serial number Environmental
factor Responses Never Rarely Sometimes Often Undecided
1 Sleepiness 2 Tiredness 3 Restlessness 4 Displeasure to
do classwork
Table 6.11.The item used to collect the data at the field surveys of this study concerning the
views of teachers about symptoms exhibited by pupils when the air temperatures turns hot in
classrooms.
6.9.1. Sleepiness
With respect to the data collected from the field surveys using the questionnaire in Table 6.11,
a descriptive statistics was performed. The descriptive statistics examined the views of teachers
from schools in group A and B concerning how often pupils show signs of sleepiness when the
air temperatures turns hot in classrooms. The results from the descriptive statistics are presented
in Figures 6.3 and 6.4 respectively. From the results in Figures 6.3 and 6.4, it could be deduced
that, a high percentage of teachers from schools in group A (67%) and B (70%) indicated that
pupils sometimes tend to show symptoms of sleepiness when temperature turns hot in
classrooms. In sum, this result suggests that sleepiness could be attributed to how high air
temperatures could distract and affect pupils’ learning in the classrooms of public schools in
Minna.
Figure 6.3.Result of the descriptive statistics from respondents in group A with respect to
symptoms of sleepiness exhibited by pupils at high air temperatures
0.5
10.5
67
18
7
0
10
20
30
40
50
60
70
80
Never Rarely Sometimes Often undecided

137
Figure 6.4.Result of the descriptive statistics from respondents in group B with respect to
symptoms of sleepiness exhibited by pupils at high air temperatures.
6.9.1. Tiredness
With respect to the questionnaire in Table 6 .11, a descriptive statistics was performed. The
descriptive statistics examined the views of teachers from schools in group A and B about how
often pupil’s exhibit signs of tiredness when the air temperature is hot in classrooms. Figures
6.5 and 6.6 presents the results. The results in Figures 6.5 and 6.6 suggest that most of the
respondents(teachers) from schools in group A and B indicated by their responses that when
temperatures turns hot in classrooms pupils tend to show signs of tiredness. The high
percentage of responses (sometimes and often) by teachers from schools in group A and B
suggest that tiredness may be linked to how high air temperatures could affect learning and
pupils’ academic performance in public schools of Minna.
Figure 6.5.Result of the descriptive statistics from respondents in group A as regards symptoms
of tiredness exhibited by pupils at high air temperatures .
0 4
70
21
5
01020304050607080
Never Rarely Sometimes Often Undecided
0
9
4439
8
05
101520253035404550
Never Rarely Sometimes Often Undecided

138
Figure 6.6.Result of the descriptive statistics from respondents in group B as regards symptoms
of tiredness exhibited by pupils at high air temperatures.
6.9.3. Restlessness
With respect to the data collected from the field surveys using the questionnaire in Table 6.11,
a descriptive statistics was performed. The descriptive statistics examined the views of teachers
from schools in group A and B concerning how often pupils show signs of restlessness when
the air temperatures turns hot in classrooms. The results of the descriptive statistics are
presented in Figures 6.7 and 6.8. From Figures 6.7 and 6.8, it can be deduced that respondents
from schools in group A and B indicated by a relatively high percentages 64.5% and 71% that
pupils often show signs of restlessness when temperatures turns hot in classrooms . This result
suggest that there is a potential link between restlessness and how high air temperatures affect
pupils learning and their academic performance in classrooms procured for public schools in
Minna.
Figure 6.7.Result of the descriptive statistics from respondents in group A as regards symptoms
of restlessness exhibited by pupils at high air temperatures.
2
11
33
48
6
0
10
20
30
40
50
60
Never Rarely Sometimes Often Undecided
0 3
18.5
64.5
14
0
10
20
30
40
50
60
70
Never Rarely Sometimes Often Undecided

139
Figure 6.8. Result of the descriptive statistics from respondents in group B as regards symptoms
of restlessness exhibited by pupils at high air temperatures.
6.9.4. Displeasure to do class work
With respect to the data collected from the field surveys using the questionnaire in Table 6.11,
a descriptive statistics was performed. The descriptive statistics examined the views of teachers
from schools in group A and B concerning how often pupils show signs of displeasure to do
classwork when the air temperatures turns hot in classrooms. The summary of the results of the
descriptive statistics is presented in Figures 6.9 and 6.10. The results in Figures 6.9 and 6.10
shows that 74.5% of respondents from schools in group A indicated that very often pupils
show signs of displeasure to do classwork when the air temperatures in the classrooms turns
hot. Similarly about 86.7% of respondents from schools in group B share same view as the
respondent in group A. In sum, the results here suggest that displeasure to do classwork when
temperature is hot could be attributed to how high air temperatures may affect pupils learning
and their academic performances in classrooms of public schools in Minna.
Figure 6.9. Result of the descriptive statistics from respondents in group A as regards symptoms
of restlessness exhibited by pupils at high air temperatures.
0 1.5
14
71
13.5
0
10
20
30
40
50
60
70
80
Never Rarely Sometimes Often Undecided
04.7
15.6
74.5
5.2
0
20
40
60
80
Never Rarely Sometimes Often Undecided

140
Figure 6.10.Result of the descriptive statistics from respondents in group B as regards
symptoms of restlessness exhibited by pupils at high air temperatures.
6.10 Results concerning the views of teachers about the performance the classrooms used for this study in terms of air temperature, noise, daylighting and air flow
The subsequent subsections presents the results of the descriptive statistics performed with the
views of teachers from schools in group A and B about the performance of the classrooms used
for this study in terms of air temperature, daylighting, and noise and air flow. The data
concerning the views of teachers for which the results are reported in this section were collected
via the questionnaire in Table 6.12.
Please what is your view as regards the conditions of the environmental factors listed in table below in the classrooms of this school during this hot season? Tick x as a response in a row of the table below.
Serial number
Environmental factor Responses Too high
high Adequate (moderate)
low Too low
I don’t know
a Air temperature b Daylighting c Noise d Air flow
Table 6.12Table showing the questionaire used to survey the views of teachers about the
performance of classrooms in the public schools used for field surveys
6.10.1 The views of Teachers about the performance the classrooms in the schools used for this study in terms of air temperature
The result of the descriptive statistics performed concerning the views of teachers from schools
in group A and B about the performance of the classrooms used for this study in terms of air
temperature is provided in Figures 6.11and 6.12. The result shows that 86.5% of the respondents
0.7 2.2 6.7
86.7
3.70
102030405060708090
100
Never Rarely Sometimes Often Undecided

141
from schools in group A indicated that during the period of the field surveys (March-April
2017) the air temperatures in the classrooms are too high. Similarly about 74% of respondents
(teachers) from schools in group B indicated that during the period of the field surveys the air
temperatures in the classrooms are too high.
Figure 6.11.Result of the descriptive statistics from schools in group A with respect to the
performance of classrooms used for the field surveys in terms of air temperature.
Figure 6.12.Result of the descriptive statistics from schools in group B with respect to the
performance of classrooms used for the field surveys in terms of air temperature.
6.10.2 The views of teachers about the performance the classrooms in the schools used for this study in terms noise
The result of the descriptive statistics performed concerning the views of teachers from schools
in group A and B about the performance of the classrooms used for this study in terms of Noise
are summarised in Figures 6.13 and 6.14. The result of the descriptive statistics presented in
Figures 6.13 and 6.14 suggests that most the respondents from schools in group A (73.4%) and
B (67.4%) indicated that the noise level in the classrooms of their school is moderate. This
result proposes that the classrooms of public schools in Minna seems to be performing
satisfactorily with respect to the noise levels.
86.5
5.2 0 8.3
020406080
100
too high moderate Too low I dont know
74.1
4.40
21.5
0
10
20
30
40
50
60
70
80
too high moderate Too low I dont know

142
Figure 6.13.Result of the descriptive statistics from respondents in group A with respect to the
performance of classrooms in public schools of Minna in terms of noise.
Figure 6.14. Result of the descriptive statistics from respondents in group B with respect to the
performance of classrooms in public schools of Minna in terms of noise
6.10.3 Result: teachers’ views about the performance the classrooms in the schools used for this study in terms daylighting
Figures 6.15 and 6.16 provides the result of the descriptive statistics performed concerning the
views of teachers from schools in group A and B about the performance of the classrooms used
for this study in terms daylighting. The result of the descriptive statistics in respect to the
performance of classrooms of public schools used for this study in terms of daylighting showed
that; a high percentage of the respondents from schools in group A (67.7%) and B (78.8%)
indicated that the amount of daylighting in classrooms of their school is moderate. The result
from the surveys reported in this subsection agrees with the result of the subjective evaluation
10.4
73.4
0
16.1
0
10
20
30
40
50
60
70
80
too high moderate Too low I dont know
6.7
67.4
0.7
25.2
0
10
20
30
40
50
60
70
80
too high moderate Too low I dont know

143
of daylighting levels reported from the field experiments documented in chapter 5(section
5.2.2). It was reported in chapter 5(section 5.2.2) that none of the sample of pupils utilised for
the field experiments indicated daylighting levels in classrooms is too high or too low.
Additionally, two reasons that may account for why the daylighting levels in the classrooms of
public schools in Minna seems adequate from the results of the field surveys are outlined below.
1. Availability of reasonable amount of daylight from the sun at most time of the year as the
site of this field work is located within the tropics.
2. Availability of windows on two sides of the longest walls of the classrooms, see Figure 4.1
in chapter 4 for the position of windows in the classrooms.
Figure 6.15. Result of the descriptive statistics from respondents in group A with respect to the
performance of classrooms in public schools of Minna in terms of daylthing .
Figure 6.16. Result of the descriptive statistics from respondents in group B with respect to the
performance of classrooms in public schools of Minna in terms of daylthing .
8.9
69.3
0
21.9
0
10
20
30
40
50
60
70
80
too high moderate Too low I dont know
4.4
78.5
0
17.1
0102030405060708090
too high moderate Too low I dont know

144
6.10.4 Result: teachers’ views about the performance the classrooms in the schools used for this study in terms of air flow
Result of the descriptive statistics performed concerning the views of teachers from schools in
group A and B about the performance of the classrooms used for this study in terms Airflow
are shown in Figures 6.17 and 6.18. The result of the descriptive statistics in Figures 6.17 and
6.18 shows that most of respondents from schools in group A (71%) and B (63.7%) indicated
by their responses that the air flow in classrooms of their schools is too low during the period
of the field surveys (March-April 2017). The findings here suggest that air flow in classrooms
of public schools in Minna during the peak months of hot season in Nigeria could be low. The
Findings as regards the level of air flow reported in this subsection may contribute to why the
air temperature reads as much as 360C in classrooms when the thermal comfort and productivity
of the respondents (teachers) were evaluated at the field surveys conducted between March and
April 2017.
Figure 6.17.Result of the descriptive statistics from respondents in group A with respect to the
performance of classrooms in public schools of Minna in terms of airflow.
Figure 6.18. Result of the descriptive statistics from respondents in group B with respect to the
performance of classrooms in public schools of Minna in terms of airflow.
0
12.5
71.4
16.1
0
10
20
30
40
50
60
70
80
Too high moderate Too low I don’t know
0.7
16.3
63.7
19.3
0
10
20
30
40
50
60
70
Too high moderate Too low I don’t know

145
6.11 Chapter summary
Findings from the field surveys with teachers in this study reported in this chapter suggest that
naturally occurring indoor air temperature of 360C can affect the thermal comfort of teachers in
public schools of Minna to a large extent. Also, results in this chapter suggest that there is no
significant gender difference in the thermal comfort of the teachers (respondents) when their
thermal comfort were assessed at indoor air temperature of 27.7 0C (low temp) and 360C (high
temp). This is probably because the male and female teachers (respondents) used for the field
surveys in this study dressed in clothing with similar insulation values of approximately 0.56
clo.
Furthermore, there is evidence from the result documented in this chapter that the perceived
productivity votes used to assess the productivity of the respondents (teachers) was significantly
higher at indoor air temperature of 27.7 0C (low temp) in comparison to 360C (high temp).This
result indicates that that the respondents used for the field surveys perceived that their
productivity is likely to be significantly higher at a lower indoor air temperatures of about
27.70C in comparison a relatively high indoor air temperatures of about 360C.
As well, results reported from the field surveys with teachers in this chapter suggest that
sleepiness, tiredness, restlessness and displeasure to do classwork are symptoms’ that pupils
often show when indoor air temperatures turns hot in classrooms. This result suggest some of
the mechanism by which high air temperature affects the performance of task.
Lastly, results from the field surveys with teachers in this chapter shows that indoor air
temperature is the most problematic environmental factor with respect to its effect on the work
of teachers and pupils in schools, this in comparison to noise and daylighting.

146
Chapter 7. Analysis from the building performance simulation
7.1 Introduction
With respect to the method described in chapter 3 (subsection 3.7.3), this chapter presents the
analysis from the building performance simulation of a typical sample of classroom used for
this study. The simulation was performed using IESVE software version 2018. The rationale
for using a typical classroom for carrying out the building performance simulation in this study
is provided in section 7.1 of this chapter while the limitation for the single simulation is
provided in section 9.2 in chapter 9. The output from the building performance simulation
reported in this chapter aims to predict the ranges of indoor air temperature that exist in the
classrooms of the schools used for this study for a whole academic year. In turn, the output
mentioned here was utilised in estimating the extent (duration) by which high air temperatures
could affect the performance pupils (samples) over an academic year. The reason for estimating
the effect of air temperature over a whole academic year is because, the pupils performance
were evaluated at specific indoor air temperatures at a particular point in time during the field
work of this study. Furthermore, other outputs from the building performance simulation were
utilised for the following:
a) To validate the ranges of indoor air temperature used to measure the thermal comfort and
performance of pupils and teachers at the field experiments and field surveys in this study.
b) To discount the effect of CO2 on the results concerning the effect of indoor air temperature
on the health and academic performance of the sample of pupils used for the field
experiments in this study.
As well, the analysis from the building performance simulation identifies the building
component that is likely to contribute most to heat gain and high indoor air temperatures with
respect to the fabric of the classrooms used for this study. Overall, the output from the building
performance simulation reported in this chapter aims to support the findings from the field
experiments and field surveys discussed in chapter 8 (discussion chapter).
7.2 The rationale for using a typical classroom for carrying out the building performance simulation.
The rationale for the use of a typical classroom model for conducting the building performance
simulation in this study is that; evidences from the physical surveys reported in chapter 4
(section 4.2) suggests that the classrooms of the schools used for this study were built as
prototypes. This means that the classrooms are similar in terms of design (e.g. shape, size,
landscape, building components and materials. Another rationale for using a typical classroom

147
model for conducting the building performance simulation in this study is as follows. Analysis
from the building performance simulation reported in Table 7.1, 7.2 and Figure 7.1suggests that
the average hourly indoor air temperature during daily occupancy periods for 180 school days
differs only very slightly with about 0.320C, this even when the classrooms are orientated with
their front side facing different cardinal points,. The 180 school days mentioned here covers:
60 school days between September- December (first term); 60 school days between January-
April, (second term) 60 school days between May-July (third term).
Table 7.1.Values of mean hourly indoor air temperatures for 180 school days in a typical
classroom used for this study during occpancy and non occupancy periods .
Table 7.2. Values of mean hourly indoor air temperatures for 180 school days during daily
occupancy period(07.30- 13.30) for a typical classroom used for this study as deduced from
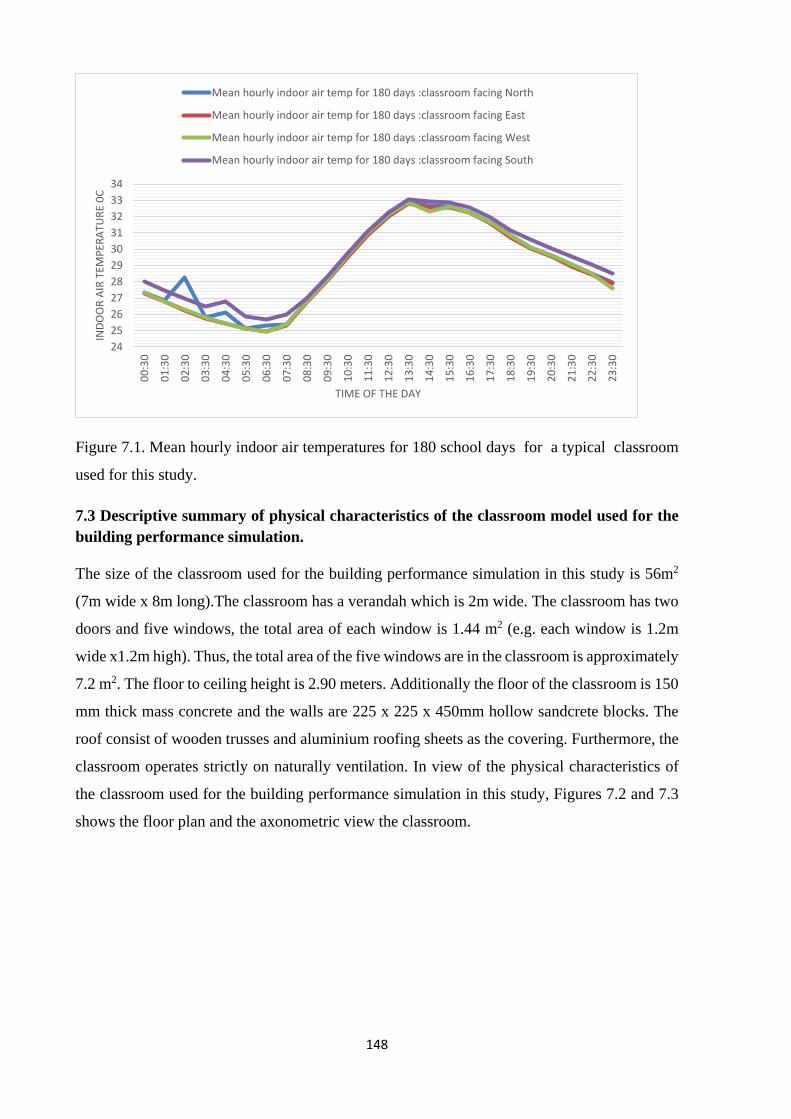
148
Figure 7.1. Mean hourly indoor air temperatures for 180 school days for a typical classroom
used for this study.
7.3 Descriptive summary of physical characteristics of the classroom model used for the building performance simulation.
The size of the classroom used for the building performance simulation in this study is 56m2
(7m wide x 8m long).The classroom has a verandah which is 2m wide. The classroom has two
doors and five windows, the total area of each window is 1.44 m2 (e.g. each window is 1.2m
wide x1.2m high). Thus, the total area of the five windows are in the classroom is approximately
7.2 m2. The floor to ceiling height is 2.90 meters. Additionally the floor of the classroom is 150
mm thick mass concrete and the walls are 225 x 225 x 450mm hollow sandcrete blocks. The
roof consist of wooden trusses and aluminium roofing sheets as the covering. Furthermore, the
classroom operates strictly on naturally ventilation. In view of the physical characteristics of
the classroom used for the building performance simulation in this study, Figures 7.2 and 7.3
shows the floor plan and the axonometric view the classroom.
2425262728293031323334
00:3
0
01:3
0
02:3
0
03:3
0
04:3
0
05:3
0
06:3
0
07:3
0
08:3
0
09:3
0
10:3
0
11:3
0
12:3
0
13:3
0
14:3
0
15:3
0
16:3
0
17:3
0
18:3
0
19:3
0
20:3
0
21:3
0
22:3
0
23:3
0
INDO
OR
AIR
TEM
PERA
TURE
0C
TIME OF THE DAY
Mean hourly indoor air temp for 180 days :classroom facing North
Mean hourly indoor air temp for 180 days :classroom facing East
Mean hourly indoor air temp for 180 days :classroom facing West
Mean hourly indoor air temp for 180 days :classroom facing South

149
Figure 7.2.The plan of the block of classroom used for the building performance
simulation
Figure 7.3.The axonometric view of the block of classroom used for the building performance
simulation

150
7.4 Estimation of the extent to which pupils (samples) do academic task under indoor air temperatures that are outside the ranges that could affect their performance in classrooms over an academic year.
Figure 7.4 shows the mean hourly indoor and outdoor air temperature for 180 school days
spanning the three terms of an academic year in the classrooms of the sample of public schools
used for this study. From Figure 7.4, it could be deduced that pupils in public schools of Minna
could be studying above indoor air temperatures that have been identified by authors to negate
the performance of academic tasks (Kevan and Howes, 1980; Wargocki and Wyon, 2007; Park,
2016; Porras‐Salazar et al., 2018).These authors identified that pupils are likely to perform
better in schools when they do tasks within air temperatures of 20-250C .Furthermore, it could
be inferred from Figure 7.4 that between 7.30am-13.30pm (6 hours), the study samples (pupils)
may be learning for an average of 5 hours each school day above indoor air temperatures that
may affect their academic performance. 7.30am-13.30pm is the daily occupancy period in the
sample of schools used for this study.
By extension, the findings reported from the building performance output in Figure 7.4 suggest
that the effect of indoor air temperature on the academic performance of pupils reported from
the results of the field experiments in chapter 5 may still occur in the three terms of a school
year. This is mainly because Figure 7.4 shows that pupils do learn in classrooms of public
schools in Minna at indoor temperatures that reads well above the thresh hold for pupils
performance.
Figure 7.4.Mean hourly indoor and out door air temperatures in the sample of schools used for
this study.
202122232425262728293031323334
00:30
01:30
02:30
03:30
04:30
05:30
06:30
07:30
08:30
09:30
10:30
11:30
12:30
13:30
14:30
15:30
16:30
17:30
18:30
19:30
20:30
21:30
22:30
23:30
Mean hourly indoor air temperature for 180 school days
Mean hourly out door air temperature for 180 school days
Upper threshold for pupils’ performance
Lower threshold for pupils’ performance

151
7.5 Comparison between the measured indoor air temperatures at the field work with that of the building performance simulation.
Table 7.3 shows the summary of the comparison between the indoor temperatures measured in
the classrooms during the field survey of teachers in March with that from the building
performance simulation output. In summary, Table 7.3 shows that the indoor air temperatures
utilised for evaluating the thermal comfort and productivity of teachers (respondents) at the
field surveys in this study tends to correspond with indoor air temperatures obtained from the
building performance simulation carried out in this study. Overall, the result in Table 7.3
suggests that the outputs from building performance simulation reported in this chapter can be
reliable as the difference between the measured and the simulated data in Table 7.3 is relatively
small (difference of less than 5% and 1.40C).
Variables Indoor Air temperature
Differences between the measured indoor air temperature and that from the building performance simulation output
Average indoor air temperature in the classrooms between 8.30-9.30am measured during the field survey with teachers in March
27.70C 4.9%
Average indoor air temperature in a typical classroom between 8.30-9.30am in March from the simulation output
29.10C
Average indoor air temperature in the classrooms between 12.30-1.30pm measured during the field survey with teachers in March
36.00C 2.7%
Average indoor air temperature in a typical classroom between 12.30-1.30pm in March from the simulation output.
35.020C
Table 7.3. Summary of the comparison between the indoor air temperature measured at the
field work and that of the building performance simulation.
7.6. The ranges of air temperatures in the classrooms used for this study during exam periods in the three academic terms.
With respect to the output from the building performance simulation in this study, Figures 7.5
to 7.7 shows the indoor air temperatures for school days during the examinations periods in the
three academic terms of a year. Each Figure shows the indoor air temperature for 10 school
days towards the end of a term. Pupils usually take exams within two weeks (10 school days)
before the end of each term in public schools of Minna.

152
Figure 7.5.The ranges of air temperatures in the classroom of public schools in Minna for 10 school days corresponding to the first term examination periods around early December. (07.30am – 13.30pm is the daily occupancy period for pupils)
Figure 7.6.The ranges of air temperatures in the classroom of public schools in Minna for 10 school days corresponding to the second term examination periods around early April. (07.30am – 13.30pm is the daily occupancy period)

153
Figure 7.7.The ranges of air temperatures in the classroom of public schools in Minna for 10
school days corresponding to the third term examination period around the end of July.
(07.30am – 13.30pm is the daily occupancy period).
Drawing on Figures 7.5-7.7 above, Figure 7.5 suggests that the range of air temperatures within
the occupancy period (07.30am -13.30pm) in the classrooms of public schools in Minna during
the first term examination periods (early December) could read approximately between 24-250C
in the mornings (7.30 am) and 29.7- 34.0C in the afternoons (13.30pm).
Also, Figure 7.6 shows that the range of indoor air temperatures within the occupancy period
(07.30am -13.30pm) around the second term examination periods (early April) could be in the
range of approximately 28-310C in the mornings (07.30 am) and 34-370C in the afternoons
(13.30pm).
Lastly, Figures 7.7 suggests that the range of air temperatures within the occupancy period
(07.30am -13.30pm) in the classrooms of public schools in Minna around the third term
examinations periods (end of July) is approximately in the range of 23.5-280C in the mornings
(7.30 am) and 26-340C in the afternoons (13.30pm).
On the whole, the findings from the indoor air temperature readings in Figures 7.5-7.7 tends to
show that pupils in public schools of Minna usually sit for examinations at periods when the
indoor air temperatures reads up to 100C higher than what the World Health Organisation
(WHO, 1984) specifies for the indoor thermal comfort and wellbeing of humans indoors. WHO
(1984) specifies air temperature range of 180C to 240C thermal comfort and health of humans

154
as cited in Ormandy and Ezratty (2012).Furthermore, the findings as regards the ranges of
indoor air temperatures reported from the simulation output in Figures 7.5-7.7 proposes that
pupils in public schools of Minna do sit for examinations when air temperatures in classrooms
reads well over the ranges that have been recommended by some researchers for optimum gain
in performance of tasks in schools.
By and large, the ranges of indoor temperatures estimated from Figures7.5-7.7 suggest that; the
thermal comfort and academic performance of pupils in public schools of Minna can be affected
during examination periods. Examination is a very important measure of determining pupils
learning achievement in Nigeria.
Adding to the results reported from Figures 7.5-7.7 above, simulation outputs in Appendix L-
U further poses that the indoor air temperatures during occupancy periods in the classrooms of
public schools Minna is usually high most schools terms of the year.
7.7 The CO2 concentration levels in classroom
With respect to the results from the building performance simulation performed in this study,
Figures 7.8 – 7.10 shows the CO2 concentration levels in a classroom for a month in each
academic term in public schools of Minna. The results in Figures 7.8, 7.9 and 7.10 tends to
show that when the pupils are not in the classroom (e.g. before7.30 am and after 1.30 pm) the
CO2 concentration levels in the classrooms is centered about 400ppm. However, during
occupied hours 7.30 am-1.30pm the Figures suggest that the CO2 levels usually increases from
400 -600 ppm. This suggests that the CO2 level in the classrooms usually increases when the
pupils occupy the classrooms , similar trend has been reported by Kukadia et al.(2005) as cited
in DfES (2006b) .
From the data concerning the CO2 levels in Figures 7.8, 7.9 and 7.10 , it could be deduced that
the CO2 concentration levels in the classrooms of public schools in Minna is centred around
400 - 600 ppm during occupied hours in the three school terms of a year. To conclude, the
results here proposes that the CO2 concentration levels in the classrooms of public schools used
for this study are within the levels required in classrooms as recommended by Education &
Skills Funding Agency (2018) and ASHRAE 62 (2010).Education & Skills Funding Agency
(2018) specifies that the CO2 in classrooms should not exceed 1000 -1500 ppm. ASHRAE
(2010) recommends that the indoor CO2 levels should not exceed 1030ppm.
By extension, the findings as regards the levels of CO2 reported from the output of the building
performance simulation above suggest that the results concerning the effect of indoor air

155
temperature on the health and academic performance of pupils earlier reported in chapter 5
(section 5.4 and 5.5) is not affected by the CO2 levels in the classrooms used this study.
Figure 7.8. The ranges of CO2 concentration levels in a classroom of public schools in Minna
for school days in October (part of first term)
Figure 7.9.The ranges of CO2 concentration levels in a classroom of public schools in Minna
for school days in February (part of second term)
0100200300400500600700
00:3
0
01:3
0
02:3
0
03:3
0
04:3
0
05:3
0
06:3
0
07:3
0
08:3
0
09:3
0
10:3
0
11:3
0
12:3
0
13:3
0
14:3
0
15:3
0
16:3
0
17:3
0
18:3
0
19:3
0
20:3
0
21:3
0
22:3
0
23:3
0CO2
conc
entr
atio
n (p
pm)
Time of the day
school day school day school day school day school day school day
school day school day school day school day school day school day
school day school day school day school day school day school day
school day school day school day
0100200300400500600700
00:3
0
01:3
0
02:3
0
03:3
0
04:3
0
05:3
0
06:3
0
07:3
0
08:3
0
09:3
0
10:3
0
11:3
0
12:3
0
13:3
0
14:3
0
15:3
0
16:3
0
17:3
0
18:3
0
19:3
0
20:3
0
21:3
0
22:3
0
23:3
0
C02
conc
entr
atio
n (p
pm)
Time of the day
school day school day school day school day school day
school day school day school day school day school day
school day school day school day school day school day
school day school day school day school day school day
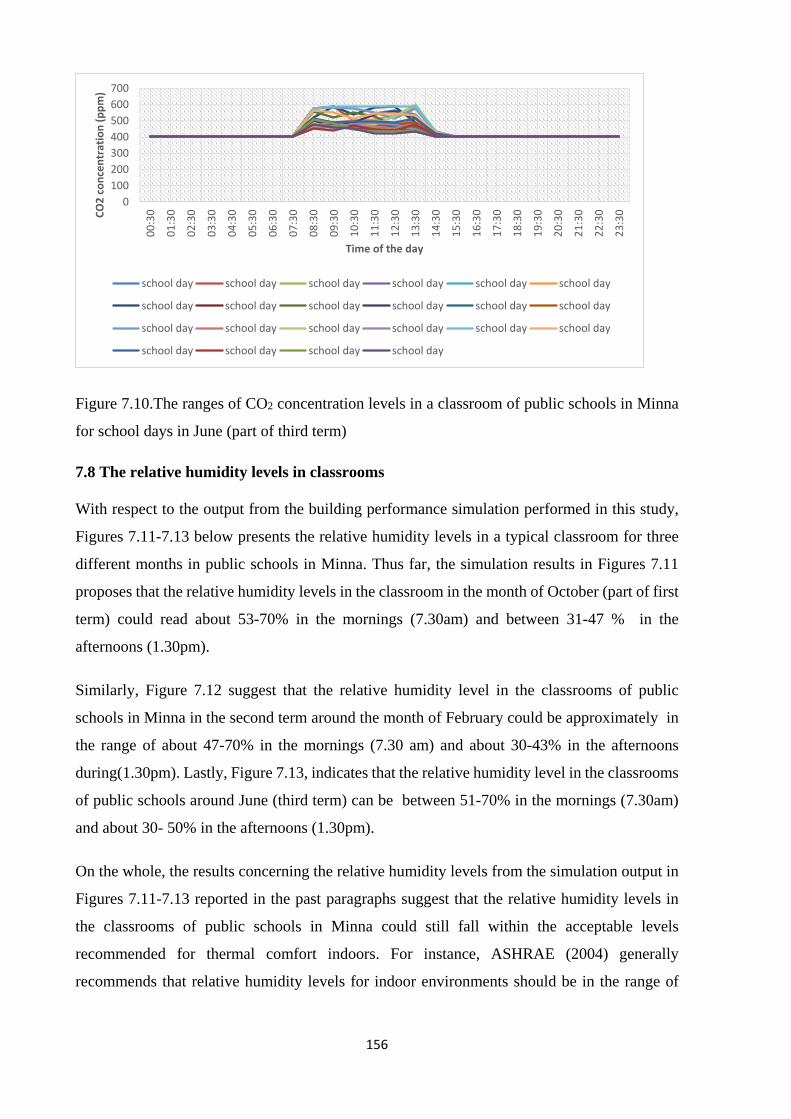
156
Figure 7.10.The ranges of CO2 concentration levels in a classroom of public schools in Minna
for school days in June (part of third term)
7.8 The relative humidity levels in classrooms
With respect to the output from the building performance simulation performed in this study,
Figures 7.11-7.13 below presents the relative humidity levels in a typical classroom for three
different months in public schools in Minna. Thus far, the simulation results in Figures 7.11
proposes that the relative humidity levels in the classroom in the month of October (part of first
term) could read about 53-70% in the mornings (7.30am) and between 31-47 % in the
afternoons (1.30pm).
Similarly, Figure 7.12 suggest that the relative humidity level in the classrooms of public
schools in Minna in the second term around the month of February could be approximately in
the range of about 47-70% in the mornings (7.30 am) and about 30-43% in the afternoons
during(1.30pm). Lastly, Figure 7.13, indicates that the relative humidity level in the classrooms
of public schools around June (third term) can be between 51-70% in the mornings (7.30am)
and about 30- 50% in the afternoons (1.30pm).
On the whole, the results concerning the relative humidity levels from the simulation output in
Figures 7.11-7.13 reported in the past paragraphs suggest that the relative humidity levels in
the classrooms of public schools in Minna could still fall within the acceptable levels
recommended for thermal comfort indoors. For instance, ASHRAE (2004) generally
recommends that relative humidity levels for indoor environments should be in the range of
0100200300400500600700
00:3
0
01:3
0
02:3
0
03:3
0
04:3
0
05:3
0
06:3
0
07:3
0
08:3
0
09:3
0
10:3
0
11:3
0
12:3
0
13:3
0
14:3
0
15:3
0
16:3
0
17:3
0
18:3
0
19:3
0
20:3
0
21:3
0
22:3
0
23:3
0CO2
conc
entr
atio
n (p
pm)
Time of the day
school day school day school day school day school day school day
school day school day school day school day school day school day
school day school day school day school day school day school day
school day school day school day school day

157
40% to 60 %. Also, as cited in CIBSE (2006) relative humidity levels below 30 % are still
acceptable indoors.
Figure 7.11.The ranges of humidity levels in a classroom of public schools in Minna for school
days in October (First term)
Figure 7.12. The ranges of humidity levels in a classroom of public schools in Minna for school
days in February (part of second term)

158
Figure 7.13.The ranges of humidity levels in a classroom of public schools in Minna for school
days in June (part of third term)
7.9 The component of the simulated classroom model that is likely to contribute most to elevated air temperatures indoors
7.9.1 The U values of the components of the classroom.
Table 7.4 shows the construction materials of the classrooms and their U values as obtained
from the output of the building performance simulation performed in this study. The results
concerning the U values in the Table 7.4 shows that the roof of the classroom have the highest
U values, while the floor has the lowest. To conclude, the findings from the result in Table 7.4
suggest that the roof of the classrooms of public schools in Minna has the have the highest
potential of contributing to indoor heat gain and elevated indoor air temperatures in comparison
with other components that make up the envelope of the classrooms. This is because the higher
the U value of a building component the higher the rate of transmission of heat flow.
Material Description U values (W/m2 K) Roof covering 0.55mm long span corrugated aluminium roofing sheets 7.14 Ceiling 5mm thick hard board ceiling 4.19 Walls 225 x225 x450 mm hollow sandcrete blocks finished with
25mm cement/ sand plaster internally and externally
1.79
Floor 150 mm thick concrete floor finished with 25mm terrazzo 0.37 Windows 1.2wide x1.2 high metal casement windows (5 mm thick
metal sashes) 5.62
Doors doors 1.2 m wide x 2.1high double hinged metal doors (5mm thick metal door leaves
5.87
Table 7.4.U values of the materials that make up the envelope of a typical classroom used for
this study from the simulation output in this study.
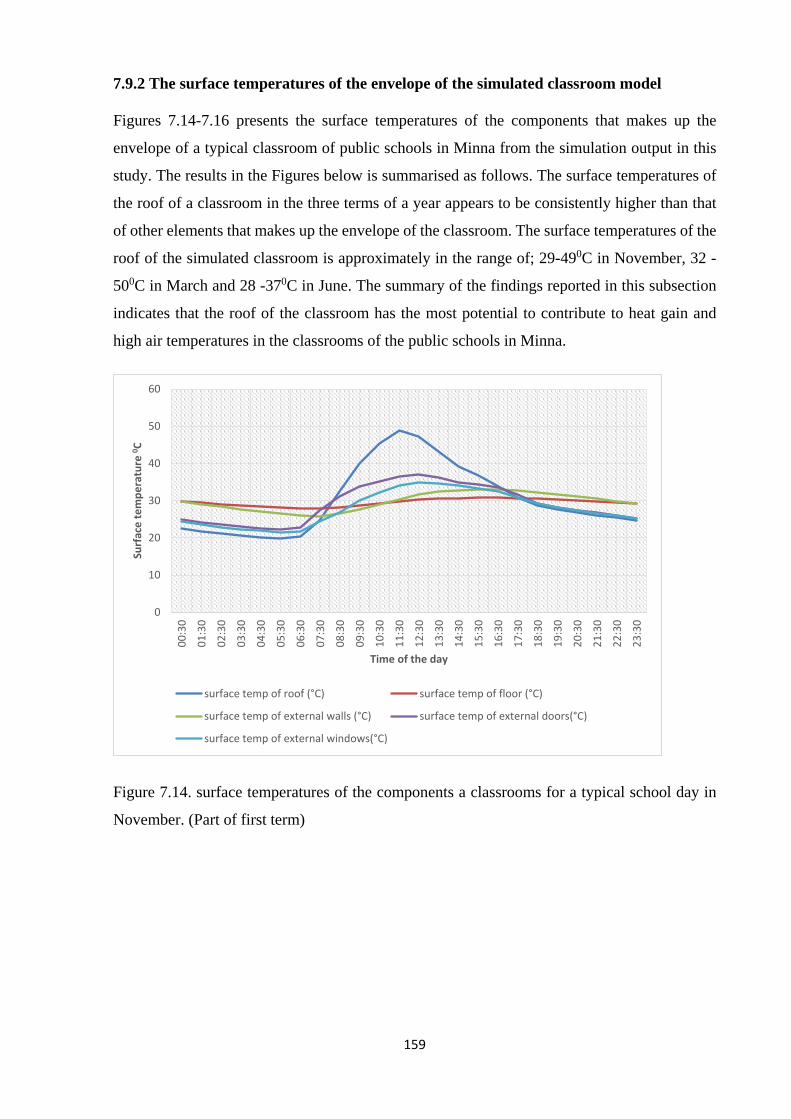
159
7.9.2 The surface temperatures of the envelope of the simulated classroom model
Figures 7.14-7.16 presents the surface temperatures of the components that makes up the
envelope of a typical classroom of public schools in Minna from the simulation output in this
study. The results in the Figures below is summarised as follows. The surface temperatures of
the roof of a classroom in the three terms of a year appears to be consistently higher than that
of other elements that makes up the envelope of the classroom. The surface temperatures of the
roof of the simulated classroom is approximately in the range of; 29-490C in November, 32 -
500C in March and 28 -370C in June. The summary of the findings reported in this subsection
indicates that the roof of the classroom has the most potential to contribute to heat gain and
high air temperatures in the classrooms of the public schools in Minna.
Figure 7.14. surface temperatures of the components a classrooms for a typical school day in
November. (Part of first term)
0
10
20
30
40
50
60
00:3
0
01:3
0
02:3
0
03:3
0
04:3
0
05:3
0
06:3
0
07:3
0
08:3
0
09:3
0
10:3
0
11:3
0
12:3
0
13:3
0
14:3
0
15:3
0
16:3
0
17:3
0
18:3
0
19:3
0
20:3
0
21:3
0
22:3
0
23:3
0
Surf
ace
tem
pera
ture
0 C
Time of the day
surface temp of roof (°C) surface temp of floor (°C)
surface temp of external walls (°C) surface temp of external doors(°C)
surface temp of external windows(°C)

160
Figure 7.15.The surface temperatures of the components a classroom for a typical school day
in March (part of second term).
Figures 7.16. Surface temperatures of the components of classrooms for a typical school day in
June ( part of third term).
7.10 Chapter summary
Results from the building performance simulation in this study has been reported in the past
sections and subsections of this chapter, the summary is presented in this section as follows:
0
10
20
30
40
50
60
00:3
0
01:3
0
02:3
0
03:3
0
04:3
0
05:3
0
06:3
0
07:3
0
08:3
0
09:3
0
10:3
0
11:3
0
12:3
0
13:3
0
14:3
0
15:3
0
16:3
0
17:3
0
18:3
0
19:3
0
20:3
0
21:3
0
22:3
0
23:3
0
surface temp of roof (°C) surface temp of floor (°C)
surface temp of external walls (°C) surface temp of external doors(°C)
surface temp of external windows(°C)
0
5
10
15
20
25
30
35
40
00:3
001
:30
02:3
003
:30
04:3
005
:30
06:3
007
:30
08:3
009
:30
10:3
011
:30
12:3
013
:30
14:3
015
:30
16:3
017
:30
18:3
019
:30
20:3
021
:30
22:3
023
:30
Surf
ace
tem
pera
ture
0 C
Time of the day
surface temp of roof (°C) surface temp of floor (°C)
surface temp of external walls (°C) surface temp of external doors(°C)
surface temp of external windows(°C)

161
Findings from the building performance simulation in this study suggest that there is no
remarkable effect of orientation on the indoor air temperature of naturally ventilated schools in
Minna. This because results from the simulation in section 7.2 shows that for 180 school days
the indoor air temperature in the classrooms used for this study do not vary remarkably, even
when the classrooms are orientated facing the four different cardinal points.
Broadly, the ranges of indoor air temperatures in the classrooms of public schools reported from
the building performance simulation in this chapter poses that the indoor air temperatures reads
well above the 20-240C suggested by some authors for the optimum performance of tasks
indoors (Kevan and Howes, 1980; Seppanen et al., 2006; Wargocki and Wyon, 2007).
Furthermore, results from the building performance simulation suggests that the range of air
temperatures that can be found in the naturally ventilated classrooms of public schools in Minna
all year round could read well above the recommended ranges suggested by WHO (1984) for
indoor thermal comfort and wellbeing of human indoors. By extension, the results reported in
this paragraph suggest that the effect of high air temperature on the thermal comfort and
performance of the samples reported in chapter 5 in this study may extend (applicable) all year
round.
Also, results from the building performance simulation reported in this chapter suggest that the
ranges of CO2 concentration that can be found in the naturally ventilated classrooms of public
schools in Minna are within 400-600ppm during the occupancy periods in the three academic
terms of a year. These ranges (400-600ppm) are still within the recommended CO2 ranges
specified for indoor environments by some standards, e.g. ASHRAE (2010). In sum, this results
suggest that CO2 is not an extraneous variable that imparted on the result concerning the effect
of indoor air temperature on the performance of pupils earlier reported in chapter 5 of this study.
(section5.5). Additionally, the results from the building performance simulation reported in this
chapter suggests that the relative humidity levels in the classrooms of public schools in Minna
during occupancy still falls within the acceptable humidity levels required for indoor
environments .
Lastly, results from the building performance simulation presented in this chapter shows that
the aluminium roofing sheet have the highest capability of contributing to heat gain and elevated
air temperatures in the classrooms of public schools in Minna. This is in comparison with the
other building components that make up the envelope of the classrooms of public schools in
Minna.

162
Chapter 8. Discussions of key findings
8.1 Introduction
This chapter discusses the key findings from the results in this study with respect to the aim and
objectives of this study earlier stated chapter 1. As well, the discussion in this chapters referred
to the analytical model in chapter 2 (section 2.8). In view of the introduction provided in this
section, find in the subsequent sections of this chapter the discussions of the key findings from
this study.
8.2 Effect of indoor air temperature on thermal comfort
As regards thermal comfort, the analytical model deduced from the literature review in chapter
2 of this study shows that indoor air temperature can affect the thermal comfort of persons
indoors. As well, statistical evidence from the results of the field experiments with pupils
reported in chapter 5(5.3) shows that the air temperature of 34.5 0C (high temp) significantly
affected the thermal comfort of the samples (pupils) .This result implies that as the indoor air
temperatures in the classrooms used for the experiments increased from 25.60C (low temp) to
34.5 0C (high temp) , the thermal sensation of the samples from the 11 schools used for this
study also significantly increased from the state of being thermally comfortable to
uncomfortable. Equally, the significant effect of indoor air temperature of 34.5 0C on the
thermal comfort of pupils reported in chapter 5 of this study is consistent with the findings from
the field surveys with teachers reported in chapter 6 (section 6.7) .The results from the field
surveys with teachers shows that in comparison to 27.7 0C (low temp) the air temperature of 36 0C (high temp) significantly affected the thermal comfort of the respondents (teachers) used
field surveys.
Interestingly, the effect size of the indoor air temperature of 34.5 0C on the thermal comfort of
the pupils reported in this study corresponds with the effect size of the indoor air temperature
of 36 0C on the thermal comfort of teachers (respondents) reported in this study. The effect
size of the indoor air temperature of 34.5 0C on the thermal comfort of pupils reported from the
field experiments is large (d= 2.0) with respect to Cohen (1998): similarly, the effect size of
the indoor air temperature of 36. 0C reported from the field surveys with teachers is large (r
=0.10).Effect sizes with Cohens d value above 0.80 is considered to be large, Cohen (1998).The
large effect sizes reported here suggest that the indoor air temperature in the classrooms of
public schools in Minna have the potentials to affect the thermal comfort of the users to a large
extent.
By extension, the negative effect of indoor high air temperature on the thermal comfort of pupils
and teachers reported in this study and earlier discussed above suggests the following:

163
1. That passive design features cannot moderate the indoor air temperatures in the classrooms
of public schools in Nigeria to suit the thermal comfort of the pupils who take lessons in
them right through a school day (7.30am to 1.30 pm).
2. That the air temperatures in the naturally ventilated schools provided for pupils to learn in
public schools of Minna reads higher than 180C to 240C suggested by World health
Organisation (WHO) for thermal comfort and wellbeing of human beings indoors.
Broadly, the results concerning the negative effect of the indoor air temperature on the thermal
comfort of teachers and pupils observed in this study and earlier reported in this section are in
good agreement with the works of Lan et al. (2011) and Cui et al. (2013). The authors reported
that the air temperatures of 300C and 320C respectively affected the thermal comfort of the
subjects used for their study. Also, the result concerning the negative effect of the indoor air
temperature on the thermal comfort observed and reported in this study resonates the following.
1. The hypothesis that there is a positive correlation between indoor air temperature and
thermal discomfort Humphreys, (1977).This means as indoor air temperature increases
thermal discomfort is likely to be on the increase.
2. The principle of thermoregulation, which tend to suggest that when the amount of heat gain
by a person is greater than that dissipated, thermal discomfort is likely to occur if the body
fails to physiologically restore thermal comfort. (Fanger 1973; Parsons 2002; Auliciems and
Szokolay (2007).
Furthermore, a number of reasons from the results of the physical survey of schools reported in
chapter 4 and the building performance simulation in chapter 7 may provide some idea behind
why the indoor air temperatures in the schools used for this study reads as high as 360C which
may have contributed to the significant effect reported on the thermal comfort of pupils and
teachers in this study. These reasons are:
a) Findings from the physical surveys indicates that the classrooms of the public schools used
for this study have no mechanical means of moderating the air temperatures in the
classrooms.
b) Evidence from the physical surveys of classrooms showed that the roofing sheets used for
the classrooms is made from Aluminium. This material (Aluminium) have huge potentials
to promote heat gain and elevated indoor air temperatures.
c) Findings from the physical surveys of classrooms showed that insulation panels were not
installed beneath the aluminium roofing sheets to curtail heat gain into the interior spaces.

164
d) There was evidence from the physical surveys of classrooms that indicates that the spaces
beneath the roof of the classrooms are not ventilated.
e) Results from the physical surveys of classrooms shows that the percentage of window to
floor area ratio was observed to relatively small in comparison to that suggested for
effective ventilations in tropical buildings.
f) Analysis from the building performance simulation suggests that the aluminium roofing
sheet used as the roof covering of the classrooms has the most potential of contributing to
heat gain in comparison to other building components that makes up the envelope of the
classrooms, Figure 7.14.
As well, it could be deduced that the negative effect of indoor air temperature on the thermal
comfort of pupils and teachers reported in this study may not be limited to the period when the
thermal comfort of the samples were assessed at the field experiments and field surveys , but
over most school periods of the year. This is because findings from the building performance
simulation in Figure 7.1 and 7.4 suggest that the air temperatures in the classrooms of the
schools used for this study is often high all year round.
Adding to the results discussed above, findings from the field experiments with pupils in this
study suggests that there is no significant difference in the effect of indoor air temperatures of
25.60C on thermal comfort of the boys and that of the girls used as samples. In contrast, there
was significant difference observed in the thermal comfort of the boys and girls used as samples
when their thermal comfort were assessed at 34.50C at the field experiments. The significant
difference observed in the thermal comfort of boys and girls reported here is probably due to
the idea that; some of the girls used as samples wore school uniform with clo values higher
than that of the boys when their thermal comfort were assessed at the field experiments. At the
field experiments the sample of boys wore uniform with clo value of approximately 0.5 while
some of the sample of girls wore uniform with clo value of approximately 0.8. See Figure 5.4,
chapter 5 for clo values of the school uniform worn by sample of pupils.
However, when it comes to the respondents (sample of teachers), finding in this study shows
that there is no significant difference observed in the thermal comfort of the male and female
respondents when their thermal comfort were evaluated at 27.7 (low temp) and 360C (high
temp).This findings may be attributed to the fact that at the field surveys, the male and female
respondents dressed in similar clo values of approximately 0.56. Refer to section 6.4 chapter 6
for the clo values worn by the respondents used for the field surveys.

165
Taken together, the findings concerning gender difference in thermal comfort discussed in the
in this section suggest that provided male and female put on similar clothing insulation values,
there is likely to be no significant gender difference in thermal comfort conditions between
males and females due to physiological reason. Nevertheless, if any gender difference is
observed in a thermal comfort study, it could be attributed to differences in clo values (clothing
insulation values) worn by the male and female samples or differences in activity performed by
the samples. The author tends to agree with the findings regarding gender reported here, this
because a female that is dressed in a thick trouser suit with inner wear is likely to feel thermally
dissatisfied in a hot environment than a male that is wearing a short pant and a light T- shirt in
the same hot environment.
Widely, the findings concerning gender differences in thermal earlier discussed in this section
tends to align with the findings reported by some of the authors reviewed in this study (e.g.
Fanger 1973; Wong et al. 2009;Hwang and Chen, 2009; Liu et al. 2011). Their findings suggests
that, provided males and females put on clothing with similar clo insulation values, there is
likely not to be any significant difference in their thermal comfort due to physiological
differences.
8.3 Effect of indoor air temperature on health
Results from the field experiments with pupils in this study shows that when the health of the
samples (pupils) were evaluated at 34.50C (high temp), the symptoms of thirst, sweating and
displeasure to do classwork significantly increased in comparison to 25.60C (low temp). This
result has some resemblance with the findings from the field surveys with teachers reported in
this study. Teachers indicated by their views from the results of the fields surveys that pupils
often exhibit symptoms of tiredness, sleepiness and displeasure to do classwork when the indoor
air temperature turns hot in classrooms.
Surprisingly, results from the field experiments with pupils reported in this study shows that
the samples (pupils) did not significantly exhibit symptoms of headache and tiredness when
their health were assessed at high air temperature of 34.50C at the field experiments. Headache
is a symptom commonly associated with high air temperatures. One reason that may account
for why the samples (pupils) did not exhibit symptoms of headache and tiredness at high air
temperature may be based on the idea that the samples knew that they were taking part in an
experiment, as such they may have adapted physiologically to annul the effect of tiredness and
headache in order not to be excluded from participating in the experiments.

166
On the whole, the findings from the result of the field experiments with pupils and the field
surveys with teachers earlier reported in the first paragraph of this section proposes that raised
indoor air temperatures have the potentials to affect the health of pupils in public schools of
Minna. The results concerning the effect of indoor air temperature on the health of the samples
discussed on this section is in alignment with the analytical model deduced form the literature
review in section 2.8, Figure 2.13 of this study. The analytical model deduced from the literature
review in this study shows that indoor air temperature can affect the health of persons.
Furthermore, findings concerning the negative effect of indoor air temperature of 34.50C on the
health of pupils discussed in this section may account for one of the reasons behind why
CIBSE (2006A) recommends that operative temperature in classrooms should not exceed 250C
most occupied times of the year. As well, the findings concerning the negative effect of indoor
air temperature on the health of the pupils reported in this study is likely not to be due the effect
of CO2. This is because evidence from the building performance simulation in chapter 7(7.7)
suggests that the CO2 levels in the classrooms used for the investigations in this study is within
the recommended standards for classrooms during occupied hours.
Broadly, the findings reported in this section concerning the relationship between high indoor
air temperature of 34.50C and the symptoms earlier mentioned in the first paragraph of this
section aligns with the findings from the studies of several authors (Jaakkola et al., 1989; Smith
and Bradley, 1994; Lan et al., 2011; Cui et al., 2013). For example, Lan et al. (2011) reported
that when the subjects used for their study became thermally uncomfortable at indoor air
temperatures of 300C they exhibited negative mood as well as symptoms of dry throat (thirst).
Similarly, Jaakkola et al. (1989) reported that the subjects used for their study experienced
increase in sensation of dryness (e.g. dry throat, dry nose and dry skin) as the indoor air
temperatures increased from 210C to 260C.
8.4 Effect of indoor air temperature on performance
In the area of the numerical (mathematics) based test, the results in chapter 5 shows that the
mean scores of the samples from the 11 schools significantly decreased at mean air temperature
of 34.50C (high temp) in comparison to 25.6 0C (low temp). This is in respect to when the
academic performances of the samples were assessed at the field experiments at 25.6 0C and
34.50C. The findings reported here suggest that there is a link between high indoor air
temperatures and the performance of numerical based tasks by children. The finding concerning
the effect of indoor air temperature reported here is in agreement with the analytical model
surmised from the literature review in this study. The analytical model in this study shows that

167
there is a link between indoor air temperature and performance of task. Additionally, the effect
size of the indoor air temperature of 34.50C on the pupils academic performance in mathematics
from the results of the field experiments reported in chapter 5 was observed to be small
(d=0.26). In practical terms small effect sizes are not trivial. (Kotrlik and Atherton, 2011).
Importantly, the result from the academic performance tests in mathematics observed in this
study and under discussion in this section can be reliable. This is because of two reasons.
Firstly, pre-informed by the analytical model in chapter 2, there was control for several basic
factors at each of the 11 field experiments conducted in this study. The factors controlled are:
noise, daylighting, ventilation, classroom density, emotions, hunger, and sickness)
Secondly, the result from the building performance simulation in chapter 7 suggest that the
classrooms used for the field experiments in this study meets the required level of C02 levels
recommended for schools. Therefore, it can be deduced that C02 is likely not to be a factor that
may not have influenced the significant effect as regards the mathematics test observed and
reported in this study.
Furthermore, two reasons presented in the next two paragraphs may account for the mechanism
behind how indoor temperature of 34.50C (high temp) significantly affected the academic
performances of the samples (pupils) used for this study in the area of mathematics.
Firstly, the result from the field experiments with pupils in this study discussed earlier in
section 8.1 showed that the samples (pupils) were thermally dissatisfied at air temperature of
34.50C when their academic performance were assessed at each of the field experiments
conducted at the 11 schools. This may have directly caused the samples to be distracted and
demotivated resulting to the significant performance decrement in mathematics reported in this
study.
Secondly, the result discussed in the past section (8.2) showed that the samples (pupils)
significantly exhibited symptoms of displeasure to do class work at 34.50C in comparison to
25.60C when their health were assessed at field experiments in this study. This may have
affected the pupils’ emotion (mood) directly, and indirectly leading to the significant decrease
in the academic performances of the samples in the mathematics test reported in this study.
Emotions have the potentials to influence teaching and learning outcomes. (Perkrum, 1994;
Robert, 1994; Blackmore et al. 2011).

168
Widely, the findings concerning the result of the academic performance test in mathematics
observed in this study and discussed in this section appears to be in agreement with the findings
from the studies of several authors (e.g. Peccolo 1962; Wyon 1969; Nelson et al 1984;
Wargocki and Wyon 2007).These authors reported significant performance decrement from the
results of their studies as a result of raised air temperatures .Also, the findings as regards the
significant negative effect of indoor air temperature on mathematics test reported in this study
is in good agreement with conclusions reached from a meta-analytic review by Pilcher et al,
(2002).The authors concluded from their study that temperatures of over 32.220C have the
potential to affect cognitive tasks. Additionally, the effect of indoor air temperature of 34.5 0C
on the academic performance test in mathematics observed in this study tends to strengthen the
hypotheses by Mendel and Heath (2004). They hypothesised that there is a link between indoor
environmental factors, health and performance.
By extension, the significant effect of indoor air temperature on the performance of
mathematics based tasks reported from the findings in this study suggests that the indoor air
temperatures in the natural ventilated classrooms used for learning in public schools of Minna
is not within the 20-250C suggested by some authors for the optimum performance of tasks
indoors (Kevan and Howes, 1980; Seppanen et al., 2006; Wargocki and Wyon, 2007). Also, a
practical implication of the negative effect of raised air temperature on performance that was
observed from the findings of this study suggest for the need of temperatures that will promote
the performance of academic task in classrooms of public schools in Minna.
In contrast to the result of the mathematics test earlier discussed in this section above, results
from the field experiments reported in chapter 5 shows that the academic performance (scores)
of the samples in the area of English language did not significantly differ between 34.5 0C and
25.60C. This result means that the average scores of the samples did not significantly change
when they took the English test at 25.60C (low temp) and 34.5 0C (high temp) at the field
experiments. In short, this study did not observe any significant negative effect of high indoor
air temperature on the performance of the samples (pupils) in the area of English language
based tasks. One reason may be attributed to why there was no significant effect reported as
regards the result of the English test reported in this study. The reason may be due to the idea
that the English language test administered to the samples at the field experiments in this study
consists of mostly questions that requires multiple choice answers. Questions with multiple
choice answers may not demand series of worked out steps and cognitive processes to arrive at
the answers, pupils (samples) could guess to arrive at the answers.

169
Generally, the result of the English language test reported from the findings observed in this
study is similar to the findings of Wyon (1975) and Karl (2005). These authors found no
significant difference in the academic performance of the subjects used for their studies due to
elevated indoor air temperatures. On the other hand, the findings concerning the English test
earlier reported in this section runs at odds with the conclusions reached by Pilcher et al,
(2002).The authors concluded from their meta- analytic review that elevated air temperatures
above 32.220C and low air temperature (less than 100C) generally have significant negative
effects on the performance of cognitive tasks.
Adding to the results of the mathematics and English test earlier discussed in this section, results
from this study suggest that the performance of mathematics and English language task by
pupils under relatively high indoor air temperature is likely not to be dependent on gender.
Furthermore, similar to the result of the mathematic test earlier discussed in this section,
findings from the field surveys with teachers (respondents) in this study shows that the
productivity of teachers is likely to be significantly affected by high indoor air temperature. By
extension, the result concerning high air temperature on the productivity of teachers discussed
here proposes that the teachers in the classrooms of public schools used for this study are likely
to teach qualitatively and quantitatively at relatively lower indoor air temperatures. The
practical application of the findings concerning the productivity of teachers under discussion
here is that if teachers are exposed to high air temperatures in classrooms, their ability to teach
qualitatively and quantitatively could be impaired. ‘Productivity’ refers to the ability to
qualitatively or quantitatively carry out a task or service (Leaman and Bordass, 1999).
On the whole, the results concerning the mathematics and English tests reported in this study
and under discussion in this section seems to point out that the link between high air
temperatures and pupils’ academic performances is not often straightforward, it could be
dependent on the nature of the academic task. Also, the results concerning the mathematics and
English tests reported in this study suggest that the link between high air temperatures and
performance of task as deduced from the analytical model in chapter 2 of this study could be
inconsistent and requires further research.
8.5 Chapter summary
The results from this study that is discussed in this chapter suggests the thermal comfort, health
and performance of teachers and pupils in public schools Minna can be affected by relatively
high indoor air temperatures even if the teachers and pupils are presumed to be acclimatised to
170
tropical climate. This result responds to the aim of this study stated chapter 1 as well as the
questions raised from the analytical model in chapter 2 of this study. The practical implication
of the negative effect of high indoor air temperature discussed in this chapter from the results
in this study suggest that every effort should be made by providers of public schools in Nigeria
to develop strategies of promoting suitable indoor air temperatures in schools. Generally, the
negative effect of indoor air temperature from the results discussed in this chapter could be
applicable to other public schools in Nigeria particularly schools located in places with
relatively high air temperatures most periods of the year.
171
Chapter 9. Summary of key findings and Conclusion
9.1 Introduction
This chapter presents the limitations in respect of the key findings from this study. As well, this
chapter provides a summary of the key findings and conclusions derived from the investigations
in this study. Furthermore, recommendations for future studies are also suggested in this
chapter. Lastly, as a result of the findings of this study, this chapter suggest some
recommendations that may enhance the thermal comfort and promote the performance of
teachers and pupils in classrooms of public schools in Nigeria.
9.2 Limitations
There are certain limitations that may be associated with the findings from the investigations in
this study, some of which are reported as follows.
Firstly, the sample size of schools used for the field experiments and field surveys in this study
is generally small in comparison to the number of public schools across Nigeria. This may limit
the generalisations of the findings from this study to all the public schools in Nigeria.
Secondly, the study did not measure the physiological changes in the brain of the samples that
were utilised for this study. Measuring physiological changes may require ethical permissions
which may be beyond the scope of this study.
Thirdly, the samples (pupils) used for the field experiments knew that their academic
performance were evaluated for experimental purposes, this may have led to the small effect
size in the mathematics test reported from the results in this study in section 5.5.(chapter 5).
Fourthly, the period for data collection as regards the field experiment with pupils in each
classroom of the 11 schools used for the study was short (i.e. one field experiment per day as
permitted by the principals of the schools used for the study). This has limited the study from
examining the effect of indoor air temperature on the academic performances of the samples in
a wide range of subjects that are related to their normal class work.
Fifthly, in order to report the effect of indoor air temperature on the productivity of teachers,
their productivity was not measured objectively at the field surveys. The productivity of
teachers was measured at the field surveys via their perception. See Appendix K for the item
used to measure the productivity of teachers on a five point Likert scale at the field surveys.

172
Sixthly, there may be other physical and psychosocial factors other than those controlled at the
field experiments that could play a role in affecting the results concerning the effect of indoor
air temperatures on the academic performances of the samples observed in this study.
Seventhly, one typical classroom model was utilised in performing the building performance
simulation and reporting the ranges of indoor air temperatures, CO2 and humidity levels in the
classrooms of the 11 schools sample of schools. However, there could be variations in the
ranges of the indoor air temperatures, CO2 and humidity levels in the classrooms used for this
study between the 11 schools due to the differences in the locations of the schools within the
macro climate of Minna. Minna is the study area.
9.3 Key findings and Conclusions
The key findings in respect of the aim of this study posed in chapter 1 are outlined below, this
is followed by the conclusions reached from the key findings of this study.
• The thermal sensation of the samples from the 11 schools (11classrooms) were on the
average significantly higher at indoor air temperature of 34.5 0C in comparison with
25.60C.This result suggest that the thermal comfort of the samples from the 11 schools was
significantly affected by indoor air temperature of 34.5 0C (high temp).
• In comparison with indoor air temperature of 25.60C, the indoor air temperature of 34.50
significantly affected the health of the samples from the 11 schools used for this study.
• In comparison to 25.6 0C the indoor air temperature of 34 .50C significantly affected the
academic performance of the samples in the area of numerical based tasks (mathematics).
• The mean score of the samples from the 11 schools (11classrooms) in the English language
tests at the field experiments did not differ significantly between the air temperatures levels
of 25.60C and 34.50C. This result suggest that the academic performance of the samples
from the 11 schools was not significantly affected by indoor air temperature of 34.5 0C
(high temp).
• In comparison between air temperature of 27.7 and 360C, the air temperature of 360C
significantly affected the thermal comfort and productivity of the sample of teachers
employed for the field surveys in this study.
• Predictions of the ranges of indoor air temperatures from the results of the building
performance simulation in chapter 7.2 suggest that the negative effect of high indoor air
temperature observed from the results in study may still occur all year round in public
schools of Minna.

173
In respect of the findings outlined above, the conclusion from the findings of this study is that;
teachers and pupils are performing academic tasks in naturally ventilated classrooms of public
schools in Minna under relatively high air temperatures. By extension, it has been shown in this
study that performing academic task in classrooms under relatively high air temperatures have
negative effect on the thermal comfort, health and performance of teachers and pupils who are
presumed to be acclimatised tropical climate. In short, the conclusion reached from the findings
of this study is that acclimatisation to tropical climate is not a guarantee that the thermal
comfort, health and performance of task by users of school buildings will not be affected.
The practical implication of the conclusion reached by this study is that the naturally ventilated
classrooms procured for teaching and learning in public schools of Nigeria does not provide
thermally safe indoor environments for the health and learning progress of the users.
Also, other conclusions that could be drawn from the results of this study are:
• Provided that the clothing insulation values worn by males and females are similar, there
seems to be no difference in their thermal comfort or thermal sensations under similar
indoor air temperatures.
• The performance of academic task by males and females under the same indoor air
temperature conditions are similar. This means performance of task at high indoor air
temperature it is not dependent on gender.
• The effect of air temperatures on the performance of academic task by pupils is not often
straight forward, it could be influenced by the nature of task.
• Hence the design features of public schools across the country are similar, the findings and
conclusions reached by this study may be applicable to teachers and pupils in other public
schools in Nigeria, particularly in areas where day air temperature are usually high.
9.4. Contributions of the findings from this study
This study has investigated the effect of indoor air temperature on the thermal comfort health
and performance of users in select public schools in Nigeria. In view of this, find in the
subsequent paragraphs of this section the contributions that may be attributed to the findings
from the investigation carried out in this study.
Prior to this study, literature search suggests that almost all the studies concerning the
relationship between high air temperatures and academic performances were conducted in
artificial chambers and in temperate climates. However, it is now clear from the findings of this

174
study that high air temperatures in classrooms also have the potentials to negate the performance
of cognitive task by pupils who are presumed to be acclimatised to tropical climates. In this
way, the findings of this study tends to strengthen the results from the studies of several authors
such as Wargocki and Wyon (2007) and Porras‐Salazar et al. (2018).These authors have earlier
demonstrated that high air temperatures in classroom have demonstrable negative effect on the
performance of cognitive tasks by pupils in schools.
Also, findings from this study contributes towards revealing that the performance of task under
elevated air temperatures is not always straight forward, it could be dependent on the nature of
the academic task. This because the findings from this study reported in sections 5.5 and 5.6
(chapter 5) shows that the performance of task by the sample of pupils used for this study was
significantly affected by high air indoor temperature in the area of mathematics while no
significant effect was observed in the area of English language. The finding reported here opens
up another area for future investigations by researchers who are intending to carry out similar
research.
Similarly, findings from the field surveys with teachers reported in section 6.9 (chapter 6)
contributes in identifying some ways that could be related to how high indoor air temperatures
potentially affects the performance of task by pupils in classrooms.
Again, findings from the field survey with teachers in this study contributes towards showing
that elevated air temperatures seems to be the most problematic environmental factor that could
affect the work of teachers and pupils in comparison to noise and daylighting ( chapter 6,section
6.10).This finding compliments some the published works of some authors (Earthman, 2004;
Sonne et al., 2006; Barrett et al., 2016), their findings also suggest that indoor air temperature
could be the most problematic environmental factor to the works of teachers and pupils in
school environments.
Furthermore, findings from this study contributes to the inconclusive literature concerning the
effect of gender on the thermal comfort of humans. This is because the result reported in
subsection 6.7.4 of this study suggest that; provided males and females put on clothing with
similar clothing insulation values there is likely not to be any significant difference in their
thermal comfort conditions under the same indoor air temperatures. The finding concerning
gender reported here complements the works of some authors (Fanger, 1973; Humphreys, 1977;
Becker and Paciuk, 2009; Liu et al., 2011). Adding to this, findings under section 5.5 of this

175
study contributes to suggest that the performance of academic task by pupils under similar
indoor air temperatures is not dependent on gender.
As well, findings from the field survey of teachers reported in chapter 6 (subsections 6.7.1 and
6.7.2), shows that the teachers used as samples for the surveys in this study were thermally
comfortable at indoor air temperature of 27.70C in classrooms. This results contributes to
strengthen the adaptive hypothesis. The adaptive hypothesis suggest that people who are
accustomed to working and living in tropical climates could accept relatively high indoor air
temperatures than people living in cold or moderate climates (Nicol, 2004).By extension, the
result concerning the comfortable temperature accepted by teachers mentioned here contributes
towards pointing out that thermal comfort standards such as ISO 7730 which are derived based
on PPD/PMV of persons living in temperate climates is not applicable for specifying thermal
comfort conditions for people living in naturally ventilated buildings in the tropics. Also, the
indoor air temperature of 27.70C at which the teachers (respondents) found to be comfortable
from the results in this study strengthens the works of authors summarised in chapter 2,
subsection 2.3.8,Table 2.8.Their findings (authors listed below and in Table 2.8) suggest that
persons in naturally ventilated schools of the tropics can be comfortable at relatively high
indoor temperatures above the threshold of what some international thermal comfort standards
prescribes for thermal comfort indoors (Kwok, 1997; Wong and Khoo, 2003; Appah-Dankyi
and Koranteng, 2012; Mishra and Ramgopal, 2015).
Likewise, findings from several authors in subsection section 2.2.1 suggests that in order to
prevent solar heat gain and elevated indoor air temperatures in naturally ventilated buildings in
the tropics, buildings should be orientated with their shortest sides on the east-west axis
(Kukreja, 1978; Givoni, 1994). However, results from the field experiments with pupils
reported in chapter 5, Table 5.2 and building performance simulation in chapter 7, section 7.2
contributes to reveal that orientation of naturally ventilated buildings in the tropics with their
shortest sides on the east-west axis may not remarkably reduce indoor solar heat gain and indoor
air temperatures.
Finally, the findings concerning the negative effect of the indoor air temperature on the thermal
comfort, health and academic performance observed in this study could be used as demonstrable
evidence towards promoting best practices, policies and funding in the procurement of public
schools in Nigeria.

176
9.5 Recommendation for future study from the findings of this study.
1. Based on the findings from the field experiments with pupils and field surveys with
teachers which showed that high indoor air temperatures could be detrimental to academic
tasks. This study recommends that objective research should be conducted with a view to
determine the specific strategies of achieving thermal comfort in the naturally ventilated
classrooms of public schools in Nigeria.
2. The results of the field experiment concerning the effect of high air temperatures on the
thermal comfort, health and academic performance of the samples in this study needs
further validation. This is because the sample size of classrooms and schools used for this
study is relatively small compared to number of public schools across the country.
3. Future research into the effect of high air temperatures on pupils academic performances
should aim at measuring some physiological changes in the samples in order to determine
the mechanisms by which high air temperatures affects the performance of tasks.
4. Future studies that are related to this one should attempt to develop methods for objectively
evaluating the productivity of teachers as regards the effect of high air temperatures on
their productivity.
5. It may be desirable for future studies to focus on determining the optimum temperatures
ranges that could promote learning tasks in classrooms of public schools.
6. Future related research should be planned as longitudinal study where the researcher
examines the academic performances of the pupils in varied subject areas for 1-2 year
period under varying indoor air temperatures.
7. Future studies should focus on identifying the changes in the brain during the performance
of tasks under high air temperatures in order to understand how air temperatures affects
cognitive performances.
9.6 Recommendations of design features that may promote thermal comfort in the classrooms of public schools.
The findings from this study all tend to show that the design features of the classrooms of public
schools used for this study may not be able to provide the required indoor air temperatures that
may suit the thermal comfort and performance of the users. In view of this, find in the
subsections below some recommendations that may be utilised in the design and construction
of future classrooms for the sake of promoting thermal comfort and learning in public schools
of Nigeria.
177
Specificity in the design of future classroom for public schools
The findings from the physical surveys in chapter 4 suggest that the classrooms of public
schools have similar design features. In view of this, this study is of the view that in the design
of future classrooms for public schools, there should be some specificity in the approach by
which classrooms should be designed. This suggests that classrooms should be designed and
built with respect to the varied climatic conditions of Nigeria via use of specific materials,
construction techniques and design considerations.
The windows
It was observed from the results of the physical surveys of schools that the percentage of
window area to floor area ratio in the classrooms is small (13%) in comparison to the 20 -30%
suggested by some authors (e.g. Tantasavasdi et al. 2001; Awbi 1994). Against this backdrop,
this study recommends that the percentage of window to floor area ratio of classrooms in public
schools of Minna should be increased from 13% as observed from the physical surveys in this
study to about 20 -30%.Nevertheless, due consideration should be given to the use of shading
devices and orientations before increasing window to floor area ratio in classrooms.
Also, in order to curtail heat gain, it is the view of this study that metals should not be used for
the sashes of the windows of classrooms in public schools of Minna. Windows sashes made of
materials such as wood or PVC may be desirable for windows of classrooms in public schools
in Minna. PVC and wood relatively have better insulation values than metals.
Additionally findings from the physical survey of the schools showed that the window to wall
area ratio of the front and rear walls of each classroom are 12% and 18% respectively. This
study recommends that the percentage of window to wall area ratio of classrooms of public
schools should be increased between 30-50% in order to promote ventilation (Zhang et al. 2017;
Rabah and Mito, 2003). However it should be noted that increasing window to wall areas ratio
requires that provision for shading and appropriate orientations.
The roofing covering
It was observed from the results of the building performance simulation reported in chapter
7(7.9.1 and 7.9.2) that the roof covering of the sample of classrooms investigated in this study
is likely to contribute most to solar heat gain, this is in comparison with other components. This
is probably because findings from the physical survey of schools suggest that material used for
the roof of the classrooms is aluminum sheets. In view of this, the use of clay tiles as the roof

178
covering of classrooms in public schools of Minna is recommended for the sake of reducing
solar heat gain and high air temperatures.
Roof vents
Findings from the physical survey of the classrooms reported in chapter 4 (subsection 4.11.2)
showed that there is no provision for ventilating the hip roofs via roof vents. In view of this, the
current study recommends the use of roof vents in the design and construction of classrooms in
public schools of Minna, this may curtail solar heat gain via the ceilings into the classrooms.
The use of trees
Findings from the physical surveys in chapter 4 (section 4.5) suggests that there is paucity in
the use of trees as shading devices in the schools investigated in this study. In view of the
finding reported here, this study recommends the planting of evergreen or semi-evergreen trees
(e.g. neem tree) around the classrooms of public schools in Minna. Trees generally have the
potentials to limit solar heat gain and the occurrence of high air temperatures (Huang et al 1987;
Shashua –bar 2011; Balogun et al. 2014).
The use of solar fans
Findings from the physical survey in chapter 4 (section 4.3) of this study suggest that the
classrooms of public schools in Minna strictly depends on natural ventilations for the thermal
comfort of the users (pupils and teachers).This due to acute power outages currently in Nigeria.
Thus, as regards the finding reported here, this study recommends the use of solar fans in the
classrooms of public schools in Minna in order to promote the rate by which hot air indoors
could be dissipated. In turn, this may assist to lessen the occurrences of high air temperatures
in the classrooms of public schools in Minna.
Orientation
The findings from the building performance simulation in this study in chapter 7(7.2) suggest
that orientation of classrooms in public schools of Minna with their shortest sides on the east-
west axis may not be able to remarkably reduce the indoor air temperature .However, this study
still recommends that classrooms in public schools of Minna should as much as possible be
orientated with their shortest sides on the east-west axis for the sake of promoting thermal
comfort.

179
Appendices
Appendix A: Permission letter from Niger state Ministry of Education to conduct field work.

180
Appendix B: Sample of consent form for parents of the pupils

181
Appendix C: Sample of consent form for the pupils

182
Appendix D: Sample of consent form for the teachers

183
Appendix E: Questionnaire used to collect data for control variables
Questionnaire survey (control questionnaire)
I Makun Yakubu Charles a PhD student at the Newcastle University, United Kingdom, kindly request that you assist me in filling this questionnaire on some factors that you feel may affect your performance in the academic test in this field experiment. The data gathered here is strictly for academic purpose.
Section I: General information
Name of school Gender Date and time Year of birth Name (optional) Registration number
Section II:
1. Please respond by ticking Yes or No in the box below if any of the conditions listed below is applicable to you right now.
Yes No Are you hungry right now? Have you been feeling sick in the last 24 hours?
Are you happy now?
Section III
Please respond by ticking Yes or No as a response to the questions in the table below.
Yes No Are you satisfied with the daylight levels in the classroom during the test?
Are you satisfied with the noise level in the classroom during the test?
Did you find any difficulty in breathing the air around you in this classroom during the test?
Thank you for taking your time to respond to the questionnaire

184
Appendix F: Questionnaire used to evaluate the thermal comfort and health of the samples
Questionnaire survey of pupil’s thermal comfort in selected public schools in Minna, Niger state, Nigeria.
I Makun Yakubu Charles a PhD student at the Newcastle university, United Kingdom, kindly request that you assist me in filling this questionnaire.
Section I: General information
Name of school Gender Date and time Year of birth Name (optional) Registration number
Section II: Questions
1. Please mark X in one of the boxes below of how hot or cold you feel right now with respect to the air temperature in this classroom.
Cold -3
Cool -2
Slightly cool -1
Neutral 0
Slightly warm 1
Warm 2
Hot 3
2. Please indicate the extent to which you are experiencing (feeling) any of the symptoms in the table below with respect to nature of the air temperature in this classroom right now. Tick X in a row of the below.
Symptoms Responses I don’t know Not at all A little Much Very much
Thirst Headache Sweating Tiredness Displeasure to do classwork

185
Appendix G: Sample of questions used to evaluate the academic performance of the samples in the area of mathematics at the field experiments conducted at mean air temperatures of 25.6 0C in the mornings.

186
Appendix H: Sample of questions used to evaluate the academic performance of the samples in mathematics at the field experiments conducted at mean air temperatures of 34.50C in the Afternoons

187
Appendix I: Sample of questions used to evaluate the academic performance of the samples in the area of English language at the field experiments conducted at mean air temperatures of 25.6 0C in the mornings Title: Academic performance test for a PhD study at Newcastle University, United Kingdom
Subject: English Language
Class: JSS 3 Morning session
Date: November 2016
Time allowed: 20 minutes
Registration number............................................................................
Section A.
Read the passage carefully and answer the questions that follow
One cold morning in 1999, David Mathew set out of his small mud house for his usual fishing
activity along the coast of River Niger in the small town of Pategi in Nigeria. As he got to the
bank of the river he found that there were some strange looking pebbles washed ashore around
his canoe. David was astonished. He had never seen pebbles in the form he found that cold
morning.
He picked up one and began to view it very closely. ‘This is unusual’, he said to himself.
Abandoning his fishing activity for that day he decided to take a sample of the pebbles for
analysis in a laboratory at a nearby city Ilorin. Ilorin is the capital city of Kwara state in Nigeria
approximately 100 kilometres from Pategi. After a series of laboratory analysis, it was
discovered that what David thought were pebbles are actually precious stones. The laboratory
technician advised him to report the findings to the appropriate authority in charge of natural
resources in Pategi. He could get a reward for what he found.
1. What item did David find one cold morning in 1999?
2. David’s house is a?
3. According to the passage Ilorin is the?
4. What did David go to do at Ilorin?
5. According to the passage what was found out at Ilorin after laboratory analysis?
Section B

188
Answer questions1-5 by filling in the blank spaces with any of the appropriate words in
bracket below.
( when, there, what, why, that, where)
1. The tailor said ………….he has finished.
2. ……………. did the child go away?
3. Please keep the book ………………………
4. ………………. were you absent yesterday?
5. I know ……………. he wants.
Section C
Choose one option from A-D in each question that is most appropriate to complete the
sentences below.
1. All the boys sang the ……………………. (A) hym (B) hime (C) heam (D) hymn
2. The boy has ……………….oranges (A) eight (B) ate (C) eaten (D) late
3. It was done ………………….. Anthony (A) by (B) bye (C) buy (D) but
4. Nobody was ………………. to enter (A) allowed (B) aloud. (C) agreed (D) drive
5. It was …………………….. unpleasant day for me (A)an (B) a (C) some (D)and
6. He was fast asleep………………… his mobile phone was stolen. (A)because (B) that (C) when (D) at
7. She……………….failed the test again. (A) did (B)has (C) does (D) have
8. Peter……………….the book he borrowed from Agnes (A) has return (B) has returned (C) turned (D) has returns.
9. Akpan caught some ……………………yesterday (A) grashopers (B) grashoppers (C)
grasshoppers (D) grasssopers.
10. Mercy took her dog to the………………… doctor (A) vetnary (B) veterinary (C) veterirary (D) veterinery

189
Appendix J: Sample of questions used to evaluate the academic performance of the samples in the area of English language at the field experiments conducted at mean air temperatures of 34.5 0C in the afternoons Title: Academic performance test for a PhD study at Newcastle University, United Kingdom
Subject: English Language (Afternoon session)
Class: JSS 3
Date: November 2016
Time allowed: 20minutes
Registration No............................................................................
Section A.
Read the passage carefully and answer the questions that follow
Two male university graduates of business management Ali and Chike left Kano town for Lagos
by rail transport in search of job opportunities. Kano and Lagos are towns located in the northern
and southern parts of Nigeria respectively. It took them two days to arrive in Lagos. On arrival,
because it was already dark they decided to lodge at a popular guest inn near the railway station
known as the Terminus. The next morning they proceeded to Ali’s uncle at No.3 Shodimu
Street, Badagry by a chartered taxi. Here, at Ali's uncle's house, they were provided with
breakfast after which he took Ali and Chike to Lagos Island where the headquarters of most
banks in Nigeria are located in order for the graduates to continue their job search. Fortunately,
the next day both graduates received invitation letters by email for an interview with
Continental merchant bank. This is one of the biggest Merchant banks in Nigeria as at 1999
with over 180 branches spread across the country.
1. Ali and Chike travelled to Lagos by what means of transport?
2. Where is Kano located in Nigeria?
3. Where is Lagos located in Nigeria?
4. According to the passage what happened fortunately?
5. According to the passage what is notable about Lagos Island?

190
Section B
Choose from the list of words A-D the one that is opposite in meaning to the
underlined word in each question
1. Azuka is a beautiful girl (A) plain (B) poor (C) ugly (D) slow
2. The old man is wise. (A) clever (B) foolish (C) sad (D) literate
3. The examination questions were easy (A) difficult (B) bad (C) strong (D) hot.
4. I bought some rotten eggs from the market yesterday (A) spoilt (B) fresh (C) corrupt
(D) sour
5. John is a friend of mine (A) relative (B) enemy (C) sister (D) helper.
Section C
Complete each of the sentences below with the most appropriate options in A-D.
6. Eze is afraid----------------------- snakes (A) by (B) for (C) of (D) at.
7. Paul cried --------------------- he failed (A) but (B) because (C) of course (D) although.
8. Many------------------------- sat for the common entrance examination in our school
yesterday (A) appointees (B) employers (C) candidates (D) workers.
9. Jack is a friend of-------------------- (A) their (B) those (C) they (D) mine
10. James cannot train with us today because he-------------------- his ankle (A) broken (B)
had break (C) has broken (D) has break
11. Water is a form of---------------- (A) gas (B) liquid (C) food (D) solid
12. I was not interested ----------------- the activities of the organisation (A) for (B) in (C)to
(D)of
13. Citizens should always pay------------------- to enable the government in providing
infrastructures for them (A) bills (B) charges (C) tax (D) fees
14. Which of the suffix can be added to ‘rare’ to form a new word--------------- (A) -an (B)
-ish (C) -ly (D)-ous
15. She ran ------------------------- the to escape from the scene of the riot (A) on (B) inside
(C) across (D) into

191
Appendix K: Questionnaire used to evaluate the thermal comfort and productivity of the teachers at the field surveys. Questionnaire for field survey of teachers
I Makun Yakubu Charles a PhD student at the Newcastle University, United kingdom kindly request that you assist me in filling this questionnaire. The questionnaire is mainly aimed at gathering data about your thermal comfort and perceived ability to teach with respect to the indoor air temperatures in classrooms.
Section A: Personal information
Name of school Gender Number of years teaching Age Name (optional) Name of space/ date
Section B
1. Please mark X in one of the boxes below of how hot or cold you feel right now with respect to the air temperatures in the classroom.
Cold -3
Cool -2
Slightly cool -1
Neutral 0
Slightly warm +1
Warm +2
Hot +3
2. Kindly rate your productivity with respect how hot or cold you feel right now with respect to the air temperature in this classroom? Tick one response from the boxes below.
I don’t know 0
Low 1
Average 2
high 3
Very high 4
3. Based on your views, how often do pupils exhibit the signs (symptoms) listed in the table below when the temperatures turns hot in the classrooms of this school? Please tick x as a response in a row of the table below.
Serial number
Environmental factor
Responses Never Rarely Sometimes Often Undecided
1 Sleepiness 2 Tiredness 3 Restlessness 4 Displeasure to do
classwork
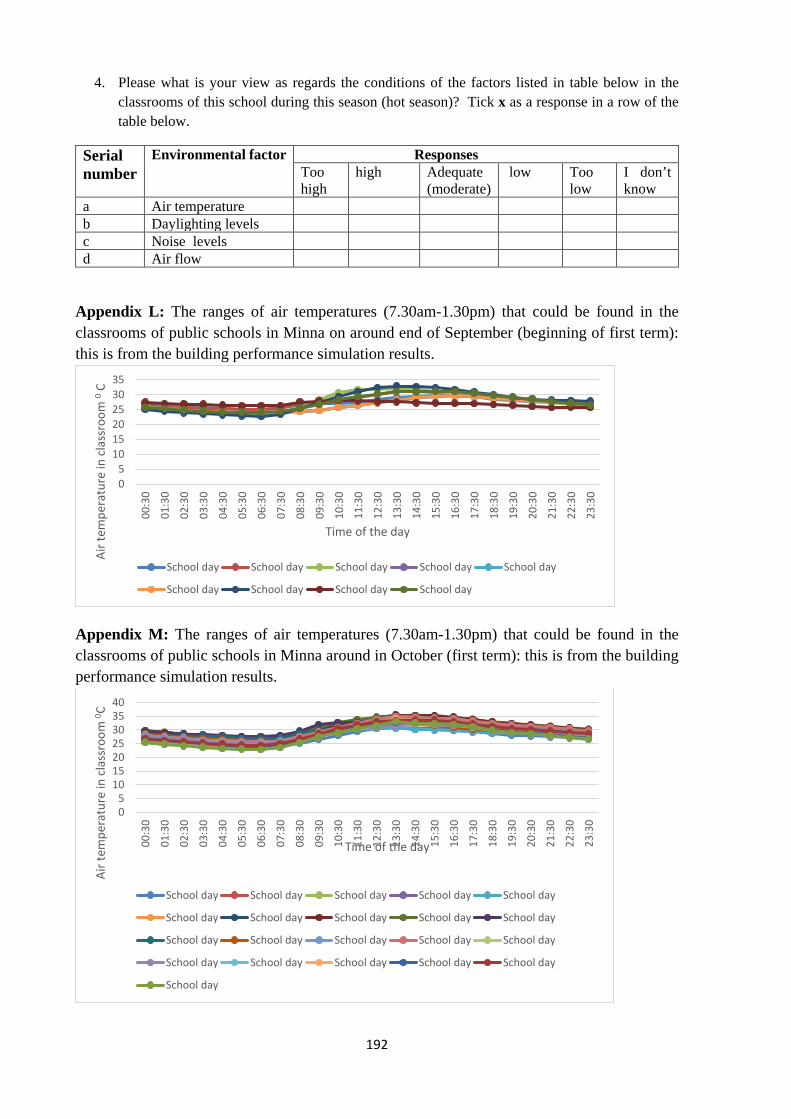
192
4. Please what is your view as regards the conditions of the factors listed in table below in the classrooms of this school during this season (hot season)? Tick x as a response in a row of the table below.
Serial number
Environmental factor Responses Too high
high Adequate (moderate)
low Too low
I don’t know
a Air temperature b Daylighting levels c Noise levels d Air flow
Appendix L: The ranges of air temperatures (7.30am-1.30pm) that could be found in the classrooms of public schools in Minna on around end of September (beginning of first term): this is from the building performance simulation results.
Appendix M: The ranges of air temperatures (7.30am-1.30pm) that could be found in the classrooms of public schools in Minna around in October (first term): this is from the building performance simulation results.
05
101520253035
00:3
0
01:3
0
02:3
0
03:3
0
04:3
0
05:3
0
06:3
0
07:3
0
08:3
0
09:3
0
10:3
0
11:3
0
12:3
0
13:3
0
14:3
0
15:3
0
16:3
0
17:3
0
18:3
0
19:3
0
20:3
0
21:3
0
22:3
0
23:3
0
Air t
empe
ratu
re in
cla
ssro
om 0
C
Time of the day
School day School day School day School day School day
School day School day School day School day
05
10152025303540
00:3
0
01:3
0
02:3
0
03:3
0
04:3
0
05:3
0
06:3
0
07:3
0
08:3
0
09:3
0
10:3
0
11:3
0
12:3
0
13:3
0
14:3
0
15:3
0
16:3
0
17:3
0
18:3
0
19:3
0
20:3
0
21:3
0
22:3
0
23:3
0
Air t
empe
ratu
re in
cla
ssro
om 0 C
Time of the day
School day School day School day School day School day
School day School day School day School day School day
School day School day School day School day School day
School day School day School day School day School day
School day

193
Appendix N: The ranges of air temperatures (7.30am-1.30p) that could be found in the classrooms of public schools in Minna around in November (first term), based on the building performance simulation results.
Appendix O: The ranges of air temperatures (7.30am-1.30pm) that could be found in the classrooms of public schools in Minna around early December (about end of first term): this is from the building performance simulation results.
0
5
10
15
20
25
30
35
40
00:3
0
01:3
0
02:3
0
03:3
0
04:3
0
05:3
0
06:3
0
07:3
0
08:3
0
09:3
0
10:3
0
11:3
0
12:3
0
13:3
0
14:3
0
15:3
0
16:3
0
17:3
0
18:3
0
19:3
0
20:3
0
21:3
0
22:3
0
23:3
0
Air t
empe
ratu
re in
cla
ssro
om 0
C
Time of the day
School day School day School day School day School day
School day School day School day School day School day
School day School day School day School day School day
School day School day School day School day School day
School day School day
0
5
10
15
20
25
30
35
40
00:3
0
01:3
0
02:3
0
03:3
0
04:3
0
05:3
0
06:3
0
07:3
0
08:3
0
09:3
0
10:3
0
11:3
0
12:3
0
13:3
0
14:3
0
15:3
0
16:3
0
17:3
0
18:3
0
19:3
0
20:3
0
21:3
0
22:3
0
23:3
0
Air t
empe
ratu
re in
cla
ssro
om 0
C
Time of the day
School day School day School day School day
School day School day School day School day
School day School day School day School day

194
Appendix P: The ranges of air temperatures (7.30am-1.30pm) that could be found in the classrooms of public schools in Minna around early January (second term): this is from the building performance simulation results.
Appendix Q: The ranges of air temperatures (7.30am-1.30pm) that could be found in the classrooms of public schools in Minna around February (second term): this is from the building performance simulation results.
0
5
10
15
20
25
30
35
4000
:30
01:3
002
:30
03:3
004
:30
05:3
006
:30
07:3
008
:30
09:3
010
:30
11:3
012
:30
13:3
014
:30
15:3
016
:30
17:3
018
:30
19:3
020
:30
21:3
022
:30
23:3
0
Air t
empe
ratu
re in
cla
ssro
om 0 C
Time of the day
School day School day School day School day School day
School day School day School day School day School day
School day School day School day School day School day
0
5
10
15
20
25
30
35
40
45
00:3
0
01:3
0
02:3
0
03:3
0
04:3
0
05:3
0
06:3
0
07:3
0
08:3
0
09:3
0
10:3
0
11:3
0
12:3
0
13:3
0
14:3
0
15:3
0
16:3
0
17:3
0
18:3
0
19:3
0
20:3
0
21:3
0
22:3
0
23:3
0
Air t
empe
ratu
re in
cla
ssro
om 0
C
Time of the day
School day School day School day School day School day
School day School day School day School day School day
School day School day School day School day School day
School day School day School day School day School day

195
Appendix R: The ranges of air temperatures (7.30am-1.30pm) that could be found in the classrooms of public schools in Minna around March (second term): this is from the building performance simulation results.
Appendix S: The ranges of air temperatures (7.30am-1.30pm) that could be found in the classrooms of public schools in Minna around May (Third term): this is from the building performance simulation results.
.
0
5
10
15
20
25
30
35
40
45
00:3
0
01:3
0
02:3
0
03:3
0
04:3
0
05:3
0
06:3
0
07:3
0
08:3
0
09:3
0
10:3
0
11:3
0
12:3
0
13:3
0
14:3
0
15:3
0
16:3
0
17:3
0
18:3
0
19:3
0
20:3
0
21:3
0
22:3
0
23:3
0
Air t
empe
ratu
re in
cla
ssro
om 0
C
Time of the day
School day School day School day School day School day
School day School day School day School day School day
School day School day School day School day School day
School day School day School day School day School day
School day School day School day
05
1015202530354045
00:3
0
01:3
0
02:3
0
03:3
0
04:3
0
05:3
0
06:3
0
07:3
0
08:3
0
09:3
0
10:3
0
11:3
0
12:3
0
13:3
0
14:3
0
15:3
0
16:3
0
17:3
0
18:3
0
19:3
0
20:3
0
21:3
0
22:3
0
23:3
0
Air t
empe
ratu
re in
cla
ssro
om 0
C
Time of the day
School day School day School day School day School day
School day School day School day School day School day
School day School day School day School day School day
School day School day School day School day School day

196
Appendix T: The ranges of air temperatures (7.30am-1.30pm) that could be found in the classrooms of public schools in Minna around June (Third term): this is from the building performance simulation results.
Appendix U: The ranges of air temperatures (7.30am-1.30pm) that could be found in the classrooms of public schools in Minna around July (Third term): this is from the building performance simulation results.
0
5
10
15
20
25
30
35
4000
:30
01:3
0
02:3
0
03:3
0
04:3
0
05:3
0
06:3
0
07:3
0
08:3
0
09:3
0
10:3
0
11:3
0
12:3
0
13:3
0
14:3
0
15:3
0
16:3
0
17:3
0
18:3
0
19:3
0
20:3
0
21:3
0
22:3
0
23:3
0Air t
empe
ratu
re in
cla
ssro
om 0
C
Time of the day
School day School day School day School day School day
School day School day School day School day School day
School day School day School day School day School day
School day School day School day School day School day
School day School day
0
5
10
15
20
25
30
35
40
00:3
0
01:3
0
02:3
0
03:3
0
04:3
0
05:3
0
06:3
0
07:3
0
08:3
0
09:3
0
10:3
0
11:3
0
12:3
0
13:3
0
14:3
0
15:3
0
16:3
0
17:3
0
18:3
0
19:3
0
20:3
0
21:3
0
22:3
0
23:3
0
Air t
empe
ratu
re in
cla
ssro
om 0
C
Time of the day
School day School day School day School day School day School day
School day School day School day School day School day School day
School day School day School day School day School day School day
School day School day School day School day

197
References
Abdullahi, M. (2005) 'Compressive strength of sandcrete blocks in Bosso and Shiroro areas of
Minna, Nigeria', AU JT, 9(2), pp. 126-131.
Ackermann, M. (2010) Cool comfort: America's romance with air-conditioning. Smithsonian
Books.
Adeniyi, M., Ogunsola, O., Nymphas, E. and Oladiran, E. (2009) 'Food security measures
during uncertain climatic conditions in Nigeria', African Journal of Food, Agriculture,
Nutrition and Development, 9(2), pp. 652-677.
Al-Homoud, M.S. (2005) 'Performance characteristics and practical applications of common
building thermal insulation materials', Building and environment, 40(3), pp. 353-366.
Al-Jabri, K.S., Hago, A., Al-Nuaimi, A. and Al-Saidy, A. (2005) 'Concrete blocks for thermal
insulation in hot climate', Cement and Concrete Research, 35(8), pp. 1472-1479.
Al-Tamimi, N.A.M., Fadzil, S.F.S. and Harun, W.M.W. (2011) 'The effects of orientation,
ventilation, and varied WWR on the thermal performance of residential rooms in the tropics',
Journal of Sustainable development, 4(2), p. 142.
Andrade, M.M. and Menna-Barreto, L. (1996) 'Diurnal variation in oral temperature,
sleepiness, and performance of high school girls', Biological Rhythm Research, 27(3), pp.
336-342.
Appah-Dankyi, J. and Koranteng, C. (2012) 'An assessment of thermal comfort in a warm and
humid school building at Accra, Ghana'.
Arens, E., Zhang, H., Pasut, W., Zhai, Y., Hoyt, T. and Huang, L. (2013) 'Air movement as an
energy efficient means toward occupant comfort'. Available at:
http://www.escholarship.org/uc/item/2d656203.
ASHRAE 55 (2010) ASHRAE STANDARD: Thermal Environmental Conditions for Human
Occupancy. American Society of Heating, R.a.A.-C.E. [Online]. Available at:
http://www.almasesepahan.com/fh/download/ASHRAE_Thermal_Comfort_Standard.pdf
(Accessed: 13 January, 2015).
ASHRAE (2010) 'ASHRAE 62.1-2010 Ventilation for Acceptable Indoor Air Quality',
Atlanta, GA.
ASHRAE , S. (2004) '9-11', Standard 55-2004. Available at: http://www.almas-
hvac.ir/fh/download/ASHRAE_Thermal_Comfort_Standard.pdf (Accessed: 19/10/2018
).
Atmaca, I. and Yigit, A. (2006) 'Predicting the effect of relative humidity on skin temperature
and skin wettedness', Journal of Thermal Biology, 31(5), pp. 442-452.

198
Auliciems, A. (1972) The Atmospheric Environment: A study of comfort and performance.
University of Toronto Press.
Auliciems, A. and Szokolay, S. (2007) Thermal Comfort. PLEA: Passive and Low Energy
Architecture International. Note 3.
Auliciems, A. and Szokolay, S.V. (1997). PLEA.
Awbi, H.B. (1994) 'Design considerations for naturally ventilated buildings', Renewable
Energy, 5(5-8), pp. 1081-1090.
Axelrod, S., Hall, R.V. and Tams, A. (1979) 'Comparison of two common classroom seating
arrangements', Academic Therapy, 15(1), pp. 29-36.
Bakó-Biró, Z., Clements-Croome, D., Kochhar, N., Awbi, H. and Williams, M. (2012)
'Ventilation rates in schools and pupils’ performance', Building and Environment, 48, pp. 215-
223.
Bansal, N., Garg, S. and Kothari, S. (1992) 'Effect of exterior surface colour on the thermal
performance of buildings', Building and environment, 27(1), pp. 31-37.
Barbic, F., Minonzio, M., Cairo, B., Shiffer, D., Dipasquale, A., Cerina, L., Vatteroni, A.,
Urechie, V., Verzeletti, P. and Badilini, F. (2019) 'Effects of different classroom temperatures
on cardiac autonomic control and cognitive performances in undergraduate students',
Physiological measurement, 40(5), p. 054005.
Barrett, P., Barrett, L. and Zhang, Y. (2016) 'Teachers' views of their primary school
classrooms', Intelligent Buildings International, 8(3), pp. 176-191.
Barrett, P.S. and Zhang, Y. (2009) Optimal learning spaces: Design implications for primary
schools. Available at: http://usir.salford.ac.uk/18471/1/SCRI_Report_2_school_design.pdf
(Accessed: 10/9/2017).
Barrett, P.S., Zhang, Y., Davies, F. and Barrett, L. (2015) Clever classrooms: Summary report
of the HEAD project. University of Salford.
Baruah, P., Singh, M.K. and Mahapatra, S. (2014) 30th International Plea Conference.
Ahmedabad.
Bauman, F., Arens, E.A., Huizenga, C., Xu, T., Zhang, H., Akimoto, T. and Miura, K. (1996)
'The impact of humidity standards on energy efficient cooling in california'.
Becker, R. and Paciuk, M. (2009) 'Thermal comfort in residential buildings–failure to predict
by standard model', Building and Environment, 44(5), pp. 948-960.
Bennett, N. and Blundell, D. (1983) 'Quantity and quality of work in rows and classroom
groups', Educational Psychology, 3(2), pp. 93-105.
Berglund, L.G. (1998) 'Comfort and humidity', ASHRAE journal, 40(8), p. 35.
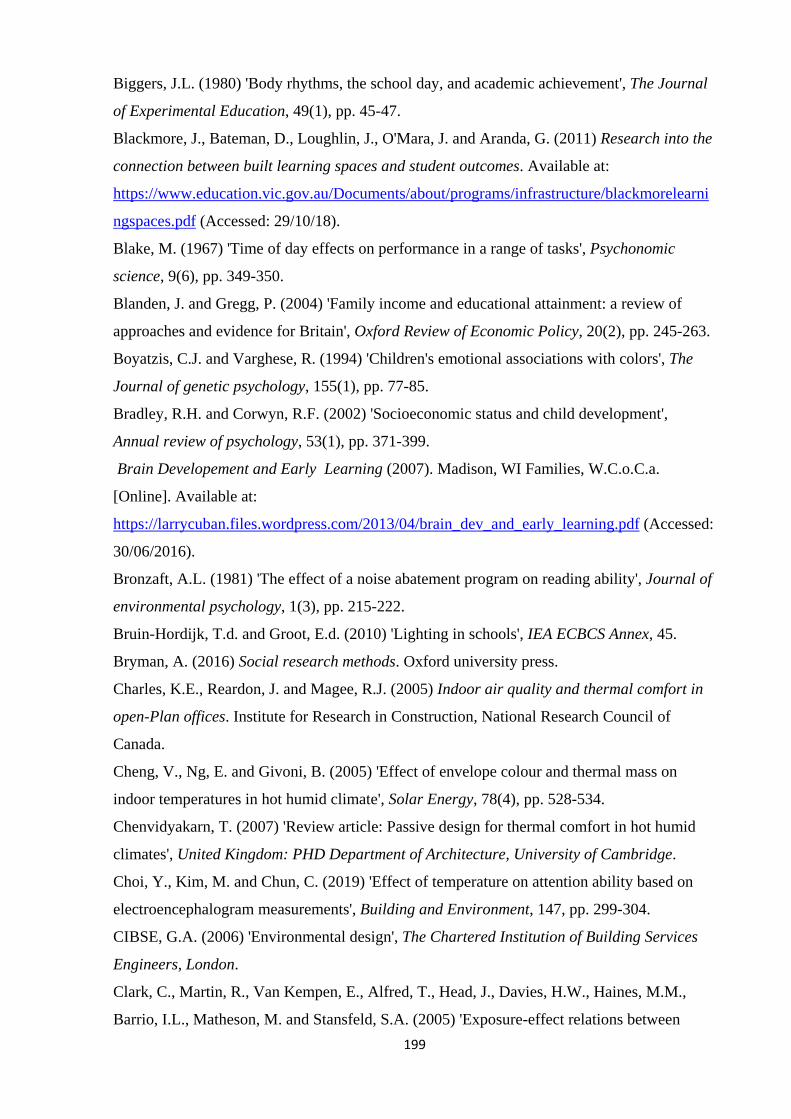
199
Biggers, J.L. (1980) 'Body rhythms, the school day, and academic achievement', The Journal
of Experimental Education, 49(1), pp. 45-47.
Blackmore, J., Bateman, D., Loughlin, J., O'Mara, J. and Aranda, G. (2011) Research into the
connection between built learning spaces and student outcomes. Available at:
https://www.education.vic.gov.au/Documents/about/programs/infrastructure/blackmorelearni
ngspaces.pdf (Accessed: 29/10/18).
Blake, M. (1967) 'Time of day effects on performance in a range of tasks', Psychonomic
science, 9(6), pp. 349-350.
Blanden, J. and Gregg, P. (2004) 'Family income and educational attainment: a review of
approaches and evidence for Britain', Oxford Review of Economic Policy, 20(2), pp. 245-263.
Boyatzis, C.J. and Varghese, R. (1994) 'Children's emotional associations with colors', The
Journal of genetic psychology, 155(1), pp. 77-85.
Bradley, R.H. and Corwyn, R.F. (2002) 'Socioeconomic status and child development',
Annual review of psychology, 53(1), pp. 371-399.
Brain Developement and Early Learning (2007). Madison, WI Families, W.C.o.C.a.
[Online]. Available at:
https://larrycuban.files.wordpress.com/2013/04/brain_dev_and_early_learning.pdf (Accessed:
30/06/2016).
Bronzaft, A.L. (1981) 'The effect of a noise abatement program on reading ability', Journal of
environmental psychology, 1(3), pp. 215-222.
Bruin-Hordijk, T.d. and Groot, E.d. (2010) 'Lighting in schools', IEA ECBCS Annex, 45.
Bryman, A. (2016) Social research methods. Oxford university press.
Charles, K.E., Reardon, J. and Magee, R.J. (2005) Indoor air quality and thermal comfort in
open-Plan offices. Institute for Research in Construction, National Research Council of
Canada.
Cheng, V., Ng, E. and Givoni, B. (2005) 'Effect of envelope colour and thermal mass on
indoor temperatures in hot humid climate', Solar Energy, 78(4), pp. 528-534.
Chenvidyakarn, T. (2007) 'Review article: Passive design for thermal comfort in hot humid
climates', United Kingdom: PHD Department of Architecture, University of Cambridge.
Choi, Y., Kim, M. and Chun, C. (2019) 'Effect of temperature on attention ability based on
electroencephalogram measurements', Building and Environment, 147, pp. 299-304.
CIBSE, G.A. (2006) 'Environmental design', The Chartered Institution of Building Services
Engineers, London.
Clark, C., Martin, R., Van Kempen, E., Alfred, T., Head, J., Davies, H.W., Haines, M.M.,
Barrio, I.L., Matheson, M. and Stansfeld, S.A. (2005) 'Exposure-effect relations between

200
aircraft and road traffic noise exposure at school and reading comprehension: the RANCH
project', American journal of epidemiology, 163(1), pp. 27-37.
Clements-Croome, D. (2014) 'Sustainable intelligent buildings for better health, comfort and
well-being', Report for DENZERO project.
Cleophas, T.J. and Zwinderman, A.H. (2012) Statistics applied to clinical studies. Springer
Science & Business Media.
Cohen, J. (1998) Statistical power analysis for the behavioural sciences. Second edn. New
Jersey: Lawrence Erlbaum Associates.
Cohen, L., Manion, L. and Morrison, K. (2018) Research Methods in Education. Routledge.
Cohen, S., Evans, G.W., Krantz, D.S. and Stokols, D. (1980) 'Physiological, motivational, and
cognitive effects of aircraft noise on children: moving from the laboratory to the field',
American psychologist, 35(3), p. 231.
Cohen, S., Glass, D.C. and Singer, J.E. (1973) 'Apartment noise, auditory discrimination, and
reading ability in children', Journal of experimental social psychology, 9(5), pp. 407-422.
Connolly, D., Dockrell, J., Shield, B., Conetta, R., Mydlarz, C. and Cox, T. (2019) 'The
effects of classroom noise on the reading comprehension of adolescents', The Journal of the
Acoustical Society of America, 145(1), pp. 372-381.
Considine, G. and Zappalà, G. (2002) Competing visions: Refereed proceedings of the
national social policy conference.
Cook, T.D. and Campbell, D.T. (1979) Quasi-experimentation: Design and analysis for field
settings. Rand McNally Chicago.
Cotton, K. (1996) 'School size, school climate, and student performance'. Northwest Regional
Education Laboratory Portland, OR.
Creswell, J.W. (2009) 'Research designs: Qualitative, quantitative, and mixed methods
approaches'. Thousand Oaks, CA: Sage Publications.
Creswell, J.W. (2012) 'Educational research', Planning, conducting, and evaluating
quantitative and qualitative research.
Crook, M. and Langdon, F. (1974) 'The effects of aircraft noise in schools around London
Airport', Journal of Sound and Vibration, 34(2), pp. 221-232.
Cui, W., Cao, G., Park, J.H., Ouyang, Q. and Zhu, Y. (2013) 'Influence of indoor air
temperature on human thermal comfort, motivation and performance', Building and
environment, 68, pp. 114-122.
Davis-Kean, P.E. (2005) 'The influence of parent education and family income on child
achievement: the indirect role of parental expectations and the home environment', Journal of
family psychology, 19(2), p. 294.

201
Davis, Z.T. (1987) 'The Effect of Time-of-Day of Instruction on Eighth-Grade Students'
English and Mathematics Achievement', The High School Journal, 71(2), pp. 78-80.
de Abreu-Harbich, L.V., Labaki, L.C. and Matzarakis, A. (2015) 'Effect of tree planting
design and tree species on human thermal comfort in the tropics', Landscape and Urban
Planning, 138, pp. 99-109.
De Dear, R.J. and Brager, G.S. (2002) 'Thermal comfort in naturally ventilated buildings:
revisions to ASHRAE Standard 55', Energy and buildings, 34(6), pp. 549-561.
De Vaus, D. (2002) Analyzing social science data: 50 key problems in data analysis. Sage.
Deparment, B.E. (2012) Guidelines relating to planning for public school infrastructure.
South Africa.
Deparment Of Public Education (2012) Guidelines Relating To Planning For Public School
Infrastructure. Available at:
file:///D:/11_4_47_Guidelines%20relating%20to%20planning%20for%20public%20school%
20infrastructure.pdf (Accessed: 12/5/2018).
Desforges, C. and Abouchaar, A. (2003) The impact of parental involvement, parental
support and family education on pupil achievement and adjustment: A literature review.
DfES publications Nottingham.
DfES (2006a) 'Building Bulletin 99: Briefing Framework for Primary School Projects'. The
Stationery Office London.
DfES (2006b) Building bulletin 101–ventilation of school buildings. Available at:
https://levcentral.com/wp-content/uploads/2016/10/Building_Bulletin_101.pdf (Accessed:
13/8/2018).
Ding, Y., Wang, Z., Feng, W., Marnay, C. and Zhou, N. (2016) 'Influence of occupancy-
oriented interior cooling load on building cooling load design', Applied Thermal Engineering,
96, pp. 411-420.
Dockrell, J.E. and Shield, B.M. (2006) 'Acoustical barriers in classrooms: The impact of noise
on performance in the classroom', British Educational Research Journal, 32(3), pp. 509-525.
Earthman, G. (2004) 'Prioritization of 31 Criteria for School Building Adequacy, 2004',
American Civil Liberties Union Foundation of Maryland: Baltimore, MD.
Earthman, G.I. (2002) 'School facility conditions and student academic achievement'.
Education & Skills Funding Agency (2018) Building Bulletin 101,Guidelines on ventilation,
thermal comfort and indoor air quality in schools
Version 1. Available at: https://www.gov.uk/government/publications/building-bulletin-101-
ventilation-for-school-buildings (Accessed: 11/10/2018).

202
Education, D.f. (2014) Area guidelines for mainstream schools UK.
Ellis, F. (1953) 'Thermal comfort in warm and humid atmospheres: observations on groups
and individuals in Singapore', Epidemiology & Infection, 51(3), pp. 386-404.
Evans, G.W. and Lepore, S.J. (1993) 'Nonauditory effects of noise on children: A critical
review', Children's environments, pp. 31-51.
Fang, L., Wyon, D., Clausen, G. and Fanger, P.O. (2002) 'Sick building syndrome symptoms
and performance in a field laboratory study at different levels of temperature and humidity',
Indoor Air, 2, pp. 466-461.
Fanger, P.O. (1973) 'Assessment of man's thermal comfort in practice', Occupational and
Environmental Medicine, 30(4), pp. 313-324.
Farooq, M.S., Chaudhry, A.H., Shafiq, M. and Berhanu, G. (2011) 'Factors affecting students’
quality of academic performance: a case of secondary school level', Journal of quality and
technology management, 7(2), pp. 1-14.
Feriadi, H. and Wong, N.H. (2004) 'Thermal comfort for naturally ventilated houses in
Indonesia', Energy and Buildings, 36(7), pp. 614-626.
Field, A. (2009) Discovering statistics using SPSS. Sage publications.
Field, A. (2018) Discovering statistics using IBM SPSS Statistics Fifth edn. SAGE
PUBLICATIONS
Field, A., Miles, J. and Field, Z. (2012) Discovering statistics using R. Sage publications.
Folkard, S. (1975) 'Diurnal variation in logical reasoning', British Journal of Psychology,
66(1), pp. 1-8.
Folkard, S. and Monk, T.H. (1980) 'Circadian rhythms in human memory', British journal of
psychology, 71(2), pp. 295-307.
Fountain, M., Arens, E.A., Xu, T., Bauman, F. and Oguru, M. (1999) 'An investigation of
thermal comfort at high humidities'.
Freedman, J.L., Klevansky, S. and Ehrlich, P.R. (1971) 'The Effect of Crowding on Human
Task Performance 1', Journal of Applied Social Psychology, 1(1), pp. 7-25.
Gagge, A.P., Burton, A.C. and Bazett, H.C. (1941) 'A practical system of units for the
description of the heat exchange of man with his environment', Science, 94(2445), pp. 428-
430.
Garde, F., Mara, T., Lauret, A., Boyer, H. and Celaire, R. (2001) 'Bringing simulation to
implementation: presentation of a global approach in the design of passive solar buildings
under humid tropical climates', Solar Energy, 71(2), pp. 109-120.
Gaur, A.S. and Gaur, S.S. (2006) Statistical methods for practice and research: A guide to
data analysis using SPSS. Sage.

203
Ghasemi, A. and Zahediasl, S. (2012) 'Normality tests for statistical analysis: a guide for non-
statisticians', International journal of endocrinology and metabolism, 10(2), p. 486.
Givoni, B. (1976) 'Man, climate and architecture, 2dedition'. UK.
Givoni, B. (1994) 'Building design principles for hot humid regions', Renewable Energy, 5(5-
8), pp. 908-916.
Givoni, B. (1998) Climate considerations in building and urban design. John Wiley & Sons.
Givoni, B. and Hoffman, M. (1968) Effect of building materials on internal temperatures.
Gomez-Muñoz, V.M., Porta-Gándara, M. and Fernández, J. (2010) 'Effect of tree shades in
urban planning in hot-arid climatic regions', Landscape and Urban Planning, 94(3-4), pp.
149-157.
Guedes, M.C. (2019) Bioclimatic Architecture in Warm Climates: A Guide for Best Practices
in Africa. Springer.
Hakim, C. (2000) Research Design: Succesful Designs for Social Economics Research.
London: Routledge.
Hamza, N.A. (2004) 'The performance of double skin facades in office building refurbishment
in hot arid areas'.
Hamzah, B., Gou, Z., Mulyadi, R. and Amin, S. (2018) 'Thermal Comfort Analyses of
Secondary School Students in the Tropics', Buildings, 8(4), p. 56.
Hartas, D. (2011) 'Families’ social backgrounds matter: Socio-economic factors, home
learning and young children’s language, literacy and social outcomes', British Educational
Research Journal, 37(6), pp. 893-914.
Hartley, J. and Nicholls, L. (2008) 'Time of day, exam performance and new technology',
British Journal of Educational Technology, 39(3), pp. 555-558.
Hastings, N. and Schwieso, J. (1995) 'Tasks and tables: The effects of seating arrangements
on task engagement in primary classrooms', Educational Research, 37(3), pp. 279-291.
Hatamipour, M. and Abedi, A. (2008) 'Passive cooling systems in buildings: some useful
experiences from ancient architecture for natural cooling in a hot and humid region', energy
conversion and management, 49(8), pp. 2317-2323.
Hathaway, W.E. (1992) A Study into the Effects of Light on Children of Elementary School-
Age--A Case of Daylight Robbery. ERIC.
Haveman, R. and Wolfe, B. (1995) 'The determinants of children's attainments: A review of
methods and findings', Journal of economic literature, 33(4), pp. 1829-1878.
Havenith, G. (2002) 'Interaction of clothing and thermoregulation', Exogenous Dermatology,
1(5), pp. 221-230.

204
Haverinen-Shaughnessy, U., Shaughnessy, R.J., Cole, E.C., Toyinbo, O. and Moschandreas,
D.J. (2015) 'An assessment of indoor environmental quality in schools and its association with
health and performance', Building and Environment, 93, pp. 35-40.
Haverinen‐Shaughnessy, U., Moschandreas, D. and Shaughnessy, R. (2011) 'Association
between substandard classroom ventilation rates and students’ academic achievement', Indoor
air, 21(2), pp. 121-131.
Heschong, L. (1999) 'Daylighting in Schools: An Investigation into the Relationship between
Daylighting and Human Performance. Detailed Report'.
Heschong, L. (2002) 'Day lighting and student performance', ASHRAE J, 44, pp. 65-67.
Hobbs, G. and Vignoles, A. (2010) 'Is children’s free school meal ‘eligibility’a good proxy for
family income?', British Educational Research Journal, 36(4), pp. 673-690.
HSE What is thermal comfort. Available at:
http://www.fondriest.com/news/airtemperature.htm (Accessed: 06/04/2014).
Huang, Y., Akbari, H., Taha, H. and Rosenfeld, A.H. (1987) 'The potential of vegetation in
reducing summer cooling loads in residential buildings', Journal of climate and Applied
Meteorology, 26(9), pp. 1103-1116.
Humphreys, M. (1977) 'A study of the thermal comfort of primary school children in
summer', Building and Environment, 12(4), pp. 231-239.
Hwang, R.-L., Lin, T.-P., Chen, C.-P. and Kuo, N.-J. (2009) 'Investigating the adaptive model
of thermal comfort for naturally ventilated school buildings in Taiwan', International journal
of biometeorology, 53(2), pp. 189-200.
Hwang, R.L. and Chen, C.P. (2010) 'Field study on behaviors and adaptation of elderly people
and their thermal comfort requirements in residential environments', Indoor air, 20(3), pp.
235-245.
Hygge, S. (2003) 'Classroom experiments on the effects of different noise sources and sound
levels on long‐term recall and recognition in children', Applied Cognitive Psychology: The
Official Journal of the Society for Applied Research in Memory and Cognition, 17(8), pp.
895-914.
IIoeje, N.P., Onokala, P. C, Odemerho, F.O (1999) Basic geography course for seniour
seconday schools. Nigeria: Longman Nigeria Plc.
Indraganti, M., Ooka, R. and Rijal, H.B. (2012) 'Significance of air movement for thermal
comfort in warm climates: A discussion in Indian context', Actes du congrès du Network on
Comfort and Energy Use in Buildings «The changing context of comfort in an unpredictable
world»[en ligne] URL: http://nceub. commoncense. info/uploads W, 1213.

205
Jaakkola, J., Heinonen, O. and Seppänen, O. (1989) 'Sick building syndrome, sensation of
dryness and thermal comfort in relation to room temperature in an office building: need for
individual control of temperature', Environment international, 15(1-6), pp. 163-168.
Jiang, J., Wang, D., Liu, Y., Xu, Y. and Liu, J. (2018) 'A study on pupils' learning
performance and thermal comfort of primary schools in China', Building and Environment,
134, pp. 102-113.
Jing, S., Li, B., Tan, M. and Liu, H. (2013) 'Impact of relative humidity on thermal comfort in
a warm environment', Indoor and Built Environment, 22(4), pp. 598-607.
Kahl, J.K. (2005) 'Room temperature and task effects on arousal, comfort and performance',
Journal of Undergraduate Research, 8, pp. 1-5.
Karjalainen, S. (2012) 'Thermal comfort and gender: a literature review', Indoor air, 22(2),
pp. 96-109.
Kevan, S.M. and Howes, J.D. (1980) 'Climatic conditions in classrooms', Educational Review,
32(3), pp. 281-292.
Kinnear, P.R. and Gray, C.D. (1999) SPSS for Windows made simple. Taylor & Francis.
Klatte, M., Bergström, K. and Lachmann, T. (2013) 'Does noise affect learning? A short
review on noise effects on cognitive performance in children', frontiers in Psychology, 4, p.
578.
Kothari, C.R. (2004) Research methodology: Methods and techniques. New Age
International.
Kukreja, C. (1978) Tropical architecture. Tata McGraw-Hill.
Kumar, R. (2014) Research methodology: A step-by-step guide for beginners. Sage
Publications Limited.
Kwok, A.G. (1997) Thermal Comfort in Naturally-Ventilated and Air-Conditioned
Classrooms in the Tropics. UNIVERSITY of CALIFORNIA at BERKELEY.
Kwok, A.G., Reardon, J. and Brown, K. (1998) 'Thermal comfort in tropical
classrooms/Discussion', ASHRAE Transactions, 104, p. 1031.
Kwon, J. and Choi, J. (2013) 'Clothing insulation and temperature, layer and mass of clothing
under comfortable environmental conditions', Journal of physiological anthropology, 32(1),
p. 11.
Lan, L., Lian, Z., Liu, W. and Liu, Y. (2008) 'Investigation of gender difference in thermal
comfort for Chinese people', European Journal of Applied Physiology, 102(4), pp. 471-480.
Lan, L., Lian, Z. and Pan, L. (2010) 'The effects of air temperature on office workers’ well-
being, workload and productivity-evaluated with subjective ratings', Applied ergonomics,
42(1), pp. 29-36.
206
Lan, L., Wargocki, P., Wyon, D.P. and Lian, Z. (2011) 'Effects of thermal discomfort in an
office on perceived air quality, SBS symptoms, physiological responses, and human
performance', Indoor air, 21(5), pp. 376-390.
Lan, L., Wargocki, P., Wyon, D.P. and Lian, Z. (2013) 'Warmth and performance: reply to the
letter from Leyten and Kurvers (2013)', Indoor air, 23(5), pp. 437-438.
Le, T.H.V., Gillott, M.C. and Rodrigues, L.T. (2017) 'Children thermal comfort in primary
schools in Ho Chi Minh City in Vietnam'.
Leaman, A. and Bordass, B. (1999) 'Productivity in buildings: the ‘killer’variables', Building
Research & Information, 27(1), pp. 4-19.
Leaman, A., Stevenson, F. and Bordass, B. (2010) 'Building evaluation: practice and
principles', Building Research & Information, 38(5), pp. 564-577.
Leslie, R. (2003) 'Capturing the daylight dividend in buildings: why and how?', Building and
Environment, 38(2), pp. 381-385.
Liang, H.-H., Lin, T.-P. and Hwang, R.-L. (2012) 'Linking occupants’ thermal perception and
building thermal performance in naturally ventilated school buildings', Applied Energy, 94,
pp. 355-363.
Liberman, J. (1990) Light: medicine of the future: how we can use it to heal ourselves now.
Inner Traditions/Bear & Co.
Ling, C.S., Ahmad, M.H. and Ossen, D.R. (2007) 'The effect of geometric shape and building
orientation on minimising solar insolation on high-rise buildings in hot humid climate',
Journal of Construction in Developing Countries, 12(1), pp. 27-38.
Liping, W. and Hien, W.N. (2007) 'The impacts of ventilation strategies and facade on indoor
thermal environment for naturally ventilated residential buildings in Singapore', Building and
Environment, 42(12), pp. 4006-4015.
Liu, W., Lian, Z., Deng, Q. and Liu, Y. (2011) 'Evaluation of calculation methods of mean
skin temperature for use in thermal comfort study', Building and Environment, 46(2), pp. 478-
488.
Liu, W., Zhong, W. and Wargocki, P. (2017) 'Performance, acute health symptoms and
physiological responses during exposure to high air temperature and carbon dioxide
concentration', Building and Environment, 114, pp. 96-105.
Mäkinen, T.M., Palinkas, L.A., Reeves, D.L., Pääkkönen, T., Rintamäki, H., Leppäluoto, J.
and Hassi, J. (2006) 'Effect of repeated exposures to cold on cognitive performance in
humans', Physiology & Behavior, 87(1), pp. 166-176.
Mallick, F.H. (1996) 'Thermal comfort and building design in the tropical climates', Energy
and Buildings, 23(3), pp. 161-167.

207
Matthews, B. and Ross, L. (2010) Research methods. Longman/Pearson Education.
Maxwell, L.E. and Evans, G.W. (2000) 'The effects of noise on pre-school children's pre-
reading skills', Journal of environmental Psychology, 20(1), pp. 91-98.
McGregor, G.R. and Nieuwolt, S. (1998) Tropical climatology: an introduction to the
climates of the low latitudes. John Wiley & Sons Ltd.
Melikov, A.K., Skwarczynski, M., Kaczmarczyk, J. and Zabecky, J. (2013) 'Use of
personalized ventilation for improving health, comfort, and performance at high room
temperature and humidity', Indoor Air, 23(3), pp. 250-263.
Mendell, M.J. and Heath, G.A. (2005) Indoor Air. Citeseer.
Miller, R.L. (2017) SPSS for social scientists. Macmillan International Higher Education.
Mishra, A.K. and Ramgopal, M. (2015) 'A thermal comfort field study of naturally ventilated
classrooms in Kharagpur, India', Building and Environment, 92, pp. 396-406.
Monk, T.H. (2005) 'The post-lunch dip in performance', Clinics in sports medicine, 24(2), pp.
e15-e23.
Nelson, T., Nilsson, T.H. and Johnson, M. (1984) 'Interaction of temperature, illuminance and
apparent time on sedentary work fatigue', Ergonomics, 27(1), pp. 89-101.
Nicklas, M.H. and Bailey, G.B. (1996) 'Analysis of the Performance of Students in Daylit
Schools'.
Nicol, F. (2004) 'Adaptive thermal comfort standards in the hot–humid tropics', Energy and
buildings, 36(7), pp. 628-637.
Nicol, F., Humphreys, M. and Roaf, S. (2012) Adaptive thermal comfort: principles and
practice. Routledge.
Nicol, J.F. and Humphreys, M. (1998) 'Understanding the adaptive approach to thermal
comfort', ASHRAE transactions, 104, pp. 991-1004.
Omalu, I., Olayemi, I., Otuu, C., Eke, S., Hassan, S. and Uzoaga, G. (2015) 'Entomological
and parasitological indices of malaria transmission in Tungan-Goro and Gbaiko communities
in Minna, Niger State, Nigeria', Zoologist (The), 13, pp. 1-5.
Ormandy, D. and Ezratty, V. (2012) '116-121', Health and thermal comfort: From WHO
guidance to housing strategies.
Pallant, J. (2005) 'SPSS Survival Manual: A Step By Step Guide to Data Analysis Using
SPSS for Windows (Version'. Allen & Unwin Pty, Crows Nest, Australia.
Park, J. (2016) 'Temperature, test scores, and educational attainment', Unpublished working
paper.
Parson, K. (2003) 'Human thermal environments', Human Thermal Environments.

208
Paulus, P.B., Annis, A.B., Seta, J.J., Schkade, J.K. and Matthews, R.W. (1976) 'Density does
affect task performance', Journal of Personality and Social Psychology, 34(2), p. 248.
Peccolo, C.M. (1962) The effect of thermal environment on learning. State University of
Iowa.
Peng, C.-Y.J., Chen, L.-T., Chiang, H.-M. and Chiang, Y.-C. (2013) 'The impact of APA and
AERA guidelines on effect size reporting', Educational Psychology Review, 25(2), pp. 157-
209.
Petersen, S., Jensen, K., Pedersen, A. and Rasmussen, H.S. (2016) 'The effect of increased
classroom ventilation rate indicated by reduced CO 2 concentration on the performance of
schoolwork by children', Indoor Air, 26(3), pp. 366-379.
Pilcher, J.J. and Huffcutt, A.I. (1996) 'Effects of sleep deprivation on performance: a meta-
analysis', Sleep, 19(4), pp. 318-326.
Pilcher, J.J., Nadler, E. and Busch, C. (2002) 'Effects of hot and cold temperature exposure on
performance: a meta-analytic review', Ergonomics, 45(10), pp. 682-698.
Porras‐Salazar, J.A., Wyon, D.P., Piderit‐Moreno, B., Contreras‐Espinoza, S. and Wargocki,
P. (2018) 'Reducing classroom temperature in a tropical climate improved the thermal
comfort and the performance of elementary school pupils', Indoor air.
Rabah, K.V. and Mito, C. (2000) World Renewable Energy Congress VI. Elsevier.
Ralegaonkar, R.V. and Gupta, R. (2010) 'Review of intelligent building construction: A
passive solar architecture approach', Renewable and Sustainable Energy Reviews, 14(8), pp.
2238-2242.
Reardon, C., McGee, C. and Milne, G. (2013) Passive Design, thermal mass. Available at:
http://www.yourhome.gov.au/sites/prod.yourhome.gov.au/files/pdf/YOURHOME-
PassiveDesign-ThermalMass.pdf (Accessed: 18/05/2017).
Remenyi, D., Williams, B., Money, A. and Swartz, E. (1998) Doing research in business and
management: an introduction to process and method. Sage.
Ridha, S., Ginestet, S. and Lorente, S. (2018) 'Effect of the Shadings Pattern and Greenery
Strategies on the Outdoor Thermal Comfort', International Journal of Engineering and
Technology, 10(2).
Roaf, S., Nicol, F., Humphreys, M., Tuohy, P. and Boerstra, A. (2010) 'Twentieth century
standards for thermal comfort: promoting high energy buildings', Architectural Science
Review, 53(1), pp. 65-77.
Santamouris, M. (2006) 'Adaptive thermal comfort and ventilation', AIVC: Ventilation
Information Paper, 12.
209
Sanz, S.A., García, A.M. and García, A. (1993) 'Road traffic noise around schools: a risk for
pupil's performance?', International Archives of Occupational and Environmental Health,
65(3), pp. 205-207.
Schiavon, S., Yang, B., Donner, Y., Chang, V.C. and Nazaroff, W.W. (2017) 'Thermal
comfort, perceived air quality, and cognitive performance when personally controlled air
movement is used by tropically acclimatized persons', Indoor air, 27(3), pp. 690-702.
Schulz, W. (2005) 'Measuring the Socio-Economic Background of Students and Its Effect on
Achievement on PISA 2000 and PISA 2003', Online Submission.
Seppanen, O., Fisk, W.J. and Lei, Q. (2006) 'Effect of temperature on task performance in
office environment'.
Sharma, R. (2016) 'Sustainable buildings in hot and dry climate Of India', Journal of
Engineering Research and Applications, 6(1), pp. 134-144.
Shashua‐Bar, L., Pearlmutter, D. and Erell, E. (2011) 'The influence of trees and grass on
outdoor thermal comfort in a hot‐arid environment', International journal of climatology,
31(10), pp. 1498-1506.
Shield, B. and Dockrell, J.E. (2004) 'External and internal noise surveys of London primary
schools', The Journal of the Acoustical Society of America, 115(2), pp. 730-738.
Shield, B.M. and Dockrell, J.E. (2008) 'The effects of environmental and classroom noise on
the academic attainments of primary school children', The Journal of the Acoustical Society of
America, 123(1), pp. 133-144.
Simone, A. and Olesen, B.W. (2013) 34th AIVC conference.
Singh, M.K., Kumar, S., Ooka, R., Rijal, H.B., Gupta, G. and Kumar, A. (2018) 'Status of
thermal comfort in naturally ventilated classrooms during the summer season in the composite
climate of India', Building and Environment, 128, pp. 287-304.
Sirin, S.R. (2005) 'Socioeconomic status and academic achievement: A meta-analytic review
of research', Review of educational research, 75(3), pp. 417-453.
Smith, R. and Bradley, G. (1994) 'The influence of thermal conditions on teachers’ work and
student performance', Journal of Educational Administration, 32(1), pp. 34-42.
Sodagar, B. (1991) An Investigation Into The Thermal Performance of Housing in Hot Dry
Climate of Iran. Newcastle.
Song, J. and Stough, C. (2000) 'The relationship between morningness–eveningness, time-of-
day, speed of information processing, and intelligence', Personality and Individual
differences, 29(6), pp. 1179-1190.
Sonne, J.K., Vieira, R.K. and Cummings, J. (2006) 'School conditions will continue to earn
failing grades'.

210
Sousa, J., Monteiro, R., Tomé, D. and Rodrigues, M.A. (2019) 'Effects of Noise Frequency on
Performance and Well-Being', in Occupational and Environmental Safety and Health.
Springer, pp. 521-528.
Srivajana, W. (2003) 'Effects of air velocity on thermal comfort in hot and humid climates',
Thammasat Int J Sc Tech, 8(2), pp. 45-54.
Standard, I. (1994) '7730', Moderate thermal environments–Determination of the PMV and
PPD indices and specification of the conditions for thermal comfort.
Stansfeld, S., Hygge, S., Clark, C. and Alfred, T. (2010) 'Night time aircraft noise exposure
and children's cognitive performance', Noise and Health, 12(49), p. 255.
Tantasavasdi, C., Srebric, J. and Chen, Q. (2001) 'Natural ventilation design for houses in
Thailand', Energy and Buildings, 33(8), pp. 815-824.
Taylor, P., Mathews, E., Kleingeld, M. and Taljaard, G. (2000) 'The effect of ceiling
insulation on indoor comfort', Building and Environment, 35(4), pp. 339-346.
Tiwari, M. (2010) 'Thermal Comfort of Textile Materials and Its Assessment‖', Textile
Review, Sept.
Toftum, J. (2004) 'Air movement--good or bad?', Indoor Air, 14, pp. 40-45.
Toftum, J., Kjeldsen, B.U., Wargocki, P., Menå, H.R., Hansen, E.M. and Clausen, G. (2015)
'Association between classroom ventilation mode and learning outcome in Danish schools',
Building and Environment, 92, pp. 494-503.
UNICEF (2009) 'Child friendly school manual UNICEF', New York.
Universal Basic Education (2018) Matching grant releases (2005-2008). Available at:
https://www.ubec.gov.ng/matching-grants (Accessed: 28/09/2018).
Universal Basic Education Commision (2010) Minimun standard for basic education in
Nigeria.http://wbgfiles.worldbank.org/documents/hdn/ed/saber/supporting_doc/AFR/Nigeria/
TCH/Minimum%20Standards%20for%20Basic%20Education.pdf.
Wafi, S.R. and Ismail, M.R. (2010) 'Occupant's Thermal Satisfaction A Case Study in
Universiti Sains Malaysia (USM) Hostels Penang, Malaysia', European Journal of Scientific
Research, 46(3), pp. 309-319.
Wang, S., Shen, Z. and Gu, L. (2012) 'The impact of roof pitch and ceiling insulation on
cooling load of naturally-ventilated attics', Energies, 5(7), pp. 2178-2196.
Wannarka, R. and Ruhl, K. (2008) 'Seating arrangements that promote positive academic and
behavioural outcomes: A review of empirical research', Support for learning, 23(2), pp. 89-
93.

211
Wargocki, P. and Wyon, D.P. (2007) 'The effects of moderately raised classroom
temperatures and classroom ventilation rate on the performance of schoolwork by children
(RP-1257)', Hvac&R Research, 13(2), pp. 193-220.
Wargocki, P. and Wyon, D.P. (2017) 'Ten questions concerning thermal and indoor air quality
effects on the performance of office work and schoolwork', Building and Environment, 112,
pp. 359-366.
Weinstein, C.S. (1979) 'The physical environment of the school: A review of the research',
Review of educational Research, 49(4), pp. 577-610.
Wen, X., Lu, G., Lv, K., Jin, M., Shi, X., Lu, F. and Zhao, D. (2019) 'Impacts of traffic noise
on roadside secondary schools in a prototype large Chinese city', Applied Acoustics, 151, pp.
153-163.
Wheldall, K. and Lam, Y.Y. (1987) 'Rows versus Tables. II. The Effects of Two Classroom
Seating Arrangements on Classroom Disruption Rate, On‐task Behaviour and Teacher
Behaviour in Three Special School Classes', Educational Psychology, 7(4), pp. 303-312.
WHO (1999) Guideline for community noise. Available at:
http://www.bvsde.paho.org/bvsci/i/fulltext/noise/noise.pdf (Accessed: 8/10/2018).
WHO (2006) Constitution of the World Health organisation. Available at:
http://www.who.int/governance/eb/who_constitution_en.pdf.
Wijewardane, S. and Jayasinghe, M. (2008) 'Thermal comfort temperature range for factory
workers in warm humid tropical climates', Renewable Energy, 33(9), pp. 2057-2063.
Wohlfarth, H. (1984) 'The effect of color-psychodynamic environmental modification on
disciplinary incidents in elementary schools over one school year: A controlled study',
International Journal of Biosocial Research.
Wong, L., Fong, K., Mui, K., Wong, W. and Lee, L. (2009) 'A field survey of the expected
desirable thermal environment for older people', Indoor and built environment, 18(4), pp.
336-345.
Wong, N.H. and Khoo, S.S. (2003) 'Thermal comfort in classrooms in the tropics', Energy
and buildings, 35(4), pp. 337-351.
Wyon, D., Fanger, P., Olesen, B. and Pederson, C. (1975) 'The mental performance of
subjects clothed for comfort at two different air temperatures', Ergonomics, 18(4), pp. 359-
374.
Wyon, D.P., Andersen, I. and Lundqvist, G.R. (1979) 'The effects of moderate heat stress on
mental performance', Scandinavian Journal of Work, Environment & Health, pp. 352-361.

212
Zahiri, S. and Altan, H. (2016) 'The effect of passive design strategies on thermal
performance of female secondary school buildings during warm season in a hot and dry
climate', Frontiers in built environment, 2, p. 3.
Zeiler, W. and Boxem, G. (2009) 'Effects of thermal activated building systems in schools on
thermal comfort in winter', Building and Environment, 44(11), pp. 2308-2317.
Zhang, F. and de Dear, R. (2017) 'University students' cognitive performance under
temperature cycles induced by direct load control events', Indoor air, 27(1), pp. 78-93.
Zhang, F., Haddad, S., Nakisa, B., Rastgoo, M.N., Candido, C., Tjondronegoro, D. and de
Dear, R. (2017) 'The effects of higher temperature setpoints during summer on office workers'
cognitive load and thermal comfort', Building and Environment, 123, pp. 176-188.