a strategy to leverage washington state’s unique maritime
TRANSCRIPT

Maritime Sector Strategy A Strategy to Leverage Washington State’s Unique Maritime
Assets, Geography, History, and Infrastructure
December 2014 Report to the Legislature
Brian Bonlender, Director

Maritime Sector Strategy
Acknowledgements Washington State Department of Commerce
Office of Economic Development and Competitiveness Steve Sewell, Maritime Sector Lead Research Services Darleen Muhly, Lead Researcher Amber Siefer, Researcher Graham Parrington, Researcher Steve Salmi, Unit Manager Steve Sewell, [email protected] Washington State Department of Commerce Office of Economic Development and Competitiveness 2001 6th Avenue, Suite 2600 Plum St. SE Seattle, WA 98121 www.commerce.wa.gov For people with disabilities, this report is available on request in other formats. To submit a request, please call 360-725-4000 (TTY 360-586-0772).

Maritime Sector Strategy
Table of Contents
Executive Summary ........................................................................................................................ 1
Background and Sector Definition ................................................................................................ 4
Economic Impact ............................................................................................................................ 5
Overarching Strategies and Actions ............................................................................................. 7
Specific Strategies to Support the Maritime Industry ............................................................... 13
Conclusion .................................................................................................................................... 28
Appendix A: Washington’s Maritime Industry ........................................................................... 29 Appendix B: Government Incentives and Programs to Encourage International
Trade and Economic Development (Port of Seattle) ........................................... 49

Maritime Sector Strategy 1
Executive Summary
Overview
In the 2013 session, the Legislature directed the Department of Commerce (Commerce) to develop “an economic cluster strategy to leverage the state’s unique maritime assets, geography, history, and infrastructure. Goals include growing employment, targeted economic activity, environmental considerations, tax revenue to state and local governments, and quality of life associated with the maritime sector by working with the industry to understand workforce needs, parity considerations with Oregon and British Columbia, and tax structure and regulatory barriers” (ESSB 5034 Chapter 4, Laws of 2013, 128(15). This report, in response to that directive, was developed by Department of Commerce maritime sector lead with support from the department’s research staff. Sources include original research, published reports, more than 100 interviews and meetings with industry representatives of the various subsectors of the maritime sector, and attendance at more than 50 industry events. The study comprises two main components. The first is a set of strategic actions that benefit this very diverse industry as a whole. The second is an analysis and recommendations in three specific areas of challenge and opportunity for the industry – recreational boating, commercial fishing, and port competitiveness.
Maritime Sector
The maritime sector is a major contributor to the state’s economy, producing 148,000 jobs and $30 billion in fiscal impact, according to a November 2013 study by Community Attributes, Inc. (CAI). As a whole, it is a healthy and growing part of the economy, but faces competitive threats, both domestically and globally. The Maritime sector’s diverse set of industries includes the following subsectors:
• Cargo handling and logistics • Fishing and seafood processing • Ship and boat building, repair and maintenance • Passenger vessel operations • Recreational boating • Numerous support industries
Not only does the maritime industry provide many jobs for the state’s workers, these are also good jobs, averaging $70,800 as compared to the statewide median pay of $52,000. (CAI) While the industry as a whole is healthy, some segments are facing major challenges.

Maritime Sector Strategy 2
This report summarizes the status and competitive position of the industry, describes existing and potential future actions that will benefit the industry as a whole, and focuses on three areas of major challenge and opportunity:
1. Recreational boating, which was hit harder by the recession than any other subsector. 2. The opportunity to support and grow the state’s fishing industry (the largest industry
component by gross business income), through support for rebuilding the North Pacific fishing fleet.
3. The competitiveness of our major ports, which have continued to lose market share to other parts of the country and to Canada.
Although the strategy and action plans for growing and improving jobs in the industry differ for each of the above segments of the maritime sector, there are certain overarching elements that apply across all segments. These include:
• Effectively telling the story and raising awareness of the importance of the maritime industry to job growth and the state’s economy.
• Fostering a balanced regulatory regime that supports the industry while protecting the environment and providing sufficient resources for other priorities, like education and transportation.
• Developing better coordinated, better publicized, more effective maritime workforce development, training, and education programs.
Key Findings
Among other findings and recommendations in this report, the following are key findings in the three specific areas of emphasis above, and are the subject of extensive analysis in Appendix A.
1. The requirement that non-resident, entity-owned vessels pay excise tax after 60 days in state waters is a disincentive to boaters remaining in state waters, resulting in lost revenue and job opportunities in the recreational boating industry. Changing this law so that entity-owned boats are treated equally with individually owned boats (which can remain in state waters for 180 days) will result in increased economic activity for the state.
2. Washington is the home for the North Pacific fishing fleet, with the large majority of that fleet based in our state. The fleet is old, and many boats need to be replaced. This is estimated to be a $7 billion to $14 billion opportunity, as these boats must be built in the United States. (Phillips/Dixon, see references below) While labor costs are lower in several competing states, Washington can capitalize on other advantages. The state should consider actions that could incentivize vessel owners to build new boats here.
3. Many states have enacted incentives to attract trade and port-related investment. For example, it is said that “vessels follow cargo,” and some states have effectively increased the volume of trade through their ports by providing incentives for the location of major warehouse and distribution facilities in their state and financial

Maritime Sector Strategy 3
incentives for increasing port cargo volumes. The state should explore the adoption of such incentives. In addition, our ports’ competitiveness will be strengthened by:
a. Funding of port-related transportation projects. b. The limiting of new taxes and regulations that could negatively affect trade
through the state.

Maritime Sector Strategy 4
Background and Sector Definition Washington State’s maritime sector has long been a cornerstone of the state’s economy. It is based on the early development of industries such as timber and fishing, and the state’s strategic location as a center for domestic and international trade, with development of connections to Alaska during the Gold Rush, and regular steamship and rail service from Asia to U.S. East Coast markets beginning in the late 1800s. Today, the maritime sector continues to support these industries and trade routes, and many others, including:
• Cargo handling and logistics activities – our ports, along with cargo ship operations, tugs, pilots, terminal operators and numerous other activities involved in the movement of freight.
• Fishing and seafood processing – a variety of vessels, on shore and offshore processing facilities serving an even larger variety of seafood species.
• Ship and boat building, repair and maintenance – small, medium and large yards serving both the recreational and commercial markets.
• Passenger vessel operations – a recently developed large cruise ship market, numerous smaller cruise, sightseeing and excursion operations – as well as the largest ferry system in the country,
• Recreational boating – marinas, the sale and maintenance of boats, sport fishing and related activities.
• Numerous support and marine technology companies – the sector relies on a diverse and concentrated support ‘cluster’ – including everything from fueling operations, marine electronics, refrigeration and gear manufacturers to research and technology, naval architects and other professional services.

Maritime Sector Strategy 5
Economic Impact
Direct Impacts
In 2012, Washington’s maritime sector employed more than 57,700 people directly, and was responsible for $15.2 billion in gross business income (GBI). (CAI) As a point of comparison, aerospace manufacturing employs 94,000 people directly. Cargo handling and logistics was the largest maritime employer in the state in 2012, accounting for 29 percent of maritime employment. Boat and ship building, repair, and maintenance employs 28.6 percent of the total workforce in the sector, followed by fishing and seafood processing with 27 percent. However, fishing and seafood processing accounted for nearly 60 percent of total revenues ($8.6 billion GBI). Cargo handling and logistics was the second largest contributor, at nearly 25 percent of total revenues. (CAI)
Indirect and Induced Impacts
Indirect and induced maritime jobs account for another 90,000 jobs, for a total impact of 148,000 Washington jobs. The direct contribution of maritime’s $15.2 billion in gross business income generates another $14.8 billion in induced and indirect output, for a total impact on Washington’s economy of $30 billion. (CAI)
Wages and Growth
The maritime sector paid over $4 billion in wages and salaries in 2012. Including employment-related benefits, the total compensation paid in the sector was over $5 billion. The three largest contributors were boat and shipbuilding, repair, and maintenance; fishing and seafood processing; and cargo handling and logistics. All contributed nearly 30 percent to the sector total. As noted previously and contrary to the perception of many, the sector produces good, family-wage jobs. The average annual pay (not including benefits) for workers in the maritime sector was $70,800. This compares to the annual average of jobs statewide in all sectors of $52,000. (CAI) Also contrary to popular perception, the industry is not dying or ‘old.’ Over the past 10 years, it has grown at an average annual rate of 6.4 percent. (CAI and Commerce)

Maritime Sector Strategy 6
Table 1: Summary of Maritime Impacts, Washington State, 2012
Core Sectors Number of Employer
Establishments
Wages (in millions of
dollars)
Direct Jobs
Gross Business Income
(in millions of dollars)
Passenger Water Transportation 130 $262.8 4,500 $544.5
Boat and Ship Building, Repair, and Maintenance
150 $1,163.8 16,500 $1,489.7
Maritime Support Services 300 $387.7 4,600 $864.2
Fishing and Seafood Processing 720 $1,113.4 15,400 $8,592.6
Maritime Logistics and Shipping 800 $1,156.0 16,700 $3,722.4
Total 2,100 $4,083.7 57,700 $15,213.3 Source: Community Attributes, Inc.

Maritime Sector Strategy 7
Overarching Strategies and Actions As noted previously, the maritime industry is very diverse, and each segment of the industry operates in a unique business environment. However, there are certain challenges and opportunities that cross all segments of the industry. Focusing efforts on those areas can have a positive impact on the industry as a whole. Several recent initiatives have found commonality in the priorities across the industry. A new organization – the Washington Maritime Federation, Seattle Mayor Ed Murray’s Maritime and Manufacturing Summit, the Joint Legislative Task Force on the Economic Resilience of Maritime and Manufacturing, and Commerce’s ongoing outreach to the industry over the past year have all identified the following as priorities in protecting and growing the industry:
A. Raising the visibility of the industry and raising awareness of its importance to the state’s economy
B. Workforce development, education, and training C. Regulatory and land use policies that balance environmental protection and revenue
enhancement with job growth D. Improvement of transportation infrastructure

Maritime Sector Strategy 8
A. Raising Awareness
Raising the awareness and visibility of the maritime industry is a high priority across all segments of the industry. While it is well recognized that the aerospace, technology and agriculture industries, for example, are major drivers of the state’s economy, maritime’s role as a substantial positive driver is not as well recognized. Maritime industry leaders believe that raising the visibility of the industry among policy makers, the broader business community, and the general public, is an essential first step in sustaining and growing this sector. Several efforts to do so are underway. Commerce is actively involved in all of these. Four examples follow. The Washington Maritime Federation (the Federation). The Federation is a new organization, developed over the past year to represent the maritime industry broadly. While there are more than 20 separate organizations that represent various components of the maritime industry, the industry has never had an organization that can speak with a single voice to represent the common interests of the industry. The Federation has been formed as an ‘association of associations,’ bringing together these disparate groups for the first time under one entity. The primary goals of the organization are to raise the visibility of the industry, educate, and advocate on issues of common interest (such as regulatory, land use and tax policy, transportation infrastructure development and workforce development). The Joint Legislative Task Force on the Economic Resilience of Maritime and Manufacturing (Maritime Task Force). The Maritime Task Force was created by passage of legislation in the past session of the Legislature to examine the status and competitiveness of the state’s maritime and manufacturing industries and to make recommendations on, among other things:
• Regulatory consistency and certainty in the areas of urban planning, land use permitting.
• The critical public infrastructure that supports and sustains the maritime. • The educational resources and support services available to support and sustain the
development of the maritime and manufacturing sectors. Seattle Mayor Murray’s Maritime and Industrial Summit (the Summit). The Summit brought together maritime and industrial stakeholders with the goal of supporting and growing the city’s maritime, manufacturing and logistics industries. Follow on activities from the Summit focus on the following areas:
• The land use and regulatory environment • Infrastructure and freight mobility • Communication, “Telling our Story” • Skilled Workforce
Establishment of a Maritime Industry Sector Lead. At the Governor’s direction, Commerce established a Maritime Industry Sector Lead position to sustain, grow, and improve jobs in the maritime sector. The sector lead has been actively involved in all of the above initiatives as well

Maritime Sector Strategy 9
as having active involvement in industry outreach and serving as a liaison between state government and the maritime industry, and carrying the message of the importance of this industry through industry and public outreach. Conclusion
As is evident from the above, numerous efforts are underway at the state and local level to raise the visibility of the industry and to coordinate those efforts to more effectively ‘tell the maritime story.’ These efforts should be continued and supported.
B. Workforce Development, Education and Training
All of the initiatives above, and several others, have identified development of a skilled workforce as critical to sustaining and growing the maritime industry. In addition to the above initiatives, there are others underway. Two examples follow, both of which, again, are actively supported by Commerce. Washington Maritime Roundtable (Washington Maritime)
This effort was convened by the Northwest Center of Excellence for Marine Manufacturing and Technology (Center of Excellence), the Seattle Colleges, the Port of Seattle and the Department of Commerce, and is being led by the Center of Excellence. Washington Maritime is a coalition of public and private maritime education and training providers and industry representatives. The vision of Washington Maritime is: “Washington is recognized as the leader for maritime training and education in the United States, providing highly skilled workers to meet the wide range of the maritime industry’s needs.” The mission is: “Washington Maritime is an alliance of education and training providers, working collaboratively with industry and professional associations to advance Washington’s leadership role is the global marine industry. Washington Maritime enhances the competitiveness of Washington’s exceptional maritime industry by providing innovative, relevant education and training to faculty, students, and the incumbent workforce.” Findings thus far are:
• The industry and the good jobs available in it are not well known by students, parents, teachers and guidance counselors.
• There are many good education and training programs being provided, but they are not well known, they are not well connected, and are not sufficiently funded.
• The programs provided are sometimes not well understood by, or connected to industry

Maritime Sector Strategy 10
Immediate actions identified are:
• Publicize and communicate the availability of jobs and training. A website and other materials are being developed to do this, and coordination with the Washington Maritime Federation to synchronize communication efforts is occurring.
• Develop and publicize clear pathways to jobs and careers in the industry. This will be part of the communications effort with a website that clearly depicts these pathways.
• Work more closely with industry to understand and provide priorities for education and training. This is ongoing, through recruitment of additional industry representatives into Washington Maritime, and through integration into the Federation’s work.
Core Plus
Through the initiatives above, input from the maritime industry is that better trained workers are needed with basic skills that do not necessarily have to be provided through baccalaureate degrees. Core Plus is a public/private initiative to give high school student the basic skills necessary to work in manufacturing and related occupations. It was initially focused on aerospace careers, but efforts are underway now to expand it into other industry sectors, including maritime. Core Plus was introduced in January 2012 through a pilot project in Yakima. Today, it is available at 30 locations with enrollment options available to students from more than 160 high schools. Core Plus is based on industry reviewed and validated Knowledge Skills and Abilities (KSAs) that students are able to learn through classes in Computer-Aided-Design, Metal Fabricating, Aerospace Technology, Marine Technology, Machining, Construction and Agricultural Support Services. Core Plus is still under development. It was developed to this point by a team that includes senior staff from the Office of the Superintendent for Public Instruction, instructors from The Boeing Company, members of the Manufacturing Industrial Council of Seattle and other companies across the state. Efforts are now underway to expand the program into maritime-specific skills and an industry group has been formed to support this initiative. Conclusion
As indicated above, every maritime initiative underway highlights the need for better educated and trained workers. The efforts of the Federation, the Maritime Task Force, Washington Maritime, Core Plus and others should be continued and supported.

Maritime Sector Strategy 11
C. Regulatory and Land Use Policies
All of the forums discussing support for the maritime industry have recommended that one of the highest priorities in sustaining and growing the industry is promoting regulator and land use policies that balance environmental protection and revenue enhancement with job growth. Specific areas raised consistently by industry are regulatory certainty and consistency, a more- efficient permitting process, water quality, tax policy and land use regulation. Maritime industries, because they are typically located on or near the water, are subject to regulations and permits related to water quality, aquatic life and related matters. This can take the form of storm water permits, Corps of Engineers permits, hydraulic permits, Department of Natural Resource leases, invasive species regulation, waste discharge, water quality monitoring, etc. Coordination of these processes is often lacking, resulting in added time and expense. Because many maritime businesses are involved in international trade, any tax advantages possessed by competing states can have a detrimental effect on their competitiveness. (See examples in Appendix A.) Again, because of their presence on the water, many maritime businesses are subject to development pressure to convert attractive waterfront properties to non-maritime uses. This is particularly true in rapidly urbanizing areas where land values for non-maritime use may exceed the value for continued maritime use. Conclusion
In enacting regulations and legislation, the state should consider the potential negative impacts on maritime activity, jobs, and the maritime economy. The state should also strive for regulatory certainty, so that maritime businesses can make investments with as much knowledge as possible of regulatory, environmental and land use risk. The Maritime Task Force will be addressing these issues more specifically over the coming year, giving the Legislature an opportunity to become engaged in how the state can effective balance the two valid interests.
D. Improvement of Transportation Infrastructure
Another priority highlighted by every current maritime initiative is the importance of adequate funding for transportation infrastructure. Being able to move freight efficiently is particularly important for those segments of the industry where the movement of freight is critical to their competitive success. This topic is discussed in more detail with regard to the two state’s major ports, below and in Appendix A. However, it is important to note that freight mobility (by both road and rail) is also critically important to other ports in the state, their customers and

Maritime Sector Strategy 12
communities. Properly planned and designed, freight transportation enhancements can also have significant positive impacts on personal mobility. Conclusion
It is critically important that all parties work together to address the funding of critical transportation infrastructure, specifically in this context, the efficient movement of freight. Improved port infrastructure can move goods efficiently from vessels through marine terminals, but any efficiencies gained through development of port infrastructure cannot be fully realized if there are chokepoints elsewhere in the supply chain that prevent the entire system from functioning efficiently. There are models from the past that show how local, state, private, and federal collaboration can work – for example FAST Corridor. The Freight Action Strategy for the Everett-Seattle-Tacoma Corridor (FAST Corridor) is a partnership of 26 local cities, counties, ports, federal, state, and regional transportation agencies, railroads and trucking interests, intent on solving freight mobility problems with coordinated solutions. The project involved shared planning and funding and resulted in a series of grade separations and related projects that helped cargo move more efficiently. Since 1998, the partners have identified and assembled $568 million of public and private funding to build nine strategic infrastructure improvements and start four more. This kind of model should be revisited to address growing needs for investment in freight mobility.
Maritime Sector Strategy 13
Specific Strategies to Support the Maritime Industry As noted previously, and in addition to the strategies discussed above that will benefit the industry as a whole, there are three specific strategies recommended that address challenges and opportunities in the Recreational Boating, Fishing/Shipyard, and Port segments of the maritime industry. A summary of those findings and strategies follows, with detailed analysis of each in Appendix A.
Recreational Boating
Recreational boating is not only a part of the culture of our state; it has a significant positive economic impact. While many think of yachts when recreational boating is mentioned, more than 90 percent of recreational boats are less than 30 feet, and many are sail and unpowered craft. The economic impact from recreational boating is created by spending throughout boat owners’ spending cycle. Boat building creates jobs and economic activity for boat builders (of which there are many in Washington), designers, engineers, and component manufacturers. Sales have impacts on brokers, dealers, and financers. Ownership creates impacts in permanent moorage, maintenance and repair, insurance, parts, and accessories. Operation creates spending for fuel, guest moorage, and visited retail. (Hebert) The state received $70 million in recreational boating-related revenue from 2007-2009, according to a 2010 Joint Legislative Audit and Review Committee study (not including sales tax from the sale of boats and equipment, B&O tax on recreational boating businesses, and some other revenue sources). The study showed that industry was a net contributor to state resources, as the state spent $54 million on recreational boating-related activities during the same time period. The CAI summary does not break out recreational boating separately. Rather, recreational boating activities are including in ship and boat building, repair and maintenance, and support services. However, a study done by well-regarded researchers at the National Marine Manufacturers Association’s Recreational Marine Research Center at Michigan State University, based on 2013 data (and cited in the CAI study), reports the following for the state of Washington:
• There are 254,775 recreational boats in the state. • There are 1,427 recreational boating businesses. • There are 12,615 direct jobs created by recreational boating activities (25,585 including
indirect and induced jobs). • The primary businesses creating these jobs are:
o Boat building. o Motor/engine manufacturing.
Maritime Sector Strategy 14
o Accessory and supplies manufacturing. o Dealers and wholesalers. o Boat services.
• Recreational boating has $3.18 billion in total economic impact in the state. (See Figure 1)

Maritime Sector Strategy 15
Figure 1: Economic Impact of Recreational Boating in Washington
Source: Michigan State University

Maritime Sector Strategy 16
In the 2013 and 2014 legislative sessions, the Marine Tourism Bill (SB 5241/HB1366) was proposed to temporarily extend the availability of use permits, for purposes of vessel sales and use taxation, to non-resident business entities. It would also allow those entities to acquire a vessel permit to remain in Washington for up to six months, as is currently permitted for individual-owned vessels. Under current law, non-resident, entity-owned vessels must either leave the state after 60 days or pay an excise tax equal to the amount of sales tax on the value of the vessel. This is clearly a disincentive for visiting vessels to remain in the state and contribute to the economic activity described above. On its face, this seems like legislation that should be supported, but a key question is whether there is a negative impact on state revenue (in addition to the positive spending impacts if the vessels can stay in state waters for an additional four months). The Department of Revenue has calculated that there would be a negative state revenue impact if the legislation were enacted. Unfortunately, there is no precise data to determine how many boats now stay beyond the 60 days and what effect passage of the legislation would have on the number of boats remaining. Because of the substantial cost to a visiting boat owner to stay beyond 60 days (7.6 to 9.5 percent of the value of the boat), it may also be reasonable to assume that few, if any, boats stay in Washington waters and pay the tax. This is a difficult matter to determine, but we believe it is important to work with industry to refine this analysis and seek to achieve a mutually satisfactory resolution. A separate bill (the Marine Jobs Bill (SB5817/HB1927) has also been proposed. This bill would cap the amount of sales tax on the sale or use of a boat at $300,000. While this change might – as put forth by industry advocates of the bill – increase economic activity substantially through increased boat sales and visits, the Department of Revenue calculates that this would have a combined negative impact on state revenue of $2.8 million. Vessel owners can avoid paying Washington sales tax by keeping their boats in neighboring jurisdictions, such as British Columbia or Oregon, which do not have a comparable tax. See Appendix A, “Recreational Boating,” for a detailed analysis. Conclusion
Both the Marine Tourism and Marine Jobs bills have the potential to increase the significant economic impact of recreational boating in the state. Therefore, as stated above, we should continue to work with industry interests to implement legislation that will support the maritime sector and the recreational boating industry specifically.

Maritime Sector Strategy 17
Fishing Fleet Recapitalization
The large majority of boats in the North Pacific fishing fleet are based in the state of Washington, and the economic impact from their activity is largely realized here. The average age of the fleet is more than 30 years, and as many as half of the boats currently fishing in the Bering Sea and other Alaska fisheries need to be replaced. Historically, financing vessel replacement has been difficult because of uncertainty about the health of the resource, and uncertainty about the share of the catch any individual vessel owner might get in the future. Today, the fishery is stable and is considered one of the best managed in the world, and the quota system now in place means that vessel owners can be assured of their catch and associated revenue going forward. While commercial banks are showing more interest in financing new vessels, financing is still only available to the best-financed companies, due to historic uncertainty about both the health of the resource, and the stability of the shipyards that build the vessels. Several efforts are underway at the federal level to incentivize rebuilding of the fleet. All of these boats must be built in the United States, but any changes in federal law will likely not advantage Washington over other states. Estimates of the cost to recapitalize the fleet range from several billion dollars to $14 billion (Appendix A). The vast majority of the boats in the fleet are based in Washington, so the potential revenue and job impact of this activity could be realized mostly in this state. Congress recently reformed some outdated vessel replacement and rebuilding restrictions, and fishing companies are starting to plan for the replacement and upgrading of their aging vessels. According to the National Marine Fisheries Service (NMFS), more than 900 of vessels participating in federal fisheries offshore of Alaska in 2010 were built in the 1970s and 1980s. With the average vessel over 30 years old, there is a significant and immediate need for the fleet to start upgrading and replacing vessels. Table 2: Fishing Fleet Replacement Estimates
Vessel Type Number of Vessels Average Age Cost to Replace (In millions of dollars)
Amendment 80 Non-Pollock 23 35 years 40 - 75
Pacific Cod Freezer Long Line 39 40 years 25 - 45
AFA Catcher-Processor 15 38 years 100 - 150
Bering Sea Crab 79 33 years 10 - 14 Source: National Marine Fisheries Service Other estimates from industry experts result in much higher replacement cost – $7 billion and $14 billion. (See Table 3)

Maritime Sector Strategy 18
Table 3: 2014 Value of the Fishing Fleet
Fleet Number of
Vessels Current
Number of Vessels
Needed to Replace
Current Fleet
Average Replacement
Cost (in millions of
dollars)
Total Replacement
Cost (in millions of
dollars)
AFA Catcher Vessels 83 83 17 1,411
AFA Catcher Processors 15 15 135 2,025
AFA Mothership Cacher Vessels 16 16 17 272
AFA Mothership Vessels 4 4 200 800
Non-AFA Bering Sea Catcher Vessels 13 13 16 208
Amendment 80 Fleet 24 15 70 1,050
Western Gulf of Alaska Trawlers 42 34 9 302.4
Central Gulf of Alaska Trawlers 53 42 9 381.6
Freezer Longliners 39 39 42 1,638
Halibut Fleet (IFQ and CDQ) 635 317 3 952.5
Other Halibut Boats 1,090 275 3 817.5
Longline Catcher Vessels 74 19 3 55.5
Jig Fleet 77 14 1 15.4
Groundfish Pot Vessels 123 82 15 922
Bering Sea Crab Fleet 79 79 12 948
Scallop Fleet 4 3 15 45
Alaska Seine Fleet 400 400 5 2,000
Alaska Gillnet Fleet 1,400 1,400 0.35 490
Total Replacement Cost of Fleet 4,171 2,829 14,334.4 Source: Fisherman’s News Although not all vessels will need to be replaced in the next decade or two, a significant number must be. Under any estimate, new vessel construction and upgrades will provide billions of dollars in economic activity, and fishing industry representatives estimate that as many as four to five thousand jobs could be created at the peak of construction. (Based on recent economic impact data developed by CAI, statewide ship and boat yard activity supports approximately 1,400 direct jobs for every $100 million in revenue.)

Maritime Sector Strategy 19
New vessels will enhance safety, be more energy efficient, and be designed to further increase product utilization and the economic value of harvested resources. For example, the 195’ FV Blue North freezer long liner, currently under construction at Dakota Creek Industries, will reduce emissions by 30 percent, utilizing diesel electric propulsion and a more energy efficient hull design. Its design includes a “moon pool,” allowing one fish to be caught at a time through an internal haul station. This allows for the release of non-target species, as well as allowing the crew to accomplish their work inside the boat without being exposed to rough seas or freezing temperatures and with no risk of falling overboard during hauling. The vessel’s factory will efficiently utilize proteins onboard – the fish wastage that is commonly ground up and discharged overboard. Modern processing equipment can utilize more than 95 percent of each fish, as compared to less than 50 percent in older boats, as parts of the fish not used for meat can be processed into fish meal and fish oil. Some new boats utilize excess fish oil for propulsion, and the goal of one company currently designing a boat is a 100 percent carbon-neutral operation. Conclusion
There are many good reasons to support recapitalization of the North Pacific fishing fleet. The potential economic activity created is one of the largest, if not the largest, opportunity in the maritime industry. The new boats are more environmentally friendly, safer, and utilize the resource more effectively. While federal legislation may be necessary to accelerate replacement of old vessels, replacement will occur, and the boats will be built in the U.S. The state of Washington has an inherent advantage in the location of most boat owners and the support infrastructure here. However, other areas of the country have advantages, including lower labor costs. Fishing fleet recapitalization represents an important business opportunity for Washington’s shipyards. For this reason, the Legislature should consider incentives to promote building of these boats in this state.
For example, should the state consider a preferential B&O rate, the revenue impact to the state would be small (potentially less than $50,000 depending on how the preference is structured). Yet this tax preference would provide an additional tool to Washington’s shipbuilders to bring these projects to Washington (detailed discussion of B&O tax impacts in Appendix A).
Port Competitiveness
Washington is fortunate to have a vibrant and unique public ports system, with 75 ports in all corners of the state providing jobs and economic development for their communities. While most of these ports do not provide access to deep water and international shipping, most do rely on the deep-water ports to get goods to market. A number of the marine ports – for example, Everett, Grays Harbor, Vancouver, Kalama, and Longview – have diversified from traditional, forest products-oriented cargoes to bulk, break-bulk, roll-on/roll-off, project cargo and other activities, and have grown and prospered by employing these strategies.

Maritime Sector Strategy 20
Likewise, the state’s two large container ports (Tacoma and Seattle), despite serving a much smaller population base than some other regions, have been successful in developing the third largest container load center in the North America (after Los Angeles/Long Beach and New York/New Jersey). A recent study conducted by Martin Associates, a Pennsylvania-based firm that has conducted economic studies for ports through the U.S., determined that marine cargo operations at the ports of Seattle and Tacoma supported more than 48,000 jobs in 2013, which generated nearly $4.3 billion in economic activity. This marine cargo activity produced more than $378 million in local and state taxes. Direct jobs include trucking companies and railroads moving cargo to and from terminals and warehouses, longshore workers, steamship agents and freight forwarders. Indirect jobs include office supply firms, maintenance and repair firms, and parts and equipment suppliers. Induced jobs are those created by people directly employed by marine cargo operations re-spending their wages in the community on housing, food and other consumer goods. If the farmers and manufacturers who ship products through the ports of Seattle and Tacoma are factored in, the ports’ activities reach 443,000 jobs overall in Washington (Martin). See Figure 2 for a summary of economic impacts from the two ports’ activities.

Maritime Sector Strategy 21
Figure 2: Ports of Tacoma and Seattle Economic Impact

Maritime Sector Strategy 22
Source: Martin and Associates This success story is based on the vision and work of those ports, and on their strategic location as a crossroads for international and domestic trade. As long ago as the late 1800s, the Alaska Gold Rush and location of the terminus of the Great Northern Railway established Puget Sound as a center for international and domestic cargo. The advent of containerization 50 years ago cemented this trade hub as globally important, as the commerce between Asia and the U.S. and
Maritime Sector Strategy 23
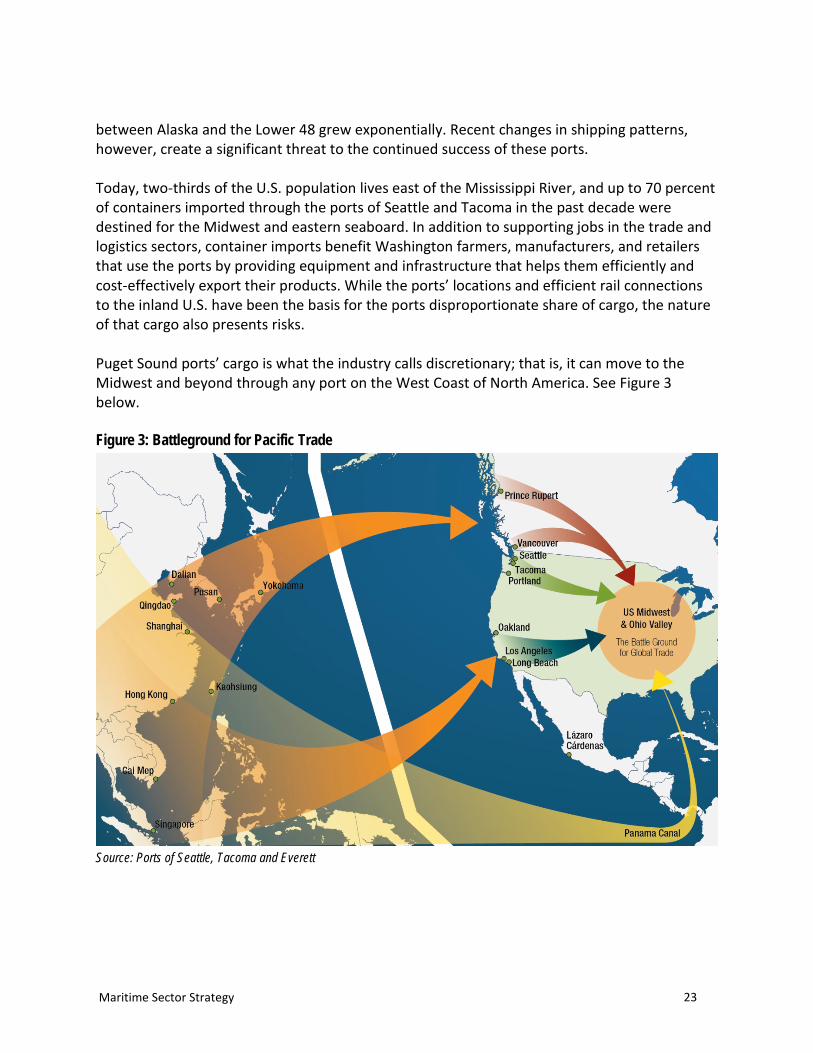
between Alaska and the Lower 48 grew exponentially. Recent changes in shipping patterns, however, create a significant threat to the continued success of these ports. Today, two-thirds of the U.S. population lives east of the Mississippi River, and up to 70 percent of containers imported through the ports of Seattle and Tacoma in the past decade were destined for the Midwest and eastern seaboard. In addition to supporting jobs in the trade and logistics sectors, container imports benefit Washington farmers, manufacturers, and retailers that use the ports by providing equipment and infrastructure that helps them efficiently and cost-effectively export their products. While the ports’ locations and efficient rail connections to the inland U.S. have been the basis for the ports disproportionate share of cargo, the nature of that cargo also presents risks. Puget Sound ports’ cargo is what the industry calls discretionary; that is, it can move to the Midwest and beyond through any port on the West Coast of North America. See Figure 3 below. Figure 3: Battleground for Pacific Trade
Source: Ports of Seattle, Tacoma and Everett

Maritime Sector Strategy 24
In recent years, the ports of Seattle and Tacoma combined have lost substantial market share to other regions. In fact, in the last 10 years, all North American port regions have seen increases in container traffic except the Puget Sound ports. (See Figure 4) Figure 4: Growth at Largest North American Container Ports
Source: Pacific Merchant Shipping Association This loss of market share is due to a number of factors. One is the diversion of cargo to Canada due in part to the Harbor Maintenance Tax and Canada’s aggressive infrastructure investment program (Detailed discussion below and in Appendix A). Figure 5 shows the dramatic change in the relative volume of cargo through Washington and British Columbia in recent years.

Maritime Sector Strategy 25
Figure 5: British Columbia and Washington Container Port Volumes
Source: Pacific Merchant Shipping Association In addition to the erosion of market share to Canada, the advent of much larger mega-container ships (built to be more fuel-efficient and reduce the per-unit cost of shipping) has resulted in shipping lines making fewer vessel calls. This results in bypassing some ports in favor of larger ‘load centers’ – like Los Angeles/Long Beach, with its local consumer population of more than 20 million. In addition, some cargo that used to transit West Coast ports now goes to the East Coast through the Panama Canal. While that route takes longer, it costs less. Both the Panama and Suez Canals are undergoing significant expansions, which could further erode market share.
Port-Related Transportation Improvements
Port competitiveness is not only based on location, but also on the cost and efficiency of moving cargo through that gateway. Puget Sound ports can become more competitive through moving cargo more efficiently, not just through their terminals, but also through the entire system. For that to occur, there are needed improvements in port access projects and ‘last mile’ connectors. For example, the connection of state routes 167 and 509 to the interstate system and the ports will dramatically improve access for the state exporters as well as importers. The Puget Sound Gateway project:
• Completes the originally planned SR 509 and SR 167 connections to I-5 to improve mobility and connectivity in the Puget Sound region.
• Relieves traffic congestion – travel time improved by 15 percent. • Reduces air emissions by up to 26 percent.

Maritime Sector Strategy 26
• Improves regional mobility and relieves congestion on local roads and highways by providing new, more efficient travel options.
• Adds more capacity to I-5 through express toll lanes, reducing congestion and travel times between Seattle and Tacoma.
• Completes critical and direct freight links between the ports of Seattle and Tacoma and the second largest distribution center on the West Coast.
• Provides important ‘last mile’ connections for Washington State exporters.
• Improves a critical node on a key international supply chain.
• Supports regional job growth and economic growth at the state’s two largest ports.
• Supports our ports’ competitive position. • Supports trade, which supports one in
three jobs in the state. In addition to road and highway improvements, railroad infrastructure and rail service are critically important to our ports’ success. Washington ports are at a competitive disadvantage against British Columbia and California in terms of rail rates and service. Conclusion
The state should continue working with the two Class One railroads serving the state to ensure sufficient investment and capacity exist to more efficiently move cargo in and out of our states. The Canadian government, the British Columbia provincial government, the Canadian railroads and the British Columbia ports have worked effectively to align their interests to invest $1.4 billion in the British Columbia gateway (Appendix A). This could serve as a model for freight mobility-related investment in Washington.
Tax and Regulatory Policies
Recognizing the importance of trade and port-related economic development, many states have introduced incentives to attract cargo through their ports. These incentives come in many forms, including incentives for the development of warehouse and distribution facilities and logistics centers. It is said that “ships follow cargo.” That is, if cargo owners (shippers) establish bases for activity in a certain region, the shipping lines that provide service to those shippers

Maritime Sector Strategy 27
will serve their customers by deploying vessels in that trade lane. This strategy has been used successfully in many port regions, notably in the Southeast, where the Georgia Ports Authority and the state of Georgia have developed incentives for the location of distribution centers (along with other incentives), resulting in growth disproportionate to the local population base. This and the incentives offered by other states are more fully described in Appendix A. In addition to positive incentives to attract cargo, the ports have cautioned against policies that can deter the movement of freight through this state. They have specifically highlighted proposed taxes on interstate freight movement and taxes on stevedoring services that would place them (and the state) at a competitive disadvantage. Further, the ports are concerned about environmental and land use regulations that create uncertainty, and additional time and expense in the development and operation of port facilities. Conclusion
The two major container ports in our state provide not only jobs and economic activity in their communities and surrounding region, they are critical links in the international supply chain, and their health and growth are essential to the health of Washington import and export businesses. The ports of Tacoma and Seattle face threats to their continued vitality. As evidence that they recognize these threats, they have recently announced the formation of a “Seaport Alliance” to jointly manage the marketing, planning, investment, and operation of their marine cargo facilities. This new structure has the potential to improve their competitive position by providing for more efficient utilization of facilities, more capacity for development, and funding of necessary upgrades and expansion. The state can support the ports through:
• Funding transportation infrastructure, specifically, investment in freight related projects such as the Puget Sound Gateway.
• Exploring tax incentives to encourage shippers to move additional cargo through the state.
• Considering the potential negative impacts tax, environmental, and regulatory policies could have on freight movement, trade, and port activity.

Maritime Sector Strategy 28
Conclusion The maritime industry in Washington is a diverse and growing sector that is a major driver of the state’s economy – providing significant revenue to the state and good-paying jobs for Washington citizens. In several recent initiatives and forums, the maritime industry (across all segments), has identified the following priorities.
• Raising the visibility of the industry and raising awareness of its importance to the state’s economy
• Workforce development, education, and training • Regulatory, tax, and land use policies that balance environmental protection and
revenue enhancement with job growth • Improvement of transportation infrastructure
The state should support these priorities. In addition, several sector-specific strategies should be considered, including adopting and promoting policies that support:
• Recreational boating and marine-related tourism. • Recapitalization of the North Pacific Fishing Fleet. • Enhanced competitiveness of our ports.
By supporting these and related initiatives, we can help ensure the continued health and growth of the industry and the economy of the state as a whole.

Maritime Sector Strategy 29
Appendix A: Washington’s Maritime Industry
Overview
The maritime sector is a major contributor to Washington State’s economy, producing 148,000 jobs and $30 billion in fiscal impact. It is a diverse sector, encompassing cargo and logistics activities, ship and boat building and repair, fishing and seafood processing, passenger vessel operations, marine technology, military operations, recreational boating, and numerous support industries. The maritime sector employs 57,700 people directly with a total job impact of 148,000. It contributes $15.2 billion in gross business income, with a total economic impact of $30 billion. In 2012, total maritime activities including direct, indirect, and induced impacts, provided an estimated $351.5 million in state tax revenues, which includes $179.2 million in sales tax, $119 million in B&O taxes, and $53.3 million in other taxes. Maritime firms directly contributed $79.5 million in state tax payments, including $29 million in B&O taxes and $36.1 million in remitted sales tax. Logistics and Shipping paid $32 million in state taxes, and maritime support services paid $20 million in state taxes. 1 In 2013, the Legislature directed the Department of Commerce (Commerce) to develop an economic cluster strategy to leverage the state’s unique maritime assets, geography, history, and infrastructure. This appendix supports that strategy by providing background on the state’s recreational and commercial boatbuilding sectors and port cargo traffic as well as research on tax policies and proposals affecting these sectors. The first section discusses recreational boating in Washington and tax policies that will support this sector. These tax policies include the proposed Marine Tourism and Marine Jobs bills. The second section explores fishing fleet recapitalization and tax policies that will encourage the building of these boats in Washington State. These tax policies include either eliminating or reducing the business and occupation taxes applied to this activity. The third section explores port container traffic and looks at tax policies and infrastructure initiatives in other states and Canada that attract shipping traffic to these ports. Two areas of particular interest are Canada’s $1.4 billion investment in the Asia-Pacific Gateway and Corridor and the imposition of the Harbor Maintenance Tax on cargo moving through U.S. ports, both of which create a significant competitive advantage for Canadian ports, diverting cargo away from Washington. Like Canada, other states and their ports have developed incentives that attract cargo, including encouraging development of warehouse and distribution centers that have regional impacts.
1 Washington State Maritime Cluster Economic Impact Study, 2013.

Maritime Sector Strategy 30
Overall Ship and Boat Building Sector
Although this report focuses on recreational boating and the commercial fishing fleet recapitalization, ship and boatbuilding in Washington State includes a broad array of activities. Commercial maritime sector activities include the fishing industry, the tug and barge industry, passenger vessel operations, and work boats. The recreational boating industry includes both small craft and luxury yachts. A rich heritage going back more than 100 years makes Washington’s ship and boat building industry one of the oldest and most established sectors in the state. It is supported by a highly developed network that includes local suppliers ranging from retail to legal services to machinery manufacturing, and skilled laborers, workforce and economic development organizations, multiple port districts, and community training programs and resources.
Ship and boat builders in turn provide a foundation for the dynamic and globally interconnected maritime sector by operating shipyards that are permanent facilities with dry docks and fabrication equipment that allow for the construction, repair, and alteration of ships and boats, as well as the production of prefabricated ship and barge sections and other specialized services.2 Ship and boat builders are highly skilled craftsmen/women, electricians, welders, and business owners who grow our capacity as a state to develop cutting-edge materials manufacturing and who support our infrastructure through capital investment in new structures and equipment. With the advent of new manufacturing technologies that allow for safer and more efficient vessels, the opportunity exists to locate Washington State as the premier site for ship and boat building.
To give a sense of Washington’s boatbuilding industry in relation to other states, we compared data from the U.S. Census Bureau for the ship and boat building industry (NAICS 3366). According to the NAICS definition, this four-digit code encompasses shipyards and boat yards but further breaks down into 336611 for ship building and repair and 336612 for boat building. Shipyards are fixed facilities with dry-docks and fabrication equipment capable of building a ship, defined as watercraft typically suitable or intended for other than personal or recreational use. Shipyard activities include the construction of ships, their repair, conversion and alteration, the production of prefabricated ship and barge sections, and specialized services, such as ship scaling. Boats are defined as watercraft typically suitable or intended for personal use.
According to the Bureau of Labor Statistics, for the combined ship and boat building industry group, in 2013 Washington ranked third in number of firms. For just the boat building portion of this sector, Washington ranked second in both employment and number of firms. For the ship building and repair portion, Washington ranked seventh in employment and sixth in
2 Washington State Maritime Cluster Economic Impact Study, 2013.

Maritime Sector Strategy 31
number of firms. Major competitor states in ship and boat building include Virginia, Mississippi, Louisiana, Florida, California, Maine, Texas, and Alabama.
In 2012, the Ship and Boat Building Industry directly employed 16,500 people with a labor impact of $1,163.8 million, and an annual average wage of $70,500,3 which considerably surpasses the state’s projected median household income of $56,444 for the same year.4 Entry-level jobs here start well above the minimum wage and come with health care benefits. Local firms include many small- and medium-sized, and family-run businesses that are core to their communities. Among these are Nichols Brothers Boat Builders, which is the largest private employer in Island County, and Dakota Creek Industries, Inc. in Anacortes, both specializing in steel and aluminum shipbuilding and repair, and Christensen Yachts, a luxury yacht builder based in Vancouver.
Recreational Boating In the United States, 117 active shipyards are spread across 26 states, with the majority located in coastal states. In Washington, we have 29 shipyards, seven of which build custom-designed yachts that are generally a minimum of 75 feet in length. Washington has more shipyards that specialize in yacht construction than other states, such as Florida (6), Maine (3), North Carolina (1), New York (1), and Wisconsin (2). Canada presently has none.5 Our ship and boat builders are recognized nationally for their excellence in high-quality products and customer service, as well as the versatility of services offered, ranging from small sailboats to fiberglass mega-yachts, to commercial vessels made of steel and aluminum.6 The maritime “quality niche” fostered by this industry gives Washington a significant competitive advantage that allows us to compete globally with low-cost manufacturing from Korea and China.7 The strategic advantages Washington enjoys due to our geographic location are significantly bolstered by the depth and character of our maritime support industries.
In Washington, 15,438 people were employed in industries that either directly or indirectly serve recreational boats, totaling an estimated $1,059 million in labor income in 2012 with direct income at $437.3 million. Jobs that support recreational boating include boat building, motor and engine manufacturing, accessory and supplies manufacturing, dealers and wholesalers, and boat services. These jobs can be found across the entire state. In 2012, 254,775 boats were registered in Washington, consisting of a mix of power boats, personal water crafts, sail boats, and others.8
3 Washington State Maritime Cluster Economic Impact Study, 2013. 4 Office of Financial Management. Median Household Income Estimates. 5 Tim Colton. ShipbuildingHistroy.com Directory of U.S. and Canadian Shipyards 6 Northwest Washington Marine Industry Cluster Study, 2007. 7 Washington State Maritime Cluster Economic Impact Study, 2013. 8 National Marine Manufacturers Association. Recreational Boating Buoys the U.S. Economy. 2012.

Maritime Sector Strategy 32
Current law requires recreational vessels sold or kept in the state to register and pay a one-time sales and use tax. Nonresident individuals purchasing or piloting a vessel in Washington may obtain a cruising permit for a 60-day period, which may be renewed twice in a calendar year, allowing a privately-owned vessel to remain in the state for a total of 180 days. Alternatively, a use permit may be obtained for up to one year at a higher cost, and once expired, the vessel cannot return to Washington for a total of 24 months. Entity-owned vessels may not apply to renew their cruise permit but must pay a use-tax equivalent to the state’s sales tax rate of the value of their boat or leave the state on the 61st day.
Vessel owners can avoid paying Washington sales tax by keeping their boats in neighboring jurisdictions, such as British Columbia or Oregon, which do not have a comparable tax. (Except for vessels owned for less than a year in California, Washington is the only state imposing this tax on the Pacific coast.) This activity not only results in lost sales tax revenue on the vessel itself but loss of other spending within Washington State associated with the vessel. This spending occurs throughout a vessel’s life, beginning with design, manufacture, vessel sales and financing, and continuing with ownership costs such as moorage, insurance, maintenance, and operational costs such as fuel and other retail services needed by the vessel’s passengers at the ports they visit. These contribute to jobs both within and outside of the maritime sector.
Marine Jobs Bill
In the 2013 and 2014 legislative sessions, the Marine Jobs Bill (HB 1927/SB5817) was proposed to temporarily limit the taxable value of vessels to $300,000 for sales and use tax, exempting any amount over that threshold until August 2018. The Washington State Department of Revenue (DOR) estimated that this bill would affect 204 vessels per year with the combined state and local taxes on their values over $300,000 totaling approximately $3.8 million in FY 2015, the first full year of implementation. However, this revenue would be recaptured if an additional 109 boats of at least $300,000 in value came into the state due to this legislation.
Other states such as Florida have passed similar legislation limiting sales and use tax on boats in order to encourage this spending in their states. Starting in July 2010, Florida limited the sales and use tax on boats and vessels to $18,000. Prior to this legislation, Florida sales and use tax did not apply to boats if the boat met certain criteria and did not remain in the state more than 90 consecutive days or 183 days within a calendar year. Florida’s criteria also included at least six months of vessel ownership within a U.S taxing district outside of Florida and no ownership by a state resident or ownership for use by a corporate officer or director who is a state resident or owns, manages, or controls a dwelling in Florida.
With a 6 percent sales and use tax, the $18,000 cap reduced the incentive for vessels valued at $300,000 or more to leave Florida for jurisdictions such as Delaware, a tax-free state, Virginia, a tax-capped state, and the Marshall Islands,9 where offshore flagging could result in significant
9 The Republic of the Marshall Islands Yacht Registry has an office in Fort Lauderdale, Florida.

Maritime Sector Strategy 33
tax savings for very large vessels. Offshore flagging is where boats register offshore with a “flag of convenience” country and then return to a state port under a cruising permit.10
In order to quantify the impact of the tax cap on generating positive tax revenue, the Florida Yacht Brokers Association commissioned a study by Thomas J. Murray, a professor at the Virginia Institute of Marine Science, to determine the impact of the tax cap on brokers statewide.11 This March 2012 study found that direct tax revenues increased by $13.46 million and the average sales price for boats increased to $907,002, almost twice the pre-cap average. In addition, the study found that 748 more boats paid tax under the new tax model then would have been expected to pay under the old method.12 Maryland instituted a similar tax cap at $15,000 on July 1, 2013, with a 2016 sunset provision.13 Both caps decrease taxes paid by taxpayers who own vessels that are valued at $300,000 or more.
In 2011, Hebert Research, Inc. conducted economic impact research on Washington recreational boating on behalf of the Northwest Marine Trade Association and the Northwest Yacht Brokers Association. That research estimated the economic impacts from both the Marine Jobs Bill and related proposed legislation, the Marine Tourism Bill (HB 1927/SB 5817), discussed below. In 2010, Washington had a total of 9,278 registered maritime vessels. Of those, 1,000 were over 50 feet in length and more than $300,000 in value. The state Department of Licensing and DOR collected a total of $17.55 million in direct taxes and fees on recreational boats. An estimated $8.11 million of monies were generated from the sales of new boats valued at over $300,000, and $6.19 million on resale transactions at the same value threshold. Additionally, $8.5 million was receipted from direct business taxes and $5.4 million from indirect and induced spending associated with recreational boating activities. In total, Hebert estimated a tax revenue impact of $31.47 million from recreational boating activities in 2010. Based on its British Columbia census and consultations with California boat planning experts, Hebert estimated that an additional 784 boats would move to Washington waters if both of the tax proposals were implemented. According to that research, entity-owned boats would purchase approximately 241 cruising permits per year, remaining in the state for 14,460 additional vessel-days, spending over $17 million per year while in Washington.
Marine Tourism Bill
In the 2013 and 2014 legislative sessions, the Marine Tourism Bill (SB 5241/HB1366) was proposed to temporarily extend the availability of use permits for purposes of vessel sales and use taxation to nonresident business entities and allow those entities to acquire a vessel permit
10 BoatTax.com, Florida Boat Tax Information 11 FYBA Compass. Sales Tax Cap: One Year Later. June/July 2011. 12 Thomas J. Murray & Associates, Inc. A Review of Brokered Boat Sales in Florida Under the Sales & Use Tax Cap. February 2012. 13 Maryland Senate Bill 90. 2013 Regular Session.

Maritime Sector Strategy 34
to remain in Washington for up to six months, as is currently permitted for individual-owned vessels. This temporary extension was proposed to end on July 1, 2016.
DOR estimated that 159 entity-owned vessels would obtain the permit as a result of this bill. That estimate is based on the average number of non-resident individual permits issued for vessels 30 feet or longer from calendar years 2009 through 2012 (23 permits). It assumes an additional number of nonresident permits equal to half of the number the Department of Licensing issued in 2012 (137 permits) for a total of 159 permits.14 The average value of these vessels is estimated to be $315,187, totaling $50 million ($315,187 x 159).The fiscal impact to the state depends upon the assumption of how many boats stay in the state. This is a very difficult number to determine due to lack of information on the number of boats currently staying beyond 60 days, and estimating how many would stay were the law changed.
Requiring non-resident, entity-owned vessels to pay excise tax after 60 days discourages them from remaining in state waters, resulting in lost revenue and job opportunities in the recreational boating industry. Changing this law so that entity-owned boats can remain up to 180 days, the same period long as individually-owned boats can remain, will result in increased economic activity in every community where these boats moor, contributing to Washington’s local economies. Based on experiences in other states that passed similar legislation and Hebert’s analysis of the potential impacts to Washington, passing the Marine Jobs Bill and/or the Marine Tourism bill would result in positive economic impacts for Washington’s maritime communities.
14 Difference in total due to rounding.

Maritime Sector Strategy 35
Commercial Fishing
The commercial fishing industry provides a base of employment for the ship and boat building industry and is the third largest employer in the Maritime Sector, in addition to generating the highest amount of business income in 2012.15 The North Pacific Fishing Fleet provides 40 percent of the landed U.S. fish catch annually.16 The Lake Union Ship Canal serves as a base for much of the 4,000-vessel fleet.
A fishing industry support facility within the canal, Fishermen’s Terminal, operated by the Port of Seattle, has supported the fishing industry for the last 100 years.17 The fleet is comprised of vessels that work in Alaska and return to Fishermen’s Terminal and other sites on the adjacent ship canal for the less corrosive freshwater environment, and more importantly because our established businesses and local artisans have the tools and know-how to keep vessels sea-worthy.
Other boats return from Alaskan waters to other ports in the state, like Everett, Anacortes, and Bellingham. While in port, the vessel owners and their employees support local firms through their purchases across the supply chain ranging from marine parts and equipment suppliers, to ship yards and repair shops to finance and insurance to waste management.18 In 2012, Washington’s fishing and seafood processing sector included 720 employer establishments with gross business income totaling $8,592.6 million and provided 15,400 direct jobs with wages totaling $1,113.4 million.19 In 2012, Fishing and Seafood Processing contributed $135.7 million in tax revenues to the state. 20 The North Pacific Fishing Fleet is regulated by The North Pacific Fishery Management Council (the Council), one of eight regional councils established by the Magnuson-Stevens Fishery Conservation and Management Act. This federal act governs the management of living marine resources in the United States and has been amended several times since it was passed in 1976. The Council has 11 voting members to include three from Washington (Department of Fish and Wildlife representative and two Washington citizens familiar with fishing industry). The Council has prepared and implemented five fishery management plans for fisheries off Alaska:
• Bering Sea/Aleutian Islands Groundfish • Gulf of Alaska Groundfish • Bering Sea/Aleutian Islands King and Tanner Crab • Alaska Scallop • Alaska Salmon21
15 Washington State Maritime Cluster Economic Impact Study, 2013. 16 Port of Seattle Fisherman's Terminal 17 Paul Wissel. (2012). "Why the Alaskan Fishing Fleet is Based in Seattle." 88.5 KPLU. 18 Washington State Maritime Cluster Economic Impact Study, 2013. . 19 Washington State Maritime Cluster Economic Impact Study, 2013. 20 Washington State Maritime Cluster Economic Impact Study, 2013. 21 North Pacific Fishery Management Council. (2009). "Navigating the North Pacific Council Process."

Maritime Sector Strategy 36
This management includes controlling the size of these fishing fleets by limiting the number of vessels within these fisheries. Because of this limitation and the significant cost to build these vessels, the current fishing fleet is aging and ready for replacement, referred to as fishing fleet recapitalization.
Recapitalization
American Fisheries Act amendments of 2010 have allowed significant opportunities for fishing fleet recapitalization. Fishermen’s News conducted extensive industry outreach and study of Council data to quantify the potential economic impact of recapitalization. As part of the Bering Sea Fisheries Conference in April 2014 the publication presented the following table of replacement costs.

Maritime Sector Strategy 37
Table A: 2014 Value of the Fishing Fleet
Fleet Number of
Vessels Current
Number of Vessels
Needed to Replace
Current Fleet
Average Replacement
Cost (in millions of
dollars)
Average Replacement
Cost (in millions of
dollars) AFA Catcher Vessels 83 83 17 1,411 AFA Catcher Processors 15 15 135 2,025 AFA Mothership Cacher Vessels 16 16 17 272 AFA Mothership Vessels 4 4 200 800 Non-AFA Bering Sea Catcher Vessels 13 13 16 208 Amendment 80 Fleet 24 15 70 1,050 Western Gulf of Alaska Trawlers 42 34 9 302.4 Central Gulf of Alaska Trawlers 53 42 9 381.6 Freezer Longliners 39 39 42 1,638 Halibut Fleet (IFQ and CDQ) 635 317 3 952.5 Other Halibut Boats 1,090 275 3 817.5 Longline Catcher Vessels 74 19 3 55.5 Jig Fleet 77 14 1 15.4 Groundfish Pot Vessels 123 82 15 922 Bering Sea Crab Fleet 79 79 12 948 Scallop Fleet 4 3 15 45 Alaska Seine Fleet 400 400 5 2,000 Alaska Gillnet Fleet 1,400 1,400 0.35 490 Total Replacement Cost of Fleet 4,171 2,829 14,334.4
Source: Fisherman’s News These costs total over $14 billion, but it is not clear how soon each of these replacements would occur or how many would occur in Washington. The boats must be built in U.S. but there is strong competition from shipyards in other states, such as Oregon and those in the Gulf. According to a 2013 Oregon Business article, Fred Wahl Marine Construction, Inc. in Reedsport, Oregon, is responsible for 70 percent of the new fishing fleet in Alaska since 2000.22 At least three ship builders in Washington can manufacture large fishing vessels in the $25 million or greater range.
A number of smaller yards around the state are capable of building smaller boats. The potential value to shipyards of the opportunity to rebuild the fleet could also draw new investment in existing shipyards and attract new yards to the state. While there is a need to replace many vessels, the historic fluctuations in fishery resources and lack of certainty about individual vessel owners’ share of the catch has made it difficult for vessel owners to finance new boats.
In the last 20 years, only one of the largest vessels has been built in the state. In 2013, Martinac of Tacoma built the Northern Leader valued at approximately $30 million for Alaskan Leader 22 http://www.oregonbusiness.com/articles/145-julyaugust-2013/10592-shipbuilder-fred-wahl-stays-afloat

Maritime Sector Strategy 38
Fisheries. Dakota Creek Industries in Anacortes is currently building a second approximately $30 million freezer longline boat for Blue North. The boat will include several design innovations, including a system that enables crews to pull in the catch from the inside of the vessel, creating safer working conditions; and automated fish sorting and weighing, allowing for more use of the resource. The vessel is expected to be completed in October 2015.23 Two other large boats have been, or are being built outside the state – one in Alaska and one in Florida.
Significant acceleration of the pace of replacement would likely require some regulatory changes at the federal level. A number of policy changes have been proposed that would benefit all shipyards in the nation.
Washington could position its shipyards to be more competitive nationally by offering tax preferences. Such preferences could take the form of a complete business and occupation (B&O) tax exemption or a preferential tax rate much like that aerospace manufacturing rate. The manufacturing B&O tax rate under which shipbuilding currently falls is 0.00484. Exempting this entirely would save $145,200 on a $30 million vessel. Reducing this to the same level as aerospace manufacturing (0.002904) would save $58,080 for that same vessel.
Based on the assumption that one large boat of approximately $30 million, 15 small boats at an average cost of $2.4 million, and 60 Bristol Bay boats at an average cost of $425,000 are built in fiscal years 2012 thru 2016 with taxable income occurring evenly over this period, a complete B&O tax exemption would save boat builders $95,000 annually. Under these same assumptions, taxing this activity at the same reduced level as aerospace manufacturing would save these same builders $38,000 annually.
Fishing fleet recapitalization represents an important business opportunity for Washington’s shipyards. The revenue impact to the state is small under this tax proposal (potentially less than $50,000 depending on how the preference is structured). Yet this tax preference would provide an additional tool to Washington’s shipbuilders to bring these projects to Washington.
23 King 5 Evening News Report, 9/16/2014
Maritime Sector Strategy 39
Port Container Traffic
Ports ship Washington products to overseas and domestic markets and connect Asian trade to the U.S. economy and Alaska to the continental U.S.. According to the Washington State Freight Mobility Plan, Washington is the fifth largest exporting state, behind Texas, California, Florida, and New York, with $65 billion in commodity exports and $24 billion in service exports activity supporting 185,123 jobs in 2012. Approximately 86 percent of these jobs are in the manufacturing sector and 13 percent in the agricultural sector. In 2012, 4.9 percent of total U.S. exports and 2.1 percent of total U.S. imports moved through Washington.24
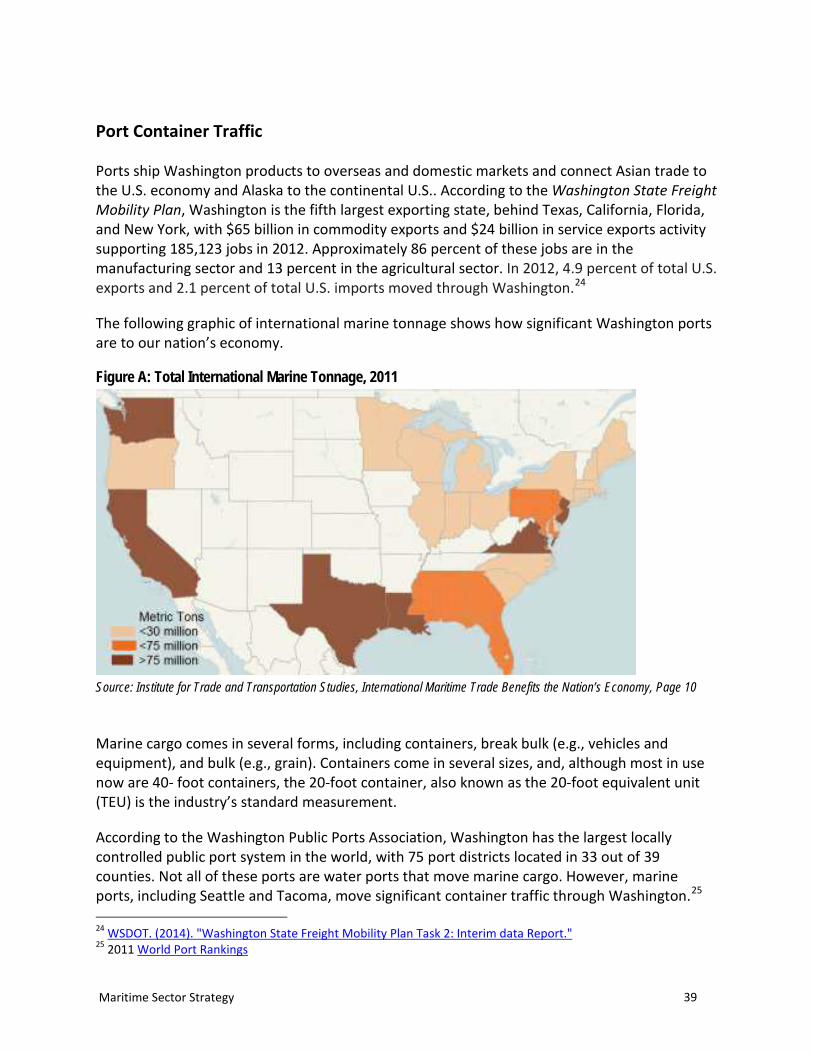
The following graphic of international marine tonnage shows how significant Washington ports are to our nation’s economy.
Figure A: Total International Marine Tonnage, 2011
Source: Institute for Trade and Transportation Studies, International Maritime Trade Benefits the Nation’s Economy, Page 10 Marine cargo comes in several forms, including containers, break bulk (e.g., vehicles and equipment), and bulk (e.g., grain). Containers come in several sizes, and, although most in use now are 40- foot containers, the 20-foot container, also known as the 20-foot equivalent unit (TEU) is the industry’s standard measurement.
According to the Washington Public Ports Association, Washington has the largest locally controlled public port system in the world, with 75 port districts located in 33 out of 39 counties. Not all of these ports are water ports that move marine cargo. However, marine ports, including Seattle and Tacoma, move significant container traffic through Washington.25 24 WSDOT. (2014). "Washington State Freight Mobility Plan Task 2: Interim data Report." 25 2011 World Port Rankings

Maritime Sector Strategy 40
In 2013, the Port of Seattle moved almost 1.6 million TEUs through its port; 649,822 were imported and 569,053 were exported. Additionally, 373,878 domestic TEUs moved through the port.26 In 2013, the Port of Tacoma moved almost 1.9 million TEUs through its port, with more than 1.4 million of those being foreign containers and 446,845 being domestic. Tacoma’s container traffic has also grown since that time, with year-to-date as of August 2014 TEUs being 8.5 percent higher than 2013.27
Although Washington ports have a strong market share, several U.S. and Canadian ports have a much higher volume and market share relative to similar local population size. The following table shows the top 10 container ports in the U.S. (Note: Seattle and Tacoma positions have changed due to the relocation since 2012 of a major shipping alliance from Seattle to Tacoma.)
Table B: 2012 Top 10 U.S. Containership Ports Full Container Statistics (in thousands of TEUs)
Port Rank Total Export Import Los Angeles, CA 1 5,938 1,870 4,068 Long Beach, CA 2 4,330 1,284 3,046 New York, NY 3 4,247 1469 2,777 Savannah, GA 4 2,288 1212 1076
Norfolk, VA 5 1,647 829 817 Oakland, CA 6 1,542 793 749 Houston, TX 7 1,495 876 619 Seattle, WA 8 1,240 514 726
Charleston, SC 9 1,216 567 649 Tacoma, WA 10 1,092 443 649
Source: U.S. Department of Transportation, State Transportation Statistics, Table 3-7: Top 30 U.S. Containership Ports
To better understand some of the competitive advantages these ports employ, we examined incentive and investment strategies present at several U.S. ports that were ranked in the top 15 in the nation in terms of their total trade dollar value in 2013, including the Port of Savannah in Georgia, the Port of Los Angeles in California, and the Port of Charleston in South Carolina. We also examined the Port of Vancouver and Prince Rupert Port in British Columbia, and Oregon ports because of their close proximity to Washington. We found that these ports use various strategies that work to enhance their market share. These include tax-based incentives that specifically target job growth and investment coupled with coordinated infrastructure improvements that include transportation stakeholders.28
26 Port of Seattle 2014 Harbor TEUs 27 Port of Tacoma Cargo Volumes 28 2013 Port of Seattle Foreign Waterborne Trade Report.

Maritime Sector Strategy 41
Georgia Port Authority
The Port of Savannah moved $54.1 billion of containerized cargo during FY2011, representing 8.7 percent of U.S. containerized trade.29 However, its container traffic has dramatically increased in recent years. While it was once much smaller than the ports of Seattle and Tacoma, it is now approaching the size of the two Puget Sound ports combined. In FY 2014, the port moved $3.1 million TEUs, becoming the fourth biggest container port in the U.S., despite a relatively small local population base.30 The port is operated by the Georgia Port Authority (GPA), a state-run entity able to coordinate with prospective businesses in regards to incentives. The GPA receives substantial investment from the Georgia Legislature for port improvements, including $266 million towards deepening the Savannah River, as well as business income tax incentives for increasing jobs and port traffic. The GPA has set a target goal of 6.5 million TEUs by 2024 in order to compete with the ports of New York and New Jersey.
Georgia bases its business income tax on the amount of a company’s gross receipts or sales, and not upon the more traditional method that includes in-state property and payroll information. This was implemented in 2005 and is known as a “Single Factor Gross Receipts” apportionment formula. Additionally, to offset the income tax, beginning in 2011,31 Georgia provided two Port Tax Credits available to taxpayers who increase imports or exports through a Georgia Port by 10 percent over the base or previous year. The associated port tax credit bonus can be used with either the Job or Investment Tax Credit programs and represent the number of new full-time jobs or amount of capital investments created by each entity. Industries that have received this credit include manufacturing, warehouse and distribution, processing, telecommunications, tourism, and research and development.
As a case in point, in the Job Tax Credit Program, if a distribution facility operating in a Tier 1 county increases their port business by 10 percent in one year from the base level of 75 tons, or the equivalent of 10 TEUs, they are eligible to receive $4,000 per job plus an additional $1,250 bonus that includes $500 for joint development. The tier status of counties in Georgia refer to the annual ranking of economic vitality for each county. Tiers 1 and 2 refer to counties with the greatest need, while Tiers 3 and 4 are the most prosperous, offering lesser amounts for tax incentives.
For example, a taxpayer who creates 50 jobs in a Tier 1 county that has also increased its port traffic by at least 10 percent, is considered eligible to receive $1,312,500 in tax credits spread over five years [50 jobs x ($4,000 job tax credit + $1,250 port tax credit bonus) x 5 years]. Alternatively, under the Investment Tax Credit Program, if a taxpayer qualifies for a port bonus in a Tier 4 county, invests $100 million in a manufacturing plant plus $25 million in recycling equipment, they would be eligible for a $7 million investment tax credit [$100 million x 5%] + [$25 million x 8%]. 29 Georgia Ports Authority Economic Impact Report 30 Cargo Business News. (2014). "Port Chief: Georgia can unseat NY/NJ as top East Coast Container Port." 31 Georgia Code sections O.C.G.A. O.C.G.A. § 48-7-40.2, 48-7-40.3, 48-7-40.4.
Maritime Sector Strategy 42
The taxpayer may choose to use the investment tax credit as a way to offset qualified capital investments as an option. The percentages used to calculate the investment tax credit are provided on a scale from 1 to 3 percent for Tiers 3 and 4 counties, 3 to 5 percent for Tier 2, and 5 to 8 percent for Tier 1. To offset the cost of payroll withholding, Georgia offers a Quality Jobs Tax Credit to companies that create at least 50 jobs in a 12-month period where each job pays wages at 110 percent or more of the county average. The credit ranges from $2,500 up to $5,000 per job per year, for up to five years – and depending upon the percentage achieved over the county average wage, up to 200 percent or greater.
Beginning in January 2011, Georgia exempted business inventory from property taxes. In many counties, distribution center and warehouse inventories are 100 percent exempt for raw materials, partially processed goods, and fully finished goods that are to be shipped out of state under the Freeport law.32 The Freeport law is an exemption on various types of tangible personal property that any local government entity may elect with approval of the voters. A level one exemption applies to state property taxes, and a level two exemption applies to local property taxes. For both levels, the percentage of the exemption can be set at 20, 40, 60, 80, or 100. More than 60 percent of Georgia counties and cities have adopted the Freeport Exemption at some level.33
Port of Los Angeles
The Port of Los Angeles, a department of the City of Los Angeles, is working to improve freeway access to port facilities through its I-110/SR-47 Connectors Improvement Program, the cost of which is estimated at $29.4 million.34 The program increases mobility for companies using shipping terminals by improving roads for commerce transportation. (The adjacent Port of Long Beach, in concert with the State of California, is replacing the Gerald Desmond Bridge to permit access to larger ships, at a cost of more than $1.2 billion.)
In April 2014, the City of Los Angeles Board of Harbor Commissioners created the Ocean Common Carrier Incentives Program. This new program provides two tiers of financial benefits to individual Ocean Common Carriers (specifically here, container shipping lines):
1. For carriers whose total TEU volume does not exceed 99,999, $5 per TEU is paid to the carrier for any amount of increase to their volume of loaded and empty TEUs in calendar year 2014.
2. For carriers whose total TEU volume is at or above 100,000, $15 per TEU is similarly paid.
32 Georgia USA. Business Incentives Brochure. March 2012. 33 Georgia Department of Revenue. Local Government Services Division. Freeport Exemption. 34 State of California Department of Transportation. John S. Gibson Boulevard/I-110 Access Ramps and SR 47/I-110 Connector Improvements. February 2012.
Maritime Sector Strategy 43
As of September 2014, the Port of Los Angeles had increased its overall container volume by 9 percent from 2013, going from 710,892 to 775,133 total TEUs. The total loaded for imports and exports also increased by 41,020 TEUs, or 7.9 percent over the same period. Additionally, the Board cancelled an Infrastructure Cargo Fee in 2014 that was initially approved in 2008 to assist in generating funds needed for transportation improvement and air quality projects. The port has 13 acres of warehouse distribution, all of which includes rail access and operates more than 20 sites for warehousing, distribution, and logistics.
An estimated 1.1 million jobs in California are associated with port activities. In 2014, the Port of Los Angeles is providing $1 million in non-taxpayer funded grants for qualifying 501(c)(3) organizations to promote its goals related to international trade, the environment and sustainability, and public safety and security. 35
South Carolina Port Authority
The South Carolina State Ports Authority (SCSPA) owns and operates public seaport facilities in Charleston, Georgetown, and Greer. SCSPA is a self-supporting state governmental enterprise with a governor-appointed board.36 SCSPA regulates the ports through Terminal Tariff No. 8, which provides for wharfage, handling, storage, and other terminal and warehouse services.37 SCSPA is working on a 10-year $1.3 billion capital plan that includes a new terminal to be opened in 2019, interstate highway expansion, existing facility improvements, container cranes, and new IT systems. The South Carolina Legislature committed $300 million to fund dredging of the already deep-water channel at the Port of Charleston to accommodate larger ships.38
In 2005, the International Trade Incentive Program was created to provide tax incentives to companies increasing cargo volume through all the ports in the state. Companies that increase their throughput by 5 percent over the base year, or 10 loaded TEUs, earn up to $1,500 per job or an investment tax credit up to 6 percent. The base year is reassessed every 10 years.39 This tax credit applies to companies that supply manufacturing, warehousing, freight forwarding, freight handling, goods processing, cross docking, transloading, wholesaling of goods, or distribution that uses port facilities. The credit may be claimed against corporate income taxes and carried forward for five years. Additionally, up to $1 million in withholding credit may be awarded annually to new warehouse or distribution facilities that spend at least $40 million at a single site and create at least 100 new full-time jobs if the base year cargo is at least 5,000 TEUs.40 As of September 2014, the Port of Charleston has increased its total TEU volume by 32 percent from 2010. 41
35 The Port of Los Angeles. http://www.portoflosangels.com 36 South Carolina Ports. 2014 State of the Port. September 8, 2014. 37 South Carolina State Ports Authority. Terminal Tariff No. 8. 38 South Carolina Ports. The Port of Charleston: the South Atlantic’s Deepwater Port. 39 South Carolina Ports. Press Release. SC Governor Signs New Tax Incentive for DCs in Charleston. June 24, 2005. 40 South Carolina Tax Incentives for Economic Development. 2014 Edition. SCC §12-6-3375. 42 South Carolina Ports. 2014 State of the Port..

Maritime Sector Strategy 44
Oregon Ports
The Oregon Public Ports Association consists of 23 ports, 14 of which are located along the Oregon coast, which provide an estimated one out of every six Oregon jobs either directly or indirectly tied to cargo, recreation, industrial, commercial, or other port-based activities.42 Port economic development activity is governed under Chapter 285A of Oregon Revised Statutes. Specifically, 258A.666 allows any Oregon port district to borrow money from the Oregon Port Revolving Fund , for projects that include engineering, acquisition, improvement, rehabilitation, construction, operation, or maintenance of port facilities.43 The revolving fund, administered by Oregon’s Infrastructure Finance Authority, consists of application fees received for approval of projects, interest accrued from those funds, and any repayment of loans to the account. The fund supports the work of the Oregon Business Development Department, which administers the fund’s proceeds and other port business. 44 The Port of Portland commissioned a study in 2011 to determine the impact of its seaport activities. The report found that from 2006 to 2011, the port increased its volume of cargo by 517,700 tons, mostly consisting of grain exports, scraps, and containerized cargo. The study also found that businesses received in total $1.5 billion of direct revenue in 2011.45 In 2005, the Oregon Legislature created the Multimodal Transportation Fund to invest in air, marine, rail, and public transit infrastructure improvements. The fund is part of the ConnectOregon program, providing grants and loans to promote non-highway related economic development. Forty million dollars was authorized in 2011 for the 2011-13 biennium, which was awarded to 36 multimodal projects by the Oregon Transportation Commission.46 Ten of these projects were awarded to ports, seven of which were used to expand and renovate various terminals, build a freight transfer facility, and expand an auto import berth. The other three projects dealt with rail and air facilities development. Historically, ConnectOregon has awarded 16 percent of total funds to projects associated with the marine sector and 3 percent on multimodal projects. 47
Comparison of Port Entity Incentives
In addition to the cases already discussed, a number of government entities have initiated incentives to attract trade and port related economic development. The Port of Seattle’s document, Government Incentives and Programs to Encourage International Trade and Economic Development, compares these incentives across entities (Appendix B).
42 The Oregonian. How the Legislature can help Oregon’s smaller ports. July 16, 2014. 43 Oregon 2013 Session Laws. Chapter 285A-Economic Development I. 44 Oregon Secretary of State. Oregon Administrative Rules. Oregon Business Development Department. 45 Martin Associates. March 15, 2012. The Local and Regional Economic Impacts of the Port of Portland, 2011. 46 ConnectOregon. Transportation Development-Planning. http://www.oregon.gov 47 Oregon Department of Transportation. ConnectOregon Report. 2011.

Maritime Sector Strategy 45
Canadian Ports
British Columbia ports have benefited in recent years from two significant factors affecting port choice by cargo and vessel owners. The Canadian and British Columbia governments, the ports and the Canadian railroads have aligned to make substantial investment in improving port and port-related infrastructure, and the Harbor Maintenance Tax has resulted in the diversion of cargo from the ports of Tacoma and Seattle to the ports of Vancouver and Prince Rupert.
The Harbor Maintenance Tax (HMT) is a federal tax imposed on cargo imported through U.S. ports that pays for maintenance dredging of federal navigational channels. This tax, assessed on the value of goods being shipped at ports of entry, creates an incentive to divert U.S. bound cargo from U.S. ports to those in Canada or Mexico, as the tax is not assessed on U.S. destination cargo transiting foreign ports. The ports of Vancouver and Prince Rupert (450 miles north of the U.S. border in British Columbia) are considered major rivals to Washington’s ports, and have benefited from this tax structure.48
In July 2012, The Federal Maritime Commission (FMC)’s July 2012 Study of U.S. Inland Containerized Cargo Moving Through Canadian and Mexican Seaports found that 2.6 percent of total U.S. import containers, or 236,436 TEUs, that entered the west coast of North America came through Canada in 2010.49 This supports the assertion that significant diversions of cargo from domestic ports have resulted from the HMT. The FMC gives various estimates for the diversion of cargo from U.S. West Coast ports through studies that model the price elasticity of inbound cargo subject to the HMT fee. For Puget Sound estimates, the FMC relied upon a 2008 study that describes import volume as being very elastic in this regard.
The study estimated that $60 per 40-foot equivalent unit (FEU) would decrease inbound loaded containers by 30 percent, and that the traffic would be cut in half if the HMT fee were at $150.50 The FMC study shows ports of Seattle and Tacoma at an average of $109 per FEU HMT. The “Maritime Goods Movement Act of the 21st Century” (S 1509 and HR 4105) may mitigate this issue, if passed. This legislation would replace the HMT with a maritime goods movement user fee so that shippers would not be able to avoid the tax by using ports outside the U.S.51 In the 2014 session, the state Legislature passed a joint resolution supporting the passage of this federal legislation.
The Port of Prince Rupert enjoys several geographic advantages, including having one of the deepest natural harbors and being the closest port to key Asian markets in North America. This makes Prince Rupert the first port of call for many ships coming from Asia and the last on the
48 The Seattle Times. Harbor tax rebate could help Seattle, Tacoma ports attract business. October 27, 2014. 49 Federal Maritime Commission. Study of U.S. Inland Containerized Cargo Moving Through Canadian and Mexican Seaports. July 2012. 50 Leachman, Robert C. Port and Modal Elasticity of Containerized Asian Imports via the Seattle-Tacoma Ports. January 2008. 51 Senator Patty Murray. "The Maritime Goods Movement Act for the 21st Century" white paper.
Maritime Sector Strategy 46
return.52 As of September 2014, the Port of Prince Rupert handled 400,948 total TEUs, or 4 million tons.53 Port Metro Vancouver increased its cargo tonnage by 9 percent from 2012 to 2013, or 135 million tons, and by 4 percent in total TEUs over the same time period, for a total of 2,825,475 TEUs in 2013.54
Today, the total container volume handled by British Columbia ports is nearly equal to the amount handled by Puget Sound ports. The growth over the last decade has been dramatic and contrasts with the loss of market share and real volume at Seattle and Tacoma. As recently as 2005, Seattle and Tacoma combined handled 4.153 million TEUs while Vancouver handled 1.176 million TEUs, and Prince Rupert had no container volume.55
In addition to the HMT, Canadian government policies have provided their ports with a competitive advantage. The ports of Prince Rupert and Vancouver are part of a coordinated Canada’s Gateways system, a partnership of Canadian federal and provincial governments, ports, railroads, and other transportation stakeholders to seamlessly connect all of its transportation modes to take full advantage of the opportunity to grow cargo through that gateway. There are three Canadian gateways: the Asian-Pacific Gateway, the Continental Gateway, and the Atlantic Gateway. The Asian-Pacific Gateway Corridor Initiative includes 24 port and other transportation infrastructure projects totaling more than $1.4 billion.56 The following graphic, taken from the Asia-Pacific Gateway and Corridor Initiative website, shows the locations of each of these 24 infrastructure projects. These projects will enhance this northern transportation corridor that moves cargo destined for mid-West and East Coast markets.
52 Prince Rupert Port Authority Competitive Advantages Webpage 53 Prince Rupert Port Authority Monthly Traffic Summary. September 2014. 54 Port Metro Vancouver. 2013 Statistics Overview. 55 Ocean Shipping Consultants Ltd. Port Metro Vancouver Container Forecast. August 2012. 56 Asia-Pacific Gateway and Corridor Initiative Investments Webpage

Maritime Sector Strategy 47
Figure B: APGCI Investments Map
Source: Asian Asia-Pacific Gateway and Corridor Initiative website This collaboration has spawned significant growth to Canadian ports, resulting in a diversion of cargo that might have come through Washington and other US ports instead. According to Canada’s Gateways website, more than $1.7 billion of goods crosses the US-Canada border daily.57
57 Canada's Gateways Advantages Webpage

Maritime Sector Strategy 48
Conclusion
This appendix includes research focused on three areas of major threat and opportunity detailed in Specific Strategies to Support the Maritime Industry (Page 16) of the main report, Maritime Sector Strategy.
1. The Recreational Boating section of this appendix provides background for the Recreational Boating section of the main report (Page 16).
2. The Commercial Fishing section of this appendix) provides background for the Fishing Fleet Recapitalization section of the main report (Page 37).
3. The Port Container Traffic section of the appendix provides background for the Port Competitiveness section of the main report (Page 21).
The maritime sector improves the quality of life for all Washingtonians whether they recreate or work within the sector, or benefit from the goods moved through our ports. Supporting strategies that strengthen this sector makes Washington a better place to live, work, and play now and into the future.

Appendix B: Government Incentives and Programs to Encourage International Trade and Economic Development
(Port of Seattle)
Maritime Sector Strategy 49
Entity Taxes and Tax Rates Incentives and Programs Washington1 • No sales tax on construction materials for
warehouses >200k sf • No sales tax on manufacturing facilities in rural
counties • No sales tax on items held for resale or sold as a
component in another product. • 0.12% for property value • 12.84% for Leasehold Excise Tax • 1.38% B&O Rate for food processing and
manufacturers.
• Waive or defer taxes on construction and equipment costs for new/expanding facilities in high unemployment counties.
• Job creation incentives: $4,000 credit per job, for wages over $40k; $2,000 credit per job, wages <$40k.
• Reduced sales taxes on machinery and equipment • B&O tax paid only once for products that required more than one taxable
activity.2
Oregon3 • No sales tax incurred on any transaction • No inventory tax • 0.87% property tax rate • No property tax on assessed value of assets
currently under construction4
• 6.6% credit on corporate taxes for new-to-Oregon business operations in rural areas. Limited to taxes apportioned to OR of <$10m.
• 25% investment cost credit toward income tax liability; $2m maximum. Unused credits may carry forward for 5 years.5
California6 • Exemption of first $200m in equipment purchases • No inventory tax • 0.74% property tax rate
• 35% reduction in taxes for wage costs. • Hiring tax credit – deduction of 35% of wages up to five years, for wages
$12 to $28/hour. • Business expense deductions: treat 40% of property cost as a business
expense, in lieu of capital expense or investment.7 • Tax Deduction from interest payments made on loans to finance business
activities in Enterprise Zones.
Port of Los Angeles
• Ocean Common Carrier Incentive Program: Carrier earns $5 per incremental TEU moved in 2014 over 2013 volumes for incremental volumes up to 99,999 TEUs; $15/incremental TEU if volumes increase by 100,000. Lump sum payment in 2015.

Maritime Sector Strategy 50
Entity Taxes and Tax Rates Incentives and Programs Port of Long Beach
• Ship dockage incentives: Limit daily dockage to $8,641, reduces costs for using larger ships to haul cargo.
• Wharfage incentives: $10/TEU for each shipped by rail; encourages using rail intermodal. (EXPIRED)
Idaho8 • No sales tax on raw materials, manufacturing equipment, or pollution control equipment.
• No Inventory (property) Tax on business inventory. • 25% cash rebate on sales tax paid on construction
materials • 0.69%, exempt on $3m investment, over 5 years
• State sponsored grants for developing infrastructure in support of local commercial or industrial facilities.
• 4% payroll tax credit on gross wages for hiring new employees in new positions.
• 3% credit on 50% of tax liability, up to 14 years9 • 3.75% income credit on $500k investment on new facilities, creating 10
new jobs, with average income of $40,000/year or more. • 2.5% property tax credit for investing $3m in new manufacturing
facilities. 10
New York11 • No sales tax on manufacturing equipment and fuels used in manufacturing
• No inventory tax • 1.23% property tax
• Low cost loans and grants for companies creating jobs • 10% tax credit for investing in manufacturing equipment, allowed to
carry over for 15 years. • 12% tax credit on investment in brownfield facility redevelopment

Maritime Sector Strategy 51
Entity Taxes and Tax Rates Incentives and Programs New Jersey12 • No sales and use tax on purchase of production
machinery and equipment13 • No inventory tax • 1.89% property tax
• Job creation incentives: $2,250 per job, minimum of 50 jobs; $1,500 per year (for 2 years) for new hires from unemployed rolls14; $1,000 per job in manufacturing sector.
• 4% credit investment in manufacturing equipment; max credit of $1m for entities with <50 staff, income <$5m.15
• 50% income tax credit for small businesses, based on creating 5+ jobs • Up to 50% corporate income tax credit for investments resulting in 5+
new jobs (50 for large businesses) and meet median annual compensation standards. 16
• Property Tax Abatement: abate property taxes for 10 years to offset increased property value due to property and production improvements.
• Enterprise Zone credits: a range of tax credits for investments, job creation, and wages.
• Brownfield Development Credits: based on percentage of eligible costs of clean up and redevelopment. Tiered credit system, beginning at 12% of investment costs.
Port of NY/NJ
• Portfields Initiative17 to redevelop underutilized and brownfield facilities into productive warehousing and distribution centers. These centers will support emerging market opportunities for new ocean and air freight-related warehousing and distribution operations.
• $25 per incremental container that is booked by rail to or from an ExpressRail location, over prior year volumes.18 (EXPIRED)

Maritime Sector Strategy 52
Entity Taxes and Tax Rates Incentives and Programs Alabama19 • 0% sales tax on raw materials and components
• 1.5% rate for manufacturing equipment • 0.33% property tax • No inventory tax • Business license tax (aka Privilege Tax) range between
.025 to .175 mills per $1000 net worth, capped business license tax frozen at $15,000 per year.
• State Docks Capital Credit20: Investment credit for locating or expanding operations on APSPA owned or leased property, eligible to companies that locate or expand operation on port owned/leased property.
• 5% credit for investing in new or expanded warehouse facilities.21 • Tax credits and exemptions for businesses located in economically
depressed regions of the state. • Property tax credits for businesses engaged in warehousing and
distribution22.
Georgia23 • No sales tax on construction materials or raw materials used in processing or manufacturing.
• 0.83% property tax • No inventory tax on items held in factories and
warehouses. • No unitary tax24, only single factor apportionment.
• GPA Port Tax Credit Bonus for Investment credits: 5% credit on investments for increasing traffic through Georgia ports by 10% over prior year.
• GPA Port Tax Bonus credit for JOBS Tax Credit: For entities increasing port volumes by 10%: $4000 tax credit per new job created plus $1,250 tax credit per new job for companies that increase port volumes by 10%25
• Job Tax Credit Program: Create jobs in manufacturing or warehousing and receive up to $4,000 per job. Depends on county/tier structure as established by the state.
• Quality Job Tax Credit: Entities creating new jobs with average wages higher than county average receive up to $5,000 per job, for up to five years.
• Employer Job Tax Credits: exemption on taxes, based on location (county, number of jobs).
• Employee Tax Credit: 50 to 80% of value of new employee’s state income tax of (for up to 10 years).

Maritime Sector Strategy 53
Entity Taxes and Tax Rates Incentives and Programs Texas26 • No sales tax on raw materials, energy used in
manufacturing • No tax on inventory maintained <175 days • 1.87% property tax • No corporate income taxes.
• Enterprise Zone Program: tax refunds based on level of investment and jobs created. Up to $1.5m grant for creating jobs.
• Energy Sales and Use tax exemption: No taxes paid for electricity and natural gas used in manufacturing processes.
• Capital Fund Infrastructure Development Program: $500k to $1.5m grants to improve public infrastructure to assist businesses that commit to create/retain jobs in rural areas.
South Carolina27
• No sales tax on machinery, equipment, materials, or inventory
• 0% sales tax on energy used in manufacturing • 0.5% property tax • No unitary tax. • No local income tax.
• Job Development Credit: based on a portion of new employee’s withholding taxes. Depends on company pay structure and location
• Port Volume Increase Credit – Income tax credit to entities using state port facilities that increase cargo volumes over base year by 5%.28,29
• Up to $8m in income tax credits, based on approval by SC State.
Virginia30,31 • 0.74% property tax • No inventory tax on items held in FTZ.
• Major Business Facilities Job Tax Credit: $1,000 tax credit per job for new, full-time jobs.
• Port of Virginia Economic Development Incentive Grant (EDIG): Grants to companies locating activities in specific counties ($1m year, and maximum of $5m per company total. Incentive for businesses to locate new maritime-related employment activities or expand existing activities in specified localities, in order to encourage and facilitate growth of the Port. A business entity that meets all four criteria will be eligible for a one-time cash grant between January 1, 2013 and June 30, 2020.

Maritime Sector Strategy 54
Entity Taxes and Tax Rates Incentives and Programs Virginia Port Authority
• Barge/Rail Use Credit: $25 per TEU (16t) for barge/rail use. Applicable to non-containerized cargo in 2012 and after. 32,33
• International Trade Facility Tax Credit: $3,500 per job for increased volumes or 2% credit on qualified capital investments made to facility increased trade, coupled with increasing cargo by 10% through VPA-operated facility over prior tax year34,35,36.
• Port Volume Increase Tax Credit: $50 per TEU (or per 16t or bulk cargo) over base year, if volumes increased by 5+% single year over base year. 5% volume increase waived if facility is less than one year old. Applies to agriculture, manufacturing, mineral or gas entity.
British Columbia37
• No unitary tax. • 2.5 to 11% corporate income tax. • 0% federal and provincial sales tax (HST - harmonized
sales tax) on materials, advanced machinery, and equipment used in production.
• Total tax rates
• Income taxes are apportioned to local entities contribution to overall corporate liability.
• HST only charged on end product for goods sold in Canada. • Sales tax (GST and HST) are credited back (recovered) by manufacturers • Goods used in manufacturing or production, or purchased for resale or
export are exempt. • Tariffs on importation of parts and materials for manufacturing will be
eliminated in 2015. • Export Development Canada – a export credit agency offering innovative
financing, insurance, and risk management solutions to help Canadian exporters and investors expand their international businesses.
North Carolina Ports
• NC Ports Tax Credit : Entities owing NC state income tax qualify for tax credits for moving cargo through NC ports. Credit is earned on wharfage and handling fees, based on excess wharfage costs over 3-year average total wharfage fees paid by the entity. Total credit of $2m, carried forward for up to 5 years. Credit applies to taxes due to NC for up to 50% of total tax liability per year.

Maritime Sector Strategy 55
Entity Taxes and Tax Rates Incentives and Programs Port of Portland, OR
• Between $20 and $45 per container to carriers using the Port of Portland. • Port/ICTSI cost sharing program (expired in 2012) paid $2.7 million. • Carrier Incentive program for 2013 of $10 per container, total cost of $1m.
Florida – Port of Fernandina / Nassau County
• QTI – Qualified Target Industry Tax Refund – refund minimum of $6,000 per job; jointly funded between state and local community (80/20); State share is 100%. Manufacturing or distribution, add at least 10 jobs, overall payroll must be 115% statewide or local average wages. Refunds are $7,000 if payroll is 150% and 8,000 if payroll is 200%.
• Sales tax on equipment and machinery used in manufacturing is exempt from state sales tax.
• Economic Development Transportation Fund – state funded plan. Nassau county application.
Source: Port of Seattle

Maritime Sector Strategy 56
Appendix B Definitions and Endnotes
Incentives – provide a mechanism for a government authority to give money directly to an entity (business) in return for the entity’s actions, such as starting an activity, or making improvements to an existing facility. Forms of incentives include subsidies, grants, tax rebates, and financing all or portions of the facility capital improvements.
Exemptions – provide a mechanism for an entity to not pay the full amount of taxes and fees owed to the government based on basic tax rules. Forms of exemptions include tax credits or deductions.
Tax increment financing – a public financing method that used as a subsidy for redevelopment, infrastructure improvement, and other community improvement projects.
Leasehold Excise Tax – a tax on the use of public property paid in lieu of property tax. Single Factor Apportionment – taxation of corporate income based on a single factor, such as
sales. Some states use triple factor (income, property, and wages) and weight each factor differently to determine the taxable value of the entity. At least 12 states are using single factor apportionment.
Unitary Tax – taxation of an entity’s income is based on the entire tax liability, regardless of where the income was earned. For example, if Georgia has unitary tax language in its code, and Microsoft has a facility in Georgia, then the state can levy income tax on all worldwide income generated by Microsoft.
1 www.dor.wa.gov. 2 The Multiple Activity Tax Credit. A manufacturer who makes AND sells a product at wholesale does not pay both manufacturing and wholesale B&O tax). WAC 458-20-19301. 3 www.oregon4biz.com. 4 Based on local tax rates (0.87% average statewide). 5 Unused credits may be carried over for next 5 years. 6 www.californiastep.org, business.ca.gov, 7 Accelerated depreciation for tangible personal property purchased in an Enterprise Zone. 8 www.commerce.idaho.gov/incentives-and-financing 9 Ability to carry forward for up to 14 years. Invest in qualified new equipment. 10 Qualify for partial/full property tax exemption for 5 years. 11 www.esd.ny.gov/BusinessPrograms/Taxes_Incentives.html. 12 www.state.nj.us/treasury/taxation/cbt-creditlist.shtml 13 NJ Sales and Use Tax (NJSA54:32B-1 et seq.). 14 P.L. 1985, c.227, N.J.S.A. 55:19-13, N.J.A.C. 18:7-3.28. 15 Applies to entities with max credit of $1m for entities with <50 staff, net income <$5m) 16 PL 1993 c. 170, P.L. 2002, c.40, N.J.S.A. 54:10A-5.4 et seq., N.J.A.C. 18:7-3.22. See 37 N.J.R. 1895(b) (May 16, 2005.) 17 A joint program with NJ Economic Development Authority Operated before Global Economic Crisis, but being reinitiated due to low vacancy rates in existing regional market. 18 This might be old. Found it on Port NY/NJ site, dated 2009. Check

Maritime Sector Strategy 57
19 www.revenue.alabama.gov/Taxincentives, www.madeinalabama.com. 20 Economic Development Partnership of Alabama, www.edpa.org/docs/alabama-taxes-and-incentives.pdf. 21 Does not apply to equipment in facility, unless capacity increases by 50% or more. Additional requirements for level of capital costs, employment, and wages. 22 New warehouse activities must have a capital cost of $1m (in favored geographical areas), and $5m for projects not in favored geographical area. Expanded activities must be at least 30% investment of original facility costs, or $2m. If the land used for new facilities is certified by the Alabama Department of Environmental Management as “Brownfield”, then there is no limit on the capital costs required business entity. 23 Georgia Department of Economic Development. www.georgia.gov/competitive-advantages/tax-exemptions/ 24 A state corporate income tax on worldwide income. Governments institute unitary taxes to close loopholes allowing entities to use accounting techniques to transfer their income to states or countries with lower income-tax rates. Unitary taxes are typically based on a combination of sales, payroll, and property attributed to a state. 25 Sample bonus calculation of port tax credit bonus for job tax credits: Suppose a company creates 50 jobs in a Tier 1 county and increases its port traffic by at least 10 percent over the previous year; that activity yields a tax credit of more than $1.3 million over five years: $4,000 job tax credit + $1,250 port tax credit bonus = $5,250 total credit per job; 50 jobs x $5,250 = $262,500 x 5 years = $1,312,500 26 www.texaswideopenforbusiness.com. 27 www.sccommerce.com. 28 Requires 75 tonnes of non-containerized cargo, or 10 loaded TEUs through SC ports in base year. Up to $8m, as determined by the SC Coordinating Council for Economic Development. 29 Changes taking effect in January 2014 include broadening the pool of qualified companies to include third-party logistics providers that store and handle cargo as it moves along the supply chain, removing a $4m limit on employee withholdings. 30 Virginia has identified three incentives that are mutually exclusive. An entity can apply for all, but cannot claim more than one credit for the same activity or activities. 31 www.portofvirginia.com 32 Used as an incentive to us the Virginia Inland Port (Front Royal) and the Port of Richmond. 33 VA Code Section 57.1-439.12:09. 34 VA Code Section 58.1-439.12:10. 35 To qualify of the International Trade Facility Tax Credit, an international facility is defined as a company that: is engaged in port-related activities; uses VPA-operated marine port facilities in Virginia; and transports at least 10 percent more cargo, measured in TEUs, through VPA-operated marine port facilities in Virginia during the taxable year than was transported by the same company through such facilities during the preceding taxable year (see VA Code Section 58.1-439.12:06(A)). 36 See 2012 Updated ITF Guidelines.pdf at www.tax.virginia.gov . 37 www.tools.britishcolumbia.ca.