a strategic review of the petroleum refinery industry sector · petroleum refinery industry sector....
TRANSCRIPT
R&D Publication 21i
A Strategic Review of the Petroleum Refinery Industry Sector
R&D Publication 21
Research Contractor:
Foster Wheeler Energy Ltd
R&D Publication 21ii
Publishing OrganisationEnvironment AgencyRio HouseWaterside DriveAztec WestAlmondsburyBRISTOLBS32 4UD.
Tel: 01454 624400 Fax: 01454 624409
ISBN: 1 85705 213 7
© Environment Agency 1999
All rights reserved. No part of this document may be reproduced, stored in a retrieval system, or transmitted, in anyform or by any means, electronic, mechanical, photocopying, recording or otherwise without the prior permission ofthe Environment Agency.
The views expressed in this document are not necessarily those of the Environment agency. Its officers, servants oragents accept not liability whatsoever for any loss or damage arising from the interpretation or use of theinformation, or reliance upon the views contained herein.
Dissemination StatusInternal: Released to RegionsExternal: Released to Public Domain
Statement of UseThis report reviews the environmental performance of the UK petroleum refinery industry sector in the context ofworld-wide best practice. Five practical options for reducing emissions are examined. The report will be used bothexternally and internally, by policy and operational staff, in the development of policies for the regulation of thepetroleum refinery industry sector.
Research ContractorThis document was produced under Environment Agency R&D Project P4-035 by:
Foster Wheeler LtdFoster Wheeler HouseStation RoadReadingBerkshireRG1 1LX
Environment Agency Project ManagerThe Environment Agency’s Project Manager for R&D Project P4-035 was:Mr Colin Foan, Environment Agency, National Centre for Risk Analysis and Options Appraisal.
Fur ther copies of this r epor t are available from:Environment Agency R&D Dissemination Centre, c/oWRc, Frankland Road, Swindon, Wilts SN5 8YF
tel: 01793-865138 fax: 01793-514562 e-mail: [email protected]
R&D Publication 21iii
CONTENTSPage
Executive Summary 1
1. Introduction 5
2. Key Factors Affecting UK Refiner ies up to 2005 72.1 Crude Supply and Quality 72.2 Product Quality Changes 132.3 The Future for Fuel Oil 152.4 UK Refinery Capacity and Economics 172.5 Discussions with Operators 202.6 Legislation for Releases to Air 222.7 Legislation for Releases to Water and Land 24
3. UK Refiner ies 263.1 Types of UK Refinery 263.2 Sources of Polluting Emissions on Refineries 283.3 Discussions with Local Inspectors 313.4 Inventory of UK Refinery Sector Releases 33
4. Wor ld-Wide Refinery Best Practice 404.1 Introduction 404.2 USA 404.3 Scandinavia 434.4 Japan 434.5 The Netherlands 444.6 Summary and Comparison with UK Practice 44
5. Pollution Reduction Issues, Techniques and Costs 465.1 Introduction 465.2 Sulphur and Sulphur Dioxide Abatement 465.3 Sulphur Recovery Units (SRU) and Sulphur Balance 495.4 Abatement of Oxides of Nitrogen (NOx) 505.5 Particulate Abatement 535.6 CCGT/CHP Facilities 535.7 VOC Abatement 535.8 Effluent Water Treatment 535.9 Summary of Costs of Abatement Plant 55
6. Pollution Reduction Strategies 586.1 General Considerations 586.2 Options for Reduction of Releases to Air 596.3 Results of Evaluation of Options 626.4 Implications for the Refinery Sector 656.5 Comparison with Legislation 666.6 Timetable for Implementation of the Options/Strategies 66
7. Longer -Ter m Strategies and Influences 687.1 Introduction 687.2 Sulphur Removal 687.3 Oxides of Nitrogen 697.4 Particulates 697.5 Volatile Organic Compounds (VOCs) 707.6 Carbon Dioxide Releases 707.7 The Emergence of Fuel-Cell Technology and Effect on Refineries 717.8 Summary 72
8. Conclusions 74

R&D Publication 21iv
Appendices
A1 Description of UK Refineries 77A2 Brief Layman’s Guide to Oil Refineries 80A3 Glossary of Terms and List of References 83
This Review has been prepared by Foster Wheeler Energy Limited under the terms of its contract with theEnvironment Agency. Whilst the report and recommendations have been prepared in accordance with normalprofessional standards, information contained herein is largely dependent upon data in the public domain providedfrom the Environment Agency Public Register and other third parties. Foster Wheeler has not made any independentverification of such data. Accordingly, Foster Wheeler makes no representation or warranty, express or implied,with respect to the completeness or accuracy of any information contained in this Report. This Review is intendedfor the sole use of the Environment Agency and Foster Wheeler shall have no responsibility whatsoever to any thirdparty for the whole or any part of this Report or the information contained herein.

R&D Publication 211
FOREWORD
The Environment Agency has the strategic aim andduty to protect and enhance the environment. Tosupport this work it also has a duty to undertakeresearch and make the results available to others.
Processes with a significant potential to causepollution are regulated by the Agency underprovisions in The Environmental Protection Act1990. Included within these processes are many inthe petroleum refinery industry sector. Operators ofthese techically complex processes are required touse the best available technique not entailingexcessive cost to prevent or minimise releases ofpolluting substances in order to achieve the bestpracticable environmental option.
The Agency, therefore, commissioned thisindependent report from Foster Wheeler EnergyLimited to help it form an objective view of thecurrent environmental performance of the UKrefinery sector. The study has sought to identifysignificant issues that could affect the industry’senvironmental performance. Emissions, processoptions and abatement practices from a number ofcountries were investigated and worldwide bestpractice considered in the context of applicability tothe UK situation.
Recent changes in the European transport fuelspecifications and the UN sulphur protocol areevidently going to present the sector with somesignificant and conflicting economic and technicalchallenges. The results of this review will assist us tomake appropriate regulatory decisions to ensure thatthe UK refinery sector uses the best availabletechniques not entailing excessive cost to protect theenvironment. It will also serve as an importantcontribution to the efficient regulation of thepetroleum refinery industry sector.
Dr R J PentreathChief Scientist and Director of EnvironmentalStrategy
EXECUTIVE SUMMARY
European, including the UK, refiners have beenstruggling with over capacity and poor or negativemargins for many years. This situation has beenespecially difficult since 1994. Overall, utilisationlevels have risen recently but highly-efficient marketshave resulted in any surplus product reducingprevailing prices and preventing improvedprofitability.
One result of low profitability is that refiners have,where possible, minimised capital expenditure andreduced operating costs. However, there has been,and will be, some expenditure to meet newenvironmental specifications on product quality andrequirements for control of releases to theenvironment. The availability of plenty of light, low-sulphur North Sea crude has helped to minimise thisexpenditure. UK refineries have as a result nowbecome dependent to a greater or lesser extent onlight, low-sulphur feedstock to meet current productspecifications and emission-release limits.
The continuing availability of this quality of crude istherefore a key factor in determining the futureprofile of UK refineries. An assessment of crude oilavailability from the North Sea has been carried outand it is concluded that supplies will continue to beadequate at least until 2005, and probably beyond. Itis to be expected that UK refiners will continue todepend mainly on North Sea crude during this period.
Given this premise, one of the most important factorsfor refiners during the period that this Review coversis the further tightening of product quality standards,particularly those for transport fuels. The EuropeanCommission and Parliament have recently agreednew standards, which are to become effective from2000 and 2005. The 2005 standards include a sharpreduction in levels of benzene, aromatics and sulphurin gasoline and sulphur in diesel. It has beenestimated that the increased refinery processing,mainly in the form of extra hydrotreatment, needed tomeet the fuel specifications for 2005 would mean theUK refinery sector increasing its CO2 emissions bybetween 2% and 4%. The supply of hydrogenrequired for this extra hydrotreatment will be an issuerefiners will need to address.
The investment needed to meet these new standardswill mark a watershed for European refiners. Mostrefineries will require modification as they will beunable to produce compliant product, even whenprocessing the best quality crudes such as those fromthe North Sea. Depending on the overall profitabilitylevels of the industry in the next few years, we couldsee a significant investment programme or a series ofclosures and mergers. If margins rise to the levelwhich offers a reasonable rate of return then, besidesinvestment to meet EU product quality legislation,further upgrades to the bottom of the barrel would be
R&D Publication 212
expected to occur. This would entail substantialexpenditure. However, if margins remain depressed,some further mergers or closures might be expected,since, for some operators, it is likely to beuneconomic to carry out a heavy programme ofinvestment under these circumstances.
In addition to these tighter EU product specificationsthere are a number of pieces of existing orprospective legislation that will require reductions inreleases to air. These include:
• the existing Large Combustion Plant Directive(LCPD) 88/609/EEC covering SO2 and NOx;
• the proposed new Large Combustion InstallationDirective (LCID);
• the United Nations Economic Commission forEurope (UNECE) Second Sulphur Protocol(1994);
• the proposed EU Communication on Acidification(COA) strategy for Europe covering SO2, NOxand ammonia. (This Communication is now likelyto be in the form of a proposed National EmissionCeilings Directive;
• the proposed EU Directive on ‘The reduction ofthe sulphur content of certain liquid fuels’(regarding fuel oil).
UK refineries range from a relatively simplehydroskimming refinery to cracking and bottom ofthe barrel upgrading refineries. Upgrading refineriesare more complex and have proportionately largermass emissions as cracking and bottom of the barrelupgrading are more energy demanding thanhydroskimming.
As requested by the Environment Agency a refineryrelease inventory has been developed as part of thisReview using information from the Public Register.This shows that in 1996 reported UK refineryemissions of SO2 were about 120 000 tonnes, whichrepresents about 5% of national emissions. In respectof NOx, reported refinery emissions were about30 000 tonnes in 1996 forming approximately 1.3%of national emissions. Reported particulate releasesconstitute about 0.8% of national emissions based on2600 tonnes from refineries in 1996. Total sector CO2releases were estimated to be 2.6% of the nationalemissions. The inventory also shows that on arefinery-sector basis approximately 54% of SO2releases are from combustion processes, 17% fromFCCUs (fluid catalytic cracker units), 19% fromSRUs (sulphur recovery units) and about 10% fromvarious other sources. Similarly for NOx on a sectorbasis, 81% of releases come from combustion, 15%from FCCUs and 14% from other sources includingcalciners. Not all emissions are reported (notablyparticulates) and insufficient data were available forflare emissions to be considered in the abovenumbers.
A number of comments have been made in thisReview concerning the data on the Public Register.For example, the Environment Agency may wish toconsider requesting, as a standard requirement, aVOC (volatile organic compound) release inventoryand a sulphur balance for each refinery, informationthat only a few refiners presently supply. It was notpossible to complete an extensive inventory ofreleases to water owing to lack of consistent data onthe Public Register.
Data from the Public Register also show that forsome combustion plant and FCCUs actual 1996reported release levels, especially SO2, weresignificantly below the release limits set by theEnvironment Agency. While there may be goodreasons for this, it could also mean that potentiallysignificant increases in current refinery releases to aircould occur within existing limits. However, anyrevision to limit levels, with this in mind, would needto take account of a refinery’s complexity,particularly the processing scheme and product slate.
Meetings were held with the local EnvironmentAgency inspector responsible for each refinery aswell as with all refinery operators. Notes of thesemeetings have been sent separately to theEnvironment Agency and although they are notincluded in the Review, the information gained,which was not confidential, has been used whereappropriate. Similarly, notes of meetings withoperators have been made and sent to themindividually and they are not included in thisdocument. However, a summary of the main pointsmade by most operators is included in Chapter 2. Themain points they emphasised included the fact thatthey are concerned to have clear target/limits inrespect of environmental releases and that theseshould be based on ‘sound science’. They also saidthey had no major investment plans in the near future,i.e. the next 12 months.
Comparison of UK abatement practice with world-wide refinery best practice in such countries as theUSA, Scandinavia, Japan, and the Netherlands showsthat the UK lags behind in the levels of abatementapplied. Scandinavian refineries represent the world’sbest practice. The SO2 release levels, for example,from the Mongstad refinery (Norway), which has acrude capacity of about 38 million barrels/year, areabout 2000 tonnes/year compared to UK refinerieswhich have SO2 releases ranging between5000-20 000 tonnes per year with crude capacities of28 to 98 million barrels/year. However, it should benoted that many of these countries with which theUK is compared, including Scandinavia, haveparticular, in-country, reasons for requiring very lowrelease levels.
Based on analysis of the refinery release inventoryprepared for this Review, a number of options (orstrategies) for reduction of releases have been
R&D Publication 213
developed. The effects on the UK refinery sector as awhole of applying these options in terms of reducedrelease levels, cost, and economic effects have alsobeen assessed. In order to make this overallassessment, the effects on each individual refinerywere considered and these components were thenaggregated. Information on the assessment of theeffects on each refinery is not included in thisReview. Where data were missing from the PublicRegister, estimates have been made taking intoaccount the size and configuration of the refineryconcerned. The abatement options that were assessedare set out below.
(1) The reduction of the sulphur in the fuel oilfired on refineries to 1%. Typically this mightinvolve substituting a vacuum residue with aNorth Sea atmospheric residue.
(2) Substituting fuel oil firing with natural gas orliquefied petroleum gas (LPG) and the sale ofexcess fuel oil. It is assumed fuel gas is alreadybeing fired to its maximum extent. (It shouldbe noted that most UK refineries arereasonably well situated to receive natural gasfrom the National Transmission System(NTS). However, refineries in South WestWales currently have no readily-availablecommercial natural gas supply.)
(3) Abating key stacks, typically two, using wetgas scrubbing with caustic soda or equivalent.
(4) A combination of Options 2 and 3, wherebyfuel oil of elevated sulphur content would befired in stacks fitted with wet scrubbing whileall remaining combustion units would be firedon fuel gas, supplemented if required withLPG or natural gas.
(5) To achieve the reductions required by 2010under the proposed EU Large CombustionInstallation Directive and theCommunication on Acidification.
Overall it is considered that the first four optionsrepresent a feasible strategy for most refineries. Theabatement measures involved in the fifth optionwould include firing clean gas in combustion plantand installing selective catalytic reduction in the fluegas streams of combustion plant. Scrubbing of FCCUflue gases would also be needed together with a rangeof other improvements including upgrades to sulphurrecovery systems. As a result, this fifth optionrepresents an order of magnitude cost increase forrefiners compared to the first four options.
It should be noted, that not every option cannecessarily be applied to every refinery, e.g. theimport of natural gas would be difficult at therefineries in South West Wales. Indeed, anyindividual refiner if required to reduce releases to air
may opt for a combination of abatement measureswhich, while not the same as any of the options,could have much the same effect.
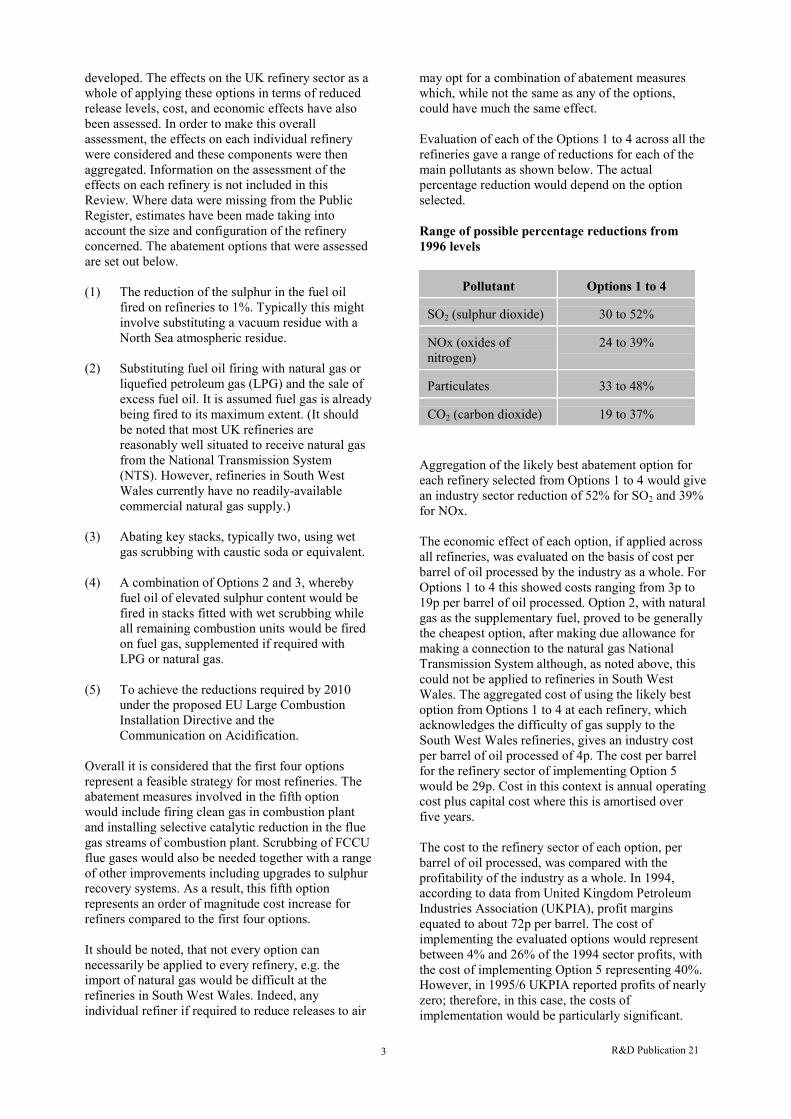
Evaluation of each of the Options 1 to 4 across all therefineries gave a range of reductions for each of themain pollutants as shown below. The actualpercentage reduction would depend on the optionselected.
Range of possible percentage reductions from1996 levels
Pollutant Options 1 to 4
SO2 (sulphur dioxide) 30 to 52%
NOx (oxides ofnitrogen)
24 to 39%
Particulates 33 to 48%
CO2 (carbon dioxide) 19 to 37%
Aggregation of the likely best abatement option foreach refinery selected from Options 1 to 4 would givean industry sector reduction of 52% for SO2 and 39%for NOx.
The economic effect of each option, if applied acrossall refineries, was evaluated on the basis of cost perbarrel of oil processed by the industry as a whole. ForOptions 1 to 4 this showed costs ranging from 3p to19p per barrel of oil processed. Option 2, with naturalgas as the supplementary fuel, proved to be generallythe cheapest option, after making due allowance formaking a connection to the natural gas NationalTransmission System although, as noted above, thiscould not be applied to refineries in South WestWales. The aggregated cost of using the likely bestoption from Options 1 to 4 at each refinery, whichacknowledges the difficulty of gas supply to theSouth West Wales refineries, gives an industry costper barrel of oil processed of 4p. The cost per barrelfor the refinery sector of implementing Option 5would be 29p. Cost in this context is annual operatingcost plus capital cost where this is amortised overfive years.
The cost to the refinery sector of each option, perbarrel of oil processed, was compared with theprofitability of the industry as a whole. In 1994,according to data from United Kingdom PetroleumIndustries Association (UKPIA), profit marginsequated to about 72p per barrel. The cost ofimplementing the evaluated options would representbetween 4% and 26% of the 1994 sector profits, withthe cost of implementing Option 5 representing 40%.However, in 1995/6 UKPIA reported profits of nearlyzero; therefore, in this case, the costs ofimplementation would be particularly significant.
R&D Publication 214
It should be recognised that this economic analysishas been restricted to assessment of the refineryindustry sector only. It has not considered the broadereconomic base of the operating companies whichown the refineries, which usually include oilproduction facilities and downstream chemicalsmanufacture.
The reductions offered by the options were comparedwith the requirements of current and potentiallegislation. This showed that, if implemented acrossall refineries, Options 1 to 4 would provide therequired levels of abatement to meet the existingLCPD 88/609/EEC and the UNECE Second SulphurProtocol (1994). This is based on the assumption thatthe UK refinery industry has met the reductions thatare required by the LCPD and the Protocol up to thepresent time. None of Options 1 to 4 would providethe level of abatement needed to meet therequirements of the proposed new LCID and the EUCOA acidification strategy. Only Option 5 would dothis.
If installed to meet the 2005 fuel specifications,FCCU hydrotreatment would provide about a 90%reduction in SO2 releases from the FCCUregenerators. However, due to its high capital cost itis not seen as a measure that can reasonably beapplied for the sole reason of abatement.
In the longer term gasification is seen as a possiblesolution for the disposal of high sulphur residue oils.It would produce ‘syngas’, which could be used as aclean gaseous fuel for combustion as well asproviding hydrogen for hydrotreatment and carbonmonoxide feedstock for organic chemical synthesis.However, current economic factors are very muchagainst the process being selected by refiners in theshort term except perhaps on a co-operative basis.These factors include the relatively high capital andoperating cost of the process, the reasonable marketfor fuel oil still prevailing, the relatively low cost ofnatural gas as a fuel for combustion, the good supplyof light sweet North Sea crude oil, and the small pricedifferentials currently existing between the sweetcrudes and the heavier sourer crudes. If any of thesefactors were to change significantly, and the emissionlevels proposed under the LCID and COA were tobecome firm requirements, refiners might considergasification more seriously.
The combustion of ‘clean’ gaseous fuels offers manyadvantages over heavy fuel oil including lower SO2,NOx, particulates, heavy metals and CO2 releases.However, the amounts of refinery fuel gas availablefor combustion in refineries may decrease due to itshydrogen component being required for the extrahydrotreatment needed to meet the 2005 fuelspecifications. Some refiners may invest in newreforming plant to provide the extra hydrogenrequired; however, others may wish to burn more fueloil. Even if low sulphur fuel oil is fired this could still
lead to increases in levels of NOx , particulates andheavy metals unless additional abatement is provided.
The optimum route for the reduction of CO2emissions in the longer term seems likely to be thecombustion of gaseous fuels with highhydrogen/carbon ratios such as refinery fuel gas,natural gas, LPG or hydrogen itself possiblyproduced from reforming or gasification processes..
There are reports that significant advances have beenmade recently in hydrogen/oxygen fuel celltechnology for the powering of vehicle transport. Iffuel-cell-powered vehicles should prove technicallyand commercially viable in the next five to ten years,the major effect on refineries would be the need tosupply the new fuel to the required specification,while maintaining existing fuel types.
Postscript
Since completing this Review a recent change hasbeen made by the EU to the proposed LargeCombustion Installation Directive. Originally thisspecified emission limits for SO2 and NOx releasesfrom existing and new large combustion installationsincluding gas turbines. The proposal has recentlybeen modified so as not to apply to existing plant.However, demanding National Emission Ceilings,designed to be met by the year 2010, are proposed bythe EU as a result of the Communication onAcidification. The softening of the LCIDrequirements therefore will only have a relativelyminor effect on the evaluations made in respect ofOption 5 in this Review.
Key words
refinerypetroleumemissionsabatementoil
R&D Publication 215
1. INTRODUCTION
This Strategic Review of the Petroleum RefineryIndustry Sector has been carried out by FosterWheeler Energy Limited on behalf of theEnvironment Agency. Specifically, Foster Wheelerwas requested to:
• Review the UK petroleum refining industry andcompare the UK refinery practice with bestpractice around the world.
• Prepare a national inventory of releases (includingboth authorised and fugitive releases) made by thesector to air, water and land and indicate whichpollutants have the greatest environmental impact.
• Prepare a range of strategies to reduce the releasesfrom the refinery industry sector. These shouldconcentrate on the pollutants with the mostsignificant environmental impact.
• Estimate the overall costs of each of the mostsignificant pollution release reduction strategiesand undertake detailed economic analysis of theimplications.
• Predict the probable effect upon the releaseinventory of implementing the most significantpollution release reduction options.
• Examine strategies to reduce pollution releasesfrom the petroleum refinery sector in the longerterm (25 years).
Chapter 2 of this Review discusses the importantfactors currently affecting UK refineries such ascrude oil supply, environmental legislation, productdemands and refinery economics.
Chapter 3 includes reviews of the current levels ofabatement applied to UK refineries and an inventoryof their releases to air.
Chapter 4 compares UK abatement practice withworld-wide best practice. Countries such as the USA,Japan, the Netherlands and Scandinavia areconsidered.
Chapter 5 discusses pollution reduction issues forrefineries, techniques for pollution reduction andtheir costs.
Chapter 6 sets out five options (or strategies) forpossible pollution reduction and assesses theireffectiveness and cost with current and proposedenvironmental legislation for the refinery sector as awhole:
Chapter 7 discusses pollution reduction technologyand associated issues in the longer term.
A number of important points should be notedregarding the Review. These are as follows-
(a) The UK refineries considered in this Revieware BP Grangemouth, Phillips Petroleum NorthTees, Lindsey at Killingholme, Conoco also atKillingholme, Shell Stanlow, BP Coryton,Shell at Shell Haven, Esso Fawley, MobilLlandarcy, Texaco Pembroke and Elf atMilford Haven. Gulf also at Milford Haven hasalready been closed and has therefore not beenconsidered in detail. Shell Haven is planned toclose in 2000 but has been included as part ofthis Review. It should be noted that while thisReview has included BP Grangemouth, thisrefinery is authorised by Scottish EnvironmentProtection Agency (SEPA) and not by theEnvironment Agency which is responsible forrefineries within England and Wales only. Theinclusion of BP Grangemouth is designed tocomplete the overall picture of the UK refineryindustry.
(b) It has been prepared using only information inthe public domain. In particular it is based ondata for releases to the environment taken fromthe Public Registers held by EnvironmentAgency offices in Britain. These release dataare for the year 1996 representing the latestand most complete set of information availableat the time this Review was prepared.
(c) The Review, as far as possible, takes accountof prevailing (1997 to 1998) refinery practice,economics, crude oil supply, market trends,environmental legislation including likelyfuture legislation, product demand, possiblepollution abatement techniques and the viewsof the refinery operators. It should be notedthat, like all industries, any of these factors canbe subject to relatively rapid change.
(d) Oil refineries are extremely complexoperations, probably the most technically andoperationally complex of all industry sectors,with a large number of integrated, high costprocessing units producing a wide range ofmainly combustible products in very largevolumes. Each refinery will therefore havemany constraints which will influence itspreferred methods of dealing withenvironmental factors and pollution abatement.This Review addresses these subjects as far aspossible when choosing the five possiblepollution abatement options, although incovering the whole refinery sector it isnecessarily generic in its approach. It is to beexpected that refiners could offer alternativesolutions and strategies to those contained in
R&D Publication 216
this Review which could achieve similarabatement results. The complexity of thisReview is, to a large extent, due to thecomplexity of the industry sector.
(e) Due to the very site-specific nature of local airand water quality, no assessment has beenmade of the current effects individualrefineries may be having on the local air andwater quality in their areas, nor on theimprovements the possible abatement optionsmight have on local air and water quality. Todo this would require a detailed assessment ofeach refinery's releases using dispersionmodelling techniques.
(f) Discussions have been held with each of theUK refinery operators together with the UKPetroleum Industries Association (UKPIA).Their views are set out in Chapter 2 of thisdocument.
(g) Little major new investment is envisaged in theUK refinery sector in the immediate future (thenext one to two years). This Review thereforemainly addresses existing refinery plant and itsoperation.
(h) While the information given in this Review isessentially based on data for individualrefineries taken from the Environment AgencyPublic Register and elsewhere within thepublic domain, the data have been analysed soas to present further information and commentfor the whole of the UK refinery sector.
(i) The Environment Agency terms of referencefor this Review ask that the options andstrategies prepared should concentrate on thepollutants with the most significantenvironmental impact. A number of UKGovernment and European environmentalreports and legislation give guidance on thismatter, such as the proposed EU acidificationstrategy, the second UNECE SO2 protocol andthe proposed Directive on Large CombustionInstallations. Guidance from these documentshas therefore been followed rather thandeveloping this subject afresh in this Review.
(j) This Review has assumed that the reader has abasic understanding of oil refinery operationsand processes. Readers less familiar with thisindustry sector may find the descriptions andexplanations helpful that are given inAppendix 2 of this Review, and in the HMSOChief Inspectors Guidance Note for ProcessesSubject to Integrated Pollution Control entitled‘S21.10 - Petroleum Processes: Oil Refiningand Associated Processes’.

R&D Publication 217
2. KEY FACTORS AFFECTING UKREFINERIES UP TO 2005
There are a number of important economic factors aswell as significant current and future environmentallegislative measures which will directly andindirectly affect refineries and their releases to theenvironment. These include:
• future crude quality and supply;• future markets for fuel oil;• refinery capacity and economics;• product quality changes;• current and future environmental legislation.
These factors are discussed in further detail below.
2.1 Crude Supply and Quality
Almost all the UK refineries are currently processingNorth Sea crude oil to a greater or lesser extent.Compared with other crude oils produced around theworld North Sea crude is both light (contains a higherproportion of lower boiling point fractions) and sweet(low in sulphur). The effect of North Sea crudeprocessing on UK refineries is threefold. First, due tothe relatively low sulphur content of the crude, SO2emission limits are generally met comfortably bymost refineries. Second, the crude produces more ofthe profitable light transportation fuels (gasoline anddiesel) in the first stage of crude processing and theserequire less hydrotreatment to remove sulphur. Third,the quality of the resulting residue is such that it isrelatively low in sulphur and permits greaterconversion to these lighter transportation fuels and acorrespondingly lower proportion of fuel oil. By wayof simple illustration, a given refinery configurationprocessing a North Sea crude could have a 20% fueloil yield, whereas the same refinery processing heavyArabian crude would have a 50% to 70% fuel oilyield. In reality each refinery has its own specificconfiguration and crude diet, and a few UK refineriesare processing heavier crudes in combination withNorth Sea crude. UK refiners are dependent uponNorth Sea crude to meet current and future marketdemands and sulphur emission limits.
It is therefore important to assess whether light/sweetcrudes will continue to be available to UK refineries.
To this end an assessment has been undertaken ofboth the future production of North Sea crude and thelikelihood that UK refineries can rely on supply ofthis crude in a competitive world market place.
2.1.1 UK Production
The North Sea is a significant supplier(approximately 20%) of non-OPEC (Organisation ofPetroleum Exporting Countries) crude oil. Althoughin general the qualities of North Sea crude are beingmaintained, more recently the Chevron Alba Fieldsand Statoil’s Heidrun Field have produced acidiccrude oil and special arrangements have had to bemade to refine this. High acidity crudes are forecastto rise in production from 0.5 million barrels per dayto 1.1 million barrels per day by the year 2000.
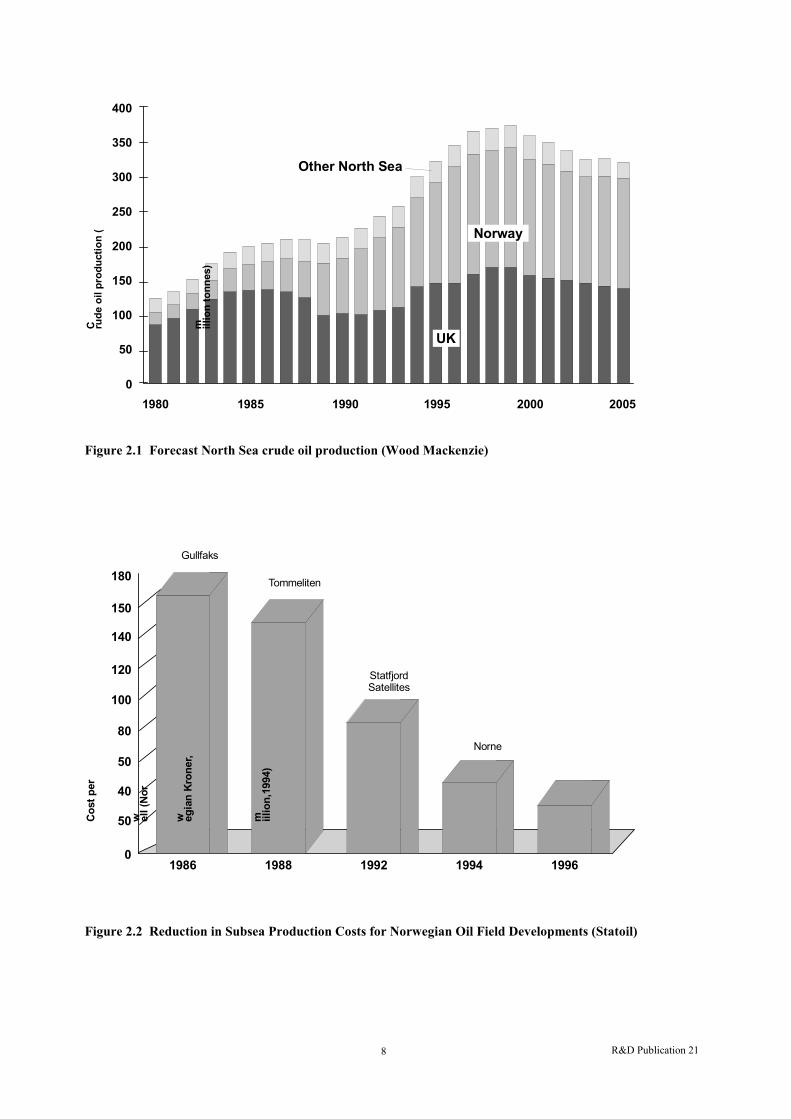
Looking to the future, Figure 2.1 shows a currentforecast of total North Sea crude production up to2005. It shows that Norwegian output is due toremain at or near current levels and that UK crude oiloutput, after a peak in 1998, is forecast to declinesteadily but still remain at a high level in historicalterms.
The rate of decline in the volume of UK suppliespost-2000 will be inevitably a matter of debate.Pessimists will argue that there are too few new smallfields to compensate for the decline in output fromolder large fields.
Sir David Simon, until quite recently chairman of BP,said in June 1997: “Finding and development costs inthe UK Continental Shelf have fallen by $8 per barrelsince 1990. That has been enough - in combinationwith a creative and responsive tax regime - to sustainboth exploration and development activity.Production looks set to increase for at least anothertwo years and the UK should still be producing asmuch as 2 million barrels of oil per day even in 15years’ time”.
Costs of North Sea production have fallen due to bothtechnical improvements (e.g. 3-D seismic, horizontaldrilling, sea-bed production facilities, increasedrecovery rates, floating production vessels etc.) andcommercial improvements (‘out sourcing’, alliancecontracts etc.). For instance, Figure 2.2 illustrates thedramatic cost reduction in subsea facilities achievedin the last ten years.
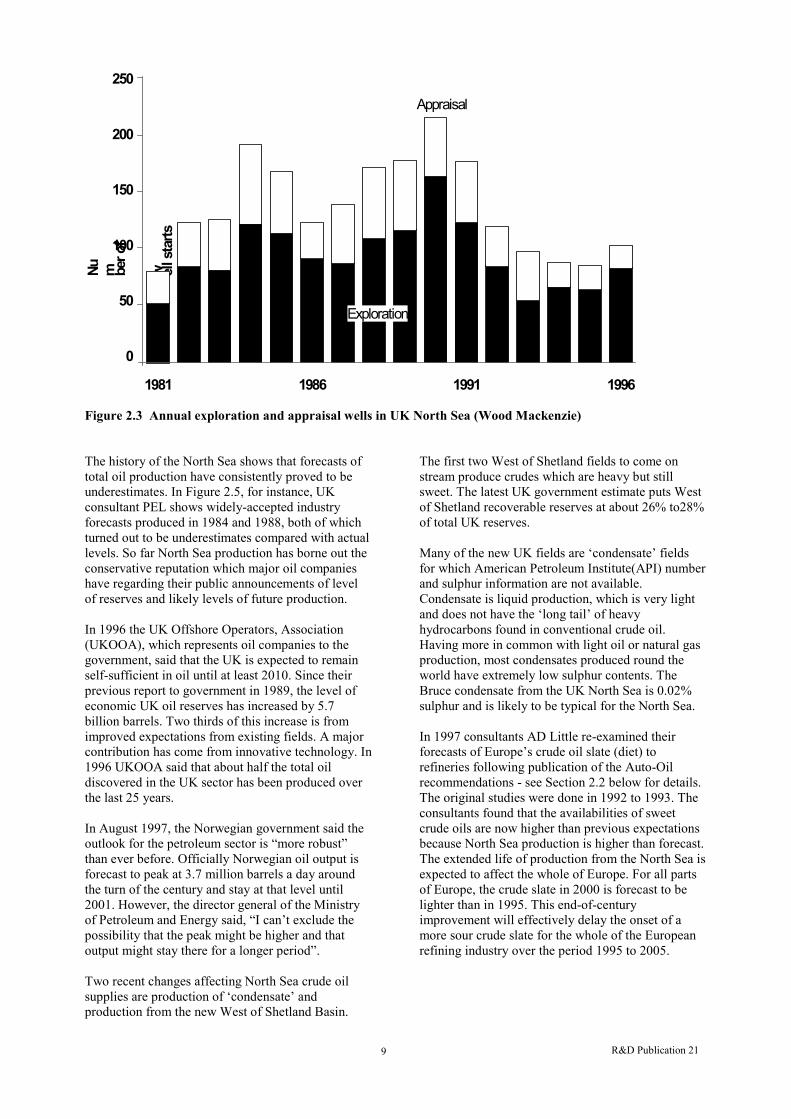
Figures 2.3 and 2.4 show the level of explorationactivity and success respectively.
R&D Publication 218
400
0
350
300
250
200
150
100
50
1980 19901985 1995 2000 2005
Norway
UK
Other North Sea
C rude
oil
prod
uctio
n (
m illio
n to
nnes
)
Figure 2.1 Forecast Nor th Sea crude oil production (Wood Mackenzie)
1986 1988 1992 1994 19960
50
100
120
140
180
150
40
50
80
Year
Cos
t per
w ell (
Nor
w egia
n K
rone
r,
m iilio
n,19
94)
Gullfaks
Tommeliten
StatfjordSatellites
Norne
Figure 2.2 Reduction in Subsea Production Costs for Norwegian Oil Field Developments (Statoil)
R&D Publication 219
1981
Nu m ber o
f
w ell s
tarts
Appraisal
1986 1991 1996
250
200
150
100
50
0
Exploration
Figure 2.3 Annual exploration and appraisal wells in UK Nor th Sea (Wood Mackenzie)
The history of the North Sea shows that forecasts oftotal oil production have consistently proved to beunderestimates. In Figure 2.5, for instance, UKconsultant PEL shows widely-accepted industryforecasts produced in 1984 and 1988, both of whichturned out to be underestimates compared with actuallevels. So far North Sea production has borne out theconservative reputation which major oil companieshave regarding their public announcements of levelof reserves and likely levels of future production.
In 1996 the UK Offshore Operators, Association(UKOOA), which represents oil companies to thegovernment, said that the UK is expected to remainself-sufficient in oil until at least 2010. Since theirprevious report to government in 1989, the level ofeconomic UK oil reserves has increased by 5.7billion barrels. Two thirds of this increase is fromimproved expectations from existing fields. A majorcontribution has come from innovative technology. In1996 UKOOA said that about half the total oildiscovered in the UK sector has been produced overthe last 25 years.
In August 1997, the Norwegian government said theoutlook for the petroleum sector is “more robust”than ever before. Officially Norwegian oil output isforecast to peak at 3.7 million barrels a day aroundthe turn of the century and stay at that level until2001. However, the director general of the Ministryof Petroleum and Energy said, “I can’t exclude thepossibility that the peak might be higher and thatoutput might stay there for a longer period”.
Two recent changes affecting North Sea crude oilsupplies are production of ‘condensate’ andproduction from the new West of Shetland Basin.
The first two West of Shetland fields to come onstream produce crudes which are heavy but stillsweet. The latest UK government estimate puts Westof Shetland recoverable reserves at about 26% to28%of total UK reserves.
Many of the new UK fields are ‘condensate’ fieldsfor which American Petroleum Institute(API) numberand sulphur information are not available.Condensate is liquid production, which is very lightand does not have the ‘long tail’ of heavyhydrocarbons found in conventional crude oil.Having more in common with light oil or natural gasproduction, most condensates produced round theworld have extremely low sulphur contents. TheBruce condensate from the UK North Sea is 0.02%sulphur and is likely to be typical for the North Sea.
In 1997 consultants AD Little re-examined theirforecasts of Europe’s crude oil slate (diet) torefineries following publication of the Auto-Oilrecommendations - see Section 2.2 below for details.The original studies were done in 1992 to 1993. Theconsultants found that the availabilities of sweetcrude oils are now higher than previous expectationsbecause North Sea production is higher than forecast.The extended life of production from the North Sea isexpected to affect the whole of Europe. For all partsof Europe, the crude slate in 2000 is forecast to belighter than in 1995. This end-of-centuryimprovement will effectively delay the onset of amore sour crude slate for the whole of the Europeanrefining industry over the period 1995 to 2005.

R&D Publication 2110
Figure 2.5 Past industry forecasts of Nor th Sea oil production (PEL)
Figure 2.4 UK exploration success ratio (Wood Mackenzie)

R&D Publication 2111
It can therefore be concluded that there is more thansufficient light/sweet crude remaining in the NorthSea to meet UK refinery demand up to and beyond2005.
2.1.2 Effect of Global Oil Supplies on EuropeanCrude Availability to 2005
Although supplies of North Sea crude are sufficientfor the foreseeable future, the question ariseswhether UK refiners are likely to continue actually touse this local North Sea crude. For instance, by 2005,North Sea producers may prefer to export most oftheir light/sweet oil to other regions of the world or,conversely, will UK refiners choose to import largevolumes of lower-quality, higher-sulphur crude fromnon-North Sea sources especially if there is asignificant price differential between these and NorthSea crude.
Current UK crude oil tr ade pattern
Currently the UK is both an importer and exporter ofcrude oil. About 570 million bbl per annum of crudeoil is currently refined in the UK, of which about 250million bbl per annum is imported. These imports areoverwhelmingly light/sweet crude from theNorwegian North Sea. Exports from the UK arecurrently about 500 million bbl per annum (twice thelevel of imports), mainly destined for coastal ports inNorthWest Europe and deep-water exports to theUSA.
The trend over the last five years has been for UKexports to grow strongly while imports haveremained fairly steady. Exports started to increasefrom about 375 million bbl per annum in 1993 whena surge of UK North Sea capacity came on stream.During this period exports to the USA increased from20% to 27% of the rising total while exports to NorthWest Europe fell in relative terms from 50% to 44%.Over the same period Norway’s share of exports tothe UK increased from 50% to over 67% whileimports from the Middle East fell from 12% to just6%.
The observed trading pattern of UK refineries usinglargely North Sea crudes is understandable on thebasis of logistical costs. The UK is the closestrefining centre to most North Sea oil production andmost North Sea oil export pipelines land in the UK,offering the lowest delivery costs to the refinery gate.For offshore fields using direct tanker loading, thetankers are usually designed for regional rather thaninternational trading. It is because of this that the UKwill continue to compete strongly for North Sea crudeeven in the scenario that there is increasedcompetition in Europe for this crude due to EU fuelspecifications, (i.e. European refineries currentlyprocessing sour crudes may wish to switch andprocess sweet crudes so that specifications can bemore easily attained).
Summarising, the UK crude supply industry is fairly‘self-contained’: most oil refined in the UK issourced locally from the North Sea. Imports fromNorway are increasing but dependence on MiddleEast oil is both low and falling. A base load of oilexports goes to local European countries while, inrecent years, the USA has taken most of the UK’sincreased production. The UK’s strong exports to theUSA are aided by American-owned multinational oilcompanies which own or produce over a third of UKproduction.
Therefore, if current trends are any guide to thefuture, any significant increase in imports by the UKare likely to come from Norway and any majorincreases in exports are likely to go to the USA.
Current global crude oil tr ade pattern
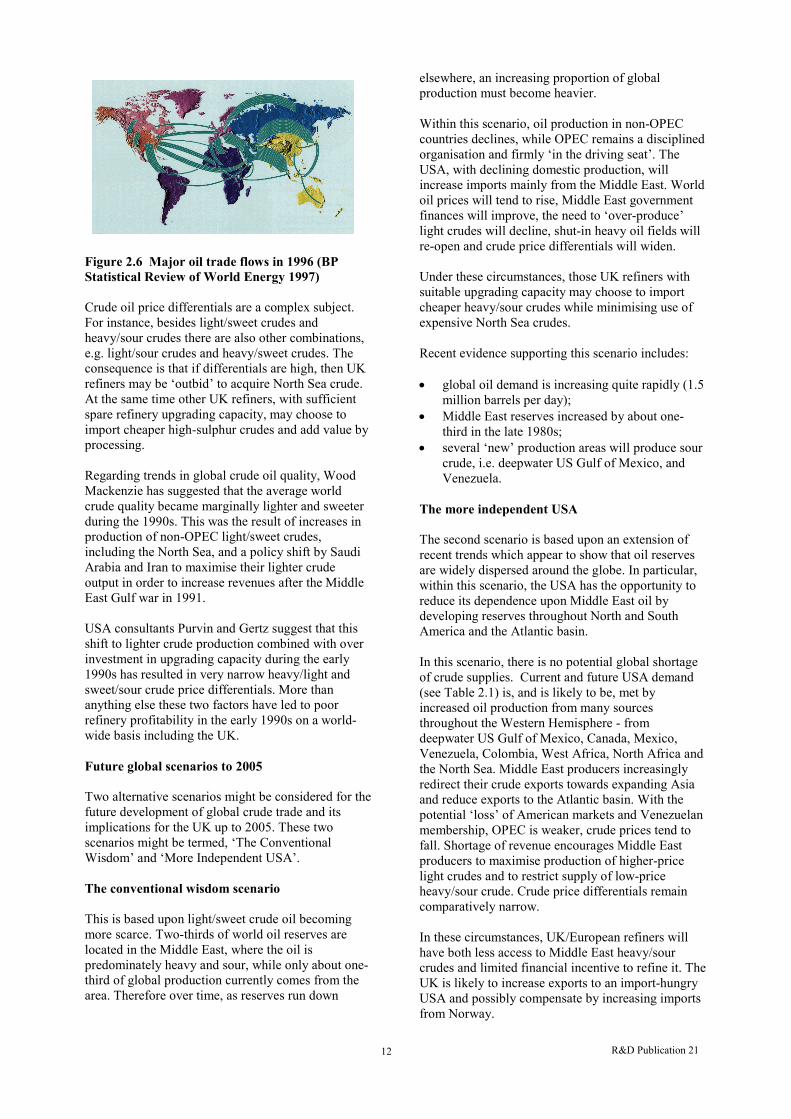
Turning to global crude oil trade, Figure 2.6 shows a‘helicopter-view’ of the world’s biggest importersand exporters in 1996. Looking at the information ona regional basis, the figure shows that Asia importsthe largest amount of crude oil and is heavilydependent upon the Middle East. Western Europeimports a significant volume but from severalsources, such as the Middle East, Africa and theFormer Soviet Union. The USA imports a totalvolume similar to Western Europe but from a morediversified range of sources, i.e. Latin America, theMiddle East, Africa, Mexico, Canada and the NorthSea.
The trend in these data over the last five years showsthat the overall world pattern has remained basicallysimilar but imports by Asia from the Middle Easthave increased by 40% as Asian economies havedeveloped. In contrast Western Europe has reducedimports from the Middle East while increasingimports from the Former Soviet Union. Similarly, theUSA has slightly reduced imports from the MiddleEast but increased imports from other sources, i.e.Latin America, Mexico, Africa and the North Sea.
Current global crude oil quality
Quality of crude oil is a key factor which drivesinternational oil trading because the price ofindividual crudes depends upon their quality. Thecommonly-quoted headline ‘world oil price’ is in factthe price of one particular crude - Dubai - a medium-sulphur crude from the Middle East. As such, Dubaicrude usually has a medium price within a range ofcurrent crude prices. For instance, Dubai is usuallyabout $2 per barrel more expensive than a high-sulphur/heavy crude but about $2 cheaper than good-quality light/sweet crudes, such as Brent from theNorth Sea. These crude-oil price differentials, or‘spreads’, reflect the value of the crude to an averagerefiner: a barrel of low-price heavy/sour crude willrequire significant refining whereas a barrel of high-price sweet/light crude is ‘easy’ to refine.
R&D Publication 2112
Figure 2.6 Major oil tr ade flows in 1996 (BPStatistical Review of Wor ld Energy 1997)
Crude oil price differentials are a complex subject.For instance, besides light/sweet crudes andheavy/sour crudes there are also other combinations,e.g. light/sour crudes and heavy/sweet crudes. Theconsequence is that if differentials are high, then UKrefiners may be ‘outbid’ to acquire North Sea crude.At the same time other UK refiners, with sufficientspare refinery upgrading capacity, may choose toimport cheaper high-sulphur crudes and add value byprocessing.
Regarding trends in global crude oil quality, WoodMackenzie has suggested that the average worldcrude quality became marginally lighter and sweeterduring the 1990s. This was the result of increases inproduction of non-OPEC light/sweet crudes,including the North Sea, and a policy shift by SaudiArabia and Iran to maximise their lighter crudeoutput in order to increase revenues after the MiddleEast Gulf war in 1991.
USA consultants Purvin and Gertz suggest that thisshift to lighter crude production combined with overinvestment in upgrading capacity during the early1990s has resulted in very narrow heavy/light andsweet/sour crude price differentials. More thananything else these two factors have led to poorrefinery profitability in the early 1990s on a world-wide basis including the UK.
Future global scenar ios to 2005
Two alternative scenarios might be considered for thefuture development of global crude trade and itsimplications for the UK up to 2005. These twoscenarios might be termed, ‘The ConventionalWisdom’ and ‘More Independent USA’.
The conventional wisdom scenar io
This is based upon light/sweet crude oil becomingmore scarce. Two-thirds of world oil reserves arelocated in the Middle East, where the oil ispredominately heavy and sour, while only about one-third of global production currently comes from thearea. Therefore over time, as reserves run down
elsewhere, an increasing proportion of globalproduction must become heavier.
Within this scenario, oil production in non-OPECcountries declines, while OPEC remains a disciplinedorganisation and firmly ‘in the driving seat’. TheUSA, with declining domestic production, willincrease imports mainly from the Middle East. Worldoil prices will tend to rise, Middle East governmentfinances will improve, the need to ‘over-produce’light crudes will decline, shut-in heavy oil fields willre-open and crude price differentials will widen.
Under these circumstances, those UK refiners withsuitable upgrading capacity may choose to importcheaper heavy/sour crudes while minimising use ofexpensive North Sea crudes.
Recent evidence supporting this scenario includes:
• global oil demand is increasing quite rapidly (1.5million barrels per day);
• Middle East reserves increased by about one-third in the late 1980s;
• several ‘new’ production areas will produce sourcrude, i.e. deepwater US Gulf of Mexico, andVenezuela.
The more independent USA
The second scenario is based upon an extension ofrecent trends which appear to show that oil reservesare widely dispersed around the globe. In particular,within this scenario, the USA has the opportunity toreduce its dependence upon Middle East oil bydeveloping reserves throughout North and SouthAmerica and the Atlantic basin.
In this scenario, there is no potential global shortageof crude supplies. Current and future USA demand(see Table 2.1) is, and is likely to be, met byincreased oil production from many sourcesthroughout the Western Hemisphere - fromdeepwater US Gulf of Mexico, Canada, Mexico,Venezuela, Colombia, West Africa, North Africa andthe North Sea. Middle East producers increasinglyredirect their crude exports towards expanding Asiaand reduce exports to the Atlantic basin. With thepotential ‘loss’ of American markets and Venezuelanmembership, OPEC is weaker, crude prices tend tofall. Shortage of revenue encourages Middle Eastproducers to maximise production of higher-pricelight crudes and to restrict supply of low-priceheavy/sour crude. Crude price differentials remaincomparatively narrow.
In these circumstances, UK/European refiners willhave both less access to Middle East heavy/sourcrudes and limited financial incentive to refine it. TheUK is likely to increase exports to an import-hungryUSA and possibly compensate by increasing importsfrom Norway.

R&D Publication 2113
Recent evidence supporting this scenario is listedbelow.
• Some ‘new’ production in the Atlantic basin is ofsweet crude, i.e. Colombia, North Africa,deepwater West Africa, North Sea.
• Potential supply of crude to the USA is greaterthan potential USA import demand.
• Export of sweet West African crudes hasswitched from the Western Hemisphere to Asiaas western area sources replace this supply.
• Iraq traditionally exported crude to Asia andwould be expected to resume in future.
• Ecuador and Gabon have already left OPEC.
• Multinational oil companies have regained entryinto several OPEC countries.
• Asia often pays a higher price for Middle Eastcrude than the West.
• Venezuela is ignoring OPEC quotas.
• American refiners are investing in upgrading(cokers) to process local heavy/sour crude.
• Canada and Venezuela are investing insynfuel/extra-heavy crude upgrading projects.
• Canadian crude exports to the USA are growing,particularly from new East Coast fields.
• NAFTA trade agreement eases energy tradebetween the USA, Canada and Mexico.
• USA plans to ‘extend’ NAFTA to Latin Americaby creating FTAA by 2005.
• Technology is dramatically reducing oilproduction costs for non-OPEC countries.
• There is growing world-wide production of sweetcondensates.
Table 2.1 Potential changes in crude supplies toUSA from 1995 to 2000
Change intotal refinerythroughputbarrels/day
Change inUSA oil
productionbarrels/day
Increase inimpor ts tothe USA
barrels/day
650 000 200 000 450 000
Source PEL January 1997
Of the two scenarios the second is thought to moreclosely reflect what is likely to occur. It is foreseenthat the number of ‘new’ non-OPEC oil-producingcountries will keep growing which ultimately adds tosupply flexibility and weakens oil prices. The nextmajor newcomers are likely to be Azerbaijan andKazakhstan which are expected to be exporting toEurope by 2005.
Furthermore, even if the first scenario does turn outto be closer to the truth, then the Middle East oilexporters will still be most dependent upon Asiancustomers. Therefore if in the future Asian/Chinesegrowth slows down, as it recently has, the MiddleEast suppliers will be directly affected and oilprices/differentials will tend to fall even in thisscenario.
In conclusion it is foreseen that while fluctuationswill occur, crude oil prices and price differentials willcontinue to be low. As a consequence this willprovide little financial benefit to UK refineries. TheUK oil industry is likely to remain fairly ‘self-contained’ and UK refineries will continue to runlocal North Sea crudes to 2005 and beyond.
2.2 Product Quality Changes
Almost all fuel products of petroleum refining havebeen or will be affected by legislation aimed atreducing environmental impacts of fuels at their pointof use. It is at the refineries where a response to theserequirements will be met. The following sectionoutlines current and possible future legislative effectson product quality.
2.2.1 Road Transpor tation Fuel Quality
The continued pressure for clean fuels is manifest inthe recent EU legislation amending Directive93/12/EEC relating to the sulphur content of certainliquid fuels. The amendment details gasoline anddiesel specifications for the year 2000 and 2005, asshown in Tables 2.2 and 2.3. EU refiners willtherefore be required to meet tighter specificationsfor the year 2000. By the year 2005 they will berequired to meet what many observers regard as thetoughest transportation fuel specifications in theworld. This inevitably will also require EU refineryprocessing operations to be among the most complexand sophisticated in the world.
The recent EU legislation offers some derogation inrespect of time for the implementation of the newspecifications, subject to EU approval. However, forthis Review it is assumed that the EU specificationsin respect of the UK will apply, and that by the year2005 refiners will be producing fuels to meet theultra-low sulphur levels.

R&D Publication 2114
The implications of these 2000 and 2005Specifications on UK refineries are now discussedbelow.
Table 2.2 EU Requirements for gasoline
Item Currentlimits
93/12/EEC
Max.Limits for
2000
Max.Limits for
2005
Sulphurppm
500 150 50
Olefins% by vol
None 18 *
Aromatics% by vol
None 42 35
Benzene% by vol
5 1 1
* Specification not yet set for 2005. This will be set followingreport by Auto Oil II programme.
Note: Certain other limits also apply but are not included above.
Table 2.3 EU Requirements for diesel
Item Currentlimits
93/12/EEC(from
1.10.96)
Max.Limits for
2000
Max.Limits for
2005
Sulphurppm
500 380 50
CetaneNumber
49 51 (min.) *
PolycyclicAromatics% weight
None 11 *
DensityKg/m3
860 845 *
* Specification not yet set for 2005. This will be set followingreport by Auto Oil II programme.
Note: Certain other limits also apply but are not included above.
Meeting 2000 specifications (gasoline and diesel)
While the year 2000 will be important for refiners interms of EU fuel specifications, it is believed that themajority of refiners have already put in placeinvestment plans to produce fuels to meet them.Those refiners who have not already prepared for thereduction of sulphur and benzene in gasoline willnow be investing in benzene and sulphur reductiontechnology, although by continuing to process low-sulphur North Sea crude, most refiners will be able tomeet the low-sulphur levels with only modestinvestment costs.
In terms of overall emissions from the refinery, thesechanges will only give rise to a marginal increase.
Meeting 2005 specifications (gasoline and diesel)
There is no doubt that refiners will be required toinvest significantly to meet the gasoline and dieselspecifications for 2005.
Gasoline
The majority of UK refining installations operate afluid catalytic cracker unit (FCCU) for upgradingheavy fractions to lighter products. The naphtha fromthe FCCU is the primary contributor of sulphur to therefinery gasoline pool. Reducing contribution ofsulphur is the critical issue for meeting reducedgasoline sulphur specifications.
The sulphur is not evenly distributed throughout theboiling range of FCCU naphtha. Typically about halfthe sulphur found in the FCCU naphtha isconcentrated in the final 10% of the boiling range.This gives the refiner some flexibility to minimisetreatment by focusing on the heavier fraction ofnaphtha. The sulphur specification for 2005 is lowand even when processing North Sea crude, a typicalrefiner will need to hydrotreat the majority of FCCUnaphtha in order to meet the required level.Hydrotreatment of the FCCU naphtha reduces theolefin content which reduces octane. The impact ofoctane reduction on the gasoline pool needs to beconsidered on a refinery-specific basis.
Alternatively the refiner could hydrotreat the feed tothe FCCU, in which case any further hydrotreatmentmay be restricted to the heavier fraction of FCCUnaphtha or potentially avoided altogether. Thedecision to install a catalytic feed hydrotreater (CFH)of this complexity and cost will usually be made onmarket investment criteria since there are benefits interms of increased conversion to higher qualityproducts. It is not expected that a CFH will beadopted by many refiners as a method for achieving2005 specifications.
The refiner may also utilise alternative approachessuch as use of FCCU catalyst additives, blending ofhigher sulphur components, and extractive caustictreatment, but these are only partial solutions at best.Hydrotreatment is therefore expected to be the keyapproach adopted by most refiners, with associatedfacilities to manage the consequent octane loss fromthe gasoline pool perhaps being needed. Reduction inaromatics content of gasoline, also a requirement ofthe 2005 specification, will remove a valuable octaneenhancer from the pool, further restricting therefiner’s ability to manage the octane loss.
Diesel
For diesel, sulphur reduction to 2005specificationsrequires investment to hydrotreat the entire roaddiesel pool. The severity required will be determinedpartly by cetane and polycyclic aromatic hydrocarbon

R&D Publication 2115
specifications. Hydrogen will be required forhydrotreatment and its sourcing will need to beaddressed as noted above.
2.2.2 Bunker Fuel
Bunker fuel is used in ships’ boilers for propulsion. Itnormally originates from the residue of atmosphericand vacuum distillation in the refinery and sulphurtends to concentrate in this product. This is one of thefew markets for residues which has thus far beenunaffected by environmental legislation.
The Marpol Convention (Annex 6) is currently underdiscussion and is being developed under the auspicesof the International Maritime Organisation (IMO).This aims to control emissions of air pollutants fromshipping. It proposes a global cap of 4.5% on thesulphur content of bunker oil, with a lower limit of1.5% in especially sensitive areas. A conference tookplace in September 1997 which resulted in the BalticSea areas accepting the 1.5% limit; however, thecountries bordering parts of the North Sea did notagree to the proposals. This Air Pollution Annex willform part of the Marpol Convention which, onceratified, should come into force within three to fiveyears. The IMO will revisit the proposals if they failto be ratified by 2002.
Indications are that countries , such as thosebordering the Baltic and North Sea, may introducedomestic legislation before the Annex becomesinternationally ratified.
2.2.3 Gas Oil
The sulphur content of all gas oils (except aviationkerosene) was limited to 0.2% by weight (2000 ppm)from 1st October 1994 by implementation of ECDirective 93/12/EEC.
2.2.4 Kerosene (Jet Fuel)
The European Commission is to propose a new limitvalue for aircraft kerosene. Details of the proposednew limit are still awaited but speculative limitssuggest a sulphur limit of 100 ppm.
2.2.5 Fuel Oil
Draft EC Directive 97/0105 (SYN.) includes aproposal amending Directive 93/12/EEC whichwould limit the sulphur content of heavy fuel oil to1% from 1999. The limit would not apply to fuel oilcombusted in the refining industry, or in largecombustion plant which is new or which alreadycomplies with the emission limits for such plant inEC Directive 88/609/EEC. The derogation forrefineries and large combustion plant from thisDirective is allowed on the basis that it is more costeffective to use flue gas abatement technologies toremove SO2. (This may not be so for refineries.)
The EU acidification strategy, part of a proposed ECstrategy to combat acidification of sensitiveecosystems, suggests that 9.03 million tonnes of fueloil were utilised in the UK in 1995. Of this 3.44million tonnes were utilised by major powerproducers (likely to come under Directive88/609/EEC) and 2.32 million tonnes were used byrefineries which in that year would leave 3.26 milliontonnes consumed in other uses. If this proportion isreflected in future years then 36% of fuel oil used inthe UK would have to be below 1% sulphur. Thisneed to supply the low sulphur fuel oil would meanthat higher sulphur fuel oil could probably bepreferentially fired in the derogated refinery andpower sectors.
2.3 The Future for Fuel Oil
2.3.1 The Cur rent Fuel Oil Market and Trends
This section reviews the future markets for fuel oil.Fuel oil is a large volume product produced byrefineries. It normally contains relatively highamounts of sulphur compared with other refineryproducts and its future large scale use is at presentparticularly uncertain. The product is of importancein the context of refinery emissions, as decliningsales demand for fuel oil is likely to increase pressurefor its use as a fuel on the refinery. An increase in theproportion of fuel oil to refinery gas combustedwould see a corresponding increase in emissions ofSO2, CO2, NOx, particulates and heavy metals.
In practice, internal refinery fuel oil consumption isset by the difference between total fuel demand andinternal fuel gas supply. The fuel balance within eachrefinery is specific to its configuration. Other factorssuch as energy efficiency, electrical power importand the recovery of useful components from the fuelgas, which can contain about 50% hydrogen, willdetermine the final balance and hence fuel oildemand. This balance is subject to change whensignificant additional processing units are installed,especially those demanding fuel gas and/or hydrogensuch as additional hydrotreatment.
Total European consumption of fuel oil has beenfalling consistently for many years as a result ofstructural change in the industrial sector and thecompetitive impact of other fuels, notably naturalgas. European consumption fell from 162 milliontonnes in 1982 to 107 million in 1996. By the latteryear ships' bunkers accounted for about 25% of totalconsumption, the one sector of the market which hasnot been shrinking. The UK is a small market,consuming 9 million tonnes in 1995 and only 6.85million tonnes in 1996.
Within Europe the decline has been most marked inthe industrial sector with 1982 consumption of 50million tonnes falling to less than 20 million by 1995.Power generation from fuel oil has also fallen sharply

R&D Publication 2116
although most of this decline occurred in the 1980s.The power market is now dominated by ENEL ofItaly which consumes 34% of Europe's inland fuel oiland ENEL's requirements will have a major impacton the direction of fuel oil markets in Europe over thenext ten years. ENEL currently specifies a maximumof 1% sulphur for 60% of its purchases but is likelyto apply the restriction to a higher percentage of itspurchases in the future.
Traditionally much of the fuel oil consumed inEurope has had a higher sulphur content than this,although the sulphur percentage has been graduallydeclining in the face of tighter environmentallegislation controlling acid gas emissions, such as theLarge Combustion Plant Directive. The exception isbunker fuel but this may become subject to tighterregulations within EU coastal waters. (See Section2.2.2.)
With regard to the quality of fuel oil used generallyin the UK and its imports and exports, there is verylittle detailed information publicly available, but whatthere is would suggest the following:
(1) High sulphur fuel oil is produced to only alimited extent by UK refineries. This tends tobe, for example, where heavier crudes whichtend to have a high sulphur content arerequired for production of bitumen and lubeoils. An indication of this may be seen inTable 3.1 where fuel oils with sulphur contentsgreater than 2% suggest some processing ofnon-North Sea crudes.
(2) High sulphur crudes are not processed by UKrefineries to a significant extent due to theseveral advantages North Sea crude offers,especially its low sulphur content.
(3) Fuel oil exports from the UK are likely to bepreferentially low sulphur to markets whichdemand this, for example, Italy. Fuel oilexports from the UK were 1 979 000 tonnes in1996(i) (Dti, 1996) although there is noindication of the sulphur content.
(4) Fuel oil imports to UK industrial sectors otherthan the refinery sector are likely to be highersulphur fuel oil, this normally being cheaper.While releases of SO2 to air are controlled, theuse of high sulphur fuel oil is not restricted inthe UK, except indirectly where the processrequires it or where release limits of SO2 inany site authorisation can only be met bycombusting low sulphur fuel oil. The UK fueloil imports were 5 343 000 tonnes in 1996(Dti, 1996) although again there are no specificdata on the sulphur content of those imports.However, returns to the Environment Agencyfrom the electricity supply industry indicate
that where fuel oil is used it is often over 2.5%sulphur.
2.3.2 Future Markets
The outlook for fuel oil in Europe will be determinedby both supply and demand factors, with the shortterm position likely to be different from the situationpost-2000. In almost all cases inland demand isexpected to decline slightly between now and 2000but this will be matched by a similar drop inproduction as both minor and major refineryupgrades take effect. Post-2000 the situation isexpected to change more radically from both a supplyand demand perspective.
Demand
• In addition to the long-term gradual decline infuel oil consumption there is the prospect of amore rapid decline post-2000 as a result of newsupplies of gas becoming available in Europe atcompetitive prices following marketderegulation. There is no clear forecast available,but it is conceivable that the inland market forfuel oil could decline by 50% beyond 2005 whilebunker fuels remain static. If this happens,European consumption in 2005 would be around65 million tonnes.
• Trends in product quality are more importantthan the volume of demand. It seems highlylikely that industrial or power users will eitherhave to invest more widely in flue gasdesulphurisation or be restricted to buying fueloil with 1% or less of sulphur. It is unclear howfar legislation will tighten for ships’ bunker fuels,but any plan to tighten quality in bunker fuel willput further pressure on the high sulphur product.The scope for using fuel oil as a 'sink' for sulphurwill be greatly restricted.
• With declining markets at home, Europeanrefiners will be looking for other outlets for theirfuel oil. One potential market is Asia which isdeficient in fuel oil despite recent increases inrefinery capacity. Net imports to that region wereexpected to be around 4 million tonnes in 1997,rising to almost 20 million in 2000. Imports arethen forecast to decline to around 16 million in2005 although this assumes that a significantamount of new local production capacity is built.Not all of this market is available to Europeansuppliers since Asia is a well established marketfor Middle East refiners and supplies also comein from the West Coast of the USA. It does,however, provide an outlet for some of Europe'spotential surplus, although it should be noted thatmany Asian countries have introduced or areintroducing increasingly stringent environmentallegislation which may also require the firing oflow sulphur fuel oil.
R&D Publication 2117
Supply
• Over the next three to four years fuel oil outputfrom European refineries is likely to declineslightly, probably in line with falling demand.The situation may change more radically in theearly years of the next century as refiners cometo terms with much more stringent qualitystandards.
• European refiners may benefit from a reductionin fuel oil exports from the Former Soviet Union(FSU) which currently total about 20 milliontonnes per year into Western Europe. Over thenext ten years refinery closures and upgradingprojects will reduce the availability of fuel oilfrom that region. This may reduce the potentialsurplus in Europe but it will have no impact onthe trend to cleaner fuel oil.
2.3.3 Implications for UK Refiner ies
UK refineries have consistently produced anexportable surplus of fuel oil. In 1997 production was11.7 million tonnes, compared with consumption ofonly 3.9 million tonnes. Both domestic and Europeanmarkets are expected to continue a gradual declineover the next ten years which will put pressure onrefiners to either upgrade or find new export markets.The reduction of high sulphur fuel oil within Europeis expected to be more rapid for land-based markets,leaving a supply market for fuel oil to ships’ bunkersonly which would total about 25 million tonnes.Export markets outside Europe are moving the sameway, although at a slower pace, and 3.5% sulphurproduct will still be permitted in some countries for awhile. Countries such as Thailand have alreadyintroduced legislation to prohibit the burning of highsulphur fuel oil (HSFO) in the greater Bangkok areaand this trend will gradually extend to other countriesin the region.
Overall, therefore, UK refiners will have to manage agradual change in their fuel oil business as marketsdecline and quality standards improve. It will begradual, however, and no precipitative change isanticipated.
2.4 UK Refinery Capacity and Economics
The following section reviews recent trends andperformance in the capacity and economics of the UKrefinery sector.
This assessment has been restricted to the refineryindustry sector. It has not considered the broadereconomic base of the refining companies which oftenown integrated chemical complexes, usually locatedon the same site as their refinery; nor has itconsidered the interests and ownership the companiesoften have in oil production facilities in the North Seaand world-wide.
2.4.1 Current UK Refinery Capacity
Total UK refinery capacity reduced significantly inthe early 1980s in response to falling demand andpoor margins. Total distillation capacity fell fromabout 130 million tonnes in 1980 to a little over 90million tonnes by 1985, a level broadly maintainedsince then.
Utilisation rates were very low in the early 1980seven with capacity being closed. In 1983, forexample, the output of all products was only 70% ofinstalled distillation capacity. Sales to the UK marketwere even lower and surplus product had to beexported. Since then utilisation levels have risensteadily as Figure 2.7 illustrates.
In 1996 the utilisation level across the UK refinerysector was at least 92% with approximately 13% ofproduction being exported.
The Gulf Refinery at Milford Haven has now beenclosed which removes about 5 million tonnes ofcapacity from the UK total (approximately 5%reduction) and plans are being made to close theShell Refinery at Shell Haven and part of theLlandarcy Refinery.
2.4.2 Future Capacity
The increase in UK refinery utilisation levels whichhas occurred since 1980 has been due almost entirelyto capacity closures and a modest increase in exports.Domestic demand for all products has been almoststatic, having risen from 71 million tonnes in 1980 to75 million tonnes in 1996, an increase of only 5.6%after 16 years.
There is no reason to think that demand will growsignificantly between now and 2005. Demand fortransport fuels will be restrained by high taxationlevels and the possible impact of government policyon levels of car use as well as improvements in fuelefficiency. The UK consumption of fuel oil and gasoil for heating is likely to continue to fall in the faceof competition from gas. On this basis UK refinerswill continue to operate in a near-static domesticmarket and will look to export markets to take‘surplus’ product.
Over the past two years UK and other Europeanrefiners have been able to take advantage of buoyantUS demand for gasoline. Total gasoline exports in1996 were over 8 million tonnes.
Currently there is a gradual shift in transport fuelsfrom gasoline to diesel. If this slow shift continuesUK refiners will continue to look to the USA forgasoline exports. The long-term outlook for theseexports is unclear, being dependent, in part, onrefinery capacity increases in the USA and LatinAmerica.

R&D Publication 2118
Figure 2.7 UK refinery capacity utilisation
Given that UK and European demand will be fairlystatic, the key factor will be supply. There is likely tobe very little European demand for new refineries orlarge capacity increases between now and 2005although developments on the margin of WesternEurope, such as at Leuna, former East Germany, andMidor in Egypt, could have a major impact. Therewill continue to be capacity creep, due to theoccasional upgrade which will tend to increasecapacity on a modest scale.
With the above factors the importance of refineryclosures becomes apparent. There has been much talkof closure in recent years and some refineries havebeen shut down. Given the financial problems of theindustry more closures may be expected but timing isvery uncertain. It could well be the case that theprocess will accelerate post-2000 as refinerscontemplate heavy capital expenditure to meet 2005product specifications. The extent to which UKrefiners are affected by closure is impossible topredict. There is no doubt that overall marketconditions will put pressure on the refinery sector toreduce capacity but it may need a specific triggersuch as 2005 specifications to overcome the inertia inthe system caused by high site clean-up costs,employment protection agreements, etc.
2.4.3 UK Refinery Economics: Outlook to 2005
Refinery margins in Western Europe have been poorfor many years but the situation worsened from mid-1994 in the face of adverse global trends. Much
investment at refineries in the late-1980s/early-1990shad been based on the assumption that the averagebarrel of feedstock would become heavier and sourer.By 1994 this assumption had been undermined by anincrease in supply of light, low sulphur crude fromthe North Sea, Africa and, most unexpectedly, SaudiArabia. The result was that upgrading margins werebadly squeezed and overall profitability declinedeven further.
Figure 2.8, published by UKPIA, shows the steepdecline in operating profitability in the downstreamsector of the UK oil industry. It should be noted thatthe downstream sector includes both oil refining aswell as product distribution and retailing. By 1996there was an overall operating loss and while therewas some improvement in 1997 it was not dramatic.The situation is broadly similar throughout WesternEurope. In a recent presentation Rolf Stomberg of BPestimated that there is approximately 500 000 barrelsper day of surplus refinery capacity in the region. Theextent to which this surplus is eliminated is a keydeterminant of whether the industry can becomeconsistently profitable again.
Although demand for refinery products is fairly staticin overall terms, the market for particular products isexpected to change significantly over the next tenyears. The gradual reduction in fuel oil sales willincreasingly concentrate demand on transportationfuels and petrochemical feedstocks. Product qualitystandards for 2005 are well beyond the ability ofmost UK refineries to produce with their existing
0
20
40
60
80
100
120
Outp ut
Capac ity

R&D Publication 2119
91 92 93 94 95 96(200)
0
200
400
600
800
(2)
0
2
4
6
8£ M ill
ion
Per
cent
age
Return on Investment
Actual profit
Pro
fit
Figure 2.8 UK refinery sector profitability (Source UKPIA)
plant and equipment even when processing 100%North Sea crude. These factors will combine to putpressure on refiners by the early years of the newcentury and a point will be reached when decisionswill have to be made to upgrade or close downrefineries.
These comments assume that the European refiningindustry remains only marginally profitable as ithas been for several years. In the 1990s pooreconomic performance was due in part to very poorutilisation levels caused by an excess capacity.Since then much of this has been eliminated andEuropean refineries are now running at muchhigher levels - at least 92% on average in 1997.
Under these circumstances it might be assumed thatprofitability would have shown a markedimprovement. In reality, however, most refinersexperienced only a modest improvement in marginsduring 1997 to 1998, which was mainlyconcentrated in upgrading margins, due to highlycompetitive conditions at the point of sales.
Individual refiners have a tendency to process asmuch throughput as possible, since this improvesrevenue, but it is based on marginal costing. Aslong as the plant is amortised and requires littleadditional expenditure, this situation is sustainable.
The key issue for the future will be the recently-introduced legislation on fuels quality which willcompel most refiners to invest heavily. At thispoint margins must rise to a level which enables
new investment to be financed. If this is notforthcoming the rational market response would bea wave of refinery closures to create a much tightermarket, thereby improving margins. In the periodup to 2005 it is expected margins will improveslightly but remain low relative to other industries.
2.4.4 Likely Investment Patterns to 2005
In the present economic climate for refineries,operators/owners are expressing extreme reluctanceto invest in new plant, including abatement plant,for the following reasons:
• with intense forecourt competition any addedproduct value resulting from investment willalmost immediately be lost;
• investment for environmental purposesprovides no added product value and overallhas a marginally negative value on return oncapital employed (ROCE);
• some future environment specifications, e.g.the EU Acidification Strategy, are not firm.Refiners want clear targets in view of the highlevel of capital expenditure likely to beinvolved;
• the UK is now having to compete to someextent with countries who have alreadyinvested more heavily in environmental plant(i.e. sunk cost).

R&D Publication 2120
Although investment made by refiners in existingplant in the immediate future will be the minimumnecessary, they will need to consider strategicoptions for their refinery operation and prospectivemajor plant investment in the years 2001 to 2002 inthe run up to 2005. It is at this time that one mightexpect refiners to give consideration to strategicinvestment in ‘bottom of the barrel conversionprocesses’ such as coking, gasification, solventdeasphalting, residue catalytic cracking and residuehydroprocessing. This period of major investmentwould be an opportune time for refiners to considertheir long-term strategy for processing eitherheavy/sour or light/sweet crudes. The investmentoption selected will be site-specific and will takeaccount of the owner's strategic objective withrespect to refinery configuration, crude supply andproduct markets. Therefore in the short term,before the year 2005, abatement options willnormally be considered in respect of existing plantonly.
2.5 Discussions with Operators
2.5.1 Topics of Discussion
During September and October 1997 discussionswere held with representatives from all eleven UKrefineries including Gulf which has sinceannounced closure plans. In addition a meeting washeld with the UK Petroleum Industries Association(UKPIA). The association represents refineryoperators in the UK. The items which formed theinitial basis for each discussion included thefollowing. (These were forwarded to each refineryin advance of each discussion.)
(1) Does the refinery operate an environmentalmanagement system (EMS) or does it intend todo so?
(2) What does the refinery regard as its mainenvironmental issues? How have these beenidentified and are there plans to further addressthem?
(3) Does the refinery have an ongoing programmeof waste and energy minimisation? Have anyeconomic benefits been gained, and reductionof releases to the environment been made,through the adoption of such measures?
(4) Has any work been done on identifyingsources of fugitive emissions of volatileorganic compounds and have these beenaggregated to give an annual estimate? Doesthe refinery have a programme in place forreduction of these types of release?
(5) In your opinion is the IPC (Integrated PollutionControl) process and the way it operateseffective in achieving improvements in
environmental performance? If not, whatchanges might be made?
(6) How does the refinery see the future up to2005 and, to a lesser extent, beyond, withregard to changes in crudes to be processed,tighter product specifications especially withregard to sulphur content, and continuedreduction in allowable releases to theenvironment?
(7) What is the general view of refinery economicsup to 2005 and beyond?
(8) With regard to reduction in releases to theenvironment, do you see improvements inexisting abatement equipment and techniquessuch as BATNEEC (Best AvailableTechniques Not Entailing Excessive Cost) orpossibly more radical approaches beingneeded?
(9) Any other points.
Notes of each discussion were written by, andforwarded to, the operator as a record. Thediscussions often went wider than the above eightitems and the operators’ general responses set outbelow reflect this.
2.5.2 The Operators’ Responses
The main points that most of the operators had incommon or emphasised are as follows.
(a) Nor th Sea crude oil supplies
All refiners broadly concurred that supplies ofsweet North Sea crude oil will be available up to2005 and probably well beyond. However, a fewsources of North Sea crude are becoming moreacidic and therefore pose potential corrosionproblems in certain refineries.
(b) Auto oil 2000 specifications
Most refineries will be able to meet thespecification for the sulphur in gasoline and diesel,and other specification changes for the year 2000,with only minor modifications to their operatingplant providing they continue to process lowsulphur crudes.
(c) Auto oil 2005 specifications
Refiners generally agree that to achieve the limitsof sulphur in gasoline and diesel and otherspecification changes required by the EU for 2005,they will need significant refinery investment,principally in new hydrotreatment facilities.
R&D Publication 2121
(d) Refinery utilisation and margins
Refiners confirm that, compared with the 1980sand early 1990s, refinery utilisation is now muchimproved (above 90% of design throughput) andgenerally this upward trend is expected to continue,albeit slowly. Some refiners are optimistic thatprofit margins could improve in the foreseeablefuture, from what is currently an extremely low ifnot a negative level in some cases.
(e) Refinery investment
Mainly due to very low financial margins, mostrefiners have no plans for significant investment inthe near future. They maintain that, due to theintense competition at retail outlets, the addedmargins that might be gained from an improvedproduct resulting from extra investment would veryquickly disappear. In addition, in the currenteconomic climate, a fairly common view is that themoney spent on environmental improvementprovides little or no financial benefit. It increasesthe investment in fixed assets but since it gives noreturn it reduces the return on capital employed.The refiners also make the point that due to theconsiderable costs normally associated withabatement plant it is essential that clear andunchanging targets and limits are specified for thecoming years. Refiners indicate that currently manyof these limits are neither clear nor fixed.
(f) Fuel oil
There was a general consensus that sale/disposal offuel and residue oil will become increasinglydifficult in the future as demand for this type ofrefinery product falls. Those refiners able to offerlow-sulphur fuel oil will be able to market theirproduct more easily. As a result some refinersindicated that they may wish to burn more fuel oilon the refinery in the future.
(g) Local air and water quality
A number of refiners expressed the view that wherethere is no evidence that EU, National or local airand water quality targets were being breached dueto releases from their refinery, then there was littlejustification for further high-cost abatement plant tobe installed.
In this respect they emphasised that any additionalabatement needs to be justified on the basis of‘sound science’ in respect of the need to improvelocal environmental quality and the improvementeffect it may have. An example quoted is theproposed Expert Panel on Air Quality Standards(EPAQS) for SO2 which refiners believe is lackinga basis for the size of the safety factor between thelowest observed human effect level and the actualstandard chosen. Refiners also emphasised that the
effects of abatement improvements recently madeand how ecosystems are recovering should beconsidered before further legislation is imposed.Some refiners felt in this connection that a gapexists between those who propose and enactenvironmental legislation and the needs for it, withits resulting costs.
(h) IPC and Integrated Pollution Preventionand Control (IPPC)
The consensus was that the IPC system as a wholewas working satisfactorily and was achievingimproved environmental performance. Refinersbelieve it lays down an understandable frameworkand that the communications that are necessarywith the site inspector are welcomed.
Some concerns were expressed about how IPPCmight impact on the current IPC system. Theterminology in each case needs to be clear. Inparticular, refiners are concerned about therequirement of IPPC for existing plant to meet therequirements of new plant in 2007. (See also item(i) below.)
(i) BATNEEC for new and existing plant
Regarding what constitutes BATNEEC; on thewhole refiners do not think that existing plantperformance should move towards the standards setfor new plant. They see the way ahead forrefineries as that which has currently been agreedwith local inspectors on improvement plans foreach refinery.
(j) ‘Level playing field’ with rest of Europe
Refiners pointed out that the UK environmentalregime needs to keep in step with the rest ofEurope. Notwithstanding this there is no indicationthat the current regulations are putting UK refinersat a significant economic disadvantage comparedwith the rest of Europe.
(k) Consistent application of existingregulations
Some refiners felt that the application of theexisting regulations as applied by the EnvironmentAgency varied significantly from refinery torefinery and that therefore some refiners were notbeing asked to achieve the same environmentallevels of abatement as others.
(l) Repor ting requirements
There is general support for the ‘bubble approach’for refinery authorisation with less prescriptivelimits at point sources of release. In a few cases,mainly in respect of effluent discharges, the
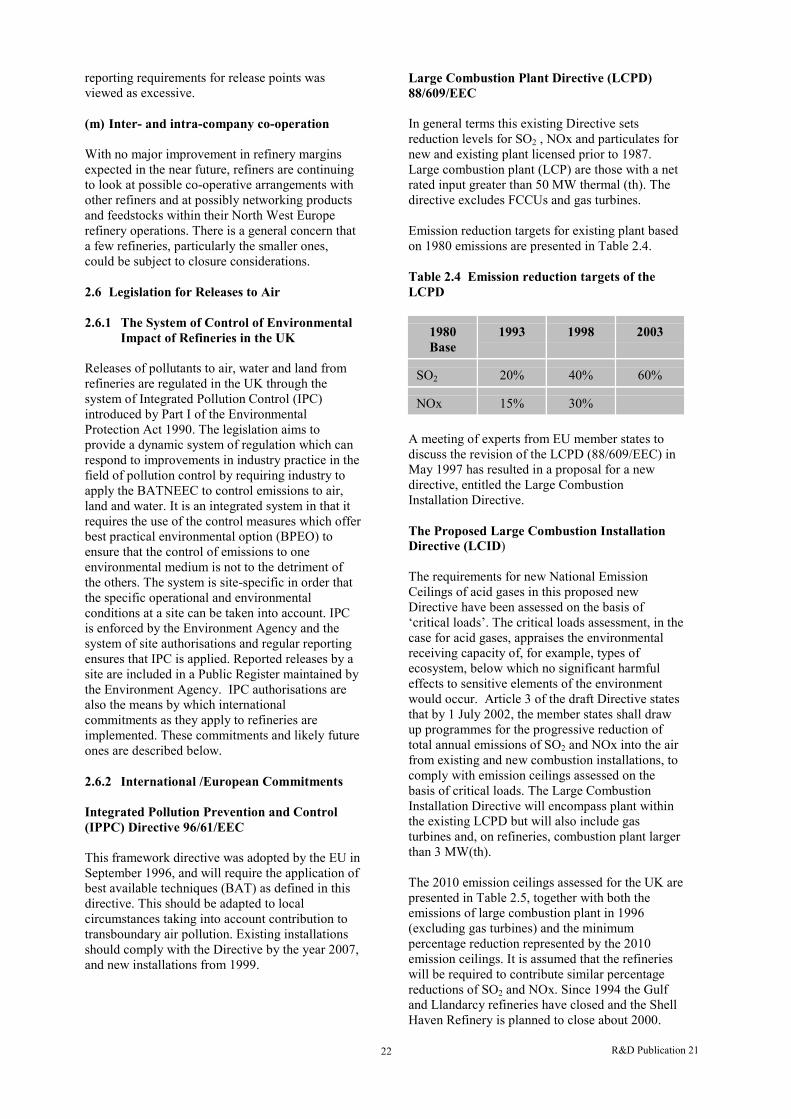
R&D Publication 2122
reporting requirements for release points wasviewed as excessive.
(m) Inter - and intra-company co-operation
With no major improvement in refinery marginsexpected in the near future, refiners are continuingto look at possible co-operative arrangements withother refiners and at possibly networking productsand feedstocks within their North West Europerefinery operations. There is a general concern thata few refineries, particularly the smaller ones,could be subject to closure considerations.
2.6 Legislation for Releases to Air
2.6.1 The System of Control of EnvironmentalImpact of Refiner ies in the UK
Releases of pollutants to air, water and land fromrefineries are regulated in the UK through thesystem of Integrated Pollution Control (IPC)introduced by Part I of the EnvironmentalProtection Act 1990. The legislation aims toprovide a dynamic system of regulation which canrespond to improvements in industry practice in thefield of pollution control by requiring industry toapply the BATNEEC to control emissions to air,land and water. It is an integrated system in that itrequires the use of the control measures which offerbest practical environmental option (BPEO) toensure that the control of emissions to oneenvironmental medium is not to the detriment ofthe others. The system is site-specific in order thatthe specific operational and environmentalconditions at a site can be taken into account. IPCis enforced by the Environment Agency and thesystem of site authorisations and regular reportingensures that IPC is applied. Reported releases by asite are included in a Public Register maintained bythe Environment Agency. IPC authorisations arealso the means by which internationalcommitments as they apply to refineries areimplemented. These commitments and likely futureones are described below.
2.6.2 International /European Commitments
Integrated Pollution Prevention and Control(IPPC) Directive 96/61/EEC
This framework directive was adopted by the EU inSeptember 1996, and will require the application ofbest available techniques (BAT) as defined in thisdirective. This should be adapted to localcircumstances taking into account contribution totransboundary air pollution. Existing installationsshould comply with the Directive by the year 2007,and new installations from 1999.
Large Combustion Plant Directive (LCPD)88/609/EEC
In general terms this existing Directive setsreduction levels for SO2 , NOx and particulates fornew and existing plant licensed prior to 1987.Large combustion plant (LCP) are those with a netrated input greater than 50 MW thermal (th). Thedirective excludes FCCUs and gas turbines.
Emission reduction targets for existing plant basedon 1980 emissions are presented in Table 2.4.
Table 2.4 Emission reduction targets of theLCPD
1980Base
1993 1998 2003
SO2 20% 40% 60%
NOx 15% 30%
A meeting of experts from EU member states todiscuss the revision of the LCPD (88/609/EEC) inMay 1997 has resulted in a proposal for a newdirective, entitled the Large CombustionInstallation Directive.
The Proposed Large Combustion InstallationDirective (LCID)
The requirements for new National EmissionCeilings of acid gases in this proposed newDirective have been assessed on the basis of‘critical loads’. The critical loads assessment, in thecase for acid gases, appraises the environmentalreceiving capacity of, for example, types ofecosystem, below which no significant harmfuleffects to sensitive elements of the environmentwould occur. Article 3 of the draft Directive statesthat by 1 July 2002, the member states shall drawup programmes for the progressive reduction oftotal annual emissions of SO2 and NOx into the airfrom existing and new combustion installations, tocomply with emission ceilings assessed on thebasis of critical loads. The Large CombustionInstallation Directive will encompass plant withinthe existing LCPD but will also include gasturbines and, on refineries, combustion plant largerthan 3 MW(th).
The 2010 emission ceilings assessed for the UK arepresented in Table 2.5, together with both theemissions of large combustion plant in 1996(excluding gas turbines) and the minimumpercentage reduction represented by the 2010emission ceilings. It is assumed that the refinerieswill be required to contribute similar percentagereductions of SO2 and NOx. Since 1994 the Gulfand Llandarcy refineries have closed and the ShellHaven Refinery is planned to close about 2000.

R&D Publication 2123
The effect of these closures is to reduce thepercentage reductions required of the remainingrefineries. This information is also shown onTable 2.5.
Table 2.5 Emission Reduction Requirement ofthe Proposed Revision to the LCPD
Pollu-tant
ECemissionceilinginc. gasturbines
1996 UKLCP
emissionsexc. gasturbines
%Reductionrequired
as aminimumby 2010
%Refinery
sectorreductionsfollowing
knownrefineryclosures
SO2 75 kt/yby 2010
1 468 95% 94%
NOx 60 kt/yby 2010
471 87% 85%
Paragraph 5 of Article 3 of the proposed LCIDstates that Member States shall establish, starting in2002 and for each subsequent year, a completeemission inventory for existing and newinstallations covering SO2 and NOx:
• on a plant-by-plant basis for plant combustionsabove 300 MW(th) and for refineries;
• on an overall basis for other combustioninstallations to which the Directive applies.
Postscript
The LCID is now not likely to apply to existinglarge combustion plant.
The United Nations Economic Commission forEurope (UNECE) Second Sulphur Protocol(1994)
This protocol has also been produced using criticalloads assessments. Countries are required toreduce, by the year 2000, their sulphur emissions tomeet a UNECE-wide target of 60% of the gapbetween sulphur emissions and the critical load.Particularly sensitive areas of Scandinavia,Germany and the Netherlands, where natural andunattributable emissions exceed the critical load,have been excluded. The target reductions forindividual countries are based on their contributionto acid deposition over the areas included in thecalculations. To meet the UNECE- wide target of60%, the UK has agreed to reduce its own SO2emissions on a 1980 basis as presented inTable 2.6.
Table 2.6 Emission reduction requirements ofthe second sulphur protocol
2000 2005 2010
SO2 emissionreduction(1980 base)
50% 70% 80%
The new protocol was officially signed in Oslo inJune 1994; however, it has yet to be ratified by the16 signatory countries. Examination of theatmospheric emission Inventory for the UKindicates SO2 emissions have reduced from 4903 ktin 1980 to 2718 kt in 1994, a reduction of 55% andcompliant with the protocols demand for 2000.
EU Communication on Acidification Strategyfor Europe
Proposals for an acidification strategy have beenpresented by the European Commission in the formof a communication: ‘A European Union Strategyto Combat Acidification’ (March 1997). Theacidification strategy is intended to becomplementary to the proposed LCID. It has beendeveloped in co-operation with the UNECEConvention on Long Range Transboundary AirPollution (UNECE/CLRTAP) which is also at theearly stages of developing a multi-pollutantreduction strategy with a wide geographic spread.The aim of the strategy is to reduce emissions ofthe three principal pollutants responsible foracidification, i.e. SO2 and NOx from combustionprocesses and ammonia from farming andagricultural activities. Implementation of thestrategy (together with other efforts) would resultin an EU-wide reduction of 66%, 48% and 15% forSO2, NOx and ammonia (NH3 ) respectively in2010. The Commission acknowledges this as beinga significant challenge. Published data show that in1990 the UK was the second highest contributor ofSO2, NOx and (NH3 ) in the EU providing around23% (SO2), 20% (NOx) and 9% (NH3 ).
The strategy adopts the same ‘critical loads’approach used by the 1994 Sulphur Protocol andthe proposed LCID.
The strategy has considered a wide range of policyinitiatives to attain, by 2010, a 50% closure of thegap between present emission levels and the levelsthat represent critical loads. In developing thesepolicies the EU has considered environmental andeconomic costs and benefits. The policy of greatestrelevance to refineries is the development ofnational emission ceilings. Although acknowledgedas requiring further development, provisionalceilings are annexed to the communication. Theproposed ceiling levels for the UK to achieve by2010 for SO2, NOx and NH3 are given below in

R&D Publication 2124
Table 2.7. The data are also shown in terms ofpercentage reduction required with 1994 as thebase year (Salway AG et al (1996)). The figures inthe current version of the draft document are onlyindicative and it is likely there will be considerableresistance to these tough demands.
As with the LCID, it is assumed refineries wouldbe required to make corresponding percentagereductions. These are also shown after allowing forknown refinery closures.
Table 2.7 UK Emission reduction requirementsof the acidification strategy
SO2 NOx NH3
UK emission limitsby 2010
279 kt/y 753 kt/y 224 kt/y
% reduction required(1994 base year)
90% 67% 30%
% refinery reductionrequired followingclosures of Gulf,Llandarcy and ShellHaven refineries
89% 63%
Postscript
The EU is now likely to reflect the aims of theAcidification Strategy in a new National EmissionCeilings Directive design to be met by 2010. Thepossible UK emission limits, as of early 1999, areincreased to 497 kt/y for SO2 and 1181 kt/y forNOx.
The International Climate Change Convention
This convention was initiated at Rio de Janeiro in1992 where countries committed themselves toreduce their greenhouse gas emissions to 1990levels by 2000. These gases are chiefly CO2,methane (CH4), and nitrous oxide (N2O). Theparties to the convention met in Kyoto, Japan, inDecember 1997 and agreed on targets beyond2000.
Volatile Organic Compounds (VOCs) Protocol
Within a refinery, crude oil receipt, refining andproduct loading are significant sources of VOCs.The protocol obliges most parties to secure a 30%overall reduction in their VOC emissions by 1999using 1988 as a baseline.
2.7 Legislation for Releases to Water and Land
2.7.1 Releases to Water
As outlined above releases to water from refineriesare regulated in the UK through the system of
Integrated Pollution Control (IPC). As a result ofthe Water Resources Act, 1991 (in Scotland theControl of Pollution Act, 1974) and theEnvironment Act, 1995, water pollution control inEngland and Wales is enforced by the EnvironmentAgency. In Scotland this responsibility falls to theScottish Environment Protection Agency (SEPA).Most countries in the world have a system of fixeddischarge limits. In the UK discharge limits forflowrates and concentration are set based on thewater quality and usage of the receiving body ofwater. The limits are generally set on a 95percentile basis. This means that at least 95% ofresults obtained by sampling must comply with thelimit. An additional limit for the instantaneousmaximum is also given.
The EC Directives on water quality areincorporated into the consent levels once they areembodied into UK law. Recent EC Directives havebeen introduced on Dangerous Substances, BathingWater, Freshwater Fisheries, Nitrates, and UrbanWaste Water Treatment.
In the longer term, discharge to rivers limits will beset based on statutory water quality objectives(SWQOs), which will be used to set qualityplanning targets, and the general quality assessmentclassification (GQA), which is used for periodicassessments of river quality. Future limits ondischarge levels to certain rivers will also be setusing a toxicity-based approach.
2.7.2 Releases to Land and ContaminatedLand
Solid wastes
Refineries generate two types of solid wastestreams: industrial and non-industrial. It isestimated that approximately 3kg to 5 kg of solidwaste is generated per tonne of crude oil processed.About 80% of this has a significant heavy metalcontent (Pollution Prevention and AbatementHandbook (1997))and could potentially beconsidered as hazardous.
Waste disposal is subject to legislation and refinersare currently obliged to comply with the following:
• Collection and Disposal of Waste Regulations(1988);
• Control of Pollution Act (1974);• Duty of Care: Section 34 Environmental
Protection Act (1990);• Definition of Waste: Section 75 of
Environmental Protection Act (1990);• Controlled Waste Regulations (1992);• Waste Management Licensing Regulations
(1994);• Special Waste Regulations (1996).

R&D Publication 2125
Future waste management legislation
Forthcoming EU legislation on the landfilling ofwastes is likely to have some affect on UKrefineries. The draft Landfill Directive(Com (96) 647) was presented by the Commissionin February 1997 and has several aims including arequirement to ensure that all waste going tolandfill has been subjected to some form oftreatment. Other issues such as the prevention ofhazardous and non-hazardous wastes being co-disposed and the pricing of landfill to cover setting-up, operation, closure and aftercare costs of thesite, are also addressed by the draft directive.Implementation of the directive is likely to result inhigher costs for all generators ofindustrial/commercial waste. A number of UKrefineries have dedicated landfill facilities andthese will be subject to the new requirements.These requirements will include the need forengineered containment facilities and will thereforeresult in increased disposal costs.
Contaminated land
Pollutants released to the ground via accidentalspillages or leakage during storage, transfer orutilisation, may be a potential land contaminationissue for refiners. If refinery closure andsubsequent sale of land is contemplated and there isevidence of land contamination, including pollutionof the underlying groundwater system, then somedegree of land remediation programme by theoperators is likely to be required.
Under Draft Guidance on Contaminated Land(Consultation, September 1996) particular sites thathave been identified by the local authority as beingcontaminated may also acquire a Special Site statusby virtue of petroleum operations being, or havingbeen, conducted on such sites. In such instances, aRemediation Notice may be served on the owner ofthe land and be enforced by an ‘appropriateauthority’ which is likely to be the EnvironmentAgency. Considering the long established historiesof refineries in the UK, such regulations are likelyto require refiners to set aside significant moniesfor land remediation if they are contemplating totalrefinery closure.

R&D Publication 2126
Blank page intentional
R&D Publication 2127
3. UK REFINERIES
3.1 Types of UK Refinery
3.1.1 Descr iption of Refinery Types
Crude oil refineries vary in their complexity andthe products manufactured. Complex refineriesmake use of conversion processes such as catalyticcracking, coking and hydrocracking in order toproduce higher-value products at the expense oflower-value ones. This requires substantial extraenergy input so that releases from a complexrefinery are greater in total than a refinery ofsimilar capacity but lacking the complexconversion processes. To facilitate discussion aboutoil refineries a broad categorisation is often appliedwhich is based on the process units utilised on therefinery. These categorisations are explained asfollows.
(a) Hydroskimming refiner ies
This simple refinery type has only an atmosphericcrude distillation unit (CDU) and processes for theproduction of gasoline, kerosene and gas oil (usedas automotive diesel fuel or heating oil). Asimplified hydroskimming configuration is shownin Figure 3.1. Lighter components are either burnedon the refinery as fuel or recovered as LPG(propane and butane). The principal motor gasolinecomponent (reformate) is made by hydrotreatingnaphtha from the CDU and then raising its octanein a catalytic reforming process. The catalyticreformer raises the octane number of the feedstockby changing its chemical composition. Thisincludes the production of more aromatic (ringbased) compounds. In this process hydrogen as aby-product is produced. The hydrogen is used inthe hydrotreater process to remove sulphur, withany excess normally routed to fuel gas. Residuefrom the CDU (atmospheric residue) is used as fueloil. Due to its high fuel oil yield and the low valueof this product this type of refinery tends to be lesseconomic when refining margins are weak.Nonetheless, of all the refineries in the worldapproximately 40% are of the hydroskimming type.In the UK, the Phillips Imperial Petroleum Refineryis an example of a hydroskimming refinery.
(b) Cracking or lube oil r efiner ies
Here the hydroskimming refinery is furtherdeveloped by the addition of a vacuum distillationunit (VDU) producing vacuum gas oil (VGO) andvacuum residue. VGO, called ‘wax distillate’ bysome refiners because of the waxy nature of thematerial, can be catalytically broken down intolighter products (cracking) or used as base oil forproduction of lubricants. It can also be used asethylene cracker feedstock for chemicalsmanufacture. Two principal catalytic processes are
available for VGO cracking, namely fluid catalyticcracking (FCC) and hydrocracking.
Figure 3.2 shows a simplified Flow Scheme for aCracking Refinery with an Fluidised CatalyticCracking Unit (FCCU).
Fluid catalytic cracking (FCC) has beencontinually developed since its introduction to therefining industry in the 1940s. The core of thisprocess consists of two large vessels. One is thereactor where the longer-chain hydrocarbons arebroken down with the application of a catalystunder very turbulent conditions. The other vessel isthe regenerator where the accumulated carbon onthe catalyst is burnt off, again under very turbulentconditions. The catalyst circulates continuouslybetween the reactor and regenerator, but it is theregenerator from where the emissions to air occuron an FCCU. The modern process uses a zeoliticcatalyst which is continuously regenerated toremove unwanted coke deposits. The FCCU'smajor product is normally gasoline, yieldingapproximately four times more gasoline thanmiddle distillate (kerosene, gas oil). In addition, theprocess produces light olefinic material (C5 minus)which can be used to produce more gasoline inprocesses such as alkylation, etherification andpolymerisation.
Hydrocracking is a process in which longer-chainhydrocarbons are broken down catalytically under ahigh hydrogen pressure (typically 80-150 bar). Incontrast to the FCCU, the products ofhydrocracking are normally predominantly middledistillates, suitable for diesel production, althoughgasoline production can be achieved by appropriateselection of catalyst and operating conditions. Amajor advantage of hydrocracking, compared withFCC, is that products are high quality in relation tocontaminants, requiring little, if any, furtherprocessing and containing essentially zero sulphur.However, the octane number of hydrocrackernaphtha is too low and this is routed to the catalyticreformer for octane improvement. The catalyticreformer, the main source of hydrogen on arefinery, cannot usually meet hydrogenrequirements on a hydrocracking refinery and ahydrogen production plant is usually required inwhich hydrogen is produced, usually by reformingnatural gas.
Lube oil: in a lubricating-oil-producing refinery arange of lube base oils are produced from sidestreams off the VDU for subsequent blending tofinished oils. A number of hydroprocessing and/orsolvent extraction processes are employed to raisethe paraffinity of the base oil. In most lubricatingoil refineries valuable wax by-product is produced.

R&D Publication 2128
CDU
Cat Refor mer
Hydr otr eater
Gas/LP G
Gasoline
Ker osene
Low sulphur gas oil /diesel
Fuel oilFigur e 3.1 Simplified flowscheme of a typical hydr osk im ming r efiner y
Naph thaHydr otr eater
Hydr ogen
Figur e 3.2 Simplified flowscheme of a typical cr acking r efinery
VDU
Cat Refor mer
H ydr otr eater
Alkylat ion
CDU
G as/LP G
G asoline
K er osene
G asolineMidd le Distilla tes / Diesel
LPGVacuum Residue (Fuel O il)
VGO FCCUDecant O il
Mid. Dist il.
Naph thaHydr otr eater
H ydr ogen
Figure 3.1 Simplified flow scheme of a typical hydroskimming refinery
Figure 3.2 Simplified flow scheme of a typical cracking refinery
R&D Publication 2129
The vacuum residue, the bottom stream from thevacuum unit, from this type of refinery usually goesto fuel oil, but some refiners also produce bitumenfrom this stream.
With the exception of Phillips Imperial Petroleumand Shell Haven all UK refineries have an FCCU. BPOil Grangemouth has both FCC and hydrocracking.Shell Haven has a hydrocracker.
(c) Residue upgrade refiner ies
In this type of refinery the heavy residual materials(e.g. vacuum residue) are upgraded or destroyed asshown in Figure 3.3. Various technologies existwhich allow the refinery to produce zero fuel oil, butthese are of high capital cost. In today's economicenvironment, especially in the UK refining sector,these technologies are unlikely to provide the returnon the capital investment involved.
The most common residue upgrading processesworld-wide are delayed coking (especially favouredin the USA) and residue hydroprocessing. Delayedcoking, as practised at the Conoco Refinery in theUK, produces transportation fuels (approximately60% by weight of the feed) and a petroleum cokewhich is of premium anode grade quality. Currently itis the only refinery in the UK with a coking unit.
Residue hydroprocessing can be applied toatmospheric residue, vacuum residue or a blend ofboth residues. The processing objective is to raise thequality from high sulphur fuel oil to low sulphur fueloil (not usually economic) or to pretreat the residueahead of further processing (usually catalyticcracking). Lower-cost processes for residueupgrading are available, such as visbreaking andsolvent deasphalting, but the amount of upgradingachievable is limited, especially on poor-qualitycrude.
Three UK refineries (Conoco, Esso Fawley and ShellStanlow) have significant residue upgrading plant.
3.1.2 The UK Refiner ies
In terms of the above the ten UK crude oil refineriesanalysed in this review can be classified as follows:
Hydroskimming - Phillips ImperialPetroleum
Cracking and/or Lube - BP Grangemouth- Elf Milford Haven- Lindsey Oil- BP Coryton- Shell Haven- Texaco Pembroke
Residues Upgraded - Conoco- Esso Fawley- Shell Stanlow
A brief description of each UK refinery is provided inAppendix 1.
3.2 Sources of Polluting Emissions onRefiner ies
3.2.1 Refinery Processing with Respect toReleases to Air
The following paragraphs briefly discuss releases andthe sources of releases in relation to current UKrefinery processing practice.
(a) Refinery process heater s and boiler s(combustion processes)
Sulphur dioxide (SO2), nitrogen oxides (NOx) andparticulates are the usual pollutants released to airfrom refinery process heaters, boilers and otherpower plant. This plant is often designed for dualfiring of gas and oil and therefore the emissionsreleased are dependent upon the type and balance offuels burned in the process. Refinery fuel gas and fueloil are the usual fuels. Most refineries use eitheratmospheric residue or vacuum residue as fuel oil butvisbreaker residue is also used in a few cases.Refinery fuel gas is normally the base fuel and usedto its fullest availability, with shortfalls in refineryfuel gas supply made up by burning fuel oil oroccasionally vaporising propane. Refinery fuel gas isnormally much lower in sulphur than fuel oil andtypically contains about 50% hydrogen. Typically,refineries in the UK are burning refinery fuel gaswith a sulphur content, as H2S, ranging from 0.05 to0.6 vol%, and fuel oil with a sulphur content of 0.8 to4.5% by weight. Hence the amount of SO2 that isemitted from combustion processes on a refinery isheavily dependent on the fuel gas/oil ratio.
NOx, a mixture of nitrogen oxide (NO) and nitrogendioxide (NO2), is produced during combustion fromthe combination of oxygen and nitrogen in the air andby the combination at high temperature of oxygen inthe air and nitrogen in the fuel. Unlike fuel oil,natural gas and refinery gas contain no nitrogencompounds.
There are several methods for the reduction of NOx,the most usual being the installation of low NOxburners. Most refineries in the UK haveimplemented, or are in the process of implementing, aprogramme for fitting low NOx burners. The fitmentprogrammes vary in their extent and in some casesare due to take several years to complete.
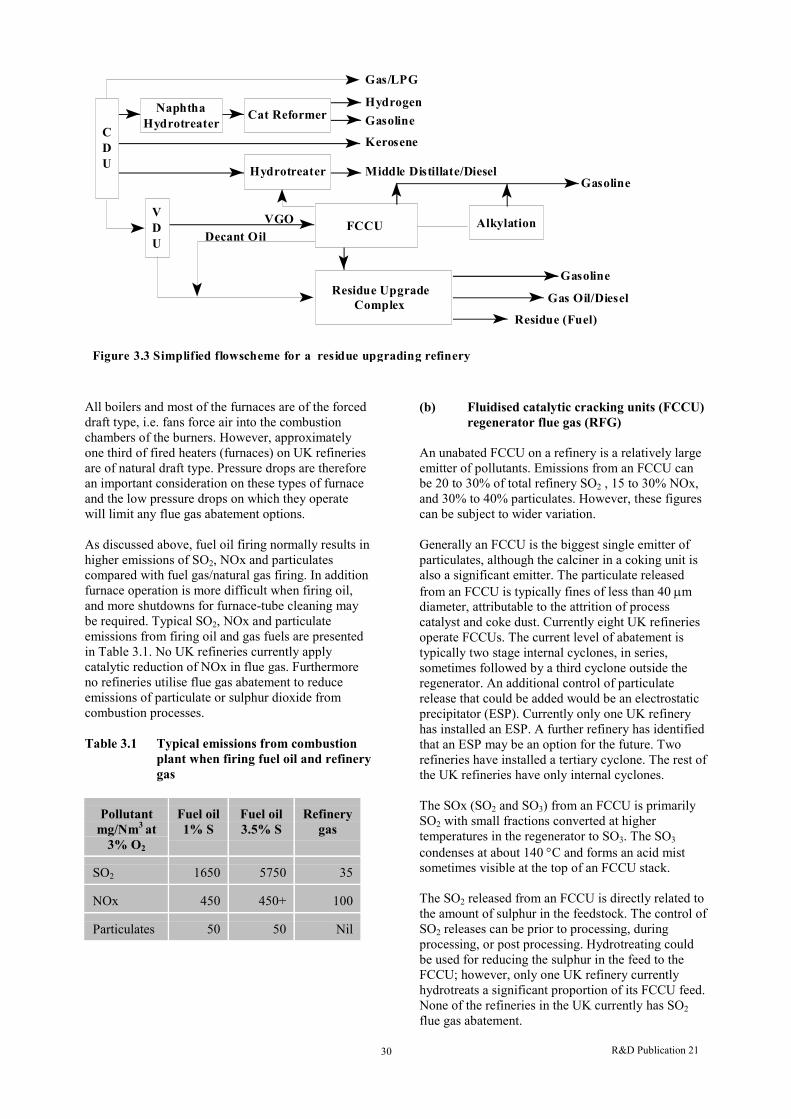
R&D Publication 2130
Figur e 3.3 Simplified flowscheme for a r esidue upgr ading r efiner y
VDU
Cat Refor mer
H ydr otr eater
Alkylat ion
CDU
G as/LP G
G asoline
K er osene
G asolineMidd le Distillate/Diesel
VGO FCCU
Residue Upgr adeG asoline
G as O il/Diesel
Residue (Fuel)
Decant O il
Complex
Naph thaH ydr otr eater
H ydr ogen
All boilers and most of the furnaces are of the forceddraft type, i.e. fans force air into the combustionchambers of the burners. However, approximatelyone third of fired heaters (furnaces) on UK refineriesare of natural draft type. Pressure drops are thereforean important consideration on these types of furnaceand the low pressure drops on which they operatewill limit any flue gas abatement options.
As discussed above, fuel oil firing normally results inhigher emissions of SO2, NOx and particulatescompared with fuel gas/natural gas firing. In additionfurnace operation is more difficult when firing oil,and more shutdowns for furnace-tube cleaning maybe required. Typical SO2, NOx and particulateemissions from firing oil and gas fuels are presentedin Table 3.1. No UK refineries currently applycatalytic reduction of NOx in flue gas. Furthermoreno refineries utilise flue gas abatement to reduceemissions of particulate or sulphur dioxide fromcombustion processes.
Table 3.1 Typical emissions from combustionplant when fir ing fuel oil and refinerygas
Pollutantmg/Nm3 at
3% O2
Fuel oil1% S
Fuel oil3.5% S
Refinerygas
SO2 1650 5750 35
NOx 450 450+ 100
Particulates 50 50 Nil
(b) Fluidised catalytic cracking units (FCCU)regenerator flue gas (RFG)
An unabated FCCU on a refinery is a relatively largeemitter of pollutants. Emissions from an FCCU canbe 20 to 30% of total refinery SO2 , 15 to 30% NOx,and 30% to 40% particulates. However, these figurescan be subject to wider variation.
Generally an FCCU is the biggest single emitter ofparticulates, although the calciner in a coking unit isalso a significant emitter. The particulate releasedfrom an FCCU is typically fines of less than 40 µmdiameter, attributable to the attrition of processcatalyst and coke dust. Currently eight UK refineriesoperate FCCUs. The current level of abatement istypically two stage internal cyclones, in series,sometimes followed by a third cyclone outside theregenerator. An additional control of particulaterelease that could be added would be an electrostaticprecipitator (ESP). Currently only one UK refineryhas installed an ESP. A further refinery has identifiedthat an ESP may be an option for the future. Tworefineries have installed a tertiary cyclone. The rest ofthe UK refineries have only internal cyclones.
The SOx (SO2 and SO3) from an FCCU is primarilySO2 with small fractions converted at highertemperatures in the regenerator to SO3. The SO3
condenses at about 140 °C and forms an acid mistsometimes visible at the top of an FCCU stack.
The SO2 released from an FCCU is directly related tothe amount of sulphur in the feedstock. The control ofSO2 releases can be prior to processing, duringprocessing, or post processing. Hydrotreating couldbe used for reducing the sulphur in the feed to theFCCU; however, only one UK refinery currentlyhydrotreats a significant proportion of its FCCU feed.None of the refineries in the UK currently has SO2flue gas abatement.
R&D Publication 2131
The FCCU regenerators can be operated in partialcombustion mode where carbon on the catalyst isoxidised to carbon monoxide. Additional heat canthen be recovered when the carbon monoxide isincinerated in a dedicated combustion chamber (COboiler) external to the regenerator. In such cases, asindicated above, NOx emissions will probably behigher than FCCUs not fitted with a CO boiler. Afew UK refineries have CO boilers installed.
Except where a CO boiler is installed, NOxconcentrations from FCCUs tend to be lower thanfrom combustion plant due to the comparativelylower temperatures in the regenerator.
The regenerator off-gas is a medium pressure, hightemperature stream containing a significant amountof energy. It is generally economic to recover this bygenerating steam in a waste heat boiler, and alloperators do this. On larger FCCUs it is ofteneconomic to install a power recovery facility byletting down the high temperature flue gas fromoperating pressure to atmospheric pressure in anexpander, and using the power produced to drive themain air blower feeding the regenerator as well asgenerating additional power. The exact configurationwill vary from case to case. A typical 40 000 barrelsper day FCCU can raise approximately 8 MWe froma power recovery train. Steam generation from awaste heat boiler and power recovery would notgenerate extra releases. The majority of UK refinerieshave power recovery installed.
(c) Sulphur recovery units (SRU)
There are many gaseous streams on the refinerywhich contain varying concentrations of sulphur inthe form of hydrogen sulphide (H2S). This Sulphur isrecovered as elemental sulphur in a two stageprocess:
1. removal of hydrogen sulphide from gas streams by amine treating
2. regeneration of the amine to release hydrogen sulphide as feed to sulphur recovery units of a licensed design.
An amine solution is used to remove sulphur in theform of H2S from gaseous streams. Regeneration ofthe ‘rich’ amine releases H2S and this, along withother gases such as sour water stripper (SWS) gas,are fed to a Claus SRU. This oxidises the H2S toelemental sulphur. Depending on the size of therefinery and the level of sulphur in the crude oil beingprocessed, a two or three stage Claus unit will beprovided. The tail gas from the SRU is incinerated todestroy H2S and the resulting flue gas containing SO2is released to atmosphere via a stack. If operated welland within the original design parameters, a recoveryof between 90% and 96% of the incoming sulphur
may be achieved. Due to operating problems, somerefineries achieve less.
Further increases in recovery can be achieved by theaddition of a tail gas treatment unit (TGTU). Avariety of TGTU technology is available. Forinstance two refineries have installed Shell ClausOffgas Treatment (SCOT) units on their SRUs, andanother plans to install one in 1998. One refinerywith a lower overall sulphur loading has installed aDOW Sulferox process which is intended for loweramounts of sulphur and will have higher efficiency atthe lower loadings.
There is considerable inconsistency in removal andrecovery of sulphur in UK refineries. Not allrefineries remove sulphur from refinery fuel gas.Some refineries have SWS associated with a specificprocess unit where the sour water overheads areincinerated directly in the furnaces associated withthe process. Where this happens there is inevitably anincrease in SO2 emissions and the loss of the possibleconversion to elemental sulphur. Operatingefficiency, sparing and back up provision to the mainsulphur recovery unit varies. All of these factorsaffect sulphur recovery efficiency and henceemissions of sulphur dioxide to the atmosphere.
3.2.2 Effluent Water Discharges from RefineryProcesses
As far as the level of treatment of wastewater effluentis concerned, a few refineries provide tertiarytreatment of effluents by using biological treatment,see section 5.8 for further details. Other refineriestypically use only physical methods for oil and waterseparation.
Pollutants found in wastewater from refineriesinclude hydrocarbons (dissolved and suspended),suspended solids, phenols, sulphides, ammonia andtraces of heavy metals. The main process operationscontributing to these pollutants comprise thefollowing.
• Desalters - Fresh and/or recycled water is used towash soluble salts out of the crude oil. Thewastewater will contain high levels of salt,sulphides, ammonia and phenol and is directed tothe effluent treatment plant.
• Crude distillation unit (CDU) - Aqueouscondensate from the CDU is sent for disposal viathe sour water stripper (SWS). This will containsulphides, ammonia, small quantities of chloridesand hydrocarbons.
• Vacuum distillation unit (VDU) - Overheadcondensed sour water from the VDU of a similarcomposition to that from the CDU is similarlyrouted to the SWS.
R&D Publication 2132
• Hydrofining and hydrotreating - Aqueouseffluent arising from these types of processoperation contain high concentrations ofhydrogen sulphide and ammonia. The effluent istherefore fed to the SWS prior to being routed tothe effluent treatment plant.
• Fluidised catalytic cracking - Sour water fromthe scrubber section of the process, containingphenols, ammonia, hydrogen sulphide andhydrogen cyanide, is routed to the SWS.
• Hydrocracking - A low volume, dirty effluent isproduced containing ammonia and hydrogensulphide. This effluent is directed to the SWS.
• Visbreaking - Aqueous condensate from thefractionator condenser containing hydrocarbonsand sulphur compounds is sent to the SWS.
• Polymerisation - Water is used to preconditionthe feed to the process in a wash tower. Thepurge from the latter is routed to the SWS.
• Etherification - Water is bled to the effluenttreatment plant from the methanol recovery partof the process. The stream may containmethanol, formic acid, hydrocarbons, tertiaryamyl methy ether (TAME) or methyl tertiarybutyl ether (MTBE).
• Coker - Aqueous condensate from the mainfractionator is routed to the SWS. This streamcontains high concentrations of sulphides andammonia, as well as cyanides and phenols.Water used in removing the coke from the drum(sometimes termed ‘drilling water’) is filteredand usually recycled.
• Sour water stripper - The sources of sour waterare outlined above. The streams contain varyingquantities of hydrogen sulphide and/or lowmolecular weight mercaptans, ammonia, phenolsand cyanides. The steam stripped effluent iseither reused or sent to the effluent treatmentplant.
• In addition to these continuous process flows,effluent arises from site drainage (storm andfirewater), ballast water from shipping, coolingwater and boiler blowdowns.
3.2.3 VOC Abatement
Many refineries are installing secondary floating roofseals on tanks storing volatile materials to reduceVOC emissions. A number of refineries follow aprogramme of leak detection and repair (LDAR) toidentify and reduce VOC emissions.
3.2.4 Solid Wastes
With regard to solid wastes, one refinery operates awaste incinerator. Refineries actively look foropportunities to minimise waste production. Table3.2 lists the types of refinery solid waste, their usualorigin and their typical disposal method.
3.3 Discussions with Local Inspectors
Copies of recent data from the Public Register wereobtained by visiting the appropriate offices of theEnvironment Agency. In support of this information adiscussion was held with each refinery IPC siteinspector. A range of questions were asked coveringthe following issues:
• maintenance practices;• environmental management practices;• monitoring practices both by the Environment
Agency and the operator;• site environmental improvements made recently;• future improvements proposed;• unauthorised releases;• environmental performance as a whole;• compliance with IPC authorisations.
Notes were made of each meeting which werereturned to the inspectors. The information providedassistance in understanding the inspectors' view ofthe main environmental issues at each refinery. Nocommercially-confidential information held by theinspectors was provided. Discussions relied on theinspectors' own knowledge of the refineries andinformation which would be available on the PublicRegister. The individual IPC inspector meeting noteshave not been included in this Review although theinformation provided has been utilised throughout thestudy where pertinent.
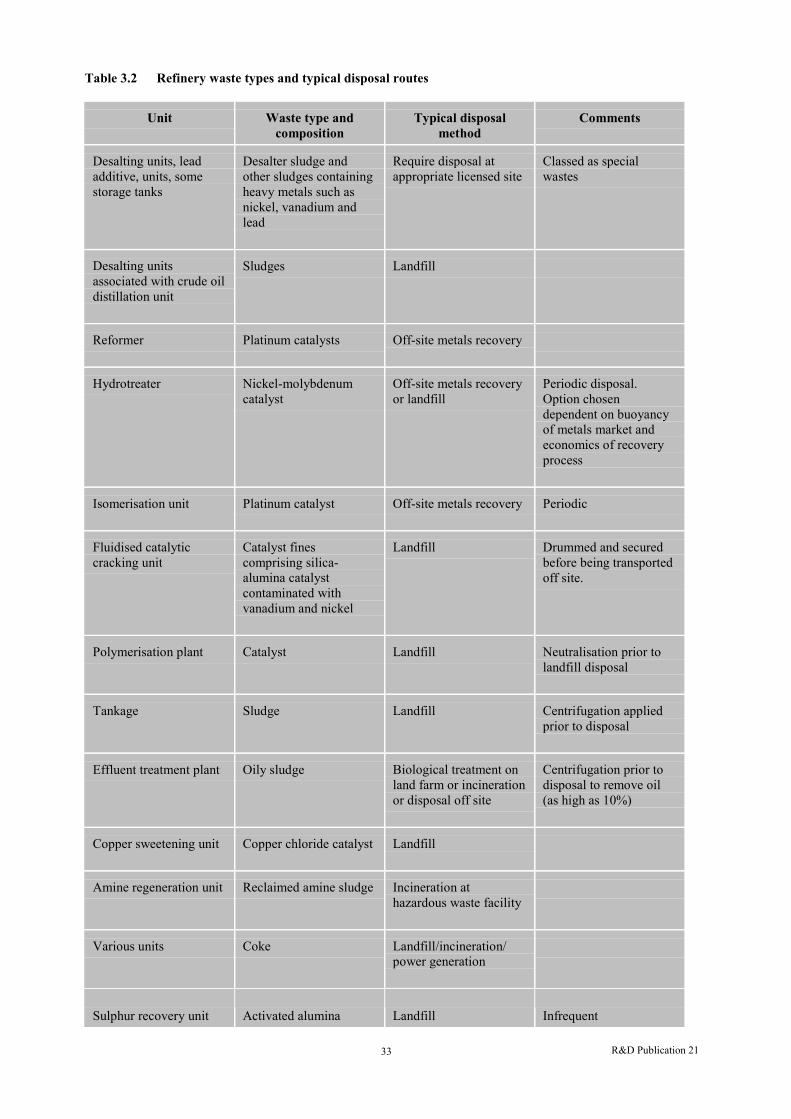
R&D Publication 2133
Table 3.2 Refinery waste types and typical disposal routes
Unit Waste type andcomposition
Typical disposalmethod
Comments
Desalting units, leadadditive, units, somestorage tanks
Desalter sludge andother sludges containingheavy metals such asnickel, vanadium andlead
Require disposal atappropriate licensed site
Classed as specialwastes
Desalting unitsassociated with crude oildistillation unit
Sludges Landfill
Reformer Platinum catalysts Off-site metals recovery
Hydrotreater Nickel-molybdenumcatalyst
Off-site metals recoveryor landfill
Periodic disposal.Option chosendependent on buoyancyof metals market andeconomics of recoveryprocess
Isomerisation unit Platinum catalyst Off-site metals recovery Periodic
Fluidised catalyticcracking unit
Catalyst finescomprising silica-alumina catalystcontaminated withvanadium and nickel
Landfill Drummed and securedbefore being transportedoff site.
Polymerisation plant Catalyst Landfill Neutralisation prior tolandfill disposal
Tankage Sludge Landfill Centrifugation appliedprior to disposal
Effluent treatment plant Oily sludge Biological treatment onland farm or incinerationor disposal off site
Centrifugation prior todisposal to remove oil(as high as 10%)
Copper sweetening unit Copper chloride catalyst Landfill
Amine regeneration unit Reclaimed amine sludge Incineration athazardous waste facility
Various units Coke Landfill/incineration/power generation
Sulphur recovery unit Activated alumina Landfill Infrequent
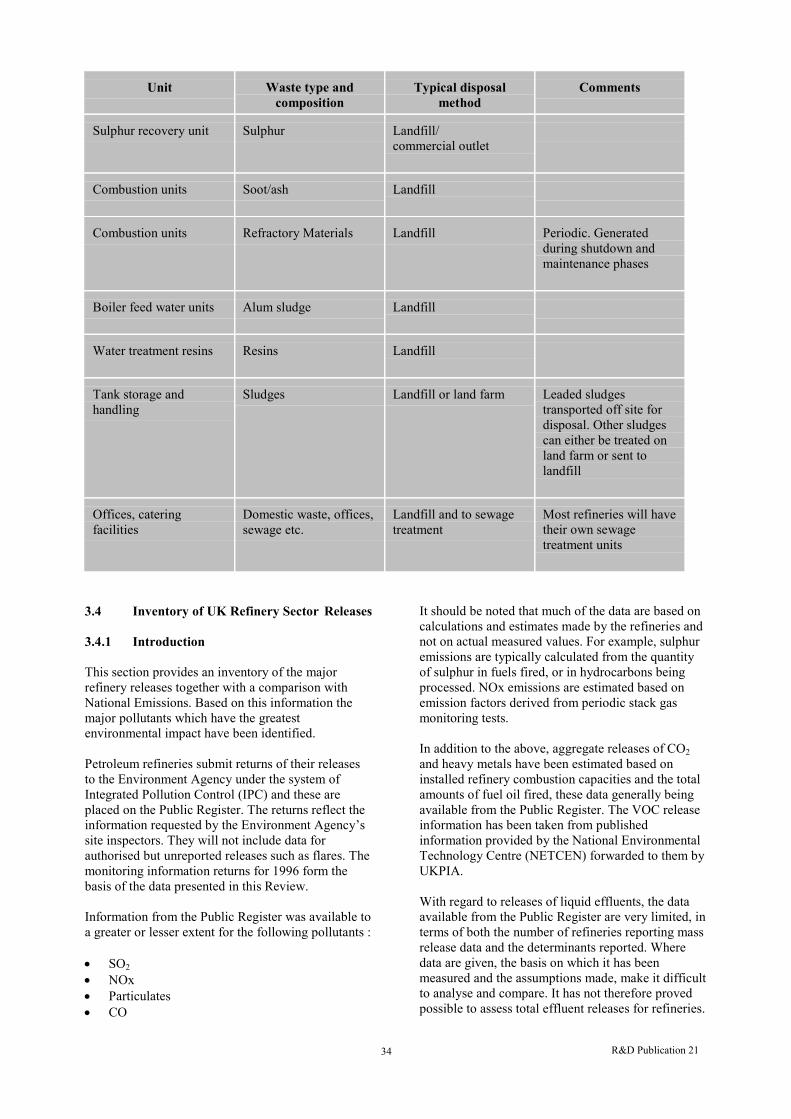
R&D Publication 2134
Unit Waste type andcomposition
Typical disposalmethod
Comments
Sulphur recovery unit Sulphur Landfill/commercial outlet
Combustion units Soot/ash Landfill
Combustion units Refractory Materials Landfill Periodic. Generatedduring shutdown andmaintenance phases
Boiler feed water units Alum sludge Landfill
Water treatment resins Resins Landfill
Tank storage andhandling
Sludges Landfill or land farm Leaded sludgestransported off site fordisposal. Other sludgescan either be treated onland farm or sent tolandfill
Offices, cateringfacilities
Domestic waste, offices,sewage etc.
Landfill and to sewagetreatment
Most refineries will havetheir own sewagetreatment units
3.4 Inventory of UK Refinery Sector Releases
3.4.1 Introduction
This section provides an inventory of the majorrefinery releases together with a comparison withNational Emissions. Based on this information themajor pollutants which have the greatestenvironmental impact have been identified.
Petroleum refineries submit returns of their releasesto the Environment Agency under the system ofIntegrated Pollution Control (IPC) and these areplaced on the Public Register. The returns reflect theinformation requested by the Environment Agency’ssite inspectors. They will not include data forauthorised but unreported releases such as flares. Themonitoring information returns for 1996 form thebasis of the data presented in this Review.
Information from the Public Register was available toa greater or lesser extent for the following pollutants :
• SO2
• NOx• Particulates• CO
It should be noted that much of the data are based oncalculations and estimates made by the refineries andnot on actual measured values. For example, sulphuremissions are typically calculated from the quantityof sulphur in fuels fired, or in hydrocarbons beingprocessed. NOx emissions are estimated based onemission factors derived from periodic stack gasmonitoring tests.
In addition to the above, aggregate releases of CO2and heavy metals have been estimated based oninstalled refinery combustion capacities and the totalamounts of fuel oil fired, these data generally beingavailable from the Public Register. The VOC releaseinformation has been taken from publishedinformation provided by the National EnvironmentalTechnology Centre (NETCEN) forwarded to them byUKPIA.
With regard to releases of liquid effluents, the dataavailable from the Public Register are very limited, interms of both the number of refineries reporting massrelease data and the determinants reported. Wheredata are given, the basis on which it has beenmeasured and the assumptions made, make it difficultto analyse and compare. It has not therefore provedpossible to assess total effluent releases for refineries.

R&D Publication 2135
However, types of effluents typically discharged bythe various refinery units and the level of effluenttreatment provided by refineries is summarised inSection 3.2.2 above. The possible methods oftreatment that can be applied to refinery effluents andthe likely improvements needed to treatment plants inthe future are discussed in Section 5.8.
3.4.2 Releases of Sulphur Dioxide (SO2)
General considerations
The major sources of SO2 emissions are:
• combustion emissions;• emissions from fluidised catalytic cracker units
(FCCUs);• emissions from sulphur recovery units (SRUs).
The information from the Public Register shows thatthe percentage contributions of SO2 from similarrefinery processes varies widely between individualUK sites. There are also a number of refineryemission sources including SRU and an FCCU (albeita small unit) where potentially significant releases ofSO2 emissions are unreported. Further, it is not clearfrom the public register whether some refineriesreport SO2 emissions resulting from the firing incombustion plant of sour gas originating from sourwater strippers. None of the refineries except one hasreported emissions from flares.
In terms of refinery capacity, the general trend seenis, as expected, one of decreasing SO2 emissions withdecreasing capacity.
In addition, complex refineries in terms of processingare generally expected to have relatively higheremissions although there are some exceptions.However, when related to installed combustioncapacity, i.e. emissions divided by installed MW(th)the releases are not particularly high.
As already noted, SO2 emissions from refineries areaffected by the sulphur content of the fuels beingprocessed. Emissions from refineries which process aportion of crudes and/or residues with a highersulphur content are correspondingly higher.
Combustion emissions
A number of factors influence the total annual SO2emissions of a refinery including:
• the installed combustion plant capacity whichdepends on the refinery size and processingcomplexity;
• the utilisation of that combustion plant;
• the degree of electrical generation on site, asopposed to imported electricity, which entailsoff-site emissions;
• the quality of the fuel fired in terms of sulphurcontent.
All refineries report SO2 releases from combustionplant. From 1996 data on the Public Register theestimated total release of SO2 from combustion ineleven UK refineries was 64 731 tonnes per year.
Emissions from FCCUs
The amount of SO2 released by the FCCU depends toa large extent on the amount of sulphur in the feed tothe unit.
The FCCU Regenerator continuously burns sulphur-containing coke off the recirculating catalyst. As aresult, SO2 will be emitted together with otherproducts of combustion, including particulates, NOx,CO2 and some SO3. As noted in Section 3.2.1 above,carbon monoxide boilers are fitted to FCCUs at somerefineries. The mode of operation can affect theemission to air.
The FCCU in most cases contributes approximately15% to 30% to total SO2 refinery emissions. Theemissions vary markedly and do not follow the trendof lower emissions for smaller refinery size. Eightrefineries operate FCCUs. Six refineries reported SO2releases from FCCUs. One other refinery did notreport FCCU emissions separately from other non-combustion emissions. Another refinery did notreport FCCU emissions at all. Three other refineriesdo not operate this type of plant. From 1996 data onthe Public Register, the estimated total release of SO2from reported refinery FCCUs was 20 072 tonnes peryear.
Emissions from SRUs
SO2 emissions are affected by the quantity of sourgas fed to the SRU and the efficiency of the SRU.Only some refineries treat sour gas from the sourwater strippers which will tend to raise emissionsfrom their SRU slightly but would greatly reducesite-wide emissions. Other refineries incinerate SWSsour gas or burn it in fired heaters. In these cases SO2emissions will be higher on a refinery-wide basis asno sulphur is recovered and all sulphur in the SWSsour gas is released as SO2. Quantities of sour gaswill increase where crudes and residues with highersulphur contents are being processed.
Review of the Public Register information shows thatthe SRU can be a significant source of SO2 emissionsfrom refineries. From the limited informationavailable, some refineries have SRU efficienciesabove 98% and also have relatively low SO2 releases.
R&D Publication 2136
Other refineries either have poorer performance ordid not report their SRU efficiency.
From the 1996 data on the Public Register,comprising reports from six refineries, the estimatedtotal release of SO2 from UK refinery SRUs was22 084 tonnes per year. Three other refineries did notreport SRU releases. One site did not report SRUemission separately and one site did not operate anSRU.
Summary of SO2 releases
Figure 3.4 at the back of this section summarises theabove data graphically.
3.4.3 Releases of Oxides of Nitrogen (NOx)
General considerations
The principle sources of NOx emissions are:
(a) combustion emissions;(b) FCCU emissions;(c) calciner emissions;(d) miscellaneous.
None of the refineries reported NOx emissions fromflares. Reliable NOx factors are, however, difficult toestablish. Only two reported emissions from theirSRU, though these are likely to be relatively minorreleases, particularly for smaller refineries.
Refinery emissions of NOx are mainly influenced bycombustion and, to a lesser extent, FCCU releaseswith relatively small contributions from SRUs andbitumen units. However, a coke calciner is asignificant contributor to NOx emissions. Emissionstend to reflect, besides refinery size and complexity,the proportion of fuel oil to refinery fuel gas fired incombustion units.
Combustion emissions
All refineries reported NOx releases from combustionplant. At most refineries combustion contributes over75% to total NOx emissions.
Refinery emission factors suggest that typically fueloil firing produces two to three times as much NOxas refinery fuel gas firing for the same weight of fuelburnt (see Chapter 5). However, at refineries whereemission factors have been developed for individualfurnaces through stack monitoring, emission factorsfor NOx production range from two to seven timeshigher when firing on fuel oil than when firing onfuel gas. Refineries firing a high proportion of fuel oilwould therefore be expected to have a relatively highNOx emission. For those refineries where the actualfiring mix is known, the relative emissions follow thetrend expected by the fuel mix.
The estimated total release of NOx from the elevenrefinery combustion sources is 24 222 tonnes peryear.
FCCU emissions
Five of the eight refineries with FCCUs reportedNOx emissions from these units. The data availableshow the contribution of FCCU to refinery NOxemissions varies widely between 15% to 45% of totalrefinery emissions. NOx emissions from theregenerator are attributable to a number of factorsincluding:
• thermal oxidation of nitrogen in combustion air;• thermal oxidation of nitrogen compounds in the
coke;• design of the unit;• presence or absence of a fired waste heat
boiler/CO boiler.
The data suggest that further review of the way inwhich the emission data are generated should bemade, as well as how plant operation affectsemissions.
For the five refineries that report NOx from FCCUs,the estimated total emission is4576 tonnes per year.
Calciner emissions
Emissions from petroleum coke calciners are notreported but their contribution to the overall NOxemissions has been estimated at about 1038 tonnesper year.
Miscellaneous
Other sources of NOx emissions which have beenidentified are as follows.
• SRU
Data on NOx and particulate releases from SRUs areavailable for one site only and no emission limits areset. On this basis the SRU as a source of NOxappears to be minor.
• Bitumen plant
Five refineries operate bitumen plants. Differentgrades of bitumen are produced in the refinery by'blowing' bitumen to increase hardness as measuredby the bitumen penetration test. The blowing stripsoff lighter hydrocarbons from the bitumen and thehydrocarbon-laden air is subsequently incinerated.
The total emission of NOx from SRUs and bitumenplants sources has been estimated as 340 tonnes peryear.
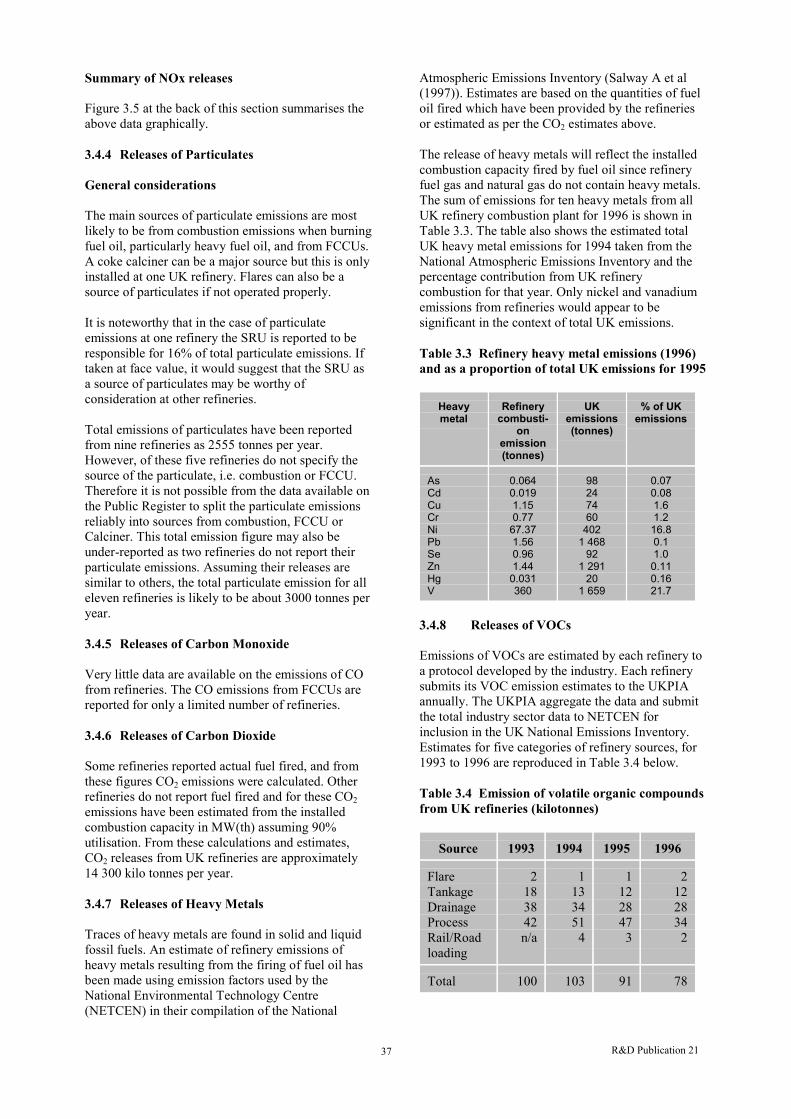
R&D Publication 2137
Summary of NOx releases
Figure 3.5 at the back of this section summarises theabove data graphically.
3.4.4 Releases of Par ticulates
General considerations
The main sources of particulate emissions are mostlikely to be from combustion emissions when burningfuel oil, particularly heavy fuel oil, and from FCCUs.A coke calciner can be a major source but this is onlyinstalled at one UK refinery. Flares can also be asource of particulates if not operated properly.
It is noteworthy that in the case of particulateemissions at one refinery the SRU is reported to beresponsible for 16% of total particulate emissions. Iftaken at face value, it would suggest that the SRU asa source of particulates may be worthy ofconsideration at other refineries.
Total emissions of particulates have been reportedfrom nine refineries as 2555 tonnes per year.However, of these five refineries do not specify thesource of the particulate, i.e. combustion or FCCU.Therefore it is not possible from the data available onthe Public Register to split the particulate emissionsreliably into sources from combustion, FCCU orCalciner. This total emission figure may also beunder-reported as two refineries do not report theirparticulate emissions. Assuming their releases aresimilar to others, the total particulate emission for alleleven refineries is likely to be about 3000 tonnes peryear.
3.4.5 Releases of Carbon Monoxide
Very little data are available on the emissions of COfrom refineries. The CO emissions from FCCUs arereported for only a limited number of refineries.
3.4.6 Releases of Carbon Dioxide
Some refineries reported actual fuel fired, and fromthese figures CO2 emissions were calculated. Otherrefineries do not report fuel fired and for these CO2emissions have been estimated from the installedcombustion capacity in MW(th) assuming 90%utilisation. From these calculations and estimates,CO2 releases from UK refineries are approximately14 300 kilo tonnes per year.
3.4.7 Releases of Heavy Metals
Traces of heavy metals are found in solid and liquidfossil fuels. An estimate of refinery emissions ofheavy metals resulting from the firing of fuel oil hasbeen made using emission factors used by theNational Environmental Technology Centre(NETCEN) in their compilation of the National
Atmospheric Emissions Inventory (Salway A et al(1997)). Estimates are based on the quantities of fueloil fired which have been provided by the refineriesor estimated as per the CO2 estimates above.
The release of heavy metals will reflect the installedcombustion capacity fired by fuel oil since refineryfuel gas and natural gas do not contain heavy metals.The sum of emissions for ten heavy metals from allUK refinery combustion plant for 1996 is shown inTable 3.3. The table also shows the estimated totalUK heavy metal emissions for 1994 taken from theNational Atmospheric Emissions Inventory and thepercentage contribution from UK refinerycombustion for that year. Only nickel and vanadiumemissions from refineries would appear to besignificant in the context of total UK emissions.
Table 3.3 Refinery heavy metal emissions (1996)and as a propor tion of total UK emissions for 1995
Heavymetal
Refinerycombusti-
onemission(tonnes)
UKemissions(tonnes)
% of UKemissions
AsCdCuCrNiPbSeZnHgV
0.0640.0191.150.77
67.371.560.961.44
0.031360
98247460
4021 468
921 291
201 659
0.070.081.61.216.80.11.00.110.1621.7
3.4.8 Releases of VOCs
Emissions of VOCs are estimated by each refinery toa protocol developed by the industry. Each refinerysubmits its VOC emission estimates to the UKPIAannually. The UKPIA aggregate the data and submitthe total industry sector data to NETCEN forinclusion in the UK National Emissions Inventory.Estimates for five categories of refinery sources, for1993 to 1996 are reproduced in Table 3.4 below.
Table 3.4 Emission of volatile organic compoundsfrom UK refiner ies (kilotonnes)
Source 1993 1994 1995 1996
FlareTankageDrainageProcessRail/Roadloading
2183842n/a
1133451
4
1122847
3
2122834
2
Total 100 103 91 78
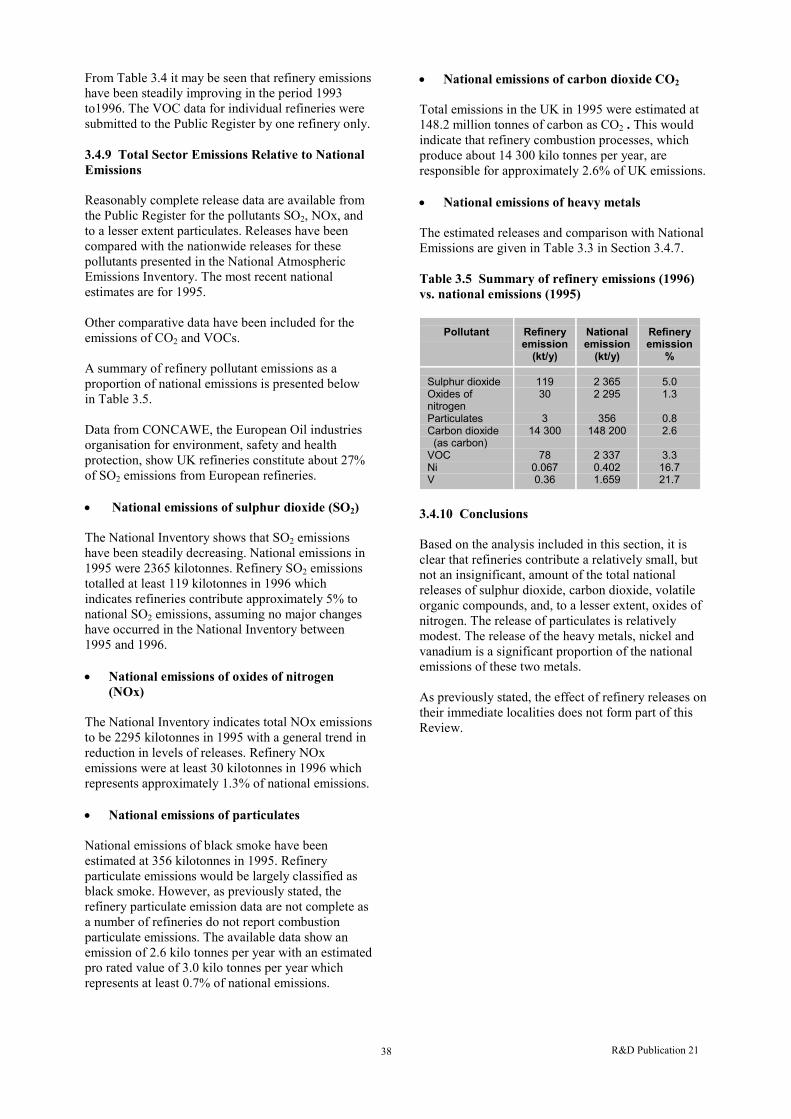
R&D Publication 2138
From Table 3.4 it may be seen that refinery emissionshave been steadily improving in the period 1993to1996. The VOC data for individual refineries weresubmitted to the Public Register by one refinery only.
3.4.9 Total Sector Emissions Relative to NationalEmissions
Reasonably complete release data are available fromthe Public Register for the pollutants SO2, NOx, andto a lesser extent particulates. Releases have beencompared with the nationwide releases for thesepollutants presented in the National AtmosphericEmissions Inventory. The most recent nationalestimates are for 1995.
Other comparative data have been included for theemissions of CO2 and VOCs.
A summary of refinery pollutant emissions as aproportion of national emissions is presented belowin Table 3.5.
Data from CONCAWE, the European Oil industriesorganisation for environment, safety and healthprotection, show UK refineries constitute about 27%of SO2 emissions from European refineries.
• National emissions of sulphur dioxide (SO2)
The National Inventory shows that SO2 emissionshave been steadily decreasing. National emissions in1995 were 2365 kilotonnes. Refinery SO2 emissionstotalled at least 119 kilotonnes in 1996 whichindicates refineries contribute approximately 5% tonational SO2 emissions, assuming no major changeshave occurred in the National Inventory between1995 and 1996.
• National emissions of oxides of nitrogen(NOx)
The National Inventory indicates total NOx emissionsto be 2295 kilotonnes in 1995 with a general trend inreduction in levels of releases. Refinery NOxemissions were at least 30 kilotonnes in 1996 whichrepresents approximately 1.3% of national emissions.
• National emissions of par ticulates
National emissions of black smoke have beenestimated at 356 kilotonnes in 1995. Refineryparticulate emissions would be largely classified asblack smoke. However, as previously stated, therefinery particulate emission data are not complete asa number of refineries do not report combustionparticulate emissions. The available data show anemission of 2.6 kilo tonnes per year with an estimatedpro rated value of 3.0 kilo tonnes per year whichrepresents at least 0.7% of national emissions.
• National emissions of carbon dioxide CO2
Total emissions in the UK in 1995 were estimated at148.2 million tonnes of carbon as CO2 . This wouldindicate that refinery combustion processes, whichproduce about 14 300 kilo tonnes per year, areresponsible for approximately 2.6% of UK emissions.
• National emissions of heavy metals
The estimated releases and comparison with NationalEmissions are given in Table 3.3 in Section 3.4.7.
Table 3.5 Summary of refinery emissions (1996)vs. national emissions (1995)
Pollutant Refineryemission
(kt/y)
Nationalemission
(kt/y)
Refineryemission
%
Sulphur dioxideOxides ofnitrogenParticulatesCarbon dioxide (as carbon)VOCNiV
11930
314 300
780.0670.36
2 3652 295
356148 200
2 3370.4021.659
5.01.3
0.82.6
3.316.721.7
3.4.10 Conclusions
Based on the analysis included in this section, it isclear that refineries contribute a relatively small, butnot an insignificant, amount of the total nationalreleases of sulphur dioxide, carbon dioxide, volatileorganic compounds, and, to a lesser extent, oxides ofnitrogen. The release of particulates is relativelymodest. The release of the heavy metals, nickel andvanadium is a significant proportion of the nationalemissions of these two metals.
As previously stated, the effect of refinery releases ontheir immediate localities does not form part of thisReview.
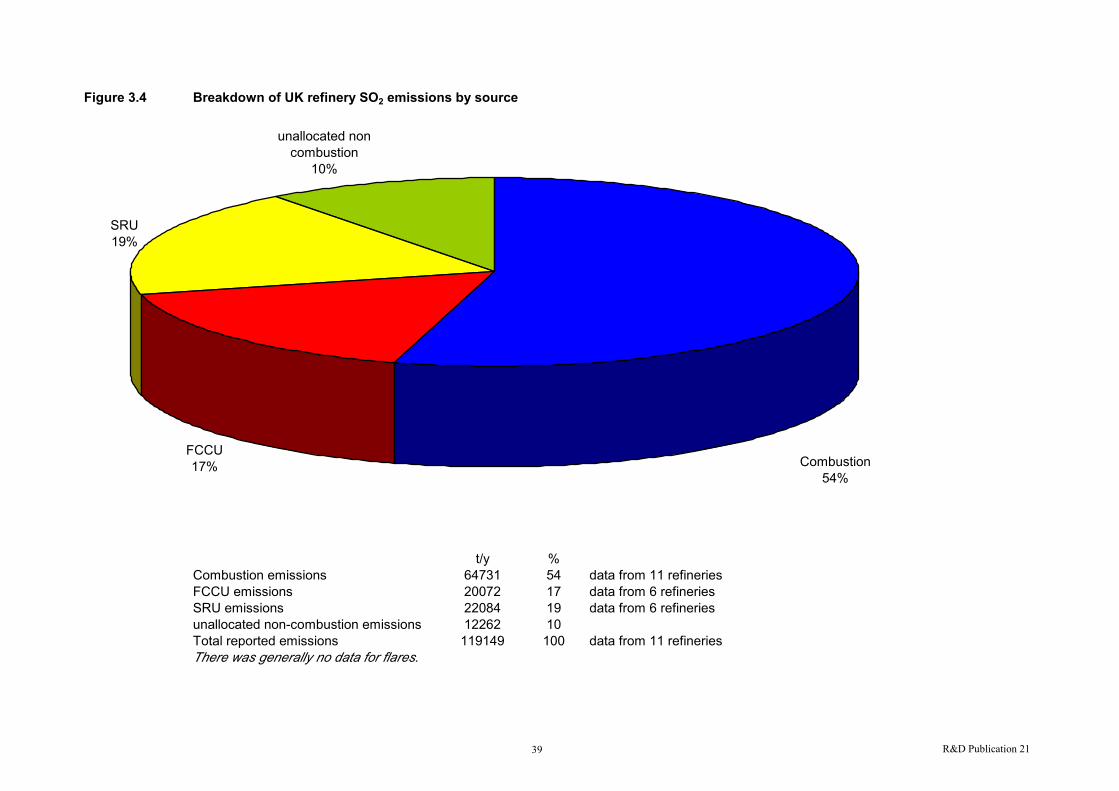
R&D Publication 2139
Figure 3.4 Breakdown of UK refinery SO2 emissions by source
t/y %Combustion emissions 64731 54 data from 11 refineriesFCCU emissions 20072 17 data from 6 refineriesSRU emissions 22084 19 data from 6 refineriesunallocated non-combustion emissions 12262 10Total reported emissions 119149 100 data from 11 refineriesThere was generally no data for flares.
SRU19%
FCCU17% Combustion
54%
unallocated non combustion
10%

R&D Publication 2140
Figure 3.5 Breakdown of UK refinery NOx emissions by source
t/y %Combustion emissions 24222 80.3 data from 11 refineriesFCCU emissions 4576 15.2 data from 5 refineriesCalciner emissions 1038 3.4 data from 1 refineriesUnallocated non-combustion emissions 340 1.1Total reported emissions 30176 100 data from 11 refineries
Combustion 81%
FCCU15%
Calciner 3%
combustion1%

R&D Publication 2141
4. WORLD-WIDE REFINERY BESTPRACTICE
4.1 Introduction
This Chapter reviews the environmental abatementpractice in the following countries, which aregenerally regarded as the leading countries orregions in environmental protection.
• USA• Scandinavia• Japan• The Netherlands
4.2 USA
4.2.1 Regulations
The USA applies the terms LAER (LowestAchievable Emission Rate) and BACT (BestAvailable Control Technology). LAER focuses onrequiring the most stringent emission limitationachieved in practice for the category of source underconsideration. Economics are not considered at all inLAER, whereas BACT is largely concerned with theeconomic feasibility of a control technology. BACTis a requirement applicable to major sources whichemit pollutants and requires consideration of eachsource on a case-by-case basis. BACT is generally aperformance requirement not an equipmentrequirement, and requires evaluation of alternativeproduction processes and available methods,systems and techniques, including fuel cleaning ortreatment or innovative fuel combustion techniques.BACT allows for the investigation of the economicfeasibility of technologically-viable measures,methods, controls or limitations.
Consideration of BACT is required for sources orunits above the following thresholds:
Pollutant Thresholdrelease valuestonnes/year
Sulphur dioxideOxides of nitrogenCarbon monoxideParticulate matter less than 10 µmVolatile organic compounds
4040
10015
40
The definition of BACT also states a minimumrequirement as “In no event shall application ofBACT result in emissions of any pollutant whichwill exceed the emissions allowed by any applicablestandard represented under the New SourcePerformance Standards (NSPS)”. In addition thecontrol of acid rain is planned to be achieved by
imposing NOx emission limits on a pounds permillion Btu annual average basis. The United StatesEnvironmental Protection Agency (USEPA)foresees that this approach will force industry toexplore energy efficiency and enhanced emissionscontrol technology.
Consideration of BACT for a refinery process unit isapplied if a permitted emission threshold isexceeded. BACT is applied to new process units,process units that are reconstructed, or process unitsthat undergo a major modification.
State legislation is superimposed on the FederalBACT approach where there is additional concernover pollutant levels. For example, California andDelaware apply the LAER approach to mitigatelow-level ozone. As NOx is a precursor to ozone theNOx regulations are, in consequence, stringent. Anyplant or unit that is reconstructed or replaced isconsidered to be new and as such comes under theNew Source Performance Standards. Emissioncredits cannot be carried over and the new limitunder LAER must achieve less than 25 tonnes peryear of NOx.
4.2.2 'Bubble' Approach
The Bubble emission permit system exists in theUSA, where the setting of an overall emission targetlevel for given pollutants emitted from an integratedprocessing complex is established. The level ofpollution varies markedly from one area to anotherand so a graduated classification scheme has beenimplemented whereby areas are categorised by theirair quality status. The pollution reductionregulations of a certain area are scaled accordinglyand deadlines for compliance set.
4.2.3 Emissions Trading
The USA has introduced 'emission trading' whererefineries can 'bank' future emissions by shuttingdown equipment or by using control equipmentwhere it is not regulatory driven. Each state canestablish its own emission trading regulations for aspecific pollutant; for example, New Jersey has aNOx trading programme. Emissions that are bankedare generally not based on licensed limits, but onhow the equipment has been operating in the recentpast, usually the previous two years. The value ofbanked emissions have a time limit and decrease invalue until they disappear completely, at some timein the future. Generally emissions will be lowerusing the banking system.
4.2.4 Use of Abatement Technology
Table 4.1 shows examples of abatement technologyand their current application by oil companies in theUSA.

R&D Publication 2142
Abatement Techniques - Air
SO2
The SO2 emission limit for New SourcePerformance Standards is 700 mg/Nm3. Techniquesalready in use on USA refineries to achieve thisinclude:
(i) scrubbing of flue gases. This has been in usesince the 1970s. Recent trends include forcedoxidation to produce gypsum, a commercialproduct. Scrubbing is applied typically toFCCU flue gases;
(ii) three stage Claus unit on sulphur recovery units;(iii) additional off-gas treatment such as proprietary
Beavon or Shell Claus Off-gas Treatment(SCOT). These are used for larger plants;
NOx
The principal techniques in use to control NOx inrefineries are:
(i) use of low NOx and ultra-low NOx burnersin combustion equipment;
(ii) selective non-catalytic reduction (SNCR)and selective catalytic reduction (SCR), usedin California and Delaware as LAERtechnology).
Par ticulates
US regulatory authorities have set an NSPSrequirement generally for FCCUs of 1lb ofparticulate matter per 1000 lbs of coke burned off(equates approximately to 75 mg/Nm3). Abatementtechnology permitted under the BACT scenario andcurrently in use includes:
(i) tertiary external cyclones;(ii) ESPs for fine particulates.(iii) wet gas scrubbing;
VOCs
BACT used to reduce VOC emissions in refineriesincludes:
(i) regenerable activated-carbon vapour recovery units;
(ii) temperature controlled vapour combustors;(iii) vapour recovery during loading/unloading
operations at marine terminals;(iv) secondary seals within storage tanks;(v) leak Detection and Repair Programme
(LDAR) to minimise fugitive emissions;(vi) use of closed systems for wastewater treatment
collectors to restrict losses to atmosphere.
Abatement techniques - water
Standard regulatory requirements to reduce waterpollutant levels include use of BACT.
Strict limits apply to toxic and conventionalpollutants, BOD, COD, TOC, ammonia, sulphidesand phenolics.
BACT includes:
(i) waste water management;(ii) segregation of process water, storm water
and oily storm water;(iii) oil segregation at source;(iv) spill prevention and control;(v) measures to maintain segregation;(vi) enclosed CPI separator (corrugated plate
interceptor) that vents to carbon absorbers;(vii) filtration and carbon systems to provide
final water polishing.
Abatement techniques - land
The USA operates a Toxic Release Inventoryprogramme which includes solid wastes wherebyowners and users must report releases of listedsubstances. Federal law prevents the application oftoxic wastes to land.
BACT includes:
(i) incineration;(ii) recycling;(iii) stabilisation/solidification;(iv) use of special purpose off-site disposal;(v) land farming of residual sludge, provided that
concentrations of components meet federal andlocal regulations.

R&D Publication 2143
Table 4.1 Examples of USA abatement applications
Facility State(1) Process Efficiency Control
NOx abatement measures
ChevronFletcher Oil
Koch RefiningCompany
MSCA
MN
Process heatersVacuum heater for gas oilprior to vacuum distillationFCCU
63%85%
-
Ultra-Low NOx burnersSelective catalytic reduction
Low excess air on catalyst;regenerator with combustioncontrol on the CO boiler
SO2 abatement measures
Texaco
TransamericanTransamericanMobil OilCompany
CA
LALACA
SRU
SRUFCCU regeneratorTEOR(2) operation withSulphur removal
99.9%
99.9%90%95%
Three stage Claus, aminebased tail gas treating unitThree stage Claus, SCOT inc.Dry lime injection scrubberSulphur scrubbing system forH2S
Par ticulate abatement measures
Murphy Oil LA FCCU 90.8% Electrostatic Precipitators
Par ticulate and SO2 abatement measures
Shell
MaricopaTransamerican
LA
AZLA
FCCU regenerator
Process heaters and boilersFCCU regenerator
-
-93%
Wet gas scrubber (to adhereto NSPS)Wet scrubberTertiary cyclone with venturiscrubber
VOC
BP, ToledorefineryBP, ToledorefineryMobil OilCompanyTexacoRefining
OH
OH
AL
CA
Stormwater diversionchamberCoker
Claus sulphur recoveryunitSurge tank
95%
99%
-
98%
Carbon canisters
Flare
Thermal oxidizer, increaseoperating temperatureVapour recovery system
(1) State codes (2) TEOR Thermally Enhanced Oil RecoveryMS - Missouri MN - Minnesota AZ - Arizona AL - AlabamaCA - California LA - Louisiana OH - Ohio
R&D Publication 2144
4.3 Scandinavia
4.3.1 Regulations
Scandinavian countries generally have morestringent regulatory requirements than the UK,although there are slight variations between thedifferent Scandinavian countries. Financialincentives may be offered by Governments to meetrequirements, e.g. removal/reduction of NOxemissions.
Denmark, Sweden and Finland have establishedwide-ranging energy taxes including special leviesfor carbon- based fuels. Sweden has alsointroduced stringent requirements to minimise alltypes of emissions. Use of high sulphur fuels(>0.5%) is prohibited throughout the country.Sulphur recovery must be in excess of 99%including the flaring of residual tail gas. NOx andparticulates must be reduced to the minimumfeasible level. Norway has introduced a special taxduty to minimise emissions of CO2 and NOxduring flaring on a per tonne of oil produced basis.Low sulphur fuels are also used in Norway.
Denmark has set SO2 emission limit values of1000 mg/Nm3 for residual product fuels , with amaximum of 1% S in fuel oil. SO2 limits forgaseous and LPG fuels have been set at muchlower levels (35 mg/Nm3 to 5 mg/Nm3). NOxlevels have been set at 225 mg/Nm3 for both liquidand gaseous fuels.
In Sweden the total permitted release levels for theScanraff Refinery are 2000 tonnes per year SO2 and1000 tonnes per year NOx. The absolute limit ofparticulates from the FCCU is 75 mg/Nm3. Thecrude capacity for this refinery is 200 000 barrelsper day or 9.5 million tonnes per year which iscomparable in size to most UK refineries.
Release levels for the whole of the MongstadRefinery, Norway's main refinery, are 2000 tonnesper year for SO2 and 2150 tonnes per year for NOx.The crude capacity for this refinery is130 000 barrels per day or 6.2 million tonnes peryear.
4.3.2 The 'Bubble' Approach
The bubble concept is applied to overall emissionsfrom refineries. This requires that new processesare included within the current permitted emissioninventory for a site. In consequence emissions fromexisting plant must be reduced to accommodatenew plant operation.
4.3.3 Use of Abatement Technology
Abatement techniques - air
SO2
Refinery operators use advanced abatementtechnology to meet the stringent emission limitsof Scandinavia. The technology includes:
(i) additional SRU off-gas treatment such as theSCOT process (Sweden);
(ii) SRU recovery efficiency >99.5%;(iii) refinery fuel gas only allowed to be fired in
refineries, except for start-ups when fuel oilcan be used.
NOx
NOx abatement technology is essential to meetthe strict NOx requirements. Technology used todate includes:
(i) low or ultra-low NOx burners are standardor retrofitted;
(ii) SCR has been retrofitted to the Scanraffrefinery FCCU.
Par ticulates
Abatement technology includes the use oftertiary treatment for FCCUs, e.g. hot ceramicfilters retrofitted to the underflow of third stagecyclones.
VOCs
Abatement technology used in Sweden andDenmark to minimise VOC emissions includesvapour recovery equipment on storage tanks.
4.4 Japan
4.4.1 Regulations
Japan is a highly industrialised country withsignificant limitations on available land for bothurban and industrial development. Inconsequence the pollution regulations arestringent. This is particularly applicable to high-density industry complex ‘hot spots’ such asTokyo Bay and Osaka Bay. In these areas localgovernment regulations impose further stringentemission limits to the national regulations. Ingeneral Japanese national regulations do notspecify particular technology requirements suchas BAT or BACT. Instead, Japanese regulationsspecify emission limits in the form ofconcentrations and quantities. Total pollutantload control is required for the ‘hot spot’ regions.

R&D Publication 2145
Local regulations may, however, identify specificprocess requirements or abatement technology,particularly for VOCs.
Local government has the right of final acceptanceof plant operations through its environmentalpermit system.
4.4.2 Bubble Approach
Due to the density of industrial complexes Japaneselegislation is applied on an area basis. A totalemission load control is applied for NOx and SO2.Consequently, when new processes or plants areplanned, fuel and emission control strategies arerequired to make adjustments to existing plant inorder to meet the total limits.
4.4.3 Use of Abatement Technology
The need to meet stringent emission requirementsdictates the need to apply similar abatementtechnology/facilities throughout Japaneserefineries. Japan also tends to apply ‘maximumresource recovery’ techniques to make use of allby-products from processes.
Abatement techniques - air
SO2
Fuel oil sulphur content is restricted to a maximum1.2%. However, clean refinery fuel gas is regularlyused to avoid the need for abatement technology.
Abatement technology includes:
(i) high-efficiency sulphur recovery;(ii) scrubbing of flue gas using
limestone/gypsum systems, Mg(OH)2 orNaOH.
NOx
Abatement technology includes:
(i) low NOx and ultra-low NOx burners;(ii) clean fuel gas;(iii) use of SCR (selective catalytic reduction).
Par ticulates
Electrostatic precipitators have been used to reduceparticulate emissions from FCCUs.
VOCs
Control of VOC emissions tends to be based onlocal government initiatives. Abatement technologyused includes vapour recovery at loading facilitiesas well as other usual VOC abatement methods.
4.5 The Nether lands
4.5.1 Regulations
Refineries negotiate their own release levels withtheir local authorities.
4.5.2 Use of Abatement Technology
Abatement techniques - air
The Shell Refinery at Pernis, in the Netherlands,has applied heavy oil gasification where some ofthe syngas is burnt as fuel on the refinery toproduce steam from the combined cycle gasturbine. SO2 emissions are virtually zero fromthis process, as after gasification, the H2S andother sulphur components are removed from thegas phase. Shell has an agreement with the DutchGovernment that the refinery will not be subjectto tightening of emissions regulations for another20 years.
No flue gas abatement plant (wet scrubbing, SCRetc.) is fitted to Dutch refinery processes, butfiring of fuel oil is not permitted. All combustionplant fire fuel gas and are fitted with low NOxand ultra-low NOx burners; therefore SO2, NOxand particulate releases will be lower than in theUK. (It should be noted that Rotterdam Europortprovides a major outlet for fuel oil, supplied asships’ bunker fuel.)
4.6 Summary and Compar ison with UKPractice
4.6.1 General
The Scandinavian countries, Japan andCalifornia USA have the most rigorousrequirements for pollution control and reduction.Such countries tend to apply the lowest-achievable emission rate as a standard withlimited, if any, consideration to economics. Japanhas achieved the lowest per capita emissions forSO2, NOx and particulates within the OECDcountries. This reflects the close proximity oflarge populations to heavily-industrialised areas.
The other parts of the USA and the othercountries that have been surveyed together withthe UK, usually apply cost versus abatementperformance to some degree.
4.6.2 Bubble Per mit System
Most countries operate the bubble permit systemfor emissions, whereby the refinery is classed asan integrated unit and individual refinery releaselevels are established by the Authorities. Newplant has to be accommodated within the existing

R&D Publication 2146
set limits. Therefore new plant, or majormodifications, imply increasingly stringent controlmeasures at a refinery. In the UK there is notgenerally a requirement at present to accommodatenew plant within existing limits.
4.6.3 Fuel Constraints
Crude feedstock quality is regulated in Scandinaviaand Japan, as is the allowable sulphur content inrefinery fuel oil and gas (< 0.5% in Sweden andbetween 0.5% and 1.2% in Japan). Other countries,like the USA, do not specify a limit, but wherehigher sulphur content fuels are used, abatementequipment has to be installed. Generally, end-of-pipe technology is avoided if other techniques,such as fuel substitution, fuel cleaning andadvanced combustion techniques are effectivelyemployed. At present there is no generalrequirement to limit sulphur levels in refinery fuelsin the UK.
4.6.4 SO2 Emissions
Flue gas abatement on refineries is mainly used inthe USA. In Europe the preference is for thecombustion of clean fuels, particularly gas, ratherthan, for example, the use of wet gas scrubbing.
Increasingly, hydrotreatment, the removal ofsulphur in the feedstock or product stream, is beingutilised to reduce sulphur emissions from fuels,especially in the USA, Japan and Scandinavia.
4.6.5 NOx Emissions
Scandinavia has established incentives to reduceNOx emissions.
In all the countries the use of low NOx burners isconsidered the minimum abatement technology toreduce NOx emissions. USA, Scandinavia andJapan tend to use ultra-low NOx burners, and insome cases flue gas recirculation (FGR). It isnoteworthy that in the UK the combustion plant onseveral of the refineries are not fully fitted with lowNOx burners. The use of SCR is not considered tobe the best available technology in the majority ofthe USA, due to higher capital and operating costs.In some states, however, like California andDelaware, there are strict NOx limits to minimiselow-level ozone formation and use of SCR isrecognised as representing LAER. SCR and SNCR(selective non-catalytic reduction) are not generallyused downstream of furnaces and boilers onrefineries in Europe, but FCCU plants in Sweden,Hamburg and Rotterdam have been retrofitted withSCR technology.
Combined SO2/NOx removal systems, recently inthe development stage, are now becoming
available. Potentially they may be equivalent orpreferable to other systems currently in use, dueto their favourable cost and overall removalefficiency (see Section 5.4.3).
4.6.6 Par ticulates
Cyclones used for abatement of FCCUparticulates are not very efficient at collecting thesmaller particles and are supplemented by theaddition of ESPs in the USA and Japan. Onlyone refinery in the UK has an ESP fitted to itsFCCU and another is considering it for thefuture.
Sweden has utilised newer hot ceramic filtertechnology, with varying success. The techniqueis continuing to be developed and may becomemore standard abatement technology in thefuture.
4.6.7 VOCs
The USEPA requires refineries to prepare andimplement LDAR programmes. Theseprogrammes are being implemented in manyrefineries, world-wide, in an effort to reducefugitive emissions of hydrocarbons, pump seals,valves and flanges. It is considered that theseprogrammes are likely to result in significantreductions of fugitive emissions. In the UK thereis no regulatory requirement for VOC controlacross the refinery sector.
4.6.8 Conclusion
When the above data are compared with thecurrent abatement measures applied to UKrefineries, as described above and in Chapter 3, itcan be seen that the UK does not compareparticularly favourably with the advancedcountries surveyed. Overall it could beconcluded that the UK is behind the USA interms of application of abatement techniques,and significantly behind Scandinavia and Japan,which are probably the world’s leading investorsin environmental protection.

R&D Publication 2147
5. POLLUTION REDUCTION ISSUES,TECHNIQUES AND COSTS
5.1 Introduction
This Chapter reviews the main refinery plant andtechniques that are available to reduce pollutingreleases. Abatement techniques are described foreach pollutant, SO2, NOx , particulates etc.Approximate costs of abatement plant are alsodiscussed and these are summarised in Table 5.3 atthe back of this section.
Methods for abatement of polluting releasesgenerally fall into three main areas;
• Upstream abatement, for example, ensuring thefuel combusted is as ‘clean’ as possible. In thisrespect Table 3.1 in Chapter 3 highlighted theimprovements that can be obtained in SO2, NOxand particulate releases by burning very lowsulphur refinery gas or natural gas.
• Using abatement techniques inside a furnace orreactor where combustion or a chemicalreaction is taking place.
• Abating releases downstream of combustionplant or reactors. These techniques aresometimes known as ‘end-of-pipe solutions’.One problem with these is that equipment tendsto be larger and hence more expensive than itmight otherwise be because other large-volumeinert substances may also be present in the flow.For example, by volume, there is four times asmuch nitrogen in air than oxygen and thereforecombustion flue gas is very largely composedof nitrogen.
5.2 Sulphur and Sulphur Dioxide Abatement
5.2.1 Upstream Abatement of Sulphur (FuelCleaning)
(a) Hydrotreatment and associated processes
Hydrotreatment is a general term for a range ofprocesses for the removal of sulphur from refineryfeed and product streams. The process removessulphur, under pressure and elevated temperature inthe presence of hydrogen over a catalyst, byconversion of the sulphur to hydrogen sulphide.
Sulphur is generally more readily removed from thelighter, lower boiling range, hydrocarbon streamsthan from heavier, higher boiling range streams. Inthe case of the lighter hydrocarbons less hydrogen isrequired and less reactor pressure, typically 30-40bar. On the other hand, hydrotreatment of a heavyhigh sulphur residue stream, where the sulphur ismore difficult to remove, and hydrocracking, where
the cracking of the heavy fractions is the primeobjective and where sulphur is also removed, requirepressures of the order of 50-80 bar and 80-150 barrespectively. These types of processes are thereforeenergy intensive. They also require more catalystand more hydrogen than the hydrotreatment oflighter streams and are therefore very expensiveboth in investment costs and operating costs.
Some examples of costs for typical sizes/capacitiesof hydrotreaters applicable to UK refineries aregiven in Table 5.1. All installed costs quoted areindicative as the final cost will be influenced by thesite-specific factors and the operators’ requirements.The scope of each price typically includes licenceand engineering fees, civil/foundations, materials,construction/installation and commissioning, butexcludes the cost of catalyst, power, steam and otherutility plant. These are included in the indicativeoperating costs given immediately below Table 5.1.
The investment is further increased by the additionaldemand for hydrogen and the need to convert thehydrogen sulphide produced to liquid or solidsulphur in an expanded sulphur recovery unit(SRU). It may be possible in some cases to supplythe extra hydrogen from the catalytic reformer unitby changing its operating conditions slightly.However, if the hydrogen requirement is met fromthe existing refinery fuel gas system this could leadto less refinery fuel gas being available forcombustion processes on the refinery. If this refineryfuel gas were replaced by fuel oil firing incombustion processes, emissions would againincrease. Provision of a new steam methanereforming plant to supply the extra hydrogen wouldbe a third option for refiners, but this would be themost expensive alternative. Further, the addition of ahydrotreatment or hydrocracker unit will itself incuremissions including NOx and CO2 and perhaps SO2 .
As catalytic cracking is the predominant conversionprocess in UK refineries, any investment to meet2005 fuel specifications, and the other market trendsdescribed in Chapter 2, is expected to be centredaround this key asset. On this basis, a few refinersmay install either hydrocracking, or feedhydrotreatment capacity, upstream of the FCCU.Hydrotreatment of feed to the FCCU operates atsimilar conditions to those used for gas oil andatmospheric residue. Installation of FCCU feedhydrotreatment (or a feed hydrocracker) will reducethe sulphur content in FCCU products, improve theirquality and require less final processing. It will alsoreduce emissions of SO2 from the regenerator byabout 90% and give a reduced catalyst consumptionin the FCCU.

R&D Publication 2148
However, because of the investment costs it isunrealistic to expect refiners to invest in FCCU feedhydrotreatment purely for abatement of SO2emissions from FCCU regenerators, furnaces andboilers burning fuel oil. However, some refinersmay well consider adopting such a scheme in orderto meet a number of requirements such as thosedescribed above, which would include emissionabatement. In this case, refiners should haveadequate information made available to them toenable them to consider future emissions abatementrequirements at the same time as they areconsidering upgrading to meet the 2005specifications.
It can take three to four years to add complex newupgrading plant and therefore such requirementswould need to be made clear by as soon as possibleas most refiners are now planning their investmentto meet the 2005 fuel specifications.
Table 5.1 Hydrotreater costs applicable to UKrefiner ies
Type ofhydrotreater /
service
Typical UKsize/capacity(thousands ofbar rels/day)
Typicalcapital/installed
cost 1997£million(1)
Naphthahydrotreatment
304050
424856
Cat. feedhydrotreatment(typical feeds beingatmospheric residueand vacuum gas oil)
255075
5894(2)
133
Vacuum residuehydrotreatment
2550
75(3)
123
Hydrocracking 3040
102132
(1) Costs include necessary interconnections to existing plantfor integration purposes.
(2) Typical operating cost for this size unit £16 million/yr(3) Typical operating cost for this size unit £13 million/yr
The costs in Table 5.1 assume that there is adequateplot space and existing SRU and sour waterstripping capacity. Most UK refineries, ifcontemplating investment in FCCU feedhydrotreatment, residue hydrotreatment orhydrocracking would, as noted above, need newhydrogen-producing facilities. A new hydrogenplant for a 50 k barrels/day FCCU feed hydrotreateror hydrocracker would typically cost in the range of£40 - 50 million.
Syngas
An alternative approach to removing sulphur usingFCCU feed hydrotreatment is to process residues bygasification to produce sulphur-free syngas. Syngascould be utilised, as refinery fuel gas for hydrogen,fuel, or chemicals production. This approach wouldprobably result in a refiner producing lesstransportation fuels. The gasification process isdescribed in more detail in Chapter 7. At present itis relatively expensive and therefore unlikely to beadopted by individual refineries in the near future,but they might consider it on a co-operative basis.
5.2.2 In-Furnace Abatement of SO2
Boilers and furnaces
For conventional refinery boilers and furnaces theinjection of lime or limestone into the furnace forsulphur capture cannot be applied. However, ifexisting types of boilers were to be replaced, forexample, by fluidised bed or circulating fluidboilers, to burn petroleum, coke or heavy asphaltsresulting from solvent deasphalting, thenlime/limestone injected into the furnace asabatement would be practical. Although this wouldabate the SO2 release by about 90%, limestone100% in excess of the stoichiometric quantity wouldbe required.
FCCU regenerators
SO2 in the regenerator off-gas of an FCCU can bereduced by using a catalyst which transfers asignificant portion of the sulphur associated with thecoke on the catalyst to the reactor where it isliberated as hydrogen sulphide. This leaves thereactor with the cracked vapour product for capturein the refinery’s amine scrubbing system and thenceconversion to sulphur in the SRU.
However, the sulphur-reducing catalyst has anumber of adverse effects, including the promotionof SO3 and NOx in regenerators which are operatedin total combustion mode, i.e. where there is no COboiler. Where there is a CO boiler, i.e. with FCCUregenerators operated with a reducing atmosphere,this type of catalyst may help in reducing pollutingemissions without promoting others.
Overall, the method may be seen as an interimsolution over a few years where the requirement isto marginally reduce SO2 emissions in order to meetemission limits. In summary:

R&D Publication 2149
Advantages
• SO2 removal range is from 30-50%;• additional operating cost for the catalyst is
low;• the method is well established commercially,
particularly in the US.
Disadvantages
• SO3 and NOx increases for FCCUs in totalcombustion mode;
• poorer yield of products from FCCU;• reduced FCCU operating flexibility;• high cost per tonne of SO2 removed. Typical
costs are £2 million per annum for the catalystfor a gas flow of 200 000 Nm3/hr;
• increased load on the SRU.
5.2.3 Downstream Flue Gas Abatement of SO2
Boilers/furnaces/FCCU regenerators
The capital cost of equipment for downstream SO2abatement on boilers, furnaces and FCCUregenerators is largely dependent upon flue gas flowrates. Typical flue gas flow rates and associated SO2concentrations are shown below in Table 5.2 for UKrefineries.
Table 5.2 Typical flow rates and concentrationsfrom UK refiner ies
Flow(Nm3/hr at 3% O2)
Concentration ofSO2 (mg/m3)
Boilers and Furnaces:
650 000450 000250 000100 000
2000230010002000
FCCUs:
200 000150 000
70 000
700900
1100
A number of licensed processes for abatement ofSO2 in flue gases on refineries have been installedaround the world. Most of these are operational inthe USA. The most popular is wet scrubbing of theflue gas from FCCU units. A brief summary of thewet scrubbing process is given below, together withother scrubbing processes less likely to be suitablefor flue gas cleaning in refineries.As already noted, pressure drop is an importantconsideration in respect of downstream abatement,
particularly in the case of natural draft furnaces andFCCUs. In order that key pieces of refineryequipment such as the FCCU do not need to be shutdown solely for maintenance of their abatementplant, such plant needs not only to be effective butalso highly reliable and compatible with theoperating requirements of the main equipment.
• Wet gas scrubbing processes
SO2, CO2 and particulates are removed from the fluegas by reaction with an alkaline solution, forexample caustic soda or sodium carbonate, toproduce a soluble sodium sulphate effluent. Thealkaline solution is contacted with the flue gas in ascrubber and the outlet passes to a separator drum.The separated gas flows to a stack and the liquid isrecycled to the contacting scrubber. There is aconstant purge of slurry and corresponding make upof caustic or carbonate solution. Typically a venturiscrubber is used, although a spray tower may beused as an alternative. This has a similarperformance to the venturi scrubber but usuallyachieves a lower pressure drop.
A suitably-designed wet scrubbing process willnormally provide an effective removal efficiency ofboth SO2/SO3 and particulates of up to 90%. Withthe inclusion of an extra treatment tower, to oxidisethe NO to NO2, an NOx removal efficiency of about70% may be achieved. Nearly all CO2 from the gasstream could be absorbed if an alkaline solutionsuch as caustic soda is used as the scrubbing agent.Variants on the process exist which allow forregeneration of the scrubbing agent.
Advantages:
• widely used on FCCU plants in the USA;• considerable operating experience;• low pressure drop;• operates at low temperature;• no solid deposition problems;• 90% sulphur and particulate removal.
Disadvantages:
• expensive raw material, e.g. caustic soda, ifsulphur and other loadings are high;
• may need flue gas reheat to prevent visibleplume mist;
• effluent water purge stream usually produced.
Typical installed capital costs for this type ofabatement plant are given in Table 5.3, based on therange of flue gas flows and concentrations shown inTable 5.2.

R&D Publication 2150
• Dry and semi-dry processes
SO2 is removed from the flue gas by reaction withlime. The key component of the semi-dry process isa spray drier in which the hot flue gas is contactedwith a spray of fine droplets of lime slurry. The SO2is absorbed into the droplets forming reactionproducts which are dried to a fine powder by the hotflue gas.
In the dry process, dry lime is injected into the fluegas as finely-dispersed particles. Both dry and semi-dry processes require downstream dust arrestmentsystems, such as an electrostatic precipitator (ESP)or bag filtration. The disadvantages may includehigh pressure drops across the bag filters. The dryprocess is a relatively low cost solution not requiringa spray drier but only achieves about a 50% sulphurcapture.
Dry and semi-dry flue gas desulphurisation (FGD)systems have been extensively used in the powerindustry world-wide but not widely on refineries andin particular, not on FCCU applications, as theirreliability and compatibility are questionable in thistype of service.
Advantages:
• 85% sulphur removal with semi-dry process andabout 50% removal with dry process;
• operates at the lower temperature end of system;• solid waste for disposal;• cheaper raw material;• capital and operating costs typically less than
wet scrubbing.
Disadvantages:
• increased dust load in gas stream; need for dustcapture;
• operational difficulties in water/heat balance(spray driers only);
• possibly significant pressure drop across bagfilter dust arrestment plant, e.g. bag filters;
• not likely to be suitable for natural draftfurnaces or FCCUs and compatibility may bedoubtful on other refinery combustion plant.
• Other SO2 r emoval processes
Other SO2 removal processes which could beconsidered, but which have not so far been widelyapplied to refinery abatement, include the following.
• Limestone gypsum (including semi-dryprocess). Widely applied in the power industryon large electrical generating stations but lesslikely to be applicable to the refinery industry
due to the amount of solids handling requiredand the smaller flue gas flows.
• Sea-water scrubbing. This uses the naturalalkalinity of the sea water to remove SO2. SO2recovery can be as high as 90%. Thisapplication has been successfully applied in aScandinavian refinery, which is situated on adeep fjord. UK refineries are mostly situated onestuaries. Due to the large volumes of waterinvolved in the process, it is likely that therewould be adverse environmental effects fromthe acidic process effluent discharged intoestuarine waters.
• Dry catalytic process. Removal of SO2 is byabsorption on, and reaction with, copper oxideheld in a matrix in a reactor vessel.
5.3 Sulphur Recovery Units (SRU) andSulphur Balance
5.3.1 Sulphur Recovery Units
Overall issues
Insufficient data are available from the PublicRegister to fully assess existing sulphur plant size,adequacy and performance. This could be remediedif refiners were asked to provide the EnvironmentAgency with sulphur balance data that clearly showthe performance of the sulphur plant, see below.This could include releases of sulphur when the unitis shut down both for scheduled and unscheduledreasons. Without significant investment in newplant, any improvement in refinery sulphur recoverywill probably be limited by the ability of the existingSRU to accept new stream compositions e.g. sourwater stripper (SWS) gas and an increase in volumethroughput. A brief description of the key factorsinvolved in improving SRU performance and thedesign of the SRUs is given below.
Minor capacity improvements
Minor capacity increases obtained by overcomingthe pressure profile constraint in SRUs can begained by a combination of strategies. These mayinclude uprating combustion air blowers, improvedsulphur seals, and improving catalyst efficiencythereby reducing the bed pressure drop. This latterroute will probably require the operation of theamine unit and sour water stripper at slightly higherpressures, or, alternatively, a tail gas blower may beinstalled. The increase in throughput that can begained in this way may vary from 5% to 25%,depending on the mechanical and upstreamconstraints. More extensive modifications wouldrequire substantial SRU downtime and entailsignificant cost.
R&D Publication 2151
The largest throughput improvements normallyachieved on existing SRUs is by oxygen enrichmentof combustion air, or replacement with pure oxygen.If circumstances permit, 100% increase inthroughput can be achieved. This is probably themost cost-effective solution to significantlyincreasing the refineries’ sulphur recovery potential.Significant cost is entailed if the existing SRU is notable to be modified in this way due to age or otherconstraints. Typical capital costs for SRUs and SRUmodifications are given in Table 5.3.
New sulphur recovery unit design
If a new SRU is ultimately required then it should bedesigned to achieve 99.5% sulphur recovery orbetter. This would entail at least three catalyticstages plus a tail gas treatment unit (TGTU) or twostages plus integral TGTU. A tail gas incinerator,operating at least at 850 °C with a residence time ofone second and reasonable turbulence enhancementsto prevent tail gas bypassing, should be provided toensure residual H2S of 10 ppm or less in the fluegas.
The new SRU should have an individual on-streamfactor exceeding 96%. If the refinery does not havea complete annual shut down, then there should besufficient parallel or spare capacity to allow thescheduled maintenance activity to proceed everytwo years, as a minimum, without a significantincrease in sulphur emissions as a result.
For the unscheduled times when SRU capacity isunavailable, full emergency SRU treatmentshould ideally be available. Alternatively, thereshould be the ability to divert the whole acid gas andSWS gas flows to the SRU tail gas incinerator for aperiod not exceeding an agreed short period of time.A sour flare design should not be used.
Typical costs for a range of SRU size applicable toUK refineries are given in Table 5.3.
5.3.2 Refinery Sulphur Balance
In addition to the suggestion that a sulphur balanceis applied to the SRU, analysis of data from thePublic Register show that, with the exception of onerefinery, there are insufficient data and lack ofconsistent data to assess a refinery's overallperformance in abating sulphur releases. Forexample an SRU may be operating very well butthat is relatively unimportant if most of the sulphurthat is being emitted from combustion processes orsulphur-bearing streams are piped directly tofurnaces for disposal.
Figure 5.1 shows the typical sulphur-bearingstreams into and leaving a refinery. It is suggestedthat the Environment Agency might consider asking
refiners in the future, as part of their returns to theirlocal Environment Agency inspector, to regularlyreport their overall refinery sulphur balance in theform of the sulphur in the streams entering andleaving the refinery. All recognised sulphur-bearingstreams should be accounted for in this exercise.
5.4 Abatement of Oxides of Nitrogen (NOx)
5.4.1 Upstream Abatement of NOx
Hydrotreatment, in addition to removing sulphurcompounds, will remove nitrogen compounds byabout 15% to 40%. (Very severe hydrotreatingmight achieve higher percentage removals.) Thenitrogen compounds, especially in residues used asfuel oil, give rise to increased levels of NOx whenthe fuel is burnt. However, as was identified above,installation of hydrotreatment purely for thepurposes of refinery pollution abatement could beconsidered as excessive cost. This therefore appliesthe more so for nitrogen compounds in residues,which in any case would only be reduced to a degreeby hydrotreatment.
5.4.2 In furnace Abatement of NOx
Low NOx burners
Typically a 30% to 40% reduction in NOx emissionscan be achieved by fitting conventional low NOxburners. These burn the fuel on a staged basis toachieve lean combustion and hence lower flametemperature and lower NOx levels. Low NOxburners designed for firing refinery gas typicallyachieve 100 mg NOx/Nm3 at 3% excess oxygen.NOx abatement on older furnaces and boilers mayalso be less effective due mainly to the need to avoidflame impingement on the furnace tubes.
New ultra-low NOx burners can, depending oncombustion conditions outlined below, achieve80 mg/Nm3. They are currently available from twosuppliers. Performance of ultra-low NOx burners inboth natural draft and forced draft heaters aredescribed below.

R&D Publication 2152
Figure 5.1 Data for refinery sulphur balance and SRU per formance analysis
In the case of natural draft heaters, 80 mg/Nm3 isachievable with ultra-low NOx burners when airpreheat is below 150 °C (air preheat for natural draftheaters is unlikely to be above 150 °C) and when theburner is fired with a typical refinery fuel gascontaining about 50% hydrogen. If the hydrogencontent were to increase above 80% then NOxwould increase. However, this level of hydrogen isnot very likely in an oil refinery’s fuel gas system.Slightly higher NOx emissions occur when firingnatural gas with cold air, typically about100 mg/Nm3 . If the burner is fired on natural gasand air is preheated to 150 °C, then NOx levels arelikely to rise to 115-120 mg/Nm3. Fire boxtemperatures above 900 °C will also have quite aneffect on achievable NOx levels; the amount ofincrease depends on the fuel specification, the heaterdimensions and hence the heat liberated per unitvolume.
In the case of forced draft heaters, 80 mg/Nm3 isagain achievable with ultra-low NOx burners whenfiring on refinery fuel gas. Emissions of NOx doincrease if air preheat temperatures increase above150 °C, if the hydrogen content goes above 80%, orif there are elevated fire box temperatures.
For natural gas firing with ultra-low NOx burners inforced draft heaters, NOx emissions will typically be
100 mg/Nm3 . Again NOx will increase under theconditions described above.
Generally, natural gas firing with ultra-low NOxburners in both forced or natural draft conditionsmay show signs of instability at some points,particularly at low turndown and low excess air.Care needs to be taken during the installation ofthese burners. Burner testing to explore the limits ofcombustion prior to site installation is highlyrecommended for reliable operation.
To date, no low NOx burners have been developedfor burning residual fuel oil which give NOx valuesas low as those from gas firing, since NOx arises notonly from the combination of nitrogen and oxygenat high temperatures but also from the nitrogencompounds in the liquid fuel. Firing low NOxburners with fuel oil containing 0.3% wt nitrogenwill typically produce about 450 mg/Nm3 of NOx,this being from both thermal NOx and from thenitrogen compounds in the fuel. A typical 0.02% ashin the fuel gives rise to 50 mg/Nm3 particulates,comprising about 20 mg from the ash and 30 mg ascarbon produced from combustion. However, atturndown and when firing fuel oil with high ash,nitrogen and asphaltenes present, the NOx can riseto 700-800 mg/Nm3 and carbon particulates willalso increase.
RFG F.O.COMBUSTION
PROCESSESFCCU FLARE OTHER
REFINERY(THROUGHPUT)
(ON STREAM HOURS)
SRU(THROUGHPUT)
(ON STREAMHOURS)
SULPHUR EMISSIONS TO ATMOSPHERE
SULPHUR IN CRUDE
SULPHUR IN FUEL (BOUGHT IN)
ACID GAS
SWS GAS
SOLID SULPHUR
SULPHURIN PRODUCTS
SULPHURIN SOLID WASTES
REFINERY CONTROL SURFACE
SULPHUR EMISSIONSTO WATER
S. PLANT CONTROLSURFACE
NOTE : DATA REQUIRED FOR EACH STREAM IS MASSFLOW RATE AND MASS FRACTION OFSULPHUR IN THE STREAM.
FREQUENCY OF REPORTING SHOULD BEMONTHLY AND OVERALL REPORT YEARLY

R&D Publication 2153
For oil firing there is a direct link between NOx andparticulates, i.e. a reduction in NOx as the flametemperature falls will lead to an increase inparticulates. For low NOx fuel oil burners, as withconventional fuel oil burners, further reduction ofthermal NOx results in an increase in carbonparticulates.
Gas v. oil fir ing
As an example of the relative potential for gas andoil to generate NOx, in one UK refinery in 1996approximately 42 000 tonnes of fuel oil wascombusted producing 360 tonnes of NOx, whereasfiring 130 000 tonnes of refinery gas produced about350 tonnes of NOx, a ratio of about 3:1 in favour ofgas. NOx factors (NOx produced per tonnes of fuelcombusted) used by some refiners to report NOxemissions indicate NOx from oil firing to be two tothree times that from gas firing. However, factorsfrom other refiners, particularly those based on stackmonitoring, indicate that NOx from oil can be asmuch as five or six times that from gas.
The amount of refinery gas combusted by refineriescompared with residual fuel oil, in terms ofmegawatts fired, is typically 60% refinery gas to40% fuel oil. However, data from the PublicRegister for 1996 show that, on some refineries, theamount of fuel oil fired can approach 60%.
If there were to be a significant increase in theamount of residual fuel oil burnt on refineries,possibly because of the predicted increase in surplusfuel oil and the likely decrease in refinery gasavailable, then NOx emissions have the potential torise significantly. Even if the sulphur in the fuel oilwere to be reduced to a very low level in order toreduce emissions of SO2, the amount of NOxproduced would remain high, relative to thatachievable by gas firing, even if low NOx burnerswere fitted. This is due to the present lack of asuitable, similarly effective, low NOx fuel oil burnercompared to low NOx gas burners.
Other NOx reduction processes
Using recirculated flue gas as part of the combustionair can further reduce NOx formation but theprocess is difficult to control especially duringturndown, and the necessary plant modificationswould be likely to incur excessive cost. Thereforeusing recirculated flue gas is not consideredappropriate for refineries.
Control of NOx in gas turbine combustors is carriedout by using low NOx burners and/or steam/waterinjection. However, steam or water injection andflue gas recirculation have not been applied toboilers and furnaces on UK refineries due to the
technical difficulties, cost and the preferred solutionof using low NOx burners.
Costs for reburnering a typical crude oil furnacewith low NOx burners consisting of 40 forceddraught burners would be approximately £2 million.This would include the general upgrading of thefurnace air, fuel and control systems likely to becarried out at the same time by a refiner.
5.4.3 Downstream Flue Gas Abatement of NOx
A number of licensed selective catalytic reduction(SCR) processes are available. NOx removalefficiencies are typically between 80% and 90%.The process operates on the principle of reducingNOx to nitrogen and water using ammonia over acatalyst, the ammonia being injected into the fluegas upstream of the catalyst. The catalytic reactionusually requires a temperature range of 260 °C to600 °C in which to operate effectively. This meansthat the location of the catalyst in the flue gassystem is important and may restrict its applicationin some cases. However, lower temperature SCRprocesses are now becoming available which willoperate closer to a typical flue gas stacktemperatures of about 100 °C. Pressure drop can bean important consideration as to whether SCR canbe applied to a flue gas system. For this reasonnatural draft furnaces could probably not be fittedwith it.
SCR is used extensively on power plant in Japanand Germany and on gas turbine plant in Californiain the USA. However, to date it has not been widelyused on refinery plant although it has beensuccessfully applied to an FCCU in Sweden.
Typical installed costs for SCR equipment for therange of flue gas flows listed in Table 5.2 are givenin Table 5.3.
Thermal NOx reduction processes, sometimes calledselective non-catalytic reduction (SNCR) are alsoavailable. These operate by injecting ammonia intocombustion gases at temperatures ranging from870 °C to 1100 °C. This high temperaturerequirement means this process is less likely to beapplicable to refinery plant. However, it has beenapplied in Japan on an FCCU where a CO boilerprovides a sufficient temperature window.
Wet NOx scrubbing has advantages including lowercapital cost, if installed in conjunction with SO2 wetgas scrubbing. A separate spray tower is usuallyrequired prior to the main SO2 absorption spraytower. An additive applied in this extra toweroxidises the NO to NO2 which is then absorbed withthe SO2.

R&D Publication 2154
5.5 Par ticulate Abatement
Particulate loads from refinery combustion plant arenormally fairly low unless heavy residues are burnt.Particulate loads are highest from FCCUregenerators, where they can reach 200-600 mg/Nm3
as coke fines. Particulates may be abated using anumber of methods including electrostaticprecipitators (ESP), bag filters and wet scrubbing, asalready described above.
It is unlikely that bag filters would be favoured forrefinery processes such as FCCUs due to theirpressure drop, the potential for ‘blinding’ of thebags, the large plot space required and their inabilityto cope with upset conditions. A similar problem ofbag blinding can arise from ‘sticky’ soot particlesfrom boilers when burning fuel oil. Therefore,except where wet scrubbing is employed to removeboth SO2 and particulates, ESPs are likely to be thefavoured abatement technique as they are best ableto cope with upset conditions. Typically they shouldachieve about 50 mg/Nm3 release, but it should benoted that recovery efficiency of dust from FCCUflue gas in ESPs may in certain cases be lower thanexpected due to the high and varying resistivity ofthe catalyst dust. Typical installed capital costs forESPs for the range of flue gas flows set out inTable 5.2 are between £1 million and £3 million. Asan alternative, the use of ceramic filters on cycloneunderflow systems would also probably achieveabout a 50 mg/Nm3 release. Ceramic filters designedto filter the complete gas stream have not yet beeninstalled on refinery FCCUs.
5.6 CCGT/CHP Facilities
A number of refineries have, or are currentlyinstalling, combined cycle gas turbine (CCGT) orcombined heat and power (CHP) plant, designed toproduce steam and power for the refinery. This isusually done to replace in whole or part old oil-firedboiler plant, to reduce operating costs and todecrease reliance on the National Power generators.Where this occurs the Environment Agency maywish to consider a refinery’s emission levels, to theextent that substitution of power from the NationalGrid is taking place, hence reducing emissions fromthe power sector.
The fuel for this type of facility is usually naturalgas from the National Transmission System (NTS).However, refiners are likely to investigate thepossibility of also firing refinery gas as part of thefuel slate, thus potentially reducing the amount ofrefinery gas available for combustion in boilers andfurnaces.
Most turbines require a particularly stable mix offuel in order to be sure of flame stability and arebasically designed to burn natural gas. Refinery fuel
gas components can vary considerably, especiallywhen surplus hydrogen is produced, such as when ahydrotreatment unit is temporarily shut downresulting in excess hydrogen being set to the fuel gassystem. However, these problems can usually beovercome, up to a limit of about 70% hydrogen inthe fuel.
5.7 VOC Abatement
Very little data exist on the Public Registerregarding VOC releases, although returns are madeto UKPIA by refiners.
Most VOC abatement/improvement is made byrefineries on an ongoing basis and therefore it isdifficult to cost this specifically. The EnvironmentAgency may wish to consider asking refiners tomake returns to them and to set annual targets basedon continuous improvement. A number of refineriesoperate a LDAR system, though some do not. Asystem for monitoring approximately 3000 refinerycomponents (primarily pump seals, valves in highliquid vapour pressure or gas services, and road/railloading) is estimated to cost about£70 000 excluding modification of poorly-performing equipment and cost of labour.
5.8 Effluent Water Treatment
5.8.1 Minimisation of Wastewaters
Conventional refinery practice is to bringappropriate wastewater streams together and providea common treatment plant. The size and complexityof such plant may be reduced by employing wasteminimisation techniques and the treatment of certaindifficult wastes at their source. In addition, thesetechniques may serve to remove problems ofdisposal of solids and/or gaseous emissions whichwould otherwise be formed during the wastewatertreatment process. Waste techniques fall into threecategories namely (listed in priority order) sourcereduction, recycling, and treatment, althoughrecycling may also take place after treatment.
5.8.2 Source Reduction
For refineries, a typical source reduction techniquewould be the provision of facilities and training ofpersonnel in housekeeping techniques to preventaccidental spillages and leaks or reduce theexcessive use of water during cleaning activities.Also included in this category are energyconservation methods, improved effluent flowcontrol, upgrading equipment and optimisingoperating conditions. This could includeoptimisation of sour water stripper performance toreduce the number of upsets at a particular refinery.The smoothing out of run-down from tankage toprevent ‘peaks’ of contaminants, such as phenols
R&D Publication 2155
and sulphides which could kill the biomass in awastewater treatment plant, and the segregation ofclean and contaminated process streams, are furtherexamples of source reduction techniques.
5.8.3 Recycling
Recycling and reuse of materials is exemplified on arefinery by the recycling of sour water stripperbottoms to the desalters. There is a tendency forpollutants, particularly phenol, to be reabsorbed bythe crude oil depending on the operating pH.
5.8.4 Treatment
Wastewater treatment processes fall into three maincategories as follows:
• Primary treatment
This consists of the simple separation of gross oiland solids content using techniques such as APIseparators and plate interceptors (tilted orcorrugated).
• Secondary treatment
More advanced separation of oil and solids contentusing techniques such as flocculation, air flotation(dissolved or induced), sedimentation and filtration(gravity or pressure).
• Tertiary treatment
Treatment of residual and dissolved pollutants usingtechniques such as biological processes, aerationand final polishing.
A key aspect in the operation of treatment plant isthe need for refineries to balance the effluent watersbefore they enter the wastewater treatment plantitself, and particularly upstream of the biologicaltreatment stage. This could help to eliminateexcursions from discharge consents caused byprocess upsets which, at worst, could kill off the‘bug’ population in the bioplant.
There may be need for pretreatment of a very strongwaste stream upstream of the effluent treatmentplant, such as a sour water stripper waste stream, orspent caustic from sweetening operations.
Four types of spent caustic arise from these types ofoperations.
• Sulphidic spent caustic from sulphide andmercaptan removal operations such as LPGprewash.
• Phenolic spent caustic from treatment of FCCUproduct hydrocarbons such as FCCU gasoline.
This includes the removal of acid oils (cresolsand xylenols), organic acids and phenols.
• Naphthenic spent caustic from the treatment ofkerosene and diesel cuts.
• Chloride spent caustics from the removal ofchlorides and pH control techniques.
Release of these types of streams directly into theeffluent treatment plant may cause a number ofproblems including the release of mercaptans andhydrogen sulphide gases and associated odours atthe wastewater treatment plant. These problems canbe resolved by pretreatment of these streams.
All refineries in England and Wales use primarytreatment processes. Most are now employingsecondary and/or tertiary treatment to improve thefinal effluent quality.
5.8.5 Future Situation
Toxicity testing
From information obtained from the Public Registerand from conversations held with IPC Inspectors,the underlying trend is for the tightening ofdischarge standards for oils and oxygen demand(COD, TOC, BOD) in the UK. It is thereforeanticipated that refineries without biotreatment willneed to install it in the near future. Wastewatertreatment requirements will also be influenced bythe introduction of direct toxicity assessment (DTA)techniques in the UK. A large pilot study iscurrently under way to assess a revised protocol forusing DTA as a technique for water qualitymanagement. The intention is to use DTA on aprioritised basis to help improve receiving waterswhere toxicity is perceived to be a significantcontributory cause of poor water quality. Thecurrent proposals address acute (short exposure)toxicity only. Tests for chronic (long exposure)toxicity may be developed in the long term. Anumber of the refineries have carried outecotoxicological testing themselves, on currenteffluent discharges by methods such as Microtox.The new toxicity testing may only impact dischargesto certain selected rivers/estuaries. Refineries thatare affected may, depending upon the nature of theireffluent, need to add final polishing, such as carbonfilters, to their treatment schemes to achieve therequired quality of discharges. These could consistof traditional GAC (granular activated carbon) ormore unusual systems such as walnut or coconutshells.

R&D Publication 2156
Ammonia
A number of improvement notices have called for areduction in ammonia discharge levels. Biologicaltreatment will achieve the required reduction, butusually with an increase in nitrate levels. It isanticipated that future legislation may require thereduction of levels of nitrogen in discharges tocertain receiving waters including the North Sea.This will probably mean that there will be a shiftfrom legislating for nitrogen as ammonia tolegislating for total (Kjeldahl) nitrogen. This maymean that the existing biotreatment systemscurrently used by some refineries may need to beupgraded or additional chemical treatment employedto convert the nitrogen further.
VOCs and odours
It is anticipated that future reductions in VOCs fromrefineries will encompass areas such as thewastewater treatment plant where long residencetimes in open ponds or API separators (separatorsdesigned to guidelines set out by the AmericanPetroleum Institute) lead to potentially high levels ofhydrocarbons and odorous gases being released.These are often a cause of complaint. A number ofrefineries in the USA and Europe use either floatingor fixed covers on their API separators to minimisethese emissions. The replacement of open pondswith storage tanks is recommended by the USEPAin their EPA Sector Notebook Project. The drive toreduce VOCs may also encompass the use of coverson flotation units. This may influence the selectionof IAF (Induced Air Flotation) units above DAF(Dissolved Air Flotation) since the former areenclosed units. It should be noted that these unitsdiffer in their mechanism for removing impuritiesfrom the effluent. DAF units are generally held to bemore efficient than IAF units. However, with acorrectly-designed treatment scheme usingbiological treatment as the next step, little change infinal effluent quality will be observed.
Oil in water testing
A number of different techniques exist for analysingoil in water, including the use of two or three peakinfra-red analysis with or without filtration throughFlorisil. Results obtained using Florisil should notbe compared with those that do not use thischemical during testing. Each technique willproduce different measures of oil in water,particularly where there is a significant quantity ofaromatics present in the effluent sample. Aromaticcomponents would require treatment by biologicaltechniques. It is recommended that data placed onthe Public Register should include the test methodand the determinants to enable meaningfulcomparisons to be made.
Estimated order of magnitude costs for abatement ofwastewater releases are given in Table 5.3.
5.9 Summary of Costs of Abatement Plant
Table 5.3 summarises the estimated installed andoperating costs for some of the abatement plant andtechniques discussed above. They are battery limitcosts based on 1998 prices and include such items asequipment, licence fees, foundations, erection, tie-insto existing plant, and commissioning. They are anorder of magnitude only. Site-specific factors such aslayout, available space, and necessary modificationsto existing plant could have a significant impact. Insome cases these factors might be expected toincrease the costs by some 50%.

R&D Publication 2157
Table 5.3 Summary of possible abatement plant capital and operating costs for refiner ies
Abatement Plant size range Approximate capitalcost (£million
installed)
Approximate operatingcost per annum (£million)
(a) Upgrade of refinery amine treatmentsystem to meet 0.01% to 0.02% v/v ofH2S in fuel gas
UK refineries 3-6 per refinery (negligible increase inexisting operating costs)
(b) Wet flue gas scrubbing (SO2 andparticulate removal)
Flue gas flows200 000 Nm3/hr to650 000 Nm3/hr
612
12.5
(costs are mainly for causticsoda)
(c) Reburnering of furnaces and boilers withlow NOx burners plus upgrade
Crude oil furnace with40 burners
2 N/A
(d) SCR Flue gas flows150 000 Nm3/hr650 000 Nm3/hr
3/58/14
0.52
(costs are mainly forammonia)
(e) Electrostatic precipitator Flue gas flow150 000 Nm3/hr650 000 Nm3/hr
1.53.5
0.1
(f) SRU including tailgas treatment unit(TGTU) to give >99% S recovery
50 t/d100 t/d250 t/d
101528
New SRU operating costapproximately equal to
existing costs
(g) Tailgas treatment unit to improve SRUrecovery to 99%
99.8%
50 t/d100 t/d250 t/d
50 t/d100 t/d250 t/d
1.31.72.3
2.83.55.0
Operating cost relatively low
(h) Upgrade SRU with O2 enrichment toincrease throughput from 100 t/d to170 t/d
100 t/d 1.7-4.5(2) 1.3 (costs are for oxygen)(2)
(i) Use of LPG in lieu of fuel oil As appropriate to eachrefinery
Small, somereburnering
Cost differential betweenLPG and fuel oil of £81 per
tonne
(j) Use of natural gas in lieu of fuel oil As appropriate to eachrefinery
4 (for 10 km of 305mm pipeline plus some
reburnering)
Cost differential betweennatural gas and fuel oil of
£32 per tonne
(k) Use of 1% S fuel oil using typicallyatmospheric residue of North Sea crudein lieu of vacuum residue
As appropriate to eachrefinery
(Minimal) Cost differential betweenatmospheric and vacuum
residue approximately £63per tonne
(l) Installation of secondary and tertiary(biological treatment plant assuming APIseparators are installed(3)
8-10
(m) Installation of sand filters and carbonfilters (for final effluent polishing)(3)
5
(n) Installation of covers on an API separatordesigned to handle 1135 m3/hr effluentwith 10 000 ppm oil and grease(3)
0.42

R&D Publication 2158
Notes:
(1) Typical costs for hydrotreatment are provided in Table 5.1.
(2) Capital cost variation depends on complexity of installation and existing plant condition. Operating cost will vary depending on source ofoxygen; cost given is for liquid oxygen purchased. Costs will reduce for leased oxygen plant and further still if a pipeline supply available.
(3) Reference used is the Guidance for Operators and Inspectors of IPC Processes, Effluent Treatment Techniques. Environment Agency,1997.

R&D Publication 2159
6. POLLUTION REDUCTION STRATEGIES
6.1 General Considerations
This Chapter analyses a number of possibleabatement options (strategies) that could be adoptedby refineries for reduction of polluting releases. Theoptions selected are based on the discussions in thepreceding sections of this Review. The effectivereduction resulting from application of each optionis presented together with the economic cost of theoption in terms of cost per barrel of oil processedper year by the industry. Capital and operating costsfor abatement plant used in the analyses are thoseprovided in Section 5.9.
There are also a number of abatement possibilitieswhich deserve consideration but which do not formpart of the abatement options considered. These arediscussed in 6.1.1 to 6.1.5 below.
6.1.1 Hydrotreatment
The type of hydrotreatment an operator may selectwill be very specific to the refinery. As identified in5.2.1 FCCU feed hydrotreatment would be a majorand expensive part of any upgrade and therefore it isnot seen as a strategy which can be reasonablyapplied solely for abatement purposes. Nevertheless,where refiners choose to invest in it to meet 2005product specifications it would reduce releases ofSO2 from the regenerator by about 90%. Further, ifthe refiner chooses to combust the fuel oil from anFCCU complex which included a feed hydrotreater,it would also assist in reducing the sulphur contentof the total fuel oil fired on the refinery.
Whatever type of hydrotreatment the refiner selectsto meet the 2005 fuel specifications some increase inemissions will occur as the process requiressignificant energy inputs. The amount of increase inCO2 from all UK refineries that will occur due toextra hydrotreatment has been estimated at between2% and 4% of current levels depending on fuelfired.
6.1.2 Sulphur Balance and Sulphur Recovery
In Sections 3.3 and 5.3 it was noted that:
• A number of refineries are firing fuel gas whichis in excess of 0.05% v/v sulphur. Aminetreatment of refinery fuel gas will reduce thesulphur content. Hence low sulphur contentrefinery fuel gas ought to be achievable by allrefineries at relatively low cost with theresultant lower SO2 emissions, see Table 5.3.
• Gaseous overheads from SWSs are in somecases not being piped for processing to asulphur recovery plant. In a few cases this
stream may be very low in sulphur but in mostcases it is expected to be significant andtherefore sulphur recovery should be applied tothese streams.
• Existing sulphur recovery plants in some casesexhibit operational problems such as lack ofspare capacity, poor performance duringturndown and poor reliability.
Best practice elsewhere in the world includes; firingof clean, very-low-sulphur fuel gas in furnaces andboilers; recovery of all sulphur-bearing gaseousstreams; and highly efficient sulphur recovery units.Some UK refineries are already close to meetingthese standards and in others improvements in thisarea are currently taking place. Others appear to besome way off meeting these best practice standardsThe lack of definitive data from the Public Registeron sulphur balance information has meant that it hasonly been possible to make broad assumptionsregarding existing sulphur abatement measures,especially related to sulphur plant performance. Ithas therefore not been possible to fully developabatement options in this area. Advice has beengiven in Section 5.3, as to the data that refinerswould need to supply to fully assess refinery andsulphur recovery plant performance. If this sulphurbalance data were to be provided by refiners, the fulleffects on releases of carrying out improvementmeasures could be better assessed. Typical costs forpotential abatement measures are given in Table 5.3.
6.1.3 Replacement with Low NOx Burners
This is ongoing and well advanced at most refineriesalthough, as noted in Chapter 4 not all refinerieshave low NOx burners installed in all theircombustion plants or have plans to retrofit them.Because of this wide variation in application, lowNOx burner installation has not been analysed aspart of the abatement options although typical costsfor furnace reburnering are given in Table 5.3.
6.1.4 Liquid Effluent Pollutants
As already noted, the data available from the PublicRegister are limited in terms of both the number ofsites reporting mass release data and thedeterminants reported. Where data are given, thereis no explanation of assumptions that have beenmade, making it difficult to analyse and comparedata. It has therefore not been possible to developmeaningful liquid effluent abatementoptions/strategies for refineries as a whole. Section5.8 includes information of current practices, trends,costs and likely abatement requirements regardingeffluent discharges.

R&D Publication 2160
6.1.5 Current Emission Limits
Data from the Public Register indicate that 1996release limits are in some cases considerably higherthan actual releases, particularly in the case ofemissions of SO2. While there may be good reasonsfor this, it is calculated that if refineries were tooperate closer to these limits, a potential increase of103 082 tonnes per year of SO2 and 16 549 tonnesper year of NOx could occur. However, any revisedlimit levels would need to take account of a numberof factors including a refinery’s complexity,particular processing scheme, and current crude andproduct slates.
In this connection, all UK refineries in 1996 wereprocessing North Sea crude oil to a greater or lesserdegree and are expected to be processing it for theforeseeable future. If refiners subsequently wishedto process sourer crudes, for example because theybecome cheaper, a view could be taken that theyshould install the extra abatement necessary, ratherthan have a limit level that automatically permitsthis.
However, in this type of situation the EnvironmentAgency should be aware of unfair advantages whichmight result from any across-the-board reductions inlimit values closer to the level of current emissions.For example, in the case where heavy high sulphurcrude becomes cheaper those refineries which donot already process heavy crudes would have toinstall abatement plant to remain within thetightened emissions limits. Refineries which alreadyprocessed in part heavy, high sulphur crude wouldhave no incentive from their revised limits toimprove abatement and they could more readily takeadvantage of the reduced price for heavy, highersulphur crudes.
6.2 Options for Reductions of Releases to Air
Initially four possible pollution reduction strategies,or options, were evaluated for the effect they wouldhave on emission of pollutants and their cost to therefineries. Although each one provided significantabatement none, of them met the requirements offorthcoming legislation from the EU, covering newNational Emission Ceilings which are based on theCOA. The requirements of this EU legislation aremarkedly more demanding when compared with EUDirectives currently in force. A fifth option wastherefore developed with the aim of meeting therequirements of this future legislation. Consequentlythis fifth option represents a step change from thefour options initially developed.
Typical costs for installation and operation of plantand equipment needed to implement each of theoptions across the UK refinery sector have beenestimated based on the cost data given in Table 5.3.
Capital costs for each abatement option have beenamortised over a five- year period. Annual operatingcosts for the corresponding option have then beenadded to give the total abatement cost per annum foreach refinery. This figure has been divided by theannual nominal crude oil throughput of the refinerysector to give an abatement cost for the UK industryper barrel of oil processed by it as a whole. The totaleffectiveness of each abatement option across allrefineries has been evaluated.
Note that in order to assess the costs andeffectiveness of each abatement option for the UKrefinery sector as a whole it has been necessary tomake similar individual assessments for eachrefinery and then to aggregate each one. The data forindividual refineries are not included in this Reviewdocument.
It should not be assumed that each option cannecessarily be applied to every refinery. There maybe good practical reasons, known only to the refiner,why certain options cannot be undertaken. However,it is considered that on the whole each option wouldbe practical on most UK refineries and overallwould generally cost the sums of money indicated.
Each of the five options is described below.
Option 1 Reduction of sulphur in fuel oil
This option entails the reduction of the sulphurcontent of fuel oil fired in combustion processes to1% sulphur or less. This level is in line with an EUdraft Directive 97/0105 (SYN) (although, ascurrently drafted, the Directive will not restrictsulphur content in fuel oil fired in refineries or largecombustion plant on the basis that flue gasabatement is assumed by the EU to be applied inlieu and to be more cost effective (see Section2.2.5)).
This reduction of the sulphur content of fuel oilwould reduce emissions of SO2. The degree ofreduction would mainly depend upon the amount offuel oil currently fired and also the actual fuel oilsulphur content. In this respect the sulphur contentof fuel oil for UK refineries ranges from 0.4% to2.9%. The proportion of fuel oil being fired variesfrom 20% to 75%, with one refinery not firing fueloil at all. Similarly, fuel gas sulphur content rangesfrom 0.05% to 0.56%, with the percentage of fuelgas fired varying from 25% to 100%. One UKrefinery fires almost all fuel gas and therefore thishas not been included in the analysis of Option 1.Another refinery fires fuel gas with an elevatedsulphur content but already meets the 1% sulphur infuel oil; in this case the sulphur reduction in therefinery fuel gas has been considered in lieu of thefuel oil sulphur reduction. Two other refineries are
R&D Publication 2161
already meeting the 1% sulphur in fuel oil andtherefore are also not included in the analysis.
In order to evaluate a cost per barrel forimplementing this option it has been assumed that1% S fuel oil can be attained by firing North Seaatmospheric residue in lieu of vacuum residue.However, each refinery may have different means ofattaining 1% sulphur or less in fuel oil. Theapproximate cost differential between these twotypes of oil is shown in Table 5.3 and this cost hasbeen used in the calculation.
Option 2 - Substituting fuel oil fir ing with LPGor natural gas (NG)
Maintaining fuel gas firing and substituting fuel oilfiring with either liquefied petroleum gas or naturalgas would result in reductions of SO2 and heavymetals, as both sulphur and metals are essentiallyzero in these fuels. Reductions in CO2, NOx andparticulates would also result for the reasonsdescribed in Paragraph 3.2.1.
As already noted, the difference in NOx productionbetween fuel oil burners and gas burners varies andthere are a wide variety of NOx factors currently inuse for these fuels. This option has therefore usedtwo estimates of the reduction which might beachieved by changing from oil to gas firing, namelya 2.5 times reduction and a 3.5 times reduction.These numbers therefore represent minimum andaverage reductions respectively. Any largerdifference in NOx production potential would seegreater benefits in NOx reduction from switching togas firing. The evaluation also used the proportionsof fuel oil fired on each refinery.
Costs accounted in this option are those resultingfrom diverting saleable LPG to combustion on therefinery (£131/t) and, alternatively, the cost ofpurchase of natural gas (£82/t) from the NationalTransmission System (NTS), less the cost of the fueloil saved at typically £50/t. An interconnecting gaspipeline capital cost as shown in Table 5.3 has alsobeen included for each refinery. Some of therefineries already have a connection to the NationalTransmission Grid; however, it has been assumedthat the facility will need upgrading. Two refineriesin South West Wales are a considerable distancefrom the NTS. As mentioned in Option 1, onerefinery already fires almost entirely fuel gas andhas not therefore been included in the evaluation ofthis option.
Option 3 - Abating key stacks on a refinery usingwet gas scrubbing (WGS)
This option was applied to all UK refineries. Fluegas abatement has been assessed for key stacks oneach refinery, typically combustion stacks and
FCCU stacks. The stacks chosen were those withhigher pollutant concentrations, flows and/or largefuel oil usage. Typically two stacks were selectedfor each refinery. It was not possible to checkwhether these selected stacks have the physicalspace around them to be able to install the clean upequipment, and this uncertainty should be regardedas a limitation to this option.
Wet gas scrubbing in twin absorption towers usingcaustic soda has been assessed, although otheralkalis, e.g. Mg(OH)2, could be used. It should benoted that although caustic soda is relativelyexpensive as a chemical, this system is flexible interms of the wide range of applications with which itcan be used and the multiple emissions that it canscrub. The system, suitably designed, will typicallyabate NOx by about 70%, SO2 by about 90%,particulates by about 90%, and virtually all CO2. Itwill also abate heavy metals to some degree throughremoval of particulates. Selenium, cadmium andmercury with higher vapour pressures wouldprobably be less effectively abated than other heavymetals.
Wet gas scrubbing produces a water effluent whichshould be treatable in most existing refinery effluenttreatment systems without the need for majorexpenditure to cope with the added load. Capital andoperating costs used are shown in Table 5.3. Thecost of the different sizes of plant necessary tohandle the flow from various selected stacks wascalculated using the cost estimating 6/10 rule Costof new = Cost of known [throughput ofnew/throughput of known]0.6
Option 4 - A combination of Options 2 and 3
The fourth option considered was a combination ofOptions 2 and 3, above. Fuel oil, higher than 1% S,would continue to be fired in the furnaces or boilerswhose stacks were abated with wet scrubbing, butrefinery gas supplemented with LPG or natural gaswould be burnt in all other combustion units whereabatement was not applied. Costs for this option arethose used in Options 2 and 3.
At one refinery virtually no fuel oil is fired so that inthis case, effectively, only Option 3 applies. Foranother refinery only the FCCU regenerator stackwas selected for scrubbing. For this refinery Option4 included the scrubbed FCCU stack only with allcombustion plant being fired on gas.
Emission reduction effects under this option will besimilar to those in Option 2 although SO2 andparticulate emissions will be marginally higher thanin Option 2, and CO2 and NOx emissions will bemarginally lower.

R&D Publication 2162
Option 5
Option 5 has been developed with the aim ofmeeting the requirements currently set out in theEU’s proposed Communication on Acidification(COA) and the Large Combustion InstallationsDirective (LCID).
Postscript
This proposed EU legislation has recently beenmodified as noted in Chapter 3.
In the development of this fifth option a number ofpoints should be noted.
• It is assumed that if the COA and LCID wereimplemented as they currently stand that therefinery sector would be required to providecorresponding reductions from its operations.The extent of these reductions has beenidentified in Tables 2.5 and 2.7 of Section 2.6after making the allowance for recent andprospective refinery closures.
• The emission sources covered by the proposedLCID constitute most, but not all, refineryreleases to air. The COA would be applicable toall refinery releases. Therefore in developing apollution reduction strategy that will broadlymeet both these pieces of prospective legislation,the LCID was considered initially followed bythe COA.
• In developing this option an assumption has beenmade that a small number of refiners may installFCCU feed hydrotreatment as part of their plansto meet the 2005 fuel specifications. As notedabove, installation of FCCU feed hydrotreatmentwould significantly reduce SO2 releases from thistype of refinery unit.
• Costs of FCCU hydrotreatment have not beenincluded as this investment would be primarilyadopted to meet 2005 product specificationsrather than for abatement reasons. At threerefineries, modifications to the sulphur recoverysystem have been implemented since 1996.These costs have been included.
• On the basis of 1996 emissions data, closure ofthe Gulf, Llandarcy and Shell Haven refinerieswill reduce total sector NOx and SO2 emissionsby 11% and 13% respectively. Reductions forlarge combustion installations (taken as boilers,furnaces and gas turbines) for NOx and SO2emissions due to the closures will be 15% and21% respectively. These closures mean that inorder to meet the sector reduction requirementsof the legislation total refinery emissions willneed to be reduced by 89% for SO2 and 63% for
NOx, and that large combustion installationsneed to reduce 1996 emissions of SO2 by 94%and NOx by 85%.
• As with Options 1 to 4, annual costs have beencalculated on the basis of the combination ofcapital costs amortised over five years plusannual operating costs.
In order to achieve the high levels of emissionabatement required for 2010 it has been estimatedthat the following is generally typical of themeasures refiners would need to adopt to achievethe required SO2 and NOx reductions.
(a) All combustion plant to be fired on clean (zerosulphur) gas with ultra-low NOx burners.
(b) SCR to be fitted to all major furnaces andboilers, subject to space and pressuredrop limitations, as already discussed.
(c) Recovery of all waste gas streamscontaining sulphur for processing in thesulphur recovery unit.
(d) Sulphur recovery units operating at 99.9%recovery efficiency with spare capacityavailable during SRU shutdown.
(e) FCC feed hydrotreatment fitted to major FCCUson two refineries, as part of plans to achieve2005 fuel specifications, and wet gas scrubbingfitted to remaining FCCUs.
(f) Use of high integrity trip systems, in refineryprocess control operations and the recovery ofwaste gas streams, to minimise the frequencyand quantity of releases from flares.
Based on the current level of abatement applied atUK refineries, together with data from the PublicRegister, it has been estimated that the abatementmeasures set out in Table 6.1 would provide thenecessary reductions.
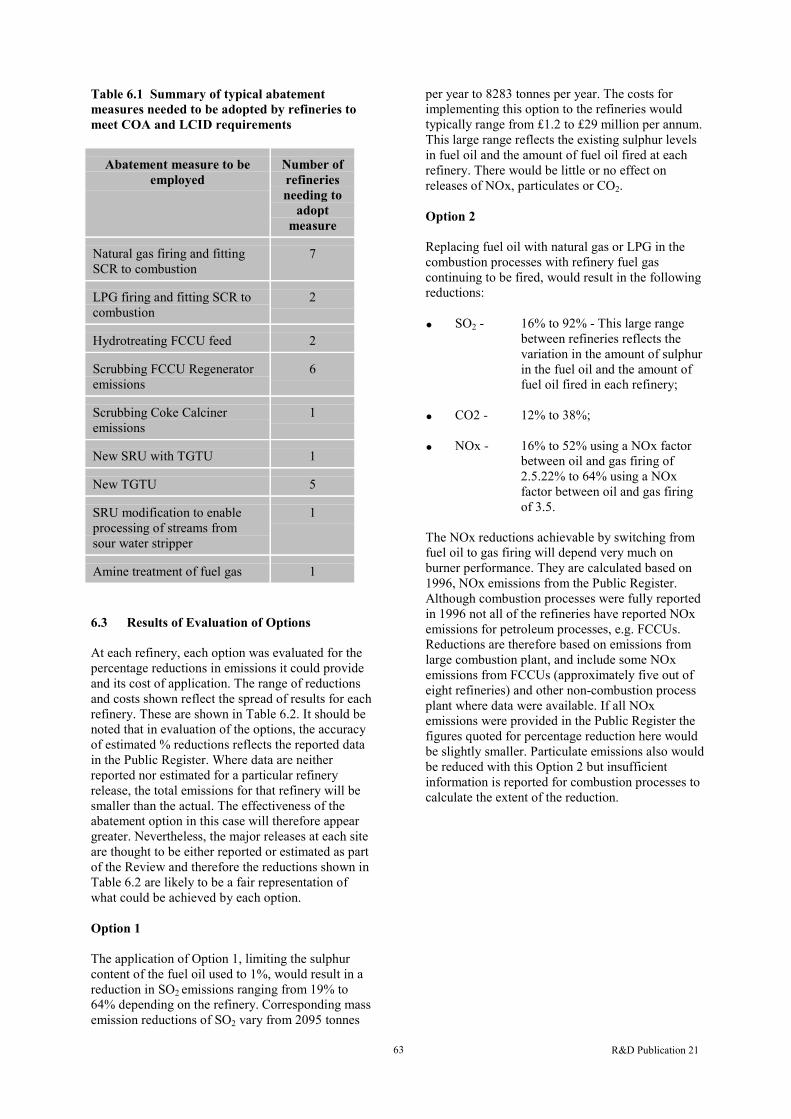
R&D Publication 2163
Table 6.1 Summary of typical abatementmeasures needed to be adopted by refiner ies tomeet COA and LCID requirements
Abatement measure to beemployed
Number ofrefiner iesneeding to
adoptmeasure
Natural gas firing and fittingSCR to combustion
7
LPG firing and fitting SCR tocombustion
2
Hydrotreating FCCU feed 2
Scrubbing FCCU Regeneratoremissions
6
Scrubbing Coke Calcineremissions
1
New SRU with TGTU 1
New TGTU 5
SRU modification to enableprocessing of streams fromsour water stripper
1
Amine treatment of fuel gas 1
6.3 Results of Evaluation of Options
At each refinery, each option was evaluated for thepercentage reductions in emissions it could provideand its cost of application. The range of reductionsand costs shown reflect the spread of results for eachrefinery. These are shown in Table 6.2. It should benoted that in evaluation of the options, the accuracyof estimated % reductions reflects the reported datain the Public Register. Where data are neitherreported nor estimated for a particular refineryrelease, the total emissions for that refinery will besmaller than the actual. The effectiveness of theabatement option in this case will therefore appeargreater. Nevertheless, the major releases at each siteare thought to be either reported or estimated as partof the Review and therefore the reductions shown inTable 6.2 are likely to be a fair representation ofwhat could be achieved by each option.
Option 1
The application of Option 1, limiting the sulphurcontent of the fuel oil used to 1%, would result in areduction in SO2 emissions ranging from 19% to64% depending on the refinery. Corresponding massemission reductions of SO2 vary from 2095 tonnes
per year to 8283 tonnes per year. The costs forimplementing this option to the refineries wouldtypically range from £1.2 to £29 million per annum.This large range reflects the existing sulphur levelsin fuel oil and the amount of fuel oil fired at eachrefinery. There would be little or no effect onreleases of NOx, particulates or CO2.
Option 2
Replacing fuel oil with natural gas or LPG in thecombustion processes with refinery fuel gascontinuing to be fired, would result in the followingreductions:
• SO2 - 16% to 92% - This large rangebetween refineries reflects thevariation in the amount of sulphurin the fuel oil and the amount offuel oil fired in each refinery;
• CO2 - 12% to 38%;
• NOx - 16% to 52% using a NOx factorbetween oil and gas firing of2.5.22% to 64% using a NOxfactor between oil and gas firingof 3.5.
The NOx reductions achievable by switching fromfuel oil to gas firing will depend very much onburner performance. They are calculated based on1996, NOx emissions from the Public Register.Although combustion processes were fully reportedin 1996 not all of the refineries have reported NOxemissions for petroleum processes, e.g. FCCUs.Reductions are therefore based on emissions fromlarge combustion plant, and include some NOxemissions from FCCUs (approximately five out ofeight refineries) and other non-combustion processplant where data were available. If all NOxemissions were provided in the Public Register thefigures quoted for percentage reduction here wouldbe slightly smaller. Particulate emissions also wouldbe reduced with this Option 2 but insufficientinformation is reported for combustion processes tocalculate the extent of the reduction.

R&D Publication 2164
Table 6.2 Ranges in % reduction of emissions and costs for each option
Option 1 Option 2 Option 3 Option 4 Option 5
% SO2 reduction% NOx reduction (2.5)% NOx reduction (3.5)% CO2 reductionCost £ million/yr(1)
19-64n/an/an/a
1.2-29
16-9216-5222-6412-38
0.8-18.6
15-673-47n/a
2-711.1-6.95
21-9129-5737-6014-75
1.1-15.4
(2)(2)(3)(3)
6-31
(1) Annual costs are capital costs amortised over five years plus operating costs. (2) In line with the requirements of the proposed Communication on Acidification and Large Combustion Installation Directive
(see Section 2.6). (3) Not developed.
Costs have been calculated for the use of natural gasor LPG as follows:
• substituting with LPG, additional costs rangefrom £0.8 to £18.6 million per annum;
• if natural gas is used, total additional costs rangefrom £0.9 to £4 million per annum.
The additional costs include for capital andoperating costs as well as credit for the fuel oil notfired. The large range of costs reflects variousamounts of fuel oil combusted on differentrefineries.
Option 3
For Option 3 wet gas scrubbing was applied toselected stacks serving, large fired heaters, steamraising plant, or FCCU units. In general, two stackswere selected for each refinery, except where therewas not enough information available. Resultingrefinery reductions ranged as follows, the actualreduction again depending on the refinery:
• SO2 ranging from 15% to 67%;• NOx ranging from 3% to 47%;• CO2 from 2% to 71%;• particulates would be abated to some extent;• the total costs for this option would typically
range from £1.1 to £6.95 million per annum.
Option 4
The combination of Options 2 and 3 involves addingwet gas scrubbing to the same stacks as Option 3and firing only gas in the remaining unabated stacks.Reductions range as follows:
• SO2 reductions would be from 21% to 92%;
• NOx reductions as a minimum, would rangefrom 29% to 57% using a NOx factor betweenoil and gas firing of 2.5 as an average. Using aNOx factor of 3.5 they would range from 37%to 60%;
• particulates would be reduced, less than Option2 but more than Option 3;
• CO2 reductions would be greater than Options 2and 3 and would result in reductions from 14%to 75%;
• the total cost of this option with LPG wouldrange from £1.1 to £15.4 million, and if naturalgas was used from £1.1 to £9.9 million.
Aggregation of Options and likely best options 1 -4 at each refinery
Table 6.3 shows aggregated costs and effectivenessacross the refinery sector of applying each option atevery refinery. It also shows, for the refinery sectoras a whole, aggregated costs and effectiveness ofselecting the most cost Effective of Options 1 to 4(i.e. likely best option) at each refinery. In selectionof the best option at each refinery, SO2 emissionswere the initial consideration. In cases where thecosts were similar the lower cost option wasselected.
Costs and effectiveness of the likely best option ateach refinery were also aggregated to give optimalrefinery sector abatement and corresponding costper barrel of oil process by the refinery sector as awhole.
Aggregating the likely best option at each refinerygave a refinery sector SO2 emission reduction of64 040 tonnes per year, which represents a 52%reduction. The corresponding aggregated sectorannual cost is estimated to be £26.4 million per year,equivalent to £0.04 per barrel of crude oil processedannually by the sector.

R&D Publication 2165
Table 6.3 Summary of aggregate refinery sector industry costs and emission reductions for each option
Footnotes forthis table areon thefollowingpage
Option 1 Option 2(2) Option 3 Option 4(2) Aggregate of likelybest options
Option 5
LPG NG LPG NG
Cost ofabatement
Capital cost(£ million)
1.2 40 95.7 104 120.8 47.9 450
Operating cost(£million)
105.54 77.7 13.4 13.6 35 19 16.8 100
Total cost per year(1)
( £ million)106.74 77.7 21.1 32.7 56 43 26.4 190
Cost per barrel (£) 0.19 0.12 0.03 0.05 0.09 0.07 0.04 0.29
Reduction inemissions(3)
SO2 (%) 31 48 37 49 52 }
SO2 (t/y) 37 549 58 915 44 876 60 172 64 040 }
NOx factor used(4) 2.5 3.5 2.5 3.5 2.5 3.5 }
NOx (%) N/A 27 36 24 35 39 31 39 } (5)
NOx (t/y) 8296 10 961 7097 10 606 11 786 9305 11 831 }
Particulates (%) N/A 33 36 42 48 }
Particulates (t/y) 830 917 1082 1231 }
CO2 (%) N/A 19 30 37 21 }
CO2 (t/y) 2 857 874 4 541 341 5 562 595 3 176 315
R&D Publication 2166
Option 5
The total cost to the refinery sector of meeting therequirements of the COA and LCID, is £190million, which is equivalent to a cost of £0.29 perbarrel of oil processed by the sector.
Table 6.3 Basis of calculations
The following notes apply to the above table:
(1) Capital cost has been amortised over fiveyears, hence total cost per year is annualoperating cost plus one fifth of capital cost.
(2) Cost of LPG and NG has been discountedagainst the sale of the correspondingcalorific value of fuel oil.
(3) Percentage reductions for each abatementoption/strategy are based on 1996 releases.
(4) Different NOx reductions result fromOptions 2 and 4 depending on whether thefactor for NOx emissions for fuel oil andgas firing is 2.5 or 3.5.
(5) Reduction in emissions provided byOption 5 are in line with the requirements ofthe proposed EU Communication onAcidification and Large Combustion Instal
(6) Total crude oil processing capacity of UKrefinery industry in 1996 was 90.3 milliontonnes.
(7) Options 1 to 4 have been applied uniformlywhere data were available except as notedbelow:
• Option 1 applicable to eight of elevenrefineries. Three refineries fire less than1% sulphur content in their fuel oilcurrently;
• Option 2 applicable to 10 of 11refineries. Currently one refinery firesalmost entirely refinery gas;
• Option 3. wet gas scrubbing applied onall refineries;
• Option 4 applied at all refineries. Onerefinery fires no fuel oil, thereforeOption 3 adopted as Option 4.
(8) At one refinery the FCCU stack is the stackselected for scrubbing, therefore in this case,Option 2 and 3 have been combined.
6.4 Implications for the Refinery Sector
The financial effects of implementing any of theabove options/strategies can be measured againstrecent levels of profitability reported by the UKrefinery industry. Figure 2.8 in Section 2.4.3presents data prepared by UKPIA which illustratethe decline in overall refinery operatingprofitability among UKPIA member companies.The numbers are necessarily very general andinclude some impact from the retail sector.Nonetheless they do indicate the financialbackground against which the downstreamindustry is operating.
Table 6.3 shows the cost of implementing variousemission reduction strategies on a basis of cost perbarrel of oil processed for the refinery industry asa whole. It can be seen that Options 1 to 4 fall intothe range between £0.03 to £0.19 per barrel of oilprocessed. Option 5 would have a much greaterimpact, costing £0.29 per barrel of oil.
The costs per barrel can be compared withprofitability per barrel for the UK industry as awhole. Figure 2.8 in Chapter 2 represents dataprovided by UKPIA on the profitability of the UKrefinery sector and its associated downstream andretail operations. It represents the most up-to-dateinformation on the subject in the public domain.However, there are no separate data for therefinery sector without the downstream and retailoperations included. The distorting effects of theGulf War on UK refinery operations ceased in1991 to 1992. Since then profitability of the sectoras a whole fluctuated between a high value ofabout £500 million in about 1994 and a low value,essentially zero, in 1996. The amount of crude oilprocessed by UK refiners in 1994 was 93 milliontonnes (approximately 1.9 million barrels perstream day). A very simple calculation is to dividethe annual operating profit by the annualthroughput, which in this case shows that thesector operating profit per ton in 1994 equalled£5.38. This is equivalent to about 72p per barrelhence, the implementation of these options 1 to 4would result in a percentage impact of 4% to 26%.The implementation of Option 5 would result inan impact of 40%.
Clearly, the impact of zero profit in 1996 is thatthe industry in that year generated no surplusfunds against which abatement costs can becompared.
It should be recognised that this economic analysishas been restricted to assessment of effects on therefinery industry. It has not considered the broadereconomic base, especially the upstreamexploration and production sector of the operatingcompanies which own the refineries.
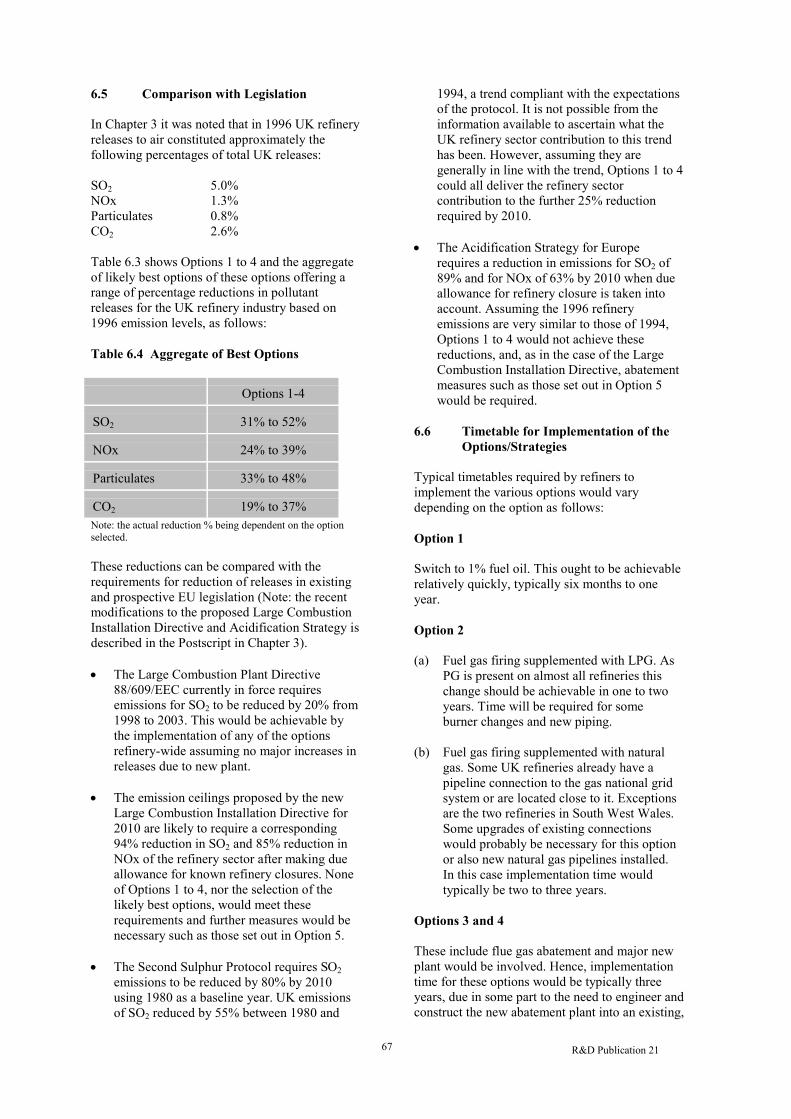
R&D Publication 2167
6.5 Compar ison with Legislation
In Chapter 3 it was noted that in 1996 UK refineryreleases to air constituted approximately thefollowing percentages of total UK releases:
SO2 5.0%NOx 1.3%Particulates 0.8%CO2 2.6%
Table 6.3 shows Options 1 to 4 and the aggregateof likely best options of these options offering arange of percentage reductions in pollutantreleases for the UK refinery industry based on1996 emission levels, as follows:
Table 6.4 Aggregate of Best Options
Options 1-4
SO2 31% to 52%
NOx 24% to 39%
Particulates 33% to 48%
CO2 19% to 37%Note: the actual reduction % being dependent on the optionselected.
These reductions can be compared with therequirements for reduction of releases in existingand prospective EU legislation (Note: the recentmodifications to the proposed Large CombustionInstallation Directive and Acidification Strategy isdescribed in the Postscript in Chapter 3).
• The Large Combustion Plant Directive88/609/EEC currently in force requiresemissions for SO2 to be reduced by 20% from1998 to 2003. This would be achievable bythe implementation of any of the optionsrefinery-wide assuming no major increases inreleases due to new plant.
• The emission ceilings proposed by the newLarge Combustion Installation Directive for2010 are likely to require a corresponding94% reduction in SO2 and 85% reduction inNOx of the refinery sector after making dueallowance for known refinery closures. Noneof Options 1 to 4, nor the selection of thelikely best options, would meet theserequirements and further measures would benecessary such as those set out in Option 5.
• The Second Sulphur Protocol requires SO2emissions to be reduced by 80% by 2010using 1980 as a baseline year. UK emissionsof SO2 reduced by 55% between 1980 and
1994, a trend compliant with the expectationsof the protocol. It is not possible from theinformation available to ascertain what theUK refinery sector contribution to this trendhas been. However, assuming they aregenerally in line with the trend, Options 1 to 4could all deliver the refinery sectorcontribution to the further 25% reductionrequired by 2010.
• The Acidification Strategy for Europerequires a reduction in emissions for SO2 of89% and for NOx of 63% by 2010 when dueallowance for refinery closure is taken intoaccount. Assuming the 1996 refineryemissions are very similar to those of 1994,Options 1 to 4 would not achieve thesereductions, and, as in the case of the LargeCombustion Installation Directive, abatementmeasures such as those set out in Option 5would be required.
6.6 Timetable for Implementation of theOptions/Strategies
Typical timetables required by refiners toimplement the various options would varydepending on the option as follows:
Option 1
Switch to 1% fuel oil. This ought to be achievablerelatively quickly, typically six months to oneyear.
Option 2
(a) Fuel gas firing supplemented with LPG. AsPG is present on almost all refineries thischange should be achievable in one to twoyears. Time will be required for someburner changes and new piping.
(b) Fuel gas firing supplemented with naturalgas. Some UK refineries already have apipeline connection to the gas national gridsystem or are located close to it. Exceptionsare the two refineries in South West Wales.Some upgrades of existing connectionswould probably be necessary for this optionor also new natural gas pipelines installed.In this case implementation time wouldtypically be two to three years.
Options 3 and 4
These include flue gas abatement and major newplant would be involved. Hence, implementationtime for these options would be typically threeyears, due in some part to the need to engineer andconstruct the new abatement plant into an existing,

R&D Publication 2168
and usually congested, refinery layout underoperational conditions.
Option 5
The very significant investment that would berequired to implement this option, such as theinstallation of SCR and FCCU flue gas scrubbingas well as the other measures described, will meanmajor forward planning would be needed byrefiners. Overall they would probably need atleast five years to implement the necessarymeasures.

R&D Publication 2169
7. LONGER-TERM STRATEGIES ANDINFLUENCES
7.1 Introduction
The most likely long-term scenario for the oilrefining companies is one of continuing struggle formarket share against a crude oil price which isunlikely to rise significantly. The peak of oil and gasproduction world-wide will possibly occur around2015 to 2020 and thereafter decline slowly. InWestern Europe, although transport requirementsare scheduled to increase, this is not likely to bereflected in a significant increased demand for fuelsas the forecast increase in transport will probably beoffset by increased fuel efficiency with the use oflean burn and fuel injection engines and other newtypes of technology. Therefore, overall productdemand in Western Europe is likely to remainrelatively flat for the foreseeable future.
Against this background there are a number of long-term issues that will directly or indirectly affectrefinery operations in the foreseeable future. Someof these, such as sources and quality of crudesupply, reductions in pollutant releases, increasinglystringent product specifications and declining fueloil sales, have already been discussed for the shortto medium term. This section discusses the longer-term effects of these issues as well as theimplications for refiners of possible technologicaldevelopments both inside and outside the refinery,which they will increasingly need to take intoaccount in order to maintain their competitiveposition.
7.2 Sulphur Removal
If not removed in the refinery as elemental sulphur,sulphur in crude oil is released to the environment asSO2 either in refinery emissions or in the case offuel products through combustion at the point ofuse. Possible process technologies for the removalof sulphur, not already discussed in some detail, aredescribed below along with their wider implicationsfor refiners in the longer term.
7.2.1 Heavy Oil Gasification
During the crude oil refining process sulphur tendsto be concentrated in the heavier, lower valuefractions and products.
Heavy oil gasification can be applied to a widerange of low value oil products including:
• residual oils including vacuum residue,asphalt/pitch;
• petroleum/water emulsion including orimulsionand;
• petroleum coke.
The resulting products are virtually sulphur free andof increased value.
The process route typically comprises the followingmain steps.
• Gasification with oxygen and steam at 50 to 80bar pressure to produce hydrogen, carbonmonoxide, a smaller amount of CO2 andhydrogen sulphide. This gas is usually called a‘synthesis gas’ or syngas. The major processesavailable are licensed by Texaco and Shell.With minor exceptions, both these licensedprocesses can gasify all the heavy oils listedabove. Oil gasification can be used as a veryflexible ‘refinery dustbin’ to dispose of anyresidual heavy oil, refinery slops, etc. withoutlimitation due to its metals or sulphur content.
• The ash and heavy metals in heavy oil areremoved as solids and can be landfilled orperhaps sold for recovery of their highvanadium and nickel content.
• Hydrogen sulphide is removed by conventionalamine scrubbing and the hydrogen- sulphide-rich amine sent to a sulphur plant for sulphurrecovery. Typically 99% of sulphur in the feedis removed. New hot gas desulphurisationprocesses using absorbent solids are beingdeveloped which should be less expensive thanamine systems.
The resulting gas, synthesis gas, comprisinghydrogen and CO, is a very clean fuel that can befired in furnaces or gas turbines, used for productionof hydrogen, or for synthesis of a range of liquidfuels and chemicals. These may include liquid fuelswith low sulphur through the Fischer Tropschreaction, acetic acid, ammonia, methanol, and OXOalcohols. The gasification unit also produces exportsteam.
Experience from the USA indicates that a refinerypreviously combusting a high proportion of fuel oilin its furnaces and boilers improved its releases ofSO2, NOx and particulates by about 80% in eachcase after the installation of a gasification unit. Atthe same time the problem of disposal of surplusfuel oil has been solved.
If required, the CO can be converted to CO2 via theCO shift reaction and the CO2 removed, asdescribed below in Section 7.6, leaving hydrogen asa fuel or as a processing component, e.g. forhydrotreatment or hydrocracking. Typical heavy oilconsumption is 0.45 tonnes per 1000 Nm3 ofhydrogen produced.
Shell at its very large Pernis Refinery at Rotterdamin the Netherlands has recently undertaken a

R&D Publication 2170
programme of major plant modernisation andinvestment which includes a residue gasificationplant. The three gasifiers deliver hydrogen for a newlarge hydrocracker unit. As a result of this new unitpart of the fluid catalytic cracking plant has beenshut down as a proportion of transport fuels are nowproduced from the new hydrocracker. From the shiftreactors the CO2 is currently emitted to atmosphere.However, a project is in hand, funded by the DutchGovernment, aimed at injecting the CO2 intounderground strata.
The main problem with investment in gasificationplant is its capital and operating cost. To beattractive commercially it usually needs to beundertaken on a large scale. Typically, production ofmore than 200 MWe of electrical power is requiredthrough an integrated gasification combined cycle(IGCC) or else use of the products hydrogen, carbonmonoxide and steam on a large scale to producechemicals.
Generally accepted investment costs for an oil-gasification- based combined cycle plant in the 200+MWe range are US$1200 to 1500 per kw installed,with a thermal efficiency of around 40% and about99% sulphur emission abatement. As averageelectrical demand on a refinery is usually less than80 MWe, investment in IGCC often depends onthere being a market for the exported electricalpower. However, high pressure steam can also be avaluable gasification product and there are examplesof much smaller gasification units which make agood refinery fit.
In the current climate of very low UK refinerymargins and low-cost natural gas, investment by asingle refinery in IGCC for economic reasons seemsunlikely in the immediate future, although co-operative ventures among refiners might be viableover the next few years. In the longer term,environmental pressures will help to encourageconsideration of gasification as a way of disposingof residual fuel oil with a high sulphur content, aswell as providing clean fuels for combustion infurnaces and boilers resulting in lower refineryreleases. Gasification as a process is also morelikely to be considered by refiners if the differentialprice between light North Sea crudes and heaviersourer crudes starts to widen so that processing asour crude with gasification of residue becomesmore economic. Other scenarios which wouldencourage residue gasification are: decline in NorthSea oil production starts earlier than expected, or iflegislation has the effect of reducing sales of fuel oilquicker than expected.
In the long term, 2010 and beyond, as sweet crudesstart to decline, it seems likely that heavy oilgasification will be installed in a number of thelarger refineries.
7.2.2 Solvent Deasphalting (SDA) andCombustion in a Fluidised-Bed Boiler
An alternative method for disposal of heavy residualoils or petroleum coke is combustion in a fluidised-bed boiler with limestone injection for sulphurcapture. About 90% of the sulphur content of thefuel is captured and about 50% of the calcium in thelimestone is used in sulphur absorption. Theresulting calcium sulphate and unconverted calciumoxide, together with the nickel and vanadium, in thefuel are discharged from the boiler as a solid residuewhich can be used as road aggregate or disposed ofto landfill. A combination of fluidised- bed boilerswith upstream solvent de-asphalting or delayedcoking can be a cost-effective solution for refinerieswith existing FCCU capacity and steam/powerdeficiencies. However, such schemes have a lowersulphur capture performance than gasification andthey do not provide the option of producinghydrogen. There could also be environmentalobjections to the mining and transport of limestoneand disposal of the residue. For these reasonsgasification may be generally more attractive in thelong term.
7.3 Oxides of Nitrogen
As already identified, NOx levels in flue gases fromcombustion will be lower generally when burning aclean gas than when burning a fuel oil because it ismore difficult to achieve staged mixtures of air andoil close to stoichiometric proportions, and due tothe nitrogen compounds present in the fuel oil. Theonly exception to this is when burning hydrogen gaswhich gives a considerably higher flametemperature than, for example, natural gas, leadingto slightly higher NOx levels than those from naturalgas. In the absence of downstream abatement, lowerNOx levels will only be achieved by either burningclean gas on a more or less exclusive basis withoutdownstream abatement, or by burning liquid or solidfuels with downstream abatement, typically SCR.
Even with the use of clean gas, SCR downstreamabatement, as is currently practised in Californiamay eventually be required in order to achieve ultra-low NOx release levels on a refinery.
7.4 Par ticulates
The technology and processes are well establishedto abate particulates to relatively low levels at costswhich are not normally excessive. However,submicron particles are more difficult to abate. Thefiring of clean fuel gas will eliminate particulatereleases from combustion plant. With theapplication of continuous improvement to the levelsof particulate releases, as well as the application ofthe best abatement technology, it should be possible

R&D Publication 2171
to eliminate particulates as a problem in theforeseeable future.
7.5 Volatile Organic Compounds (VOCs)
VOC reduction programmes such as leakagedetection and repair (LDAR), waste minimisationand recycling are available to refiners. In additionthe following abatement plant and techniques can beapplied:
• vapour recovery systems, for example, duringthe loading and unloading of higher vapourpressure hydrocarbons;
• minimisation of flare releases through, forexample, the use of high integrity trip systemsfor the control of process operations;
• closed loop product quality sampling andtesting;
• application of latest seal technology forpumps, compressors and tankage;
• disposal of occasional vents and safety valvereleases by flare or incineration; and
• vapour recovery from effluent treatment plants(not yet implemented on UK refineries).
With the application of such measures VOC releasesfrom refineries should be reduced to levels whichhave only a minor environmental effect. It isunlikely, however, that VOC emissions can beeliminated altogether, even in the longer term.
7.6 Carbon Dioxide Releases
Assuming refinery utilisation gradually increases (asdiscussed elsewhere in this Review) and thatproduct specification and abatement requirementscontinue to be more stringent, then CO2 releases, ifunabated, are likely to continue to rise since thesemeasures will require energy. Within 2.2.1 theimplications for refinery CO2 emissions of increasedprocessing to meet the 2005 product specificationsare discussed. It has been estimated, as part of thisReview, that to meet these specifications CO2emissions would increase between 2% and 4%,depending on the fuel type, due to the additionalenergy required.
A number of options exist for the reduction ofreleases of CO2, including the following.
7.6.1 Combustion of Fuels with a HighHydrogen Component
The combustion of hydrogen produces water withno production of CO2. As the proportion of carbonin the fuel increases so the amount of CO2 increases.This is demonstrated in Table 7.1 below.
It may be seen from Table 7.1 that for equivalentheat releases, natural gas produces about 40% lessCO2 than coal and about 20% less than fuel oil.
7.6.2 Capture of CO from Synthesis Gas
As noted above synthesis gas may be produced bygasification of heavy residues or by steam reformingof natural gas. The CO content of synthesis gas maybe used in the production of chemicals such asmethanol and other alcohols and acetic acid, oralternatively the CO gas can be reacted with moresteam under pressure to produce O2 and morehydrogen. The CO2 is then removed by absorptiontechniques. The resulting hydrogen-rich gas maythen be combusted. Investment costs with CO2removal would be much greater than for gasificationwithout CO2 removal, typically increasing in therange of US$300 per 600/kW installed for CO2removal from reforming of natural gas. Thermalefficiency would fall from around 60% for aconventional natural-gas-fired combined cycle plant,to around 50%
7.6.3 Removal of CO2 from Flue Gas Streams
Wet scrubbing using caustic soda for the removal ofSO2/NOx will effectively remove CO2 as acarbonate. It should be noted, however, that to applywet gas scrubbing for the sole purpose of removal ofCO2 would be largely self-defeating as thescrubbing process itself requires energy as does theproduction of the scrubbing agents. A number ofother licensed processes are available which willremove CO2 from flue gases using a solvent that canbe recycled, typically methylethylamine (MEA).After absorbing the CO2 in a scrubbing system, thesolvent is thermally regenerated, releasing the CO2.This could then be compressed, liquefied and sent tounderground disposal. Present indications are thatthe high energy requirements of this type of schemewill discourage its general use.
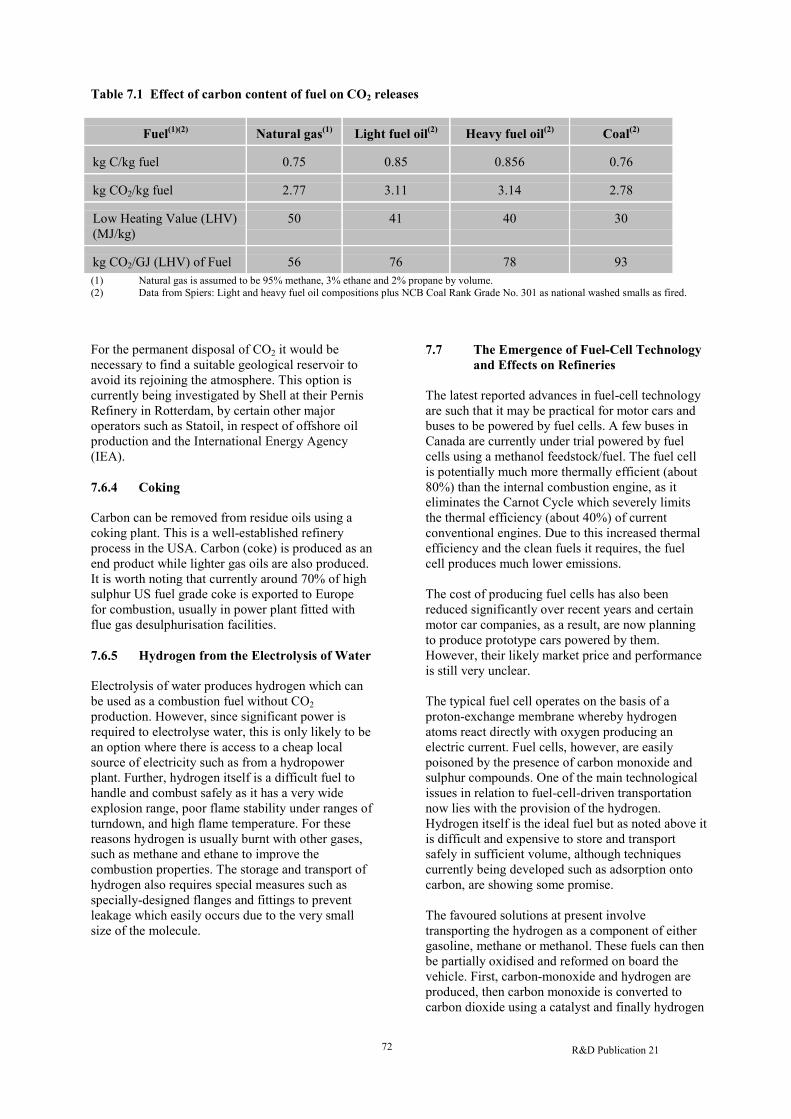
R&D Publication 2172
Table 7.1 Effect of carbon content of fuel on CO2 r eleases
Fuel(1)(2) Natural gas(1) Light fuel oil(2) Heavy fuel oil(2) Coal(2)
kg C/kg fuel 0.75 0.85 0.856 0.76
kg CO2/kg fuel 2.77 3.11 3.14 2.78
Low Heating Value (LHV)(MJ/kg)
50 41 40 30
kg CO2/GJ (LHV) of Fuel 56 76 78 93(1) Natural gas is assumed to be 95% methane, 3% ethane and 2% propane by volume.(2) Data from Spiers: Light and heavy fuel oil compositions plus NCB Coal Rank Grade No. 301 as national washed smalls as fired.
For the permanent disposal of CO2 it would benecessary to find a suitable geological reservoir toavoid its rejoining the atmosphere. This option iscurrently being investigated by Shell at their PernisRefinery in Rotterdam, by certain other majoroperators such as Statoil, in respect of offshore oilproduction and the International Energy Agency(IEA).
7.6.4 Coking
Carbon can be removed from residue oils using acoking plant. This is a well-established refineryprocess in the USA. Carbon (coke) is produced as anend product while lighter gas oils are also produced.It is worth noting that currently around 70% of highsulphur US fuel grade coke is exported to Europefor combustion, usually in power plant fitted withflue gas desulphurisation facilities.
7.6.5 Hydrogen from the Electrolysis of Water
Electrolysis of water produces hydrogen which canbe used as a combustion fuel without CO2production. However, since significant power isrequired to electrolyse water, this is only likely to bean option where there is access to a cheap localsource of electricity such as from a hydropowerplant. Further, hydrogen itself is a difficult fuel tohandle and combust safely as it has a very wideexplosion range, poor flame stability under ranges ofturndown, and high flame temperature. For thesereasons hydrogen is usually burnt with other gases,such as methane and ethane to improve thecombustion properties. The storage and transport ofhydrogen also requires special measures such asspecially-designed flanges and fittings to preventleakage which easily occurs due to the very smallsize of the molecule.
7.7 The Emergence of Fuel-Cell Technologyand Effects on Refiner ies
The latest reported advances in fuel-cell technologyare such that it may be practical for motor cars andbuses to be powered by fuel cells. A few buses inCanada are currently under trial powered by fuelcells using a methanol feedstock/fuel. The fuel cellis potentially much more thermally efficient (about80%) than the internal combustion engine, as iteliminates the Carnot Cycle which severely limitsthe thermal efficiency (about 40%) of currentconventional engines. Due to this increased thermalefficiency and the clean fuels it requires, the fuelcell produces much lower emissions.
The cost of producing fuel cells has also beenreduced significantly over recent years and certainmotor car companies, as a result, are now planningto produce prototype cars powered by them.However, their likely market price and performanceis still very unclear.
The typical fuel cell operates on the basis of aproton-exchange membrane whereby hydrogenatoms react directly with oxygen producing anelectric current. Fuel cells, however, are easilypoisoned by the presence of carbon monoxide andsulphur compounds. One of the main technologicalissues in relation to fuel-cell-driven transportationnow lies with the provision of the hydrogen.Hydrogen itself is the ideal fuel but as noted above itis difficult and expensive to store and transportsafely in sufficient volume, although techniquescurrently being developed such as adsorption ontocarbon, are showing some promise.
The favoured solutions at present involvetransporting the hydrogen as a component of eithergasoline, methane or methanol. These fuels can thenbe partially oxidised and reformed on board thevehicle. First, carbon-monoxide and hydrogen areproduced, then carbon monoxide is converted tocarbon dioxide using a catalyst and finally hydrogen

R&D Publication 2173
and carbon dioxide are fed to the fuel cell. Thecarbon dioxide takes no part in the production of theelectricity in the cell. One of the main debatescurrently concerning fuel cell technology fortransportation therefore centres on which fuel is tobe used. The advantages and disadvantages of thethree mentioned above are as follows.
• Gasoline has the advantage that the refineriesand infrastructure are already established for itsproduction and distribution. It has thedisadvantage that it still contains sulphur whichwould need to be removed to levels much lowerthan even the new 2005 gasoline specificationsin order not to ‘poison’ the fuel cell. This wouldbe very expensive to achieve and involve muchhigher energy inputs, and hence carbon dioxidereleases by the refineries, in order to achieve thevery low sulphur levels required.
• Methane could be supplied as natural gas butthere are probably not sufficient supplies ofnatural gas in the medium to long term to meetall the demands for it.
• Methanol can be produced by refineries fromnaphtha, natural gas or gasification of heavy oilcomponents. The principal unit operations aregasification, removal of sulphur in the form ofhydrogen sulphide, methanol synthesis over acatalyst and finally distillation to produce puremethanol. Both methane and methanol wouldcontain almost zero sulphur but methanol hasthe disadvantage of being toxic at high exposurelevels.
If methanol (or hydrogen, if the storage andtransportation issue can be solved) were to beproduced from heavy oil gasification this couldpotentially have several major advantages. Forexample a valuable product would be produced froman increasingly unwanted and low value heavy oilfeedstock. With a suitable increase in capacity ofthe installed gasification complex sufficientsynthesis gas could be produced to provide cleanfuel for the whole of the refinery and any associatedpower plant, and hence also provide a significantreduction in SO2 and particulate emissions.
At present, it seems unlikely that the fuel cell willhave a significant impact on refinery operationsbefore about 2005. However, if the technology doesprove to be a technical and commercial propositionin the next few years, then the potential for all roundimprovement in releases to the environment fromrefineries and vehicle transport might be verysignificant. It is to be expected that a longchangeover period, ten years or more, would occurwhilst conventional internal combustion engineswere being phased out and fuel-cell-poweredvehicles were being introduced.
However, the effect on refineries of producing thenew fuel whether it be virtually zero sulphurgasoline, hydrogen, methanol or methane (naturalgas supplies in the long term are not likely to meetthe demand as noted above) would be major andrequire significant investment.
Once the changeover period was completed, it isconceivable that, if the established fuel washydrogen or methanol, a refinery could be reducedto largely gasifying crude oil directly without manyof the downstream units it currently needs andutilises.
7.8 Summary
As identified previously in this Report, the burningof clean gaseous fuels, especially fuels with a highhydrogen content, has many advantages including:
• virtually zero sulphur emissions;
• considerably lower NOx emissions comparedwith fuel oil combustion (excluding purehydrogen);
• zero heavy metal releases;
• lower CO2 releases;
• zero particulate releases; and
• little need for downstream flue gas abatementexcept possibly in respect of NOx if very lowlevels of release are required.
As an alternative to the combustion of natural gas orLPG, refiners could gasify residues and fire theclean synthesis gas. However, this is expensive andto be economically viable usually needs to becarried out on a large scale. In the current economicclimate and taking into account the relatively lowcost of natural gas in the UK, gasification ofresidues is not considered a strategy that a singlerefinery is likely to adopt on its own in the very nearfuture. However, in view of the declining fuel oilmarket, particular refinery circumstances or joint co-operative ventures by refiners might make thisoption viable in some cases in the longer term.
To remove CO and hence CO2 from the products ofgasification prior to their combustion would increasethe cost of the resulting fuel (mainly hydrogen), andunder prevailing economics would not be viable.
In the next few years at least, the best option forreduction of CO2 release on a large scale seemslikely to be the combustion of fuels with a relativelyhigh hydrogen to carbon ratio such as hydrogenitself, natural gas or LPG. In addition the adoption,where practical, of heat integration, and combined

R&D Publication 2174
heat and power (CHP) schemes to increase thermalefficiency will help to reduce CO2 releases as willincreased use of certain non-fossil-fuel alternatives,for example, solar power.
The introduction of the fuel cell, should it proveeconomically and technically feasible in the nextfew years, would have a major effect on refineriesand considerably assist in reducing CO2 and otherpolluting releases from transport vehicles.

R&D Publication 2175
8. CONCLUSIONS
The main conclusions of this Review are as follows.
• UK refineries are currently experiencing verylow or negative profit margins and, until veryrecently, significant overcapacity. As a result,capital expenditure and operating costs havebeen and are being minimised by refiners.Further refinery closures or mergers are quitepossible, although closing a refinery involvesthe spending of substantial sums of money initself.
• The availability of light/sweet North Sea crudeoil is helping to minimise expenditure thatmight otherwise be required to abate emissionsand to achieve product quality. Most UKrefiners now depend on light/sweet crude tomeet current release levels and productspecifications (for example, sulphur ingasoline and diesel). North Sea crude is alsorelatively easy to process and producesrelatively large proportions of high valueproduct. Refiners will continue to bedependent on it beyond the year 2000 whenlower sulphur levels in gasoline and diesel willcome into force.
• Light/sweet North Sea crude is likely to beavailable to UK refiners in good supply at leastup to the year 2005 and probably beyond.
• By the year 2005 there will be a further sharpreduction in the permitted levels of benzene,aromatics and sulphur in gasoline and sulphurin diesel. To meet these new EU (2005)transport fuel specifications refiners are likelyto need to undertake major new investment.Any significant abatement required shouldtherefore be made known to the refiners assoon as possible as they are alreadyconsidering plans and investment for 2005 fuelspecifications.
• The combusting in refineries of ‘clean’gaseous fuels has a number of advantages overliquid fuels, particularly heavy fuel oils. Theseinclude significantly lower SO2, NOx,particulate, heavy metals and CO2 emissions.
• Most refiners are likely to need to invest insome type of extra hydrotreatment to meet theEU 2005 fuel specifications. This extrahydrotreatment will require a correspondingamount of extra hydrogen which could besupplied from the refinery fuel gas system.This in turn may mean less refinery fuel gas isavailable to burn in furnaces and boilers. (Thereduction in benzene levels in gasoline mayalso have the effect of slightly reducing the
amounts of hydrogen produced by thereformer unit.) As a replacement for this lossof fuel gas, refiners may wish to burn morefuel oil which would, if unabated, lead toincreased releases to air. The supply ofhydrogen within their refinery is a subjectoperators will need to address as a result of theextra hydrotreatment.
• It has been estimated that the increasedrefinery processing required to meet the 2005fuel specifications would result in UK refinerysector CO2 emissions increasing by between2% and 4%. UK Refineries currentlycontribute 2.6% to national emissions of CO2.
• Discussions held with operators indicate thatthey generally have no plans for majorinvestment prior to having to respond to thenew EU (2005) fuel specifications. Operatorswere concerned to have clear targets/limits inrespect of environmental releases which do notinvolve excessive cost to achieve and whichare based on sound science, not on arbitraryreductions.
• Most refiners agree that disposal of highersulphur fuel oil will become increasinglydifficult, particularly as new limits on sulphurin fuel oil (1% max) are expected to beintroduced by the EU. (However the draft EUDirective on this subject currently exemptsrefineries themselves and large combustionplant from this 1% fuel oil sulphur limit, onthe assumption that equivalent abatement iscarried out.)
• Compilation of an inventory of UK releaseshas shown total reported SO2 releases fromUK refineries to be about 120 000 tonnes peryear with individual refineries typicallyemitting 7000 to 21 000 tonnes per year. Thiscompares with some Scandinavian refineries,the most abated in the world, which typicallyhave limits of about 2000 tonnes per year. TheUK refineries range in capacity from 4.4 to15.6 million tonnes per year of crudeprocessed and the Scandinavian from 6.2 to9.5 million tonnes per year.
• A review of world-wide refinery best practiceand current abatement techniques on UKrefineries has shown that UK refineryabatement practice does not compareparticularly favourably with abatement incountries like the USA and the Netherlands,and is well behind Scandinavia and Japan.
• Review of the information from the PublicRegister shows that data concerning releasesare incomplete in some areas. The
R&D Publication 2176
Environment Agency may, for example, wishto consider requesting a VOC releaseinventory and a sulphur balance from eachrefinery; something that a few refiners alreadysupply. A number of other points concerninginformation missing from the Public Registerhave been raised in this Review, includingsome lack of data for sulphur recovery plantsand sour water stripper gas streams. Further,information on solid waste disposal could beintegrated into the IPC register andimprovements in the uniformity of monitoringrequirements for releases to water could bemade.
• 1996 data from the Public Register show thatsome SO2 and NOx emission limits for largecombustion plant and FCCUs are well above1996 reported release levels. There may begood reasons for this but it could mean thatpotentially-significant increases in currentrefinery releases to air could occur if refinerswere to operate closer to these limits.However, any revised limit levels would needto take account of a number of factorsincluding a refinery’s complexity, particularprocessing scheme, and current crude andproduct slates. More complex refineries,particularly residue-upgrading refineries,generally require proportionally higher energyinputs and hence have proportionally higherreleases than refineries with simplerprocessing schemes.
• Uses of FCCU hydrotreatment orhydrotreatment of residues, solely as an optionto provide lower releases from the FCCUregenerator or lower sulphur refinery fuel oil,has excluded it on the grounds of excessivecost. However, hydrotreatment of the feed tothe catalytic cracker, for example, may beincluded by some refiners as a processing unitin their plans to meet 2005 transport fuelspecifications. Should this be the case then itwould also assist in abating releases of SO2 toair from FCCUs.
• Five options (or strategies) for reducingreleases to air have been assessed. The firstfour involve: reduction in the sulphur contentof the fuel oil fired; substituting fuel oil firingwith natural gas or LPG; abating releases fromstacks with large pollutant flows, and abatingthe same stacks, with all remainingcombustion equipment being fired on fuelgas/LPG or natural gas. The fifth optioninvolved assessing the abatement measuresthat would be required to meet the largereductions in pollutant levels required by 2010under the Draft EU Large CombustionInstallation Directive and the Communication
on Acidification. Each of the five options havebeen evaluated for the UK refinery sector as awhole. There were insufficient data on thePublic Register to develop abatementstrategies for releases to water and land,though some guidance on measures to reduceimpacts to these media have been provided.
• The first four options (or strategies) representlikely solutions that refiners could adopt toachieve significant reductions in releases toair. However, if required to achieve suchreductions, individual refineries may well optfor various combinations of these options orother alternatives to suit their particularrequirements. The fifth option represents anorder of magnitude increase in pollutionreduction and hence investment compared withthe first four. It would involve almost allrefineries burning clean gas, fitting selectivecatalytic reduction to remove NOx fromcombustion flue gas streams, scrubbing FCCflue gas and upgrading sulphur recoverysystems and sulphur recovery plants. Certainother process modifications would alsoprobably be necessary.
• The Options (or strategies) 1 to 4 givereductions for the refinery industry as a wholeranging from 31% to 49% for SO2, 24% to39% for NOx, 33% to 42% for particulates and19% to 37% for CO2, the actual percentagebeing dependent on the option.
• The aggregate of the likely best abatementoption, selected from Options 1 to 4, for eachrefinery achieves a 52% reduction in SO2 and39% reduction in NOx. For this case Option 2was selected as the best option for mostrefineries, though Options 3 and 4 wereselected at refineries where gas supply was notavailable or where the refinery already firedalmost entirely on fuel gas.
• The fifth option gives reductions in SO2 andNOx in the order of 90% and 85%respectively.
• The cost of implementing each of Options 1 to4 across the UK refinery industry, per barrel ofcrude oil processed by the industry, rangesfrom 3p to 19p. The industry aggregate cost ofapplying the likely best option, selected fromOptions 1 to 4, is 4p per barrel. The cost ofimplementing the fifth option is approximately29p per barrel. Cost in this context is annualoperating cost plus capital cost amortised overfive years.
• Based on recent financial performance dataprovided by UKPIA for the UK refinery

R&D Publication 2177
sector, profit margins were about 72p perbarrel in 1994. Based on these data,implementation of Options 1 to 4 wouldrepresent between 4% and 26% of 1994 sectorprofits and Option 5 about 40%. However,with profits in 1995 to 1996 at almost zero,implementation of any of the options would beparticularly significant on refinery sectormargins in these circumstances.
• This economic analysis has been restricted tothe refinery industry sector only. It has notconsidered the broader economic base of theoperating companies which own or operate therefineries.
• The reduction in releases to air of SO2 andNOx provided by the options indicate thatcommitments under the existing LCPD88/609/EEC for SO2 reduction could be met byimplementing any of Options 1 to 4. The sameis true of the UNECE Second Sulphur Protocol(1994). However, proposed new EU emissionceilings based on the COA and designed to beachieved by 2010 could be met only by thefifth option.
• In the longer term, gasification of heavy fueloil residues produced by refineries is seen as agood solution to the disposal of high sulphurfuel oil and the provision of hydrogen. Theclean syngas, hydrogen and carbon monoxideproduced by this process could be burnt infurnaces or power plant resulting in muchimproved releases to air relative to fuel oil.The syngas can also be processed to extract thehydrogen for use in hydrotreatment with thecarbon monoxide acting as a chemicalfeedstock. Gasification is an expensiveprocess, both capital and operational costs arehigh, and it is therefore often best applied on alarge scale, although there are a few situationswhere a smaller gasification unit can make agood fit in a refinery. Current economics, i.e.low refinery margins, relatively cheap naturalgas, and good availability of low sulphur crudeoil with little price differential compared toheavier crudes, all point to gasification notbeing installed by UK individual refiners in thenear future. However, if crude oil pricedifferentials start to widen significantly andrefinery profit margins improve, or the marketfor fuel oil continues to deteriorate, thengasification may become economically viablefor some refiners. Alternatively certain refinersmight co-operate to construct a jointly-ownedgasification facility.
• Reports of recent improvements inhydrogen/oxygen fuel-cell technology are suchthat vehicle transport powered by fuel cells
may be technically and commercially viable inthe next five to ten years. There are a numberof options regarding the type of fuel used toprovide the hydrogen for the fuel cell.Whichever type of fuel is preferred the long-term impact on refiners is likely to besignificant.

R&D Publication 2178
Blank page intentional

R&D Publication 2179
APPENDIX A1 - DESCRIPTION OF UKREFINERIES
A1.1 Conoco RefineryA1.2 Gulf Milford Haven RefineryA1.3 BP Coryton RefineryA1.4 Elf Oil (GB) Milford Haven RefineryA1.5 BP Oil Grangemouth RefineryA1.6 Esso Fawley RefineryA1.7 Shell Haven RefineryA1.8 Mobil Llandarcy RefineryA1.9 Lindsey Oil RefineryA1.10 Shell Stanlow RefineryA1.11 Texaco PembrokeA1.12 Phillips Imperial Petroleum
A1.1 Conoco Refinery
Descr iption
Conoco is currently wholly owned by DuPontalthough DuPont have announced an intent todispose of some of its oil-related business. Therefinery is located at South Killingholme adjacent tothe Lindsey Oil Refinery. Operations began in 1969and the refinery now processes about 140 000 bpsdcrude (7 million tonnes per year) plus around 60 000bpsd imported residues and gas oils. Conoco isunusual in being able to produce premium value'needle' grade coke for anode manufacture. To makepremium quality coke requires low sulphur, lowmetals, coker feed, the refinery consequently runs amixed North Sea crude slate. The refinery is linkedto the British Pipeline Agency pipeline network.
Refinery process units
The refinery is equipped with thermal cracking,catalytic cracking and two coking units. All theseprocesses give the refinery processing flexibility anda low yield of fuel oil product.
A1.2 Gulf Milford Haven Refinery
Descr iption (Post scr ipt)
This 115 000 bpsd (6 million tonnes per year)refinery which became operational in 1968. Gulf hassold to Texaco its interest in the jointly-ownedPembroke Cracking Company and the refinery siteto Petroplus b.V. of Holland. This site no longerundertakes refinery operations.
A1.3 BP Coryton Refinery
Descr iption
The refinery, which is owned by BP (70%) andMobil (30%), is located on the Thames close to the
Shell Haven Refinery. It began operation in 1953producing a range of products including lubricatingbase oils, industrial fuels and bitumens. Currentcapacity is approximately 200 000 bpsd (7.5 milliontonnes per year) of light crudes (predominantlyNorth Sea) and imported atmospheric residue.
Refinery process units
The refinery has a range of units for the productionof fuels and continues to be a producer of lube baseoils.
The fluidised catalytic cracker unit (FCCU),propane deasphalter and lube train provide someresidue upgrading capability. However, the refinerystill produces a quantity of fuel oil.
A1.4 Elf Oil (GB) Milford Haven Refinery
Descr iption
Elf Milford Haven is a relatively modern, ex-Amocorefinery, dating from 1973, and is owned by Elf andMurco. It is located on the north side of the Haven.
The refinery processes a sweet crude slate,predominantly from the North Sea, and has anominal capacity of 108 000 bpsd (5.4 milliontonnes per year). Atmospheric residue is imported inorder to fully load the FCCU.
The refinery is connected to the shared pipelinesystem for the distribution of finished transportationfuels to the Midlands and North West England.
Refinery process units
The refinery is equipped with an FCCU but has nofuel oil upgrading/conversion process units.
A1.5 BP Oil Grangemouth Refinery
Descr iption
Grangemouth Refinery dates from 1924 and is nowowned by BP (70%) and Mobil (30%). The currentcapacity is 200 000 bpsd (8.7 million tonnes peryear).
The refinery is linked by pipeline to the FortiesOilfield and to the Finnart Ocean Terminal on theScottish west coast. Crude processed ispredominantly Forties, supplemented with importsof crude and residue through Finnart.
The refinery is a supplier of feedstock to BPChemicals located next to the refinery.
Approximately 120 MW power is raised in therefinery's own power plant from fuel oil firing,

R&D Publication 2180
supplying both the refinery and the adjacentchemicals site.
Refinery process units
Grangemouth has both FCCU cracking andhydrocracker units for vacuum gas oil conversion,but currently has no processes to upgrade/convertfuel oil. A hydrofiner produces low sulphur dieselfuel.
A1.6 Esso Fawley Refinery
Descr iption
Fawley, 100% owned by Esso, is located on thewest shore of Southampton Water and competeswith Shell Stanlow as the largest refinery in the UK.Nominal refinery capacity is 300 000 bpsd (15.6million tonnes per year). Operations at the sitebegan in 1921, but it was not acquired by Esso until1949. In 1966 Exxon Chemicals started up apetrochemical complex adjacent to the refinery. Therefinery is highly integrated with the petrochemicalsfacility.
The refinery has pipeline connections to Fawleypower station for fuel oil supply and to terminals inLondon, the Midlands and North West England.
Refinery process units
The refinery is equipped with catalytic cracking andresidue hydrodesulphurisation (Residfiner). TheResidfiner began operation in 1991 and upgradesvacuum residue feed to lighter products, FCCU feedand low sulphur fuel oil. Lubricating oils are alsoproduced at Fawley.
The refinery processes both North Sea and MiddleEast crudes.
A1.7 Shell Haven Refinery
Descr iption
The Shell Haven Refinery is currently scheduled forclosure before the end of 1999. A significantnumber of process units came on line in the early1950s upgrading the site to a conventional oilrefinery. It is a 100% owned Shell facility located onthe Thames estuary at Stanford-le-Hope, Essex, andhas a current capacity of 4.3 million tonnes per year.
Crude processed is predominantly North Sea. Therefinery delivers products by road and sea and isconnected to the White Oil British Pipeline Agencypipeline serving the Midlands and East Anglia.
Refinery process units
The refinery has no FCCU, although a hydrocrackerunit was added in 1979 and an isomerisation unit(for light naphtha octane improvement) in 1992.Except for a small bitumen plant the refinery has nobottom of the barrel upgrading capacity.
A1.8 Mobil Llandarcy Refinery
Descr iption
Operations at the Llandarcy site in South Walesbegan in 1921. The refinery ceased crude oilprocessing in the early 1980s as part of BP's refiningrationalisation programme. Since this time therefinery has imported atmospheric residues,principally from North Sea crudes to feed retainedlube oil and bitumen production facilities. Followingthe recent BP/Mobil downstream merger therefinery was operated by Mobil until it ceasedproduction in November 1999.
A1.9 Lindsey Oil Refinery
Descr iption
The Lindsey Oil Refinery, located on the HumberEstuary, is jointly owned by Total Oil (GB) Limitedand Fina plc. Refinery capacity is 200 000 bpsd(10 million tonnes per year). Lindsey is able toprocess both sweet and sour crudes from all over theworld. In addition to road and rail, distribution fromthe refinery is linked to the UKOP pipelineconnecting central and southern England. TheLindsey Oil Refinery is located next to the ConocoRefinery.
Refinery process units
Multiple process units, including FCCU,visbreaking and bitumen production providesflexibility and ability to process sour crudes.
A1.10 Shell Stanlow Refinery
Descr iption
The 100% owned Shell Stanlow refinery is locatedat Ellesmere Port, Cheshire, and is adjacent topetrochemical, manufacturing and researchfacilities. Operations at site began in 1924 with theinstallation of crude storage and blending facilitiesand bitumen production. Refinery capacity is now262 000 bpsd (13 million tonnes per year). Therefinery processes predominantly low sulphur crude,but Middle East crude is imported for lubesproduction. Pipeline links exist to the Ince 'B' PowerStation, the Shell petrochemical complex atCarrington, near Manchester, Haydock terminal andthe UKOPL pipeline to the Midlands.

R&D Publication 2181
Refinery process units
The refinery is equipped with an atmosphericresidue catalytic cracker and a lube oil train. Boththese plants help reduce the refinery's fuel oilproduction.
A1.11 Texaco Pembroke
Descr iption
The refinery opened in 1964 and is 100% owned byTexaco, located in Dyfed, South Wales. Refinerycapacity is a nominal 190 000 bpsd (9 milliontonnes per year). The refinery also operates a nearbycracking facility (the Pembroke CrackingCompany), this became 100% Texaco owned whenthe nearby Gulf Refinery closed.
The refinery processes crude from many countries,including the Middle East and Africa, but theprincipal feed is North Sea. The refinery has fuel oilpipeline connections to the Pembroke Power Stationand transportation fuel pipelines to the Midlands andManchester.
Refinery process units
The FCCU and Visbreaker allows the refinery to runa sour crude slate if it wishes. Visbreaking apart therefinery has no residue upgrading plant.
A1.12 Phillips Imper ial Petroleum
Descr iption
This hydroskimming refinery began operation in1963 and is owned by ICI/Phillips ImperialPetroleum Limited. Nominal crude capacity is100 000 bpsd (5 million tonnes per year). Therefinery processes North Sea crude (Ekofisk) fromthe oil terminal at Seal Sands. Naphtha is transferredto ICI by pipeline. The adjacent ICI facility alsoreceives fuel oil from the refinery.
Refinery process units
A hydroskimming refinery. No processing ofatmospheric residue, which is sold to other UKrefineries mainly as a low sulphur fuel oil.

R&D Publication 2182
Blank page intentional

R&D Publication 2183
APPENDIX A2 - BRIEF LAYMAN’S GUIDETO OIL REFINERIES
Crude oilCrude Oil from an oilwell is a mixture of liquid andgaseous hydrocarbons. The mixture will varyconsiderably from oil field to oil field. For example,the proportion of short-chain hydrocarbons andhydrocarbon gases may be higher in one type ofcrude oil than another. Refineries normally aredesigned to process particular types of crude oil.
If this is the case the crude oil is normally termed ‘alight crude’. Conversely if the crude contains ahigher proportion of tar and pitch, it is usually called‘a heavy crude’.
Another important factor is the amount of sulphurthat occurs in the crude oil. Crude oils with less thanabout 1.5% to 2% Sulphur by weight are termed‘sweet crudes’. Those with a larger amount ofsulphur are termed ‘sour crudes’.
Typical components of crude oil from the oil wellinclude:
• methane (with smaller amounts of ethane) - thisis also called natural gas, most of this isremoved at the oilfield;
• propane and butane - once liquefied by coolingtermed liquefied petroleum gas (LPG) and soldunder various brand names such as ‘Calor Gas’;
• paraffins - straight-chain hydrocarbons;• naphthenes - multicyclic hydrocarbons which
may be saturated or unsaturated;• some aromatics - unsaturated cyclic rather than
straight-chain hydrocarbons;• water - this is usually largely separated from the
oil at the oilfield before the oil is transported tothe refinery.
CondensateA very light portion (or fraction) of hydrocarbonsfrom an oil well, usually liquid at lowertemperatures, which are intermediate betweenpropane/butane gas and heavier liquid hydrocarbons.Condensate normally includes hydrocarbonmolecules with between 5 and 7 carbon atomspresent in each molecule.
Crude Oil Slate (diet)Crude oils from around the world vary in cost and inthe proportions of the types of hydrocarbons presentin each crude. Depending on the products an oilrefinery wishes to produce and the cost of eachcrude, it will choose a particular crude oil orcombination of crude oils for its refinery that bestsuit its requirements. The particular combination ofcrudes an oil refinery selects is termed its slate orsometimes, its diet.
The role of the refineryThe characteristics and components of the fuels andother products, such as lubricating oils, produced byan oil refinery vary considerably. The specificationthat each fuel, such as gasoline (petrol), diesel andaviation fuel, is required to meet is very precise anddetailed. It is the task of the refineries to processcrude oil to ensure that their products conform tothese specifications and that the quantities of thevarious fuels and other products produced meetmarket demands. This is achieved through physicaland chemical refining of crude oil as describedbriefly below.
Refining:(i) Crude & Vacuum DistillationThe first main process unit on a refinery is the crudedistillation unit (CDU). This separates the variouscomponents of the crude oil by making use of thedifferent boiling points of the various hydrocarboncomponents of the crude. The CDU is oftensupplemented by a vacuum distillation unit (VDU)which further distills the higher boiling pointhydrocarbons under vacuum to minimise thermalbreakdown. The products produced by the CDU andVDU would not normally be in the quantities and tothe specifications required. There is normally asurplus of higher boiling point hydrocarbons, thelonger chain or larger molecules, and a deficit oflower boiling point or shorter-chain molecules.
The other processing units on a refinery aretherefore designed to take the products from theCDU and to convert and treat them to the quantitiesand the specifications required. In most cases, thistreatment produces a range of products including thedesired component as well as some gaseoushydrocarbons and heavier residues. Almost all ofthese treatment and conversion processes are ofproprietary designed and are licensed by refiners.
(ii) CrackingSome of the processes downstream of the CDU aredesigned to break the longer or larger molecules intosmaller ones. The term used in the refinery industryfor the breaking of larger hydrocarbon moleculesinto smaller ones is ‘cracking’. This type of processusually involves the use of a catalyst and/or highpressure; hence the term ‘cat cracker’ - i.e. acracking process using a catalyst. One of the mostcommon cracking processes on a refinery is a‘fluidised catalytic cracker unit’ (FCCU). Thisoperates on the basis of catalyst being suspended ina turbulent mixture of hydrocarbon and hydrocarbonvapour. The FCCU is the main process unit for theproduction of gasoline on a refinery.

R&D Publication 2184
(iii) HydrocrackingThis is a high temperature, high pressure crackingprocess, principally designed to produce goodquality distillate fuels such as diesel and aviationfuel from heavier (higher boiling point) poorerquality feedstock. The process is very flexible,however, and can produce a wide range ofessentially zero sulphur products including gasoline.
(iv) ReformingAnother important refinery process is ‘reforming’.This produces, amongst other products, ring-basedhydrocarbons (aromatics) from the straighter chainmolecules. These improve the precombustion or‘knock’ properties of gasoline (petrol) when blendedinto the gasoline pool. One ring compound which isincreasingly being removed from gasoline isbenzene due to carcinogenic concerns. Other ringcompounds such as xylenes and toluenes are alsosometimes removed as feedstocks for thepetrochemical industry.
(v) Isomer isation and alkylationBranched chained hydrocarbons also have better‘anti-knock’ properties than straight-chainhydrocarbons. This characteristic is important forpetrol ignition engines. Various refinery processesare designed to produce branched chainshydrocarbons, these include such process units asisomerisation and alkylation.
(vi) VisbreakerThis is a mild thermal cracking process designed tobreak longer chain (heavy) hydrocarbons intoshorter or lighter hydrocarbons. The main objectiveof the process is to lower the viscosity of theresulting fuel oil product. If this was not done morevaluable middle distillate would have to be added tothe fuel to meet viscosity specifications. In theprocess, the heavy oil is heated in a furnace undercarefully controlled conditions of temperature andpressure. The resulting ‘cracked’ oil is then distilledto produce the lighter products and lower viscosityfuel oil.
(vii) Synthetic fuel/gasSynfuel: The product of synfuel (short for syntheticfuel) is based on syngas, see definition below, whichis processed to produce a liquid fuel. There are arange of synfuels including methanol, but the term isgenerally used for fuels produced via the FischerTropsch process. The resulting liquid is extremelylow in sulphur and has excellent properties as a fuelfor internal combustion engines. As a resultemissions are considerably improved compared to astandard refined fuel.
Syngas: Short for synthesis gas. Synthesis gas is amixture of carbon monoxide and hydrogen. It can beproduced by the reforming of carbon, includingcoal, or hydrocarbons. Various process routes areavailable based on reaction with steam and/oroxygen. Sulphur can be removed before or afterreforming depending on the process.
(vii) Bottom of the bar rel processesThe ‘heavy’ (high boiling point) black residues thatremain after vacuum distillation can be furthertreated to produce more valuable ‘lighter’ or lowerboiling point products. What remains after theseprocesses have been applied is usually asphalt/pitchor even petroleum coke (carbon). Processes to refinethese heavy black residues include, visbreaking, andcoking, solvent deasphalting and residue cracking.Alternatively, the heavy less useable hydrocarbonscan be gasified to produce synthesis gas (hydrogenand carbon monoxide), and in turn power fuels orchemical feed stocks.
Sulphur removalSulphur in fuels leads to the emission of sulphurdioxide when the fuel is burnt. Therefore a numberof processes on a refinery are designed to reduce thesulphur in refinery products as much as possible.Sulphur removal processes have a number of namesand include hydrotreatment, hydrodesulphurisationand hydrofining.
DOW SulferoxThis is the proprietary licensed process to removehydrogen sulphide from gas streams by contactingwith a liquid which chemically absorbs the sulphur.The liquid yields elemental sulphur uponregeneration with air in a sparged tank. The processdiffers from other recovery processes in that sulphuris recovered in an elemental form withoutcombustion. The process has an economic capacityrange which places it between fixed bed absorbentsand Claus type processes. Another licensor of asimilar process is US Filter.
Sulphur Recovery plantWhen sulphur is removed from hydrocarbonproducts or feedstocks it is normally produced in theform of hydrogen sulphide gas (which smells ofrotten eggs at low concentrations). This gas isrecovered and is then piped to the sulphur recoveryplant which converts the gas to elemental sulphur.With modern technology, 99% or more of thesulphur fed to the sulphur plant can be recovered.
Flar ingWhen operating all the processes referred to above,there comes a point when it is no longer economic torecover small amounts of gases. In suchcircumstance these are piped to an elevated flare andburnt. The flare also acts as a safety system in caseof a sudden need to discharge combustible gases.

R&D Publication 2185
Energy demandsMany refinery processes have large demands forenergy, in the form of electrical power, for examplefor driving electric motors for pumps andcompressors and in the form of direct heating viafurnaces and indirect heating via steam. To make arefinery as economic as possible a large amount ofheat and energy recovery is therefore designed intothe processing units, most of which are ‘heatintegrated’.
Emissions to AirFurnaces (fired heaters) and boilers for theproduction of steam result in the emission to airfrom the combustion of fuel fired in these types offacility. Emissions to air also result from fluidisedcatalytic cracking where carbon which accumulateson the catalyst is burnt off. Other processes such ascoking can also have significant release to air.Leakage and evaporation of hydrocarbons whenexposed to air results in release of volatile organiccompounds (VOCs).
Effluent and Solid WastesAs with all industrial processes, with liquid oilyeffluents and solid wastes are produced althoughcompared with some other types of industrialprocesses the amounts of solid wastes per unitweight of products are relatively small. Facilities areprovided to treat these effluent and wastes.
Offsites and UtilitiesThese are terms used in the refinery industry.Offsites include storage and handling, includingloading and offloading of crude oil, intermediateproducts and final products. Offsites also usuallyinclude blending facilities, flares and buildings.
Utilities normally include the plant and equipmentneeded to provide such systems as steam at variouspressures, power, nitrogen, air, fuel gas, water andeffluent treatment.
Usually the offsites and utilities cover a larger plotarea on a refinery than the processing units.

R&D Publication 2186
Blank page intentional
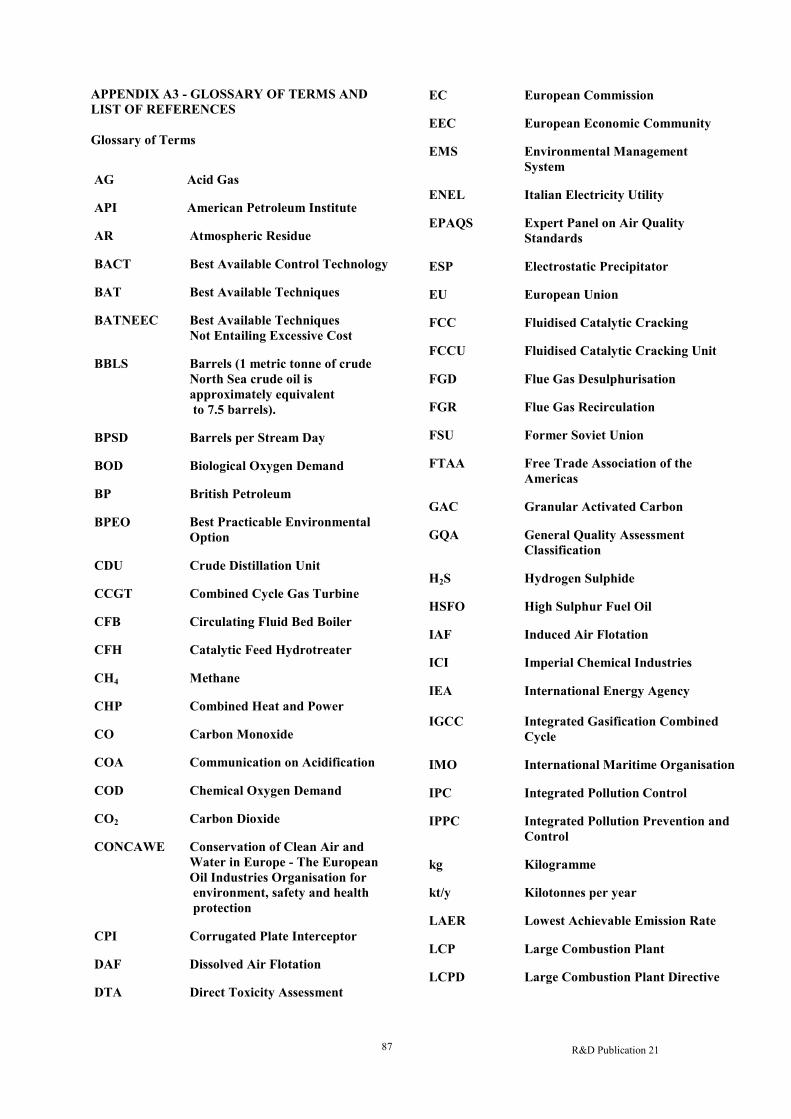
R&D Publication 2187
APPENDIX A3 - GLOSSARY OF TERMS ANDLIST OF REFERENCES
Glossary of Ter ms
AG Acid Gas
API Amer ican Petroleum Institute
AR Atmospher ic Residue
BACT Best Available Control Technology
BAT Best Available Techniques
BATNEEC Best Available TechniquesNot Entailing Excessive Cost
BBLS Barrels (1 metr ic tonne of crudeNor th Sea crude oil isapproximately equivalent to 7.5 bar rels).
BPSD Barrels per Stream Day
BOD Biological Oxygen Demand
BP British Petroleum
BPEO Best Practicable EnvironmentalOption
CDU Crude Distillation Unit
CCGT Combined Cycle Gas Turbine
CFB Circulating Fluid Bed Boiler
CFH Catalytic Feed Hydrotreater
CH4 Methane
CHP Combined Heat and Power
CO Carbon Monoxide
COA Communication on Acidification
COD Chemical Oxygen Demand
CO2 Carbon Dioxide
CONCAWE Conservation of Clean Air andWater in Europe - The EuropeanOil Industr ies Organisation for environment, safety and health protection
CPI Corrugated Plate Interceptor
DAF Dissolved Air Flotation
DTA Direct Toxicity Assessment
EC European Commission
EEC European Economic Community
EMS Environmental ManagementSystem
ENEL Italian Electr icity Utility
EPAQS Exper t Panel on Air QualityStandards
ESP Electrostatic Precipitator
EU European Union
FCC Fluidised Catalytic Cracking
FCCU Fluidised Catalytic Cracking Unit
FGD Flue Gas Desulphur isation
FGR Flue Gas Recirculation
FSU For mer Soviet Union
FTAA Free Trade Association of theAmer icas
GAC Granular Activated Carbon
GQA General Quality AssessmentClassification
H2S Hydrogen Sulphide
HSFO High Sulphur Fuel Oil
IAF Induced Air Flotation
ICI Imper ial Chemical Industr ies
IEA
IGCC
International Energy Agency
Integrated Gasification CombinedCycle
IMO International Mar itime Organisation
IPC Integrated Pollution Control
IPPC Integrated Pollution Prevention andControl
kg Kilogramme
kt/y Kilotonnes per year
LAER Lowest Achievable Emission Rate
LCP Large Combustion Plant
LCPD Large Combustion Plant Directive
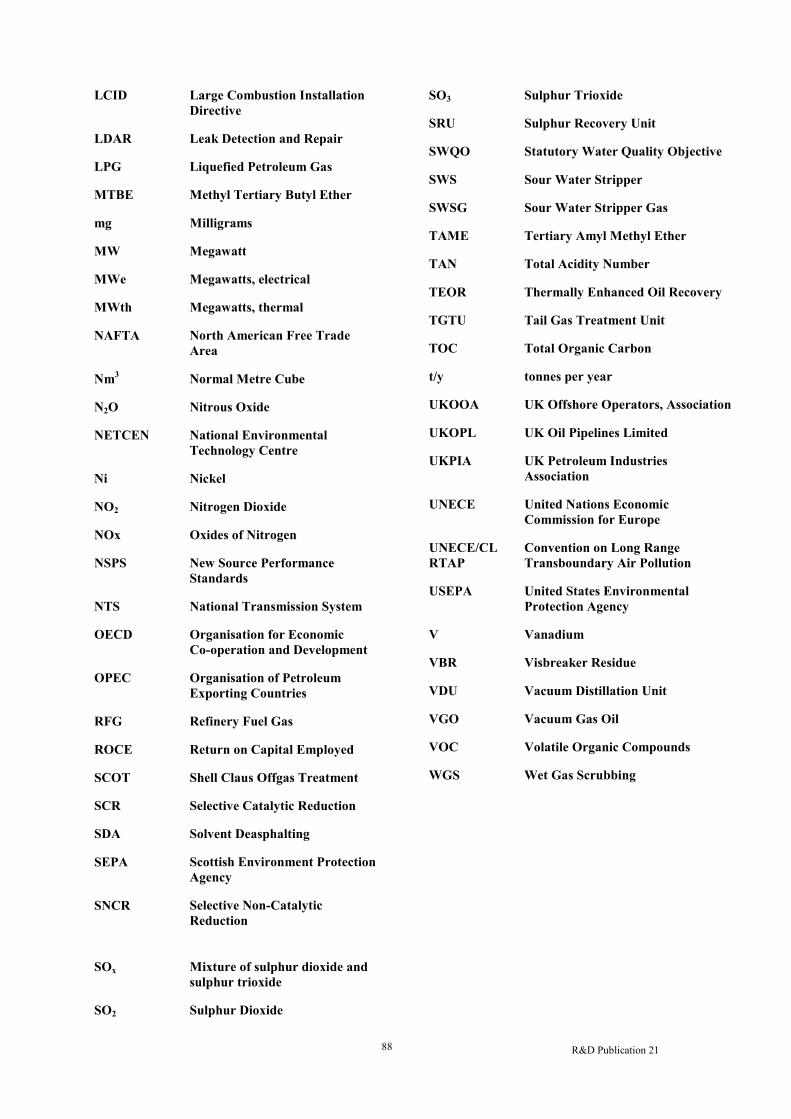
R&D Publication 2188
LCID Large Combustion InstallationDirective
LDAR Leak Detection and Repair
LPG Liquefied Petroleum Gas
MTBE Methyl Ter tiary Butyl Ether
mg Milligrams
MW Megawatt
MWe Megawatts, electr ical
MWth Megawatts, ther mal
NAFTA Nor th Amer ican Free TradeArea
Nm3 Normal Metre Cube
N2O Nitrous Oxide
NETCEN National EnvironmentalTechnology Centre
Ni Nickel
NO2 Nitrogen Dioxide
NOx Oxides of Nitrogen
NSPS New Source Per formanceStandards
NTS National Transmission System
OECD Organisation for EconomicCo-operation and Development
OPEC Organisation of PetroleumExpor ting Countr ies
RFG Refinery Fuel Gas
ROCE Return on Capital Employed
SCOT Shell Claus Offgas Treatment
SCR Selective Catalytic Reduction
SDA Solvent Deasphalting
SEPA Scottish Environment ProtectionAgency
SNCR Selective Non-CatalyticReduction
SOx Mixture of sulphur dioxide andsulphur tr ioxide
SO2 Sulphur Dioxide
SO3 Sulphur Tr ioxide
SRU Sulphur Recovery Unit
SWQO Statutory Water Quality Objective
SWS Sour Water Str ipper
SWSG Sour Water Str ipper Gas
TAME Ter tiary Amyl Methyl Ether
TAN Total Acidity Number
TEOR Thermally Enhanced Oil Recovery
TGTU Tail Gas Treatment Unit
TOC Total Organic Carbon
t/y tonnes per year
UKOOA UK Offshore Operators, Association
UKOPL UK Oil Pipelines Limited
UKPIA UK Petroleum Industr iesAssociation
UNECE United Nations EconomicCommission for Europe
UNECE/CLRTAP
Convention on Long RangeTransboundary Air Pollution
USEPA United States EnvironmentalProtection Agency
V Vanadium
VBR Visbreaker Residue
VDU Vacuum Distillation Unit
VGO Vacuum Gas Oil
VOC Volatile Organic Compounds
WGS Wet Gas Scrubbing
R&D Publication 2189
LIST OF REFERENCES
BP (June 1997), Statistical Review of Wor ldEnergy
BP (1997) Rolf Stomberg London Conference.
Chevron (1997) Annual Repor t 1997,Chevron: Building on Success page 22.
Communication from Exxon Engineer ingTechnology Depar tment (December 1997) WetGas Scrubbing Cost and Per formance data.Communication from the Commission to theCouncil and European Par liament (18 September1989), a community Strategy for WasteManagement, SEC(89)934.
CONCAWE (Apr il 1996) sulphur dioxideemissions from oil r efiner ies and combustion of oilproducts in Western Europe (1992) ReportNo.6/94.
Data base held by Foster Wheeler EnvironmentalCorporation, Livingston NJ Communication 1997.Summary of USEPA Best Available ControlTechnology Data.
Depar tment of the Environment (December 1995)Development of a National Waste ClassificationScheme, Stage 2 A system for clar ifying wastes. Aconsultation Draft.
Depar tment of the Environment (September 1996)EPA 1990 Par t IIA: Contaminated Land,Consultation on Draft Statutory Guidance onContaminated Land Vol. I and II.
DOE White Paper (1995) Making Waste Work: AStrategy for Sustainable Waste Management inEngland and Wales.
DTi, (1996) UK digest of energy statistics.
Environment Agency, (1997) Guidance forOperators and Inspectors of IPC Processes,Effluent Treatment Techniques.
Environment Agency, 1997, Communicationof information from the public register .
Environment Agency Author isation under IPCNo. AF8173, Var iation Notice Number AW7789Conoco Ltd, Humber Refinery, 01.05.97.
Environment Agency Author isation Under IPCNo. AF7215, Var iation Notice Number AW0318Phillips Imper ial Petroleum Limited,Middlesborough 24.03.97.
Environment Agency Author isation Under IPCNo. AF6928, Var iation Number AZ4948 LindseyOil Refinery, Nor th Lincolnshire 10.10.97.
Environment Agency Author isation Under IPCNo. AF8394, Shell UK Limited, StanlowManufactur ing Complex, 30.04.98.
Environment Agency Author isation Under IPCNo. AX4220, Texaco Limited and PembrokeCracking Company, Pembroke Plant, 21.03.97.
Environment Agency Author isation Under IPCNo. AF6910, Shell Haven Refinery, Essex,01.11.93.
Environment Agency Author isation Under IPCNo. AF7886, Var iation Number AQ9626 Elf OilUK Limited, Milford Haven Refinery, 01.08.96.
Environment Agency Author isation Under IPCNo. AA2917 for combustion processes var iationAV1980 09.04.96 and author isation for petroleumprocess AF8009 31.03.98 Esso Refinery, Fawley.
Environment Agency Author isation Under IPCAF7860, Var iation Notice AX7318, Gulf OilRefinery Limited, Waterston Refinery, 01.04.97.
Environment Agency Author isation under IPCNo. AF8050 for Petroleum Process, 09.07.93, No.AA3387, Var iation No. AP5617 for combustionprocess, 01.01.95, Mobil Oil Company Limited,Coryton Refinery.
Environment Agency Author isation Under IPCNo. AF7843, Var iation No. AU3499 for PetroleumProcess 27.03.96, Author isation No. AJ0329 forCombustion Processes 06.08.93 for BP OilLlandarcy Refinery Ltd, West Glamorgan.
Environment News No. 17 (1995) EnvironmentalAdministration in Denmark, Ministry ofEnvironment of Energy Denmar k.
Environmental Quality Standards Division,Office of the National Environment Board,Thailand.
European Commission (18 Apr il 1998) DGX1Directorate E. Agenda of Meeting of Exper tsfrom Member States on the revision of theDirective 88/609/EEC Alimitation of emissionof cer tain pollutants into the air from largecombustion plants @ (LCP Directive),

R&D Publication 2190
contained, Draft Proposal for a new Directiveon Large Combustion Installations.
European Commission (1997) Proposal for aCouncil Directive on the landfill of waste (97/C156108) COM(97) 105 final -97/0085(SYN). OJ 24May 1997.
European Commission (1997) Proposal for aCouncil Directive on the Incineration of Waste.Working Paper .
European Commission (12 March 1997)Proposal for a Council Directive relating to areduction of the sulphur content of cer tainliquid fuels and amending directive93/12/EEC COM(97)88 final 97/0105 (SYN).
European Commission (18 June 1996)Proposal for Directive relating to the qualityof petrol and diesel fuels and amendingCouncil Directive 93/12/EEC (COM (96)248COD 9616).
European Communities (1996) CouncilDirective 96/61/EC 24 September 1996concerning integrated pollution preventionand control OJ No. L257/26 10.10.96.
European Commission (1994) Council Directive94/67/EC of 16 December 1994 on the incinerationof hazardous waste. OJ No. L365/34. 31 December1994.
European Commission (23 March 1993)Communication to the council and theEuropean Par liament on a Communitystrategy to combat acidification COM(97)88final 97/0105(SYN).
European Commission (23 March 1993)Council Directive 93/12/EEC of 23 March1993 relating to the sulphur content of cer tainliquid fuels. OJ No. L074,27/03/93 P0081.
European Communities (1988) Councildirective of 24 November 1988 on thelimitation of emissions of cer tain pollutantsinto the air from large combustion plants88/609/EEC.
Her Majesty's Inspectorate of Pollution (1995)Chief Inspectors Guidance Note Oil Refining andassociated processes S2 1.10, HMSO.
HMSO (1990) Environmental Protection Act1990, Par t 1.
Institute of Petroleum IP Statics Service,Library and information service.
International Mar itime Organisation (17March 1987)Conference of par ties to theinternational convention for the prevention ofpollution from ships 1973. Agenda Item 6MP/Cont. 3/3.
Oil Gas (1994) European Magazine 2/1994,Upgrading Shells Pernis Refinery for ImprovedEnvironmental Per for mance Author T. De Jong,Refinery Manager .
Petroleum Economics Ltd (PEL) (1996),Oil and Energy Outlook Repor t
Petroleum Economics Ltd (PEL) Presentation(March 1997),The Market for Middle East Crude in theAtlantic – Middle East Petroleum and GasConference (Abu Dhabi)
Pollution Handbook (1998) National Society forClean Air and Environmental Protection.
Pollution Prevention and Abatement Handbook:Towards Cleaner Production, Wor ld Bank (Draft1997).
Purvin and Ger tz (1997), Wor ld Crude Oiland Refining to 2015:The Shifting Balance in the Atlantic Basin
Presentation made by Johnson Matthey tointernal Forum at Foster Wheeler (4th December1997).
Research and Development Collaborative,including the EA (1997-98). Direct ToxicityAssessment (DTA), cur rent update issues No. 3,Apr il 1998. Contact Derek Tinsley E. A.
Salway AG et. al. (1997) UK Emissions of AirPollutants 1970-1995. AEA Technology forthe Depar tment of the Environment.
Salway A G et. Al. (1996) UK Emissions of AirPollutants 1970-1994. AEA Technology forthe Depar tment of the Environment.
Scottish Environmental Protection AgencyAuthor isation Under IPC No. IPC/001/92 forcombustion process, 11.12.92. Author isation No.IPC/034/1993 Var iation IPJ /1/CB/2 for petroleumprocess 3.01.97, BP Oil Grangemouth RefineryLimited.
Spiers H. M. (1961) Technical Data on Fuel.Br itish National Committee Wor ld PowerConference.

R&D Publication 2191
UKPIA (Summer 1997) Oil Review, thereview of the oil r efining and marketingindustry in non-competitive areas.
United Nation's Conference on Environment andDevelopment (June 1992) contained theFramework Convention of the Atmosphere(Climate Treaty).
United Nations Economic Commission for Europe(1991) Protocol to the Long Range TransboundaryAir Pollution concerning the Control of Emissionsof Volatile Organic Compound or theirTransboundary Flumes, (ECE/EB.Air /30).
USEPA (1995) New Source Per formance Standardfor Petroleum Refiner ies, 40CFR 60, Subpar t J .
USEPA (September 1995) EPA Office ofCompliance Sector Notebook Project, Profile ofthe Petroleum Refinery Industry. USEPA Officeof Enforcement and Compliance Assurance.Washington DC (Publication No. EPA/310-R-95-013).
WEFA Energy (2 December 1996) ConferenceProceedings, Fuel Oil Markets workshop,London.
Wood Mackenzie (May 1997), The EnergyIndustry in the 21st Century.– European and Industry Overview
Wood Mackenzie (Jan 1997), Nor th SeaRepor t – Supplement

R&D Publication 2192