a statistical method for predicting automobile driving...
TRANSCRIPT
A Statistical Method for Predicting AutomobileDriving Posture
Matthew R Reed, Miriam A. Manary, Carol A. C. Flannagan, and Lawrence W.Schneider, University of Michigan Transportation Research Institute, Ann Arbor, Michigan
A new model for predicting automobile driving posture is presented. The model,based on data from a study of 68 men and women in 18 vehicle package and seatconditions, is designed for use in posturing the human figure models that areincreasingly used for vehicle interior design. The model uses a series of indepen-dent regression models, coupled with data-guided inverse kinematics, to fit awhole-body linkage. An important characteristic of the new model is that it placesgreatest importance on prediction accuracy for the body locations that are mostimportant for vehicle interior design: eye location and hip location. The modelpredictions were compared with the driving postures of 120 men and women infive vehicles. Errors in mean eye location predictions in the vehicles were typicallyless than 10 mm. Prediction errors were largely independent of anthropometricvariables and vehicle layout. Although the average posture of a group of peoplecan be predicted accurately, individuals' postures cannot be predicted preciselybecause of interindividual posture variance that is unrelated to key anthropometricvariables. The posture prediction models developed in this research can be appliedto posturing computer-rendered human models to improve the accuracy ofergonomic assessments of vehicle interiors.
INTRODUCTION
The design of passenger car interiors isnow commonly facilitated by the use of three-dimensional (3-D) human representations thatcan be manipulated in a computer environment(Porter, Case, Freer, & Bonney, 1993). Thesecomputer-aided-design (CAD) human modelshave increased in sophistication in recent yearswith advances in computer hardware and soft-ware, but their effective use is hampered by thelack of valid methods to set the posture ofthe models in the simulated vehicle interior.
In the mid-1950s, Dempster (1955) intro-duced an approach to ergonomic assessment forseated vehicle occupants using an articulated,two-dimensional (2-D) template. A similar tem-plate design and a weighted 3-D manikin formeasurements in actual vehicles were standard-ized in the mid-1 960s for passenger car interior
design by the Society of Automotive Engineersin Recommended Practice J826. In this textSAE Jn refers to a Society of Automotive Engi-neers (SAE) Recommended Practice, publishedin the Automotive Engineering Handbook (SAE,2001). These two tools, the 2-D template andthe 3-D H-point machine, are still widely usedfor designing vehicle interiors but are supple-mented by statistical tools that predict the dis-tributions of particular posture characteristicsfor the U.S. population. These task-orientedpercentile models, based on posture data froma number of studies, are available for driver-selected seat position (SAE J1517), eye position(J941), reach (J287), and head location (J1052).See Roe (1993) for a thorough review of theuse of these tools in contemporary occupantpackaging.
Although the existing task-oriented percentilemodels are very useful for vehicle design, they
Address correspondence to Matthew P. Reed, University of Michigan Transportation Research Institute, 2901 Baxter Rd.,Ann Arbor, MI 48109-2150; [email protected]. HUMAN FACTORS, Vol. 44, No. 4, Winter 2002, pp. 557-568.Copyright © 2002, Human Factors and Ergonomics Society. All rights reserved.
Winter 2002 - Human Factors
are not directly applicable to the posturing ofhuman figure models because they address thepopulation distribution of particular posturecharacteristics, rather than predict the pos-ture for any particular anthropometric category.For example, the SAE "eyellipse" provides aprediction of the mean and distribution of drivereye locations but does not predict the eye loca-tion for women 1550mm tall or men 1800mmtall. This more detailed information is necessaryto establish an accurate posture for a particularinstance of a CAD human model, which neces-sarily represents a single set of anthropometricvariable values.
As computer technology has developed,CAD models have been created to simulate the2- and 3-D physical manikins, supplementedby more complete 3-D human representations.Porter et al. (1993) briefly reviewed the featuresof 13 human-modeling systems in use prior to1993 with potential application to vehicle de-sign. Software development moves rapidly, how-ever, and the two models most widely used forvehicle interior design at the time of this writ-ing - Jack (EDS-PLM Solutions, Cypress, CA)and Tecmath's RAMSIS (Human Solutions,GmbH, Kaiserslautern, Germany) - were notmentioned in the Porter et al. review.
One impediment to more widespread use ofhuman models for vehicle design has been alack of valid posture prediction. Without pos-ture-prediction capability built into the modelor available through other external data orstatistical models, many of the most useful ap-plications of the CAD human models are unreli-able. For example, vision and reach assessmentsrequire an accurate starting posture for the par-ticular manikin dimensions being used. In theabsence of accurate posture prediction, CADhuman models are valuable primarily for visual-ization rather than for ergonomic assessment.
Few published studies are applicable to pos-ture prediction for vehicle occupants. In manyearly studies data were presented only in theaggregate or in terms of a population distri-bution, so the findings are not applicable tohuman model posture (Hammond & Roe, 1972;Meldrum, 1965; Phillipart, Roe, Arnold, &Kuechenmeister, 1984). Seidl (1994) presentedthe most complete approach to whole-bodydriving posture prediction to date. Using pos-
ture data collected in a laboratory vehiclemockup, he developed an optimization-basedapproach that is now used with the RAMSIShuman model. The Seidl approach selects aposture consisting of the set of joint anglesthat is empirically most likely within the speci-fied kinematic constraints. This technique usesposture data collected from three vehicle con-figurations and can be interpreted as represent-ing an analogue of the driver's inherent postureselection process, but it has several importantlimitations. The posture prediction model isproprietary, and hence its validity cannot beindependently assessed except through the useof the RAMSIS software. In addition, the pos-ture prediction model cannot be applied to ahuman figure model having a different linkage.
In the current research a model to predictautomobile driver postures was developedusing driving posture data obtained from a lab-oratory study of 68 men and women in vehicleand seat configurations that span a large rangeof passenger car interior geometry (Reed,Manary, Flannagan, & Schneider, 2000). Thecascade prediction model (CPM) places thehighest priority on accurate prediction of hipand eye locations, two of the posture charac-teristics that are most important for vehicleinterior assessment. The CPM was also devel-oped specifically to be suitable for use with anyhuman figure model and to be capable of rep-resentation in closed form. As such the perfor-mance of the CPM as implemented in a figuremodel can be verified by reference to pub-lished functions, an important check that is notpossible with the RAMSIS posture predictionapproach. The prediction accuracy of the CPMwas assessed using the original laboratory dataand data from a separate study of driving pos-ture in five vehicles.
METHODS
Model Development MethodologyFigure 1 shows the model development ap-
proach schematically. Data from a laboratorystudy with 68 drivers were used to develop theposture prediction model. The model was sub-sequently validated by comparison with thepostures of 120 drivers in five vehicles.
The laboratory study methods and results
558
I 6%l-rl cv. - -rw A- I-AM F vi S 559
Figure 1. Schematic of model development and validation.
were described in a previous paper (Reed et al.,2000). An anthropometrically diverse group of68 men and women selected their preferreddriving postures in a vehicle mockup that wasconfigured to represent a wide range of vehicleinterior conditions. The participants were ap-proximately evenly distributed in stature, fromunder 1500 mm to over 1900 mm tall. The pre-ferred driving posture for each participant wasrecorded for 18 combinations of seat height,seat cushion angle, and fore-aft steering wheelposition. The vehicle package configurationsranged from those typical of small, sporty carsto those typical of minivans and sport utilityvehicles (SUVs). The steering wheel fore-aftposition was varied over a 200-mm range forseat heights (SAE H30; Society of AutomotiveEngineers, 2002) of 180, 270, and 360 mm.
Driver posture was recorded by using asonic digitizer to record the 3-D locations of 23body landmarks. The external landmark datawere used to calculate internal joint locationsusing methods described in Reed, Manary, andSchneider (1999). For example, the locations ofthe hip joints were calculated from the measuredlocations of the left and right anterior-superioriliac spine and pubic symphysis landmarks usingoffset vectors developed from cadaveric studies(Bell, Pedersen, & Brand, 1990; Reynolds, Snow,& Young, 1981; Seidel, Marchinda, Dijkers, &Soutas-Little, 1995). The joint locations define
a kinematic linkage representation of the humanbody shown in Figure 2. Additional detailsconcerning the data collection methodologyare in Reed et al. (2000).
Vehicle Package GeometryDriver posture prediction is conducted in a
coordinate system defined by several commonlyused vehicle reference points. The layout of thedriver workstation is referred to as the vehiclepackage. Complete definitions of these pointscan be found in SAE JI 100 and associatedpractices (SAE, 2001). The x axis in the packagecoordinate system runs positive rearward, the yaxis runs positive to the driver's right, and thez axis runs positive upward. The origin is de-fined by a different point on each axis. The ori-gin x coordinate is defined by the ball of foot(BOF) reference point, whereas the origin zcoordinate is defined by the accelerator heelpoint (AHP).
For the current analysis the origin y coordi-nate is the centerline of the driver seat. Figure 3illustrates these reference points in a side-viewschematic of the driver's station. In general termsvertical dimensions are measured from the floorand fore-aft dimensions are measured from apoint on the accelerator pedal. Dimensions thatare inputs to the posture prediction model areseat height (H30), seat cushion angle (L27),and fore-aft steering wheel position (L6).
559PDr-mrTihir. Ai ITnMnRII;= Mnvimr, POSTLJRE

560 Winter 2002 - Human Factors
z X Ar \Neck
Foream Thorax
Leg / Aebdomen
Thig Pelvis
Center Eye Point Upper Neck Joint(Atlanto-occipital)
Lwer Neck Joint
Knee < t(C7IT1)Upper Lumbar Joint
// /\ s / t~~~~~~~Tl2/1-1)Hip / /o Lower Lumbar Joint
\_Ankle ~~~~~~~(L5/Sl)
Hip-to-Eye AngleHead Angle
Neck Angle
Elbow,Ange ThoraxAngle
Abdomen Angle
Pelvis Angle
< ~~Knee Angle
Figure 2. Definitions of kinematic linkage and posture measures. Angles referenced to horizontal or verticalare x,z (sagittal) plane angles. Angles between segments (elbow angle, knee angle, and ankle angle) are mea-sured in the plane formed by the segments (included angles). Note: Neck angle is negative as shown. Allother angles are positive as shown.
560 Winter 2002 - Human Fartnr-z

PRFnWTINC AUTOMOBILE DRIVING POSTURE 561
Steering Wheel Angle
Steering WheeltoBOFX
(L6)
SeatTrack Angle L l
Ball of FootReference Point
A _~(BOF)
Accelerator.\1 _
Package Origin (0,0)
Seat Height
Seat Cushion Angle (127) (H30)
Heel Point (AHP)
x
Figure 3. Vehicle package geometry. Expressions in parentheses are nomenclature from SAE Jl 100 (SAE, 2001).
Model Structure
The posture prediction model combines theregression functions presented in Tables 1 and2 with inverse kinematics guided by additionalinformation from the input data set. The modelis intended to produce the best possible predic-tion of eye and hip locations while potentiallysacrificing some accuracy in other model de-grees of freedom. The posture of the trunk andthe right limbs is predicted, after which theright-limb posture is reflected to the left side ofthe body, in keeping with a sagittally symmet-ric definition of normal driving posture.
The model is known as the cascade predic-tion model (CPM) because the predictions areobtained using a series of submodels, each basedon the results of the previous model. The moti-vation for this approach is to provide the bestpossible prediction accuracy for the hip and eyelocations, the posture characteristics that aremost important for ergonomics assessments ofthe driver's station. Hip location is closely related
to seat position and lower extremity posture,whereas eye location is critical for vision analy-ses. In addition, this approach allows the CPMto be used with many different human figuremodel linkages and also permits the core partsof the model that predict hip and eye locationsto be used with other approaches to fitting thetorso and extremities.
Figure 4 depicts the CPM algorithm schemat-ically. The fore-aft hip location (Hipx reBOF) ispredicted directly using regression functions.The hip-to-HI-point offset vector is calculatedusing regression functions, yielding a hip travelpath in the x,z plane corresponding to,fore-aftseat position adjustment. The point along thisline with x value equal to the predicted fore-afthip location is the predicted hip location in thex,z plane; The y coordinates of the left andright hip joints are set so that each hip jointlies equidistant from the seat centerline, plac-ing the torso segments in the x,z plane of theseat centerline.
Eye location in relation to the hip is then
z
AcceleratorPedal
561PpiznirTiNr. AtIMMORILE DRiVlNG POSTURE
562Winter 2002 - Hiim�n F�,-fnrc
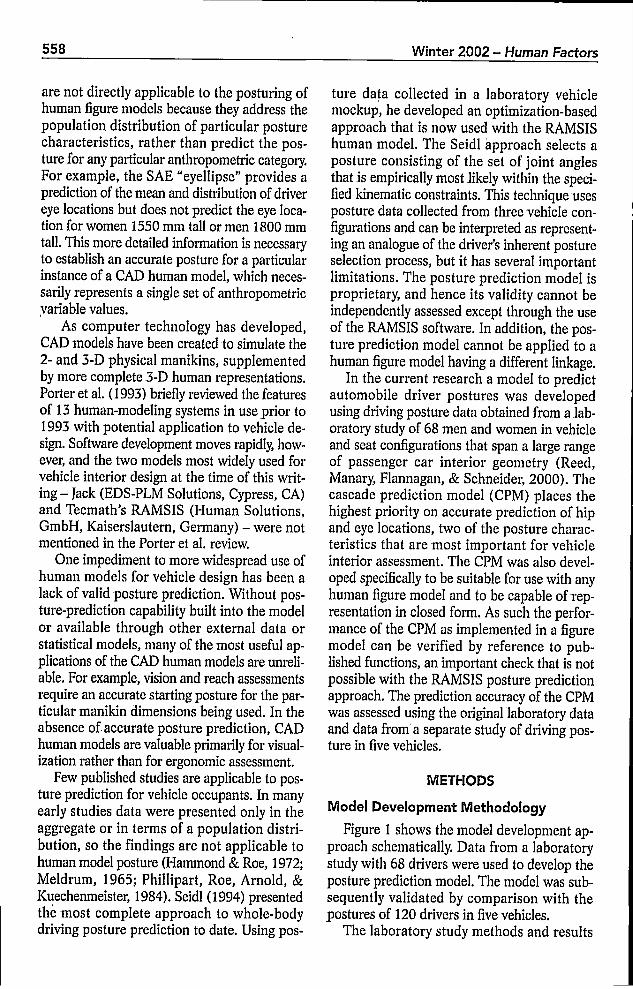
TABLE 1: Regression Models
Sitting Seat SW to CushionVariable Stature Height/ Height BOFx Angle(mm or0) Intercept (mm) Stature (H30; mm) (L6; mm) (L27; 0) 12adj RMSE
Hipx reBOFHip-to-eye angleEyex reBOFEyez reAHPEyex reHipEyez reHipAnklex reBOFAnklex reAPedalAnklez reAHPKnee angleHead angleNeck angleThorax angleAbdomen anglePelvis angle
84.8-72.7
-836.6-267.1-916.0-261.5-300.2
46.18.4
69.1-156.2
16.1-42.7-94.5-16.3
0.46590.006420.58420.31220.11870.33360.0400
-0.04660.0312
-0.00710.00919
-0.011970.004970.01090.0102
-430.1115.7916.6679.9
1347.2675.8467.6
61.3137.5
45.2184.5
90.2
-0.1732
-0.15591.0319
0.1746
0.1236-0.0321
0.44790.01470.61010.02920.1563
-0.05440.1358
0.0829
0.01090.01280.02220.0177
-1.040.11
1.15
1.3
0.55-0.59
0.39
.78
.20
.71.89.23.72.32.05.25.44.03.04.03.09.04
35.93.9
50.921.841.722.918.023.213.17.7
10.67.76.19.7
10.0Note: linear model created by multiplying each term in the table by the value of the column variable and adding a constant intercept.BOF - ball of foot; AHP = accelerator heel point; APedal - accelerator pedal; SW - steering wheel.
calculated using the regression functions inTable 1. With respect to the original data set,predicting the eye location relative to the hiplocation and relative to AHP/BOF gives essen-tially identical results. However, the indirectprocedure avoids potential errors associatedwith seat track angles different from the angleused in testing. The predicted eye location isthe center eye point, a point on the midline ofthe body that has a z coordinate equal to thecorner-of-eye landmark and an x coordinateequal to the infraorbitale landmark. This makesit possible to conduct calculations of all torsosegments in a plane.
An inverse kinematics submodel is used tofit the kinematic linkage representation of thetorso to the predicted hip and eye locations. Re-gression analyses were performed using valuesof torso segment orientation and overall recline(hip-to-eye) angle after subtracting participant
means. The slopes of the regression functionsestimate the average change in x,z plane orien-tation of each torso segment with a change inoverall recline. These values are used to deter-mine the relative motion in the torso as the torsosegments are manipulated to match the pre-dicted hip and eye locations.
Once the torso segment orientations havebeen calculated using the inverse kinematicsprocedure, upper-extremity posture is calculat-ed using inverse kinematics and employing thecalculated shoulder locations and the hand griplocations. Consistent with observations fromthe laboratory study, note that the locationsof the hands on the steering wheel do not af-fect the torso posture. Rather, the torso postureand hand grip locations determine the upper-extremity joint angles. An analogous process isused to fit the thigh and leg segments to thepredicted hip and ankle locations.
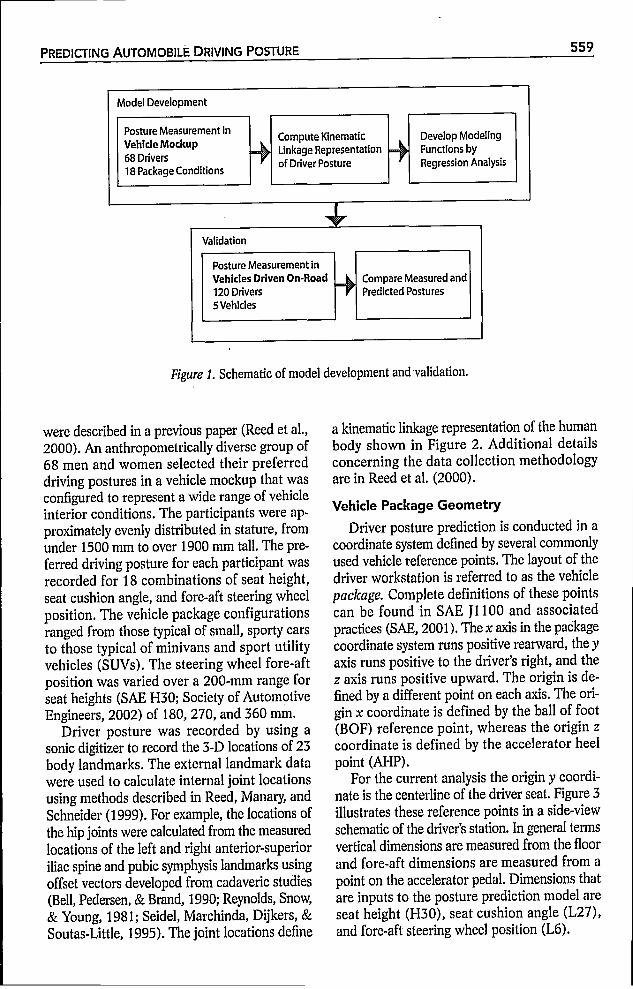
TABLE 2: Regression Models for H-Point Location
BodyMass Seat SW to Cushion
Stature Index Fleight BOFx AngleVariable Intercept (mm) (kg/M2) (H30; mm) (mm) (0) R2adj RMSE
Hipx reHPt -131.5 0.0482 -2.677 - - 5.00 0.34 27.6Hipz reHPt -143.4 - 2.009 0.0700 0.1375 0.49 0.40 13.7Note: Linear model created by multiplying each term in the table by the value of the column variable and adding a constant intercept.SW - steering wheel; BOF - ball of foot; HPt - H point
Wintpr 20W - ktimnn Jz_n,-+,,rc

PI\nVIrur1 AV DRIVING POSTURE 5 63
0A
4
C
4-.
Figure 4. Information flow schematic of cascade prediction model (CPM) and step-by-step sequence.A: Predict hip and eye locations. B: Fit torso segments by inverse kinematics using data-based motion distribu-tion. C: Fit limb segments by inverse kinematics using splay data. D: Fit full 3-D model to kinematic linkage.SW = steering wheel, SgRP = seating reference point, BOF = ball of foot.
Regression Modeling
Hip and eye locations, which are the mostimportant postural degrees of freedom for ergo-nomics analysis of the driver's station, are pre-dicted by regression functions developed fromthe laboratory study data. These functions werecreated by a stepwise process following a thor-ough analysis of the study data (see Reed et al.,2000, for details of the factor effect assess-ments). Among the conclusions of the originalanalysis were that seat height, steering wheelposition, and seat cushion angle all have signif-icant independent effects on posture.
Data from all participants and trials werepooled in the analysis. A stepwise regressiontechnique was applied with the potential regres-sors of stature, body mass index, sitting heightdivided by stature, seat height (H30), steeringwheel to BOF distance (L6), and seat cushionangle (L27). Body mass index (weight in kilo-grams divided by stature in meters squared) wasused rather than body weight to reduce theproblems associated with correlated regressors.For the same reason, the ratio of sitting height tostature was used rather than sitting height itself.
An automated algorithm selected a modelusing p < .25 to enter and p > .10 to leave, after
563PpiznirTimr. Ai IMMMIIF DRIVING POSTURE
564~~~~~ Wine 200 v ua atr
which manual selections were made to obtain aparsimonious model that maintained an adjust-ed R2 value within .02 of the maximum valueobtained by the automated procedure. Tables 1and 2 summarize the regression models forposture variables of interest. All terms includ-ed in the models are significant with p < .001,as are the models themselves. No interactionterms are included in these models because nosignificant interactions between the potentialpredictors were found (see Reed et al., 2000,for more analysis of potential factor interac-tions in this data set).
In-Vehicle Study MethodsThe validity of the posture prediction model
was assessed by reference to data from a sepa-rate in-vehicle study reported in Manary, Flan-nagan, Reed, and Schneider (1 998). As part ofthat study, 120 men and women ranging instature from 1441 to 1952 mm tall drove fivevehicles (a sports car, two sedans, a minivan,and an SUV) that ranged in seat height from189 to 326 mm.
Each participant drove each vehicle over a15-min road route, adjusting the seat trackposition and seat back angle to obtain a com-fortable driving posture. Each car was equippedwith automatic transmission and was testedwith the seat track adjustment restricted totwo-way (fore-aft) travel. After drivers returnedfrom the road route, their posture was recordedusing a mechanical coordinate measurementarm and procedures similar to those used in thelaboratory. These procedures have been usedextensively in other studies (e.g., Flannagan,Manary, Schneider, & Reed, 1998; Flanna-gan, Schneider, & Manary, 1996) and have beenshown to produce reliable measures of normaldriving posture. The in-vehicle data used inthis analysis were also used in the developmentof the most recent revision to the SAE "eyel-lipse" (Manary et al., 1998).
RESULTS
Model Assessment: Original DataThere are two general areas of concern in
assessing model performance. First, the abilityof the models to match the original data usedto construct the models is assessed. Second,
the predictive ability of the models is evaluatedusing new data collected in vehicles. Becauseeye location is one of the most important char-acteristics of the posture prediction, quantita-tive assessments of the models will focus oneye location.
For the original data, observed and predictedeye locations differ by 0.9 mm in the x directionand -0.4 mm in the z direction. The standarddeviation of the errors, a measure of the resid-ual posture variance not accounted for by themodel predictions, is about 51 mm for the xcoordinate and about 20 mm for the z coordi-nate. These values are similar to the root meansquare error (RMSE) values for the direct re-gression prediction of the eye location in Table 1,indicating that the model prediction precisionis similar to the precision obtained by a directprediction.
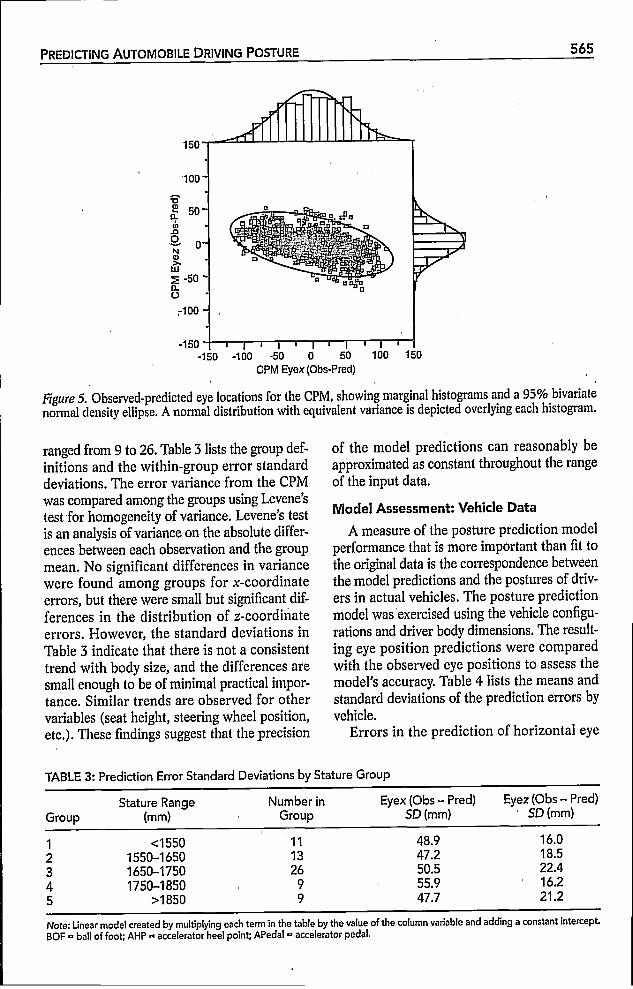
Figure 5 shows a plot of the CPM x and z axiserrors along with a 95% density ellipse. The zaxis errors are approximately normally distrib-uted (Shapiro-Wilk W test), but the x axis errorshave a broader-than-normal distribution. None-theless, the normal distributions overlying themarginal distribution plots in Figure 5 illustratethat the x,z plane prediction error distributioncan reasonably be approximated as bivariatenormal.
The correlation among the errors is attribut-able to the effects of the principal ways in whichposture selection behavior can deviate from theprediction. People can select a seat position orrecline angle that is different from that predict-ed. Both deviations tend to cause a movementof the eye along an inclined side-view path.Seat position prediction errors result in dis-crepancies along a path having the same slopeas the seat track, and recline angle errors resultin errors along a slightly more inclined path.
One important question concerning the pre-diction errors is whether the prediction precisionvaries substantially with the input variables. Isthe prediction precision approximately thesame for small people and large people, or fordifferent seat heights? To address this issue wedivided the participants into five stature groupsusing 100-mm bins from 1550 to 1850 mm(three groups), and creating two groups fromthose with statures above 1850 and below 1550mm. The number of participants in each group
564 Winter 2002 - 14uman Farfnrc
PRPnI V l Ia l AuTM L DRVIN POTR 565
-150 a I I, I I a I-150 -100 -50 0 50
CPM Eyex (Obs-Pred)
Figure 5. Observed-predicted eye locations for the CPM, showing marginal histograms and a 95% bivariatenormal density ellipse. A normal distribution with equivalent variance is depicted overlying each histogram.
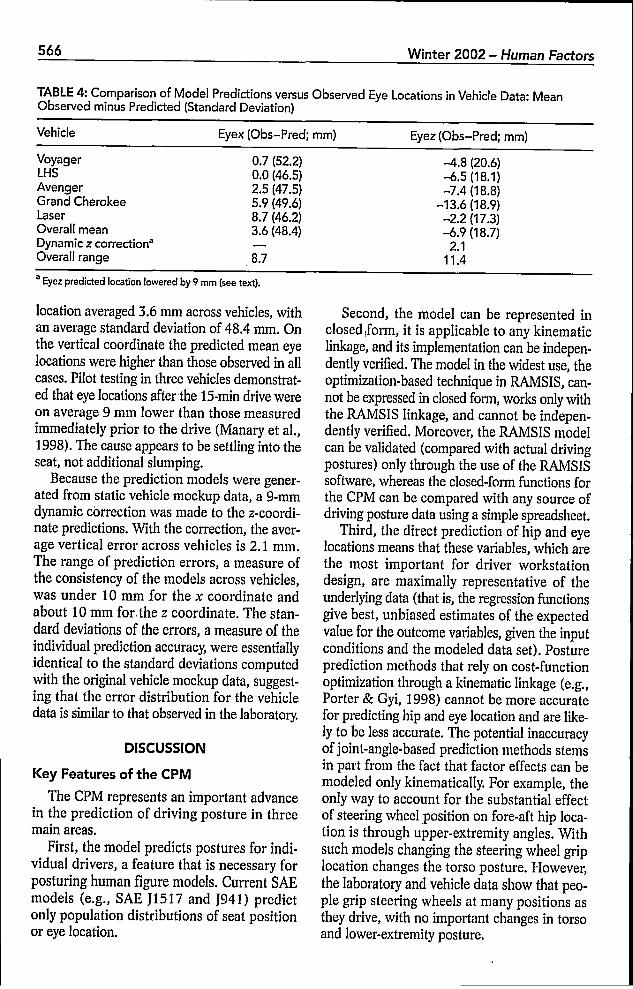
ranged from 9 to 26. Table 3 lists the group def-initions and the within-group error standarddeviations. The error variance from the CPMwas compared among the groups using Levene'stest for homogeneity of variance. Levene's testis an analysis of variance on the absolute differ-ences between each observation and the groupmean. No significant differences in variancewere found among groups for x-coordinateerrors, but there were small but significant dif-ferences in the distribution of z-coordinateerrors. However, the standard deviations inTable 3 indicate that there is not a consistenttrend with body size, and the differences aresmall enough to be of minimal practical impor-tance. Similar trends are observed for othervariables (seat height, steering wheel position,etc.). These findings suggest that the precision
of the model predictions can reasonably beapproximated as constant throughout the rangeof the input data.
Model Assessment: Vehicle Data
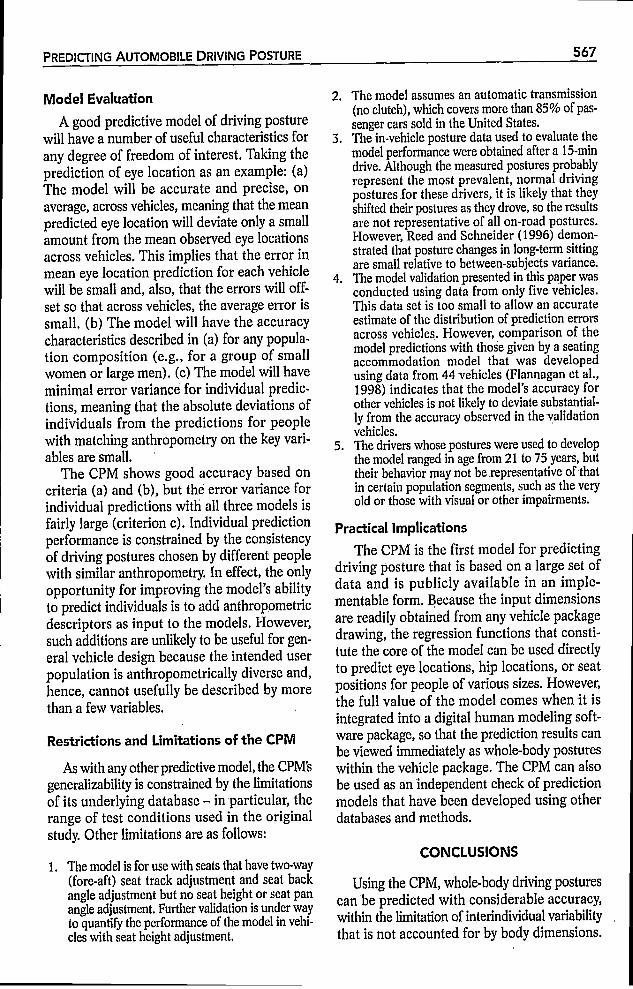
A measure of the posture prediction modelperformance that is more important than fit tothe original data is the correspondence betweenthe model predictions and the postures of driv-ers in actual vehicles. The posture predictionmodel was exercised using the vehicle configu-rations and driver body dimensions. The result-ing eye position predictions were comparedwith the observed eye positions to assess themodel's accuracy. Table 4 lists the means andstandard deviations of the prediction errors byvehicle.
Errors in the prediction of horizontal eye
TABLE 3: Prediction Error Standard Deviations by Stature Group
Stature Range Number in Eyex (Obs - Pred) Eyez (Obs - Pred)Group (mm) Group SD (mm) SD (mm)
1 <1550 11 48.9 16.02 1550-1650 13 47.2 18.53 1650-1750 26 50.5 22.44 1750-1850 9 55.9 16.25 >1850 9 47.7 21.2
Note: Linear model created by multiplying each term in the table by the value of the column variable and adding a constant interceptBOF ball of foot; AHP accelerator heel point; APedal - accelerator pedal.
565P=ntrTimr. WIMMORILF: DRiVING POSTURE
5Wnr0-HaF r
TABLE 4: Comparison of Model Predictions versus Observed Eye Locations in Vehicle Data: MeanObserved minus Predicted (Standard Deviation)
Vehicle Eyex (Obs-Pred; mm) Eyez (Obs-Pred; mm)
Voyager 0.7 (52.2) -4.8 (20.6)LHS 0.0 (46.5) -6.5 (18.1)Avenger 2.5 (47.5) -7.4 (18.8)Grand Cherokee 5.9 (49.6) -13.6 (18.9)Laser 8.7 (46.2) -2.2 (17.3)Overall mean 3.6 (48.4) -6.9 (18.7)Dynamic z correction' - 2.1Overall range 8.7 11.4
a Eyez predicted location lowered by 9 mm (see text).
location averaged 3.6 mm across vehicles, withan average standard deviation of 48.4 mm. Onthe vertical coordinate the predicted mean eyelocations were higher than those observed in allcases. Pilot testing in three vehicles demonstrat-ed that eye locations after the 15-min drive wereon average 9 mm lower than those measuredimmediately prior to the drive (Manary et al.,1998). The cause appears to be settling into theseat, not additional slumping.
Because the prediction models were gener-ated from static vehicle mockup data, a 9-mmdynamic correction was made to the z-coordi-nate predictions. With the correction, the aver-age vertical error across vehicles is 2.1 mm.The range of prediction errors, a measure ofthe consistency of the models across vehicles,was under 10 mm for the x coordinate andabout 10 mm for the z coordinate. The stan-dard deviations of the errors, a measure of theindividual prediction accuracy, were essentiallyidentical to the standard deviations computedwith the original vehicle mockup data, suggest-ing that the error distribution for the vehicledata is similar to that observed in the laboratory.
DISCUSSION
Key Features of the CPM
The CPM represents an important advancein the prediction of driving posture in threemain areas.
First, the model predicts postures for indi-vidual drivers, a feature that is necessary forposturing human figure models. Current SAEmodels (e.g., SAE J1517 and J941) predictonly population distributions of seat positionor eye location.
Second, the model can be represented inclosed,form, it is applicable to any kinematiclinkage, and its implementation can be indepen-dently verified. The model in the widest use, theoptimization-based technique in RAMSIS, can-not be expressed in closed form, works only withthe RAMSIS linkage, and cannot be indepen-dently verified. Moreover, the RAMSIS modelcan be validated (compared with actual drivingpostures) only through the use of the RAMSISsoftware, whereas the closed-form functions forthe CPM can be compared with any source ofdriving posture data using a simple spreadsheet.
Third, the direct prediction of hip and eyelocations means that these variables, which arethe most important for driver workstationdesign, are maximally representative of theunderlying data (that is, the regression functionsgive best, unbiased estimates of the expectedvalue for the outcome variables, given the inputconditions and the modeled data set). Postureprediction methods that rely on cost-functionoptimization through a kinematic linkage (e.g.,Porter & Gyi, 1998) cannot be more accuratefor predicting hip and eye location and are like-ly to be less accurate. The potential inaccuracyof joint-angle-based prediction methods stemsin part from the fact that factor effects can bemodeled only kinematically. For example, theonly way to account for the substantial effectof steering wheel position on fore-aft hip loca-tion is through upper-extremity angles. Withsuch models changing the steering wheel griplocation changes the torso posture. However,the laboratory and vehicle data show that peo-ple grip steering wheels at many positions asthey drive, with no important changes in torsoand lower-extremity posture.
566 Winter 2002 - Human Factor-s
PREDICTING AUTOMOBILE DRIVING POSTURE
Model Evaluation
A good predictive model of driving posturewill have a number of useful characteristics forany degree of freedom of interest. Taking theprediction of eye location as an example: (a)The model will be accurate and precise, onaverage, across vehicles, meaning that the meanpredicted eye location will deviate only a smallamount from the mean observed eye locationsacross vehicles. This implies that the error inmean eye location prediction for each vehiclewill be small and, also, that the errors will off-set so that across vehicles, the average error issmall. (b) The model will have the accuracycharacteristics described in (a) for any popula-tion composition (e.g., for a group of smallwomen or large men). (c) The model will haveminimal error variance for individual predic-tions, meaning that the absolute deviations ofindiViduals from the predictions for peoplewith matching anthropometry on the key vari-ables are small.
The CPM shows good accuracy based oncriteria (a) and (b), but the error variance forindividual predictions with all three models isfairly large (criterion c). Individual predictionperformance is constrained by the consistencyof driving postures chosen by different peoplewith similar anthropometry. In effect, the onlyopportunity for improving the model's abilityto predict individuals is to add anthropometricdescriptors as input to the models. However,such additions are unlikely to be useful for gen-eral vehicle design because the intended userpopulation is anthropometrically diverse and,hence, cannot usefully be described by morethan a few variables.
Restrictions and Limitations of the CPM
As with any other predictive model, the CPM'sgeneralizability is constrained by the limitationsof its underlying database - in particular, therange of test conditions used in the originalstudy. Other limitations are as follows:
1. The model is for use with seats that have two-way(fore-aft) seat track adjustment and seat backangle adjustment but no seat height or seat panangle adjustment. Further validation is under wayto quantify the performance of the model in vehi-cles with seat height adjustment.
567
2. The model assumes an automatic transmission(no clutch), which covers more than 85% of pas-senger cars sold in the United States.
3. The in-vehicle posture data used to evaluate themodel performance were obtained after a 15-mindrive. Although the measured postures probablyrepresent the most prevalent, normal drivingpostures for these drivers, it is likely that theyshifted their postures as they drove, so the resultsare not representative of all on-road postures.However, Reed and Schneider (1996) demon-strated that posture changes in long-term sittingare small relative to between-subjects variance.
4. The model validation presented in this paper wasconducted using data from only five vehicles.This data set is too small to allow an accurateestimate of the distribution of prediction errorsacross vehicles. However, comparison of themodel predictions with those given by a seatingaccommodation model that was developedusing data from 44 vehicles (Flannagan et al.,1998) indicates that the model's accuracy forother vehicles is not likely to deviate substantial-ly from the accuracy observed in the validationvehicles.
5. The drivers whose postures were used to developthe model ranged in age from 21 to 75 years, buttheir behavior may not be representative of thatin certain population segments, such as the veryold or those with visual or other impairments.
Practical ImplicationsThe CPM is the first model for predicting
driving posture that is based on a large set ofdata and is publicly available in an imple-mentable form. Because the input dimensionsare readily obtained from any vehicle packagedrawing, the regression functions that consti-tute the core of the model can be used directlyto predict eye locations, hip locations, or seatpositions for people of various sizes. However,the full value of the model comes when it isintegrated into a digital human modeling soft-ware package, so that the prediction results canbe viewed immediately as whole-body postureswithin the vehicle package. The CPM can alsobe used as an independent check of predictionmodels that have been developed using otherdatabases and methods.
CONCLUSIONS
Using the CPM, whole-body driving posturescan be predicted with considerable accuracy,within the limitation of interindividual variabilitythat is not accounted for by body dimensions.

568~~~~~~~~~~~~~~~~~~~~~~~~~~.. Winte 2,_2 -. ___mR , ,-nrCUg U6
'With this modeling approach the predictions ofkey degrees of freedom are independent of thekinematic model definition and linkage scaling.The model prediction errors are largely inde-pendent of driver size and vehicle geometry,allowing a straightforward interpretation ofprediction precision. The cascade model ap-proach allows the most important degrees offreedom to be predicted directly, with reason-able accuracy on other degrees of freedomobtained using inverse kinematics assisted bymotion distribution heuristics.
ACKNOWLEDGMENTS
The research described in this paper wasconducted primarily under the Automotive Seatand Package Evaluation and Comparison Tools(ASPECT) program, an industry-sponsored ef-fort to develop a new generation of vehicle andseat design tools. ASPECT participants wereBMW, Chrysler, Ford, General Motors, JohnsonControls, Lear, Magna Interior Systems, PSA-Peugeot-Citroen, Toyota, Volkswagen, and Vol-vo. The American Automobile ManufacturersAssociation also supported part of the researchthrough grants to the University of MichiganTransportation Research Institute to support thedevelopment of new industry-standard packag-ing models.
REFERENCES
Bell, A. L., Pedersen, D. R., & Brand, R. A. (1990). A comparison ofthe accuracy of several hip center location prediction methods.Ioumal of Biomechanics, 23, 617-621.
Dempster, W. T. (1955). Space requirements of the seated opera-tor: Geometrical, kinematic, and mechanical aspects of thebody with special reference to the limbs (WADC Tech. Report55-159). Wright-Patterson Air Force Base, OH: Wright AirDevelopment Center.
Flannagan, C. A. C., Manar, M. A., Schneider, L. NV., & Reed, M.P. (1998). An improved seating accommodation model withapplication to different user populations (Tech. Paper 980651).SAE Transactions: Joumal of Passenger Cars, 107, 1696-1705.
Flannagan, C. A. C., Schneider, L. W., & Manary, M. A. (1996).Development of a new seating accommodation model (SAETech. Paper 960479). In Automotive design advancements inhuman factors: Improving drivers' comfort and performance(SP-1 155, pp. 29-36). Wanrendale, PA: Society of AutomotiveEngineers.
Hammond, D. C., & Roe, R W. (1972). Driver head and eye posi-tions (SAE Tech. Paper 720200). New York. Society of Auto-motive Engineers.
Manar, M. A., Flannagan. C. A. C., Reed, M. P., & Schneider, L. W.(1998). Development of an improved driver eye position model(Tech. Paper 980856). SAE Transactions: Journal of PassengerCars, 107, 1366-1379.
Meldrum, J. E (1965). Automobile driver eye position (SAE Tech.Paper 650464). New York: Society of Automotive Engineers.
Phillipart, N. L., Roe, R W., Arnold, A. J., & Kuechenmeister, T. 1.(1984). Driver selected seat position model (SAE Tech. Paper840508). Warrendale, PA: Society of Automotive Engineers.
Porter, J. M., Case, K., Freer, M. T., & Bonney, M. C. (1993).Computer-aided ergonomics design of automobiles. In B.Peacock & W. Karwowski (Eds.), Automotive ergonomics (pp.43-77). London: Taylor & Francis.
Porter, J. M., & Gyi, D. E. (1998). Exploring the optimum posturefor driver comfort. Intemational Joumal of Vehicle Design, 19,255-266.
Reed, M. P., Manary, M. A., Flannagan, C. A. C., & Schneider, L. W.(2000). The effects of vehicle interior geometry and anthropo-metric variables on automobile driving posture. HumanFactors, 42, 541-552.
Reed, M. P., Manar, M. A., & Schneider, L. W. (1999). Methodsfor measuring and representing automobile occupant posture(Tech. Paper 990959). SAE Transactions: Journal of PassengerCars, 108, 1857-1866.
Reed, M. P., & Schneider, L. W. (1996). Lumbar support in autoseats: Conclusions from a study of preferred driving posture(Tech. Paper 960478). SAE Transactions: Joumal of PassengerCars, 105, 480-489.
Reynolds, H. M., Snow, C. C., & Young, J. W. (198 1).Spatialgeom-etry of the human pelvis (Memorndum Report AAC-1 19-81-5).Oklahoma City: Federal Aviation Administration, Civil Aero.medical Institute.
Roe, R. W. (1993). Occupant packaging. In B. Peacock & W. Kar-wowski (Eds.), Automotive ergonomics (pp. 11-42). London:Taylor & Francis.
Seidel, G. K., Marchinda, D. M., Dijkers, M., & Soutas-Little, R. W.(1995). 1-Iip joint center location from palpable bony landmarks- A cadaver study. Joumal of Biomechanics, 28, 995-998.
Seidl, A. (1994). Das Menschmodell RAMSIS. Analyse, Syntheseund Simulation dreidimensionaler Korperhaltungen des Men.schen [The man-model RAMSIS: Analysis, synthesis, and simu-lation of three-dimensional human body postures]. UnpublishedPh.D. dissertation, Technical University of Munich, Germany.
Society of Automotive Engineers. (2001). Automotive engineeringhandbook. WVarrendale, PA: Author.
Society of Automotive Engineers. (2002). SAE handbook. Warren-dale, PA: Author.
Matthew P. Reed is an assistant research scientist inthe Biosciences Division of the University of Michi-gan Transportation Research Institute. He received aPh.D. in industrial and operations engineering fromthe University of Michigan in 1998.
Miriam A. Manary is a senior research associate inthe Biosciences Division of the University of Michi-gan Transportation Research Institute. She receivedan M.S.E. in bioengineering from the University ofMichigan in 1994.
Carol A. C. Flannagan is an assistant research scien-tist in the Biosciences Division of the University ofMichigan Transportation Research Institute. Shereceived a Ph.D. in psychology from the Universityof Michigan in 1993.
Lawrence W. Schneider is a senior research scientistand head of the Biosciences Division of the Universi-ty of Michigan Transportation Research Institute.He received a Ph.D. in bioengineering from theUniversity of Michigan in 1973.
Date received: February 28, 2002Date accepted: September 16, 2002
568 Wintpr 20f)9 - Ptiman 1:nr+nrc
COPYRIGHT INFORMATION
TITLE: A Statistical Method for Predicting Automobile DrivingPosture
SOURCE: Hum Factors 44 no4 Wint 2002WN: 0234902939005
The magazine publisher is the copyright holder of this article and itis reproduced with permission. Further reproduction of this article inviolation of the copyright is prohibited.
Copyright 1982-2003 The H.W. Wilson Company. All rights reserved.