a statistical evaluation of the 'pock counting' technique
TRANSCRIPT

Louisiana State UniversityLSU Digital Commons
LSU Historical Dissertations and Theses Graduate School
1955
A Statistical Evaluation of the 'Pock Counting'Technique Applied to the Study of Herpes SimplexVirus Infection in the Chorio-Allantois ofEmbryonated Eggs.Dieu-donne Joseph GuidryLouisiana State University and Agricultural & Mechanical College
Follow this and additional works at: https://digitalcommons.lsu.edu/gradschool_disstheses
This Dissertation is brought to you for free and open access by the Graduate School at LSU Digital Commons. It has been accepted for inclusion inLSU Historical Dissertations and Theses by an authorized administrator of LSU Digital Commons. For more information, please [email protected].
Recommended CitationGuidry, Dieu-donne Joseph, "A Statistical Evaluation of the 'Pock Counting' Technique Applied to the Study of Herpes Simplex VirusInfection in the Chorio-Allantois of Embryonated Eggs." (1955). LSU Historical Dissertations and Theses. 122.https://digitalcommons.lsu.edu/gradschool_disstheses/122

A STATISTICAL EVALUATION OF THE "POCK COUNTING" TECHNIQUE APPLIED TO THE STUDY OF HERPES SIMPLEX VIRUS INFECTION
IN THE CHORIO-ALLANTOIS OF EMBRYONATED EGGS
A Dissertation
Submitted to the Graduate Faculty of the Louisiana State University and
Agricultural and Mechanical College in partial fulfillment of the requirements for the degree of
Doctor of Philosophyin
The Department of Microbiology School of Medicine
Dieu-donne JP Guidry M.S., Louisiana State University, 1952
August, 1955
Acknowledgement
I am deeply grateful to Dr* G* John Buddingh for his guidance and assistance.
I also wish to thank the staff of the Department of Microbiology, particularly Dr. C. Ray Womack, for the consideration and cooperation extended to me during the course of my work.
Thanks are due to Mrs. E. Stoudenmier for her painstaking efforts in the typing of the dissertation.
ii
16
9
1118
25
28
31
31
35
36
40
475152
54
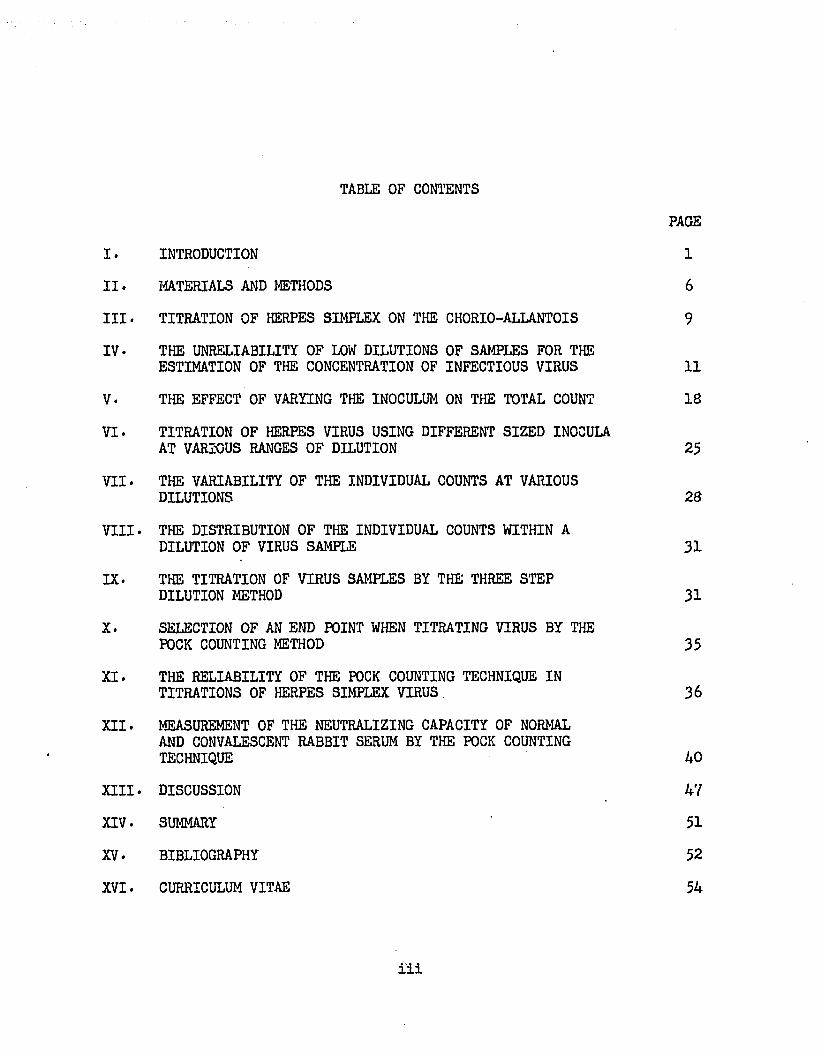
TABLE OF CONTENTS
INTRODUCTION MATERIALS AND METHODSTITRATION OF HERPES SIMPLEX ON THE CHORIO-ALLANTOISTHE UNRELIABILITY OF LOW DILUTIONS OF SAMPLES FOR THE ESTIMATION OF THE CONCENTRATION OF INFECTIOUS VIRUSTHE EFFECT OF VARYING THE INOCULUM ON THE TOTAL COUNTTITRATION OF HERPES VIRUS USING DIFFERENT SIZED INOCULA AT VARIOUS RANGES OF DILUTIONTHE VARIABILITY OF THE INDIVIDUAL COUNTS AT VARIOUS DILUTIONSTHE DISTRIBUTION OF THE INDIVIDUAL COUNTS WITHIN A DILUTION OF VIRUS SAMPLETHE TITRATION OF VIRUS SAMPLES BY THE THREE STEP DILUTION METHODSELECTION OF AN END POINT WHEN TITRATING VIRUS BY THE POCK COUNTING METHODTHE RELIABILITY OF THE POCK COUNTING TECHNIQUE IN TITRATIONS OF HERPES SIMPLEX VIRUSMEASUREMENT OF THE NEUTRALIZING CAPACITY OF NORMAL AND CONVALESCENT RABBIT SERUM BY THE POCK COUNTING TECHNIQUEDISCUSSIONSUMMARYBIBLIOGRAPHYCURRICULUM VITAE
iii

LIST OF TABLES
I.
II.
III.
IV.
V.
VI.
VII.
VIII.
IX.
X.
XI.
PAGEResults of the Titration of Herpes Simplex Virus onthe Chorio-allantoic Membrane of 12 Day old ChickEmbryos 10The Influence of the Size of the Inoculum on theTotal Count 20The Effect of Increasing the Size of the Inoculum withIncreasing Dilution on the Titration Curve of a VirusSample 26The Relationship of the Coefficient of Variation to the Dilution of Virus Sample and the Average Number of Pocks 30Frequency Distribution of Pock Counts obtained from aSingle Dilution of a Virus Sample 32Estimation of the Concentration of Virus in a Sampleby the Three Step Dilution Method 34Standard Error of the Difference Between DuplicateTitrations of Herpes Simplex Virus 37Standard Error of the Difference between SuccessiveDilutions of a Sample in the Titration of HerpesSimplex Virus 38Standard Error of the Titration Based on the Pooled Variation of Corresponding Dilutions from Duplicate Samples 39A Comparison of the Neutralizing Capacity of Freshand Inactivated Normal Rabbit Serum 44Measurement of the Neutralizing Capacity of Convalescent Rabbit Serum to Herpes Simplex Virus 46
iv

PAGE
12
13
14
15
17
19
21
22
23
24
27
29
33
41
42
LIST OF FIGURES
Relationship of the Average Number of Pocks per Membrane to the Dilution of Virus SampleTitration of Herpes Simplex Virus on the Chorio-allantois Showing the Total Number of Pocks at each Dilution of the Virus SampleTitration Curves obtained from Samples with Low Concentrations of Virus showing the Relationship of the Total Count to the Dilution of Virus SampleTitration Curves obtained from Samples with High Concentrations of Virus showing the Relationship of the Total Count to the Dilution of Virus SampleRelationship of the Percentage Deviation•from the Average Total Pock Count to the Dilution of Virus SampleThe Influence of the Concentration of Virus in a Sample on the Titration CurveThe Influence of the Size of the Inoculum on the Total Pock Count (Sample 1)The Influence of the Size of the Inoculum on the Total Pock Count (Sample 2)The Influence of the Size of the Inoculum on the Total Pock Count (Sample 3)The Influence of the Size of the Inoculum on the Total Pock Count (Sample 4)The Effect of Increasing the Inoculum at Various Dilutions on the Titration Curve of a Virus SampleRelationship of the Coefficient of Variation to the Total Pock CountFrequency Polygon showing the Distribution of Counts in a Large Sampling from a Single DilutionRelative Titration End Points Necessary for a Significant Difference between two Virus Samples at the 99*7$ level of ConfidencePercent Reduction in Viru3 Concentration Necessary for Significance at Various Levels of Confidence

ABSTRACTI
The neutralization phenomenon is regarded to be of considerable importance in acquired resistance to many infectious diseases * During convalescence
from a particular disease or following deliberate immunization procedures the serum of man or animals acquires the property of specifically inhibiting or neutralizing the infectivity of the agent. When a suspension of virus is mixed in vitro with its specific immune serum and a susceptible host or tissue is inoc.ylated with the virus-serum mixture no detectable disease or recognizable lesions develop. The serum of non-immune animals does not have this specific neutralizing property.
Because of its high specificity the neutralization te3t has played an important part in the study of virus diseases. In the test, serum containing antibody is mixed with the homologous infectious agent and then inoculated into a susceptible host which serves as an indicator of specific neutralization. The choice of an indicator host presents one of the greatest difficulties. An ideal host would be one which has a low initial cost and upkeep together with high susceptibility to a large variety of infectious agents and no tendency to spontaneous infection. The embryonated hen»s egg meets these requirements in many respects.
Burnet (1939) devised a simple method for measuring antibody to herpes simplex virus using the chick embryo. This method is based on the fact that herpes virus produces discrete, pock-like lesions on the chorio-allantois.The neutralizing power of a serum can be measured by comparing the number of pocks on chorio-allantoic membranes receiving a serum-virus mixture with the
number of pocks on membranes receiving the virus alone and expressing the
vi

neutralizing capacity of the serum in terms of the percentage reduction in the number of pocks.
The purpose of this investigation was to evaluate the pock counting technique as a method for the estimation of the concentration of virus in a sample and for the measurement of neutralizing antibody in serum. A curvilinear relationship between the dilution of a sample and the number of pocks produced was found to exist. The initial dilutions of a virus sample were found to give low estimates of the virus concentration as the result of competitive exclusion between virus particles. All titration curves formed a peak or plateau where the most accurate estimate of the virus concentration could be made* This range of optimal dilution is determined by the concentration of virus in the sample.
The reliability of the pock counting method was found to compare favorably with that calculated for egg and mouse infectivity tests using influenza virus. It was found that a minimum end point difference of 0.4 log unit between two samples was significant at the 99*7 percent level of significance.
The results obtained show that a 2-fold change in serum concentration can significantly alter the pock count. Studies with undiluted serum indicate that 20 percent changes in serum concentration could produce significant differences in the pock count.
The pock counting technique has been used by others in studying the growth and mechanism of cell infection of herpes simplex virus. It should prove useful in studying the effect of chemical and physical agents on virus. Many other viruses grow well and produce easily recognizable lesions on the chorio-allantois. The pock counting technique has also been used with
vaccinia, variola, cowpox, and ectromelia viruses.
vii

INTRODUCTION
The neutralization reaction utilizes a well recognized phenomenon exhibited in immunity to infectious diseases. It has been applied more extensively in the study of viruses than of bacteria. During convalescence from a particular viral disease or following deliberate immunization procedures the serum of man or animals acquires the property of specifically inhibiting or neutralizing the infectivity of the agent. The reaction becomes demonstrable when a suspension of virus is mixed in vitro with its specific immune serum. When a susceptible host or tissue is inoculated with the virus-serum mixture no detectable disease or recognizable lesions develop. The serum of non-immune animals or that obtained before infection is established does not have this specific neutralizing property. The reaction involves the specific union of antigen and antibody. Under the conditions of the test this reaction is detected.in the absence of the development of one or more of the recognizable manifestations of the disease process attributable to the particular infectious agent. The test provides a means for the specific identification of an unknown agent or for revealing the presence of aspecific antibody in convalescent or immune serum. Quantitative estimations of antibody can be achieved by varying either the virus concentration or by serial dilution of the serum.
Sternberg(l) was the first to recognize this phenomenon in 1892. He mixed serum from calves convalescent from vaccinia with a suspension of the virus in the test tube. After a short incubation period the mixture was

inoculated into the scarified skin of susceptible calves. No recognizable lesions of vaccinia developed. Serum from non-immune calves did not havethis property of specifically inhibiting the infectivity of the virus. During the first decade of this century Beclere, Chambon, and Menard (2) and many others studied this reaction in great detail with vaccinia and its immune serum using the scarified rabbit skin as the test site.For many years the phenomenon was referred to as the virucidal activity of immune serum. Later studies indicated that under specific conditions the reaction was 'reversible and not one in which the virus was rendered non-viable. Thus the term neutralization is considered to be more definitive .
Applied to other viruses and rickettsiae a wide variety of specific immune bodies in the serum of man and animals have been identified by means of this reaction. The specific neutralizing property of immune serum is thus regarded as indicating past experience either by active or inapparent infection or by immunization with the agent inhibited when the test is appropriately performed. The neutralization phenomenon is regarded to be of considerable importance in acquired resistance to many infectious diseases.
Because of its high specificity the neutralization test has played an important part in the study of virus diseases. As a result, many modifications have been developed. Some provide a quick, simple means for screening large quantities of serum; others, while more complex and time consuming, are capable of detecting relatively small amounts of antibody; finally there are those which, although highly sensitive, are

suitable for experimental purposes only. In all cases the principle of the test remains the same. Serum containing antibody is mixed with the homologous infectious agent and then inoculated into a susceptible host which serves as an indicator of specific neutralization.
Under ideal conditions the test would involve a highly stable infectious agent which in unit concentration is capable of producing a recognizable lesion or death in a susceptible host and a specific antibody which is also stable and occurs in immune serum in detectable amounts. Such conditions are rarely if ever fulfilled. The choice of an indicator host presents one of the greatest difficulties. Susceptibility to infection, initial cost, and expense of maintenance are among the major influencing factors. The ease with which animals acquire subclinical infection must also be considered. For instance, Parker (3) was able to develop a highly accurate neutralization test for vaccinia virus in rabbits but the ease with which these animals acquire subclinical infection with the virus makes it necessary to use them immediately after delivery to the laboratory.
An ideal host, then, would be one which has low initial cost and upkeep together with high susceptibility to a large variety of infectious agents and no tendency to spontaneous infection. . The embryonated henfs egg meets these requirements in many respects. Since the initial transmission of the virus of fowl sarcoma to the chorio-allantois by Rous in 1911 (4) this host has been adapted to a large variety of uses in the study of viruses (5, 6).

Burnet (1939) devised a simple method for measuring antibody to
herpes simplex virus (7)» This method is based on the fact that herpes simplex virus produces discrete focal, pock-like lesions on the chorio- allantois of chick embryos. A fairly constant series of pock counts could be obtained from a suspension of virus and a direct correlation was found to exist between the dilution of a virus suspension and the number of pocks it produced. The neutralizing power of a serum could be measured by mixing a sample with virus, allowing it to stand for a prescribed length of time, and then inoculating the chorio-allantoic membrane of chick embryos with a measured amount of the mixture. Following incubation for 48 to 72 hours the number of pocks on membranes receiving the serum-virus mixture was compared with the number of pocks on those receiving the virus alone and the neutralizing capacity of the serum expressed as the percentage in reduction of the number of pocks.
Shaffer and Enders (8) reported that Burnet’s method was as sensitive as intracerebral mouse inoculation in titrating virus suspensions. They concluded that the test was nob satisfactory for neutralization tests since ten-fold differences in concentration of serum could not be detected by this method. Burnet applied the technique to vaccinia virus and showed that a linear relationship between dilution and pock count existed when high dilutions of virus were used (9)* Buddingh utilized the pock counting technique in studying the antigenic relationships between chick embryo adapted and calf adapted strains of vaccinia and variola virus (10). More recently Buddingh and his coworkers used the method in detecting and measuring neutralizing antibody to herpes

simplex virus in various segments of the population (11). McCarthy and Downie (12) used the pock counting technique in studying the antigenic relationships between the viruses of variola, vaccinia, cowpox, and ectro- melia. Kilboume (13) reported that the progressive antibody increase in serum from a patient revealed by intracerebral titrations in infant mice was not disclosed by the pock counting method. Jawetz (14) found that the pock counting technique was more sensitive than yolk-sac inoculation in the detection of small amounts of virus, but that it was inferior to the yolk-sac route in measuring the neutralizing antibody content of serum.
Rose (1952) modified BurnetTs method by using the dilution of virus producing one or more lesions in 50 percent of inoculated eggs (ID^q ) as the endpoint (15) • He concluded that this modification was more reliable than the pock counting technique.
Scott and his coworkers (1953) applied the method of pock counting to the study of the growth curve of herpes simplex and concluded that the test was satisfactory, the results agreeing within one log unit of each other (16).
It is readily apparent that some technique employing absolute numbers rather than dilution factors as an indication of the concentration of virus in a sample would be highly desirable for exacting studies such as antigen-antibody relationships. The greater adaptibility of absolute values to statistical evaluation is readily appreciated. On the supposition that a technique such as Burnet*s pock counting procedure would provide a more exact means for a quantitative analysis of antigen- antibody relationships in herpes simplex and certain other viral infect-

6
ions an extensive study of the technique to determine its scope and limitations was undertaken.
Materials And Methods
Strains of Herpes Simplex Used. Strain H.F. This strain was used in the form of mouse brain adapted virus and also as virus adapted to the chorio-allantois of the chick embryo. The mouse brain adapted strain was initiated with chorio-allantois propagated virus and maintained by serial passage intracerebrally in 6 to 8 week old C*F. strain of white Swiss mice. The chick embryo adpated H.F. virus originated as a lyophil- ized mouse brain suspension maintained at the Rockefeller Institute^ in rabbits and mice. It had been carried through 47 membranal passages in 12 to 14 day old embryos.
Strain W*G* was a chick embryo adapted strain originally derived from the spinal fluid from a human case of herpetic meningo-encephalitis (17) • It had undergone 22 yolk sac and 16 chorio-allantois passages in the chick embryo.
Strain A.S. was a chick embryo adapted strain propagated through 18 yolk sac and 15 chorio-allantois passages.
Virus Suspensions. Strict aseptic technique and bacterial culture control was maintained throughout in the preparation of the virus suspensions. All suspensions were made in phosphate buffered saline* To protect
^The H.F. strain was kindly supplied by Dr. Peter Olitsky of the Rockefeller Institute.

7
the viability of the virus during storage in the deep freeze 10 percent by volume of normal rabbit serum was added to all stock suspensions.
Mouse Adapted H.F. Strain. Brains from mice dying 3 or 4 days following intracerebral injection with 0.03 ml of a 1-100 virus infected brain suspensions were pooled, ground while frozen and brought to approximately 10 percent suspension by volume. After centrifugation at 1500 r.p.m. at 10 to 15 C. to remove coarse particles the supernatant was restored to its original volume with added buffered saline. Aliquots of the suspension were stored in the deep freeze until required. These preparations usually titered to about 3X10^ pocks per ml.
Chick Embryo Adapted H.F. Virus• Membranal lesions harvested 48 hours after inoculation of the chorio-allantois of 12 day old embryos were pooled and ground while frozen. The ground membranal material was then treated inthe same manner as described for the mouse brain propagated virus. Thesesuspensions usually titered to about 6X10^ pocks per ml.
Strains W*G» and A.S. These virus strains were in the form of amnioticfluid collected from embryos dead 2 to 3 days after inoculation of the yolk 3ac on the 8th day with 0.2 ml of a 1-10 dilution of infected amniotic fluid. Pools of bacteria free fluid to which 10 percent inactivated normal rabbit serum was added were divided into 1 ml aliquots and stored in the deep freeze until used. These preparations usually titered out to about 3X10^ pocks per ml.
Immune Sera. Two forms of immune serum were used and compared: convalescent and hyperimmune. They were made against the W.G. and A.S. strains only.

Convalescent Serum. Obtained from rabbits 21 days following inoculation of the scarified cornea and the subsequent development of typical herpetic kerato-conjunctivitis. Of 4 rabbits inoculated with the W.G. strain only one survived encephalitis. Each of the 4 rabbits inoculated with the A.S. survived the infection*
Hyperimmune Serum. The animals surviving the herpetic kerato-con- junctivitis were subsequently given 6 intravenous injections with 0.1 ml of the appropriate virus suspension at 7 day intervals. Blood for serum was withdrawn 7 days after the last injection.
Virus And Serum Titrations. All titrations were performed on the chorio-allantois of 12 day old chick embryos. Dilutions were carefully prepared using a separate serological pipette for each dilution* Four to six embryos were inoculated with each dilution. Whenever a large number of eggs were inoculated the dilutions of virus were kept in an ice bath until used. Inoculations were made by evenly spreading from 0*05 to 0.2 ml of virus suspension over the surface of the chorio-allantois of 12 day embryos exposed by the window method (18) by means of a 1 ml tuberculin syringe fitted with a 27 guage needle. Inoculated eggs were incubated for 48 hours at 35 C. The infected membranes were exposed by breaking away the overlying eggshell and the pocks counted with the aid of a dissecting microscope.
Neutralization Tests. Serum-virus mixtures were incubated at 37C. for 1 hour before inoculation of the chorio-allantoic membrane of 12 day embryos. The serum-virus mixtures were placed in an ice bath while awaiting inoculation. The method of inoculation and pock counting was

9
identical to that used in virus titration experiments.
Titration Of Herpes Simplex Virus On The Chorio-allantois
Early attempts to employ the pock counting technique using egg adapted HF herpes met with immediate difficulties. Instead of discrete, focal lesions the virus invariably produced confluent reactions on the chorio-allantois which could not be correlated to the dilution of virus sample. On the supposition that the HF strain might be over adapted to the chorio-allantois intracerebral passage in mice was carried out in order to obtain mouse adapted virus. The mouse brain adapted HF herpes virus proved to be more satisfactory because it produces discrete, countable foci on the chorio-allantois which can be more directly related to the dilution of virus. The results indicated that more discrete lesions were produced and a greater degree of correlation could be obtained if low concentrations of virus were used. Further experiments revealed that the concentration of virus in a suspension was one of the major influencing factors determining the type of lesion produced on the chorio-allantois and the degree of correlation attainable between pock counts and dilution of virus. It was subsequently shown that suspensions containing very high concentrations of virus could be satisfactorily titrated if a sufficiently wide range of dilutions was employed.
Table I shows the results of the titration of a sample of mouse a- dapted HF herpes virus on the chorio-allantois of 12 day chick embryos.The mean or average count, standard deviation, standard error, and coefficient of variation have been calculated for each dilution of the sample.

TABLE I
Results Of The Titration Of Herpes Simplex Virus On The Chorio-allantoic Membrane Of12 Day Old Chick Embryos.
Dilution Number Of PocksPer Membrane
Log. (0.2 ml. inoculum)1:100 -2.0 250, 200, 3001:200 -2.3 180, 210, 300, 150, 3001:400 -2.6 200, 210, 300, 400, 2501:800 -2.9 200, 275, 250, 3001:1000 -3-0 250, 180, 130, 200, 1501:1200 -3-08 146, 275, 120, 100
1:1400 -3*15 155, 42, 35, 140
AverageNo.Pocks
Number Of Pocks Per ML.
Number Log*S.D. c.v. S «E.
250 125,000 5-09 50.0 20 29.4228 228,000 5-36 58.1 25 25.9272 544,000 5-74 81.7 30 36-5256 1,024,000 6.01 42.7 17 21.4182 910,000 5*96 46*6 26 20.8160 960,000 5-98 78.8 49 39-493 651,000 5.81 63.0 68 31-7
Ho

11
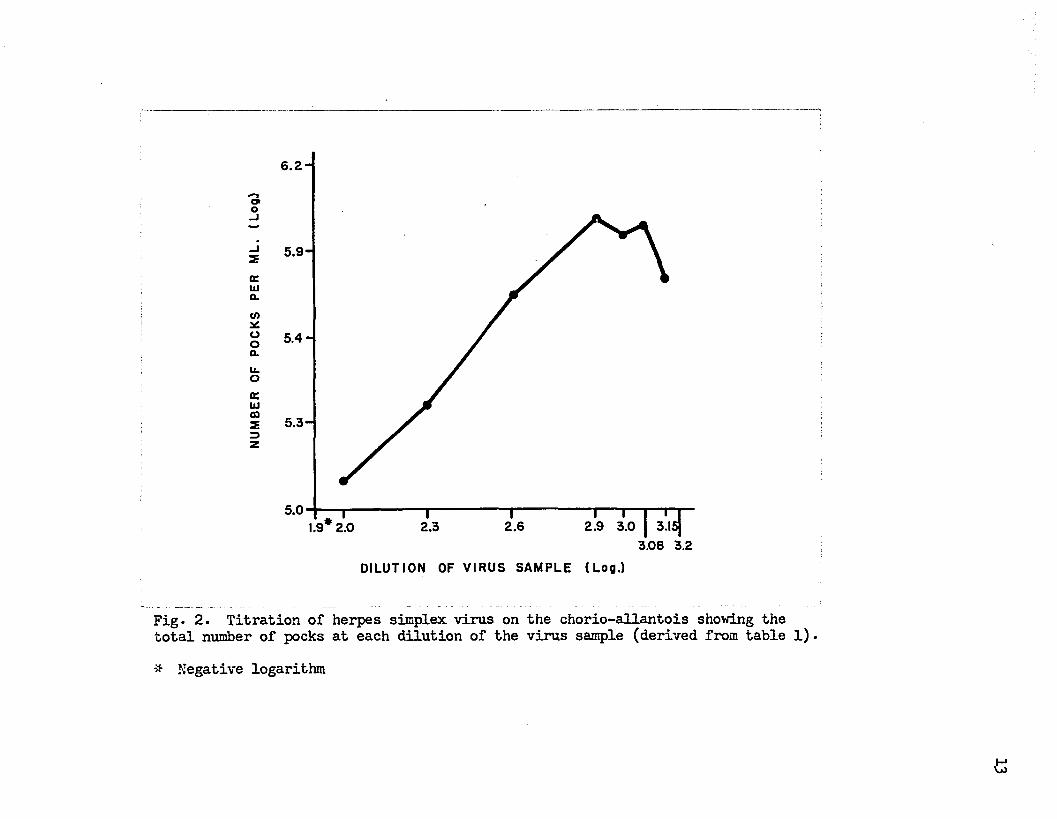
Figure 1 shows, the relationship of the mean or average count to the dilution of virus sample. The average count increases at first then decreases with progressive dilution of the virus. The rate of decrease in the average count changes with each dilution of the virus sample ranging from a slope greater than minus one to a slope of less than minus one.This results in the curvilinear relationship between the total pock count and dilution of virus shown in figure 2.
The shape of the curve for the total pock count varies from one titration to another with regard to the sharpness of the peak. In many instances a plateau rather than a peak is formed by those dilutions giving the highest total counts. Figures 3 and 4 show titration curves for samples containing low and moderately high concentrations of virus respectively. Sample C in figure 3 shows only the decline phase of the titration curve. In figure 4the curve for sample A with its plateau lies in sharp contrast to the othertwo curves. However, an equally flat peak would have been obtained for sample B if dilutions of sample identical to those in sample A had beenchosen. It is apparent from figures 3 and 4 that the general contour ofthe titration curves for herpes simplex virus is very similar regardless of the concentration of the viru3 in the sample and that the sharpness ofthe peak is influenced to a large extent by the dilutions tested.
The Unreliability Of Low Dilutions Of Samples For The Estimation Of The Concentration Of Infectious Virus
The curve for the total count shown in figure 2 indicates that the initial dilutions of the virus sample gave low estimates of the virus

280
260
240
u 200'
ui 140
120100
40
20
2.623
DILUTION OF VIRUS SAMPLE (Log)
Fig. 1. Relationship of the average number of pocks per membrane to the dilution of virus sample (derived from table l).■> Negative logarithm
ro
6.2-
JS 5.9-
CE 1Ua.
0)ooa
5.4 -
b.OCCtuCDz
5.02.9 3.02.62.3
3.08 3.2DILUTION OF VIRUS SAMPLE (Log.)
Fig* 2. Titration of herpes simplex virus on the chorio-allantois showing the total number of pocks at each dilution of the virus sample (derived from table 1).-* Negative logarithm

5.0-
I4.5-
oe_i_l2ecua.o>scuoa.14.ohia.23Z 4.5-
3.0*
2.6 2.9 3j0 3.53.06
OILUTION OF VIRUS SAMPLE (Lo«J
Fig* 3* Titration corves obtained from samples with low concentrations of virus showing the relationship of the total comt to the dilation of virus sample.* Negative logarithm
£

6.2-
6.0-
- jz 5 .5 -trui0.
//i i.oITUlm 5 j0 -3Z
4.613*2.0 2.6 2.9 3.0 3.2
3.08DILUTION OF VIRUS SAMPLE (Log.)
Fig. 4* Titration curves obtained from samples with high concentrations of virus showing the relationship of the total count to the dilution of virus sample.
Negative logarithm

16
concentration. If the mean total count for the titration i3 arbitrarily calculated from dilutions 1-400 through 1-1400 the percentage deviation from the mean can be determined for each dilution of the sample as shown in figure 5* The three dilutions giving the highest total counts lie within two percent of the calculated mean. The reasons for the low estimates of virus concentration given by the initial dilutions of the sample are not completely clear. The confluent lesions obtained with suspensions containing high concentrations of virus suggest that a large number of virus particles initiate infection on a relatively confined area of membrane. Under these circumstances the number of infectious virus particles far exceeds the number of susceptible host cells so that the virus must compete for the available susceptible cells with the result that some of the particles fail to initiate infection. As a result of such competitive exclusion the number of lesions produced is less than the number of infectious particles actually inoculated on the membrane. That such competitive exclusion is taking place is further indicated by the initial increase in the average count as the virus is diluted out. It would appear that the pealc of the curve for the total count represents those dilutions where an optimal distribution of virus particles exists and where the influence of the factors leading to competitive exclusion of infectious particles is at a minimum. The decrease in the total count following the peak of the curve can be explained partially by the progressively diminishing probability that the inoculum will contain proportionate numbers of infectious particles.
If the peak of the titration curve does represent an optimal dilution of virus then it follows that samples with sufficiently different concentrations

R 100-
Jr 90
60-
50-
< 40-
o 30-
u 20-
2.3 2.6 2.9 3.03.8 3.2
DILUTION OF VIRUS SAMPLE (Log)
Fig. 5« Relationship of the percentage deviation from the average total pock count to the dilution of virus sample (derived from table l).■* Negative logarithm
H

of virus would give titration curves with peaks occurring at different dilutions. Evidence to support this view was gained in the following manner.A chorio-allantoic membrane suspension of mouse brain adapted HF herpes virus was divided into three aliquots. The first aliquot was retained at its original concentration of lO- -. The second aliquot was prepared as a 1-30 dilution of virus and the third aliquot as a 1-60 dilution of virus. Thus the second aliquot contained one third as much virus as the original suspension and the third aliquot contained one sixth as much virus as the original suspension. The three aliquots were then treated as original suspensions at a dilution of 10“^ and series of dilutions designed to include the peak of the titration curve was prepared from each aliquot, ^he results are shown in figure 6. The peak of the curve for sample III lies within the lower range of dilutions. The peaks of the titration curves for sample II and sample I follow at higher dilutions. It is obvious from figure 6 that the range of dilutions at which the peak of a titration curve will occur is determined by the concentration of virus in the sample.
The Effect Of Varying The Inoculum On The Total Count
Dilutions of virus samples were prepared and inoculated in various amounts on the chorio-allantois of 12 day embryos. The total counts obtained with the various amounts of each dilution are presented in table II. The results are also shown graphically in figures 7-10. It is apparent that the size of the inoculum markedly influences the total count.Figure 7 shows well defined titration curves for all levels of inoculum.

DILUTION OF VIRUS SAMPLE (Log.)
Fig* 6* The influence of the concentration of virus in a sample on the titration curve.■55- Negative logarithm
HvO

TABLE II
The Influence Of The Size Of The Inoculum On The Total Count
\
Dilution Of
Virus Sample (Log.)•
Sample 1Total Count Per Ml.Ml. Of Inoculum 0.05 0.10 0.20
Sample 2Total Count Per Ml.Ml. Of Inoculum 0.05 0.10 0.20
Sample 3Total Count Per Ml.ML. Of Inoculum 0.10 0.20
Sample 4Total Count Per ML.ML. Of Inoculum 0.10 0.20
-1.7 4.94 4-71-2.0 5.67* 5*23 5-09 5-51 5-31 4.92 4-86 5.08 4-81
-2.3 5-95 5.53 5-36 5-69 5-73 5-59 5-04 4.68 4.65 4.71-2.6 6.23 5.93 5-74 6.05 5-85 5-75 5-20 4.61 4.49 4*68
-2.9 6.52 6.11 6.01 6.26 6.16 5-93 5-07 4.79 4-57 4-49-3-0 6.38 6.19 5-96 6*44 6.04 6.17 4.70 4-97 4-58 4*60-3.08 6.20 5-98 6.09 6.13 5.00 4*82 3-86 4*28
-3-15 6.12 5.81 5.19 4.94 4.45 4-54-3.20 6.42 5.94
■*Log- of total count based on 5 eggs per dilution.

6.. 5
o>o_l
JZDCUJDL o;</>3£Ooa.(JL 5.5-occiiiCDzoz
o* rV.
5.0-4.9
2.9 3.0 I 3.15 33 3.22.62.3D ILU TIO N OF VIRUS SAM PLE (Log.)
Fig. 7* The influence of the size of the inoculum on the total pock count, (derived from sample 1 table IV).# Negative logarithm

6.4 -
J2 5.8 -
<n■3Cuo
5.5-11.o
CEUJCO2 5.2-=>z
4.9-4.8
1.9*2.0 2.3 2.6 2.9 I 3.08 13.2 3.0 3.15D IL U T IO N OF V IR U S S A M PLE (L o g .)
Fig. 8. -The influence of the size of the inoculum on the total pock count, (derived from sample 2 table IV).■it Negative logarithm

j
5.5'
o>
W 5 .0 -
4.5
4.42.9 3.0 | 3.151
3.8 3.22.62.3
DILUTION OF VIRUS SAMPLE (Logi
Fig. 9* The influence of the size of the inoculum on the total pock count, (derived from sample 3 table IV).* Negative logarithm

5.0
4.5-
oeUJclcoxooCLu .° 4.0-K111IDz3Z
3.52.9 3.0 I 3J5|
308 3.22.62.0
DILUTION OF VIRUS SAMPLE (Log.)
Fig. 10. The influence of the size of the inoculum on the total pock count, (derived from sample 4 table IV).* Negative logarithm

25
In figure 8 the peaks of the curves had not been reached for the 0.05 ml and 0.1 ml inocula. Figure 10 shows the decline phase of the titration curves. It is interesting to note that at this stage the two curves are very close to one another. In all cases the size of the inoculum was inversely related to the highest total count obtained. It would 3eem that the greater area of membrane surface available when small inocula are used results in a larger number of particles initiating infection to produce discrete lesions. These results support the view that competitive exclusion must be taking place when a large number of virus particles are placed on a relatively limited area of chorio-allantois.
Titration Of Herpes Virus Using Different Sized Inocula At Various Ranges Of Dilution
Since competitive exclusion was apparently occurring at low dilutions of virus and probability factors were causing a decrease in the total count at the higher dilutions, it was reasoned that both difficulties could be overcome by using small inocula at the low dilutions and large inoculaat the high dilutions of virus. A mouse brain suspension of HF herpes containing a moderate concentration of virus was titrated as indicated in table III. The average count was calculated for each dilution on the basis of 1 ml of sample. Inspection of table III shows a fairly close agreement between dilutions with regard to the total count. This is indicatedby figure 11 where a line has been fitted to the values for the totalcount by the method of least squares. The slope of -0.1207 is not far below zero where perfect correlation between dilution and total count would

TABLE III
T he E f f e c t O f I n c r e a s in g T h e S iz e O f T he In o c u lu m W i th I n c r e a s in g D i l u t i o n On T heT i t r a t i o n C u rv e O f A V i r u s S a m p le * ,I
N um ber O f P o c k s P e r M em brane
Dilution Of Virus Sample(Log.) 2-3 2.6 2.8 2.9 3-0 3*08 3.15 3.2 3*5Amount Of Inoculum(Ml.) 0.1 0.1 0.1 0.2 0.2 0.2 0.4 0.4 0.4
134 196 64 58 86 53 108 59 21124 189 56 89 54 82 97 88 46142 62 120 82 132 57 87 78 72178 112 68 72 88 82 98 112 48236 128 55 64 82 64 77 56 40198 140 78 55 72 42 68 48 99184 148 86 80 84 72 78 68 25135 120 40 116 78 48 84 122 24192 92 78 92 d* 90 d 56 42188 143 45 110 114 58 86 90 41
Average Count Per 0.1 Ml. 171 132 79 ;Average Count Per 0.2 Ml. 82 88 65Average Count Per 0.4 Ml. 87 78 46Total Count Per Ml. (Log.) 5-53 5-7.2. 5*68 5-52 5-64 5-59 5-48 5.49 5-56Coefficient Of Variation(^) 21 31 32 80 26 25 14 32 52Standard Error 11 13 8 21 8 5 4 8 7Standard Error (Titration) COLTVo•o log. unit

^ 6.0-6>3
(EUJQ.COacooCL 5.5-u.otc111ax
» L°t£0NFlD£NCE *
• UVlft i-jyjEL — — ^
5.0 1 i i * rI n m*“ i— r3.52.0
I2.3
" T “2.6 2.9 3.0 ' 3.15'
308 32DILUTION OF VIRUS SAMPLE (Log.)
Fig. 11. The effect of increasing the inoculum at various dilutions on the titration curve of a virus sample (derived from table VI)•
# Negative logarithm

28
occur. Analysis of the data indicates that on the basis of the results obtained in table II 95 percent of the total counts obtained at the dilutions used could be expected to fall within plus or minus 0.158 log of the line fitted to the points. While the curve for the total count was not completely flattened the results indicate that the factors influencing the shape of the curve were compensated for to a large extent.
The Variability Of The Individual Counts At Various Dilutions
It was shown in table I that the standard deviation of the pock counts differed for each dilution being smallest at the dilution giving the highest total count. The relationship of the coefficient of variation to the dilution of virus sample and the total count is shown in figure 12. While the coefficient of variation is at its lowest value at the peak of the curve it begins to increase thereafter and continues to increase with further dilution of the sample. It can be seen that some of the dilutions which are considered to give the most accurate estimates of the virus concentration show the highest coefficients of variation. Analysis of other titration curves revealed similar findings. Table IV shows that in general the coefficient of variation for the average pock count increases with dilution of the virus sample. The large values for the coefficient of variation which occur at high dilutions of virus can be accounted for on the basis of the veiy small value of the mean count.

6.2TOTAL COUNTCOEFFICIENT OF VARIATION
J 5.9 Zacuia.
70
60co1C8 5.6a.b .o
50
40a:inCD
305.3- 20
5.0'1.9* 2.0 2.9 3.02.6 3X)6 3.2
DILUTION OF VIRUS SAMPLE (Log.)
Fig* 12* Relationship of the Coefficient of Variation to the total pock count, (derived from table l) .
Negative logarithm
COEF
FICIENT
OF VARIAT
ION
(PER
CENT
)

TABLE IV
T h e R e la t i o n s h ip O f T he C o e f f i c i e n t O f V a r i a t i o n T o T h e D i l u t i o n O f T he V i r u s S a m p le A n d T h e A v e ra g e N um ber O f P o c k s .
Dilution Sample 1 Sample 2 Sample 3Of
Coeff.Virus No. Avg. Total No. Avg. Total Coeff. No. Avg. Total CoeffSample Eggs Count Count Var. Eggs Count Count Var. Eggs Count Count Var.(Log.) (Log) * (Log) * (Log) *-1*7 5 138 4-54* 35 6 205 4-71 45-2.0 7 56 4*45 62 4 116 4*76 22 6 128 4-81 37-2.3 8 73 4*86 61 2 126 5*10 5 51 4*71 86-2.6 7 86 5*24 63 8 99 5*30 71 4 24 4.69 57-2.9 7 30 5.08 88 8 80 5-50 63 6 8 4*49 64-3.0 5 8 4.60 90-3-08 6 3 4*28 66-3*15 6 0.5 4*54 165-3*2 10 46 5*56 64 7 39 5*49 50-3*5 7 24 5*59 92 9 11 5*25 42-3.8 9 6 5*30 163 10 4 5*05 108-4.1 9 0.4 4*45 166 9 2 5*15 124
^ L o g * o r o o ta x c o u n t p e r m l

The Distribution Of The Individual Cotints Within A DilutionOf Virus Sample
Although a small number of eggs were used for each dilution of the sample presented in table I experiments using larger numbers of eggs for each dilution indicate that the counts within a given dilution closely approximate a normal distribution. Table V shows the distribution of the counts obtained from a single dilution of virus sample when 12 day embryos were inoculated with 0.2 ml of virus suspension. The results, shown in figure 13, indicate a normal distribution of the counts.
The Titration Of Virus Samples By The Three Step Dilution Method
Since complete titration curves invariably formed either a peak or a plateau a method of titration designed to include only the peak or plateau seemed a more efficient and economical way of determining the concentration of virus in a sample. Because the titer of a virus suspension prepared in a given manner is fairly constant from one preparation to another it was possible to choose dilutions which should include the peak or plateau of the curve. Table VI shows representative samples of three step dilution curves. While some of the samples show very close agreement between dilutions with regard to the total count others show differences which are too large for satisfactory estimation of the virus concentration. In many cases the curve is still rising or is in the decline phase, showing that the curve either has not reached its peak or that the peak has already been passed. In both instances one would ex
pect to obtain a low estimate of the actual virus concentration. In spite

TABLE V
F re q u e n c y D i s t r i b u t i o n O f P o c k C o u n ts I n A S in g le D i l u t i o n O f A V i r u s S a m p le .
Number O f Lesions Number O fPer Membrane Membranes60 to 79 580 to 99 11
100 to 119 16' 120 to 139 9140 to 159 4160 to 179 3180 to 199 3
Total Number O f Membranes 51Mean Number O f Lesions 113-5Standard Deviation 30.8Standard Error 4.2

20
ui
160 180 220140 200100 1208040 60
NUMBER OF POCKS PER MEMBRANES
Fig. 13• Frequency polygon showing the distribution of counts in a large sampling from a single dilution.
VjJVjJ

TABLE VI
E s t im a t io n O f T h e C o n c e n t r a t io n O f V i r u s I n A S a m p le B y T h e T h re e S te p D i l u t i o n M e th o d .
Sample 1 Sample 2 Sample 3Dilution No• Avg. Total S »E. Dilution No. Avg. Total S «E. Dilution No• Avg• Total S «E»
Eggs No• Count Eggs No• Count Egg3 No. Count(Log.) Pocks (Log) (Log.) Pocks (Log) (Log.) Pocks (Log)-3.0 21 43 5.33* 6.4 -3.0 15 34 5-23 8.7 -3.0 15 17 4.93 2.5-3-08 21 31 5.27 5-2 -3.08 18 48 5-46 7.8 -3-08 14 10 4-79 2.0-3-15 25 27 5-28 4-8 -3.15 6 42 5-47 16.6 -3.15 11 14 4-99 4*6
Sample 4 Sample 5 Sample 6Dilution No. Avg. Total S «E • Dilution No. Avg. Total S «E • Dilution No. Avg. Total S «E.
Eggs No. Count Eggs No• Count Eggs No. Count(Log.) Pocks (Log) (Log.) Pocks (Log) (Log.) Pocks (Log)-3.0 13 18 4*95 5-8 -3.0 11 48 5-38 6.3 -3-78 10 58 6-54 8.6-3.08 9 7 4.61 1-7 -3.08 10 43 5-41 5-6 -3-90 12 21 6.22 3.6-3-15 11 4 4*4L 1.2 -3.15 10 50 5-54 7.2 -4-0 10 48 6.68 5.8
* L o g . t o t a l c o u n t p e r m l .
VjO■p-

35
o f th e t im e a n d m a t e r ia l s s a v e d t h e t h r e e s t e p d i l u t i o n m e th o d i s n o t
s a t i s f a c t o r y f o r e s t im a t in g t h e c o n c e n t r a t io n o f v i r u s i n a n t i g e n - a n t ib o d y
s t u d i e s .
S e le c t i o n O f A n E n d P o in t When T i t r a t i n g V i r u s
B y T he P o c k C o u n t in g M e th o d
E x a m in a t io n o f t h e v a r io u s t i t r a t i o n c u r v e s p r e s e n te d m akes i t c l e a r
t h a t a lo w e s t im a te o f t h e v i r u s c o n c e n t r a t io n w i l l b e o b ta in e d i f t h e
t o t a l s f o r t h e e n t i r e ra n g e o f d i l u t i o n s a re in c lu d e d i n t h e c a l c u l a t i o n
o f t h e m ean t o t a l c o u n t . I t i s o b v io u s t h a t a m o re a c c u r a te e s t im a t e o f
t h e v i r u s c o n c e n t r a t io n c a n be o b t a in e d i f o n l y th o s e d i l u t i o n s f o r m in g th e p e a k
o r p la t e a u o f t h e c u r v e a r e c o n s id e r e d i n o b t a i n i n g t h e m ean t o t a l c o u n t . T he
n u m b e r o f d i l u t i o n s w h ic h a r e t o be w e ig h e d w i l l v a r y f r o m o n e t i t r a t i o n t o
a n o th e r a n d w i l l be d e te r m in e d b y t h e sh a p e o f t h e t i t r a t i o n c u r v e . I n c a s e s
w h e re a p la t e a u i s fo rm e d o v e r a ra n g e o f t h r e e o r f o u r d i l u t i o n s t h e c a lc u
l a t i o n o f th e m ean t o t a l c o u n t w i l l b e s im p le . When a s h a r p p e a k o c c u r s
some d i f f i c u l t y i n t h e c h o ic e o f d i l u t i o n s t o b e w e ig h e d w i l l be e n c o u n te r e d .
U n d e r th e s e c o n d i t i o n s t h e h ig h e s t t o t a l c o u n t i s lo c a t e d a n d a t l e a s t one
a n d p r e f e r a b l y tw o d i l u t i o n s o n e a c h s id e o f t h e p e a k a r e i n c lu d e d i n
c a l c u l a t i n g th e m ean t o t a l c o u n t .

36
The R e l i a b i l i t y O f T he P o c k C o u n t in g T e c h n iq u e I n T i t r a t i o n s
O f H e rp e s S im p le x V i r u s
Before the pock counting method could be used for comparing the amount of herpes virus in different samples it was necessary to determine the minimum end point difference required for significance. If duplicate titrations are carried out on a group of samples and the difference between the first and second titration for each sample determined then the degree of sampling variation for the method may be calculated. Table VII shows the results of duplicate titrations on a group of both egg adapted and mouse adapted herpes virus. The mean difference between duplicate titrations was obtained and used in calculating the standard error of the difference between duplicate titrations. If a 99*7 percent level of confidence is desired then on the basis of table VII a minimum end point difference of 3 S.E.^ff. or 0*306 log unit between titrations would be required. The same statistical method may be used to compare successive dilutions of a single sample as shown in table VIII. The value for the is essentially the same asthat calculated in table VII. The sampling variation may be determined in another manner by pooling the variation of two samples as shown in table IX. The data represent duplicate titrations of a single sample and the mean total count for each titration indicates how close the results were. Inspection of table IX reveals that the individual variation in sample 1 was greater than that in sample 2. The standard error for the titration is comparable to those determined in tables VII and VIII. If the standard errors derived by various methods are combined an average S . E . of 0.1205 log unit results.

37
TABLE V I I
S ta n d a r d E r r o r O f T h e D i f f e r e n c e B e tw e e n D u p l ic a t e T i t r a t i o n sO f H e rp e s S im p le x V i r u s .
Strain
HF
Passage 1st.Titration
E52(MB39)CA1 6.681
2ndTitration6.95
Diff. d+ .27
Diff. From The Mean# (d - d)+ .23
Square Diff. From Mean(d - d f .0529
n E52(MB39) 6.72 6.96 + .24 + .20 .0400tt E57(MB32) 5-69 5.70 + .01 + .03 .0009tt E57(MB29) 5.40 5*35 -.05 -.09 .0081it E57(MB45) 6.06 6.14 + .08 + .04 .0016
Simpson E40 Y25 5-95 5.78 -.17 -.21 .0441tt E41 Y26 6.75 6-58 -•17 -.21 .0441tt E42 Y27 5.84 6.60 + .76 + .72 .5184tt E42 Y27 6.60 6.50 -.10 -.14 .0196tt E45 Y30 6.75 6.32 -.43 -.47 .2209
+ •44 •9506* Mean difference from the mean ** +•44/10 a + .04
s <= « d - d ) 2 . .9506
S =n-1 \
•3259
Standard error of the difference (S.E.^iff. )a S a .325 a .102-\Jn 3 -162
^ L o g . t o t a l c o u n t p e r m l .

TABLE VIII
Standard Error Of The Difference Between Successive Dilutions Of A Sample In The Titration Of Herpes Simplex Virus.
L o g . T o t a l C o u n t x2- xx
( d - d ) f t ( d - d )O
L o g . T o t a l C o u n t
*1( L o g . d i l . -2.0)
d
( L o g .
*2d i l . -2.3)
409** + .23 + .06 .0036 4 *624*65 - + .30 + .13 .0169 4.954-70 + .20 + .03 .0009 4.903*78 + .96 + •79 .6241 4.743-78
( L o g . d i l . -2.6)+ .92 + .74 •5476
( L p g .4.70
d i l . -2.9)5-05 + .46 + .29 .0841 5-515.11 + .12 -.05 .0025 5.235.56 -.47 — *64 .4096 5.094.30
( L o g . d i l . -3.2)+ .15 -.02 .0004
( L o g .4-45
d i l . -3.5)4.9 8 -.08 -.25 .0625 4.905-58 -.47 - .64 .4096 5-115.68 + .22 + .05 .0025 5*905-20 + .76 + .59 •3481 5-965.60 + .08 -.09 .0081 5.685-85 -.41 -.58 •3364 5.444.90 -.22
+2.75-39 .1521
3.00904 *68
ft Mean difference between successive dilutions (?) ■ d°° 2.75 » +*17n “ 16
- d )2 ^ n - 1
3.00901 15
•45
Standard'Error of the difference (S.E.^iff.) » s •=aIF
•113
f t f t R e p re s e n ts t o t a l c o u n t p e r m l . f r o m o n e m em brane

TABLE IX
Standard Error Of The Titration Based On The Pooled Variation Of Corresponding Dilutions From Duplicate Samples*
Sample 1L o g . T o t a l
C o u n t Xl (Xi- xi)
5*09* -•315.55 + .1$4.86 -.544.60 -.805.50 + .105-45 + .055.58 + .185*68 + .285.20 -.205-85 + •455-16 -.244.90 -.505*80 + *405.75 + .354.90 -.505*11 -.295-90 + .505-96 + .565-68 + .285.44 + .04
Xx= 5*40 n]_= 20
Log. Totalo Count(Xl- Xi):2 x2
(Log. dilution -2.9).0961 $.74.0225 5.68.2916 5.20.6400 5.59.0100 5.00.0025 5.30(Log. dilution -3*2)
.0324 5*49
.0784 5*66
.0400 6.04
.202$ 4*60•0576 5.20.2500 5.60.1600 5.63.1225 5.60(Log. dilution -3*5)
.2500 4.90
.0841 5-2$
.2500 5-38
.3136 5.25
.0784 5-32
.0016 5.202.9838
X2= 5*38n2» 20
Sample 2
(x2- r2) (X2- x2)2+.36 .1296+ .30 .0900-.18 •0324+ .21 .0441-.38 •1444-.08 .0064+ .11 .0121+ .28 .0784+ •66 •4356-.78 .6084-.18 .0324+ .22 .0484+ .2$ .0625+ .22 .0484-.48 .2304-.13 .0169.00 .0000
-.13 .0169-.06 .0036-.18 .0324
2.0733
s - |*(Xi- Xi)2 + i(HLo- Xo)2 = 1 2*9838 + 2.0733 - -365I n * n - 2 | 20+20-2
S.E Xt *= S.E«Xp ** s ™ >365 a *082X >) So* Represents total count per ml. from one membrane

40
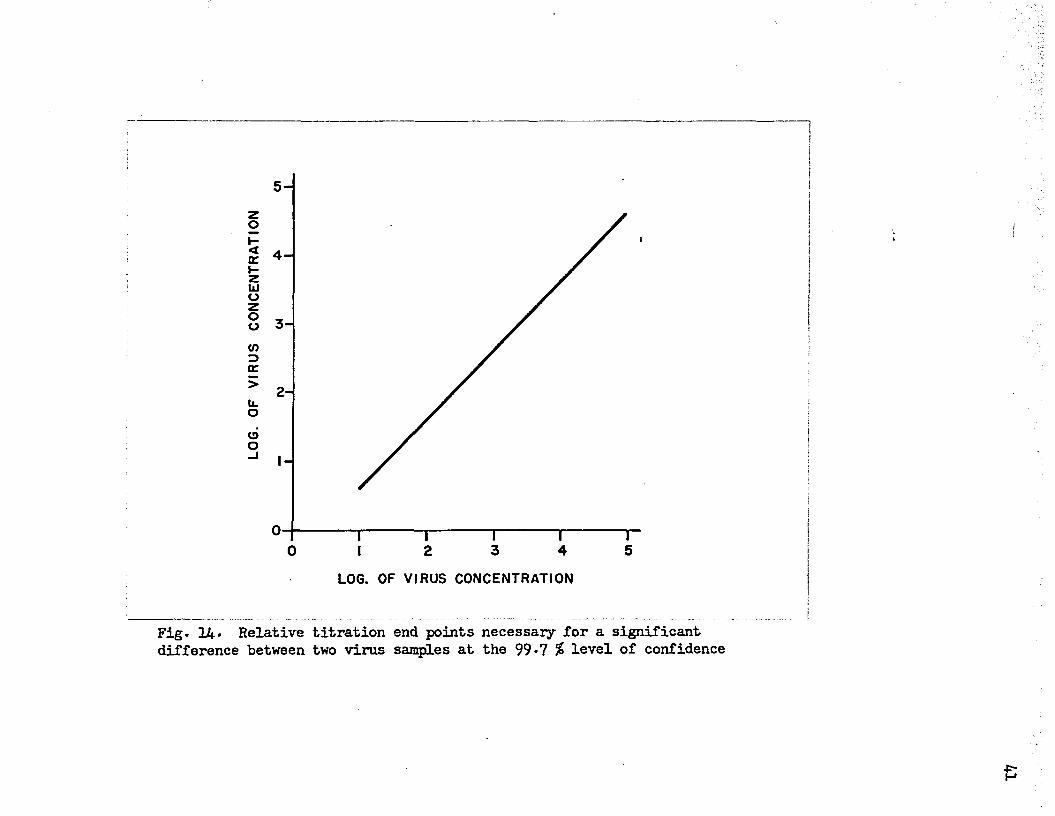
On this basis an end point difference of O.36 log unit would be required for significance at the 99*7 percent level of confidence. At the 95 percent level of confidence an end point difference of 0.24 log unit would be required for significance. An added degree of confidence can then be gained by rounding out these end point differences to 0*4 log unit and 0*3 log unit respectively. Thus at the 99*7 percent level of confidence a minimum difference of 0.4 log unit between the titers of two samples must occur for the samples to differ significantly. This relationship, shown in figure 14* is a linear one.
It can be shown that a difference of 0*4 log unit between two end points represents a difference of approximately 60 percent between their numbers regardless of the magnitude of the values. A difference of 0*3 log unit between two end points represents a difference of approximately 50 percent between their numbers. These relationships can be used in setting up the standards for significant reduction in the number of pocks at various levels of confidence as indicated in figure 15* Conversion of the standards for minimum end point differences to percentage differences is especially useful in neutralization tests where comparisons between average counts rather than total counts are made.
M e a s u re m e n t O f T he N e u t r a l i z i n g C a p a c i t y O f N o rm a l A n d C o n v a le s c e n t R a b b i t
S e rum B y T he P o c k C o u n t in g T e c h n iq u e
N e u t r a l i z a t i o n O f H e rp e s S im p le x V i r u s W i th N o rm a l R a b b i t S e ru m . B lo o d
w as w i th d r a w n f r o m r a b b i t s a n d t h e s e ru m t e s t e d f o r n e u t r a l i z i n g a n t ib o d y t o
h e rp e s v i r u s o n t h e same d a y . One a l i q u o t o f t h e s e ru m w as t e s t e d i n t h e
LOG
. OF
VI
RUS
CO
NC
ENTR
ATI
ON
5 -
4 -
3 -
2-
3 4 50 2LOG. OF VIRUS CONCENTRATION
F i g . R e la t i v e t i t r a t i o n e n d p o in t s n e c e s s a r y f o r a s i g n i f i c a n td i f f e r e n c e b e tw e e n tw o v i r u s s a m p le s a t t h e 9 9 * 7 % l e v e l o f c o n f id e n c e

z ^2iocHI-<£ 90- zUJo 80-zo° TOCO| 60-
- 50-zoj l 40" oS 3°-ir
20-zUlO 10- UJ “■ 0
99.7% LEVEL OF CONFIDENCE
95% LEVEL OF CONFIDENCE
~r2 *T“3
T~4
t5
LOG. OF VIRUS CONCENTRATION
Fig. 15* Percent reduction in virus concentration necessary for significance at various levels of confidence.

43
fresh state while the other aliquot was inactivated at 56C» for 30 minutes prior to the addition of virus. Both aliquots were diluted out a3 indicated in table X and mixed with an equal quantity of virus to a final dilution of 1-4000. Both serum-virus mixtures and the control were incubated at 37 C. for 1 hour prior to inoculation on the chorio-allantois of 12 day chick embryos. The results are shown in table X. The individual pock counts for each embryo inoculated and the average pock count for each dilution of sample are presented. The percentage reduction indicated for the various dilutions of the serum samples is based on the average count for the control. If the standards for minimum end point differences shown in figure 15 are applied then normal rabbit serum diluted 1-2 significantly reduced the number of pocks produced by herpes virus. By the same standards the heated rabbit serum showed no capacity for neutralizing herpes virus. To test the validity of the standards set up in figure 15 the probability values for the significance of the differences between various dilutions of normal uninactivated rabbit serum were derived by the Fisher t-test. The results show that even 50 percent reduction in the number of pocks is unquestionably significant. Since the percentage reduction (24$) in pock counts obtained with a 1-4 dilution of unheated serum was not significant it follows that no significant reduction was obtained with heated serum. The results in table X indicate that a 2-fold change in serum concentration can significantly alter the pock count.
Neutralization Of Herpes Virus With Convalescent Rabbit Serum. Due to the relatively high neutralizing capacity of convalescent serum it wa3 found necessary to test it against high concentrations of herpes virus.

TABLE X
A Comparison Of The Neutralizing Capacity Of Fresh And InactivatedNormal Rabbit Serum.
Fresh Serum Inactivated ControlSerum
Dilution undil.> 1-2 1-4 1-8 undil. 3.-2 1-4 1-400010 22 77 112 40 51 66 327 23 kb 51 161 42 155 611 3 26 71 37 65 92 3321 2 18 112 50 41 64 76
Pock 5 12 14 58 11 18 111 68Counts 2 3 82 40 53 56 79 97
1 7 55 32 34 60 63'8 31 68 44 57 625 31 52
28 29Avg. CountPer 0.1 ml 7 14 46 60 55 48 87 61PercentReduction 89 78 24 0 9 22 0P value for undil. serum vs. control : .001> PP value for undil. serum vs. dil. 1^2 : .01 > P > .001P value for dil. 1-■2 vs. control : .001> PP value for dil. 1--2 vs. dil. 1-4 : .01 > P > ..001P value for dil. 1-4 vs. control : -3 > P > .2

45
Table XI shows a neutralization test carried out with convalescent serum. Various proportions of undiluted serum were mixed with virus diluted to 10“ -. Although this concentration of virus gave confluent lesions on the chorio- allantois which could not be counted an estimate of the amount of virus present at that dilution can be made on the basis of the mean total count for the titration. Table XI shows the advantage of using a wide range of dilutions in the control. Although the first two dilutions gave unsatisfactory results the plateau of the curve was demonstrated. It is apparent that although the concentration of virus used in the test produced confluent lesions on the control embryos a sufficient amount of reduction in pock count occurred in the serum-virus mixtures to permit the production of countable foci. The results indicate that 20 percent differences in serum concentration were demonstrable but that 10 percent differences in serum concentration did not significantly alter the pock count under the conditions of the experiment. The probability values for the significance of the difference between means are larger than would be expected on the basis of the percentage differences in the samples compared. This indicates that the standard error is greater than usual for this method and stresses the importance of applying a test of significance to each set of results. This is especially true when small samples are used.

TABLE XI
Measurement Of The Neutralizing Capacity Of Convalescent RabbitSerum To Herpes Simplex Virus.
Virus No. Average Average Log.Dilution Eggs Pock Pock Total
Count Count Count(0.2 ml) (0.1 ml) Per ml.
10-2 5 confluentVirus ioi , 6 500+Control 10-3 *6 5 243 6.6910-3*9 6 113 6.66
• 10-4*2 5 58 6«68/
Serum Virusml. ml.
VirusPlus 0.1 0.9 5 165Conva 0.2 0.8 5 185lescent 0.3 0-7 5 45Serum 0.4 0.6 5 37
0.5 0.5 5 22
Serum 0.1 ml; Virus 0.9 mland .02 > P > .01
Significance Of The Serum 0.3 ml; Virus 0*7 ml Difference Between:
Serum 0*3 ml; Virus 0*7 mland .05 > P > .02
Serum 0.5 ml; Virus 0.5 ml

47
DISCUSSION
The pock counting method should provide a means for the quantitative analysis of several aspects of the behavior of those viruses which produce focal lesions on the chorio-allantois of the embryonated egg. Under definite conditions it can be reasonably assumed that each lesion or pock represents initiation of infection by a single virus particle. The numerical value obtained by counting the pocks produced by a measured volume of a given dilution provides the basis for estimating the number of viable or infectious particles in a particular sample. In this respect the method is comparable to the colony count as applied to bacteria or the plaque count to the bacteriophages.
In obligate parasitism exhibited by viruses the dynamics of the infectious process which obtain in the host cell-parasite relationship greatly complicates procedures directed toward more exact quantitative analysis. The proportionate relationship between the number of infectious virus particles and the susceptible host cells is of prime importance. It is immediately apparent from the present study with herpes simplex virus that only under definite circumstances of dilution, the stage of embryonic development and the method of inoculation will the number of pocks provide a fairly accurate estimation of the number of infectious particles per given volume of virus suspension.
The titration of serial dilutions of herpes virus results in pock counts which seem to indicate that a curvilinear rather than a straight line relationship exists between the number of infectious units per volume

48
and the number of lesions observed. Within limits concentrated inocula ini
tiate relatively fewer numbers of lesions than less concentrated suspensions. This apparent paradox is largely determined by the proportion of infectious particles to the number of susceptible cells. This phenomenon has been recognized with other viruses, notably influenza, and is usually referred to as "auto-interference” . It seems that the term "competitive exclusion" more nearly indicates the underlying mechanism insofar as it applies to viable or infectious particles. Auto-interference would apply more specifically to the inhibition of invasion by infectious virus caused by the adsorption or absorption of inactive particles by susceptible cells. In concentrated inocula both mechanisms operate in providing falue low values for estimating total counts for infectious particles per unit of a given sample.
Only within a certain range of dilutions will the effect of "competitive exclusion" and "auto-interference" be sufficiently reduced or eliminated to provide reasonably accurate estimations. This range will vary from one sample to the next. Extremely high dilutions give false low total counts largely because of unavoidable unequal distribution of infectious particles in aliquots of a series of inocula.
In order, therefore, to achieve statistically reliable and reproducible results it is essential that a range of at least 6 two-fold dilutions of a sample be titrated respectively on the chorio-allantois of a series of 4 to 6 twelve to fourteen day embryos each. When plotted the dilutions at the peak of the curve present counts from which the most accurate estimation of the number of infectious particles per unit volume can be estimated. These factors have not sufficiently been taken into account by other investigators

49
of the method. For this reason the adaptation of the pock counting technique to the neutralization test has provided contradictory results* Furthermore comparison of results by different investigators are difficult to evaluate since no accurate estimation of the quantity of virus neutralized was made.
The statistical analysis of the results obtained in the present study indicates that the method can be brought to a much greater degree of reliability than achieved by others. Burnet (7) found that at optimal dilutions a coefficient of variation of 30 percent was encountered. Scott (16) tested the reproducibility of a series of titrations and reported a much greater degree of variation than this study reveals. Others have been hesitant to apply quantitative comparisons because of the variability of the pock counting method but presented no data showing the degree of variation encountered. When properly performed as described in this report the reliability of the pock counting method compares favorably with that calculated for influenza virus infectivity titrations in mice and embryonated eggs (19)•
The foregoing considerations are essential in the application of the pock counting method to virus neutralization by specific antiserum. Adequate control of the neutralization test by this method consists in performing a complete infectivity titration curve in order that the number of infectious particles neutralized per unit of antiserum can be estimated. Significant alterations in the pock count can be brought about in high as well as low concentrations of virus by small changes in serum concentrations. The observations of those who were unable to detect alterations in the pock count with 10-fold dilutions of serum are very likely due to failure to obtain accurate estimations of infectious particles per unit volume. The present

50
results also point to the fact that the actual neutralizing capacity of a serum may best be estimated by the use of undiluted or slightly diluted serum. The dynamics of antigen-antibody union in undiluted serum undoubtedly differ from those which obtain when serum is diluted. The degree of resistance of an immune host is perhaps more actually exhibited in the neutralizing activity of the whole circulating blood and thus more nearly represented by the activity of undiluted serum.
It is therefore of considerable interest that preliminary observations presented here indicate that quantitation of the heat labile ’’natural11 neutralizing capacity of serum can be made. This capacity very likely is of importance in resistance to naturally occurring infections. Further study of this phenomenon in relation to its possible enhancing effect upon acquired immunity can be undertaken on the basis of the methods and data presented.
The well recognized specificity of the neutralization reaction makes its application to the differentiation of strain variants and specific types of viruses of great importance. More accurate quantitative methods will provide better opportunities for specific characterization of strains and types by means of neutralization with homologous and heterologous antisera. Properly applied, accurate pock counts are more likely to elicit a broader spectrum of antigenic patterns and interelationships.
As already indicated the method is not restricted to herpes simplex virus. Valuable contributions have already been made in studies with variola, vaccinia, cowpox and ectromelia. Other viruses such as fowlpox, Newcastle disease, pseudorabies, and B. virus which produce focal lesions on the chorio-allantois can be subjected to extensive study by this method. Further development

51
in studies of cell infection (7, 8) and of the growth curve (16,20,21,22) can
be anticipated on the basis of the foregoing observations.
SUMMARY
The application of the pock counting technique to quantitative analysis of antigen-antibody relationships was investigated.
In the quantitation of virus, a curvilinear relationship rather than a straight line relationship was found to exist between the dilution of virus sample and the total number of pocks produced on the chorio-allantois. The dilutions producing the highest total pock counts were found to give the most accurate estimate of the concentration of virus in a sample.
The reliability of the pock counting method was found to compare favorably with that calculated for influenza virus infectivity titrations in em- bryonated eggs and mice. A minimum end point difference of 0.4 log unit was found to be significant at the 99*7 percent level of confidence.
Neutralization tests performed with the pock counting procedure revealed that a 2-fold change in serum concentration can significantly alter the pock count. Preliminary observations indicate that the pock counting method may prove highly usefill in studying antigen-antibody relationships using undiluted immune serum.

BIBLIOGRAPHY
1. Sternberg', G.M. “Practical Results Of Bacteriological Researches,”Trans. Of The Assn. A. Physicians (1892) 2* 68-86.
2. Beclere, A. Chambon and Menard. !lEtudes Sur L^mmunite Vaccinale,”Ann. Inst. Pasteur (1899) 12* 81-125*
3* Parker, R.F. “The Neutralization Of Vaccine Virus By Vaccine- immune Animals,” J. Immunol. (1939) 24* 147-157*
4* Rous, P. and Murphy, J.B* "Tumor Implantation In The DevelopingEmbryo. Experiments With A Transmissible Sarcoma Of The Fowl," J. Am. Med. Assn. (1911) j>6, 741-742.
5* Goodpasture, E.W* "Some Uses Of The Chick Embryo For The Study Of "infection And Immunity," Am. J. Hyg. (1938) 28, 111-129*
6. Beveridge, W.I.B., and Burnet, F.M* "The Cultivation Of Viruses And Rickettsiae In The Chick Embryo," Spec. Rep. Series Med. Res. Coun., London. (1946) 256.
7* Burnet, F.M. and Lush, D. "The inactivation Of Herpes Virus ByImmune Sera: Experiments Using The Chorio-allantoic Membrane Technique," J. Path, and Bact. (1939) 48, 275-286.
8. Shaffer, M. and Enders, J.F. "Qualitative Studies On The InfectivityOf The Virus Of Herpes Simplex For The Chorio-allantoic Membrane Of The Chick Embryo Together With Observations On The Inactivation Of The Virus By Its Specific Antiserum," J. Immunol. (1939) 22* 383-411.
9* Burnet, F.M. and Faris, D. "The Technique Of Qualitative Chorio-allantoic Virus Titration," J. Bact. (1942) Zj4* 241-248.
10. Buddingh, G.J. "The Pathogenic And Antigenic Properties Of DermalVaccinia Virus Propagated In The Chorio-Allantois Of Chick Embryos," Am. J. Hyg. (1943) 2^» 310-322.
11. Buddingh, G.J., Schrum, D.I., Lanier, J.C., and Guidry, D.J. "StudiesOf The Natural History Of Herpes Simplex Infections," Pediatrics (1953) n, 595-610.
12. McCarthy, K. and Downie, A.W. "An Investigation Of ImmunologicalRelationships Between The Viruses Of Variola, Vaccinia, Cowpox, and Ectromelia By Neutralization Tests On The Chorio-allantois of Chick Embryos," Brit. J. Exp. Path. (1948) 29, 501-510.
52

53
13* Kilboume, E.D. and Horsfall, Jr., F. "Studies Of Herpes Simplex Virus In New Born Mice," J. Immunol. (1951) 62, 321-329*
14* Jawetz, E. and Coleman, V*R. "Studies On Herpes Simplex Virus. III.The Neutralization Of Egg Adapted Herpes Virus By Human Sera In Ovo," J. Immunol. (1952) j>8, 645-653*
15* Rose, H-M. "Differences In The Capacity Of Human Serums To NeutralizeHerpes Simplex Virus," J. Immunol. (1952) 68, 687-691*
16. Scott, T.F.M., Coriell, L.L., Blank, H. and Gray, A. "The Growth CurveOf The Virus Of Herpes Simplex On The Chorio-allantoic Membrane Of The Embryonated Hen’s Egg," J . Iinmunol. (1953) j[l, 134-144*
17* Hunt, B*P* and Comer, E. O’B. "Herpetic Meningo-Encephalitis Accompanying Cutaneous Herpes Simplex," Am. J. Med. In Press.
18. Buddingh, G*J. "Chick-Embryo Technics," Chapter 5 Viral And RickettsialInfections Of Man. Philadelphia: J.B. Lippincott Co. (1952)•
19* Davenport, F.M. "Reliability Of 50$ Egg Infectivity Titrations WithSuspensions Of Influenza Viruses Prepared From Mouse Lungs," Proc. Soc. Exp. Biol. Med. (1953) 82, 1-5*
20. Gray, A. and Scott, T.F.M. "Some Observations On The IntracellularLocalization Of The Virus Of Herpes Simplex In The Chick Embryo Liver," J. Exp. Med. (1954) 10C)» 473-484*
21. Wildy, P. "The Growth Of Herpes Simplex Virus", Aust. J . Exp. Biol.(1954) 22, 605-620.
22. Nodi, N.L. and Tobin, J. O’H* "Observations On The Growth Of HerpesSimplex Virus In The Chorio-allantois Of The Developing Chick Embryo And In Tissue Culture," Brit. J. Exp. Path. (1955) 35, 595-602.

CURRICULUM VITAE
Dieu-donne Joseph Guidry Born March 29, 1928 at Gueydan,Louisiana
Attended N.P. Moss Elementary School, Lafayette, Louisiana.1945 Graduated from Lafayette High School 1945-46 Attended Southwestern Louisiana Institute.1946 Entered U.S. Navy. Served as Pharmacists Mate until
Honorably Discharged, December, 1947*1948-50 Attended Tulane University, New Orleans, Louisiana1950-51 Attended Southwestern Louisiana Institute. Awarded B.S. degree
February, 1951•February, 1951 Matriculated Louisiana State University Graduate School,
Department of Bacteriology.July, 1951 Matriculated Louisiana State University Graduate School,
Department of Microbiology, School of Medicine.August, 1952 Awarded M.S. degree, Louisiana State University.
54

EXAMINATION AND THESIS REPORT
Candidate: Dieu-Donne Joseph Guidry-
Major Field: Microbiology
Title of Thesis:
A Statistical Evaluation Of The uPock Counting” Technique Applied To The Study of Herpes Simplex Virus Infection In The Chorio-allantois of Embryonated Eggs.
Approved:
Major Professor and Chaihnan
ate School
EXAMINING COMMITTEE:
Date of Examination:
June 30, 1955
rue IUKDCN