a state guide for teacher preparation data systems · a state guide for teacher preparation data...
TRANSCRIPT
GETTING TO BETTER PREP: A State Guide for Teacher Preparation Data Systems
Working Paper
APRIL 2017
C
M
Y
CM
MY
CY
CMY
K
TNTP__WorkingPaper_2017.pdf 1 4/11/17 4:00 PM
1
Table of Contents Executive Summary ........................................................................................................................................................................................................ 2
The Need for New Data on Teacher Preparation .............................................................................................................................................. 4
Benefits of Teacher Preparation Data Systems .................................................................................................................................................. 6
Benefit 1: Better meeting the needs of teachers and state and local workforce demands by identifying and
supporting targeted improvement efforts for programs ........................................................................................................................ 6
Benefit 2: Strengthened partnerships between districts and providers that enable districts and schools to meet their
needs and build stronger instructional teams............................................................................................................................................... 7
Benefit 3: More intentional state planning for teacher supply and demand ................................................................................... 8
Benefit 4: Added efficiencies in state systems as a result of focusing on improving this aspect of their data
infrastructure ............................................................................................................................................................................................................... 9
Best practices for SEAs building a teacher preparation data system..................................................................................................... 10
Best Practice 1: Establish a vision for teacher preparation within a state and a theory of action for how the state will
use data in service of that vision ...................................................................................................................................................................... 10
Best Practice 2: Create a multi-year roadmap ............................................................................................................................................ 14
Best Practice 3: Meaningfully engage a range of stakeholders in the development and use of the data system ........ 17
Best Practice 4: Build a system of multiple measures and identify the content (domains, indicators, and measures)
within the data system based on your state’s vision, theory of action, and values.................................................................... 19
Best Practice 5: Continuously improve the system throughout design and implementation ............................................... 23
Best Practice 6: Identify opportunities and third parties to provide technical assistance to teacher preparation
programs in using the state data to make targeted program improvements ............................................................................. 26
Conclusion ...................................................................................................................................................................................................................... 27
Appendix A: Overview of Featured States’ Teacher Preparation Data Systems ................................................................................ 28
Appendix B: The Role of the SEA in Achieving the Benefits of a Teacher Preparation Data System ....................................... 36
Appendix C: Glossary of Terms .............................................................................................................................................................................. 38
Appendix D: Stakeholder Engagement Checklist ........................................................................................................................................... 39
Appendix E: Data Collection Checklist ................................................................................................................................................................ 41
Appendix F: Vision and Theory of Action Worksheet ................................................................................................................................... 42
Appendix G: Applying Vision and Theory of Action to a Multiple Measures Data System .......................................................... 45
Appendix H: Delaware Design Principles ........................................................................................................................................................... 48
Acknowledgements .................................................................................................................................................................................................... 49

2
Executive Summary
The strength of teacher preparation programs matters now
more than ever, as states and districts work to ensure students are
ready for college and careers in an ever-evolving, interconnected,
and complex world. Because an effective teacher is one of the most
significant school-based levers influencing student achievement and
students’ life outcomes,1 our students need teachers who are
prepared with the content knowledge and instructional skills to make
a positive impact on their learning from day one.
At the same time, many states are experiencing a demand
for teachers in particular grades and subjects or within certain
regions that are unmatched by the supply of teachers coming out of
preparation programs. Compounding the challenge, the needs of the
students attending our public schools are rapidly changing. More
rigorous academic standards require more teachers with deep
expertise and content knowledge, and an ever-diversifying student
population calls for a more diverse teacher workforce.
In the face of growing concerns of teacher shortages and
the continued pursuit of thriving school systems, states and local
education agencies (LEAs) are looking to teacher preparation
programs to partner in examining their practices to better align to
state, local, and student needs. And many Educator Preparation
Programs (EPPs) are eager to collaborate to improve offerings to
prospective teachers. But most states and EPPs lack information on
how their programs are preparing teachers and meeting the hiring
needs of schools and districts, as well as the needs of students upon
entering the classroom. This vital information must be the foundation
of any meaningful responses to the needs of students and districts.
State Education Agencies (SEAs) can play a critical role in
supporting teacher preparation by working with providers to make
better data available—and where they are already doing this, it is
making a difference. Several states are now prioritizing the evolution
of their teacher preparation data systems to be outcomes-based and
offer more robust evidence of teachers’ classroom readiness and
experiences after graduation. Providers find this information more
meaningful than the traditional input-based systems that only
include characteristics of programs and candidates that are unrelated
to teachers’ classroom success. Of course, outcomes-based data
alone does not solve the challenges noted above, but it is a critical—
even compulsory—first step in providing the baseline information
necessary for states, districts, and preparation programs to work
together in ensuring teacher candidates are fully prepared to meet
the needs of students and districts.
1 Chetty, R., Friedman, J.N., and Rockoff, J.E. (2014). Measuring The Impacts of Teachers II: Teacher Value-Added and Student Outcomes
in Adulthood, 104(9) AMERICAN ECONOMIC REVIEW 2633, 2633-34 (finding students assigned to an effective teacher are more likely to
Who should read this report?
This report is drafted with state leaders and
policy makers in mind, including those who
work with or support these education
leaders.
The information shared here will likely be
most relevant to states that have either not
yet considered a new data system on teacher
preparation providers, are only now starting
to consider the idea, or are currently
embarking on plans to design and
implement such a system.
How can this report help your
state?
This report offers two primary functions to
readers. First, it illustrates the benefits of
teacher preparation data systems as they
have been experienced by states who have
them or are building them. It makes the case
for this work through “real-life” examples.
Second, it offers best practices to help states
in moving forward on planning and
implementing such systems, drawn from the
direct experiences of the featured states.
Each best practice is accompanied by at least
one example of how a featured state chose
to implement it.
How should you use this report?
The best practices offered here are not a
linear step-by-step guide, nor do they
suggest a uniform method for building one,
ideal data system. Rather, readers should use
the best practices offered here as a set of
guideposts that every state that has done
this work believes are critical elements of the
process.
States should execute each guidepost in the
way that is most effective for their own
needs. The various examples illustrate how a
state could choose to execute the best
practice while making clear that states take
different approaches to the same practice.
3
Through the generous support of the Charles and Lynn Schusterman Family Foundation (the “Foundation”),
Delaware, Massachusetts, New Jersey, Rhode Island, Illinois, and Louisiana (collectively, the “featured states”)
participated in a series of convenings2 in which they collaborated on the development of their systems. They
graciously agreed to share their experiences in doing this work, common best practices, and lessons learned,
synthesized and compiled here in this report.
The report illustrates the real-life benefits of prioritizing outcomes-based teacher preparation data systems
as experienced by six states that have already done so, and it offers a checklist of “must do” best practices to help
other state leaders begin or continue similar work. It is written from the vantage point of SEAs primarily for other SEAs
working to create the conditions necessary to promote great teaching in their states.
The states featured in this report have enabled SEAs, LEAs, EPPs, and teacher candidates to collaboratively
strengthen teacher preparation and find ways to partner together in doing so. They expect and have already begun to
experience a variety of benefits that flow from outcomes-based teacher preparation reporting, including:
1. Better meeting the needs of teachers and state and local workforce demands by identifying and supporting
targeted improvement efforts for programs;
2. Strengthened partnerships between districts and providers that enable districts and schools to meet their
needs and build stronger instructional teams;
3. More intentional state planning for teacher supply and demand;
4. Added efficiencies in state systems as a result of focusing on improving this aspect of their data
infrastructure.
The six featured states were early pioneers in the development of outcomes-based teacher preparation data
systems. As leaders in this work, they did not have robust examples or other research to turn to, but through
participation in the full convening series, they shared challenges, learned from each other and experts in the field, and
refined their systems. Through their collaboration and workshopping of specific challenges, they were able to
maintain momentum and advance their systems.
Additionally, their work together uncovered common best practices applicable to states doing similar work.
Although each state had a particular set of contexts that shaped the goals and development of their system, they
frequently found commonalities in both their purpose and process for developing teacher preparation data systems.
These best practices include:
Establish a vision for teacher preparation within a state and a theory of action for how the state will use
data in service of that vision.
Create a multi-year roadmap.
Meaningfully engage a range of stakeholders in the development and use of the data system.
Build a system of multiple measures and identify the content (domains, indicators, and measures) within
the data system based on your state’s vision, theory of action, and values.
Continuously improve the system throughout design and implementation.
Identify opportunities and third parties to provide technical assistance to teacher preparation programs in
using the state data to make targeted program improvements.
For additional information on the size of the featured states and details of their systems, please
refer to Appendix A.
attend college and higher-ranked colleges, earn higher salaries, save more for retirement, and less likely to have children as
teenagers, in study examining the school data of 2.5 million children in grades 3-8 linked to tax records over 20 years).
2 Additionally, several of these states also had the opportunity for further cross-state collaboration as members of the CCSSO
Network for Transforming Educator Preparation (NTEP).
4
The Need for New Data on Teacher Preparation
Traditionally, state and federal efforts to track and report information on EPPs or inform program renewal
decisions have not adequately supported providers or enabled advances in matching teacher supply and demand.
Reporting has typically been based on “inputs” that explain the characteristics of a program and its candidates, such
as student demographics or course and clinical requirements. But because this information does not correlate to a
teacher’s ability to succeed in the classroom, it fails to offer EPPs actionable information to strengthen their programs
or signal to SEAs when a program may benefit from intervention.
Similarly, LEAs are not given information to make discerning hiring decisions or support their teaching staff
based on how they were prepared, and teacher candidates cannot discern the best program to meet their goals.
Input-based reporting does not enable EPPs to match their teacher supply to hiring demands because it does not
track workforce data they would need to do so, such as graduates’ job placement or retention.
In 2012, in light of more rigorous learning standards and the growing conversation around teaching and
learning in 21st century classrooms, a Council of Chief State School Officers (CCSSO) task force comprised of state
chiefs recognized the benefits of states partnering with and better supporting EPPs in preparing teachers. The task
force articulated enhanced data systems as one of three primary policy levers for doing so and issued a report, Our
Responsibility, Our Promise, that included guidance for how to improve data systems to offer more robust information
to EPPs that would connect to PK-12 information and better support their improvement.3
This outcomes-based information—such as indicators of teacher effectiveness in the classroom and their job
procurement and retention—does a much better job illuminating teachers’ readiness for the classroom, and how
programs are contributing to the teaching needs of their state. Additionally, states’ data systems have been evolving
to provide information on individual preparation programs rather than whole institutions. Program-level data not only
differentiates between programs but also offers providers information at the level needed to recognize opportunities
for innovation and improvement.
Preparers are eager for this greater level of detail because it is fundamental to determining the changes
needed to improve a state’s workforce, setting the right goals for targeted improvements, identifying the necessary
resources, appropriately balancing workforce supply and demand, and ultimately tracking toward achievement of
those goals. In addition to preparers, LEAs, state leaders, and teachers all have a role to play in using and acting on
this kind of information if it is available. SEAs are uniquely positioned to provide this information, based on their
ability to access and connect data from both teacher preparation and PK-12 systems.
To be clear, the intent of outcomes-based reporting is not to prescribe certain actions for teacher
preparation providers or to collect additional data for data’s sake. It is to improve existing data reporting functions to
offer the information and conditions necessary for meaningful improvement and support, tailored in a way that
makes a difference for providers and districts. The SEAs featured in this report view their role in supporting teacher
preparation as:
Making data available, including sharing distributions of performance across programs;
Meaningfully defining the bar for program effectiveness and setting clear standards for renewal;
Building data systems to enable the state to make decisions based on how programs meet those standards;
Identifying, making available, and convening resources for technical assistance, but not necessarily serving as
the entity to offer it.
3 CCSSO Task Force on Educator Preparation and Entry into the Profession (2012). Our Responsibility, Our Promise: Transforming
Educator Preparation and Entry into the Profession, available at:
http://www.ccsso.org/Resources/Publications/Our_Responsibility_Our_Promise_Transforming_Educator_Preparation_and_Entry_into_t
he_Profession.html.
5
For more information on how the states interpret these responsibilities, please refer to
Appendix B.
Additionally, the featured states recognize that improved data systems4 alone are not the only thing
necessary for providers to improve, and they acknowledge that EPPs are not solely responsible for ensuring quality
teachers for all students. Certainly teacher candidates enter preparation programs influenced by their own
educational experiences, and they join instructional teams after preparation that collectively influence students’
experiences. But as a critical juncture in which teachers learn how to meet the needs of students, and as the source of
supply for states’ hiring demands, stakeholders require a better understanding of how preparation programs are
producing teachers.
By offering this level of understanding, outcomes-based teacher preparation data systems enable:
1. Public Transparency: Inform stakeholder decision-making and policy.
2. Continuous Improvement: Identify specific programmatic actions to refine teacher preparedness and
contributions to state and local workforce needs.
3. Accountability: SEAs and policymakers ensure a high standard of preparation across all programs.
The featured states have different points of view on how they use new data to accomplish each of these
three purposes. Specifically, they diverge on whether making outcomes-based data available is, in itself, enough to
drive programs to continuously improve and offer accountability to the public for doing so, or if the state must create
a formal accountability model by attaching consequences to the new data in order for programs to act on it. While
states always play a role in accountability by authorizing EPPs, they have so far differed on the extent to which they
may apply ratings to outcomes data or use it to influence program review decisions
Regardless, a state should identify their intended objectives for the data system at the start. The decisions
made at the outset are not limiting, and a state can always evolve in how they use their system. But the kind of data
they collect and the way it is communicated to stakeholders must be closely tied with the state’s objectives and
theories for how to best support programs. Teacher preparation data systems can achieve a number of benefits, and
deciding which benefits are most important will help the SEA determine how they want to structure their system and
define its intended purpose.
For additional details on how each of the featured states uses its data system to achieve these
intended purposes, please refer to Appendix A.
4 All of the data systems featured in this report, and the term “data systems” used throughout, refers to outcomes-based systems
that indicate how programs prepare teachers by offering evidence of teachers’ classroom readiness and experiences after
graduation. While such data systems do not all contain identical information, they likely include similar types of information from
multiple sources across the state, such as candidates’ success in preparation, information from LEAs about teachers’ job placement,
retention, and performance after they complete preparation, and state-level information to link these data points together and offer
additional information about states’ expectations and workforce needs.
6
Benefits of Teacher Preparation Data Systems
When empowered by the information available through robust teacher preparation data systems, states,
programs, and school districts are equipped to pursue and experience the following benefits:
1 Better meeting the needs of teachers and state and local workforce demands by identifying
and supporting targeted improvement efforts for programs;
2 Strengthened partnerships between districts and providers that enable districts and schools
to meet their needs and build stronger instructional teams;
3 More intentional state planning for teacher supply and demand;
4 Added efficiencies in state systems as a result of focusing on improving this aspect of their
data infrastructure.
The creation of a data system may not achieve these benefits on its own, but it provides a critical foundation for
doing so.
Benefit 1: Better meeting the needs of teachers and state and local workforce demands by
identifying and supporting targeted improvement efforts for programs
Providers require—and many are eager for—better information to inform program improvement. In 2015,
Deans for Impact surveyed 23 teacher preparation programs regarding the information they could access on their
completers. Of those 23, only six had access to the student achievement data of their candidates and less than a third
had other forms of information on their candidates post-graduation.5 One of the primary policy recommendations
made by Deans for Impact as a result of their study and on behalf of the programs surveyed was stronger state data
systems. Programs need to understand how their preparation equipped candidates for the classroom in order to
identify specific ways to make that preparation stronger.
Just as preparers need this information in order to know how to improve, SEAs need it to know how to
support them. Data systems help SEAs recognize the critical needs of their state’s teaching profession and set
expectations for providers to meet those needs. With this information, states can also track how providers meet these
expectations and recognize where programs benefit from intervention or where a program’s strengths can serve as
models to the field or otherwise be highlighted. States may choose to use their teacher preparation data system to
make program approval and renewal decisions, or offer less consequential interventions as needed. Regardless, data
is a necessary tool for a state making any decisions about how to intervene, hold accountable, and support programs
in a meaningful way.
STATE SPOTLIGHT: RHODE ISLAND, DELAWARE & ILLINOIS
States with completed data systems have started to see the effects of making this information available. In Rhode
Island, EPP leaders are now more aware of their completer employment within the state and their general
5 From Chaos to Coherence: A Policy Agenda for Accessing and Using Outcomes Data in Educator Preparation. (2015). Austin, TX:
Deans for Impact.
7
performance, enabling them to set more informed program goals. In Delaware, programs that received low ratings
on the state scorecard now have the information they need to create specific performance goals laid out in an
action plan. Additionally, as a result of the requests the Delaware Department of Education made of EPPs for
information on their candidates and graduates, programs strengthened their own internal data collection
processes, resulting in higher data quality within the institutions to inform their goals and improvement efforts.
Improving data collection and reporting at the state level can also streamline processes at the EPP level as well.
“We recognized a need for a more robust annual reporting system [on the Educator Preparation Providers in our
state] because we weren’t providing providers with the information they needed to improve in a meaningful way.
[Our existing system] would show who was compliant, which was almost all programs across the state. We weren’t
able to identify the programs that were excelling or needing improvement. We needed to give institutions
information they could use.”
-Emily Fox, Division Administrator, Educator Licensure, Illinois State Board of Education
Benefit 2: Strengthened partnerships between districts and providers that enable districts and
schools to meet their needs and build stronger instructional teams
Partnerships between school districts and teacher preparers can significantly strengthen the quality of
schools’ instructional teams by offering, among other benefits, quality student-teaching training opportunities to
candidates before they join a school, a seamless transition from preparation to full-time work, enhanced matching of
supply and demand, and meaningful feedback to preparers on the needs of new teachers upon entering the
classroom. Yet the success of such a partnership depends largely on access to data that can clarify the needs and
objectives for the collaboration and track its outcomes.
A recent report studied many of the strongest district-teacher preparation partnerships across the country to
create a roadmap for building such collaborations.6 The first stage of the roadmap requires data to understand district
pipeline needs and to set informed goals for the partnership, as well as continued access to data to measure how the
teaching candidates of the preparation program are meeting expectations. For partnerships to achieve their intended
benefits, a strong data system is required.
STATE SPOTLIGHT: RHODE ISLAND & LOUISIANA
Rhode Island has already witnessed examples of how their data system strengthened partnerships between
providers and school districts. As a result of its increased access to information, a school district was able to
recognize the number of candidates they were hiring from one provider in particular. They identified an
opportunity to revise their student teaching agreement with the provider to tailor it more to the district’s needs. As
a result, they now have an improved student teaching partnership and an enhanced relationship with one of their
largest providers. Separately, another Rhode Island provider was able to recognize room for improvement in its
partnerships with regional LEAs where they place student teachers, so they contracted with facilitators to lead a
two-day workshop with the provider and LEA leaders focused on how to improve their relationship.
6 Luczak, J., Vaishnav, A., Horwath, B. and Sanghani, P. (2016). Ensuring High-Quality Teacher Talent: How Strong, Bold Partnerships
Between School Districts and Teacher Preparation Programs are Transforming the Teacher Pipeline. Seattle, WA: Education First.
8
“[The work of building an index on teacher preparers] supports our larger vision of sharing useful data with
stakeholders. The prep work started with the intention of being able to share critical information with EPPs so they
could improve, districts so they could be better consumers around hiring, and the general public about what was
happening around hiring trends and prep in Rhode Island.”
-Lisa Foehr, Director, Office of Educator Excellence and Certification Services,
Rhode Island Department of Education
Louisiana Board of Regents publishes annual data dashboards with information about each EPP and the
Department of Education publishes regional workforce reports showing the hiring needs and placement of
teachers throughout each region, as well as the preparation programs supplying them. The DOE has observed
improved quality of conversation between districts and EPPs as the reports help them focus on the most
meaningful things in terms of developing partnerships: identifying where the highest need areas are, where
preparers should focus on recruitment, and the quality of completers. These data-informed conversations have
identified several ways to boost recruitment for districts, such as by alleviating the strain of commuting to certain
schools during periods of high traffic by changing their start time and the consideration of on-site childcare for
new parents.
Benefit 3: More intentional state planning for teacher supply and demand
The teacher workforce needs of each state are unique. They can vary by subject, grade level, and region,
among other factors. Data is required to know if a shortage or surplus exists and, if so, its root causes. This
information is foundational to being able to craft appropriate solutions to the underlying problem, including
identifying how providers can contribute. The unique details of a state or region’s workforce needs can also inform or
serve as the impetus for successful partnerships that address the issue, as noted above.
While a data system focused on teacher preparation programs may not itself contain all the information that
explains a state’s teacher demands, it will likely show detailed information about teacher supply, including the number
of teachers completing preparation programs each year, their certification areas, and their job placement and
retention. States can pair their data on workforce demands with these details on supply to understand the complete
picture of their workforce needs and make decisions about how to incentivize providers in meeting those needs. By
providing better information to preparers, LEAs, and state leaders on how preparation programs contribute to their
state’s workforce needs, teacher preparation data systems equip preparers with what they need to partner in meeting
those needs and better position the state to set more deliberate goals or incentives to do so.
STATE SPOTLIGHT: DELAWARE & RHODE ISLAND
Delaware aligned its workforce measures to their priorities by including in-state job placement in their teacher
preparation data system. Delaware schools hire 50 percent of teachers from out of state, and the Delaware
Department of Education (DDOE) hopes to partner with EPPs in encouraging more candidates toward in-state jobs.
Rather than only tracking whether program completers receive any job placement, the Delaware scorecard also
measures in-state job placements to offer providers the information needed and incentive to consider how they
contribute to the specific needs of the state in which they operate.
“From a state perspective, we felt that the pipelines for educators were a key, critical piece to having an effective
educator for every student. Yet, without having a sense of how well prep programs were doing and supporting
9
those pipelines, we were never really going to move the needle on teacher quality if we didn’t also include prep in
a major way. We know that effective teachers’ abilities go far beyond those of teachers who are less well-prepared.
In thinking about how much better our students would be if those teachers were better prepared, we can’t ignore
prep as a critical piece of the teacher quality conversation. And without data around their performance, we can’t
set goals or establish effective partnerships. We need data to help drive toward desired outcomes.”
-Shannon Holston, Deputy Officer, Educator Preparation, Delaware Department of Education
Similar to Delaware, the Rhode Island system offers programs information on how many candidates they place in
high-need teacher placement areas. As a result of seeing these areas of high need, some programs in the state
have started to explore creating new programs in order to help boost the supply of teachers in shortage areas.
Benefit 4: Added efficiencies in state systems as a result of focusing on improving this aspect of
their data infrastructure
Finally, states may find they experience other new efficiencies as a result of focusing on improving their data
infrastructure. With a robust data system in place, states have the foundation to recognize countless new
opportunities for growth within their programs and within their broader goals for education.
STATE SPOTLIGHT: RHODE ISLAND & DELAWARE
For example, Rhode Island significantly streamlined their teacher certification process as a result of being able to
move some of the steps previously completed on paper into the online system created for their new teacher
preparation data system. This enabled in-state program completers to apply for their initial certification online and
eliminated the need for Rhode Island Department of Education to manually collect and enter the same data
repeatedly. Further, programs are now able to track online their candidates’ progress from student teacher to
program completer and certified.
In Delaware, the SEA observed that preparation providers started to improve their own internal data infrastructures
in order to report required information to the state, which led the providers to have improved efficiencies and
access to information they can use to inform their programs.
10
Best practices for SEAs building a teacher preparation data system
The best practices provided here are key guidelines that every state should consider in how it approaches
the work of building and using a data system on teacher preparers, including the tools and reports included in its
system. A state will likely create its own timeline that will have key phases of design and implementation tailored to
their unique goals and needs. These best practices are not meant to substitute for building such a timeline or to be
interpreted as a step-by-step guide, because they are not perfectly linear steps in the process. One best practice does
not discretely begin and end before the next practice begins. Rather, the best practices here are “must dos” in any
state or any context; they will be relevant in each phase of the process and also personalized to each state’s approach.
This list of best practices was curated over the course of convenings as the featured states shared updates
on their work, workshopped challenges, and collaborated on how to best advance their goals. Through these
discussions, it became clear that though each state was building a unique system in a process tailored to their own
context, they all adopted these common practices as core elements of their work:
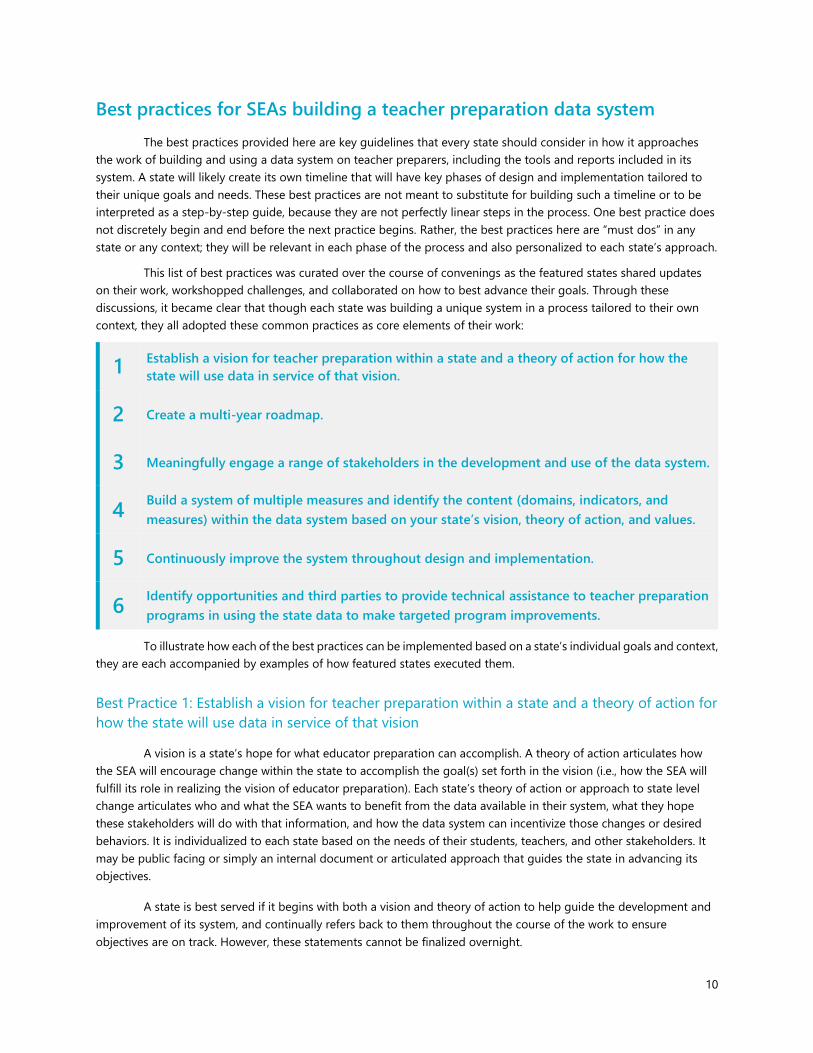
1 Establish a vision for teacher preparation within a state and a theory of action for how the
state will use data in service of that vision.
2 Create a multi-year roadmap.
3 Meaningfully engage a range of stakeholders in the development and use of the data system.
4 Build a system of multiple measures and identify the content (domains, indicators, and
measures) within the data system based on your state’s vision, theory of action, and values.
5 Continuously improve the system throughout design and implementation.
6 Identify opportunities and third parties to provide technical assistance to teacher preparation
programs in using the state data to make targeted program improvements.
To illustrate how each of the best practices can be implemented based on a state’s individual goals and context,
they are each accompanied by examples of how featured states executed them.
Best Practice 1: Establish a vision for teacher preparation within a state and a theory of action for
how the state will use data in service of that vision
A vision is a state’s hope for what educator preparation can accomplish. A theory of action articulates how
the SEA will encourage change within the state to accomplish the goal(s) set forth in the vision (i.e., how the SEA will
fulfill its role in realizing the vision of educator preparation). Each state’s theory of action or approach to state level
change articulates who and what the SEA wants to benefit from the data available in their system, what they hope
these stakeholders will do with that information, and how the data system can incentivize those changes or desired
behaviors. It is individualized to each state based on the needs of their students, teachers, and other stakeholders. It
may be public facing or simply an internal document or articulated approach that guides the state in advancing its
objectives.
A state is best served if it begins with both a vision and theory of action to help guide the development and
improvement of its system, and continually refers back to them throughout the course of the work to ensure
objectives are on track. However, these statements cannot be finalized overnight.
11
Both a vision and theory of action require a deep understanding of the state’s needs in order to articulate
appropriate goals, and a theory for how to feasibly achieve those goals. The work of creating a vision starts with a
landscape analysis of state needs, an assessment of the changes required to meet those needs, and identification of
how teacher preparation contributes to the intended changes. With this information, state leaders can determine how
to use data to achieve the desired change and build data systems accordingly. A vision and theory of action may
evolve upon learning more information through the building process, but they will remain a north star for shaping the
course of development and assessing whether the information is leading stakeholders closer to the intended goals.
The featured states have taken varied approaches to how and when they finalize their visions and theories of
action, but they consistently create them based on their particular needs and goals and use them regularly as a guide
to ensuring their data system meets those needs.
For a tool to help your state develop a vision and theory of action for teacher preparation data
systems, please refer to Appendix F.
STATE SPOTLIGHT: LOUISIANA
Louisiana’s vision for educator preparation is rooted in a belief in the capability of their students. The state has a
high bar of excellence for classrooms as well as an equally high bar for the EPPs that prepare teachers for those
classrooms. The vision that guides their work reads:
Upon receipt of a Level 1 teaching certificate, every teacher will have the knowledge and skills needed
to be able to add a year of academic growth and/or attainment of IEP goals for all students.
Preparation providers and LEAs partner to develop and implement recruitment, selection, and
placement strategies that align with workforce needs—including equitable access to effective
educators in high-need and geographically remote schools and hard to staff certification areas.
Louisiana’s approach to achieving this vision is based on the belief that change starts with the education field, and
the role of the state is to support and scale that work. So the first step for the state in any work on its EPP data is
understanding the education field and identifying its needs, which informs their approach to policy development
or other state changes in service of their vision. In the last three years, this approach has guided the state in
making several key changes to how they support EPPs, teachers, and districts.
Louisiana has long been a leader in using robust data to support its EPPs. Though the state’s work in making data
available to EPPs started over a decade ago, in 2014 the Louisiana Department of Education (LDOE) hypothesized
that teachers would need greater support to meet higher student and teacher expectations put into state law and
policy in 2012. To gain a sense of how the state was doing in achieving their vision in the wake of the new policies,
they turned to the field for the true perceptions of educators, school and district leaders, and preparation
providers.
In 2014, LDOE surveyed7 these education leaders statewide, inquiring whether teachers felt prepared for the
realities of the classroom. In response, LDOE heard from many districts that they did not have enough teachers,
and new teachers would benefit from additional training in certain areas, such as assessments, as well as more
hands-on experience in classrooms. The survey results confirmed LDOE’s hypothesis that there were opportunities
to strengthen preparation.
7 See http://www.louisianabelieves.com/docs/default-source/links-for-newsletters/partners-in-preparation-survey-report.pdf
12
These responses from the field identified areas of focus for moving closer to the state’s vision and framed the
state’s approach. The results suggested that increased clinical experience before entering the classroom full-time
would address many of the growth areas identified in the survey by offering more classroom experience, targeted
training in areas of district need, and increased alignment of supply of teachers to district vacancies. Using
practices informed by national and international teacher preparation examples, they established a pilot program,
Believe and Prepare, to support more partnerships between districts and providers in which teachers were prepared
through year-long residencies. After several years of piloting these teacher preparation shifts, the state Board
considered and adopted regulations that make a yearlong clinical residency before graduation a component of all
preparation programs across the state.
The Louisiana Board of Elementary and Secondary Education (BESE) recently enacted these policy changes as
requested by the field. With those in effect, LDOE has recently started considering how to further ensure teachers
are prepared for Louisiana classrooms and the state is moving toward its vision. LDOE is now focusing on the data
used to review and approve EPPs to ensure it is consistent with the goals for teacher preparation and the standards
districts and providers have come to expect through the success of the residencies.
Because Louisiana has long been a pioneer in publishing data around the efficacy of teacher preparation programs,
they already have prior lessons from the field to help guide their approach to program accountability. The state
first published value-added data for teacher preparation programs in 2007 without any associated consequences.
This served as a pilot for the state regarding how to incentivize change among providers. Based on this, LDOE
assembled an accountability work group composed of stakeholders from across the state as well as national
experts to help inform the best information to use in program review and approval and how to determine
appropriate consequences attached to those measures.
The work of the new accountability system is in progress, but it will remain driven by the field in the same way
Louisiana has approached all of its efforts to achieve the state’s vision for teacher preparation.
STATE SPOTLIGHT: MASSACHUSETTS
In June of 2012, Massachusetts’ Board of Elementary and Secondary Education (BESE) passed revised regulations
for program approval standards that ushered in new expectations for organizations in the state. These regulations
communicated several shifts in expectations, including an inclusion of outcomes measures. At the same time, the
Massachusetts Department of Elementary and Secondary Education (DESE) had been collaborating with EPPs about
their data on completers and how it could be linked to the state’s PK-12 data systems, identifying an interest
among EPPs in greater access to outcomes-based data. DESE decided that to fully uphold the shift in expectations
outlined by BESE, an improved accountability system incorporating more robust data would need to be envisioned
and implemented.
Massachusetts’ work is guided by their mission to guarantee that preparation in MA results in effective educators
ready to support the success of all students. While the intention of this mission was not new, when the DESE team
began improving their accountability system, they wanted to communicate a sense of urgency around their work
on the new system to help re-focus efforts and make careful choices about how to approach and refine the work.
They crafted a vision to more explicitly convey their mission that states:
Our team’s driving belief is that Preparation CAN and SHOULD prepare educators to be ready on
day one…. Our goal, which began in 2012, is that by 2022, we want to close what we call the
“experience gap” and dramatically alter the growth trajectory of first year teachers such that they
come in practicing at a much higher level than they are right now.

13
We know that first year teachers are more likely to be assigned to academically-behind
students…[and] [f]irst year teachers also have a lower median SGP than more experienced teachers.
Therefore, we have unique leverage to make a powerful positive impact on our students by giving
our neediest students access to effective teachers.
Our biggest policy levers for achieving our vision for educator preparation are our formal review,
interim review and informal review. Each of these accountability mechanisms relies on data and the
professional judgment of our review team members…to ensure that all educator preparation
programs are meeting the high set of expectations the state has placed upon them starting in 2012.
This statement offers a clear and consistent message about why the state was focusing efforts on teacher
preparation and what they intended to accomplish as a result.
Additionally, DESE articulated how they believed their work would achieve those intended outcomes in an internal
theory of action. This helped to further explain the changes underway based on the end goals and also helped
DESE step back from their ongoing work and synthesize whether all of their current and forecasted actions were
aimed toward their vision:
As a state agency, we believe we are best positioned to improve the quality of educator preparation
by focusing our efforts on three main facets of work. All of these efforts exist in a balance to ensure
that we achieve our state’s goals, and each is driven by the data system we’ve intentionally built to
support evidence-based decision-making. With our data linkages in their nascent stages, we focused
our efforts for developing a robust accountability system that put output measures at the center of a
multiple measures system.
First, we believe that by implementing an effective, efficient and consistent review processes, we can
ensure that all programs are meeting the high expectations the state has placed upon them. The
review process uses an evidentiary-base that relies on outcomes rather than programmatic inputs
and is designed to incorporate different data measures as they become available. Just like our
educator evaluation system, the process relies on the professional judgment of the review team
evaluating the educator preparation program. There are several checks in place to ensure that the
review team is well-calibrated. Each criterion the review team evaluates is descriptive of expectations,
not prescriptive of approach. In this way the state does not set algorithmic thresholds, rather we rate
the sufficiency of evidence present or not for any given expectation. This drives the state and providers
to closely examine outcomes data in support of this process.
Second, we believe that all organizations should be continuously improving. Our role as the state is
to provide data to ed prep programs so that they can monitor their own progress to their goals, while
at the same time changing course if needed. To support this, we’ve built a platform to share data
with providers in a way that allows them to slice, dice and cross-cut the state measures, so that they
can look at it in the most meaningful ways. This system also allows them access to the data at least
one year before it becomes publicly available and part of our accountability framework.
Finally, as we think about the potential of the market forces to drive improvement within our
programs, we readily share the outcomes data on our public Profiles. In this way, a potential
candidate or hiring district could review the outcomes data of different preparation providers,
alongside important context about that data provided by each program.
Data is an embedded and integral part of all of these avenues of work. Data helps to unify these
buckets of work into a coherent and cohesive vision.
14
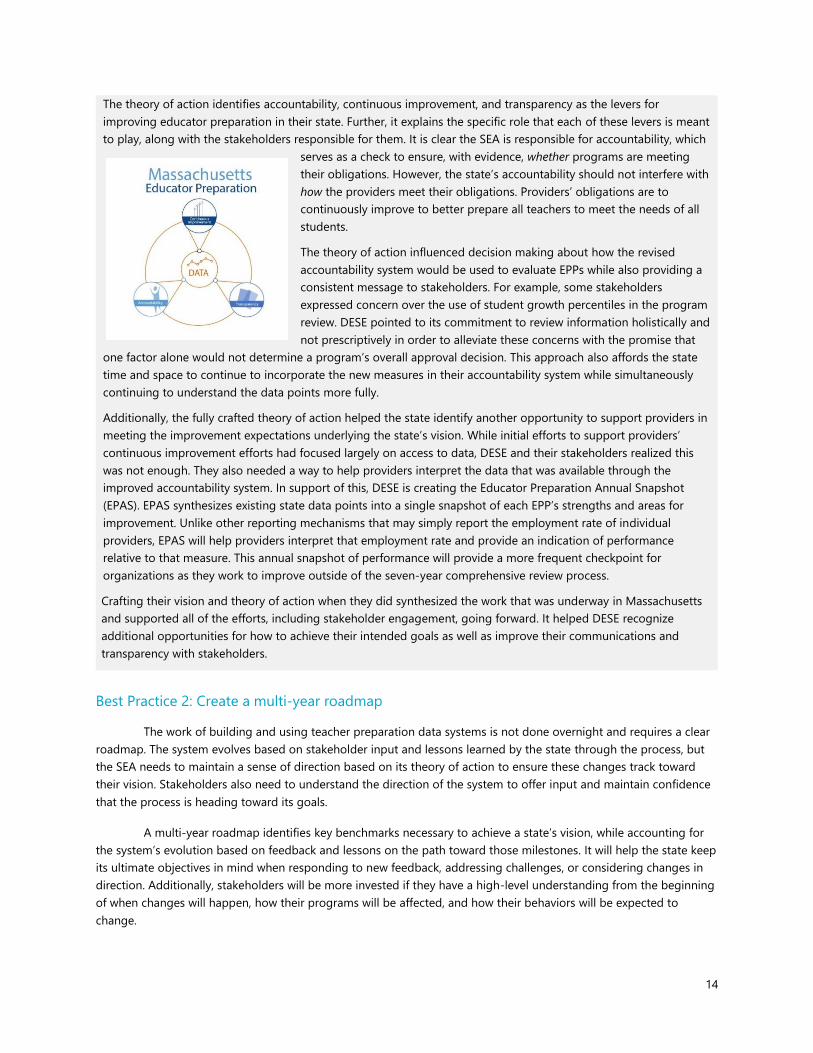
The theory of action identifies accountability, continuous improvement, and transparency as the levers for
improving educator preparation in their state. Further, it explains the specific role that each of these levers is meant
to play, along with the stakeholders responsible for them. It is clear the SEA is responsible for accountability, which
serves as a check to ensure, with evidence, whether programs are meeting
their obligations. However, the state’s accountability should not interfere with
how the providers meet their obligations. Providers’ obligations are to
continuously improve to better prepare all teachers to meet the needs of all
students.
The theory of action influenced decision making about how the revised
accountability system would be used to evaluate EPPs while also providing a
consistent message to stakeholders. For example, some stakeholders
expressed concern over the use of student growth percentiles in the program
review. DESE pointed to its commitment to review information holistically and
not prescriptively in order to alleviate these concerns with the promise that
one factor alone would not determine a program’s overall approval decision. This approach also affords the state
time and space to continue to incorporate the new measures in their accountability system while simultaneously
continuing to understand the data points more fully.
Additionally, the fully crafted theory of action helped the state identify another opportunity to support providers in
meeting the improvement expectations underlying the state’s vision. While initial efforts to support providers’
continuous improvement efforts had focused largely on access to data, DESE and their stakeholders realized this
was not enough. They also needed a way to help providers interpret the data that was available through the
improved accountability system. In support of this, DESE is creating the Educator Preparation Annual Snapshot
(EPAS). EPAS synthesizes existing state data points into a single snapshot of each EPP’s strengths and areas for
improvement. Unlike other reporting mechanisms that may simply report the employment rate of individual
providers, EPAS will help providers interpret that employment rate and provide an indication of performance
relative to that measure. This annual snapshot of performance will provide a more frequent checkpoint for
organizations as they work to improve outside of the seven-year comprehensive review process.
Crafting their vision and theory of action when they did synthesized the work that was underway in Massachusetts
and supported all of the efforts, including stakeholder engagement, going forward. It helped DESE recognize
additional opportunities for how to achieve their intended goals as well as improve their communications and
transparency with stakeholders.
Best Practice 2: Create a multi-year roadmap
The work of building and using teacher preparation data systems is not done overnight and requires a clear
roadmap. The system evolves based on stakeholder input and lessons learned by the state through the process, but
the SEA needs to maintain a sense of direction based on its theory of action to ensure these changes track toward
their vision. Stakeholders also need to understand the direction of the system to offer input and maintain confidence
that the process is heading toward its goals.
A multi-year roadmap identifies key benchmarks necessary to achieve a state’s vision, while accounting for
the system’s evolution based on feedback and lessons on the path toward those milestones. It will help the state keep
its ultimate objectives in mind when responding to new feedback, addressing challenges, or considering changes in
direction. Additionally, stakeholders will be more invested if they have a high-level understanding from the beginning
of when changes will happen, how their programs will be affected, and how their behaviors will be expected to
change.

15
The lessons of the featured states illustrate how they have created their multi-year roadmaps as well as how
they stay on track toward meeting their milestones.
STATE SPOTLIGHT: ILLINOIS
Illinois is in the process of building a new teacher preparation data system that will replace its existing system for
determining program approval and renewal decisions. The Illinois State Board of Education (ISBE) team responsible
for the new system wanted a plan to help structure their work, and they knew the institutions with whom they
planned to engage would also want an understanding of when the new system would go into effect and how they
would be heard throughout the process. With the support of consultants, other experts, and a review of examples
of other featured states, the team created a multi-year timeline for developing their system, including key
milestones to reach along the way, and identified ways to monitor their progress against those milestones.
Illinois learned other states had used pilots of their data systems to get feedback on their reliability and usability
before finalizing the data system and making information public or consequential. They applied this example to
their own context to plan a three-year pilot, believing their EPPs would be most comfortable with ample time for
the data to be reviewed year over year and corrected based on stakeholder input. Additionally, they knew they
were collecting new information that would require new data-sharing agreements with providers of the
information, acclimation to new data requests for the entities providing data, and a state-level synthesis of new
data from a variety of sources. They intentionally created a timeline that accounted for delays in the collection
process so they could plan for and address the unexpected without falling off their key benchmarks.
The first year of the three-year pilot would be a voluntary pilot, and the second and third years would be
mandatory for all providers in the state. By making the first year voluntary, the state could minimize the
commitment providers were required to make while offering the option of being involved as soon as they wanted
to be. Additionally, by the time of the mandatory pilot, the state will have been able to refine the data collection
and reporting so that all institutions statewide see a stronger version of the system. Year three of the pilot will be
used to further refine the system.
Illinois also created a timeline of “Important Dates”8 to share with stakeholders and the general public. They began
stakeholder engagement efforts by sharing this framework for how the state would build its system, when
stakeholders would be involved in the process and how, and when the final system would launch. At the same
time, they shared a clear message about the purpose of the new system and how their timeline would help them
achieve their goals. (See more regarding Illinois’ messaging to stakeholders in the stakeholder engagement best
practice below.)
Illinois is now in the midst of its first pilot with strong voluntary participation from most providers in the state.
Though they have already encountered parts of the process that take longer than expected, they are on track for
meeting their key milestones as a result of the thoughtful design of their plan and publicly committing to key dates
so their team and all the stakeholders involved would be jointly accountable to the milestones.9
8 See https://www.isbe.net/Documents/PEP-fact-sheet1611.pdf
9 For additional information on the development of the Illinois system, please refer to their website:
https://www.isbe.net/Pages/Partnership-for-Educator-Preparation.aspx

16
Key Tips on Multi-Year Planning
Rely on examples from other states whenever possible to not re-invent the wheel, and tailor their
ideas to the needs and capabilities of your state.
Plan for the unexpected and build in extra time to ensure you are able to stay on track toward your
broadcasted deadlines.
Build pilot periods into your plan and use them as a way to test the collection of new data and
verify it with the field before launching final systems.
Create shared accountability between the SEA and stakeholders in meeting deadlines. Once you
have established a timeline with milestones that account for extra time for the unexpected, publicly
share your timeline, noting when stakeholders will provide input and when the SEA is promising
new information or deliverables.
STATE SPOTLIGHT: LOUISIANA
As evidenced by their vision and approach to policy development in service of their vision, Louisiana follows a
multi-year plan for all of their work supporting teacher preparation programs to ensure the field is leading the way.
In the example of their residency requirements, the Department responded to a need and funded innovative
districts and EPPs to develop promising models and refine them over time.
As a general rule, their approach is to start a new initiative based on either a need identified from the field or a
legislative mandate. From there, they “verify” the need with the field to understand the real challenge or real
change that is needed to benefit the affected stakeholders. They then share their findings publicly, as a way to
report back to stakeholders what they heard, ensure it captures the changes desired by the field, and affirm their
commitment to act.
With the end goal identified, they next pilot possible solutions to find the best means to accomplishing the desired
end. The pilot process includes evaluating the pilot and its results to determine the best course of action. The pilot
process is not only useful for identifying practicable strategies and testing their effectiveness, but it also ensures
stakeholders refine the solutions until they are supportive of any future changes before they are finalized or
implemented at scale.
Once the pilot process has revealed a course of action that will achieve the desired result and has the support of
stakeholders, the state formalizes the change. In the instance of a problem that started with a need identified from
the field, the next step is likely to codify the new change or plan of action in policy. If the need arises from a
legislative mandate, the SEA tries to have their pilot process built into the policy itself so that implementation of
the legislation can follow this same course of action.
The example of how Louisiana revised its residency requirements illustrates how they applied their multi-year
approach to identifying the need for teachers to be better prepared to meet the specific demands of Louisiana
students and ultimately identified a possible solution. This same framework can be applied in other states to
crafting a vision and theory of action for teacher preparation as well as the structure for creating multi-year
roadmaps to build and use their data systems.
17
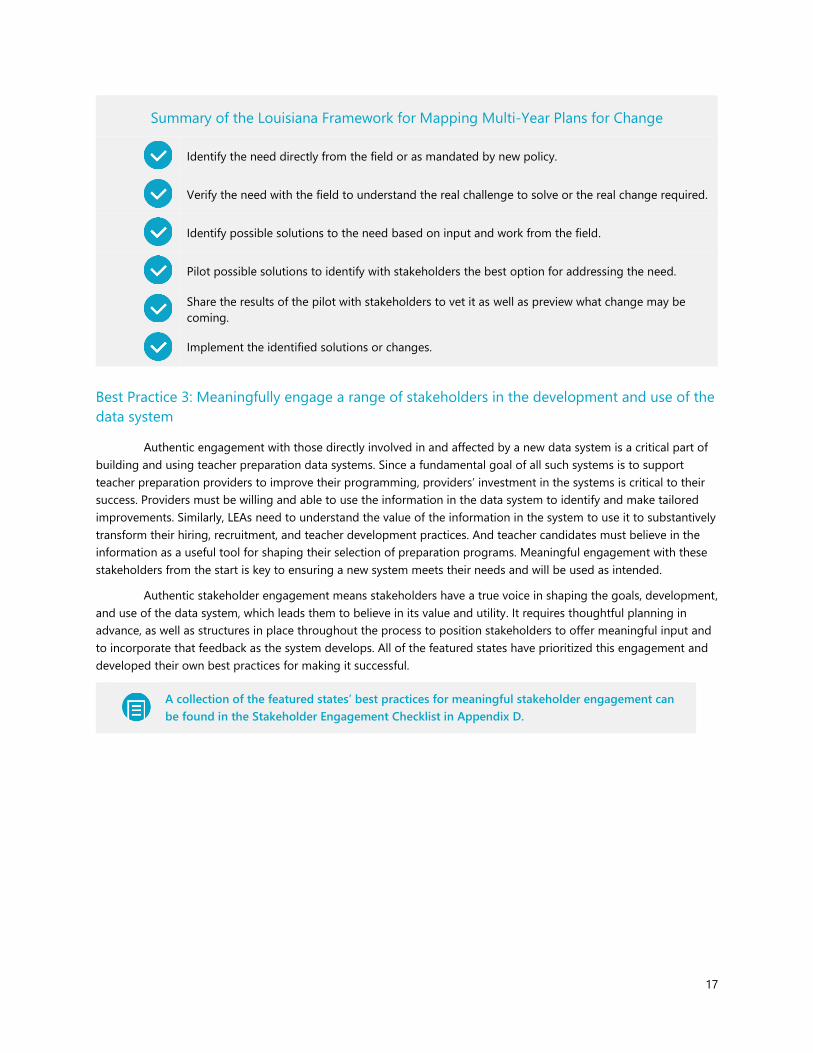
Summary of the Louisiana Framework for Mapping Multi-Year Plans for Change
Identify the need directly from the field or as mandated by new policy.
Verify the need with the field to understand the real challenge to solve or the real change required.
Identify possible solutions to the need based on input and work from the field.
Pilot possible solutions to identify with stakeholders the best option for addressing the need.
Share the results of the pilot with stakeholders to vet it as well as preview what change may be
coming.
Implement the identified solutions or changes.
Best Practice 3: Meaningfully engage a range of stakeholders in the development and use of the
data system
Authentic engagement with those directly involved in and affected by a new data system is a critical part of
building and using teacher preparation data systems. Since a fundamental goal of all such systems is to support
teacher preparation providers to improve their programming, providers’ investment in the systems is critical to their
success. Providers must be willing and able to use the information in the data system to identify and make tailored
improvements. Similarly, LEAs need to understand the value of the information in the system to use it to substantively
transform their hiring, recruitment, and teacher development practices. And teacher candidates must believe in the
information as a useful tool for shaping their selection of preparation programs. Meaningful engagement with these
stakeholders from the start is key to ensuring a new system meets their needs and will be used as intended.
Authentic stakeholder engagement means stakeholders have a true voice in shaping the goals, development,
and use of the data system, which leads them to believe in its value and utility. It requires thoughtful planning in
advance, as well as structures in place throughout the process to position stakeholders to offer meaningful input and
to incorporate that feedback as the system develops. All of the featured states have prioritized this engagement and
developed their own best practices for making it successful.
A collection of the featured states’ best practices for meaningful stakeholder engagement can
be found in the Stakeholder Engagement Checklist in Appendix D.
18
STATE SPOTLIGHT: ILLINOIS
From the beginning of its planning, the Illinois state team was committed to authentic stakeholder involvement.
As a first step, Illinois deliberately crafted the messaging about their new data system. They wanted providers and
districts to understand that the system was meant to support them and help them improve. Though the system will
be used for program review and approval once launched, the purpose of that accountability is to support and
strengthen providers. Additionally, the state team recognized that building the new system requires the collection
of additional information from stakeholders, which would be an additional request of their time. With this in mind,
the state team strived to emphasize how the system would result in tangible benefits to stakeholders. For instance,
the state’s institutions wanted to know where their graduates teach post-graduation; the state emphasized they
would be able to provide it in the new data system. ISBE’s message about their goal to support providers is shared
publicly on their website10 and consistently throughout additional materials on the new system.
Next the state team created a steering committee, referred to as the Partnership for Educator Preparation (PEP),
which would consistently offer feedback throughout the process. The steering committee offered one consistent
entity with which the state team could regularly interact while accounting for multiple voices involved in the
process. Since the PEP would be their primary source of stakeholder input and investment, the Illinois team
ensured it included full representation from all stakeholders involved in teaching, hiring teachers, and preparing
teachers in all regions of the state. They invited representatives from the following stakeholder groups:
Teacher preparation providers from private, public, and community colleges including both large and
small institutions
School district HR personnel
Teachers (identified by the teachers’ unions)
Illinois Community College Board
Illinois Board of Higher Education
Illinois Parent-Teacher Association
Large Unit District Association
State Board of Higher Education
To invite stakeholders, ISBE personally reached out to high-level staff at each entity to ask who should be involved.
To help PEP members attend meetings and affirm the state’s message that the purpose of this work is to support
their stakeholders, they procured substitute teachers for any teachers on the PEP who missed class as a result of
the meetings.
The state team continues to use many forms of communication to interact with the PEP, including the PEP website,
in-person meetings, webinars, surveys, FAQs, establishing a call-in support number, and offering one-on-one
correspondence via e-mail or phone. This captures feedback from a variety of stakeholders who have different
schedules and various opportunities for how they can engage. Additionally, multiple forms of communication offer
a tangible way to affirm the state’s commitment to authentic and robust engagement with stakeholders.
The ISBE team built their multi-year plan around this stakeholder engagement. They considered how stakeholders
would respond to their timeline and also built time into their milestones to receive and incorporate input from
stakeholders. Illinois officially launched the PEP in spring of 2016, at which time they were already prepared to
share goals for the new data system and the key dates for its development. Their pre-planning offered clarity to
stakeholders about the intent of the system and also certainty that the current system would be changing, with a
10 See https://www.isbe.net/Pages/Partnership-for-Educator-Preparation.aspx

19
timeline for how. Moreover, it illustrated the value of stakeholder input, articulating how they can engage, what
aspects of the system they can help shape, and when that will happen. Throughout the execution of their key
milestones, the state has also shared its materials publicly through a website created specifically for the PEP.
After providing a clear overview of the plans for the new system and the role of the PEP in their first meeting, the
ISBE facilitator shared specific questions for stakeholder input right away. She made a point to largely just listen
and take notes on what she was hearing so that stakeholders left the meeting feeling heard. Importantly, the state
did not stop there. They immediately synthesized the feedback and identified opportunities for changes they could
implement right away to show the PEP their commitment to using their input. For example, ISBE promptly removed
some elements from the data collection requests they planned to make in the pilot based on PEP feedback that the
elements were redundant, and ISBE refined definitions of certain elements where the PEP noted the definitions
were ambiguous.
After launching the PEP in spring of 2016, Illinois launched the first year of their pilot in the fall. Though it was
voluntary, most stakeholders chose to participate, serving as evidence that stakeholders so far believe their
participation and input is worthwhile and a positive sign of their investment in the ultimate system.
Best Practice 4: Build a system of multiple measures and identify the content (domains,
indicators, and measures) within the data system based on your state’s vision, theory of action,
and values
No state has found a “magic formula” to drive program improvement at scale and perfectly match the supply
of teachers to workforce demands. In lieu of a single, consistently recognized and evidence-based pathway to
effectively preparing all teachers, states rely on a variety of elements collectively to identify how preparers are
equipping teachers for the classroom and meeting workforce needs. One measure on its own may not tell a complete
story about a preparation program, but the picture is more complete when the data is paired with other measures.
Further, additional strengths and characteristics of a program can be revealed through the use of multiple measures.
Each state determines what it values in the teaching workforce and how to encourage providers and partners
to support those values. States should not select each measure in isolation but rather start with the big picture of
what a successful teaching workforce would look like and identify the elements that collectively compose that picture.
Every measure should, either on its own or in conjunction with others, reveal some information to assess whether the
state is moving closer to its goals for the teaching workforce. The selection of measures will also be influenced by the
realities of what a state can access and share, such as how information on teacher candidates or their student
performance is influenced by a state’s privacy laws.
Many of the featured states realized the magnitude of how unique each state’s system truly is at different
points in the convening series. They felt it was eye-opening to recognize their role is not to build the universally
accepted ‘perfect system’ but to identify the measures that most perfectly achieve the state’s goals and workforce
needs. Given their shared view, this report does not offer a proposed framework or set of recommended measures for
building your own data system. Rather, the case studies here illustrate how two of the featured states chose their own
set of multiple measures to highlight key steps of the process for doing so.
Additional details about the measures each featured state chose, as well as additional resources
on the types of measures a state may consider, can be found in Appendix A.
For a glossary of defined terms used in discussing multiple measures systems, such as domains,
indicators, and measures, please refer to Appendix C.
For a tool to use in applying your vision and theory of action to the selection of measures,
please refer to Appendix G.
20
STATE SPOTLIGHT: MASSACHUSETTS
The work of building an outcomes-based data system in Massachusetts started with a series of conversations with
the state’s EPPs and a pilot to test the possibilities. In 2011, DESE worked with 14 EPPs to explore their data and the
possible linkages between preparation data and the state’s PK-12 system. From these insights, Massachusetts
recognized the value in linking their EPP accountability system to the PK-12 system and was able to more clearly
outline the intent behind their improved data system, shared in their vision earlier.
DESE used the feedback from their providers and their pilot process to develop the measures of their new EPP
accountability system. Based on their collaboration with EPPs, Massachusetts believes that every data point
associated with educator preparation tells you something about a program and is meaningful when triangulated
with all of the evidence collected both from the EPP as well as by the state during onsite review. Further, they
believe the professional judgment of field experts is a key element in interpreting all of the evidence about a
program. Based on these beliefs, they created a robust set of revised measures for their accountability system that
linked to PK-12 systems and offered a variety of data points from which reviewers could ascertain a comprehensive
picture of EPPs. The complete set of measures used in the Massachusetts accountability system can be found in
Appendix A.
Having identified a set of measures for EPPs, DESE turned to collecting the data to ensure they would be able to
use it. They created a unique identifier to bridge multiple data sets and link all of the measures to one teacher.
They spent two years building the identifier and applying it to the disparate data sets. The unique identifier now
allows DESE to track teachers from their preparation programs into their jobs, measure their retention, track their
performance, and match them to their students’ performance records.
The unique identifier allowed them to start using the increased information within their program review process,
which required a plan for how to rate the new information and incorporate it into programs’ renewal decisions.
Based on the commitment to reviewing programs holistically articulated in their vision and theory of action, they
decided to not establish an algorithm for each indicator but instead calibrate the review teams. The reviewers all
use the same process and tools11 to assess all of the information about a program in relation to each other,
ensuring a nuanced approach to understanding the full picture of a program.
DESE also designed this calibration and the structures that support it to evolve as more outcome measures
become available. To ensure this room for growth as well as the state’s commitment to reviewing whether
programs meet expectations but now how they do so, they intentionally decided that reviewers would evaluate the
sufficiency of evidence in support of whether an expectation is met, not the quality of the activities involved in
meeting the expectation. In this way, DESE and program reviewers are focusing on outcomes by looking for
evidence of impact suggesting that that criteria is met—regardless of the plans or inputs of an EPP to meet
expectations.
For additional information on key considerations in planning to collect the data needed for your
state’s multiple measures system, please refer to Appendix E.
11 See http://www.doe.mass.edu/edprep/evaltool/default.html

21
STATE SPOTLIGHT: DELAWARE
Delaware has a state policy12 that requires EPPs to collaborate with the Delaware Department of Education (DDOE)
in reporting on information about their program graduates and requires DDOE to approve and review all EPP
programs based, in part, on this performance data. At the same time this policy was enacted, DDOE also
recognized teacher preparation providers as a critical factor in the success of teachers and, therefore, the success
of students. They wanted to include EPPs as equal stakeholders in sharing the responsibility for meeting the state’s
goals for student achievement, which required a new data system to provide a detailed understanding of how
those programs prepared teachers. The state policy offered minimum boundaries for what the system must
contain, which DDOE used as a launch point for identifying the additional metrics that, when combined, tell a
comprehensive story about a teacher preparation program’s contribution to the state workforce.
This initial belief in the importance of providers sharing responsibility for student achievement, as well as the need
for data to understand how providers fulfill that role, served as Delaware’s vision at the start of this work. (They
later articulated a more formal vision and theory of action, once they were deeper into the process of building
their system, and used it to shape many of their decisions and confirm their work was on track toward their goals.)
In the absence of those statements at the start, DDOE articulated design principles that served as a theory of
action proxy. Additionally, the legislation clarified some elements they would have otherwise been decided at the
start, such as how the information would be shared and whether it would be used for program accountability.
The legislative requirements and design principles served as the state team’s bar for what is important in their
system and for making decisions about what to include. Delaware created their original design principles based on
research and on the belief that their final system should convey through multiple data points a comprehensive,
accurate picture of how all preparation programs equip teachers for the classroom and contribute to the state’s
workforce. For example, one of the principles was, “The reports should offer an honest accounting of the program
participants …through multiple metrics, not individual impacts.” The core belief that the system should identify
how programs across the state are performing also led to principles that the system should “highlight the
differences among programs” and “be comparable across different educator types and pathways.”
To see the complete set of design principles used by the Delaware DOE in building their multiple
measures system, refer to Appendix H.
DDOE then created a framework of “inputs, outputs, and outcomes” for identifying potential measures. These are
three categories of measures that DDOE believed would, together, illustrate the full picture of a providers'
performance and provide actionable data for improvement. "Inputs" are metrics regarding who enters a program,
such as recruitment information. "Outputs" are data points regarding teacher candidates upon completion of their
preparation, such as their content knowledge and job placement. "Outcomes” reflect the impact of the teacher's
preparation, such as their job retention and their students' learning. DDOE believed all three types are necessary
to understand a program's effectiveness and alignment to state values. For example, the state wants teachers to
be effective in positively affecting student learning, which required outcomes measures. The state also values a
diverse teaching workforce, which required understanding the input of diverse candidates into programs.
Once DDOE determined their scorecard would include these three types of measures, they brainstormed all of the
possible measures of each type that could possibly inform their understanding of programs. They did not limit this
brainstorm to only information currently available in the state as they wanted to identify everything that could
possibly yield useful information. As part of this initial brainstorm, DDOE met with EPP stakeholders on several
12 See http://delcode.delaware.gov/title14/c012/sc08/index.shtml
22
occasions to solicit input on what they would like to see in the scorecard and have access to for their own
improvement efforts.
With a complete list of possible inputs, outputs, and outcomes brainstormed, DDOE then evaluated each possible
metric according to their design principles to identify the elements most critical for meeting their goals. For
example, they had brainstormed graduation rate as a possible output measure. When evaluating it against their
principles, it was unclear what this metric on its own would indicate about a program so they did not include it.
They had also brainstormed the outcome metric of teacher retention. They knew from research that a teacher is
more likely to remain in teaching if better prepared for it. Because of this correlation to the impact of preparation,
DDOE decided to include it. They also identified student growth as a possible outcome measure. Asking what it
would tell them, they concluded it could serve as a sign of a teacher’s effectiveness in the classroom and it met all
of their design principles, such as the ability to make it comparable across the state. Based on this analysis, they
included student growth in their system as well. Once DDOE had a narrowed list of draft measures that met their
design principles and goals, they turned to organizing them. They wanted to categorize the metrics into similar
groups, or domains, which would simplify the system and the scoring for making program renewal decisions. The
draft metrics fell rather naturally into domains based on similarities in what they reveal and their type of metric.
For example, the measure of student growth indicates a teacher’s effectiveness, as do teacher evaluation ratings.
These are both outcomes that naturally fit into the same domain of Graduate Performance. DDOE reviewed all
their measures for these commonalities and organized their metrics into six domains:
Recruitment
Candidate Performance
Placement
Retention
Graduate Performance
Perceptions
With the metrics organized, DDOE considered how each would be scored to contribute to a program’s overall
renewal decision. They used a base score of 100 points for simplicity. Each domain and metric are assigned a total
point value within the 100 available points; the greater the possible point value indicates a greater weight in the
overall score. DDOE started by determining the total point value applicable to each domain and then assigned
point values to each metric within it based on the total allotted to that domain.
When assigning point values, the team continually went back to its goals and design principles by asking, “What
are we trying to incent?” They believed higher weighted metrics would be paid closer attention to, so higher
weights were assigned to the behaviors the state most wanted to see improved. However, they also were
committed to making all measures work together to paint an overall picture of programs, so they did not want
any metric to be weighted so high that it alone could change a program’s overall rating.
For a tool to help guide your state’s thinking in how to make decisions about scoring multiple
measures consistent with your values and objectives, refer to Appendix G.
DDOE then took its draft system to the field for feedback. They ran draft reports based on their newly designed
system and shared them with stakeholders—for informational purposes only—without attaching any program
renewal consequences. If they had decided to include a measure to which they did not yet have access, they
marked it as a placeholder during initial scoring decisions. It was assigned a point value, but that value was
deducted from the 100 points possible until the measure was collected. DDOE hosted monthly stakeholder
meetings to get input on the accuracy and utility of the draft reports. Based on feedback from the field, they
refined the metrics as well as the point totals before launching final reports, with renewal decisions, in 2016. For
example, they added a measure for content readiness exam scores to the Candidate Performance domain and
worked with stakeholders to create a survey for the Perceptions domain.
23
To determine how point totals result in a program renewal decision, they use four performance tiers:
1. Renewed
2. Renewed with Conditions
3. Probation
4. Program Under Further Review
This allows them to make decisions about how to set “cut offs” for the point totals of each tier. In doing so, the
state again asked “what are we trying to incent?” and “what to do we value?” By this point, they had articulated an
explicit vision and theory of action that stated the specific changes they wanted to see made in teacher
preparation as a result of their reports. This, along with their original design principles, helped them determine
answers to those questions and establish cut scores consistent with their values.
Delaware’s approach to building its multiple measure system is instructive not only in offering a framework and
rationale for determining the content of a system, but also how they adopted many of the best practices to build
their system. They started with a loose vision and theory of action (in their design principles) and codified it over
time to help synthesize what they were trying to achieve. Throughout the process, the statement of their values
and what they believed important to achieving those values guided their decision-making. From the beginning of
their work, they had a multi-year outlook that included a design phase, stakeholder engagement period based on
draft informational reports, revision period, and then a systems launch. They built stakeholder engagement
directly into this multi-year outlook to ensure the final system was based on direction from the field.
Their experience also emphasizes the iterative nature of this work: they brainstormed a variety of measures and
vetted them before continuing to make other refinements throughout the build process. Moreover, it illustrates
how many of the best practices identified in this report occur concurrently. As Delaware was building its system of
multiple measures, they were continuously refining it and engaging stakeholders.
Best Practice 5: Continuously improve the system throughout design and implementation
States should plan to refine their systems during the building process and to continually revisit their systems
and make adjustments after they are implemented. States should clearly explain these intentions to stakeholders from
the very beginning to set the expectation that the system may not be perfect from day one but, with shared
stakeholder commitment and feedback, will ultimately achieve the objectives. The iterative nature of this work also
gives providers a model of continuous improvement from the state and makes clear its commitment to being
responsive to stakeholder input.
In a multi-year roadmap, build in milestones that expressly state when revisions to the system will be made
based on stakeholder input and state team’s review of incoming information to ensure promised improvements will
be made and accounted for in project planning. The plan for continuous improvement should account for not only
stakeholder feedback, but also for reviewing the data to identify additional refinements called for by the information
itself. State teams should regularly assess the data they are collecting to identify if new questions arise and to track
whether the data collected is meeting their needs, as set forth in the vision, and driving the desired improvements set
forth in the theory of action.
STATE SPOTLIGHT: NEW JERSEY
The New Jersey Department of Education (NJDOE) started working on new Educator Preparation Provider
Performance Reports (EPPPR) in 2012. Their goal at the start was to develop a better picture of how providers were
preparing their teachers for the classroom and how the contribution of providers into New Jersey public school

24
districts was meeting the needs of LEAs. They set out to be methodical about engaging stakeholders in how the
reports were developed and continuously improving based on that input.
NJDOE created a structure in which they initially released a version of the report to providers and kept the reports
“embargoed” for one year before being posted publicly. In that year, providers could offer feedback on the
accuracy of the information in the reports as well as its utility to them in understanding how their programs were
meeting the needs of teachers and districts. The state then improved the system in the embargo year before
publicly releasing the revised reports.
NJDOE shared their first report with providers in 2013, but it was not posted publicly until 2014. Each year since,
they have maintained the same structure. NJDOE embargoes and refines all new data points for one year before
they are published, but they do not embargo data points that have already been through an embargo year. During
the embargo year for new data elements, NJDOE collects feedback from providers on the accuracy and
visualization of the data. Based upon that feedback, NJDOE then revises the embargoed elements appropriately
prior to public release the following year.
In the years they have followed this structure, NJDOE has been able to identify and make a number of
improvements both in terms of content as well as display of the reports. For example, in 2015, NJDOE added a new
element to the EPPPR to share teacher evaluation data with providers. They added this to offer providers a
stronger indication of how their teachers were prepared to perform in the classroom upon graduation. In 2016,
NJDOE added PRAXIS Core statewide scores to their reports for the first time. They shared this element on an
embargoed basis and only at the state level. Their providers delivered specific feedback about presentation and
business rules to further improve how the NJDOE will report it publicly. The state plans to implement their
suggestions by 2018.
Over the last four years, NJDOE has demonstrated their commitment to continuously improving the report and its
utility to stakeholders as demonstrated in the chart below.
Elements 2013 2014 2015 2016 2017 2018
Certification and hiring data
Improved visuals and data: demographics, teacher
shortage, compensation
Enhanced Persistence Reporting *
Evaluation: Overall rating, Student Growth Objective,
Teacher Practice, Student Growth Percentile *
Multi-year hire rates
Praxis CORE * *
Survey of certified program completers *
Certificate of Eligibility program level reports *
Certificate of Eligibility with Advanced Standing
program level reports *
Employer Survey *
NJDOE’s one-year embargo serves as a public commitment to continuous improvement and offers a structure for
their team to know when improvements will be made. As a result, they have been able to make regular
enhancements to their system and keep stakeholders informed along the way.
25
STATE SPOTLIGHT: RHODE ISLAND
Rather than a year-by-year structure as in New Jersey, Rhode Island created a three-phase approach for
continuously improving their data system. Each phase allows the state to gather additional information to refine
their system and move closer to their goals.
Currently, Rhode Island Department of Education (RIDE) uses an onsite program review13 to determine programs’
renewal, and they use a separate teacher preparation data system, the Educator Preparation Index,14 to offer
programs regular access to information on their outcomes. The information in the Index is not currently associated
with any consequences. However, RIDE has a long-term goal of using the information in the Index as part of its
program review process. They believe the Index needs to be improved over time to use it for these accountability
purposes, so they created a long term, three-phase continuous improvement plan to eventually accomplish this
goal.
Phase 1: Launch the Index without consequences
Phase 2: Establish non-consequential performance standards within the Index
Phase 3: Use the providers’ assigned performance standards to inform consequential program
renewal decisions
In Phase I, RIDE co-designed the Index with its providers to ensure the information within it would be actionable.
They started by asking providers what information would be useful and actionable. Once designed, RIDE launched
the Index for informational purposes only with a plan for how it would be used in order to build toward Phases 2
and 3. In Phase I they collect and share information in the Index in order to a) start making it available to providers
for their own improvement efforts; b) gather feedback from providers on the accuracy and utility of the data; and c)
start building a data set year-over-year in which RIDE can run analyses to determine performance distributions
across the state and independently assess data accuracy.
RIDE is currently in Phase I and working on these three key activities. They have conducted multiple outreach
sessions with stakeholders from LEAs and EPPs to solicit feedback on their use of the Index. They have asked HR
directors in LEAs and superintendents to compare the Index to EPP reports from other states and identify what is
helpful about the Index or other comparable options. They have held separate outreach sessions with teacher
candidates and principals to ask how they would like to be able to review information in the Index to best make
use of it and identify any information that would be helpful but is missing.
From this feedback, they have started to make improvements to the Index. For example, they recently changed
how the information in the Index is displayed to make it more informative. Previously, they displayed information
based on the number of relevant completers, but they changed it to a percentage-based display, after realizing this
information would be more useful to understanding the success of a program if the reader could understand
whether the given number represented a significant portion of all completers from a program.
Additionally, RIDE is refining plans to start transitioning into Phase II. They will use the information amassed in the
Index over the last several years to identify differences in performance across providers and programs to show
distributions across the state. They will be able to use these distributions to identify the range of performance in
each metric of the Index, which will allow them to create performance standards to display in the Index that show
13 See http://www.ride.ri.gov/TeachersAdministrators/EducatorCertification/PerformanceReviewforEducatorPreparation-
RI.aspx#32031113-overview-of-prep-ri
14 See http://www3.ride.ri.gov/RIEdPrepIndex/Default.aspx
26
providers where they stand in comparison to other programs and, eventually, to state expectations for
performance. RIDE will continue its outreach and refinement efforts in Phase II to continuously improve the Index
and the performance standards to then build from Phase II to Phase III. They will also use their analyses to assess
the accuracy of the data in the system and identify any outliers that suggest a validity issue.
RIDE’s three-phase continuous improvement strategy creates a structure for how improvements must be made for
the state to maintain progress toward its ultimate goals. Within each phase, they accomplish different goals
specific to the phase but maintain consistent methods for making refinements via stakeholder outreach and
incorporation of improvements. This structure allows them to maintain flexibility in how they progress through the
phases while also tracking toward benchmarks to ensure they are continuously improving the system over time.
Best Practice 6: Identify opportunities and third parties to provide technical assistance to teacher
preparation programs in using the state data to make targeted program improvements
States create teacher preparation data systems so stakeholders use the information to make meaningful
improvements in teaching. Throughout the convenings, the featured states often asked whether the role of the SEA
should include not only making data available but also aiding stakeholders in actually using the data to make
improvements.
The states ultimately determined they are best suited to serve as a hub for other resources that can offer this
form of support, rather than offering it themselves, due to both limited SEA capacity as well as inevitable tension in
trying to play a dual role of assistance provider as well as accountability entity. The featured states continue to
generate new ideas for how the SEA can fulfill this role, such as:
Connect providers struggling on a particular issue with other programs in the state that have mastered
that issue or otherwise feature leaders who are strong in making data-driven program improvements.
Identify and maintain a list of third party vendors that offer specialized support to programs. Further,
the state can fund, when resources are available, professional development opportunities for its
stakeholders. Rhode Island has considered planning sessions led by a third party for districts and
providers so the events can double as opportunities to strengthen their partnerships as well.
Mandate particular changes be made by programs based on what the information is showing as a way
to highlight interpretations of the data.
Provide structures for how preparers should plan to improve any deficiencies revealed in their data.
Delaware and Rhode Island have both recently implemented two different ideas for how their SEA can
support providers in improving their programs without receiving direct technical assistance from the state.
STATE SPOTLIGHT: RHODE ISLAND
Shortly after the convenings ended, RIDE completed an onsite program review of its largest teacher preparation
provider, Rhode Island College (RIC). The review identified several RIC programs that were struggling to prepare
teachers for success in the classroom. Seven programs were conditionally approved with specific requirements for
how they were to improve in subsequent years.
However, RIDE was concerned the programs would not improve as they needed to without some additional
structure. They considered how K-12 schools respond to state-level accountability and were concerned that state-
level accountability without a space for improvement would seem hypercritical and fail to create the space needed
for improvement. RIDE wanted to push themselves to be creative in helping the RIC programs help themselves
without simply offering accountability and no support.
27
The state thought of a new concept for helping its largest provider improve: a change mentor. The change mentor
is responsible for overseeing the overhaul of all the teacher preparation programs in need of development. The
SEA worked with the president of RIC directly to identify a mentor, as this would ensure RIC felt comfortable
partnering with the mentor in a productive relationship and the state also felt confident the mentor would be able
to drive the changes needed. Based on this collaborative approach, the president of RIC was publicly favorable to
the report and the recommendations of the change mentor. They are now in the process of working with the RIDE
Commissioner to select one for their partnership.
RIDE also recently launched a second idea for how it can better support EPPs to improve: a mini-grant competition
in which they offer $15,000 to providers to better integrate technology into their instruction. They hope the grants
will spur innovative ideas of how technologies can improve preparation programs, which the grantees can then
share with other providers in the state. Additionally, they believe that by offering a grant that allows faculty
themselves to test the new theories, there will be greater investment across the state in any of the new ideas
generated than if they were to come from the SEA or other external entities.
STATE SPOTLIGHT: DELAWARE
Delaware similarly wanted to offer programs more than simply their ratings, but they did not believe the SEA
should provide direct technical assistance to programs for all the reasons discussed above. As a result, they created
action plan templates, available on their website, for all of their programs that are renewed with conditions or
placed on probation. Each such program is required to complete and submit the action plan to the SEA. It offers
programs a set of concrete steps for how they will act on the targeted information provided in their report card,
but flexibility for the programs to determine how they will execute each step. Plans must be submitted within 90
days, and the Department will provide feedback on the plans as needed to offer programs additional guidance.
The plan offers a structure from the state for approaching improvement, but leaves it to the program to define
how they will interpret their data and act on it.
Conclusion
The featured states are among some of the first in the country to pursue the work of building and using
outcomes-based teacher preparation data systems. As leaders, they embarked on their work without an abundance of
examples to follow or guidance from established research or peer programs, but with a conviction in the need for this
work to better support teachers and students. State chiefs recognized the need for greater support and partnership
with EPPs in their 2012 report, and the work to date of these pioneering states shows the benefits of responding to
that call to action.
Their leadership has helped prove the importance of these systems and identify numerous benefits that can
be achieved with the information featured within them. Additionally, their innovation and willingness to collaborate
with each other helped illuminate the common best practices that can be guideposts to additional states who follow
in pursuing this work.
While the lessons from the featured states provide must-do action items and considerations for other states
in building such systems, the states’ various systems and processes also make clear that states have thought and
acted differently about their systems—even while adhering to the same procedural guidelines. This, in itself, is of
great benefit to the field: it should empower other states to use these guideposts to make their own decisions about
what will work well in meeting their particular goals for preparing teachers to best serve their students.
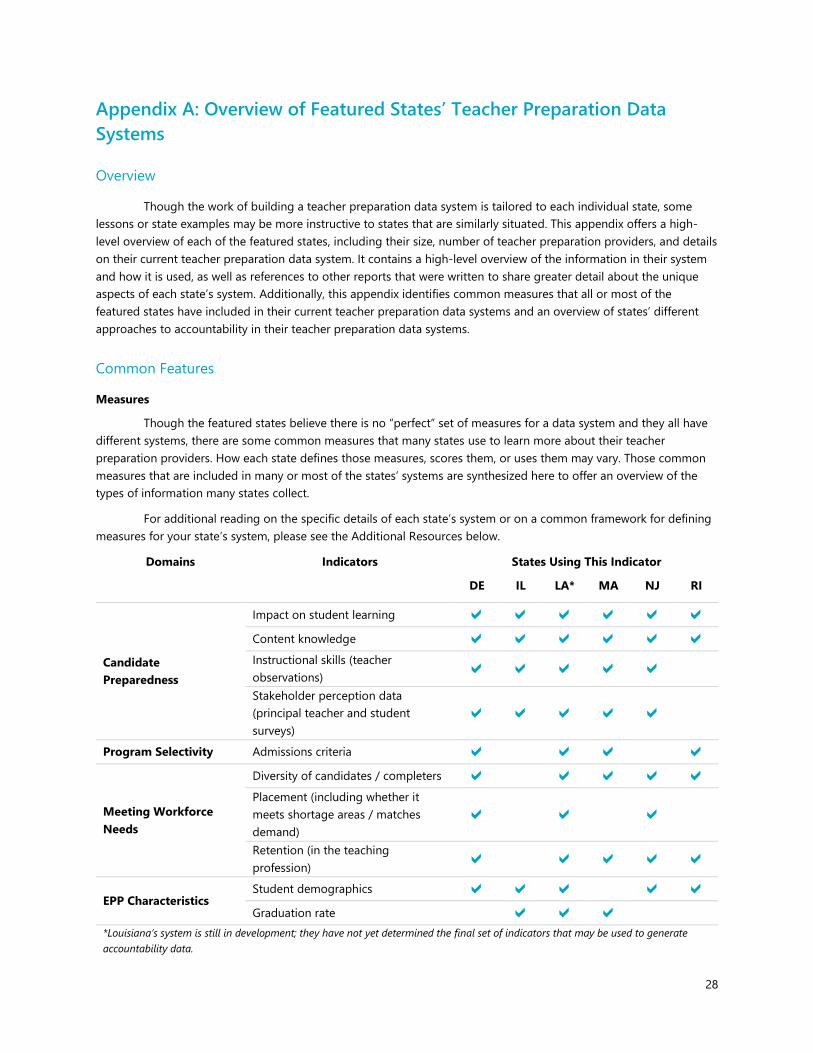
28
Appendix A: Overview of Featured States’ Teacher Preparation Data
Systems
Overview
Though the work of building a teacher preparation data system is tailored to each individual state, some
lessons or state examples may be more instructive to states that are similarly situated. This appendix offers a high-
level overview of each of the featured states, including their size, number of teacher preparation providers, and details
on their current teacher preparation data system. It contains a high-level overview of the information in their system
and how it is used, as well as references to other reports that were written to share greater detail about the unique
aspects of each state’s system. Additionally, this appendix identifies common measures that all or most of the
featured states have included in their current teacher preparation data systems and an overview of states’ different
approaches to accountability in their teacher preparation data systems.
Common Features
Measures
Though the featured states believe there is no “perfect” set of measures for a data system and they all have
different systems, there are some common measures that many states use to learn more about their teacher
preparation providers. How each state defines those measures, scores them, or uses them may vary. Those common
measures that are included in many or most of the states’ systems are synthesized here to offer an overview of the
types of information many states collect.
For additional reading on the specific details of each state’s system or on a common framework for defining
measures for your state’s system, please see the Additional Resources below.
Domains Indicators States Using This Indicator
DE IL LA* MA NJ RI
Candidate
Preparedness
Impact on student learning
Content knowledge
Instructional skills (teacher
observations)
Stakeholder perception data
(principal teacher and student
surveys)
Program Selectivity Admissions criteria
Meeting Workforce
Needs
Diversity of candidates / completers
Placement (including whether it
meets shortage areas / matches
demand)
Retention (in the teaching
profession)
EPP Characteristics Student demographics
Graduation rate
*Louisiana’s system is still in development; they have not yet determined the final set of indicators that may be used to generate
accountability data.
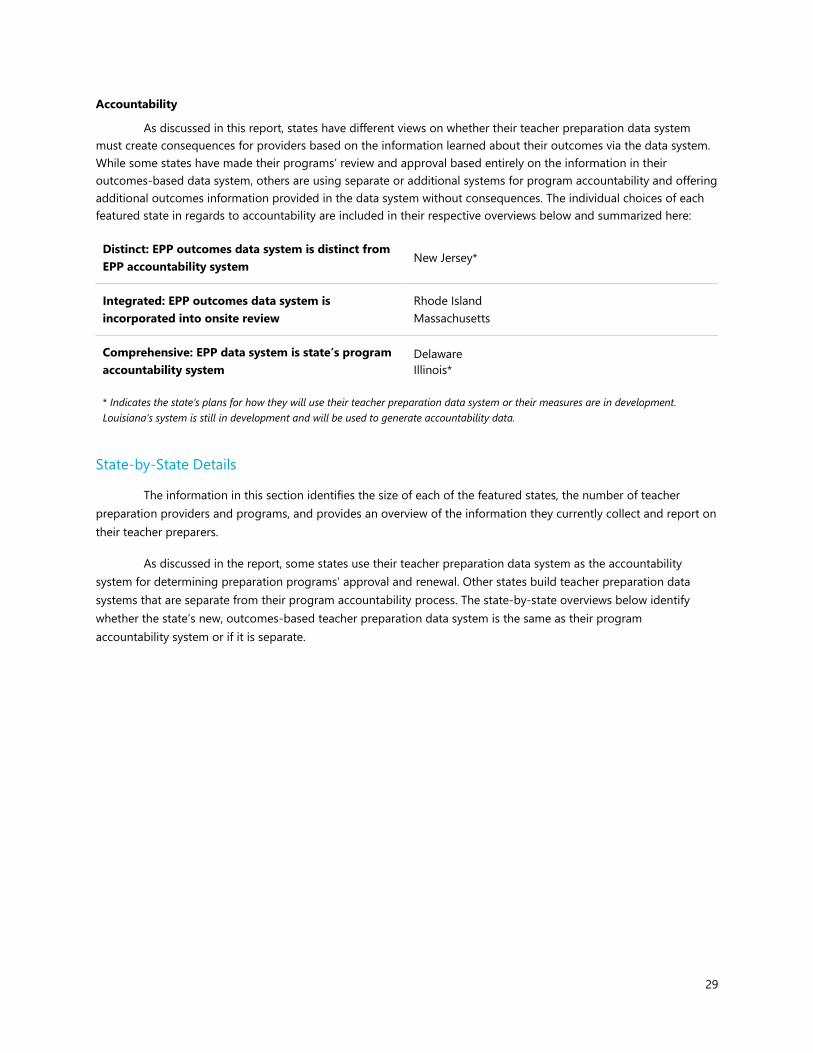
29
Accountability
As discussed in this report, states have different views on whether their teacher preparation data system
must create consequences for providers based on the information learned about their outcomes via the data system.
While some states have made their programs’ review and approval based entirely on the information in their
outcomes-based data system, others are using separate or additional systems for program accountability and offering
additional outcomes information provided in the data system without consequences. The individual choices of each
featured state in regards to accountability are included in their respective overviews below and summarized here:
Distinct: EPP outcomes data system is distinct from
EPP accountability system New Jersey*
Integrated: EPP outcomes data system is
incorporated into onsite review
Rhode Island
Massachusetts
Comprehensive: EPP data system is state’s program
accountability system
Delaware
Illinois*
* Indicates the state’s plans for how they will use their teacher preparation data system or their measures are in development.
Louisiana’s system is still in development and will be used to generate accountability data.
State-by-State Details
The information in this section identifies the size of each of the featured states, the number of teacher
preparation providers and programs, and provides an overview of the information they currently collect and report on
their teacher preparers.
As discussed in the report, some states use their teacher preparation data system as the accountability
system for determining preparation programs’ approval and renewal. Other states build teacher preparation data
systems that are separate from their program accountability process. The state-by-state overviews below identify
whether the state’s new, outcomes-based teacher preparation data system is the same as their program
accountability system or if it is separate.
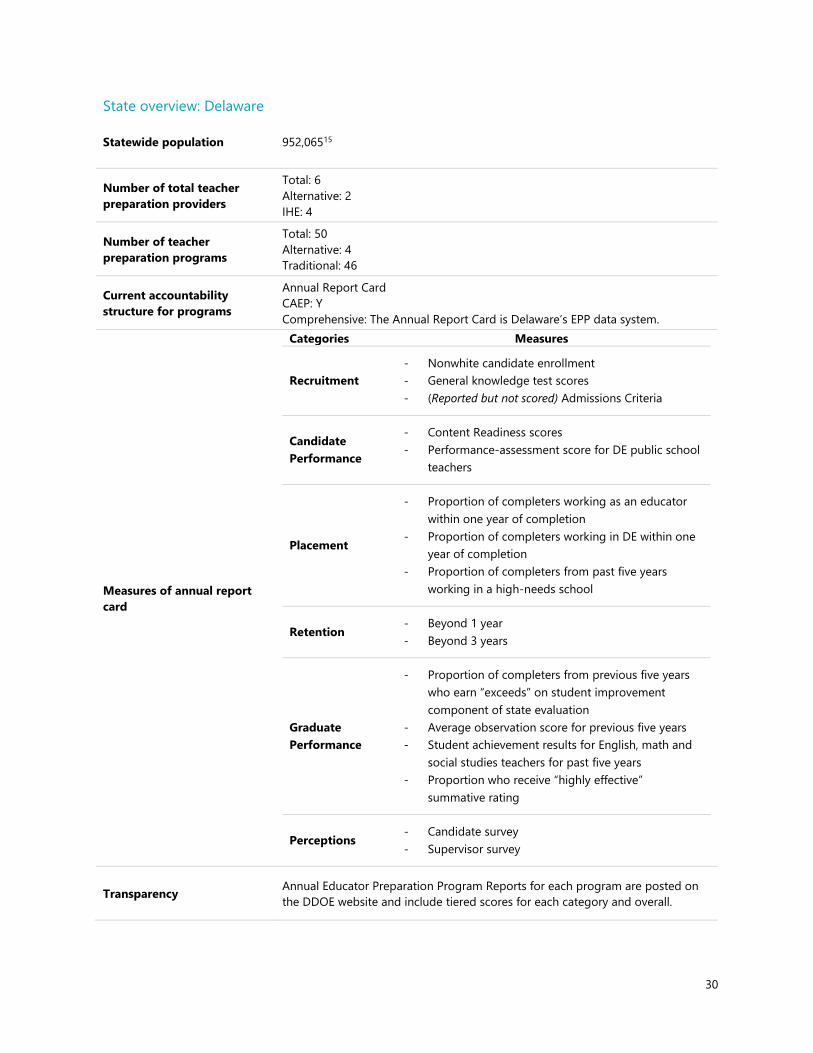
30
State overview: Delaware
Statewide population 952,06515
Number of total teacher
preparation providers
Total: 6
Alternative: 2
IHE: 4
Number of teacher
preparation programs
Total: 50
Alternative: 4
Traditional: 46
Current accountability
structure for programs
Annual Report Card
CAEP: Y
Comprehensive: The Annual Report Card is Delaware’s EPP data system.
Measures of annual report
card
Categories Measures
Recruitment
- Nonwhite candidate enrollment
- General knowledge test scores
- (Reported but not scored) Admissions Criteria
Candidate
Performance
- Content Readiness scores
- Performance-assessment score for DE public school
teachers
Placement
- Proportion of completers working as an educator
within one year of completion
- Proportion of completers working in DE within one
year of completion
- Proportion of completers from past five years
working in a high-needs school
Retention - Beyond 1 year
- Beyond 3 years
Graduate
Performance
- Proportion of completers from previous five years
who earn “exceeds” on student improvement
component of state evaluation
- Average observation score for previous five years
- Student achievement results for English, math and
social studies teachers for past five years
- Proportion who receive “highly effective”
summative rating
Perceptions - Candidate survey
- Supervisor survey
Transparency Annual Educator Preparation Program Reports for each program are posted on
the DDOE website and include tiered scores for each category and overall.
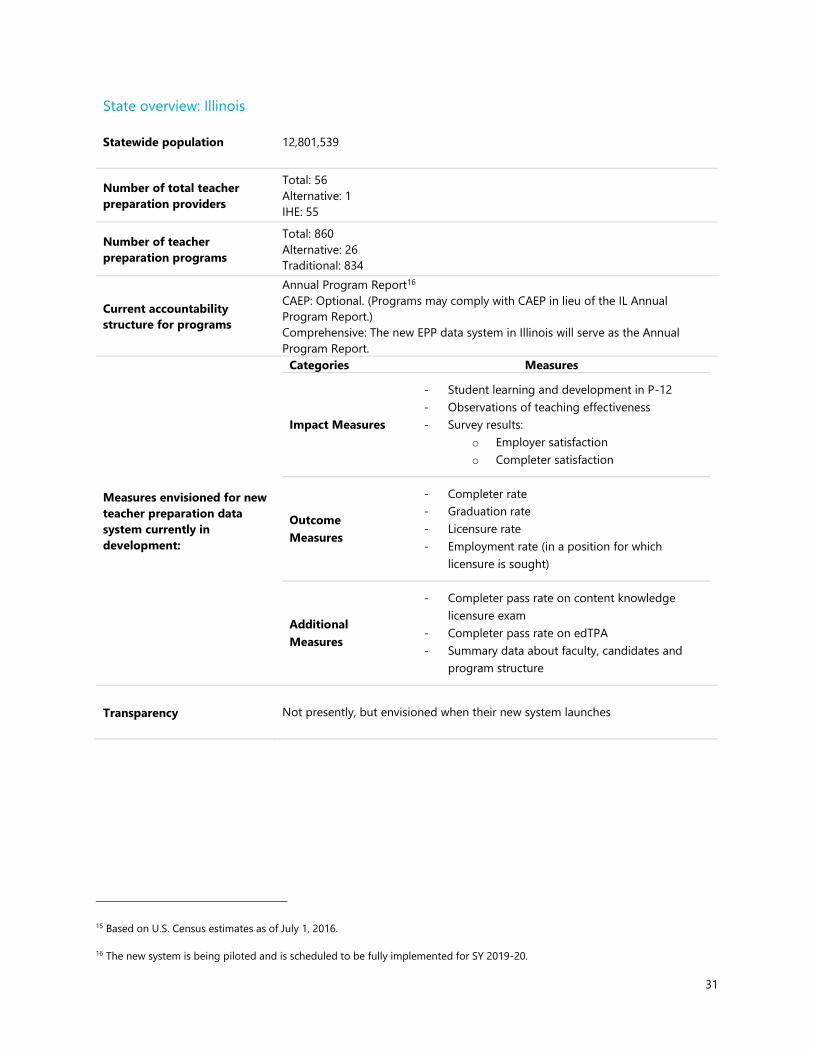
31
State overview: Illinois
Statewide population 12,801,539
Number of total teacher
preparation providers
Total: 56
Alternative: 1
IHE: 55
Number of teacher
preparation programs
Total: 860
Alternative: 26
Traditional: 834
Current accountability
structure for programs
Annual Program Report16
CAEP: Optional. (Programs may comply with CAEP in lieu of the IL Annual
Program Report.)
Comprehensive: The new EPP data system in Illinois will serve as the Annual
Program Report.
Measures envisioned for new
teacher preparation data
system currently in
development:
Categories Measures
Impact Measures
- Student learning and development in P-12
- Observations of teaching effectiveness
- Survey results:
o Employer satisfaction
o Completer satisfaction
Outcome
Measures
- Completer rate
- Graduation rate
- Licensure rate
- Employment rate (in a position for which
licensure is sought)
Additional
Measures
- Completer pass rate on content knowledge
licensure exam
- Completer pass rate on edTPA
- Summary data about faculty, candidates and
program structure
Transparency Not presently, but envisioned when their new system launches
15 Based on U.S. Census estimates as of July 1, 2016.
16 The new system is being piloted and is scheduled to be fully implemented for SY 2019-20.
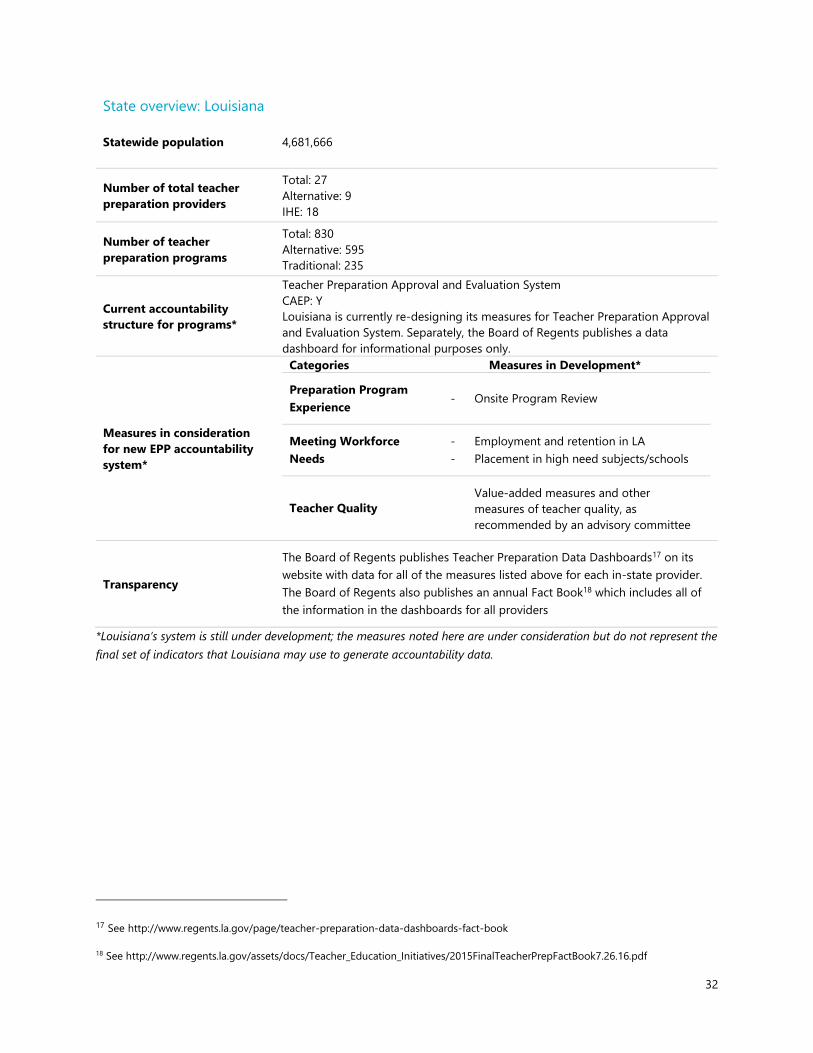
32
State overview: Louisiana
Statewide population 4,681,666
Number of total teacher
preparation providers
Total: 27
Alternative: 9
IHE: 18
Number of teacher
preparation programs
Total: 830
Alternative: 595
Traditional: 235
Current accountability
structure for programs*
Teacher Preparation Approval and Evaluation System
CAEP: Y
Louisiana is currently re-designing its measures for Teacher Preparation Approval
and Evaluation System. Separately, the Board of Regents publishes a data
dashboard for informational purposes only.
Measures in consideration
for new EPP accountability
system*
Categories Measures in Development*
Preparation Program
Experience - Onsite Program Review
Meeting Workforce
Needs
- Employment and retention in LA
- Placement in high need subjects/schools
Teacher Quality
Value-added measures and other
measures of teacher quality, as
recommended by an advisory committee
Transparency
The Board of Regents publishes Teacher Preparation Data Dashboards17 on its
website with data for all of the measures listed above for each in-state provider.
The Board of Regents also publishes an annual Fact Book18 which includes all of
the information in the dashboards for all providers
*Louisiana’s system is still under development; the measures noted here are under consideration but do not represent the
final set of indicators that Louisiana may use to generate accountability data.
17 See http://www.regents.la.gov/page/teacher-preparation-data-dashboards-fact-book
18 See http://www.regents.la.gov/assets/docs/Teacher_Education_Initiatives/2015FinalTeacherPrepFactBook7.26.16.pdf
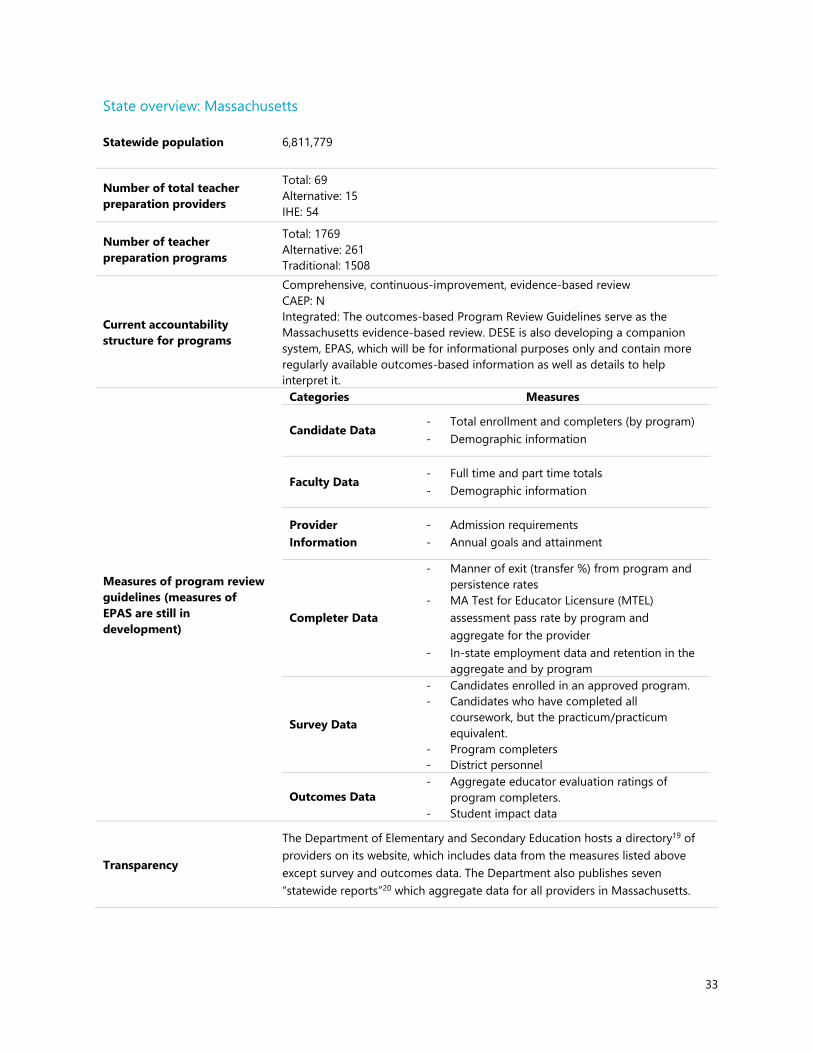
33
State overview: Massachusetts
Statewide population 6,811,779
Number of total teacher
preparation providers
Total: 69
Alternative: 15
IHE: 54
Number of teacher
preparation programs
Total: 1769
Alternative: 261
Traditional: 1508
Current accountability
structure for programs
Comprehensive, continuous-improvement, evidence-based review
CAEP: N
Integrated: The outcomes-based Program Review Guidelines serve as the
Massachusetts evidence-based review. DESE is also developing a companion
system, EPAS, which will be for informational purposes only and contain more
regularly available outcomes-based information as well as details to help
interpret it.
Measures of program review
guidelines (measures of
EPAS are still in
development)
Categories Measures
Candidate Data - Total enrollment and completers (by program)
- Demographic information
Faculty Data - Full time and part time totals
- Demographic information
Provider
Information
- Admission requirements
- Annual goals and attainment
Completer Data
- Manner of exit (transfer %) from program and
persistence rates
- MA Test for Educator Licensure (MTEL)
assessment pass rate by program and
aggregate for the provider
- In-state employment data and retention in the
aggregate and by program
Survey Data
- Candidates enrolled in an approved program.
- Candidates who have completed all
coursework, but the practicum/practicum
equivalent.
- Program completers
- District personnel
Outcomes Data
- Aggregate educator evaluation ratings of
program completers.
- Student impact data
Transparency
The Department of Elementary and Secondary Education hosts a directory19 of
providers on its website, which includes data from the measures listed above
except survey and outcomes data. The Department also publishes seven
“statewide reports”20 which aggregate data for all providers in Massachusetts.
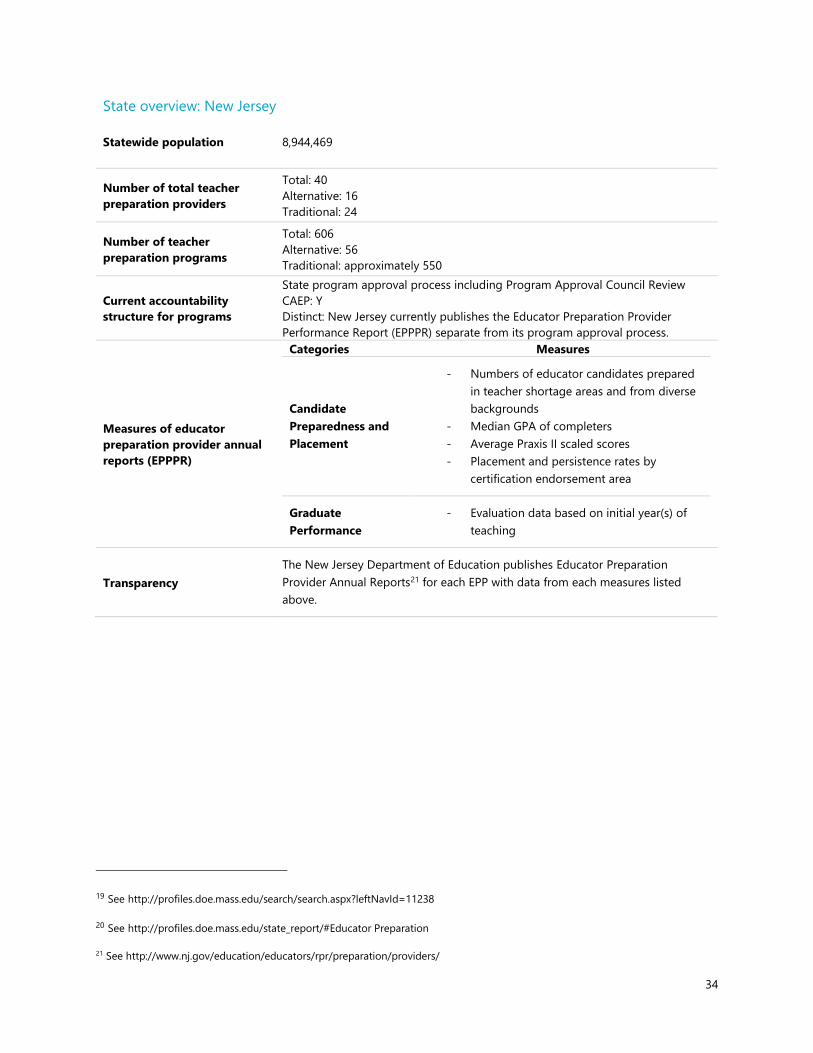
34
State overview: New Jersey
Statewide population 8,944,469
Number of total teacher
preparation providers
Total: 40
Alternative: 16
Traditional: 24
Number of teacher
preparation programs
Total: 606
Alternative: 56
Traditional: approximately 550
Current accountability
structure for programs
State program approval process including Program Approval Council Review
CAEP: Y
Distinct: New Jersey currently publishes the Educator Preparation Provider
Performance Report (EPPPR) separate from its program approval process.
Measures of educator
preparation provider annual
reports (EPPPR)
Categories Measures
Candidate
Preparedness and
Placement
- Numbers of educator candidates prepared
in teacher shortage areas and from diverse
backgrounds
- Median GPA of completers
- Average Praxis II scaled scores
- Placement and persistence rates by
certification endorsement area
Graduate
Performance
- Evaluation data based on initial year(s) of
teaching
Transparency
The New Jersey Department of Education publishes Educator Preparation
Provider Annual Reports21 for each EPP with data from each measures listed
above.
19 See http://profiles.doe.mass.edu/search/search.aspx?leftNavId=11238
20 See http://profiles.doe.mass.edu/state_report/#Educator Preparation
21 See http://www.nj.gov/education/educators/rpr/preparation/providers/
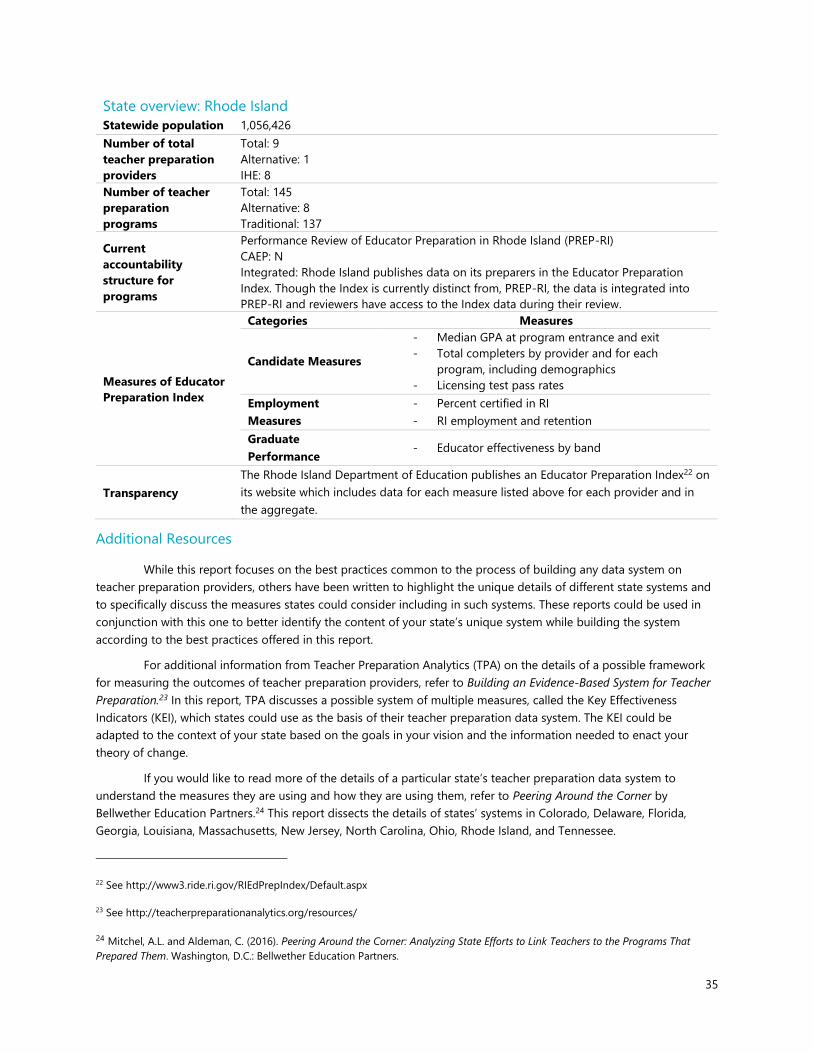
35
State overview: Rhode Island
Statewide population 1,056,426
Number of total
teacher preparation
providers
Total: 9
Alternative: 1
IHE: 8
Number of teacher
preparation
programs
Total: 145
Alternative: 8
Traditional: 137
Current
accountability
structure for
programs
Performance Review of Educator Preparation in Rhode Island (PREP-RI)
CAEP: N
Integrated: Rhode Island publishes data on its preparers in the Educator Preparation
Index. Though the Index is currently distinct from, PREP-RI, the data is integrated into
PREP-RI and reviewers have access to the Index data during their review.
Measures of Educator
Preparation Index
Categories Measures
Candidate Measures
- Median GPA at program entrance and exit
- Total completers by provider and for each
program, including demographics
- Licensing test pass rates
Employment
Measures
- Percent certified in RI
- RI employment and retention
Graduate
Performance - Educator effectiveness by band
Transparency
The Rhode Island Department of Education publishes an Educator Preparation Index22 on
its website which includes data for each measure listed above for each provider and in
the aggregate.
Additional Resources
While this report focuses on the best practices common to the process of building any data system on
teacher preparation providers, others have been written to highlight the unique details of different state systems and
to specifically discuss the measures states could consider including in such systems. These reports could be used in
conjunction with this one to better identify the content of your state’s unique system while building the system
according to the best practices offered in this report.
For additional information from Teacher Preparation Analytics (TPA) on the details of a possible framework
for measuring the outcomes of teacher preparation providers, refer to Building an Evidence-Based System for Teacher
Preparation.23 In this report, TPA discusses a possible system of multiple measures, called the Key Effectiveness
Indicators (KEI), which states could use as the basis of their teacher preparation data system. The KEI could be
adapted to the context of your state based on the goals in your vision and the information needed to enact your
theory of change.
If you would like to read more of the details of a particular state’s teacher preparation data system to
understand the measures they are using and how they are using them, refer to Peering Around the Corner by
Bellwether Education Partners.24 This report dissects the details of states’ systems in Colorado, Delaware, Florida,
Georgia, Louisiana, Massachusetts, New Jersey, North Carolina, Ohio, Rhode Island, and Tennessee.
22 See http://www3.ride.ri.gov/RIEdPrepIndex/Default.aspx
23 See http://teacherpreparationanalytics.org/resources/
24 Mitchel, A.L. and Aldeman, C. (2016). Peering Around the Corner: Analyzing State Efforts to Link Teachers to the Programs That
Prepared Them. Washington, D.C.: Bellwether Education Partners.
36
Appendix B: The Role of the SEA in Achieving the Benefits of a Teacher
Preparation Data System
The SEA strives to create the conditions necessary for teacher preparation programs to thrive, and creating
data systems that offer all of the information necessary for improvement is a key way to do that. As a state-wide
entity, the SEA is well suited to collect and report the variety of information that composes teacher preparation data
systems as well as to make the necessary decisions at the start of building one to determine the goals for the system
based on state needs. By providing needed information, using it to set tailored goals, and tracking progress toward
those goals, the SEA is able to give providers clarity on their expectations and resources to support them in meeting
those expectations without prescribing how the providers choose to meet those expectations.
Over the course of their work together, the states came to a common understanding of their role in
improving teacher preparation state-wide. The SEA should:
Make data available, including sharing distributions of performance across programs; and
Meaningfully define the bar for program effectiveness and set clear standards for renewal; and
Build a data system to enable the state to make decisions based on how programs meet those standards;
and
Identify, make available, and convene resources for technical assistance, but not necessarily serve as the
entity to offer it.
Make data available, including sharing distributions of performance across programs
A variety of stakeholders benefit from enhanced data on teacher preparation and also contribute to it by
providing data from teacher preparation programs, candidates, and LEAs. The state is appropriately situated to collect
data from a variety of sources and make it available comprehensively to stakeholders. With that information collected,
the state is the over-arching entity that can compare all programs to one another in order to identify the distribution
of performance across the state.
Meaningfully define the bar for program effectiveness and set clear standards for renewal
Based on the distribution of performance across programs, the state can set expectations or standards for
how programs should contribute to the needs of the state and identify what changes in performance can reasonably
be expected. Regardless of whether the state has chosen to use its teacher preparation data system for accountability
or maintain program renewal decisions in a different system, it can also use these performance expectations to
determine the threshold required for a program to continue to operate and at what point a program requires
intervention in order to maintain its status. Through setting standards that meet the needs of the state, the SEA can
give preparers a clear target for how they prepare candidates and contribute to the teaching workforce without
prescribing the details of how preparers meet those expectations.
The SEA may also use additional information available to the state outside of the teacher preparation data
system to influence decisions about performance expectations. For example, the SEA may have separate workforce
analyses that identify a teacher shortage across the state or in particular subject areas. The SEA may decide to set
expectations for preparers that they recruit candidates into shortage certification areas and reduce the size or
selectivity of programs that produce a surplus of teachers.
37
Build a data system to enable the state to make decisions based on how programs meet those
standards
With the information it is able to collect from sources across the state and based on the expectations the
SEA wants providers to meet, the SEA should build the teacher preparation data system tailored to these objectives.
With the performance expectations it has set based on understanding the distribution of programs within the state
and its goals for teacher preparation, it can make informed decisions about how to hold programs to the
expectations, either through risk of program closure or sanctions, incentives for certain actions, or targeted assistance.
Identify, make available, and convene resources for technical assistance, but do not necessarily
serve as the entity to offer it
Whether in its teacher preparation data system or through another system, the SEA is responsible for
approving, reviewing, and closing programs. As the entity holding providers accountable, it is difficult for providers to
partner with the SEA in refining their programs based on the same data the SEA is using to consider sanctioning or
closing programs. Providers often feel they cannot be candid about their questions and difficulties with the entity that
could close them based on these issues. Additionally, many SEAs face limited capacity in terms of staff available to
offer regular support to programs due to competing priorities with the data system itself and program accountability
responsibilities. States believe the SEA should view its role as making available or identifying alternative resources for
providers who can benefit from assistance in interpreting and acting on new information about their programs rather
than offer it directly as direct service may not be as effective.
This description of the role of the SEA defines the boundaries of its work and can help guide SEAs in
knowing what to take on and where to look for additional resources. This structure intentionally allows for and
encourages the SEA to take wide latitude in fulfilling each aspect of its role based on its state’s unique context. The
SEA should collect the data that is needed in its state, set performance expectations and make program decisions
based on the goals of the state, and offer interventions where they are most necessary to achieve the state’s highest
needs.
38
Appendix C: Glossary of Terms
The following terms are used frequently throughout this report. This glossary provides a definition of how
each of the following terms are defined within the context of this report.
Teacher Preparation Data System: A system collecting data from a variety of stakeholders, as needed, to report on
the performance of teacher preparation programs based on their outcomes. The system is meant to assess how
effectively preparation providers prepare teachers to be successful in the classroom by reviewing metrics of provider
performance such as the student learning scores of students taught by a program’s completers, teacher evaluation or
observation ratings assigned by the school district where program completers teach, and the job placement and
retention of a program’s completers.
Domain: These are broad categories of information about providers and their completers that may be assessed
through a variety of metrics. Within any domain there may be multiple options for how to measure success within
that category. Common domains include candidate performance, meeting state and district needs, or candidate
selection profile. Domains may also be referred to as “buckets,” or “categories” of data.
Indicator: These identify the characteristics of a program that would signal success within a certain Domain. For
example, within the Domain of candidate performance, impact on student learning or demonstration of teaching skill
could be indicators of effective candidate performance.
Measure: These are the specific sets of information tracked and evaluated within a certain domain and indicator to
define success within that category. For example, within the Domain of completer performance and the Indicator of
impact on student learning, one measure of completer performance may be the Value-Added (VAM) score of
students taught by a completer. Another measure under completer performance (Domain) may be teacher
observation ratings from their teacher evaluation system which would indicate teaching skill (Indicator). Measures
may also be referred to as “metrics.”
Instrument: This is a particular tool that is used to test, capture, or collect data on a specific measure. For example,
the PARCC is a standardized exam that assesses students’ skills and content knowledge. It is an instrument that may
be used to measure students growth year over year based on the results.
Data Definition: This explains how a metric is measured and the rules for interpreting the data of a given metric. A
data definition will likely include, among other items, the rules regarding the n size (the requisite number of
candidates on whom data must be available for the metric to be valid), the number of years of data that must be
accounted for in a metric, and whether the metric will be evaluated for all completers at an institution or based on
their individual programs or classes. In the example of teacher performance (Domain) and student learning (Indicator),
the data definition for a student learning measure would also include the standardized test (Instrument) to be used
for measuring growth and the ranges of VAM scores that reflect high to low candidate performance.
39
Appendix D: Stakeholder Engagement Checklist
As discussed in the report, authentic stakeholder engagement is critical to ensuring the state designs a teacher
preparation data system that will be beneficial to stakeholders and have sufficient investment from them to ensure
they use the information within it. Each of the featured states engaged with stakeholders throughout the design and
use of their data system. From that work, they have identified several best practices that were instrumental in defining
the success of their engagement efforts.
This checklist offers a comprehensive set of activities the featured states believe are critical to successful
engagement with stakeholders in building and utilizing teacher preparation data systems.
Design a clear message that explains the purpose of the system and makes clear its intent to support
stakeholders. Stakeholders will struggle to feel invested in anything they do not understand. Additionally, if they are
unclear on the intended purpose of a change, it is likely to feel perfunctory or taxing to adapt to without any benefit
in return. Spend time before launching stakeholder engagement plans to make sure you have an easily understood
message that explains what is happening, why it is happening, and how it benefits the stakeholders whose time and
interest you require.
Establish trust. States that found their stakeholder engagement to be most successful attributed it to trust between
the stakeholders and the SEA. Trust is built over time through a series of actions on the part of the SEA including
coherent planning that offers transparency about the state’s plans and stakeholders’ level of influence, previews when
there may be changes in the plans or revisions to the system, and responsiveness to stakeholder input. When
responding to input from stakeholders, make a point to be explicit about it by reminding stakeholders about their
input and articulating how the state has acted on it.
Know in advance and share up front with stakeholders any boundaries on what they are able to influence. In
many cases, some of a state’s decisions on its data system are pre-determined or heavily influenced by policy, political
considerations, or “bets” the SEA is committed to placing in terms of what they want to measure and influence. For
example, Delaware knows its data system is for accountability purposes because this is dictated by policy, and
Louisiana knows it will use its system for accountability because it believes in its evidence from the field that this is the
only way to ensure change. These are decisions that stakeholders would not be able to change. As such, the SEA
should engage with stakeholders with clarity on what those limits are and be prepared to give stakeholders options to
choose from and/or tell them up front where their input will influence the outcome and where it will not. This will
avoid frustration on the part of stakeholders and also help build trust as they will understand from the start what their
role is.
Share a timeline that offers a clear path forward with checkpoints for when and how stakeholders will
influence the process. Sharing a clear timeline for upcoming changes will help offer some peace of mind to the
stakeholders who will be experiencing the change to help them orient themselves to it and feel confident that the
transition will be well-planned and organized. It also helps to establish trust by showing stakeholders they are privy to
the state’s overall plans. Additionally, if the timeline shows when stakeholders will be involved and how subsequent
steps in the timeline are impacted by the stakeholders’ involvement, they will better be able to trust that their input is
a true factor in shaping the change.
Be transparent about the plans for the system and the iterative nature of building it. The SEA should share its
own commitment to continuous improvement at the start, both to model this behavior and to communicate to
stakeholders that their input is a driving factor in how the system will be shaped and evolve. Additionally,
stakeholders should understand the timeline for the process, when certain aspects will go into effect, and when they
might change so they can make their own plans for how to use the system.
Consider creating standing working groups to provide regular feedback throughout the development and
launch process. Assembled groups of a consistent membership can be a reliable resource over time as they will have

40
the context of the system and its goals from the beginning and provide feedback within this context. They will be able
to understand the iterative nature of the work because they will be a part of the process and witness first-hand the
variety of considerations and models the SEA considers. Additionally, they will likely gain investment in the system
over time as a result of their personal investment of time and witnessing how their feedback helps the system to
evolve, which will make them better users and advocates of the system.
Be sure to particularly gather stakeholder input on specific metrics of the system. States in the working group
found stakeholder input on these details particularly valuable, including when they were developing the system and
after sharing initial reports and then refining indicators or ratings.
Ensure all relevant and influential voices are involved in your engagement efforts. In a small state with only a
few providers, give special attention to each one in the engagement process to ensure they are all equally invested. In
larger states with numerous providers where individualized attention is less feasible, focus some targeted special
efforts on several key, large providers that are influential among their peers and those that serve unique and/or high
need regions of the state in order to invest them in the system and in helping to spread buy-in across the state. At
the same time, ensure you have voices to represent each size and region of provider across your state so you hear
from the full variety of perspectives.
Have and proactively share with stakeholders your rationale for decisions affecting them and the data system.
Part of being transparent with stakeholders requires sharing with them not only what is happening but also why.
Sharing the state’s rationale for certain decisions or actions will show the stakeholders they are partners rather than
just an audience. If they disagree with a certain decision or course of direction, they will be able to at least respect
that it is not arbitrary or ill-informed if they are able to understand the reasoning behind it.
41
Appendix E: Data Collection Checklist
The featured states did not focus a particular portion of their discussion during the convenings on the
technical aspects of how they each set up the data infrastructure in their state to enable them to collect the
information in their systems. However, throughout discussions in which they addressed shared challenges or
workshopped solutions to particular questions, some elements of the data collection process emerged.
This document provides a high-level overview of some of the key considerations for collecting data that a
state will have to keep in mind when building a new data system. However, this is not a comprehensive list or guide to
every step a state will need to take when building a data system that includes outcomes information on teacher
preparation providers. This should be used as a checklist of questions to make sure a state has considered in mapping
out its plan for building a data system and collecting and reporting the information within it.
Determine your purpose for the data. Based on the intended use, identify what information is required.
Based on your state’s vision and theory of action, what do you need to know? What are you hoping your
data will tell you and other stakeholders?
What information do you need to have in order for the data to tell you what you want to know?
How do you intend to use the data?
Who do you intend to use the data?
Do your state’s privacy laws or other policies impact what data you will be able to collect and share?
Conduct a needs assessment to determine what information you already have and what information you need
to collect.
What data do you already collect at the state level?
Where is that information currently stored?
What information is not currently collected?
Where will you get the new information not already being collected?
Create a plan for collection of the data you need.
How will you get the information you do not already collect?
Will you need to ask non-state agencies (such as preparers or LEAs) to provide certain information?
How will you support non-state agencies in sharing the information needed? How will they know what
to provide, and who will ensure they share the right information?
How will you combine the data stored in various locations and coming in from new sources?
Where will you house all of the information so that it can be comprehensively reported?
How will you link information from various sources to each teacher and their preparation program?
Share the data with those who need access to it in order to achieve your goals for how the data should be
used.
How will you display the data? What infrastructure is required to display it?
Will it be publicly available to anyone, or only to certain stakeholders?
If access to the information will be restricted, how will you restrict it?
How often will the information be updated?
42
Appendix F: Vision and Theory of Action Worksheet
This worksheet could be used by states to create a vision and theory of action for a new teacher preparation data
system.
Critical Question: What is your vision for educator preparation in your state and your theory of action for how data
and data systems should be used to achieve your vision?
Instructions: Complete the framework below to articulate your vision and theory of action for educator preparation
as well as the intended uses for preparation data within your state.
Start by writing your vision for educator preparation. Your state’s vision is an aspirational statement of what you hope
educator preparation programs can be and accomplish. Your theory of action should identify how your SEA will fulfill
its role in realizing the vision of educator preparation. It is a guiding statement for how change will happen.
Building off your vision and theory of action, this framework then prompts you to dive deeper into how to
operationalize your theory of action by using data to achieve your vision. You will identify the behaviors needed
among various stakeholders to achieve your vision and how you intend to use specific data to communicate and
incent those behaviors. Those details and the intended uses for data will be used as the foundation for discussion in
Convening Two about the right measures for each use.
Step 1: Vision
In the spaces below each prompt, articulate your state’s vision for educator preparation and the various roles
responsible for achieving that vision.
Consider these questions to articulate your state’s vision:
In regards to teacher preparation, what do we value?
What does effectiveness look like at both the candidate and provider levels?
How do we define a successful teaching workforce and pipeline?
What are the characteristics of a system that supports what we value in teacher preparation?
What is your state’s vision for educator preparation?
What are the roles of the SEA, LEA, and educator preparation providers in fulfilling the state’s
vision?

43
Step 2: Theory of Action
Your theory of action explains how data will be used to realize the state’s vision for educator preparation. Write your
state’s theory of action in the space below the prompt.
Your theory of action will guide who your state incents with data, how you communicate your aspirations, and what
changes or behaviors you hope to influence.
Example: Publishing transparent performance data to all providers, candidates, and districts will create incentives and
actionable information for providers to continuously improve instruction on the common aspects of teaching that first
year teachers are not fully equipped to handle before they get into the classroom.
What is your theory of action for achieving your state’s vision for educator preparation?
Step 3: Intended Uses
Building off your theory of action, identify all of the stakeholders involved in achieving the change envisioned within
your state and how you will use data to incentivize desired behaviors among them. Answer each of the questions
below from your perspective as the SEA. Identify all possible stakeholders, intended actions, and methods that your
state is currently using or would like to use in furtherance of your vision for educator preparation. Do not limit your
answers to the examples provided and exclude any responses that your state is not interested in pursuing. Use your
vision to consider all of the changes or actions needed within the state, and use your theory of action to consider how
those changes should be communicated and incentivized to accomplish them.
Who are the stakeholders you want to influence with data to achieve the vision of educator
preparation in your states? Who is the target audience for what you want to communicate about
our values?
Examples: Institutes of Higher Education, Alternative Certification Providers, Local Education Agencies (LEAs), Teacher
Candidates, Policymakers

44
What do you want to encourage stakeholders to do with data collected by the state? What are
the intended uses of the data?
Examples: Providers refine programming to fill gaps in teachers’ preparedness; teacher candidates select preparation
programs based on data; LEAs partner with preparers who meet specific needs in their pipeline; policy makers base
certification and licensure requirements on data
How will the data system be used to encourage the intended behaviors? How will you use data
to communicate or incent what you value?
Examples: Publishing an annual report card on preparation programs with ratings in categories that align with state’s
vision; conducting annual audits of preparer’s based on targeted data points; revoking licensure when performance falls
below articulated thresholds
45
Appendix G: Applying Vision and Theory of Action to a Multiple
Measures Data System
This graphic organizer could be used by states to review or select their measures and scoring benchmarks to ensure
the measures within a data system reinforce each other and serve the state’s ultimate goals. It could also be
instructive in considering how to score measures or set performance expectations.
Critical Question: How do we create a system that reflects whether educator preparation institutions and programs
achieve what we value?
Instructions: Use the framework below to answer the critical question above based on your state’s unique set of
circumstances.
Because states may have different priorities or areas of focus, we recommend using this worksheet to focus on the
steps in the process that best represent where you are in system design. For instance, if your state has already
articulated the goals for its system (Step 1), then you should quickly note them in Step 1 and move on to Step 2.
Step 1: Establish Goals for your State’s System
Objective: Determine or refine the goal(s) for educator preparation in your state and the state-sponsored data
system that advances those goals.
Directions: Answer guiding questions below to articulate or refine vision and use of data
Question Answer
In regards to teacher preparation, what do we
value? What does effectiveness look like at
both the candidate and provider levels?
What are the characteristics of a system that
supports what we value in teacher
preparation? (Consider Delaware’s Design
Principles as a guide for articulating what a
system should entail to reflect a state’s values)
Who are the stakeholders we want to
influence? Who is our target audience for what
we want to communicate about our values?
How do we want to communicate what we
value / incent what we value? (e.g. report card,
consequences or incentives, both)
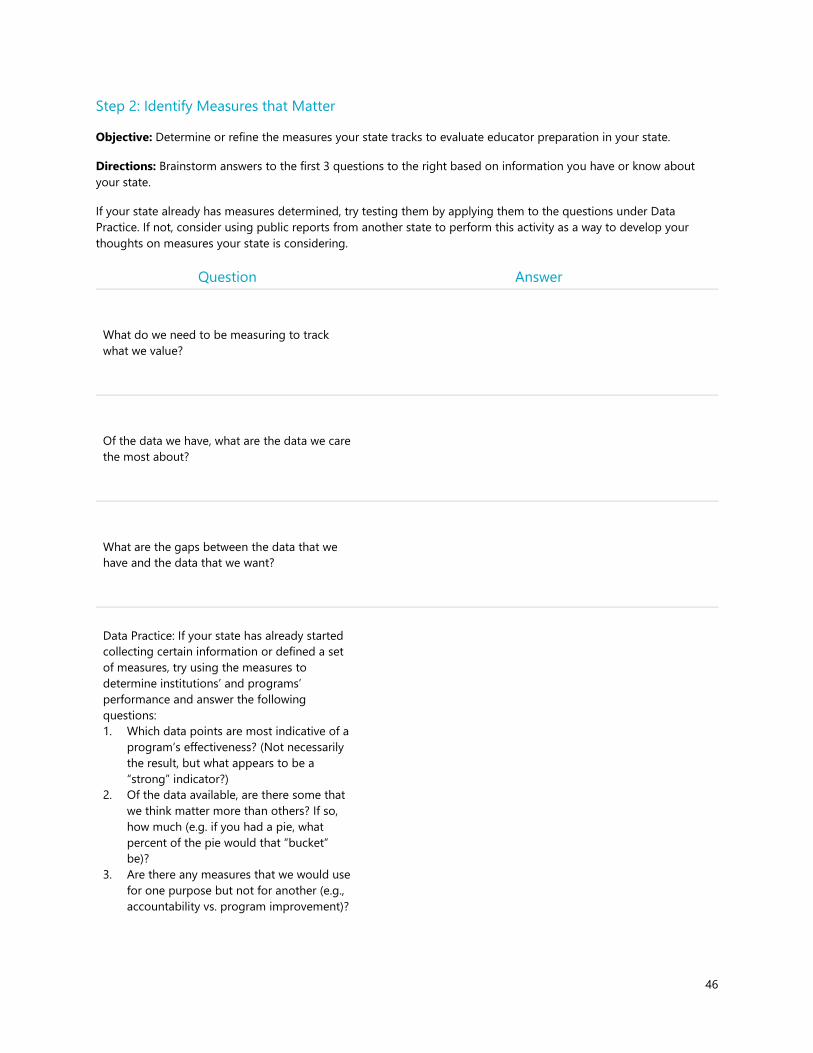
46
Step 2: Identify Measures that Matter
Objective: Determine or refine the measures your state tracks to evaluate educator preparation in your state.
Directions: Brainstorm answers to the first 3 questions to the right based on information you have or know about
your state.
If your state already has measures determined, try testing them by applying them to the questions under Data
Practice. If not, consider using public reports from another state to perform this activity as a way to develop your
thoughts on measures your state is considering.
Question Answer
What do we need to be measuring to track
what we value?
Of the data we have, what are the data we care
the most about?
What are the gaps between the data that we
have and the data that we want?
Data Practice: If your state has already started
collecting certain information or defined a set
of measures, try using the measures to
determine institutions’ and programs’
performance and answer the following
questions:
1. Which data points are most indicative of a
program’s effectiveness? (Not necessarily
the result, but what appears to be a
“strong” indicator?)
2. Of the data available, are there some that
we think matter more than others? If so,
how much (e.g. if you had a pie, what
percent of the pie would that “bucket”
be)?
3. Are there any measures that we would use
for one purpose but not for another (e.g.,
accountability vs. program improvement)?
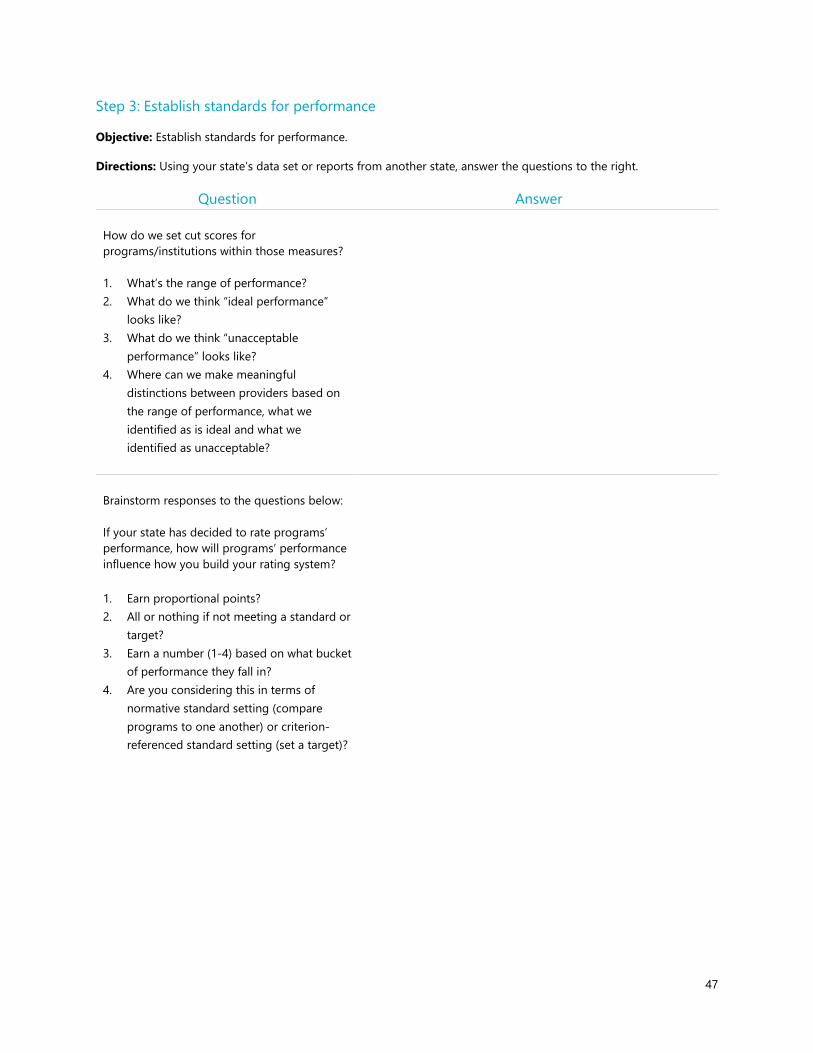
47
Step 3: Establish standards for performance
Objective: Establish standards for performance.
Directions: Using your state’s data set or reports from another state, answer the questions to the right.
Question Answer
How do we set cut scores for
programs/institutions within those measures?
1. What’s the range of performance?
2. What do we think “ideal performance”
looks like?
3. What do we think “unacceptable
performance” looks like?
4. Where can we make meaningful
distinctions between providers based on
the range of performance, what we
identified as is ideal and what we
identified as unacceptable?
Brainstorm responses to the questions below:
If your state has decided to rate programs’
performance, how will programs’ performance
influence how you build your rating system?
1. Earn proportional points?
2. All or nothing if not meeting a standard or
target?
3. Earn a number (1-4) based on what bucket
of performance they fall in?
4. Are you considering this in terms of
normative standard setting (compare
programs to one another) or criterion-
referenced standard setting (set a target)?

48
Appendix H: Delaware Design Principles
Delaware Department of Education created the following design principles that guided the design of their new
scorecard reports:
The reports should seek to highlight the differences among programs that are often obscured by their
institutional contexts.
The reports should be comparable across different educator types and pathways, from programs preparing
classroom teachers of tested grades and subjects, to those preparing school counselors and reading
specialists, and from initial educator preparation in a traditional setting (i.e. four-year college or university) to
advanced certification programs or alternative preparation programs for prospective-educators entering the
field later in their careers.
The reports should offer an honest accounting of the program participants or completers that have entered
the public education system in Delaware through multiple metrics, not individual impacts.
Data elements across inputs, outputs, and outcomes should be used to inform a program’s level of
performance.
The reports should align with the stated intent of the regulations that called for their publication (Delaware
Regulation 290), as well as previous and aligned regulation (Section 1265b of Title 14, Chapter 12,
Subchapter VI of the Delaware Code).
The reports should be easily understandable, and provide relevant, top-line information first, before delving
into system or structural intricacies.
The reports should be fair to all educators, and sensitive to their individual contexts wherever possible,
however knowing that “fairness” may come at the cost of simplicity.
The reports intend to address, at least indirectly, the return on investment gleaned by the over 5 million
dollars that have been disbursed to Delaware’s educator preparation programs over the past 5 years as well
as further continued investment.
Though the State acknowledges the mission of providers to prepare educators for success in all education
contexts, we intend to foreground the performance of program graduates or participants in the Delaware
public education context in particular.
The standards established for these program reports should be aligned with data collection and reporting
requirements of the Council for the Accreditation of Education Preparation (CAEP) as much as possible.
Delaware first evaluated, based on data, the critical needs of the state teacher pipeline, identifying possible
measures that would be key indicators of progress, and then through a reflective and iterative process
defined minimum standards and state targets for the ways of measuring those key indicators.
The 2016 reports should be able to stand on their own merits, but they should be designed with an eye
towards future iterations, and have clear elements of both flexibility and consistency.
49
Acknowledgements
This report was written by TNTP with support from the Charles and Lynn Schusterman Family Foundation. TNTP is
grateful for the Foundation and CCSSO providing the opportunity to support, plan, and facilitate the convening series
in which the lessons learned and best practices in this report were illuminated as well as work with the CCSSO NTEP
states. This report was written as a synthesis and compilation of the states’ lessons and guidance, and TNTP is
honored to write this report on behalf of the states to share their recommendations with the field.
TNTP, the Charles and Lynn Schusterman Family Foundation, and CCSSO are extremely grateful to the featured states
for their contributions and leadership in making these decisions without first having these guideposts, creating the
lessons learned here, and their willingness to share it with other states.