a stark-effect modulator for co2 laser free-space
TRANSCRIPT

University of Tennessee, Knoxville University of Tennessee, Knoxville
TRACE: Tennessee Research and Creative TRACE: Tennessee Research and Creative
Exchange Exchange
Masters Theses Graduate School
5-2005
A Stark-Effect Modulator for COA Stark-Effect Modulator for CO22 Laser Free-Space Laser Free-Space
Communications Communications
Ryan Lane Holloman University of Tennessee - Knoxville
Follow this and additional works at: https://trace.tennessee.edu/utk_gradthes
Part of the Physics Commons
Recommended Citation Recommended Citation Holloman, Ryan Lane, "A Stark-Effect Modulator for CO2 Laser Free-Space Communications. " Master's
Thesis, University of Tennessee, 2005. https://trace.tennessee.edu/utk_gradthes/2004
This Thesis is brought to you for free and open access by the Graduate School at TRACE: Tennessee Research and Creative Exchange. It has been accepted for inclusion in Masters Theses by an authorized administrator of TRACE: Tennessee Research and Creative Exchange. For more information, please contact [email protected].

To the Graduate Council:
I am submitting herewith a thesis written by Ryan Lane Holloman entitled "A Stark-Effect
Modulator for CO2 Laser Free-Space Communications." I have examined the final electronic
copy of this thesis for form and content and recommend that it be accepted in partial fulfillment
of the requirements for the degree of Master of Science, with a major in Physics.
Stuart Elston, Major Professor
We have read this thesis and recommend its acceptance:
Donald Hutchinson, Robert Compton
Accepted for the Council:
Carolyn R. Hodges
Vice Provost and Dean of the Graduate School
(Original signatures are on file with official student records.)
To the Graduate Council: I am submitting herewith a thesis written by Ryan Lane Holloman entitled “A Stark-Effect Modulator for CO2 Laser Free-Space Communications.” I have examined the final electronic copy of this thesis for form and content and recommend that it be accepted in partial fulfillment of the requirements for the degree of Master of Science, with a major in Physics. Stuart Elston Major Professor
We have read this thesis and recommend its acceptance: Donald Hutchinson Robert Compton
Accepted for the Council: Anne Mayhew Vice Chancellor and Dean of Graduate Studies
(Original signatures are on file with official student records)

A Stark-Effect Modulator for CO2 Laser Free-
Space Communications
A Thesis
Presented for the
Master of Science
Degree
The University of Tennessee, Knoxville
Ryan Lane Holloman
May 2005

Acknowledgments
The author would like to acknowledge Dr. Donald Hutchinson for the tremendous
knowledge, guidance, and time he provided. Also acknowledged are his colleagues Dr.
Roger Richards and Dr. John Simpson for their assistance. This experiment was
conceived by them and without their assistance would not have been possible. The
author truly appreciates their teaching and scientific inspiration.
Also, the author would like to acknowledge his committee members, Dr. Stuart
Elston and Dr. Robert Compton for their time and many suggestions.
Finally, the author thanks his family for their support and love.
ii

Abstract
A Stark-effect modulator prototype has been designed and constructed to transmit
an RF signal upon an infrared carrier wave produced by a CO2 laser. The anticipated
future use of this prototype will be to integrate it into an all-weather long-wavelength
infrared (LWIR) free-space communication link. This communication system is
expected to be capable of operation at 2.5 Gbits/sec over a range of >6 kilometers. The
Stark-effect modulator prototype is ideal to replace existing microwave and radio
communication links used currently. Also, the Stark-effect modulator is a better choice
than electro-optic crystal modulators and acousto-optic Bragg cell modulators because it
operates at higher frequencies and is less costly.
The Stark-effect occurs when an electric field is applied to a gas molecule that has
a substantial polarizability. The electric field changes the spacing of the gas molecule
energy levels. The gas molecule used is deuterated ammonia (NH2D) because it has a
molecular absorption resonance near the 10.59 micron wavelength line of the CO2 laser
emission.
The modulator is a dielectric waveguide that is constructed of borosilicate glass,
measuring 36-cm in length and having an inner diameter of 1.8-mm and an outer
diameter of 3-mm. The modulator has been characterized successfully, with an
experimental result agreeing with a predicted model. For the first time, an RF signal has
been successfully applied to the Stark-effect modulator and successfully transmitted and
detected by a nearby receiver.
iii

Table of Contents
Chapter Page 1. Introduction............................................................................................................... 1
1-1 LWIR Communication Advantages ......................................................................... 1 1-2 All-Weather Capabilities .......................................................................................... 2
1-2-1 Atmospheric Absorption ................................................................................... 31-2-2 Smoke Extinction Model................................................................................... 61-2-3 Fog Extinction Model........................................................................................ 8
1-3 The Thesis................................................................................................................. 82. Literature Review ................................................................................................... 11
2-1 Microwave Spectroscopy ....................................................................................... 122-2 Infrared Spectroscopy............................................................................................. 142-3 Stark-Effect Modulation ......................................................................................... 162-4 Stark-Effect Modulator at ORNL........................................................................... 22
2-4-1 Theory of Stark-Effect Modulator................................................................... 222-4-2 Experimental Results....................................................................................... 23
3. Research..................................................................................................................... 273-1 CO2 Laser ............................................................................................................... 273-2 Stark-Effect Modulator........................................................................................... 31
3-2-1 Molecular Gas Filling...................................................................................... 363-2-2 AC Biasing ...................................................................................................... 37
3-3 Data Addition ......................................................................................................... 393-4 Experimental Arrangement..................................................................................... 41
4. Results .........................................................................................................................44 5. Conclusion ................................................................................................................54 References .........................................................................................................................57 Appendix ...........................................................................................................................60 Vita ....................................................................................................................................65
iv

List of Tables
Table Page Table 1. Experimental results for percentage modulation [10].........................................17
v

List of Figures
Figure Page Figure 1. Atmospheric transmission of 12C16O2 laser wavelength [6]. ...............................4 Figure 2. Atmospheric transmission of 13C16O2-isotope wavelength [6]............................5 Figure 3. Transmission of commonly used laser wavelengths through smoke [6].............7 Figure 4. Transmission of commonly used laser wavelengths through fog [6]..................9 Figure 5. The simulated transmission of NH2D in a 30-cm cell at 2-Torr........................24 Figure 6. The simulated transmission of NH2D in a 30-cm cell at 2-Torr with a larger applied electric field than Figure 5 ...................................................................25 Figure 7. The transmission (measured) signal versus applied voltage in a 20-cm long cell filled with 8-torr of NH2D..........................................................................26 Figure 8. The RF-driven CO2 laser used for modulation experiments [6]........................28 Figure 9. On the left is the laser housing ..........................................................................29 Figure 10. Schematic inside the RF insulated housing .....................................................30 Figure 11. Inside the RF insulating housing .....................................................................32 Figure 12. Side view of the Stark-effect modulator..........................................................33 Figure 13. Cross section of the Stark-effect modulator ....................................................34 Figure 14. Picture of Stark-effect modulator ....................................................................35 Figure 15. The NH2D gas is formed and supplied to the modulator here.........................36 Figure 16. A schematic drawing of plumbing for the gas filling apparatus. ....................37 Figure 17. The bridge circuit designed for an AC bias signal ..........................................38 Figure 18. The applied AC bias on the left produces the equivalent to a steady “DC” bias as shown on the right [7] .........................................................................39 Figure 19. The bias and data waveforms must match in polarity to modulate correctly [7]....................................................................................................................40 Figure 20. An electrical schematic of the modulator circuit.............................................41 Figure 21. A picture of the experimental arrangement .....................................................42 Figure 22. This is a schematic diagram of the experimental arrangement .......................43 Figure 23. Normalized Transmission vs. Applied Voltage...............................................45 Figure 24. The RF drive signal had 8-Vpp driven to the modulator.................................47 Figure 25. This is the detected RF transmission ...............................................................48 Figure 26. This shows the transmitted RF sinusoidal signal ............................................49 Figure 27. Normalized Measured RF Signal Amplitude vs. Drive Signal .......................52 Figure 28. Figure of Merit vs. Pressure ............................................................................53
vi

Chapter 1:
Introduction
In the past, there has not been an extensive application for long-wavelength
infrared (LWIR) communication systems. This void could be alleviated if an economical
and compact source for 10-micron radiation were developed. Therefore, this thesis in
collaboration with Oak Ridge National Laboratory (ORNL) is developing a LWIR free-
space communication system [6], [7]. This communication system is expected to operate
at 2.5 Gbits/sec over a range of >6 kilometers. A LWIR communication system is ideal
to replace currently used radio and microwave communication links.
______________________
1-1 LWIR Communication Advantages
The capacity of any communication channel is proportional to the width ∆ƒ of its
frequency band [12]. Even for highly monochromatic light, where ∆ƒ/ƒo is very small
the bandwidth ∆ƒ can be enormous when ƒo is very high. Light waves carry very high
central frequencies where ƒo can reach 1014-Hz. However, radio and microwave systems
operate at much lower central frequencies. Therefore, light waves have the capacity to
carry much more information than radio and microwave systems. In fact, because radio
and microwave communications involve electromagnetic waves of longer wavelength
and lower frequency than laser light the theoretical information capacity of a typical light
wave is around 100,000 times greater than that for a typical microwave [12].
1

Besides information capacity improvements, another characteristic that makes
visible and infrared light ideal to replace radio and microwave systems is that it is
virtually impossible to intercept. This is because laser light does not scatter as much as
radio and microwave systems. This safety feature is very attractive when security of
information is important.
Ten-micron radiation has been chosen because it has unique advantages. First,
10-micron radiation is considered to be eye safe. The definition of eye safe is that
corneal burning may result, but there is no retinal damage. Laboratory safety glasses are
the only protection required for 10-micron radiation. Second, a very compact 10-micron
CO2 laser and Stark-effect modulator has been designed. Also, recent developments of a
wideband, room temperature Quantum Well Infrared Photodetector (QWIP) receiver
enable this to be a truly portable LWIR communication package [6]. Finally, LWIR
radiation operates very well in natural weather phenomenon. This means it has better
transmission than other laser wavelengths through atmospheric conditions such as fog,
clouds, and smoke.
1-2 All-Weather Capabilities
An important feature of this communication system is its all-weather capabilities.
This means more radiation may be transmitted through atmospheric conditions (fog,
clouds, and smoke) using long-wavelength infrared radiation than with shorter
wavelength lasers that are typically used [7]. Therefore, selecting the proper laser
wavelength is of great importance since absorption and scattering are wavelength
dependent. A CO2 laser has been selected for its 10-micron range; however, a
2

comparison between the standard 12C16O2 and 13C16O2-isotope laser is presented in
section 1-2-1.
_______________________
1-2-1 Atmospheric Absorption
An atmospheric absorption comparison between the standard and isotopic CO2
laser wavelengths is made using the database, HITRAN [5]. This database shows the
superiority of the 13C16O2-isotope wavelengths (~10.8-µm) versus the standard 12C16O2
laser wavelengths (~10.6-µm) for atmospheric absorption. The improved transmission
for the 13C16O2 laser wavelength occurs because the atmosphere contains very little
13C16O2. The atmospheric transmissions modeled by HITRAN are represented in Figures
1 and 2 [6]. In both of these figures, the roundtrip path length is 12-km at a pressure of
1-atm and a temperature of 296-K. Figure 1 represents the atmospheric transmission
using a 12C16O2 laser. Notice that most of the lines only have ~40 percent transmission.
In comparison, Figure 2 shows atmospheric transmission using the 13C16O2 laser
wavelength. The three laser lines shown have a transmission between 80 and 90 percent
at the same conditions. The R(20) line of 13C16O2 has the best atmospheric transmission.
To further promote the 10-µm wavelength region as ideal for an all-weather
communication link, a summary of some known effects upon the transmission of
radiation through smoke and fog is presented [6]. In these sections the 10-µm
wavelength region will be compared to other wavelengths (500-µm and 1.5-µm), which
are currently popular for optical communication systems.
3

0
0.2
0.4
0.6
0.8
1.0
10.5711 10.5910 10.6114 10.6321
10P2410P18 10P2210P20
Wavelength (microns)
Frac
tiona
l Tra
nsm
issi
on
Figure 1. Atmospheric transmission of 12C16O2 laser wavelengths [6].
4

0
0.2
0.4
0.6
0.8
1.0
10.76 10.78 10.80 10.82
10.768 10.784 10.8
13C
O2 R
(16)
13C
O2 R
(20)
13C
O2 R
(18)
Wavelength (microns)
Frac
tiona
l Tra
nsm
issi
on
Figure 2. Atmospheric transmission of 13C16O2-isotope wavelengths [6].
5

1-2-2 Smoke Extinction Model
The smoke extinction model is built around the bonding theory that small
particles (spherules) group together to from large particles (clusters) [6]. In this model,
the term fractal dimension is used to describe how well packed spherules are within the
cluster. Therefore, a fractal dimension of 1 refers to spherules just barely touching and a
fractal dimension of 3 refers to a cluster with no voids. Smoke has a fractal dimension of
1.78 [6]. To calculate the transmission of radiation in smoke:
T e L= −σρ (1)
where σ is the extinction cross-section, ρ is the density, and L is the total path
length [6].
σ πa Nka M M= −4 13 2 2Im[( ) / ( )]+ 2 (2)
N R a D= ( / ) (3)
Equation 2 is the absorption cross-section calculated for vector waves [6]. However, σa
can be taken as an estimate for σ because the absorption cross-section is much larger than
the scattering cross-section in smoke [6]. In Equation 2, k = 2π/λ and M is the complex
index of refraction at wavelength λ. Equation 3 is the average number of individual
spherules in each cluster [6], where R is the average cluster radius, a is the average
spherule radius, and D is the fractal dimension. Figure 3 shows the transmission of three
popular laser wavelengths used for communications versus smoke density [6]. For all
calculations, R = 0.1-µm and L = 1000-m. Figure 3 shows that 10-µm exhibits better
transmission than the other selected wavelengths.
6

0
0.2
0.4
0.6
0.8
1.0
0 1x10⁶ 2x10⁶ 3x10⁶ 4x10⁶
0.500 microns1.5 microns10.6 microns
Density of Smoke (clusters/cm3)
Frac
tiona
l Tra
nsm
issi
on
Figure 3. Transmission of commonly used laser wavelengths through smoke [6].
7

1-2-3 Fog Extinction Model
Finally, the extinction transmission of laser radiation in fog (water droplets), is
presented in Figure 4 [6]. Here, 10-µm and 1.5-µm wavelengths are compared. Again,
10-µm is far superior. Thus, it is concluded that the 10-µm wavelength is the best
wavelength to use for all-weather communication. Based on the findings in section 1-2,
the R(20) line associated with the 13C16O2-isotope laser is the preference for all-weather
communication.
1-3 The Thesis
Hutchinson et al. has designed and constructed a compact CW RF-driven
waveguide CO2 laser and a dielectric-waveguide Stark-effect modulator [6], [7]. The
CO2 laser is driven by a 60 MHz RF amplifier at a power level of approximately 30
watts. The modulator is based on the Stark shift of deuterated ammonia (NH2D). Stark-
effect modulation occurs when an electric field is applied to a gas molecule that has a
substantial polarization. In this case, an applied electric field changes the energy spacing
of the molecular levels, thereby changing the optical frequency or wavelength that is
absorbed by the gas [6].
Hutchinson et al. successfully characterized a borosilicate glass waveguide Stark-
effect modulator that measured 20-cm in length with an inner diameter of 0.9-mm [6],
[7]. This thesis used a borosilicate glass waveguide Stark-effect modulator that is 36-cm
in length and has an inner diameter of 1.8-mm. The increased size of the waveguide
allowed for greater modulation amplitude. The longer waveguide Stark-effect modulator
was successfully characterized, and for the first time an RF signal has been transmitted.
Thus, a working prototype Stark-effect modulator has been developed.
8

0
0.2
0.4
0.6
0.8
1.0
0 25 50 75
1.5-microns10-microns
Fog Density (mg/cm3)
Frac
tiona
l Tra
nsm
issi
on
Figure 4. Transmission of commonly used laser wavelengths through fog [6].
9

A Stark-effect modulator is better for LWIR communications than other
modulators. Electro-optic crystal modulators require a very large voltage (>1000 to 5000
volts). This voltage requirement makes high frequency modulation very difficult to
achieve [6]. Acousto-optic Bragg cells are another modulation option. They are limited
to modulation frequencies less than a few MHz [6]. A Stark-effect modulator requires
less voltage for operation. Thus, it can operate at much higher frequencies. Also, the
cost of an electro-optic crystal or an acousto-optic Bragg cell is in the thousands of
dollars. A Stark-effect modulator may be produced for a few hundred dollars. The facts
presented in chapter 1 are the motivation for undertaking this project.
10

Chapter 2:
Literature Review
The focus of this thesis is the development of a working prototype Stark-effect
modulator with an application for communications. Therefore, the literature reviewed
mainly identifies previous attempts to use the Stark-effect for modulation. Much of this
research originated in the mid 1940’s. At that time the Stark-effect was used for the
technique of microwave spectroscopy and was very limited in the infrared region. This
was due to poor resolution of the conventional spectrometers compared to the magnitude
of the Stark shifts [14]. By the late 1960’s and through the 1970’s many authors were
able to study Stark spectroscopy in the infrared region with the development of infrared
lasers. Many of these studies led to the foundation for creating a Stark modulator to
incorporate into a communication system.
Before focusing on previous studies, modulation, as it applies to communication
needs to be understood. In general, modulation causes a spectral shift in a signal and is
used to gain advantage in communications [11]. Two examples of this are discussed as
follows.
1. If several signals, with the same frequency band, are transmitted simultaneously
over the same transmission medium, they will all interfere. Consequently it will be
impossible to separate or retrieve them at a receiver. Therefore, a modulated signal can
be transmitted to shift the signal spectrum; giving each signal its own unique carrier
frequency. Once the modulated signal reaches the receiver the signal is demodulated.
11

This is how radio stations transmit their signals and is known as frequency-division
multiplexing [11].
2. The antenna size must be of the order of the wavelength of the signal to be
radiated. Since audio signals have low frequencies and large wavelengths, impracticably
large antennas would be required. Modulating the signal to a higher frequency and
smaller wavelength helps solve the problem [11].
The remainder of this chapter will focus on the development of the Stark effect from a
spectroscopic tool to being used for optical communication.
2-1 Microwave Spectroscopy
Townes and Schawlow are two of the earliest pioneers of microwave
spectroscopy [15]. Much of their literature takes a theoretical approach as to how a
molecule is affected by the Stark-effect. They define the Stark-effect as being the change
in the spectrum of a system, which may be observed when the system is subjected to an
electric field. Therefore, the effect an electric field has on the rotational energy levels of
a molecule can be described in classical terms, but require a quantum-mechanical
approach for a detailed understanding [15]. Using a quantum-mechanical approach, the
shift in energy of a given level for a nonplanar symmetric top molecule is given by
Equation 4 [15].
∆W E MKJ J1 1 1
= −+
µ( )
(4)
The shift in energy given in Equation 4 depends on the molecular dipole moment µ1, the
electric field strength E, and the quantum numbers J, M, and K. This energy shift which
is proportional to the electric field strength is the linear or first-order Stark-effect. The
12

second-order effect takes into account the small changes in the molecular wave function
due to the field. However, unless K = 0 the second-order energy will be so small
compared to the first-order that it will be unimportant. When K = 0, the second-order
energy for a symmetric molecule is simplified to Equation 5 [15].
)32)(12(3)1(
)1(2
222
2 +−−+
+=∆
JJMJJ
JhBJEW µ (5)
Besides Townes et al. [15], Karplus [9] also observed frequency modulation in
microwave spectroscopy. This work would later be expanded on by P.C. Claspy et al. [3]
as the Stark-effect applies to vibrational-rotational spectra [3]. Karplus developed a
theoretical description of the absorption coefficient of a gas as it relates to the density
matrix of that gas. This description is described through Equation 6 [9].
α π ω ρ ρ ω ωλ
λλ
λ( ) ( / ) ( ) Im ( , ; ),
t c Pmn fg
gn mk mn
g= − ×∑42 0 0h t (6)
The Pmn in equation 6 refers to the component of the dipole moment where g and λ are
degeneracy indices. The function , determines the shape of the absorption
line in equation 6. Finally, the density matrix is represented by . The
density matrix involved with the absorption coefficient is obtained from its equation of
motion, which takes into account a possible time-dependence of the resonant frequency
of the molecule and of the frequency of the exciting radiation. Karplus goes on to take
the shape of the absorption line for slow, weak, sinusoidal, and square wave modulations.
This is done by evaluating the function that determines the shape of the absorption line.
);,( tf gmn ϖϖ λ
)( 00mkn ρρ λ −
Applying slow modulation, Karplus states that the line has the same shape as if
there was no modulation present [9]. The only observable difference is that the
13

absorption peak is shifted. During weak modulation, a low modulation frequency
represents an effective differentiation of the absorption line shape obtained with slow
modulation [9]. Using sinusoidal modulation Karplus predicts a series of absorption
lines separated by some frequency [9]. Finally, in square wave modulation, the
simultaneous observation of two absorption lines, corresponding to the two values of the
resonance frequency in the two half-cycles is predicted [9].
____________________
Section 2-2 will take the foundation the previous authors set and use them for
observations in the infrared region.
2-2 Infrared Spectroscopy
Brewer et al. presented a spectroscopic technique based on the Lamb dip [2].
This investigation into the infrared Stark spectra of N14H2D reported a rapid Stark tuning
rate (frequency vs. applied field) and relatively high absorption coefficient. The research
indicates the possibility of obtaining substantial modulation depth with relatively low
field strength and short path length [9]. Brewer’s method resulted in a unique vibration-
rotation line assignment and its transition matrix element. Finally, a method to probe
ground-and excited-state Stark splitting with precision was observed [2].
Their experiment examined the vibration-rotation spectrum of the N14H2D
molecule in the ν2 vibration using the P(20) line of a CO2 laser at a frequency of
944.191-cm-1 [2]. The transition was identified as 404(α) → 514(s) in the asymmetric
rotor notation [2]. Initially, the CO2 laser was free running and was not stabilized in any
way. The laser operated CW on a single longitudinal mode with 75-MHz, with linear
polarization, and with an output power of a few W/cm2 or less. However, for low-noise
14

Lamb signals an exceptionally stable free-running CW laser was required. The laser
beam passed through a cell containing N14H2D and Stark plates made of glass and
vacuum-coated with aluminum on the inner surface. The narrowest lines were observed
with plates 12.5-cm long by 2.5-cm wide and separated by polished (λ/10) quartz spacers
0.1519-cm thick. These plates were oriented so that the Stark field was either parallel or
perpendicular to the optical field direction corresponding to the selection rules ∆M=0 or
∆M= [2]. This experiment produced Stark splitting as narrow as 1.5-MHz (within a
Doppler width of 82-MHz) [2]. This was the first time this was observed in an optically
excited state using the Lamb dip.
1±
Shimizu [14] also performed an infrared spectroscopy experiment. He reported
on Stark spectroscopy of the 14NH3 ν2 band by 10-µ CO2 and N2O lasers. The advantage
of using these lasers to study vibrational spectrum is that they have an oscillating line in
every 1 or 2 wavenumbers covering most of the 9- and 10-µ region [15].
Shimizu’s experiment used a 2-m flowing gas laser system with a cavity length of
2.6-m. One of the mirrors was replaced with a grating in order to select the transition by
changing the angle of the grating. With this arrangement in place it was possible to
obtain oscillations between the P50 and R50 lines of the ν3-ν1 band of the CO2 laser [15].
Also, lines from P42 to P5 and from R5 to R39 of the ν3-ν1 band of the N2O laser were
achieved [14]. From this point, the laser beam was passed through a cell measuring 40-
cm long and maintained at a pressure of ~10-2-10-3-torr. The cell had parallel aluminum
electrodes with an electric field of 45-V/mm. The modulation voltage was kept around
40-V peak to peak at a frequency of 5-kHz for most lines, while the voltage was
15

increased for a few of the weaker lines. Finally, a Ge:Au photoconductive detector was
used to monitor the modulated signal. This experimental arrangement provided about
100 coincidences between NH3 lines and laser lines [14]. Also, the NH3 line positions
relative to the laser lines are calculated using the data for the dipole moment obtained by
the experiment [14].
2-3 Stark-Effect Modulation
Using the basis that previous researchers developed, Landman and Marantz began
experimentally determining which electro-optic gases would modulate a laser beam [10].
They began this evolution of Stark modulation for two reasons. The advantage of gases
for modulation lies in the narrow lines that can be obtained, and the simplicity to
construct and incorporate a Stark cell into a system [10]. First, they said that four criteria
must be met to achieve a high modulation index in molecules for modulation [10]. (1)
Molecules must have a large dipole moment. (2) Molecules that are asymmetric top-
molecules with slight asymmetry are good candidates if the Stark effect is linear at the
applied field. (3) The linear Stark effect should be either in the lower state, upper state, or
both. (4) The laser line and the absorbing line should be in coincidence to within one or
two Doppler widths of the absorbing gas.
The Stark shifts of molecular absorption can amplitude modulate, frequency
modulate, line switch, and cause polarity changes to the laser output. However,
Landman and Marantz only investigated amplitude modulation because of its application
to optical communications using a CO2 laser [10]. Their experimental set up involved a
1-m sealed-off CO2 laser with external mirrors, one of which is a diffraction grating.
16

Table 1. Experimental results for percentage modulation [10].
Gas Vibration Dipole Moment
(D)
CO2 Wavelength
(µ)
Modulation(%)
Pressure (Torr)
Field (kV/cm)
NH3aSymm. Deform.
1.47 10.286 0.5 6 2
CH3BR bRock 1.80 10.612 4 3 1 CH3F aC-F
Stretch 1.79 9.658 10 2 0.9
CH3CL bRock 1.87 9.606 20 6 1.5 CH3I bRock 1.65 10.532 4 10 2.5 NF3
bDeg. Stretch
0.234 9.586 0.3 10 2.5
aParallel band. bPerpendicular band. Then the laser beam was passed through a 1-m Stark cell whose plate separation was 1/8-
in with a capacitance of 70-pF and an electric field of at least 1-kV/cm. A gold-doped
germanium detector was used to observe the effects.
Using the experiment described above, the most promising combination of CO2
line and Stark cell gas was the P(26) 00o1-02o0 line of CO2 and a line of methyl chloride
[10]. More importantly, molecular Stark effects were seen in six other gases. Therefore,
this led them to believe that many more gases held promise for modulation. Table 1
shows their findings. In order to increase the modulation depths presented in Table 1,
improvements to the modulator are required. It would have to be much shorter and
narrower to reduce the capacitance and thus the power requirement, which equals V2Cw
(V=applied voltage, C=total capacitance, w= bandwidth) for an impedance match [10].
P.C. Claspy et al. performed both a theoretical and experimental study of the
time-dependent molecular Stark effect and its application to the modulation of CO2 laser
radiation [3]. First, their theoretical approach took ideas that Karplus [9] developed for
17

microwave spectroscopy and altered it to be applicable to absorption of laser radiation in
the infrared. They used a density matrix approach to develop a quantum mechanical
description of the effect of a time-varying electric field on the absorption coefficient and
refractive index of a molecular gas near an absorption line [3]. Equation 7 describes a
single Lorentzian line with a time-varying center frequency moving synchronously with
the Stark field [3].
220
2
])([)/1(),(
smn
mn
tcp
tγωω
τε
ωϖα
+−=
h (7)
where
h
)()()(
tWtWt nm
mn−
=ω
ω frequency of light, absorption transition moment, mnp 1/τ small-signal absorption linewidth, )(tmnω transition frequency, sγ homogeneous linewidth, molecular energy levels in time. )(tWi
After their theoretical investigation Claspy determined the basic characteristics of
the time-dependent molecular Stark effect in a CO2 laser modulation application [3].
They used an 80-cm long laser that consisted of a 4-m gold surface mirror and a 1800
lines-per-inch diffraction grating blazed for 10-µ. Also, they used a piezoelectric driver
to scan lines. Next, the modulator measured 30-cm long and 3.8-cm wide with a plate
separation of 1 cm and windows made of NaCl. The plates were in a parallel
configuration and were made of aluminum. The modulator gas used was methyl chloride
for P(26) of the (00o1) - (02o0) CO2 band. The experimental results obtained show non-
18

dispersive modulation at frequencies up to 30-MHz [3]. They also found that the
response of modulation depth to Stark field amplitude is separated into linear and
nonlinear regions [3]. Finally, this work concluded that this method could effectively be
used in the modulation of CO2 laser radiation because modulation depths of greater than
80% were observed.
Johnston and Melville reported that deuterated ammonia NH2D can be used to
modulate the strong 10-µ P(20) line of a CO2 laser [8]. This is the same approach this
thesis has taken. Therefore, the theoretical model based on Stark-effect theory, used to
characterize the Stark modulator in this thesis originated from Johnston and Melville [9].
This model is presented in the appendix.
While the laser line and the gas are the same as this thesis, the experimental
arrangement is somewhat different. Johnston and Melville used a CO2 laser that was 1-m
in length and tuned to the 10.6-µ P(20) line by means of a grating. Their beam passed
through a Stark cell that was made of a glass cylinder containing polished aluminum
plates 19.7-cm long, 2.5-cm wide, and separated by 0.109± 0.003-cm by means of glass
spacers. The aluminum plates were rounded to avoid breakdown of the deuterated
ammonia and NaCl windows were attached to the Stark cell. To create a Stark field in
the cell a small sinusoidal probe field of constant amplitude at 400-Hz was applied to the
cell as a larger dc bias field swept the absorption line across the laser frequency. Once
the laser beam passed through the cell it was detected with an SBN pyroelectric detector.
Also, similar to this thesis, NH2D was created by mixing NH3 and ND3 in a Stark cell.
The exchange of hydrogen and deuterium occurs quickly; and reaches equilibrium in less
than one minute.
19

The data provided from this experiment gave values for the absorption coefficient
at line center (γM) and the pressure-broadening coefficient (C) which both apply to the
M=4 Stark component. The absorption coefficient at line center was determined by
measuring the absorption at line center as a function of pressure in several mixtures of
ND3 and NH3. The absorption at line center was found to be γM=0.033 cm-1 [8]. The
observed pressure-broadening coefficient was found by measuring the line width as a
function of pressure [8]. Its value was found to be C=32.5-MHz*Torr-1 [8]. With these
values at hand the maximum intensity modulation to be expected for a 19.7-cm cell with
20-V rms applied signal can be calculated using Equation 8 [8].
I I (8) e l= −0
γ
where
=absorption coefficient, )/( 22 bCPbM += εγγ l = length of cell, P= pressure, b= linewidth, ε= frequency offset of line center from the laser frequency. The result is ∆I/I0=48%. The experiment produced a modulation depth of 40%; therefore,
these values are in good agreement with one another.
C.K. Asawa and T.K. Plant [1] took a slightly different approach than
Johnston and Melville [9]. After studying low-pressure Stark resonance spectra of N14H3
with 25 of the more intense P and R lines in the 10- to 11-µm range they observed
intense Stark resonance absorptions of the R(18) and R(24) lines and a weaker absorption
of the R(26) line of the C13O216 laser by N14H3 in a Stark cell [1]. Measurements were
taken of the absorption versus applied voltage to the Stark cell for all three lines
20

mentioned previously. The R(18) line had absorption peaks occur at 1000, 1200, and
1500 Volts of applied voltage to the Stark cell, which corresponded to the ∆M=0
transitions between ⏐M⏐=6,5, and 4 levels. The R(24) line had its lowest Stark field
resonance appear at 1800 Volts of applied voltage for ⏐M⏐=2. Finally, the R(26) line
occurring at 2400-V was not identified. In the process they also performed a wideband
modulation experiment with an N14H3 Stark cell and the R(18) line. There were many
promising results from this experiment. First, the Stark cell measured only 10-cm long
and only a modest amount of power (<1 W) was required to attain useful modulation
depth at high data rates [1]. Finally, and most important, their Stark modulator
reproduced 180-Mbit/s random words [1]. They felt that the modulator could attain even
higher bit rates with useful modulation depths.
T.K. Plant continued his investigation, but this time with R.L. Abrams [13].
They reported new values for the magnitudes of the pressure broadening and linear
absorption coefficients. This was done for the Stark tunable (0a, 404, 4)→ (1a, 505, 5)
transition in N14H2D using a CO2 laser operating on the P(20) 10.59-µm line [13]. Plant
and Abrams used this modulating gas because of its unique energy structure that is useful
for laser modulation, laser stabilization, and nonlinear optical interactions that resulted in
a single sideband modulator operating at microwave frequencies [13].
Their modulator grounded one plate while driving the other with a 9-Hz 300-
V peak-to-peak square wave that was imposed on a slow sawtooth sweep varying from
240- to 350-V. They measured absorption line shapes, and extracted linewidths, for
Stark cell pressures varying between 50-mTorr and 10-Torr. They also created N14H2D
gas by mixing two parts N14H3 and one part N14D3.
21

Two methods were used to derive the pressure-broadening coefficient. First,
the homogeneous linewidths for various pressures generated a best straight-line fit
through zero to these values [13]. The slope of this line resulted in a pressure-broadening
coefficient of 40.2 0.4-Mhz/Torr [13]. The other method to determine the pressure-
broadening coefficient examined the pressure dependence of the line-center absorption
coefficient [13]. This resulted in a value of 40.3-Mhz/Torr [13]. Finally, from the
predicted asymptotic behavior of the line-center absorption coefficient at high pressures
the absorption coefficient was extracted to be 0.028-cm
±
-1 [13].
2-4 Stark-Effect Modulator at ORNL
Hutchinson et al [6], [7] used a borosilicate glass waveguide Stark-effect
modulator that measured 20-cm long with an inner diameter of 0.9-mm. The results,
which are explained in section 2-4-2, resulted in a successful characterization of their
Stark-effect modulator. To improve the modulation amplitude a longer Stark-effect
waveguide made of borosilicate glass was needed. This thesis extends the preceding
work performed by Hutchinson et al [6], [7] by characterizing the longer Stark-effect
modulator and by applying RF modulation to the system for the first time. The
foundation for Hutchinson’s work was the result of the previously describe work.
2-4-1 Theory of Stark-Effect Modulation
Stark-effect modulation occurs when an electric field is applied to a gas
molecule. Basically, the electric field changes the energy spacing of the molecular levels.
In turn, the energy spacing changes the optical frequency and wavelength absorbed by the
gas. The molecular gas chosen to interact with the CO2 laser radiation is partially
deuterated ammonia, specifically, NH2D. This molecular gas is chosen because it has a
22

molecular absorption resonance near the 10.59 micron line of the CO2 laser
Figure 5 shows the theoretical transmission of a 30-cm cell containing 2-Torr
of NH2D [6]. The blue line represents the transmission of NH2Dwhen no electric field is
applied. The red line depicts the transmission of NH2D when an electric field of 350-
V/mm is applied to the pressurized cell. Finally, the P(20) 10.59-µm CO2 laser line is
located at zero difference frequency. Notice how the absorption line is split into nine
Stark components. They will be classified as M = 0, ±1, ±2, ±3, ±4, with the M=0
component roughly in the center at a frequency difference of 2189 MHz and the M= ±4
components on the outer edges. If the electric field is increased the transmission curve
will change, as shown in Figure 6. With the electric field being increased to 380 V/mm,
in Figure 6, the absorption line near M=-4 comes into coincidence with the 10.59 micron
laser line. From Figures 5 and 6, digital modulation is predicted to be achievable by
setting a steady field at 365 V/mm and applying a 30-V digital signal to switch the
transmission of the cell between 75% and 90% states. Also, if the length of the cell is
increased then the modulation amplitude may exceed 30% [7].
2-4-2 Experimental Results
Hutchinson et al. characterized a dielectric Stark-effect modulator [7]. The
waveguide material was borosilicate glass and measured 20-cm with an inner diameter of
0.9-mm. The modulator was filled with 8-Torr of NH2D, and the transmission (measured
signal) as a function of the applied voltage was measured. An AC bias waveform was
generated by applying a square wave drive voltage from a signal generator to an iron-core
step-up transformer. The transformer was a 110 VAC to 6.3 VAC filament transformer
operated in reverse.
23

0 1.109 2.109 3.109 4.109 5.1090
0.1
0.2
0.3
0.4
0.5
0.6
0.7
0.8
0.9
1
Difference Frequency
Tran
smis
sion
1
0
trans1q( )
trans2q( )
5 109×0
2189MHz⋅
∆fq
M = 0 M = 1 M = 2 M = 3 M = 4
Figure 5. The simulated transmission of NH2D in a 30-cm cell at 2-Torr. The blue
curve represents the transmission with no electric field applied. The red curve shows the simulated transmission when an electric field of 350 V/mm is applied to
the cell [6].
24

0 1.109 2.109 3.109 4.109 5.1090
0.1
0.2
0.3
0.4
0.5
0.6
0.7
0.8
0.9
1
Difference Frequency
Tran
smis
sion
1
0
trans3q( )
trans2q( )
5 109×0
2189MHz⋅
∆fq
M = 3 M = 4 M = 1 M = 2 M = 0
Figure 6. The simulated transmission of NH2D in a 30-cm cell at 2-Torr with a larger applied electric field than Figure 5. The blue curve represents the
transmission of NH2D when no electric field is applied. The red curve shows the transmission of NH2D when an electric field of 380 V/mm is applied to the cell [6].
25

26
Figure 7 compares Hutchinson’s [7] experimental results to the theoretical
transmission curve. Also, a peak modulation index at approximately 30% resulted. The
results are in excellent agreement with the theoretical model provided by Johnston et al.
[8]. A MathCad representation of the model is found in the appendix. This model takes
into account the cell length, e-field enhancement, and the deuterated ammonia fraction.
Figure 7. The transmission (measured) signal versus applied voltage in a 20-cm long cell filled with 8-torr of NH2D. This result is provided from reference [7]. The
theoretical model and recorded data is in excellent agreement with one another.
0
0.1
0.2
0.3
0.4
0.5
0 500 1000 1500
Model ResultsMeasurement
M = 2M = 3M = 4
APPLIED VOLTAGE
MEA
SUR
ED S
IGN
AL

Chapter 3:
Research
This project was accomplished by using a compact CW RF-driven CO2 laser
and a dielectric-waveguide Stark-effect modulator. A description of the CO2 laser, Stark-
effect modulator, and overall experimental arrangement will be outlined. This
experimental arrangement was used to transmit an RF signal, for the first time.
_____________________
3-1 CO2 Laser
The laser shown in Figure 8 is a compact cw RF-driven, air-cooled, sealed-off
waveguide CO2 laser. This design is similar to a laser developed by Walsh [16].
Beginning from the right-hand-side of Figure 8 and moving left the laser cavity will be
explained. First, the cavity consists of a 0.5-inch diameter 3-meter radius-of-curvature
concave ZnSe 95% reflective output coupler. This coupler is attached to the ceramic
waveguide [6]. The attachment was made by sealing a brass fitting with epoxy to the
waveguide. This brass fitting was soldered to a brass bellows. Finally, the other end of
the brass bellows was sealed to the coupler. The ceramic waveguide has an inner
diameter of 2.4-mm. The cavity length is 30.5-cm, making it very compact. The other
end of the waveguide is closed off with a ZnSe Brewster window that is attached with
epoxy, and ground to the Brewster’s angle. Finally, the back end of the laser has a 150
mm-1 flat grating mounted on a piezoelectric actuator in an adjustable mirror mount to
alter the wavelength. The laser was adjusted to the P(20) line for measurements.
27

Figure 8. The RF-driven CO2 laser used for modulation experiments [6]. The waveguide was filled with a gas mixture of He:CO2:N2:Xe, in the ratio of
77:10:10:3, respectively. Walsh also used this gas mixture [16]. During the work
presented in section 2-4-2 a gas mixture of He:CO2:N2:CO in the ratio of 65:18:15:2 was
used, respectively. The ratio of this gas mixture was not thought to be optimized;
therefore, He:CO2:N2:Xe is thought to be a better mixture. This mixture was
commercially purchased for a pulsed CO2 laser. It was determined by measuring the
infrared power at different pressures that the laser had its highest infrared power output
(around 1 Watt) at approximately 82-torr. The laser’s waveguide was filled with the aid
of the apparatus seen in Figure 9. On the left side of Figure 9 is the enclosure in which
the laser and other power component are housed. On the right side is the apparatus for
filling the waveguide with the gas mixture. This apparatus has plumbing on the reverse
side that connects the gas tank, vacuum, and laser. On the front face are knobs to fill and
evacuate the system of the gas mixture. Also on the front face is a pressure meter
(Wallace and Tiernan Model FA160) to conveniently view the gas mixture pressure.
28

Figure 9. On the left is the laser housing. This kept the RF power from interfering with other electronics. On the right is the gas filler and evacuator.
The laser was driven at approximately 60-MHz with a power output of
approximately 30-watts. From Figure 8 the two aluminum heat sinks are the most
dominating feature of the laser. These not only serve as a way to cool the ceramic
waveguide, but also act as RF electrodes. One of the electrodes is grounded. On the top
of the laser there are two air wound inductors. One helps match the impedance of the
laser to the 50-ohm coaxial cable that supplies RF power and the other acts as an
autotransformer to couple RF power to the electrodes.
The system used to supply RF power to the autotransformer is shown
schematically in Figure 10. Approximately 60 MHz was supplied with a signal generator
(Tektronix Type 191, Serial number 005793) to an amplifier (Amplifier Research, Model
4W 1000). This amplified frequency was then sent through a wideband RF power
amplifier. This RF power amplifier is a Motorola Semiconductor Product that is a 300
watt unit with a frequency range of 10 to 150 MHz [4]. The circuit board was powered
by its own DC power supply (Hewlett Packard 6653A, serial number 3640A02978). To
keep the wideband RF power amplifier from overheating it was mounted on a copper
29

Figure 10. Schematic inside the RF insulated housing. The components that supply an RF signal to the laser are shown.
30

heat plate mounted to an aluminum heatsink. A cooling fan was mounted on the heatsink
to cool the entire assembly. Finally, the wideband RF amplifier signal passed through a
power meter (Bird Electronic Corporation) before connecting to the autotransformer and
matching inductor on the laser. The back end of the laser, with the 150 mm-1 flat grating
mounted on a piezoelectric actuator, is connected to a lock-in stabilizer (Lansing, model
80.215) with a SHV cable. As can be seen from Figure 9 and Figure 11, an enclosure
was built to house the laser and most of the components mentioned above. Only the RF
signal generator and lock in stabilizer are outside of the housing. The housing is made of
insulated panels and wire mesh screening (for cooling) and joined together with
structural rails. This was done to keep the RF signal from interfering with the modulator
and other pieces of electronics. One side of the housing has a door on it for access and
this side is shown in Figure 11.
3-2. Stark-Effect Modulator
As noted in chapter two, most Stark-effect modulators consist of two parallel
electrodes that are placed inside a dielectric tube that is typically made of glass or
ceramic and is under partial atmospheric pressure. Expansion of a laser beam through a
structure with closely spaced electrodes causes a loss of light due to vignetting of the
beam by the electrodes [7]. Therefore, this project design used a hollow dielectric glass
tube that acts as a dielectric waveguide. The tube is held between two metallic
electrodes. The laser beam is focused into the tube and the size of the focused beam is
designed to match the EH11 low order mode of the waveguide [7]. The dielectric
waveguide transmits over 90% of the incident laser radiation to minimize the loss of
light. Figure 12 and 13 show schematics and Figure 14 is a picture of the modulator.
31

Figure 11. Inside the RF insulating housing. The laser is located at the base of the picture. Some of the components that supply power to the laser are shown.
32

Figure 12. Side view of the Stark-effect modulator. There are two SHV connections. They are both used to apply an AC bias signal. Also, there are two
BNC connections. One is used to apply an RF signal. The other is used to monitor the AC bias voltage.
33

Figure 13. Cross section of the Stark-effect modulator. The AC bias voltage is supplied to the set screws. Since the set screws make contact with the electrodes,
this is how the AC bias voltage is supplied to the electrodes.
34

Figure 14. Picture of Stark-effect modulator.
The waveguide material used in the Stark-effect modulator is borosilicate glass.
It measures 36-cm long with an inner diameter of 1.8-mm and an outer diameter of 3-
mm. Both ends of the waveguide are sealed to the ZnSe windows. This seal was created
by machining cylindrical aluminum connectors that fit around the ends of the waveguide
and were sealed in place with epoxy. Then these ends were fastened to the ZnSe
Brewster window casings with manufactured bolts designed for the casings. This was
required to provide a method for filling and evacuating the cell. The ZnSe window cells
were connected to the mixed gas tank and the vacuum pump as shown in Figure 12. The
waveguide is suspended between two 1-cm wide by 36-cm long flat aluminum
electrodes. To mount the waveguide, two pieces of lexan were used. These are labeled
Lexan Support Stand and Lexan Insert in Figure 13. They not only provide support, but
also align the electrodes and enhance the electric field in the waveguide. The electrodes
were held in place with set screws that run the length of the electrodes. In addition, the
screws near the SHV connectors were supplied with the AC bias signal. There are two
35

BNC connectors. One BNC plug applies the RF data signal. The other BNC plug
monitors the AC bias voltage.
3-2-1 Molecular Gas Filling
It was mentioned in section 2-4-1 that deuterated ammonia, specifically NH2D
was the first gas chosen to fill the modulator with. The NH2D was formed by combining
2 parts ND3 with 1 part NH3. This was accomplished with two commercially purchased
bottles of ND3 and NH3 and one mixing tank. A specially fabricated plumbing unit mixes
the molecular gas in a mixing tank, to supply the gas to the modulator, and to evacuate
the modulator into the vacuum. This device is viewed in Figure 15. The metal plate with
the turning valves on the front is this device. It is placed in front of the modulator. The
three tanks mentioned above are seen tied down to the optical table in the left view of this
picture. A schematic view of the back side of the filling device is seen in Figure 16.
Figure 15. The NH2D gas is formed and supplied to the modulator here.
36

Figure 16. A schematic drawing of plumbing for the gas filling apparatus.
3-2-2 AC Biasing
A problem with the electrodes being external to the waveguide is that charge
build-up results inside the waveguide from stray ions and electrons [7]. One electrode is
supplied with a positive voltage while the other receives negative voltage. If a dc electric
field is applied to the modulator stray electrons will be attracted to the positive electrode
and the stray ions will be attracted to the most negative electrode. The resulting charge
build-up in the modulator results in a cancellation of the electric field inside the
waveguide. This means no modulation will occur. During the experiment performed by
Hutchinson et al. [7], it was noticed that a finite time was required for the charge to build
up and cancel the electric field. Therefore, an AC biasing method was developed [7].
The AC biasing was accomplished by using a circuit that generates a low frequency
(around 100 to 1000 Hz) square wave.
37

Figure 17 is the circuit that produces the AC bias voltage. Approximately ±800-V
was applied to the modulator. The amplifiers were connected to the modulator plates in a
bridge configuration, meaning that each amplifier was supplied with 400-V and -400-V.
The amplifiers used for this were high voltage power operational amplifiers made by
APEX Microtechnology, Model PA94. The waveform produced is seen in Figure 18.
In Figure 18 the applied AC bias voltage produces an AC bias signal that is only
proportional to the magnitude. This is shown on the right of Figure 18. To understand
this phenomenon, the selection rule for absorption says that the electric field be applied
perpendicular to the electric field of the optical beam [7]. Referring to Figure 5 and 6 the
polarity of the electric field is not important. For example, if the electric field is applied
with the positive electrode on the right and the negative electrode on the left or vice
versa, the absorption curves in Figure 5 and 6 will not be changed [7].
Figure 17. The bridge circuit designed for an AC bias signal. The EK19 kit made by APEX Microtechnology was used for the bridge circuit.
38

39
Figure 18. The applied AC bias on the left produces the equivalent to a steady “DC” bias as shown on the right [7].
To physically apply the AC bias to the modulator the following set up was used
and is schematically shown in Figure 17. A 30-Mhz synthesized function generator
(Stanford Research Systems, Model DS345) supplied a low-frequency square wave. This
square wave was amplified by two amplifiers. Therefore, each amplifier produced half of
the total voltage across the electrodes. One amplifier was a non-inverting high voltage
amplifier and the other was an inverting high voltage amplifier. Each amplifier was
supplied with high voltage from two DC power supplies (Kepco HP525M). One of the
DC power supplies provided a negative voltage and the other DC power supply provided
positive voltage for the bridge circuit amplifiers.
3-3 Data Addition
The ultimate goal of this project is to transmit an RF data signal. Therefore, to
properly modulate the laser beam the polarity of the AC bias voltage must match the
polarity of the RF data waveform [7]. Figure 19 shows how the polarity of the bias and
data waveforms matches each other. When the AC bias voltage is applied, the voltage
+800-V
-800-V
+800-V

40
Figure 19. The bias and data waveforms must match in polarity to modulate correctly [7].
should be seen at the modulator, but filtered out of the signal portion of the circuit. The
same can be said for the signal side of the circuit. The RF data signal should appear at
the modulator, but should be filtered from reaching the bias side. The RF data signal was
applied at the signal input, and is a generic sinusoidal wave that is created with a function
generator (Stanford Research Systems, Model DS345). The sinusoidal wave is capable
of being altered in frequency between 0 to 30-MHz and in amplitude from 0 to 10-V.
Greater than 10-V of RF drive amplitude was desired; therefore, a step-up
transformer was built into the circuit shown in Figure 20. The step-up transformer is
fabricated with an iron-core that has 4-turns in the primary and 20-turns in the secondary
(1:5 ratio). Unfortunately this did not result in enough RF drive (8-V). The 10-V of RF
drive amplitude never reaches the primary coil; rather an internal 50-ohm load lowers the
voltage before reaching the primary coil. The number of windings in the primary coil
and the iron-core was varied. Also, a matching coil was inserted into the circuit. In the
end not enough gain was achieved to optimize the modulation. Although more RF drive

Figure 20. An electrical schematic of the modulator circuit. The AC-bias is supplied through the SHV connections. The RF data signal is input on the other side of the modulator through the BNC connection. Finally, the other BNC plug
monitors the AC-bias voltage.
was desired it did not limit the RF signal from being transmitted. The fact that an RF
signal was transmitted made the project a success. This circuit requires more research to
obtain more drive and determine the optimum operating parameters for the modulator.
3-4 Experimental Arrangement
The laser beam was oriented perpendicularly to the modulator. Therefore, the
beam was first directed off of a reflecting mirror to place the beam on the same optical
axis as the modulator. From the reflecting mirror, the beam was sent through a lens to
focus it into the proper size to form a match to the EH11 waveguide mode of the dielectric
tube [7]. Once the beam passed through the modulator waveguide it was redirected with
another reflecting mirror towards the detector placed on a different optical table. The
detector was placed on a different optical table to give it distance from the RF signal
created by the laser and modulator. Once the beam was sent from the second reflecting
41

mirror, it passed through a lens placed on the other optical beach to focus the beam into
the detector. The detector was a liquid-nitrogen cooled mercury-cadium-telluride
(HgCdTe) infrared detector. A picture of the experimental arrangement just described is
depicted in Figure 21. Also, Figure 22 is a schematic that shows the path of the laser
beam and the system to detect the RF signal and apply the AC bias.
Figure 21. A picture of the experimental arrangement. The laser is located in its insulating housing on the left, with the modulator in the center, a detector near the
right. Later the new detector was located on an adjacent optical table.
42

Figure 22. This is a schematic diagram of the experimental arrangement. Everything on the right is on one optical table. The equipment on the left was
placed on an adjacent optical table. The dotted red line represents the laser beam. The components within the dotted lines are those shown in Figure 20.
43

Chapter 4:
Results
This thesis originally used a Stark-effect modulator constructed of ceramic
measuring 36-cm long with an inner diameter of 0.9-mm. An attempt to characterize this
modulator produced an electrical breakdown in the waveguide and prevented the
development of sufficient voltage for modulation. Approximately 800-V were applied to
the modulator, yet no Stark components were observed due to a breakdown in voltage at
600-V. The M = 4 and M = 3 peaks could not be observed as they were in the results
produced by Hutchinson et al [7].
The ceramic waveguide was replaced with a borosilicate glass waveguide of the
same length, but with a larger diameter. The inner- and outer- diameter of the new
waveguide measured 1.8-mm and 3-mm, respectively. It was thought that the ceramic
waveguide had many surface imperfections. Thus, this imperfection was a theory for the
breakdown. Borosilicate glass should have a smoother surface than ceramic. A more
perfect surface should create a more even electric field and should alleviate breakdown.
The larger diameter waveguide required a larger separation between the
electrodes. A result of the greater electrode separation was a smaller electric field for a
given applied voltage. Consequently, observations of the Stark components required
larger applied voltage. Figure 23 represents the transmission versus applied voltage for
this larger diameter cell, clearly showing that a larger voltage was required to observe the
M = 4 component. This is a disadvantage of the larger diameter waveguide.
44

Transmission vs. Applied Voltage for a Borosilicate Glass Waveguide, 36-cm X 1.8-mm i.d.
0
0.2
0.4
0.6
0.8
1
1.2
0 200 400 600 800 1000 1200 1400
Applied Voltage (Volts)
Nor
mal
ized
Tra
nsm
issi
onn
Theoretical 10 TorrTheoretical 15 TorrExperimental 15 TorrExperimental 10 Torr
M = 4
Figure 23. Normalized Transmission vs. Applied Voltage. There is good agreement between the theoretical model and experimental results.
The theoretical model was reevaluated for the new dielectric constant and
diameter size of the waveguide. Also, the transmission at different applied voltages was
recorded for the new design and compared to the model. This comparison characterized
the modulator and is graphed in Figure 23. Figure 23 shows theoretical lines based on
the model for 15-torr and 10-torr. The other two lines are based on experimental
measurements. The measurements represent averaging experimental trials under the
same modulator pressure. They show excellent correlation with the theoretical lines of
their same pressure. The present bias voltage system does not allow for higher voltages
to be reached. This is because the high voltage power operational amplifier (Apex PA94)
has a high voltage output capability of ±400-V. A bridge circuit was used for the two
45

operational amplifiers. One was classified as inverting and the other non-inverting. Both
were applied with -400-V and +400-V. This applied voltage results in a total availability
of 800-V for the system. Figure 23 it appears has the M=4 peak occurring at 1000-V.
Although not enough applied voltage is available to reach the Stark components,
it is not necessary to transmit data. A constant bias voltage between 700 to 800-V was
applied to the electrodes based on the values observed in Figure 23. An area where the
slope of the transmission line is steep is ideal for the CO2 laser emission to transmit an
RF data signal. If a bias voltage is chosen at a location along the transmission trend
where the slope is not steep an RF data signal cannot be transmitted as well. This fact is
represented with the aid of the transmission curve shown in Figure 24. Figure 24 was
created with the model at 15-torr of NH2D. The trend described as the “drive,” represents
an RF sinusoidal signal applied to the modulator. Essentially this is a generic data signal
to test the system. The peak-to-peak voltage of the drive was 8-V. When it contacts the
transmission curve it is transmitted by the modulator. Because the peak-to-peak voltage
of the drive was small, a very weak signal is transmitted. Ideally, a much larger peak-to-
peak drive voltage is desired to optimize modulation. Unfortunately the step-up
transformer shown in Figure 20 was not able to amplify the drive signal better. A drive
voltage of approximately 100-V peak-to-peak would be more ideal for this modulator.
Therefore, this needs more investigating. The thesis is still considered a success. The
goal was to transmit an RF signal and this was accomplished.
The transmitted RF signal is depicted in Figures 25 and 26. This signal was
detected with a liquid-nitrogen HgCdTe detector. This sensitive detector was required
because the RF drive voltage was small. Also, an analog oscilloscope was used instead
46

Transmission vs. Applied Voltage for a 36-cm X 1.8-mm i.d. Borosilicate Waveguide at 15-torr
0
0.1
0.2
0.3
0.4
0.5
0.6
0.7
0 100 200 300 400 500 600 700 800 900 1000 1100
Applied Voltage (Volts)
Tran
smis
sion
Transmission CurveDriveTransmission
Figure 24. The RF drive signal had 8-Vpp driven to the modulator. This resulted in a small RF transmission signal. The red curve is the 8-Vpp of sinusoidal RF drive applied to the modulator. When it contacts the transmission curve it is carried to the detector by the CO2 laser. The transmitted curve is represented by the blue
trend.
47

RF Off
RF On
Figure 25. This is the detected RF transmission. The horizontal scale is 0.2-ms/division, while the vertical scale is 10-mV/division. The area labeled as “RF On” represents the area where the detector has detected RF signal. The “RF Off” region has no signal. The background signal in the “RF Off” region is due to interference from other sources such as the RF excitation of the CO2 laser. The RF was turned
off by modulating the RF function generator source with the AC bias function generator.
48

Figure 26. This shows the transmitted RF sinusoidal signal. The horizontal scale is 200-ns/division, while the vertical scale is 10-mV/division. This view of the
transmitted signal is a “zoomed in” version of the “RF On” region of Figure 25, with an expanded horizontal scale. It clearly shows the RF sinusoidal signal was
successfully transmitted.
49

of a digital oscilloscope. The available digital oscilloscope did not have sufficient
sensitivity to reliably display the small RF transmission signal. The analog oscilloscope
was able to highlight the small RF transmission signal. The analog oscilloscope was
satisfactory for viewing the signal; however, more accurate analysis could have been
obtained with the measurement capabilities of a digital oscilloscope. A high frequency
lock-in amplifier was used to measure the transmitted RF signal amplitude, with a digital
meter connected to its output to make quantitative measurements of the transmission
signal.
Figure 25 has regions labeled “RF On” and areas labeled RF Off.” The area
labeled “RF On” is the transmitted RF sinusoidal signal. Figure 26 shows the “RF On”
region “zoomed” into. When zoomed into, the transmitted RF sinusoidal signal can be
clearly observed. This provides excellent evidence that the modulator functions since the
transmitted and detected RF frequency and amplitude is observed to be closely correlated
with that used to drive the modulator. Figure 25 also has regions labeled “RF Off.” Here
the function generator supplying the RF drive was modulated with the function generator
supplying the AC bias signal. The reason for the “RF Off” was to eliminate the
switching transients created by the AC biasing. It appears that a background signal is
measured at the “RF Off” region in Figure 25. This background was confirmed to be RF
interference that may have developed from the 60-MHz RF used to excite the CO2 laser.
Three separate measurements of the transmitted RF sinusoidal signal were taken
under the conditions described above. Under these conditions, the optimum drive
frequency was determined to be 16.4 MHz. This was true for all reasonable operating
pressures.
50

A second measurement surveyed for saturation of the transmitted signal.
Consequently, the peak-to-peak voltage of the RF drive signal was varied and the
amplitude of the received signal was observed. The result is given in Figure 27. Here, as
the voltage of the drive is increased, the amplitude of the received signal also increases.
The saturation is dependent on the transmission curve slope, shown in Figure 24. Thus,
this would be a more interesting measurement with large RF drive because it would cause
the slope to vary more.
Finally, the transmitted RF signal amplitude was measured as a function of
modulator pressure. This was studied to determine the optimum operating pressure, and
to compare with theory (see appendix for calculation). The theory is based on a quantity
called the figure of merit. The figure of merit is the modulation index multiplied by the
average transmission signal. The modulation index divides the difference of the
transmission signal by the difference of drive signal. Figure 28 compares the theoretical
model for the figure of merit to the experimental results of the figure of merit, as a
function of modulator pressure. The most obvious result is that the experimental results
are shifted to the right with respect to the model. According to the model the optimum
operating pressure is 9-torr, while the experimental trend displays an optimum at 12-torr.
This requires further investigation, but there is a possible explanation. It may be that the
modulator requires higher drive voltages to accurately reproduce the pressure-
dependence exhibited by the model in Figure 28. Nevertheless, the trends shown in that
figure are similar in their behavior.
51

Normalized Measured RF Signal Amplitude vs. Drive Signal of a 36-cm X 1.8-mm i.d Ceramic Waveguide at 15-
torr
0
0.2
0.4
0.6
0.8
1
1.2
0 2 4 6 8 10 1
Drive Signal (Vpp)
Nor
mal
ized
Mea
sure
d R
2
FSi
gnal
Am
plitu
de (V
)
Figure 27. Normalized Measured RF Signal Amplitude vs. Drive Signal. The Measured RF Signal Amplitude was normalized to the largest measured amplitude.
This verifies that along the transmission curve, shown in Figure 24, no saturation was measured.
52

Figure of Merit vs. Pressure for a 36-cm X 1.8-mm i.d. Ceramic Waveguide with 10-Vpp of Drive Signal
0
0.2
0.4
0.6
0.8
1
1.2
0 5 10 15 20 25
Pressure (torr)
Figu
re o
f M
erit
ExperimentalResults
TheoreticalModel
Figure 28. Figure of Merit vs. Pressure. According to the theory the optimum operating pressure is 9-torr for NH2D. The experimental result points to an
optimum pressure of 12-torr of NH2D.
53

Chapter 5:
Conclusion
Prior to this thesis, Hutchinson et al. [7] had characterized the DC performance of
a Stark-effect modulator. Their characterization was for a Stark-effect modulator with a
borosilicate waveguide that measured 20-cm long and had an inner diameter of 0.9-mm.
This thesis used a Stark-effect modulator with a borosilicate waveguide that measured
36-cm long and had an inner diameter of 1.8-mm. This increased length allows for
greater modulation amplitude. The goal of this thesis was to transmit an RF data signal
for the first time. Before an RF signal could be transmitted, the new Stark-effect
modulator had to be characterized. The Stark-effect modulator was successfully
characterized. The characterization was considered a success because it matches the
predicted model. The match of the model and the experimental results are graphed in
Figure 23. This experiment offers confidence that the theory is understood.
According to the characterization of this particular Stark-effect modulator,
approximately 600- to 1000-V of total applied bias voltage to the modulator should be
sufficient to transmit data. At an applied voltage of 700-V an RF sinusoidal signal was
transmitted. An applied voltage of 700-V was used because 800-V was the maximum
capability of the available AC bias system. The transmitted RF signal was successfully
detected by a receiver. This result provides a prototype for a future LWIR free-space
communication link.
54

The RF modulator drive signal had 8-V peak-to-peak voltage. This small drive
voltage resulted in a small RF transmission signal. Therefore, a sensitive liquid nitrogen
cooled HgCdTe detector was required to detect the RF signal. A method to increase the
drive signal needs to be developed for a better prototype. Hopefully this will be solved in
the future.
Measurements of the RF transmission signal amplitude were taken. First, it was
verified that saturation of the transmitted signal did not occur as the RF drive signal was
increased. Rather, the transmitted RF signal increased as the RF drive amplitude was
increased. Saturation could be present with a larger RF drive signal, since applied
saturation is dependent on the transmission curve slope.
Next, the greatest transmitted RF signal amplitude results from a modulation
frequency of 16.4-MHz. The transmitted RF signal drops in magnitude at both higher
and lower frequencies. This only holds true for the current circuit arrangement. By
altering the step-up transformer shown in Figure 20, the optimum frequency can be
changed.
Finally, the RF signal transmission was optimized with a modulator pressure of
12-torr, according to the experimental values. This was not confirmed by the model,
which predicts that the maximum transmission should occur at 9-torr of NH2D. While
the peak values are different, the trends are the same, only shifted from each other.
While more optimization is clearly required before the modulator may be
integrated into a LWIR free-space communication link, the work of this thesis has been
successful in demonstrating that the dielectric Stark-effect modulator is capable of
transmitting data at RF bit-rates.
55

Besides optimizing the pressure and RF drive signal, the molecular gas and laser
line may be optimized. There are potentially many more ammonia isotopes and CO2
laser isotopes to experiment with. The best combinations of lasing and absorption
transitions need to be identified. Thus far only two transitions have been identified in
literature and from this thesis. The reason to study this is to determine which
combination may result in the lowest drive voltage. A lower drive voltage could result in
higher speed operation. The goal of the future LWIR free-space communication link is
2.5-Gbits/sec over a range of >6 kilometers. Thus, the best transition of ammonia and
CO2 needs to be found.
56

References
57

[1] C.K. Asawa and T.K. Plant, “Wideband modulation of the C13O216 laser R(18) line at
10.784 µm with an N14H3 Stark Cell,” Appl. Phys. Lett., vol 30, no 2, January 15, 1977, pp 96-98. [2] R.G. Brewer, M.J. Kelly, and A. Javan, “Precision Infrared Stark Spectra of N14H2D Using Lamb Dip,” Phys. Rev. Lett., vol 23, no 11, September 15 1969, pp. 559-563. [3] P.C. Claspy and Y.H. Pao, “Basic Characteristics of High-Frequency Stark-Effect Modulation of CO2 Lasers,” IEEE J. Quantum Electronics, vol QE-7, no 11, November 1971, pp. 512-519. [4] H.O. Granberg, “Wideband RF Power Amplifier,” Motorola Semiconductor Products. [5] HITRAN, Molecular Line Database, U.S. Air Force, 1996. [6] D.P. Hutchinson, R.K. Richards, M.D. Chidley, and J.T. Simpson, “All Weather Long-Wavelength Infrared Free Space Optical Link for FCS vehicle to vehicle Communications,” 23rd army science conference, Orlando, fl, Dec 2-5, 2002. [7] D.P. Hutchinson, R.K. Richards, J.T. Simpson, M.L. Simpson, “All Weather Long-Wavelength Infrared Free Space Optical Communications,” SPIE, vol 4821, pg 44-49. [8] A.R. Johnston and R.D.S. Melville, Jr., “Stark-Effect Modulation of a CO2 Laser by NH2D,” Appl. Phys. Lett., vol 19, no 12, December 15 1971, pp. 503-506. [9] R. Karplus, “Frequency Modulation in Microwave Spectroscopy,” Phys. Rev., vol.73, no 9, May 1, 1948, pp. 1027-1034. [10] A. Landman, H. Marantz, and V. Early, “Light Modulation by Means of the Stark Effect in Molecular Gases-Application to CO2 Lasers,” Appl. Phys Lett., vol 15, no 11, December 1, 1969, pp. 357-360. [11] B.P. Lathi, “Signal Processing and Linear Systems,” (Berkeley Cambridge Press, Carmichael, CA, 1998). [12] F.L. Pedrotti, S.J. and L.S. Pedrotti, “Introduction to Optics,” (Prentice Hall, Upper Saddle River, NJ, 1993). [13] T.K. Plant and R.L. Abrams, “Broadening and absorption coefficients in N14H2D,” Appl. Phys., vol 47, no 9, September 9, 1976, pp. 4006-4008. [14] F. Shimizu, “Stark Spectroscopy of NH3 2 Band by 10-µ CO2 and N2O Lasers,” Chem. Phys, vol 52, no 7, April 1, 1970, pp. 3572-3576.
58

[15] C.H. Towes and A.L. Schawlow, “Microwave Spectroscopy,” (McGraw-Hill, New York, 1955). [16] C.J. Walsh, “An RF excited circular waveguide CO2 laser,” Rev. Sci. Instrum., Vol 61, no 9, Sept. 1990.
59

Appendix
60

Multiple M-Level Contributions for a Stark Modulator
Electrode Spacing. dia 0.356 cm:=
Cell Length. l 35.56 cm⋅:=
Doppler Width. bd 82 MHz⋅:=
Eo 3800
Vcm⋅:= Electric field required to offset absorption to laser line
center. Non-electrified beam region in modulator. lfree 15.96 cm⋅:= Pressure Broadening Coefficient. C 32 106
⋅Hztorr⋅:=
Fraction of NH2D. κ .44:=
efactor 1.35795:=From e-field modeling.
ε0 2189 MHz⋅:=Frequency offset of laser line center.
γH 0.05 cm 1−
⋅:= Absorption Coefficient. Math counter to calculate curve. i 1 120..:=
Pk ktorr:=Operating pressure in cell.
k 1 25..:=
Sj 0.568106⋅
j 4−
4⋅
Hz cm⋅
V⋅:= M - Level Dependent Stark Shift.
j 0 8..:= Applied voltage. Vi 10 i⋅ V⋅:=
61
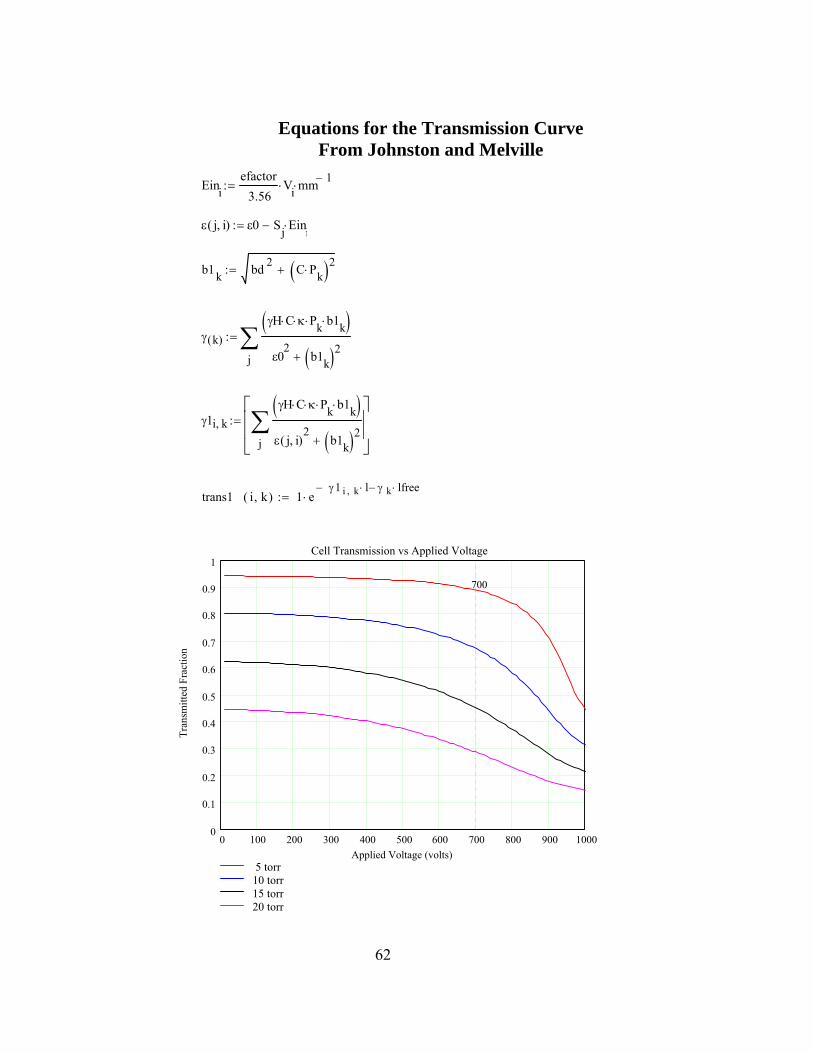
Equations for the Transmission Curve
From Johnston and Melville
Einiefactor
3.56Vi⋅ mm 1−⋅:=
ε j i,( ) ε0 Sj Eini⋅−:=
b1k bd 2 C Pk⋅( )2+:=
γ k( )
j
γH C⋅ κ⋅ Pk⋅ b1k⋅( )ε0
2b1k( )2+
∑:=
γ1i k,
j
γH C⋅ κ⋅ Pk⋅ b1k⋅( )ε j i,( )
2b1k( )2+
∑⎡⎢⎢⎣
⎤⎥⎥⎦
:=
trans1 i k,( ) 1 eγ1 i k,− l⋅ γ k lfree⋅−
⋅:=
0 100 200 300 400 500 600 700 800 900 10000
0.1
0.2
0.3
0.4
0.5
0.6
0.7
0.8
0.9
1
5 torr10 torr
Cell Transmission vs Applied Voltage
Applied Voltage (volts)
Tran
smitt
ed F
ract
ion
700
15 torr20 torr
62

Modulation Index
modindex75 k( )trans1 73 k,( ) trans1 81 k,( )−( )trans1 73 k,( ) trans1 81 k,( )+
:=
modindex100 k( )
trans1 75 k,( ) trans1 85 k,( )−( )trans1 75 k,( ) trans1 85 k,( )+
:=
modindex150 k( )trans1 69 k,( ) trans1 85 k,( )−( )trans1 69 k,( ) trans1 85 k,( )+
:=
0 5 10 15 20 250
0.05
0.1
0.15
Modulation Index vs Pressure
Pressure (torr)
Mod
ulat
ion
Inde
x
63

Figure of Merit
mod75k modindex75 k( )
trans1 73 k,( ) trans1 81 k,( )+( )2
⋅:=
mod100k modindex100 k( )trans1 75 k,( ) trans1 85 k,( )+( )
2⋅:=
mod150k modindex150 k( )trans1 69 k,( ) trans1 85 k,( )+( )
2⋅:=
0 5 10 15 20 250
0.02
0.04
0.06
0.08
0.1Figure of Merit
Pressure (torr)
Mod
ulat
ion
Figu
re o
f Mer
it
64
Vita
Ryan Lane Holloman was born in Albuquerque, New Mexico, on November 22, 1979 to
Charles and Pamela Holloman. He was raised in Westminster, Colorado, and graduated
from Standley Lake High School in 1998. He received a Bachelor of Arts in physics
from the University of Northern Colorado in 2002. While an undergraduate, he
participated in two National Science Foundations sponsored Research Experience for
Undergraduates (REU) programs. The first appointment was at Kansas State University,
during the summer of 2000. While there, Ryan worked in experimental atomic physics
trapping Rubidium atoms with a Magneto-Optical Trap (MOT). During the summer of
2001, Ryan attended the University of Massachusetts Lowell. There he worked in health
physics, characterizing the response of UML’s stack monitor system designed for their 1
MW research reactor. In 2005 Ryan received his Master of Science degree in physics
from the University of Tennessee, and performed his thesis research at the Oak Ridge
National Laboratory.
65