a south african produced technical analysis software
TRANSCRIPT

PDSnet – Share Trading Software and Education
Share Trading Software & Education | Progress Data Services
A South African produced technical analysis software package, including EOD and hourly
pricing for all JSE indices, equities, unit trusts, etfs, commodities, currencies, financial
futures, agricultural futures, warrants and international market indices.

2
PDSnet - Share Trading Software and Education 011 622 6767
Progress Data Services 29B Whittakers Way
Bedfordview Germiston
2007
Phone: +27 11 622 6767
www.pdsnet.co.za
FOLLOW US ON

3
PDSnet - Share Trading Software and Education 011 622 6767
Table of Contents Introduction ............................................................................................................................................ 4
Product Benefits...................................................................................................................................... 5
Why ShareFriend? ................................................................................................................................... 6
Around For Years: ............................................................................................................................... 6
Large User Base: .................................................................................................................................. 6
Flexibility ............................................................................................................................................. 7
Scanning Ability ................................................................................................................................... 7
Software Features ................................................................................................................................... 7
The Quick Access Menu ...................................................................................................................... 8
Scans ................................................................................................................................................... 9
Overall Market View ....................................................................................................................... 9
The Market Carpet ........................................................................................................................ 10
The Market Scan ........................................................................................................................... 10
The Unit Trust Scan ....................................................................................................................... 11
Company Information ....................................................................................................................... 12
Your Watchlist of Shares ................................................................................................................... 12
Portfolio Manager ................................................................................................................................. 14
Simulation ............................................................................................................................................. 15
Indicators .............................................................................................................................................. 17
The Overbought/Oversold Indicator ................................................................................................. 17
MACD Indicator ................................................................................................................................. 17
RSI Indicator ...................................................................................................................................... 18
Momentum Indicator ........................................................................................................................ 18
On Balance Volume ........................................................................................................................... 18
Dividend Yield ................................................................................................................................... 19
List of All Indicators Included ................................................................................................................ 20

4
PDSnet - Share Trading Software and Education 011 622 6767
Introduction
At PDSnet we pride ourselves in supplying quality stock market charting and educational products. Having been in the market for over three decades, our software packages are the most up-to-date, user-friendly and comprehensive in the country.
Continuously updated and developed, ShareFriend is our own brand of charting software which was the first on the South African market in the 90’s. With all its tools, including the most accurate data available in the country and an extremely user-friendly interface on which to analyse the stock market, your goal of financial success will be reached sooner.
It’s perfect for the beginner or the professional investor, and includes, amongst other things, multiple moving averages, technical indicators as well as fundamental analysis tools, which will give you the ability to choose the right shares at the right time.

5
PDSnet - Share Trading Software and Education 011 622 6767
Product Benefits
The ShareFriend software was developed in the 90’s and has been updated
and improved over the years to ensure that the share market investor has
everything he needs to quickly and accurately analyse the market at the tips of
his fingers.
By using the ShareFriend software, you are able to:
• Grow your capital faster and earn greater returns than any other
investment vehicle.
• Reach financial independence which will enable you to:
➢ Resign from your job.
➢ Earn the bulk of your income from home.
➢ Spend more quality time with loved ones.
➢ Gain financial control.
• Ensure that your money is able to support you comfortably in your
retirement.

6
PDSnet - Share Trading Software and Education 011 622 6767
Why ShareFriend?
When choosing charting software it is important that you look at certain criteria. This will ensure that you do not waste time or money.
The ShareFriend software ticks all of these boxes. We can proudly say that our product offers good value for money, and is sold ethically and responsibly with the hope of helping our clients reach their goals of financial independence.
Around For Years:
You want to be assured of your software’s reliability in terms of both data supply and support. The ShareFriend software was the first of its kind in South Africa. Since its launch in the 90's it has been developed and maintained by expert software developers who are in touch with the latest in market needs and technical analysis charting features.
Large User Base:
A large user base ensures that there is available support and constant development. Because the ShareFriend software has been around for so long, its user base is extensive and our support team is available from 8am to 6pm daily. As well as this, our software is regularly updated with new features and abilities, helping you to recognise opportunities in the market and invest your money soundly.

7
PDSnet - Share Trading Software and Education 011 622 6767
Flexibility
Finding a charting package that is flexible allows you to enter your own analysis parameters. This gives you the options and placidity you need to do the thorough analysis that is needed when buying and selling shares. The ShareFriend software has many different indicators and mechanisms that you can use to narrow down which sectors are performing well, and which shares are worth buying.
Scanning Ability
It is important to find a charting package with a good scanning feature so that opportunities in the market can be identified and acted upon. The ShareFriend software offers multiple scanning abilities which will allow you to analyse different sectors of the market thoroughly and identify the opportunities which are worth investigating further.
Software Features
The ShareFriend software has been designed from the bottom up to provide a
technical analysis tool to anyone interested in investing on the JSE.
Technical indicators coupled with up to date end of day confirmed prices
containing high, low, volume, open and closing figures for all equities quoted
on the JSE (Johannesburg Stock Exchange), futures, unit trusts, currencies and
commodities as well as many of the major international indices.

8
PDSnet - Share Trading Software and Education 011 622 6767
The Quick Access Menu
The ShareFriend software has been designed to be
as user-friendly as possible, ensuring that your
experience is productive and hassle free.
One of the features that allows for this is the quick
access menu which enables you to right click
anywhere on a chart and quickly access the most
valuable features on your software.
Within this menu you can quickly add a share to
your Watchlist or your Favourites. You are able to
quickly open a data window onto your chart which
gives you precise share market data accurate to
the point of your cursor.
These are just some of the features which you have access to at literally the
click of your mouse.

9
PDSnet - Share Trading Software and Education 011 622 6767
Scans
One of your major problems as a share market investor is narrowing down the
market to the shares which present the best opportunities. The ShareFriend
software has multiple scans which can accurately dissect the market, allowing
you to focus on areas or specific shares with the most profit potential.
Overall Market View
The Overall Market View is a scan showing you the indices that have grown,
remained the same or dropped in value over a period of time.
The Overall Market view acts like a barometer on the stock market.
Choosing periods from 1 day to 5 years you get an immediate feel for how each sector is performing.
The left side shows a performance bar graph of each of the sectors and the top right hand area contains a graph of the sector and just below that are the current top five sectors up and the top five down.

10
PDSnet - Share Trading Software and Education 011 622 6767
The Market Carpet
Like the Overall Market View, Market Carpets gives a visual representation of how sectors and shares within the sectors are performing.
As with all the other features in ShareFriend Pro, Market Carpets is very user friendly and instantly shows miniature graphs of each active sector plus the top 5 and bottom 5 performing sectors.
The Market Scan
This Market Scan is brim-full of features allowing users to scan the entire
database using technical indicators as well as fundamental factors or both
simultaneously.
11
PDSnet - Share Trading Software and Education 011 622 6767
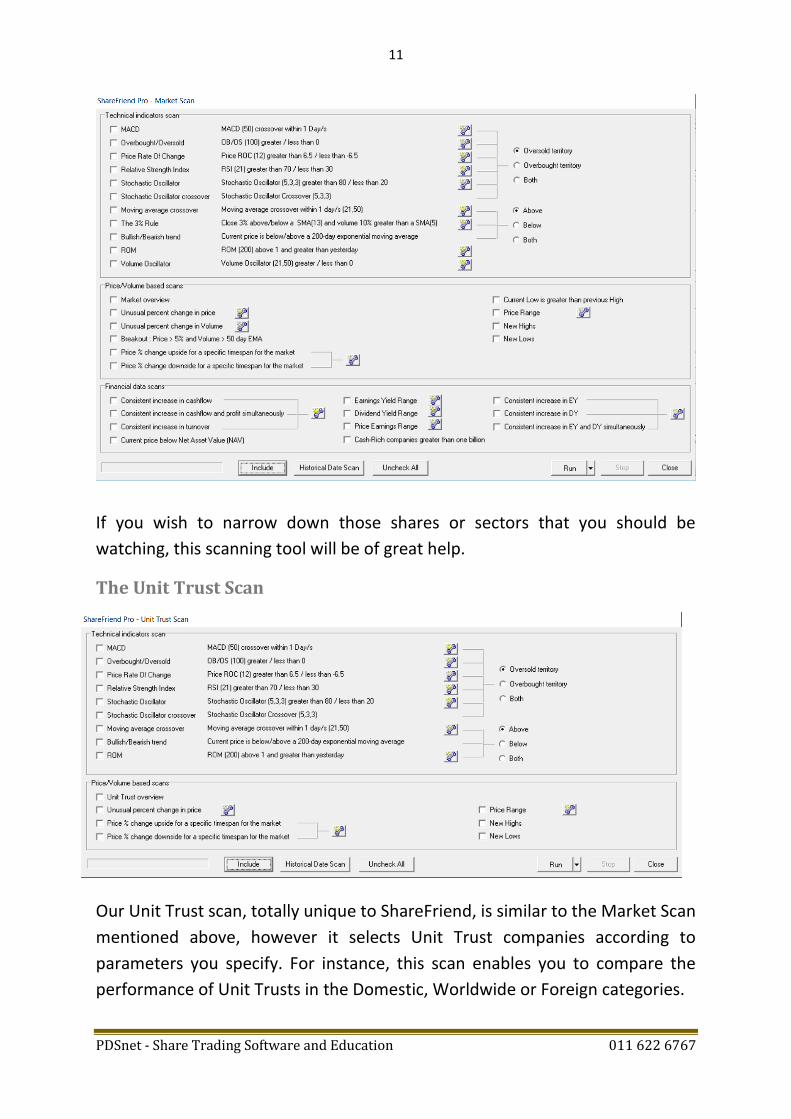
If you wish to narrow down those shares or sectors that you should be
watching, this scanning tool will be of great help.
The Unit Trust Scan
Our Unit Trust scan, totally unique to ShareFriend, is similar to the Market Scan
mentioned above, however it selects Unit Trust companies according to
parameters you specify. For instance, this scan enables you to compare the
performance of Unit Trusts in the Domestic, Worldwide or Foreign categories.

12
PDSnet - Share Trading Software and Education 011 622 6767
Company Information
The ShareFriend software also
offers detailed information on each
of the listed companies on the JSE.
This information includes a
company overview, comments,
SENS, financials, yields, ratios,
annual growth stats, director
dealings and a link to the company
website.
This feature of your software will
ensure you can make the proper
analysis of a share before you make
a decision on whether to buy or sell
in the market.
Your Watchlist of Shares
Using the ShareFriend software, it is also possible to create one or many
watchlists which may be used to track the specific shares which you believe
may present a buying opportunity in the near future.
In your watchlists you are able to set targets. As soon as a share has reached a
specified target a window will pop up indicating this with the option to view
the shares. You may also close the window and view them at a later stage.

13
PDSnet - Share Trading Software and Education 011 622 6767
Once you have decided to view the watchlist, you will get a window
similar to the one on the left indicating which shares may have reached
their targets. In this case, Standard Bank has reached its target high
price.
To change the targets, one simply has to click on the share and then the
“Edit Target” button.

14
PDSnet - Share Trading Software and Education 011 622 6767
Portfolio Manager
We can quite confidently say that the ShareFriend Portfolio Manager is one of
the most powerful out there today.
Above is a sample of what the Portfolio Manager looks like with the
holdings of shares purchased and owned with all the details for the
individual shares.
The graph in the top right of the screenshot indicates your portfolio
performance from the time of conception.
You will also notice buttons at the bottom of the screen which are used
for deleting a holding, editing stop loss and creating notes, as well as for
your holding info.
Below is a screenshot of the same sample portfolio, but showing the
transactions screen:

15
PDSnet - Share Trading Software and Education 011 622 6767
As can be seen, there is a deposit transaction and a couple of buy
transactions.
One can also see the buttons available on the transaction screen for
creating a new transaction, deleting a transaction, editing a transaction
already created as well as recalculating the holdings should you have
edited a transaction and transaction notes.
Simulation
The ShareFriend Simulation feature allows you to test your ideas and make your mistakes on paper before entering the real market. Simulations have been around for decades as a means of training in the stock market. The idea is simple. Simply choose the shares that you are interested in buying, the quantities you wish to buy and let your software do the rest. By
watching this simulation, you are able to get a real feel for what it is like to invest in the stock market.
Another thing the simulation can do in your software is add a stop-loss. A stop-loss level will ensure that you never lose more than a certain percentage of your investment, and your simulation will alert you when the share

16
PDSnet - Share Trading Software and Education 011 622 6767
price of your purchase has dropped and is approaching this mark. If you always stick to your stop-loss, the chances of you making money on the stock market are definitely in your favour, even if you choose your shares at random.
After you have run your simulation and are happy with your ability to choose the right shares at the right time, you can start a real portfolio, and your software allows you to track this in your Portfolio Manager mentioned above.

17
PDSnet - Share Trading Software and Education 011 622 6767
Indicators
There are a number of indicators which are available in the ShareFriend
software:
The Overbought/Oversold Indicator
MACD Indicator

18
PDSnet - Share Trading Software and Education 011 622 6767
RSI Indicator
Momentum Indicator
On Balance Volume

19
PDSnet - Share Trading Software and Education 011 622 6767
Dividend Yield

20
PDSnet - Share Trading Software and Education 011 622 6767
List of All Indicators Included
1. Acc/Dis
2. Accumulative Swing Index
3. Aroon
4. Aroon Oscillator
5. Bollinger Bands
6. Chaikin Money Flow
7. Chaikin Volatility
8. Chande Momentum Oscillator
9. Commodity Channel Index
10. Comparative RSI
11. Detrended Price Oscillator
12. Directional Movement System
13. Ease of Movement
14. Exponential Moving Average
15. Fractal Chaos Bands
16. Fractal Chaos Oscillator
17. High Minus Low
18. High/Low Bands
19. Historical Volatility
20. Linear Regression Forecast
21. Linear Regression Intercept
22. Linear Regression R-Squared
23. Linear Regression Slope
24. MACD
25. Mass Index
26. Median Price
27. Momentum Oscillator
28. Money Flow Index
29. Moving Average Envelope
30. Negative Volume Index
31. On Balance Volume
32. Overbought/Oversold
33. Parabolic SAR
34. Performance Index

21
PDSnet - Share Trading Software and Education 011 622 6767
35. Positive Volume Index
36. Price Oscillator
37. Price ROC
38. Price Volume Trend
39. Prime Number Bands
40. Prime Number Oscillator
41. Rainbow Oscillator
42. Relative Strength Index
43. ROM
44. Simple Moving Average
45. Standard Deviation
46. Stochastic Momentum Index
47. Stochastic Oscillator
48. Swing Index
49. Time Series Moving Average
50. Trade Volume Index
51. Triangular Moving Average
52. TRIX
53. True Range
54. Typical Price
55. Ultimate Oscillator
56. Variable Moving Average
57. Vertical Horizontal Filter
58. VIDYA Moving Average
59. Volume Oscillator
60. Volume ROC
61. Weighted Close
62. Weighted Moving Average
63. Welles Wilder Smoothing
64. Williams %R
65. Williams Accumulation Distribution
66. Zig Zag

22
PDSnet - Share Trading Software and Education 011 622 6767
These are just the main features provided in the ShareFriend
software. We also provide a comprehensive online course
explaining the art of stock market investment and technical
analysis techniques.
For more information, please contact our Bedfordview offices:
011 622 6767