a solution matrix ltd. white paper business case essentials: a guide...
TRANSCRIPT

A Solution Matrix Ltd. white paper
Business Case Essentials:A Guide to Structure and Content
Marty J. Schmidt, MBA, PhD
Revised April 2003

Business Case Essentials
Solution ♦Matrix ♦Ltd

i
Solution ♦Matrix ♦Ltd
Page
Business Case Essentials ......................................................................................1
Building Blocks A: Introduction and Overview.................................................. 2
Title & Subtitle ....................................................................................... 2 Address & Author ................................................................................... 2 Date.........................................................................................................3 Subject .................................................................................................... 4 Purpose ....................................................................................................5 Disclaimer............................................................................................... 6 Executive Summary................................................................................. 7 Introduction ........................................................................................... 7
Building Blocks B: Assumptions and Methods................................................... 8
Financial Metrics..................................................................................... 8 Assumptions ........................................................................................... 9 Scope & Boundaries................................................................................ 9 Scenarios................................................................................................10 Full Values vs. Incrementals.................................................................... 11 Cost Model ............................................................................................ 13 Benefi ts Rationale .................................................................................. 15 Data Sources and Methods.....................................................................16
Building Blocks C: Business Impacts.................................................................17
Financial Model .....................................................................................17 Cash Flow Statement .............................................................................17 Analysis of Results..................................................................................21 Non fi nancial Results .............................................................................23
Building Blocks D: Sensitivity, Risks, and Contingencies ..................................25
Sensitivity Analysis.................................................................................25 Risk Analysis ......................................................................................... 27 Contingencies and Dependencies...........................................................28
Building Blocks E: Conclusions and Recommendations.................................. 29
Conclusions .......................................................................................... 29 Recommendations ................................................................................ 29
Permission to Copy........................................................................................... 31For more Information ....................................................................................... 31About Solution Matrix Ltd. .............................................................................. 31
Contents
Copyright © 2002 by Solution Matrix Ltd. All rights reserved.

Business Case Essentials
iiCopyright © 2003 by Solution Matrix Ltd. All rights reserved.
Solution ♦Matrix ♦Ltd

1Copyright © 2003 by Solution Matrix Ltd. All rights reserved.
Solution ♦Matrix ♦Ltd
Business Case EssentialsA Guide to Structure and Content
When is a business case complete? What makes it compelling and credible? A business case is similar in some ways to a legal
case presented in court. The trial attorney and the business case devel-oper both have a lot of freedom to structure arguments, select and ignore evidence, and package the formal presentation. Whether or not the result is effective depends on their ability to tell a convincing story with compelling logic and facts. This can usually be done in many different ways: there is no single “right” outline, format, or content list.
Looking beyond superfi cialities, however, it is clear that good cases have many elements and characteristics in common. Good business cases, for instance, always present (in one way or another) rules for deciding which data belong in the case and which do not. They stipulate, that is, the boundaries of the analysis. Readers need this information in order to know confi dently that the case refl ects all costs and benefi ts that are relevant, but only those that are relevant. When fundamental information of that sort is missing or unclear, intelligent readers sense the lack instinctively and credibility suffers.
We cannot prescribe a single outline or template for all cases, but we can identify “building blocks” of this kind that are essential to building a logical structure that will stand up to critical scrutiny, serve as a useful guide to management, and predict what actually happens. Essential building blocks appear in fi ve general categories:
A. Introduction and OverviewB. Assumptions and MethodsC. Business ImpactsD. Sensitivity, Risks and ContingenciesE. Conclusions and Recommendations
This list represents a very natural order for presenting the elements of your reasoning, evidence, and analysis, and it is hard to imagine a successful business case that does not include at least one “building block” from each category. Within categories, however, some elements are essential in some kinds of cases but not others (the disclaimer, for instance).
Permission to copy and distribute this document is granted under conditions described on page 31. The contents of this paper are covered in detail in the books The Business Case Guide (isbn 1-929500-01-7) and What’s IT Worth? The Business Case for Technology(isbn 1-929500-04-1). For more information on these books visit the Solution Matrix Ltd. web site at www.solutionmatrix.com.
Revised Apil 2003

Business Case Essentials
2Copyright © 2003 by Solution Matrix Ltd. All rights reserved.
Solution ♦Matrix ♦Ltd
Building Blocks A: Introduction and Overview
Some of these blocks must be completed before any other parts of case design can proceed (the Subject, Purpose, and Introduction). The Executive Summary will be written last but read fi rst by the audience. In any case, some of the audience may read only these parts. Obviously these building blocks need to represent the entire case in terms that are terse, clear, and accurate.
Everyone expects the case title to identify—briefl y—the proposed action and the general nature of the analysis. For example:
“Proposed Computer Upgrades: Total Cost of Ownership Analysis”
or
“Cost/Benefi t Study of Planned Employee Recreation Facility”
Other terms for the general nature of the case might include:
• Business impact study • Prototype analysis• Return on investment study • Projected cash fl ow impact• Feasibility study • Business benefi ts analysis
A title is essential, of course, but you may also have the option of adding a subtitle to let readers know more precisely what the case is about. A subtitle can add interest and clarity by identifying up front such things as
• The time period analyzed
“Projections for fi scal years 2001–2005”
• The specifi c action is being analyzed (when several similar actions have been proposed).
“October 2001 upgrade proposals from IBM”
• Special characteristics of the method
“Five year projections based on historical data from 2001”
Subtitles should cover no more than one or two lines—otherwise they begin to take over the role of Executive Summary. Note that business case subtitles are not like the “tag lines” after titles in magazine or newspaper articles. There, authors create interest by revealing conclu-sions or making editorial comments (“Read the fi ne print before you sign a service contract”). For the formal business case, however, conclu-sions or editorials in the title or subtitle seems unprofessional.
Some cases need address statements with both “To:” and “From:” headers, as on a formal memo. Other cases need only show the author(s). An address with both “To” and “From” is especially appropriate if the
Title &Subtitle
Address &Author
Everyone expects the title to identify the proposed action and the nature of the analysis.

A Guide to Structure and Content
3Copyright © 2003 by Solution Matrix Ltd. All rights reserved.
Solution ♦Matrix ♦Ltd
case is prepared by consultants, sales people, or anyone outside the receiving company or organization. “To” may address an individual, in which case title and company (or organization) should be included:
To: Mr. Arnold Willows, President Rochester Manufacturing Company
Or, the report may be “To” (or “Prepared for” or “Submitted to”) a committee or group (“Capital Review Board, Whitney Financial Services, Inc.” or “Project 2002 Steering Committee, Able Diesel Corp.”).
Business cases tend to be shaped signifi cantly by the identity and needs of the intended audience. Subsequent readers of all kinds will know better how to evaluate the case if they also know who this was.
Even if the audience is not identifi ed explicitly, the author(s) should be. Authorship may be indicated by “From,” “Prepared by,” or “Submitted by.” This is another way that business cases differ from standard accounting reports or budgets, where authorship may or may not be known and where credibility is rarely in issue. Readers probably do not care specifi cally which accountant put the fi nal touches on the income statement, or which senior executive made the fi nal adjustment to the capital budget ceiling. Everyone knows, however, that business cases refl ect arbitrary and subjective judgements, that projections are uncertain, and that no two analysts are likely to produce exactly the same case results. For credibility reasons alone, it is necessary to show who is responsible for the report: a purely anonymous business case would be less than compelling in most settings, no matter how good the content. Also, if the case serves later as a management tool or model for other cases, users may want to contact the author(s) for elaboration or explanation.
Authorship is often attributed to committees or groups (“Submitted by the Project 2003 Study Committee”), which is fi ne, if the actual indi-viduals can be identifi ed elsewhere in the report, perhaps in a footnote or appendix.
The address/authorship statement can also serve to show at the outset that a number of people contributed to the content. As the head of a study group or project team, it can be important to remind readers that contributions came from individuals across many functional areas—maybe including fi nance, human resources, marketing, strategic planning, line management, and so on. As an outside consultant or sales person, it is important to register the involvement of any contributors inside the company or organization.
The cover page of the case report should show the date(s) completed and submitted. Business cases are often revised and reissued through several cycles. Completion and submission dates on the fi rst page make it easy to fi nd the latest version.
Other text in the body should indicate when the data were gathered or developed. (“Cost estimates refl ect vendor prices in effect during August, 2002,” or “Estimated expenses are based on customer service request patterns for the years 2002 and 2003”). This is important because cases
Date
A purely anonymous business case would be less than compelling in most settings.

Business Case Essentials
4Copyright © 2003 by Solution Matrix Ltd. All rights reserved.
Solution ♦Matrix ♦Ltd
use sources that change: business plan estimates, price quotes, salary and staffi ng data—all change over time and all may contribute to case results. Conditions under which measurements and estimates are made should also be stated. Dating the source data this way lets the audience know exactly which data were used, avoiding potential confusion later.
Every business case needs an explicit subject statement, describing what the case is about. The statement is critically important because it helps defi ne or shape almost everything else in the case. The subject may have a section of its own or it may appear in other building blocks, such as “Background” or “Introduction.”
Two good analysts can work independently on the same subject and arrive at different business case results, but they should be very similar results if the subject has been defi ned fully, concretely, and precisely. If the subject is defi ned incompletely, vaguely, or imprecisely, they may arrive at quite different results. To a certain extent, the results are determined (but not yet visible) when the subject is stated properly.
The starting point for identifying the case subject is usually a proposed or planned action, but the subject of the case should ulti-mately be defi ned in terms of objectives. Here, for instance, are some proposed actions that might prompt a request for business case analysis:
• An acquisition or replacement • A construction project• An investment in new capabilities or capacity• A change in organization, operations, or product offerings• A move into a new market
As suggested, the title should briefl y identify the proposed action (“Proposed Computer System Modernization” or “Planned Employee Recreation Facility”). However, the subject statement itself needs to describe the primary action and related actions more fully and precisely. The subject statement should contain, in kernel form, the scope and objectives behind the action.
This may require several sentences. A “Reservation System Enhancement” in the title might have a subject statement like this:
“This case examines the likely costs and benefi ts from computer system upgrades and other actions meant to double the daily transaction capacity of Acme Corporation’s reservation system and improve access to reservation data. These improvements are regarded as necessary, in order to improve responsiveness to customers and meet business growth targets for the next fi ve years. This will require several major actions, including an upgrade of Acme’s four Model 900 computer systems to Model 1200 systems, migration to the UNIX operating system, and re-writing of the reser-vation system software application. It will also require acquisition of an additional thirty phone lines and professional training for the sixty current reservation agents. The analysis covers the expected costs
Subject
To a certain extent, the results are determined (but not yet visible) when the subject is stated properly.
Reaching objectives has fi nancial and other business value that can be made tangible.

A Guide to Structure and Content
5Copyright © 2003 by Solution Matrix Ltd. All rights reserved.
Solution ♦Matrix ♦Ltd
and benefi t consequences of these actions, as they impact Acme’s Resorts Division during fi scal years 2001 through 2004.”
Good subject statements are built around objectives—business objectives, fi nancial objectives, functional objectives, or operational objectives (in this case, “double the daily transaction capacity of the reservation system,” and “improve access to reservation data,” which, in turn are meant to “improve responsiveness to customers,” and “meet business growth targets.”). Why move the focus from action to objec-tive? Reaching objectives has fi nancial and other business value that can be made tangible. The value of an action that is unrelated to an objective (“Upgrading a Model 900 system to Model 1200”) is much harder to quantify in a compelling way. In brief, when a proposed action supports an objective (and all proposed actions do, in a rational environment), the appropriate subject for the business case is the full range of resources and actions required to reach the objective.
The title may suggest the general approach (“Total cost of Ownership Analysis”), and it may point to the central action (“Computer System Upgrades”) but it will probably not mention the purpose of the case itself, directly. The purpose may be stated explicitly in one of the introductory building blocks, or elsewhere, or it may be omitted entirely from the fi nal report. Nevertheless, this building block is essential in the sense that the purpose must be known and understood alike by the case developer and audience.
The general purpose may be to support decision making and planning but the developer needs to know specifi cally what the case will be used for and how it will be used. For instance, the case purpose may be to
• Help decide the timing of a planned action/acquisition• Help choose between proposed capital acquisitions• Support next year’s budgetary planning• Support a specifi c budgetary request• Help choose fi nancing methods or vendor
The developer should also know from the outset which fi nancial criteria will be used to evaluate results, and what it will take in terms of these criteria achieve success (e.g., obtain funding). If the purpose is to support a proposed capital acquisition, for instance, and if the Capital Review Committee evaluates proposals with criteria such as internal rate of return (irr), payback period, and net present value (npv) of the cash fl ow stream, it is important to know that before beginning to build the case. If the Committee never funds anything with a payback period over, say, two years, it is important to know this, too. This is especially important if the case represents one of several alternative actions competing for the same funds or management attention.
Why? Because the purpose of the case and its manner of use should infl uence case design and case methods in many ways. When different cases support competing proposals, for instance, the scope of cost and benefi t coverage for all cases should generally be the same.
Purpose
The appropriate subject for the business case is the full range of resources and actions required to reach an objective.
The appropriate subject for the business case is the full range of resources and actions required to reach an objective.

Business Case Essentials
6Copyright © 2003 by Solution Matrix Ltd. All rights reserved.
Solution ♦Matrix ♦Ltd
Including a disclaimer in your case report is advisable if you are preparing the case for an audience outside your own company or organization. The disclaimer can help set audience expectations properly, but its primary purpose is to provide defensive legal protection for the case devel-oper. The message of the disclaimer is, in effect, something like this:
“I built this case carefully and professionally, but ...
• “Don’t hold me legally responsible for the accuracy of these predictions.”
• “Estimates of future fi nancial results always include some uncertainty.”• “The results depend on some factors beyond my control.”• “The results are based on information that may change.”• “The results may depend on important information I was unaware of.”• “The results depend in part upon information you furnished to me.”• “Don’t mistake this business case for professional tax guidance.”
In a real business case, of course, the phrasing is more formal and diplomatic. Here, for instance, is the disclaimer used by one it (Information Technology) system integration consultant from the fi rm “Vantage Associates:”
“This report provides approximations of important fi nancial con-sequences that should be considered in decisions involving the purchase, installation, and confi guration of computing hardware and software. The analysis is based on information which was provided by you as well as information believed by Vantage Associates to be accurate. Price information is subject to change at any time. We recommend that you use this analysis only as an aid to develop your own cost and benefi t analyses. The actual tax impact can only be determined accurately by consultation with tax advisors.”
If you even suspect that a disclaimer might be advisable in your work, then by all means check with your legal department or fi nd a qualifi ed lawyer who can discuss your potential responsibilities, vulner-abilities, and liabilities from a legal standpoint. Verify that your disclaimer text is appropriate.
When you use a disclaimer, either give it a text section of its own early in the report or set it off from other text in some unmistakable way (e.g., with a different typeface or indentation). Also be sure to bring it to the attention of your audience at least once. Do not bury it in the footnotes or appendixes.
Of course, a disclaimer will not fully protect you from the legal consequences of incompetent work, misrepresenting your qualifi cations, or misusing case results. However, if you do your best in good faith, it can provide some protection against a client or customer who later makes unfair claims against you or your organization.
Disclaimer
The disclaimer provides some protection against a client or customer who later makes unfair claims.

A Guide to Structure and Content
7Copyright © 2003 by Solution Matrix Ltd. All rights reserved.
Solution ♦Matrix ♦Ltd
Readers expect to fi nd an executive summary very early in the report. This is most useful if it contains both text and numbers:
• A short narrative paragraph tersely identifying the subject, scope, methods of analysis, and major results
• A list or table of fi nancial metrics from the analysis (e.g., Net cash fl ow total, discounted cash fl ow total, payback period, internal rate of return, or total cost of ownership)
The executive summary deserves careful preparation and formatting. Some of your audience will probably read only the executive summary. The summary is your one chance to reach this part of the audience.
Other members of your audience will read some or all of the case report, but miss the main conclusions, misunderstand the subject and scope, or otherwise misinterpret your case—unless you make these elements crystal clear in the executive summary.
The rest of your audience—even those who read the case report carefully and completely—will still want to know the essence of the whole case from the outset. It’s natural to view the preliminary executive summary as a proposition, which the rest of the case then supports, elaborates, or proves.
The introduction describes the setting for the case and helps estab-lish reader expectations for what follows. Some of the building blocks covered earlier, like the subject and purpose, fi t naturally in a section explicitly called “Introduction” (or something like Background, Overview, or Situation). This is also the place to bring in other back-ground, history, or context that helps the audience evaluate case results and compare them to other case scenarios.
Introductory statements will often “position” the case by reminding or telling the audience of such things as:
• Objectives, needs or problems addressed by the subject. E.g., The need to lower operating expenses, problems in customer
satisfaction, the need for more computing capacity, the need to improve professional selling skills, and so on.
• Other business considerations that should be in view when basing decisions on case results. May include external factors, such as increased competition, or internal factors such as policies or management directives.
• Other important and related management plans. E.g., Business plans, budgets, or special project or program plans.
• Important historical information. E.g., The “track record” of previous business case analyses on this subject.
• Alternative actions. When the case supports a proposed action that is competing against other proposals, this is a good place to sketch briefl y the alternatives that will be compared with these results.
ExecutiveSummary
Introduction
The disclaimer provides some protection against a client or customer who later makes unfair claims.

Business Case Essentials
8Copyright © 2003 by Solution Matrix Ltd. All rights reserved.
Solution ♦Matrix ♦Ltd
Building Blocks B: Assumptions and Methods
The case’s fi nancial results tell the story, but case credibility and effectiveness depend heavily on the author’s ability to explain where the data and results come from. This is largely a matter of describing the assumptions and methods behind the case. Essential building blocks in this section accomplish that purpose. Where should this information appear in the case report? It can go in several places.
• The logical fi rst choice is just after the introductory material (Section A, above), and before the fi nancial results and other business impacts (Section C below).
• If the materiel is very long, however, you may divide it into two sections: A shorter section, covering “Key Assumptions and an “Overview of Methodology” (or “General Approach”) can appear before the fi nancial results, conveying just what readers need to know to make sense of the results. Then, a longer section spelling out all assumptions and methods completely can appear in an appendix.
What will it take for the case to accomplish its purpose? Readers will want to know the answer before reading the full set of fi nancial results. A large part of that answer will be stated in terms of the fi nancial metrics (fi nancial measures) that will be developed. It is not very helpful to state simply that the case represents an analysis of “all costs and benefi ts” associated with a proposal. Instead, let readers know early, that decisions and plans based on case results will be based specifi cally on such measures as:
• Net cash fl ow • Discounted cash fl ow (dcf )• Net present value (npv) • Internal rate of return (irr)• Payback period • Total cost of ownership (tco)• Return on Investment (roi) • Return on Assets (roa)
Or other specifi c metrics such as:
• Price/performance ratio • Cost per employee• Cost per transaction • Cost per customer
If the case supports decision making, readers will also want to know early just how these measures will be used. You may indicate, for instance, that in order to obtain funding, capital proposals “must show a payback period of 2 years or less, and an irr of 40% or more.” Or , you might indicate that competing proposals will be judged primarily on the basis of “total cost of ownership.”
FinancialMetrics

A Guide to Structure and Content
9Copyright © 2003 by Solution Matrix Ltd. All rights reserved.
Solution ♦Matrix ♦Ltd
Business cases require certain assumptions for one or more of these reasons:
• Prediction • Simplifi cation• Clarifi cation
Consider fi rst prediction. Cases that project future fi nancial results are based on factors that change over time: business volume, prices, salaries, the organization’s cost structure and many other things. Suppose that your case anticipates purchasing fuel oil, real estate, or computer hardware several years from now. What prices do you enter in the case now for future purchases? You may use today’s prices, or you may try to project future prices based on current trends. Whichever you choose needs to be clearly articulated as an assumption. Any other cases compared to this one should then be based on the same assumptions.
Most business cases also require simplifying assumptions. A case may include salaries of, say, 100 clerical workers. It may be impossible or impractical to obtain the real salary fi gure for each person involved. A far more practical approach is to assume the company average for this job category, for all 100. If this not known, it may be necessary to assume an average salary level based on other sources—profession-specifi c salary surveys, for instance.
Finally, assumptions may be necessary for clarifi cation. An assump-tion of this kind might state, for instance that 20% of new equipment in the proposal will be acquired by direct purchase, and the remaining 80% through capital lease. There may be many other workable fi nancing options as well, but the author had to choose one in order to complete the case.
Assumptions of any kind, no matter how necessary, obvious, or appropriate they may be, need to be explicitly recorded in the business case whenever you cannot take it for granted that any other analyst or reader would make the same assumptions automatically.
Stating the subject, purpose, metrics, and other blocks above does not fi x the scope and boundaries of the case. Scope is range of coverage encompassed by the case along several dimensions; boundaries defi ne the scope precisely, providing rules for deciding which data belong in the case and which do not.
One dimension that always needs bounding is:
Time
• When does the analysis period begin, and when does it end?• Is the analysis synchronized with calendar years? Fiscal years?
Project or program plans?
Other dimensions that may need bounding include:
Assumptions
Scope &Boundaries
Record assumptions whenever you cannot take it for granted that any other analyst would make the same assumptions automatically.
Time is one dimension that always needs bounding.

Business Case Essentials
10Copyright © 2003 by Solution Matrix Ltd. All rights reserved.
Solution ♦Matrix ♦Ltd
Geography/Location
• Does the analysis refer to a specifi c site? A fi ctional “typical” site? Multiple sites?
• Does it cover specifi c areas only? (E.g., a manufacturing fl oor, computer room, loading dock, executive offi ces)
Organization or Function
• Does the analysis cover a specifi c division, department or group? Or, the whole company or organization?
• Does the analysis apply only to certain functions? (e.g., manufacturing, marketing, sales, etc.)
• Does the analysis apply to certain personnel but not others? (E.g., hourly-paid labor, management, it/is staff but not computer users, union employees only, etc..)
Technology
• Does the analysis cover computer hardware but not software? • Vehicle engine and drive train maintenance, but not body work? • Electrical but not mechanical devices?
Scope and boundary statements tell case developers and readers just whose costs and benefi ts are included, and where the fi nancial impacts come from. Boundary statements are always necessary, but especially so when costs of a proposed action are borne primarily by one organization or site (e.g., manufacturing, or it), but where benefi ts may be realized much more broadly.
Business cases are built to answer questions like these: Which proposal represents the best business decision? Will the returns justify the invest-ment? What will this action do for our business performance? Such questions can be answered only if the logical structure of the case is designed to address them. The logical structure of the case resides in the scenario design (introduced in this section), the cost model, and the benefi ts rationale (next sections).
The term scenario means, simply, a story showing one way that events might unfold. Scenarios in the business case itself are built so as to fi nd and make tangible every business impact that we want in the case. The scenario story may be told with information drawn from business plans, project plans, vendor proposals, pilot studies, prior experience, or other sources. Telling the story also requires an abundance of assumptions (as mentioned earlier) about things like market size, salary increases, the price of fuel, and anything else we need to specify in order to project cost and benefi t impacts into the future. And, a scenario may incorporate formal models, rules, and logic (rationale) in order to leave no doubt about what belongs in the case and what does not. Together, all the scenario elements tell the story of one possible future, in concrete detail.
Scenarios
Scope and boundary statements tell case developers and readers just whose costs and benefi ts are included.
Scenario elements tell the story of one possible future, in concrete detail.

A Guide to Structure and Content
11Copyright © 2003 by Solution Matrix Ltd. All rights reserved.
Solution ♦Matrix ♦Ltd
How many scenarios do we need in the case? Consider again the computer system upgrade at the heart of the subject statement (page 5). Assume that Acme company wants to decide between two different ways of implementing the upgrade: (a) Use their own it staff to confi gure the new hardware and re-write software applications, or (b) contract with a “systems integrator” to do the work. The case normally needs just one scenario for each major alternative or option. (All sorts of “what if?” questions concerning different assumptions can be approached with sensitivity and risk analysis, introduced below). The it business case, therefore, includes two proposal scenarios, one for each option. We must now decide, however, whether to include a third scenario, and what kinds of data to use for cost and benefi t fi gures.
Scenario design also considers the objectives for subject of the case, and the proposal, and the purpose of the case. Here, Acme wants to:
• Double the daily transaction capacity• Improve access to reservation data• Improve responsiveness to customers• Meet business growth targets
Those are objectives for the action. And, the purpose of the case is to provide a basis for deciding which alternative (use in house staff, or use a systems integrator) better meets those objectives over the next few years.
Notice the words “double,” “improve,” and “growth” in the objec-tives. These are relative terms. We have to ask: “Double (or improve, or grow) relative to what?” In order to recognize doubling, improvements or growth, the case also needs a baseline scenario for comparison. This baseline scenario we may call “business as usual,” a scenario to predicts key measures of business performance should neither proposal scenario be implemented. (It is sometimes called the “As-Is” scenario, to contrast with proposal, or “To-be” scenarios). How to handle the “business as usual scenario” and some related issues is one aspect of business case design that confuses many people, however. Lack of understanding about the logic of comparisons in the business case is the reason behind many misleading or worthless case results.
Do we actually need to create a fully developed business as usual scenario, in order to make compare the present state to the proposed sate? Yes. Do we need to present a full business as usual scenario in its own right? The answer is “maybe,” depending on the purpose of the case and the needs of the case audience.
We can present scenarios and data by different approaches. For many people, business case logic unravels completely and their analyses become meaningless when they mix the different approaches or fail to understand which approach best addresses the purpose of their business case. In order to show clearly the issues involved and that the under-lying concepts are really very simple, we need to consider the kinds of
Full Value vs.Incrementals
Lack of understanding about the logic of comparisons in the business case is the reason behind many misleading or worthless case results.

Business Case Essentials
12Copyright © 2003 by Solution Matrix Ltd. All rights reserved.
Solution ♦Matrix ♦Ltd
data that go into a case. In a nutshell, the case builder can choose to deal with cost benefi t data in either of two ways:
1. Full value approach
The cost and benefi t data are “full values:” Data represent the full values of cash outfl ows or infl ows for each line item.
2. The incremental approach
The cost and benefi t data represent the differences between full values under the proposal scenario and corresponding business as usual scenario.
Table 1 illustrates the two approaches. In this business case analysis, “it operating gains” under scenario 1 for Year 1 are projected as $190. Under “Business as usual,” the same item, it operating gains, are projected as $110. Under the “full value” approach, these values go directly into the cash fl ow summary for each scenario (left panel of Table 1). Under the incremental approach, however, the same item appears as “Incremental it operating gains.” The scenario 1 incremental value is the difference between the two ($190 - $110 = $80). In the incremental approach, “Business as usual” is created, used in calcula-tions, but not presented.
Notice that the incremental values (right panel) can be derived from the full values (left panel), but the reverse is not true. If you grasp the ideas involved in Table 1, you may at this point ask: “What is so confusing about this issue? Do people really trip up here and invalidate their own results?” Just look at some of the business cases from your own organization, or examine some of cases available on the internet, and you will see that people stumble in several ways:
Problem 1: Mixing incremental and full value data in the same scenario cash fl ow summary.
People err by using full value cost fi gures in one line item and incre-mental gains in another. Results become meaningless when incremental and full value data are mixed.
Problem 2: Confusing plus and minus signs, especially where cost savings are involved.
Using Full Values Using Incremental Values
For Year 1 … ProposalScenario 1
ProposalScenario 2
Businessas Usual For Year 1… Proposal
Scenario 1 Proposal
Scenario 2IT Operating Gains $190 $150 $110 Incremental IT Operating Gains $80 $40 IT Operating Costs ($130) ($90) ($100) Incremental IT Operating Costs ($30) $10 IT Acquisition Costs ($30) ($40) $0 Incremental IT Acquisition Costs ($30) ($40) Net Gain (Loss) $30 $20 $10 Incremental Net Gain (Loss) $20 $10
Table 1. Cash fl ow values for several scenario line items, using a full value approach (left) and incremental approach (right). Figures in parentheses are cash outfl ows,
Use full value fi gures or incremental values? The underlying issues are simple but often misunderstood.
Results become meaningless when incremental and full value data are mixed.

A Guide to Structure and Content
13Copyright © 2003 by Solution Matrix Ltd. All rights reserved.
Solution ♦Matrix ♦Ltd
In Table 1, for instance, it operating costs are projected as $100 under business as usual, but only $90 under Scenario 2. This item looks like a cost savings but does that go into the business case as a positive or negative fi gure? The answer depends on which data approach we use. Under the full value approach, we see the cost savings by comparing the two negative fi gures in the two scenarios. Under the incremental approach we see the cost savings as a positive cash infl ow.
Problem 3: Not meeting the needs of decision makers or business planners.
Incremental and full value data carry different messages and meet different needs. Here are some factors to consider:
Incremental values may be preferred if ...
• The proposed action or acquisition is to be evaluated primarily as an investment (i.e., in terms of roi, payback, or irr).
• Incremental costs and benefi ts will be quite small relative to full value fi gures. If the differences between scenarios are small but important, the full value approach may “mask” the differences that need to be seen clearly.
Full values may be preferred if ...
• The business case purpose is business planning rather than decision support. If case readers need to plan budgets based on cost projections, for instance, they need full value fi gures.
• “Business as usual” is unthinkable. If a business as usual scenario is completely unrealistic (e.g., the company would be out of business), incremental values might have questionable value.
How do you know that every important cost or benefi t item is included in the case? How do you know that different scenarios are truly compa-rable? A clear presentation of the cost model and benefi ts rationale for the case provides a direct, effective means of assuring everyone that the case includes all relevant line items and only relevant line items. The cost model and benefi ts rationale, together, assure everyone that the data selection was unbiased, and that scenarios are compared fairly.
By “cost” we simply mean something the organization spends money on. Financial impacts in each scenario that are cost impacts come in four fl avors: cost savings, avoided costs, continuing costs, and increased costs. All these impacts refer to cost or expense line items in the case. In building case scenarios, we determine fi rst which cost items go into the case and then, later, how they behave over the analysis period. The cost model’s fi rst job is simply to help identify cost items that belong in the in the case, as well as which items to exclude.
The matrix at the top of Figure 1 (next page) is a cost model that works well for many it-related business case studies—such as Acme’s analysis of a proposed upgrade scenarios. This cost model includes every cost impact item that follows from both proposal scenarios, as well as it costs expected under business as usual.
CostModel
Does a cost savings go into the business case as a positive or negative fi gure?
Incremental and full value data carry different messages and meet different needs.
The cost model and benefi ts rationale, together assure everyone that the case includes all relevant line items, and that different scenarios are truly comparable.

Business Case Essentials
14Copyright © 2003 by Solution Matrix Ltd. All rights reserved.
Solution ♦Matrix ♦Ltd
The cost model is really just an organized list of cost items: poten-tial cost items are organized into cells: each cell holds a group of cost items that change together, which need to be planned and managed together—usually because they have common cost drivers. The upper left cell, for instance, holds all “Hardware Acquisition Costs,” (a call out shows what some of these cost items might be). Each of the fi fteen cells in fact can have a long list of cost items.
Notice also that the cost universe is divided in two ways. The horizontal dimension groups cost items by “System Life Cycle” catego-ries (Acquisition, Operation, and Growth and Change). Every it cost item in the case fi ts into one of these categories. The scheme makes sense, because acquisition costs are planned and managed differently from continuing operational costs, which are planned and managed differently from growth and change costs.
The vertical dimension divides all costs into fi ve different “it Resource” categories (Hardware, Software, Personnel, Networking and Communications, and “Other” costs). This scheme also makes sense, because each resource category is planned and managed differently from the others.
Organizing cost items by categories in this way creates a surprisingly powerful tool for of identifying, analyzing, and communicating the “cost” side of the business case. With a cost model, case builders and case recipients have a simple, visual “rule” that shows which cost items belong in the case. If a cost item does not fi t in one of the cells, the item does not belong in the case. When there are two or more scenarios in the case, we ensure comparability of scenarios by applying the same cost model to each scenario. Individual scenarios may turn up different line items within cells, but the scenarios are comparable because all have applied the same cost model structure.
Figure 1. A cost model for the business case dealing with a an IT system upgrade proposal. Each cell in the model holds cost line items. Sample cost items for two of the model’s 15 cells are shown below.
Acquisition OperationGrowth & Change
Hardware Software
Personnel NW &Comm
Facilities Res
ou
rces
System Life Cycle
¶ Line usage charges ¶ Satellite costs ¶ Wireless charges ¶ Internet service provider fees
¶ Server system purchase or upgrade¶ PC purchase ¶ Workstation purchase ¶ Storage HW purchase ¶ Other peripheral HW purchase
Hardware Acquisition Costs
NW and Comm Operation Costs
Cost Model
The cost model is a simple, visual “rule” that shows which cost items belong in the case.

A Guide to Structure and Content
15Copyright © 2003 by Solution Matrix Ltd. All rights reserved.
Solution ♦Matrix ♦Ltd
There is more to business than costs and cost savings. Businesses and other organizations usually exist in order to meet certain objectives. Yet that simple and obvious fact often gets lost in business case building, when people do not know how to bring other business impacts into the case—especially different kinds of benefi ts. Cases may be built to determine how one or another proposed action contributes to business objectives, and the business case benefi ts rationale provides a basis for bringing these contri-butions into the business case. Here, for instance, are just a few kinds of objectives and contributions that may belong in the business case:
• Sales and Marketing Objectives° To increase sales revenues° To improve market share
• Financial/Business Performance Objectives° To increase cash fl ow, margins, or profi ts° To improve earnings per share
• Operational/Functional Objectives° To shorten new product development time° To increase order-processing capacity
• Product/Service Objectives° To improve customer satisfaction° To update the product line
• Image Enhancement Objectives° To be recognized as a provider of leading-edge technology° To be known as leader in environmental protection
• Internal Objectives° To improve employee morale° To provide a challenging career path for employees
• Other Business Objectives° To establish strategic alliances° To become a “total solution” supplier
When a proposed action contributes to such objectives, the impact may be recognized and measured immediately in fi nancial terms (increased sales) or it may be recognized and measured in some other terms (tangible evidence of improved customer satisfaction, for instance might appear as fewer complaints, or in the results of customer surveys). In order to bring any such impacts into the business case as benefi ts, however, the case builder develops a benefi ts rationale that establishes their validity and the basis for assigning fi nancial value to them.
The rationale for benefi ts such as “Improved customer satisfaction” can be built simply and directly by answering a questions like these:
A. Is improved customer satisfaction recognized as an important business objective for this organization? If “yes,” then…
B. Does improving customer satisfaction have value? If “yes,” then…
C. By what tangible evidence (by what measure) do we know that customer satisfaction improves?
Benefi tsRationale

Business Case Essentials
16Copyright © 2003 by Solution Matrix Ltd. All rights reserved.
Solution ♦Matrix ♦Ltd
D. What is the target level for improvement (in that measure)?E. What is the overall value to the organization of achieving the target?F. Will the proposed action impact the measure of customer
satisfaction? If “yes,” by how much?G. What is the value of that contribution (this may be 100% of the
value in “E” or, if many other factors also contribute to reaching the target, the benefi t value may be some smaller percentage of that fi gure).
When building your own business cases, by the way, remember that it is important to establish and agree on the benefi ts rationale with your case audience or readers as early as possible in the case building process—well before the fi nal case report is delivered. This is the best possible way to avoid later disagreements about so-called “soft benefi ts.” If your audience has already agreed to rationale steps A through E above, then there is no question that the benefi ts belong in the case. The only possible room left for discussion is just how much they should be valued.
The cost model and benefi ts rationale identify and organize cost/benefi t line items. Scope and boundary statements determine where they are measured. These tools need to be described in the case report. Those who read the report also need to know to know how cost and benefi t values are measured, or where they come from. For this, you can describe data sources and the methods used to assign cost and benefi t values.
A rule of thumb for deciding whether or not to describe data sources and methods is like the one given earlier for deciding which assump-tions should be spelled out: do include the descriptions when you cannot assume that another analyst or reader would know, unambigu-ously, how the data were developed. When cost and benefi t data are taken from other documents, or when they were developed fi rst for some other purpose, identify the source as a specifi c
• Business plan• Budget (historical, current, or future)• Spending record or other historical information• Vendor proposal • Feasibility study• Pilot project• Outside consultant’s estimate• Published industry average, benchmark, or “best-in-class” fi gure
Also describe the methods for assigning cost and benefi t values, if they are not obvious and known to all. If cost estimates come from an “activity based costing” scheme or another cost allocation method unique to this case, describe this briefl y. On the benefi ts side, be espe-cially clear on the source and rationale applied to all gains that have an arbitrarily assigned value. If assigning value to “Time savings for profes-sional staff,” for example, you might indicate that the expected time savings were estimated from workfl ow analysis and interviews with line organization managers, while the assigned values represent an average salary and overhead costs for people in this group.
Data Sources& Methods
The best way to avoid disagreements about so-called “soft benefi ts” is to establish the benefi ts early in the case building process.
Identify specifi c data sources, as well as the methods the methods for assigning cost and benefi t values whenever you cannot assume another analyst or reader would know, unambiguously, how the data were developed.

A Guide to Structure and Content
17Copyright © 2003 by Solution Matrix Ltd. All rights reserved.
Solution ♦Matrix ♦Ltd
Building Blocks C: Business Impacts
Building blocks in this section are the case’s reason for being. The case exists, after all, to answer ques-tions such as: “What will be the fi nancial consequences if we take the proposed action?” Here is where these questions are answered concretely. Data summaries and analysis should be presented objectively and directly, keeping interpretations and explanatory text to a minimum.
The centerpiece of the business case will be a fi nancial model. A model is a representation or analogy of something else. It is easier to examine the behavior of a model than it is to examine the thing it represents: model airplanes, mathematical models of subatomic events, and alge-braic models of a national economy all serve this purpose.
The simplest of fi nancial models include the familiar pie chart, which shows how 100% of a sum is distributed in major components, or the basic business equation (Profi t = Sales Revenue–Costs), which shows how costs and revenues work together to produce profi ts. We referred earlier to the cost model and benefi ts rationale. When these are completed, with line items and projected cash fl ow fi gures, and when the links among their various parts are specifi ed, the result is a fi nancial model for the business case.
The case fi nancial model may be nothing more than a single cash fl ow statement (see “Cash Flow Statement” below). In more complex settings, however, the complete fi nancial model may include several cash fl ow statements in spreadsheet form, as well as tables or graphs that show the behavior of key variables, or relationships between them. In complex settings, the overall fi nancial model is truly a system of inter-related models.
The heart of the fi nancial model and the heart of the business case will be a cash fl ow statement for each scenario in the case. In its simplest form, one scenario’s cash fl ow statement will look something like Table 2. This could be, for instance, a summary of the fi nancial case that goes with a proposed computer system acquisition. It says the organiza-tion can expect a net gain of $360 after three years. There will be a net cash outfl ow the fi rst year, and net positive infl ows in years 2 and 3. A.summary like this must be created, in order to develop other fi nancial metrics for the case, such as net present value (npv), total cost of owner-ship (tco) of internal rate of return (irr), payback period, and various return on investment (roi) fi gures.
If you have training in fi nancial accounting, you may wish to compare the Table 2 framework above—for a case that predicts future cash fl ows—with the standard form historical cash fl ow report, or with
Table 2. A simple cash fl ow statement for one scenario. The fi gures are projected cash infl ows (no parentheses) or cash oufl ows (in parentheses).
Scenario 1 Cash Flow Summary Year 1 Year 2 Year 3 Total
Benefits (Cash Inflows) $100 $250 $400 $750 Net Costs (Cash Outflows) ($160) ($120) ($110) $(390) Net Cash Flow ($60) $130 $290 $360
FinancialModel
Cash FlowStatement
Business Case Essentials
18Copyright © 2003 by Solution Matrix Ltd. All rights reserved.
Solution ♦Matrix ♦Ltd
a “Statement of Changes in Financial Position,” The business case cash fl ow is nearly identical, except that:
• Line items under “Sources of Cash” on the historical report become “Benefi ts” on the business case report (or “Gains,” or Cash Infl ows”).
• Line items under “Uses of Cash” on the historical report become “Expenses” and “Asset Costs” on the business case report (or “Cash Outfl ows”).
Otherwise the cash fl ow statement in the business case is just like other cash fl ow reports: it includes only line items that represent true cash infl ows or outfl ows. Depreciation expense, for example, appears on the income statement but not on cash fl ow reports because it is not a true cash outfl ow.
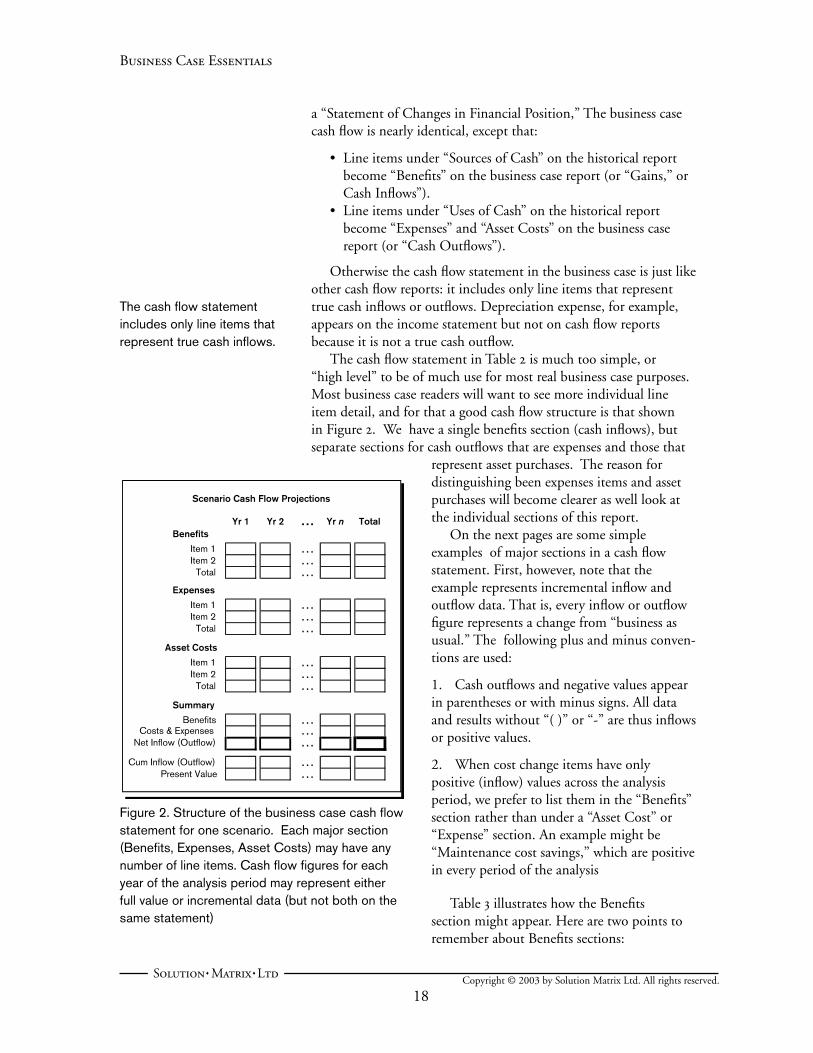
The cash fl ow statement in Table 2 is much too simple, or “high level” to be of much use for most real business case purposes. Most business case readers will want to see more individual line item detail, and for that a good cash fl ow structure is that shown in Figure 2. We have a single benefi ts section (cash infl ows), but separate sections for cash outfl ows that are expenses and those that
represent asset purchases. The reason for distinguishing been expenses items and asset purchases will become clearer as well look at the individual sections of this report.
On the next pages are some simple examples of major sections in a cash fl ow statement. First, however, note that the example represents incremental infl ow and outfl ow data. That is, every infl ow or outfl ow fi gure represents a change from “business as usual.” The following plus and minus conven-tions are used:
1. Cash outfl ows and negative values appear in parentheses or with minus signs. All data and results without “( )” or “-” are thus infl ows or positive values.
2. When cost change items have only positive (infl ow) values across the analysis period, we prefer to list them in the “Benefi ts” section rather than under a “Asset Cost” or “Expense” section. An example might be “Maintenance cost savings,” which are positive in every period of the analysis
Table 3 illustrates how the Benefi ts section might appear. Here are two points to remember about Benefi ts sections:
Yr 1 Yr 2 … Yr n TotalBenefits
Item 1 …Item 2 …
Total …Expenses
Item 1 …Item 2 …
Total …Asset Costs
Item 1 …Item 2 …
Total …Summary
Benefits …Costs & Expenses …
Net Inflow (Outflow) …Cum Inflow (Outflow) …
Present Value …
Scenario Cash Flow Projections
Figure 2. Structure of the business case cash fl ow statement for one scenario. Each major section (Benefi ts, Expenses, Asset Costs) may have any number of line items. Cash fl ow fi gures for each year of the analysis period may represent either full value or incremental data (but not both on the same statement)
The cash fl ow statement includes only line items that represent true cash infl ows.

A Guide to Structure and Content
19Copyright © 2003 by Solution Matrix Ltd. All rights reserved.
Solution ♦Matrix ♦Ltd
• First, the six items in Table 3 differ from each other with respect to the way benefi t values are assigned. Some would say they differ with respect to “hardness-softness:” Cost savings are sometimes viewed as hard benefi ts, and “Freed up professional time” as a softer kind of benefi t. Listing benefi ts individually this way allows critics to see how the whole benefi ts impact is derived, to assess “hard” vs. “soft” contributions. It is important to keep individual benefi t items visible in the fi nal report and not combine them.
• Second, if all benefi ts contribute to a company’s operating gains, then all contribute ultimately to tax savings or tax liability on operating income in the same way. If so, all benefi ts can appear in a single section. However, if some benefi ts represent capital gains or “extraordinary events, ” which may be taxed differently from operating gains, these benefi ts belong in a section of their own. (That distinction matters only in “after-tax” cases).
Following Benefi ts, the cash fl ow report will have one or more Costs or Expenses sections. There will probably be of two kinds, at least: Non-capital operating expenses, and Assets Purchases.
Cash outfl ows that qualify as non-capital operating expenses should be listed in a separate section from expenditures that represent asset purchases. Table 4 (next page) shows how this might look. Note that parentheses indicate these data are all outfl ows.
Here, “Operating Expenses” are divided into fi ve subsections, refl ecting the organization of an underlying cost model. (For this case, the cost model in Figure 1, page 14). Try insofar as possible to refl ect the structure of this model in the cash fl ow statement so that readers can better understand why different line item groups change as they do. For this example, Operating Expenses subsections follow the vertical axis categories of the cost model.
Asset purchases need to have a section or sections of their own. Compared to operating expense items, assets are usually budgeted and acquired differently, they are often fi nanced differently, and (in taxpaying organizations) they have very different tax consequences. Table 5 illustrates some points about the Assets section that are impor-tant—if this is an “after-tax” case:
Through end of …CASH FLOW STATEMENT Year 0 Year 1 Year 2 Year 3 Year 4 Year 4($ in 1,000's) Aug Aug Aug Aug Aug Aug
2001 2002 2003 2004 2005 2005BENEFITS / GAINS
Productivity improvements 0.0 400.0 618.0 742.6 819.5 900.4 3,480.6Customer satisfaction improved 0.0 240.0 316.8 418.2 552.0 728.6 2,255.6Downtime reductions 0.0 200.0 154.5 137.9 120.2 112.6 725.2Maintenance cost savings 0.0 400.0 412.0 424.4 437.1 450.2 2,123.7Avoided hiring - Add'l staff 0.0 239.0 239.0 270.7 304.2 287.2 1,340.1Reduced floorspace costs 0.0 12.5 12.9 13.3 13.7 14.1 66.4Sale of unused equipment 320.0 0.0 0.0 0.0 0.0 0.0 320.0Total Benefits/Gains 320.0 1,491.5 1,753.1 2,007.1 2,246.7 2,493.1 10,311.5
TOTAL
Table 3. Sample Benefi ts/Gains section from a business case scenario cash fl ow report.
Listing benefi ts individually allows everyone to see how the whole benefi ts impact is derived.
Try to refl ect the structure of the cost model in the subsections of the cash fl ow statement.

Business Case Essentials
20Copyright © 2003 by Solution Matrix Ltd. All rights reserved.
Solution ♦Matrix ♦Ltd
• Asset line items are organized in groups: All assets in a group share the same depreciation schedule (which will be noted in your assumptions or in notes accompanying the cash fl ow statement).
• Depreciation expenses are shown because they impact taxes (a cash fl ow item), but they do not contribute directly to the cash fl ow “bottom line” themselves (they are not real cash fl ow). “Total Asset Costs” do not include depreciation expenses.
• Depreciation expenses start for each asset in the year it was acquired, and then continue through its depreciable life.
Table 4. Sample Operating Expenses section from a scenario business case cash fl ow report.
CASH FLOW STATEMENT($ in 1,000's) Through end of …
Year 0 Year 1 Year 2 Year 3 Year 4 Year 4OPERATING EXPENSE ITEMS Aug Aug Aug Aug Aug AugCash inflows (outflows) 2001 2002 2003 2004 2005 2005
Hardware ExpensesHW maint cost increase 0.0 (120.5) (120.3) (150.7) (150.7) (150.7) (692.9)Additional small eqip expenses (12.8) (57.0) (69.0) (33.9) (13.1) (13.5) (199.4) Software ExpensesSW maintenances increases 0.0 (16.7) (16.7) (16.7) (16.7) (16.7) (83.5)End user appl's - expensed (32.0) (23.0) (23.7) (24.4) (25.1) 0.0 (128.2) Personnel ExpensesSystem Staffing Costs 0.0 (320.0) (356.2) (396.5) (441.3) (491.2) (2,005.1) NW/Comms ExpensesLine usage fees 0.0 (348.0) (412.2) (496.7) (588.3) (716.5) (2,561.7)Line maintenance 0.0 (180.2) (180.2) (180.2) (180.2) (180.2) (901.0) Other ExpensesElectrical power 0.0 (6.5) (6.5) (6.7) (6.7) (7.0) (33.4)Insurance 0.0 (4.2) (4.3) (4.5) (4.6) (4.7) (22.3)Security 0.0 0.0 (268.2) (276.3) (260.4) (293.1) (1,098.0)
Total Operating Expense Items (44.8) (1,076.1) (1,457.3) (1,586.5) (1,687.1) (1,873.6) (7,725.5)
TOTAL
CASH FLOW STATEMENT($ in 1,000's) Through end of …
Year 0 Year 1 Year 2 Year 3 Year 4 Year 4ASSETS PURCHASED Aug Aug Aug Aug Aug AugCash inflows (outflows) 2001 2002 2003 2004 2005 2005
GROUP 1: Server SystemsServer Systems (130.4) 0.0 0.0 (69.8) 0.0 0.0 (200.2)Peripheral HW assets (32.0) (34.9) (17.6) (23.7) (12.8) (8.2) (129.2)Group 1 Total Assets: (162.4) (34.9) (17.6) (93.4) (12.8) (8.2) (329.3)Group1 Depreciation Expense 0.0 (39.5) (67.5) (74.1) (78.7) (65.3) (325.1)
GROUP 2: SoftwareSoftware assets (130.0) (60.0) 0.0 (62.2) (41.6) 0.0 (293.7)Group 2 Total Assets: (130.0) (60.0) 0.0 (62.2) (41.6) 0.0 (293.7)Group2 Depreciation Expense 0.0 (38.0) (38.0) (48.0) (54.0) (54.0) (232.0)
GROUP 3: PC's and W/SPCs and workstations (300.0) (25.0) (30.0) (20.0) (30.0) (20.0) (425.0)Group 3 Total Assets: (300.0) (25.0) (30.0) (20.0) (30.0) (20.0) (425.0)Group3 Depreciation Expense 0.0 (65.0) (110.0) (76.0) (55.6) (58.3) (364.9)
Total Asset Costs: (592.4) (119.9) (47.6) (175.6) (84.4) (28.2) (1,048.1)Total Depreciation Expenses: 0.0 (142.5) (215.5) (198.1) (188.3) (177.6) (922.0)Est Tax Savings on Deprec 0.0 48.4 73.3 67.4 64.0 60.4 313.5
TOTAL
Table 5. Sample Assets Purchased section from a scenario business case cash fl ow report.

A Guide to Structure and Content
21Copyright © 2003 by Solution Matrix Ltd. All rights reserved.
Solution ♦Matrix ♦Ltd
• The Assets section also includes an estimate of tax savings due to depreciation expenses, over the analysis period. This is based on both the average tax rate on operating income, and depreciation expenses above. Tax savings are real cash fl ow and do impact the business case “bottom line.”
A scenario’s cash fl ow statement may have several sections of each type covered above (Benefi ts, Non-Capital Operating Expenses, and Assets). Different sections can highlight or bring together line items that should be evaluated together, e.g., lease-related items, or items related to fi nancing. The fi nal section of the cash fl ow report will be a Cash Flow Summary, where contributions from earlier sections are brought together. Table 6, below is an example based on Tables 3, 4, and 5.
A cash fl ow summary of case results like this is the focal point of the business case report. Here, within a few lines, lie the most direct answers to the question “What will be the fi nancial consequences if we take action?” The Net Cash Flow line shows a typical “investment curve” pattern, with a large net outfl ow in the fi rst year, and then increasing net infl ows in subsequent years.
In order to fully understand the results, compare them to other case scenarios, and apply them to management decisions, readers need to see analysis of the fi nancial model and basic cash fl ow results.
Analysis of results (this building block) develops information from the basic cash fl ow statement just presented. A broader analysis of the entire fi nancial model goes further, to examine sensitivity of results to changes in assumptions or input factors, risks, and contingencies (blocks in Section D, below).
The analysis normally begins with a summary of fi nancial metrics based on the net cash fl ow stream. These may appear here, immediately after a summary like Table 6, and they will also go into the Executive
Through end of …CASH FLOW SUMMARY Year 0 Year 1 Year 2 Year 3 Year 4 Year 4Cash inflows (outflows) Aug Aug Aug Aug Aug Aug($ in 1,000's) 2001 2002 2003 2004 2005 2005
Benefit Impacts 320.0 1,491.5 1,753.1 2,007.1 2,246.7 2,493.1 10,311.5Expense Item Impacts (44.8) (1,076.1) (1,457.3) (1,586.5) (1,687.1) (1,873.6) (7,725.5)Net Operating Inflow(Outflow) 275.2 415.4 295.8 420.6 559.6 619.4 2,586.0Tax Savings (Tax) on Inflow/Outflow (93.6) (141.2) (100.6) (143.0) (190.3) (210.6) (879.2)Asset Purchase (592.4) (119.9) (47.6) (175.6) (84.4) (28.2) (1,048.1)Tax Savings from allDepreciation Expense 0.0 48.4 73.3 67.4 64.0 60.4 313.5
0.0 1.0 2.0 3.0 4.0 5.0NET CASH FLOW (410.8) 203.7 222.9 172.3 352.9 446.0 987.2Cumulative Net CF (410.8) (207.1) 15.8 188.2 541.1 987.2 987.2
Discounted Cash Flow At 9.0 % (410.8) 186.9 187.6 133.1 250.0 289.9 636.7 At 15.0 % (410.8) 177.1 168.6 113.3 201.8 221.8 471.8
TOTAL
Table 6. Sample Cash Flow Summary section from a scenario business case report.
Analysis ofResults

Business Case Essentials
22Copyright © 2003 by Solution Matrix Ltd. All rights reserved.
Solution ♦Matrix ♦Ltd
Summary near the beginning of the report. A single line in Table 6—Net Cash Flow—contains all the information to produce the fi nan-cial metrics in Table 7.
When reporting cash fl ow results and their direct analysis, it is good form to minimize narrative interpretation. The idea, after all, is to give the numbers a chance, fi rst, to speak for themselves. Further elaborations are more appropriate in sections like Sensitivity, Risks, Contingencies, Conclusions, or Recommendations.
Figure 3. Graphical displays of cash fl ow results from Table 6
Annual Net Cash Flow
(600)
(400)
(200)
0
200
400
600
2001 2002 2003 2004 2005 2005
Cas
h Fl
ow (
$1,
000s
)
Cumulative Cash Flow
(600)(400)(200)
0200400600800
1,0001,200
2001 2000 2001 2002 2003 2004
Cum
ulat
ive
Cas
h FL
ow
($1,
000s
)
Annual Net Cash Flow and NPV
(500)(400)(300)(200)(100)
0100200300400500
Cas
h flo
w (
$1,
000s
)
Annual Net Cash FlowNPV @ 9%
Cumulative Cash Flow and NPV
(600)
(400)
(200)
0
200
400
600
800
1,000
1,200
2,001 2,000 2,001 2,002 2,003 2,004
Cum
ulat
ive
Cas
h Fl
ow (
$1,
000s
)
Cumulative Cash Flow
Cumulative NPV @ 9%
Cumulative NPV @ 15%
Server Systems Upgrade PurchaseSummary of Financial Results and Assumptions($ in 1,000's)
The estimated net benefit (cost) over the evaluation period is as follows:
After Tax Next Cash Flow 987.2Discounted Cash Flow 1 636.7 NPV at 9.0%Discounted Cash Flow 2 471.8 NPV at 15.0%
Payback Period 1.9 YearsInternal Rate of Return 50.5%
Evaluation period Sep 2001 - Aug 2006Evaluation period length 60 Months
Table 7. Summary of Financial Results (fi nancial metrics) for one scenario. These results are based on the fi gures in Tables 3, 4, 5, and 6

A Guide to Structure and Content
23Copyright © 2003 by Solution Matrix Ltd. All rights reserved.
Solution ♦Matrix ♦Ltd
Readers will probably also want to see the same cash fl ow line displayed graphically. Figure 3 shows some simple, direct ways of picturing the information readers expect to see: annual cash fl ow, cumulative annual cash fl ow, and a comparison of non-discounted and discounted cash fl ow streams.
If you assign no fi nancial value to a real impact, it contributes exactly nothing to the fi nancial analysis. For this reason, we recommend that you try very hard to quantify every benefi t and cost impact associated with the case subject. Even so, however, there may be some impacts that cannot be quantifi ed acceptably in monetary terms. On the benefi t side, for instance, these may include contributions to corporate image, customer satisfaction, or employee morale. These may represent major corporate objectives, which should ultimately translate into lower costs and increased revenues. Nevertheless, you and your audience simply may not be ready to accept value estimates for them with confi dence. These non fi nancial results will not enter the fi nancial model or cash fl ow results, or fi nancial metrics, yet they may still deserve consideration in the proposal. What can or should you say about them?
When non fi nancial result are real, when they are large enough to matter, and when they clearly impact a business objective, we recom-mend taking as many of the following three steps as possible:
1. Be sure the expected impact is recorded
Describe it immediately after the cash fl ow statement and its analysis, and in the Executive Summary, and where relevant in Conclusions or Recommendations.
2. Make the impact tangible
Even if the impact is not valued immediately in fi nancial terms, describe its effects in ways that can be observed and verifi ed. You may expect a real “improvement in staff professionalism,” for instance, but not be able to evaluate the value of that in monetary terms. You can, however, describe the likely effects of that benefi t in other observable terms, such as lower staff turnover, easier recruiting, less absenteeism, and so on.
3. Compare the impact directly to the fi nancial impacts of the case, but in non fi nancial terms
Figure 4 (next page) illustrates one approach.1 The graph summarizes the consensus view of a large international bank’s Executive Committee after considering an it action—putting local area networks and personal productivity software into branch offi ces for the use of loan offi cers. The Committee used a “score and weight” consensus-building technique to rate the relative contributions of various benefi ts to the bank’s overall strategic business goals.
1. For more information on the score and weight method mentioned here, see the Business Case Guide.
Non FinancialResults
Non fi nancial results:• Put them on the record• Make them tangible• Compare them to the
fi nancial impacts in non fi nancial terms

Business Case Essentials
24Copyright © 2003 by Solution Matrix Ltd. All rights reserved.
Solution ♦Matrix ♦Ltd
Surprisingly, in this exercise, the two top rating went to a non-quantifi ed benefi t: “Improved company image,” while one benefi t that was quantifi ed (Increased productivity) fi nished fi fth out of the fi ve benefi ts considered. Of course, everyone expects company image and improved customer satisfaction to help deliver revenues and profi ts, but the value of the it contribution to these goals was impossible for this group to quantify comfortably. However, subjective ratings such as those in Figure 4 reminded everyone that even “soft” benefi ts are important and worth paying for.
Figure 4. The consensus view of one bank’s Executive Committee: A score and weight rating method was used to compare fi nancial (indicated with $) and non fi nancial benefi ts (indicated with “NF”). Consensus weightings are the relative contributions of benefi ts to overall business objectives.
Consensus View: Importance of Benefits
0 10 20 30 40 50 60 70 80 90 100
($) Increased productivity
(NF) Imrpoved Customer Satisfaction
(NF) Position as Total Solution Supplier
($) Reduced Time to Market
(NF) Improved Company Image

A Guide to Structure and Content
25Copyright © 2003 by Solution Matrix Ltd. All rights reserved.
Solution ♦Matrix ♦Ltd
Building Blocks D: Sensitivity, Risks, and Contingencies
Almost all business cases involve uncertainty because they project results into the future. The “Business Impact” blocks above represent the author-analyst’s view of the most likely outcome, but no matter how solid the methods and analysis behind the results, audiences will have other questions, such as:
• What happens if some of the assumptions change? • Just how likely is this set of results? How likely are other possible results?• What must happen in order to obtain the results pictured here? • What can we do to maximize results?
Answers to questions like these are addressed in building blocks that deal with sensitivity, risks, and contingencies.
Sensitivity analysis asks “What happens if the assumptions change? Remember that the fi nancial model and its cash fl ow summary are the product of “hard” (relatively certain) data, but also assumptions about values and trends during the analysis period, of such factors as:
• Business volume or sales revenues• Market growth rate• Competitor business volume in the same market• Salary levels• The rate of infl ation• Prices of raw materials or commodities• Prices of assets (e.g., land, buildings, stock, mineral rights)• Time required for staff to learn new skills• Time required to develop and ship new products
What happens to case results if the values assumed for the case are wrong? Will the overall net cash fl ow change much? How will this affect the estimated payback period or irr? Such questions need to be answered on an assumption-by-assumption basis, because changes in some assumptions may impact results profoundly, while other assump-tions can change greatly with little effect on results. This building block represents the systematic attempt to measure the sensitivity of results to changes in specifi c assumptions. Put another way, this analysis examines the sensitivity of your fi nancial model’s primary outputs, to changes in individual input factors.
The theory, methods, and subtleties of sensitivity analysis are beyond the scope of this document, but Figure 5 (next page) shows how results from a simple form of the approach may appear. Note that two curves on the graph share a common vertical axis (total cash fl ow results), but each has different scaling and different fi gures on the horizontal axis. In a nutshell, these curves say that overall cash fl ow is highly sensitive to “Business Volume,” and relatively insensitive to the “Average Price of Oil.” The graphs show what happens to one result while one assump-tion is changed but all other assumptions are held constant. Analyses like this serve several purposes:
SensitivityAnalysis

Business Case Essentials
26Copyright © 2003 by Solution Matrix Ltd. All rights reserved.
Solution ♦Matrix ♦Ltd
First, they provide a rough but immediate guide to readers who may not agree with all your assumptions. They can mentally “plug in” their own preferred value for an assumption, and know something about the effect on results. Second, they simplify subsequent risk analysis and simulation modeling (next building block). Assumptions or input factors that have little impact on results can be dropped from complex simulation. Third, they begin to show management how to optimize results. Factors that have a strong impact on results obviously deserve the most attention.
This part of the case report should briefl y identify the assumptions or input factors that have a strong impact on results, identify also those that have little impact on results, and discuss anything else that may be important to understanding the sensitivity analysis. You may, for instance, point out which assumptions are related to results in a linear fashion and which are not.
Finally, when discussing sensitivity to assumptions or input factors, the implications for management are clearer if you divide them into two groups:
• Those that are completely outside your control These might include such things as: the rate of infl ation,
competitor’s actions, foreign currency exchange rates, natural disasters, acts of war, or government regulation.
• Those which you can infl uence or control to some degree These might include such things as: skill levels of your
professional staff, timely completion of related projects, achieving cost control goals, recruitment and hiring of key individuals, and many others.
Figure 5. Sample sensitivity analysis results. The curves say that projected cash fl ow results (vertical axis) are sensitive to changes in business volume, but relatively insensitive to changes in average oil price.
Sensitivity to Assumptions
0
200
400
600
800
1,000
1,200
1,400
1,600
1,800
2,000
Proj
ecte
d N
et C
ash
Flow
($ in
1,0
00s)
Business Volume
Oil Price
Assumption ValuesLowest Highest
Most Likely
Most Likely
Assumptions
Factors that have a strong impact on results obviously deserve the most attention from management.

A Guide to Structure and Content
27Copyright © 2003 by Solution Matrix Ltd. All rights reserved.
Solution ♦Matrix ♦Ltd
The fi nancial statement predicts a single overall net cash fl ow fi gure. Everyone knows, however, that the actual result will not be exactly that, even if this is the single most likely result. But how likely is “most likely?” And how likely are other fi nancial results? Risk analysis addresses these questions.
There are simple ways and complex ways to address “risk” in the business case, but the better methods all have this in common: they keep individual risks in view. Risks, unfortunately, are often lumped together. One common approach is simply to set higher “hurdle” rates or require shorter payback periods for proposals under consideration. If this is done without an eye on the individual risk components, the accuracy of the business case and management’s ability to control risk suffer.
Methods of risk analysis are beyond the scope of this document, but we can describe briefl y one that is used often: Monte Carlo simula-tion. This technique shows how the bottom line of the fi nancial model changes when all of the important input factors (or assumptions) change at once. Very briefl y, Monte Carlo asks you to identify the input factors have the most control over results (which was done in sensitivity analysis). For each important input factor, you assign minimum and maximum possible values, and then describe the likelihood the factor will have different values between its minimum and maximum (in statistical terms, describe the probability density function for the input variable). Monte Carlo’s main output is a probability “curve” like Figure 6 that lets you make statements like this: “We have a 90% chance of realizing a net gain of at least $2 million, we have a 50% chance of gaining $5 million, and we have a 10% chance of gaining $7.5 million.
Such statements may be more useful to management than a single best estimate. If a gain of $2 million is as a “good” result, and there’s a
90% chance of achieving it, the decision to go forward with the proposal is easy. If the action absolutely must return $5 million or more, than a 50% risk may be unacceptable. It is possible to develop this kind of information about overall results only when you know something about individual risk factors and analyze their collective behavior.
A section summarizing contingencies and depen-dencies can be key to making the business case predictions come about.
RiskAnalysis
Figure 6. Sample results from Monte Carlo simulation with the fi nancial model. The curve shows the probability that cash fl ow results will total at least to the
Probability of Cash Flow Results
0.0
0.2
0.4
0.6
0.8
1.0
$0 $2,000 $4,000 $6,000 $8,000 $10,000
Net Cash Flow ($1,000s)
Revers
e C
um
ula
tive P
robabili
ty Probability that net cash flow results are at least $5,050,000 is 0.50

Business Case Essentials
28Copyright © 2003 by Solution Matrix Ltd. All rights reserved.
Solution ♦Matrix ♦Ltd
The section reminds everyone (especially senior management) that the case subject has business objectives, and that reaching these objectives requires contributions from different people and organizations.
A computer system upgrade and new software might be intended, for instance to make reservations clerks in a car rental company 50% more productive. Simply installing the hardware and software alone may not deliver that goal. The desired productivity improvements may also require that clerks receive special training, master new skills, be managed differently, and be compensated differently. It may also require contributions from other parts of the organization—Marketing, for instance. It may also depend on factors that are completely outside the company’s control, such as the health of the overall economy.
This section is the place to develop and summarize the practical implications of the sensitivity and risk analyses, in terms of what must be done, by whom, by when, in order to bring the expected fi nancial results. It is also the place to show management how to maximize or improve results above the “most likely” predictions, based on the same analyses. It is important that the individual owners of the contingen-cies and dependencies described in this section acknowledge and affi rm their responsibilities before the proposed action begins. Putting these commitments “on the record” ahead of time helps ensure they will be met.
Contingencies& Dependencies
Responsibilities should go “on the record” before the proposed action begins.

A Guide to Structure and Content
29Copyright © 2003 by Solution Matrix Ltd. All rights reserved.
Solution ♦Matrix ♦Ltd
Building Blocks E: Conclusions and Recommendations
Blocks in this section address issues that were raised initially in the Introduction (or Background, Over-view, or Situation) at the beginning of the case report. Much of the preceding material intends to “let the numbers speak for themselves,” but the fi nal sections of the report interpret the numbers and connect them to objectives, decisions, and actions.
It is rarely safe to assume that readers will automatically read your fi nan-cial results and analyses, and then draw the same conclusions you drew regarding the implications for decisions or actions. Use the conclusions section to state the complete “case,” tersely but completely, supporting your reasoning with evidence from the preceding sections. This section will be very weak if it is nothing more than a simple list of major fi nan-cial projections.
Effective conclusions sections are generally organized around the business objectives addressed by the subject of the case. If the subject of the case is meant to increase productivity, increase sales, reduce costs, solve quality problems, shorten development time, provide extra capacity, or improve customer service, for instance, then the conclusions section should focus on the expected contribution to these objectives in terms of the results and analyses developed earlier.
All of the important decision criteria necessary for the case to achieve its purpose should be presented and evaluated here, as well as any helpful interpretation of results the author can provide. If, for example, net cash fl ow and payback period are both important criteria for the audience, and if the analysis produces a strong instance of one criterion but a weak instance of the other, then the relative importance of the two for the immediate setting should be discussed.
The conclusions section is also the place to point out any surprising or unexpected results of the analysis and to discuss any fi ndings that could be misinterpreted.
Explicit recommendations for the audience should come at the end of the case report. They are, after all, based on the preceding conclusions, which are based on preceding analyses.
Even when the author’s recommendation is obvious and known to all (“Fund my proposal!”), we suggest including a formal recommenda-tion statement. For example:
Based on the short payback period, the relatively low risk asso-ciated with this investment, and the losses in revenue and profi ts Acme Corporation currently suffers due to lack of manufacturing capacity, we recommend:
1. Approval of $7.5 million capital funding for manufacturing equip-ment and increased fl oor space, as proposed.
Conclusions
Recommendations
Business Case Essentials
30Copyright © 2003 by Solution Matrix Ltd. All rights reserved.
Solution ♦Matrix ♦Ltd
2. An increase of $2.5 million in the operating budget for fi scal year 1999, above currently planned levels, to cover additional wages, retooling, power consumption, and other operating expenses described in the capacity increase proposal.
3. That implementation of the capacity increase proposal to begin in October 2001 and be completed by March 2002.
A good recommendations section brings closure to the case and, when appropriate, reminds the audience that “the ball is now in their court.” Note that the example takes this opportunity to state for the last time why the action is recommended.
Finally, you can use the recommendations section to remind the audience once more to give special attention to important contingencies or dependencies.

A Guide to Structure and Content
31Copyright © 2003 by Solution Matrix Ltd. All rights reserved.
Solution ♦Matrix ♦Ltd
Further Information
Solution Matrix White PapersThe following Solution Matrix White papers are available at no charge.
• Case What’s a Business Case? and Other Frequently Asked Questions • The IT Business Case: Keys to Accuracy and Credibility• Business Essentials: A Guide to Structure and Content
For More InformationThe contents of this paper are covered in detail in the books The Business Case Guide (isbn 1-929500-01-7) and What’s it Worth? The it Business Case (isbn 1-929500-04-1). For more information on these books visit the Solution Matrix Ltd. web site at
www.solutionmatrix.com.
Copyright and Permission to ReproduceThe contents of this document are the copyrighted property of Solution Matrix Ltd. Permission is hereby granted to reproduce and distribute this document under the following conditions only: The cover page and this page (page 31) , each with the Solution Matrix Ltd. name must be included; the Solution Matrix Ltd. copyright notice must also appear at the bottom of each page. Except for brief quotes, any other reproduction, transmission, or use of this material is a violation of United States and international copyright laws.
About the AuthorMarty J. Schmidt, M.B.A. Ph.D., is founder and President of Solution Matrix Ltd. Dr Schmidt has twenty years business experience, managing software development, international marketing and sales support, and, (since 1987) management consulting on business issues. He is a recognized authority on the application of cost/benefi t analysis and business case development.
Dr. Schmidt also taught graduate and undergraduate statistics at the University of New Hampshire, is the author of a college textbook on statistics, and publishes often on professional management and business issues. He holds the Ph.D. degree from Purdue University and the M.B.A. from Babson College.
About Solution Matrix Limited
Solution Matrix Ltd. is a management consulting fi rm dedicated to helping executives, managers, consultants, and other professionals understand the impact of management actions on business performance. Our clients include individuals and organizations on fi ve continents, in business, government, education, the military, and non-profi t organizations.
Solution Matrix Ltd. was incorporated in the United States in Delaware (1994),certifi cate of incorporation 944200647-2389562 and Foreign Corporation Certifi cate 467876 from the Commonwealth of Massachusetts (1994). The company’s Dun & Bradstreet Number is 964931414. Solution Matrix Ltd. is a registered US Government contractor in the Central Contractor Registration (CCR) database (http://www.ccr.gov), CAGE code IQXP6.
For more information on our products and services, visit our web site at http://www.solutionmatrix.com.