a soil-water-nitrogen model for irrigated corn on sandy soils1
TRANSCRIPT
A Soil-Water-Nitrogen Model for Irrigated Corn on Sandy Soils1
D. G. WATTS AND R. J. HANKS2
ABSTRACTA model was developed which describes the net changes of nitrogen
amounts due to transformations and the movement, uptake, and lossof nitrogen from the root system of irrigated corn (Zea mays L.)grown on sandy soils. A potential nitrogen uptake function developedfrom field data is used to determine the maximum uptake fornonlimiting soil water and nitrogen availability. Actual uptake iscalculated as less than potential when soil water content and/ormineral nitrogen concentration and distribution limit convective anddiffusive movement of nitrate to the root system. Separate calculationsare made for uptake resulting from each of these two mechanisms.Seasonal nitrogen uptake was computed within ± 15% of measureduptake on field plots where uptake by above ground plant materialranged from 105 to 218 kg/ha. Computed, nitrate leaching lossescompared favorably with losses estimated by multiplying percolationloss determined from a weekly water balance, by measured nitrateconcentration at 150 cm depth. Field leaching losses estimated by thewater balance-concentration method ranged from 37 to 154 kg/ha.
Additional Index Words: nitrate leaching, nitrogen uptake, massflow, diffusion, irrigation management.Watts, D. C., and R. J. Hanks. 1978. A soil-water-nitrogen model forirrigated corn on sandy soils. Soil Sci. Soc. Am. J. 42:492-499.
'T'HE PRODUCTION of irrigated corn (Zea mays L.) isA rapidly expanding on large areas of sandy soils in the
central Great Plains. Pumps are supplying ground water toseveral thousand new center pivot sprinklers each year.Unfortunately, the development of new knowledge aboutthe management of production inputs in this situation hasnot kept pace with the rate of change to irrigated farming.The water and fertilizer management techniques developedfor heavier textured soils and low cost energy are not allapplicable to the sandy soils. More skill is required tocontrol the timing of application and amounts of water andnitrogen to obtain satisfactory yields while keeping thecosts of pumping and fertilization at a reasonable level.
Over-irrigation on sandy soils can rapidly leach nitratenitrogen from the crop root zone, resulting in nitrogendeficiencies and decreased yields unless corrective action istaken. The typical response to this problem, a supplementalapplication of nitrogen in the irrigation water, may com-pensate for leaching losses, but increases operational costs.It may also contribute to potential ground-water pollution.Even when irrigation amounts are controlled so that the rootzone water content is raised only to field capacity with eachapplication, leaching will still occur if rains follow soonafter irrigation is applied. A planned deficit irrigation,leaving "room for rain" in the root zone, will minimizeleaching. However, on sandy soils with low water holding
•Published as Pap. no. 5394, Journal Series, Nebraska Agric. Exp. Stn.Support of this project was received in part from the Office of WaterResearch and Technology, U.S. Dep. of the Interior, under Public Law88-379 program. The work reported here was sponsored in part by theNebraska Water Resources Center. Received 8 Aug. 1977. Approved 3Jan. 1978.2Associate Professor of Agric. Eng. Univ. of Nebraska, Lincoln, NE68583, and Professor and Head of Dep. of Soils and Biometeorology,Utah State Univ.
capacity this practice can result in yield loss if the irrigationamounts are too small or if applications are poorly timedand rainfall does not occur.
To provide better water and nitrogen management guide-lines for irrigated corn production on sandy soils a parallelprogram of field measurements and computer model de-velopment was undertaken. The general approach was tocollect field data documenting the effects of N source, rate,and timing of fertilizer application, and amount and timingof irrigation on corn yield and nitrogen losses. These datawere used to verify and adjust the model which was thenused to estimate nitrogen uptake and loss for a range ofmanagement practices. The field work was conductedjointly by the University of Nebraska Experiment Stationand the USDA-ARS at the University's Sandhills Agricul-tural Lab., 75 km north of North Platte, Nebraska.
BASIC CONCEPTThe model reported in this paper simulates the net changes of
nitrogen amounts as the result of transformations and the move-ment, uptake, and loss of nitrogen from the root zone of anirrigated corn crop during the growing season. It was developed toaid in the evaluation of the probable effects of different water andnitrogen management practices such as reduced irrigation ordelayed N application. It is not intended to be a tool for examiningindividual processes in detail, as does the nutrient uptake model ofCaassen and Barber (1976). Rather, the model provides a meansof examining on a "macro" scale the interaction of the majorprocesses affecting nitrogen uptake and leaching in the sandy soilenvironment.
Although numerous simplifying assumptions have been made,the model appears to yield a reasonable simulation of the fieldsituation. For example, rather than trying to develop field data onthe variation of root surface area with time and depth, the bulkroot concept of Nimah and Hanks (1973a) was extended toestimate nitrogren uptake.
In the development of the model, it was assumed that nitrate isthe only nitrogen form taken up by the corn plant. The authorsrecognize that during early stages of growth ammonium can be animportant component of available nitrogen (Schrader et al.,1972). However, it is assumed that nitrate represents a very largepercentage of mineral N uptake during the life of the plant.Ammonium uptake can be modeled when more information isavailable to quantitatively describe the mechanisms which causediscrimination between ammonium and nitrate uptake by the rootsystem.
There are several potential nitrogen sinks which are notpresently considered in the model. These include volatilization atthe soil surface, denitrification, and biological immobilization.There is evidence that immobilization may be a significant factorin the disappearance of mineral nitrogen from the root zone of thesoils in question (Olson, 1976). Investigation of possible losses bythe other mechanisms is continuing.
Soil Water Movement and Root ExtractionWater flow and root uptake of water are simulated using the
finite difference model of Nimah and Hanks (1973a, 1973b) withthe modifications presented by Childs and Hanks (1975). Themodel simulates a growing root zone and growing plant cover as afunction of time. The total daily evapotranspiration (ET) isconverted into a sinusoidally varying rate over the daylight periodto simulate the diurnal fluctuation of atmospheric demand.
492
WATTS & HANKS: SOIL-WATER-N MODEL FOR CORN ON SANDY SOILS 493
Nitrogen Movement in the SoilIn sandy soils attention must be given not only to the mobility
of nitrate, but also to the movement of urea (Broadbent et al.,1958). On very sandy soils with low cation exchange capacity, themovement of ammonium may be limited but significant. We haveconsidered all three nitrogren forms. In the model, urea isconsidered to be as mobile as nitrate. Ammonium in the soilsolution is assumed to be mobile. The amount in solution in anydepth increment is computed as a percentage of that on theexchange complex.
Movement in the soil of the various nitrogen forms is modeledusing a finite difference solution of the one-dimensional ex-pression for transient flow, presented by Bresler (1973),
d(Q+6C)_ .dt a
whereQ = concentration of solute in the absorbed phase,
(meq/cm3 soil),C = concentration in the solution phase (meq/cm3 soil
solution),6 = volumetric soil water content,
D(V,Q) = combined dispersion-diffusion coefficient,q - volumetric flux of solution cm3/cm2/unit time,
S(Z) = any sink or source rate term due to uptake, ornitrogen form change,
Z = depth in the soil, and/ = time.
The S(Z) sink term may be positive or negative. It is used ineach depth increment in the calculations to account for theaddition of nitrate to the soil solution through nitrification or itsremoval by plant uptake. To simplify the calculations, themovement of nitrate, urea, and ammonium are considered to beindependent of each other. Parallel solutions of Eq. [1] are madefor each nitrogen form. Sink terms are included to allow for theconversion of urea to ammonium and for the gain or loss ofammonium because of mineralization, nitrification, or movementto or from the soil solution to the exchange complex.
Soil TemperatureSoil temperature at any time and depth are computed by a finite
difference solution of the basic equation for unsteady heat flow ina homogeneous soil, in a manner similar to Hanks et al. (1971). Inthe absence of soil temperature data the soil surface temperaturemay be estimated from air temperature. We have used theapproach of Childs et al., 1976, to simulate the air temperature atany time, when the daily maximum and minimum temperaturesare known. The daily temperature wave is computed as asinusoidal function, with unequal periods for the day and nightportions depending on day length. We assume that the soil surfacetemperature is the same as air temperature after full cover.Between emergence and full crop cover the diurnal soil surfacetemperature fluctuation is assumed to have the same form as thatof the air temperature, but the daily maximum is higher, asexpressed by Eq. [2]
T = TI ms L max (C, - {(C, -!)/[! + exp(6.0 - 12.0 tae / ftc)]}) . [2]
In the above expressionTins = maximum soil surface temperature,Tma = maximum air temperature,C, = approximate ratio of maximum soil surface temperature
to maximum air temperature for bare soil at the time ofemergence,
'fc = time in days between emergence and full cover, and4e = elasped time in days since emergence.
Equation [2] provides for the increased shading of the surface
as the plant canopy grows. It parallels the crop cover growthfunction in the soil water model. The expression inside the largeparentheses is approximately equal to C, at emergence and 1.0 atfull cover.
Nitrogen Transformations
MINERALIZATION OF ORGANIC MATTERThe mineralization of organic matter to ammonium is described
by a first-order rate equation derived from equations presented byStanford and Smith (1972), and Stanford et al. (1973).
Nto = N0[l — exp(—Af0Ar)] [3]
whereN,0 = N mineralized in time Af at optimum soil moisture
content,NO = potentially mineralizable N in the soil depth increment
at the beginning of the time interval,A? = time interval (hours), andKO = mineralization rate coefficient (I/hours).
The value of KO is computed as a function of Ta, the absolute soiltemperature:
K0 = exp(17.753 - 6350.5 / Ta) / 168.0. [4]
If the soil temperature at any point exceeds 308°K (35°C), the rateconstant is approximated by the 35°C value (Stanford et at.1973).
Nto must be adjusted for the effect of soil water content on themineralization rate. Based on the findings of Stanford and Epstein(1974), and Pilot and Patrick (1972), N,, the amount of Nmineralized under existing moisture conditions is given as
[5]where
Rm = 1.111 FPS; 0.0 < FPS < 0.9, [6]
Rm= 10.0- 10.0 FPS; 0.9 <fP5< 1.0 [7]
In the foregoing, Rm = reduction coefficient for water contenteffect, and FPS = fraction of fillable pore space containingwater.
NITRIFICATIONThe nitrification of ammonium is computed according to the
first-order rate equation
whereNno = amount of ammonium converted to nitrate in time A/ at
optimum water content,Na = amount of available ammonium subject to conversion at
the beginning of the time interval, andKa = transformation rate coefficient for the conversion of
ammonium to nitrate.M. H. Frere (personal communication) in unpublished work has
indicated that the rate coefficient may be calculated as
*„ = (0.032rc - 0.12)*35; 10°C < 7C =£ 35°C, [9]
where ka = rate coefficient for conversion of ammonium to nitrateat a given soil temperature (I/hour), kx = rate constant at 35°C(I/hour), and Tc = soil temperature (°C.).
For lower temperatures the constant may be computed as
ka = (o.oiosrc + . 5; o°c < rc s io°c. [10]
494 SOIL SCI. SOC. AM. J., VOL. 42, 1978
0.9
OS
0.7
0.6
0.5
0,4
03
0.2
O.I
0 FIELD DATA
—— 0 f- FGS <-OA FTNU = 8^78 F6S3'87
OB 1 FGS- I/), FTNU"(V660 FGS *3.485 FGS2-0.930FGS3 -0.899 FGS*
0 Q(l 0,2 0,3 0.4 Q£ 0,6 0,7 OJ3 0.9 LO
FRACTION OF GROWING SEASON (FGS)
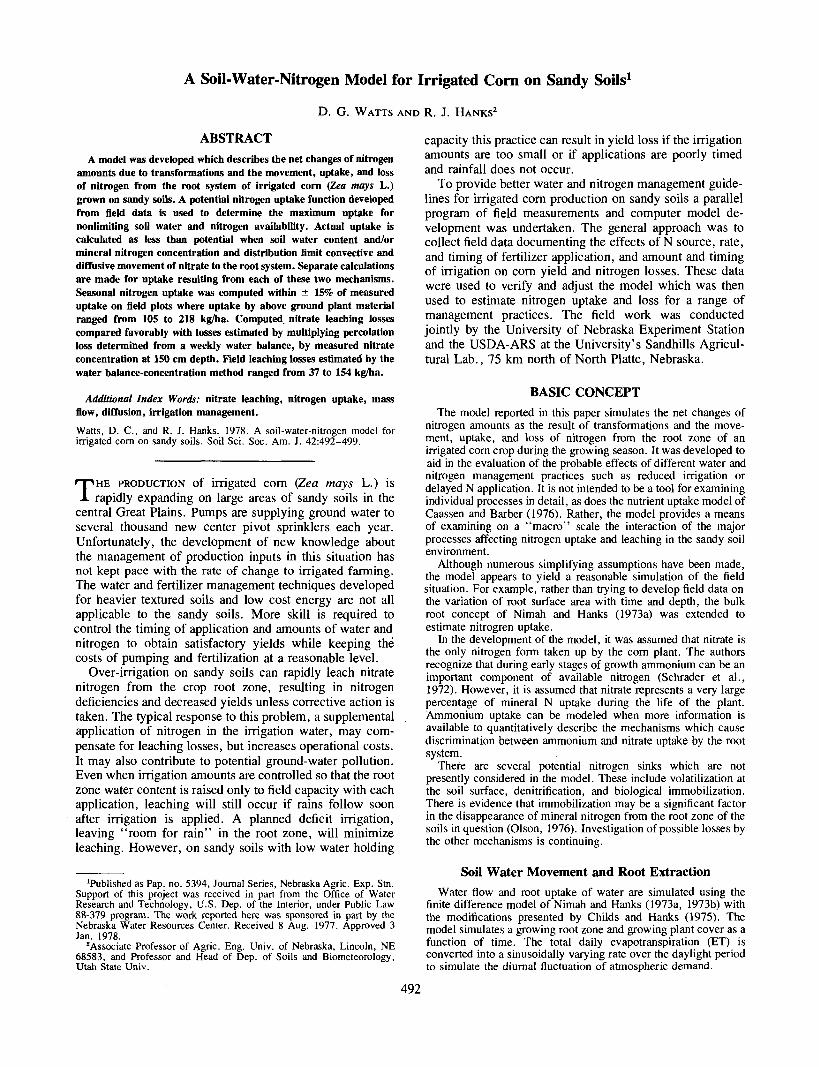
Fig. 1—Dimensionless N uptake function developed from field plotdata assumed to represent nonlimiting water and N availablity.
Above 35°C the rate constant reduces to zero at 45°C in a linearfunction yielding
fca=(-0.irc + 4.5)fc35;35°C<Tc=£45°C. [11]
The moisture reduction functions given in Eq. [6] and [7] are alsoused to compute^, the actual amount of ammonium transformedin the time interval as
[12]
HYDROLYSIS OF UREAThe hydrolysis rate of urea is computed as a function of soil
temperature only, as given by Dutt et al. (1972).
Ru= -413+ 1561oglorc+ 153log10£/n [13]
where Ru = rate of change of concentration of urea N, given asppm/day of N hydrolyzed to ammonium carbonate; TC — soiltemperature (°C), and Vn = urea concentration (ppm of N).Equation [13] is subject to the following conditions:
u<5.0, Ru=Un.If 0°C s rc < 10.0°C, Ru = log,0(rc) .if TC<O°C,RU = Q.
In accordance with Dutt's findings, no soil water contentcorrection is made in the urea hydrolysis equation.
Potential Nitrogen Uptake Demand FunctionA potential uptake demand function is used in the model
to estimate potential nitrogen uptake by the crop at any timeduring the growing season. The function establishes thepotential nitrogen uptake rate by the plant for conditions ofnonlimiting nutrient availability in the soil and no moisturestress in the plant. Nitrogen uptake computed from themodel may be less than the potential uptake because offactors limiting ion movement to the root system.
The uptake function was developed from plant sampledata taken in 1974 on optimally irrigated plots that received355 kg/ha of N as ammonium nitrate (Watts, 1975). 3Figure 1 shows the demand curve presented as a di-mensionless function of FTNU, the fraction of the totalnitrogen uptake vs. FGS, the fraction of the growingseason. The equations for the various segments are given in
3D. G. Watts. 1975. A soil-water-nitrogen-plant model for irrigatedcorn on coarse-textured soils. Ph.D. Thesis. Utah State Univ.
the figure. By putting the function in dimensionless form itcan be adjusted to model shorter or longer season varie-ties.
To begin the calculations for a growing season the modelmust be initialized with values of growing season lengthand maximum yearly nitrogen uptake for nonlimitingnutrient levels. The maximum uptake should represent thetotal potential uptake of nitrogen by the plant includingstorage in the root system.
Clark (1975) showed a maximum top/root weight ratio of6.7 for corn grown in nutrient solution. However, Foth(1962) found a maximum ratio of 10.7 for corn grown on asandy soil. D. E. Smika (personal communication) found anitrogen concentration of 1.1 to 1.2% in root systems ofcorn grown on sands in northeastern Colorado. In all casesthe values reported were for the end of the growing season.We assumed that the sandy soil data would be moreapplicable to the soils with which we were working.Accordingly, the model was designed so that the rootstorage of nitrogen follows the same pattern with time asthe storage in the above ground plant material and is equalto 10% of the uptake by the above ground plant.
To calculate the potential uptake on a given day theuptake function is used to compute the maximum possibleaccumulated uptake at the beginning of the day and again24 hours later. For any time prior to the completion oftasseling, the daily potential demand is the differencebetween the two "beginning of day" totals plus any uptakedeficit accumulated since emergence. The deficit is definedas the difference between accumulated potential uptake andaccumulated actual uptake.
After tasseling, any nitrogen deficit existing at thebeginning of a day is multiplied by the decimal fraction ofthe time remaining between the end of tasseling and the endof the growing season. This procedure continually reducesthe effective uptake deficit "seen" by the plant so that atthe end of the growing season the deficit equals zero,regardless of the total difference between accumulatedpotential and actual uptake. This is similar to the concept of"zero end of season nitrogen stress" expressed by Green-wood (1976). This procedure simulates the inability of theplant to greatly increase nitrogen uptake in the last half ofthe growth cycle even if root zone nitrate content isincreased.
The assumption is made in the model that any transpira-tion deficit will cause a reduction in dry matter productionand that there will be a corresponding reduction in yearlynitrogen uptake. Accordingly, the daily nitrogen uptakerequirement determined from the demand function ismultiplied by the ratio of the accumulated actual transpira-tion (since emergence) to the accumulated potential transpi-ration. These two sums are obtained directly from the soilwater-ET sections of the model. Short-term water deficiteffects on nitrogen uptake are accounted for in the modelby limited ion mobility as soil water content is decreased.The accumulated effect, however, is a reduction in po-tential uptake due to reduced plant growth.
Once the total daily potential demand is ascertained thissum is converted to a sinusoidally varying potential uptakerate function during the daylight hours. This results in avariable nitrogen uptake demand parallel to the variable ET
WATTS & HANKS: SOIL-WATER-N MODEL FOR CORN ON SANDY SOILS 495
SOIL WATER CONTENT - percent by volume
_0 10 _ 20 30 0 JO i 20 30 0 , JP . 2.0 30
\
8/6
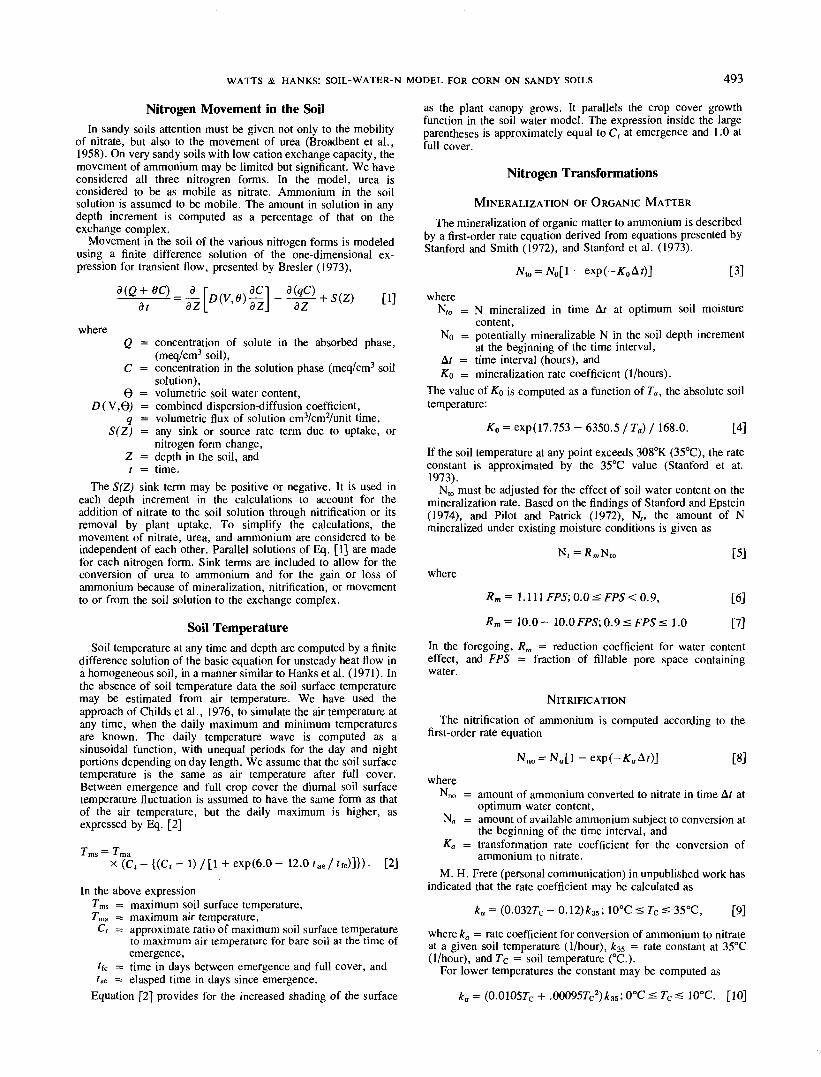
Fig. 2—Computed and measured soil water content profiles for threedates in 1975.
demand function. Uptake is assumed to be zero at nightwhen transpiration is also assumed zero.
MODELING NITROGEN UPTAKE MECHANISMSThe movement of soluble soil N to the root system is
accomplished both by convective or mass flow and by diffusion(Barber, 1962; Olsen and Kemper, 1968). Mass flow has beenconsidered by many to be the predominant mechanism (Barberand Olsen, 1968). In a series of experiments, Liao and Bar-tholomew (1974) showed that nitrogen uptake by corn could beless than, equal to, or greater than that predicted by mass flowalone, depending upon a number of factors related to both plantand soil conditions. Their work suggests that in some situations,apparently where plant N content is fairly high, plant processescan discriminate against nitrogen uptake. In such cases actualuptake may be considerably less than the amount transported tothe root surface by the transpiration stream. This concept has beenincorporated in the uptake section of the nitrogen model. Maxi-mum uptake in any 24-hour period is limited to the amountprescribed by the potential uptake function, if no deficit existsbetween the accumulated potential and actual uptake amounts.
In developing the model, we initially assumed that mass flowwas the sole mechanism for transporting nitrate from the soil tothe root system. Using this assumption, computed N uptake wasonly 40 to 60% of the total uptake by corn on experimental plotsreceiving treatments of limited nitrogen amounts or excessirrigation. Several possible reasons for this discrepancy wereexamined.
a) The model did not adequately describe soil water flowand/or water uptake by the crop.
b) The transient flow expression for nitrogen movement didnot fit the field situation.
c) The functions for describing the changes in nitrogenamount resulting from transformations were inade-quate.
d) A mechanism other than mass flow could have beenimportant in nitrogen transport to the roots.
The similarity of computed and measured water content profilesthroughout the growing season lead us to conclude that thecomputed profile distribution of water uptake by the crop wassimilar to the field situation. Figure 2 shows a comparison forthree dates. Results were equally close throughout the season forall treatments. To make the calculations the model was providedwith conductivity and water content-suction data obtained frominplace and laboratory measurements (Watts, 1975).3 Separateconductivity data were provided for a layer of reduced permeabil-ity at the bottom of the root zone. Daily values of ET measured bya lysimeter in the experimental plots and daily rainfall andirrigation amounts were also provided as inputs.
In the field work no periodic measurements of mineral nitrogencontent of the soil were made. Data were collected only at thebeginning and end of the growing season. However, using
150
125
100
75zoo'„ 50oz
25
—— MODEL- - - FIELD
4 6TIME -weeks
10
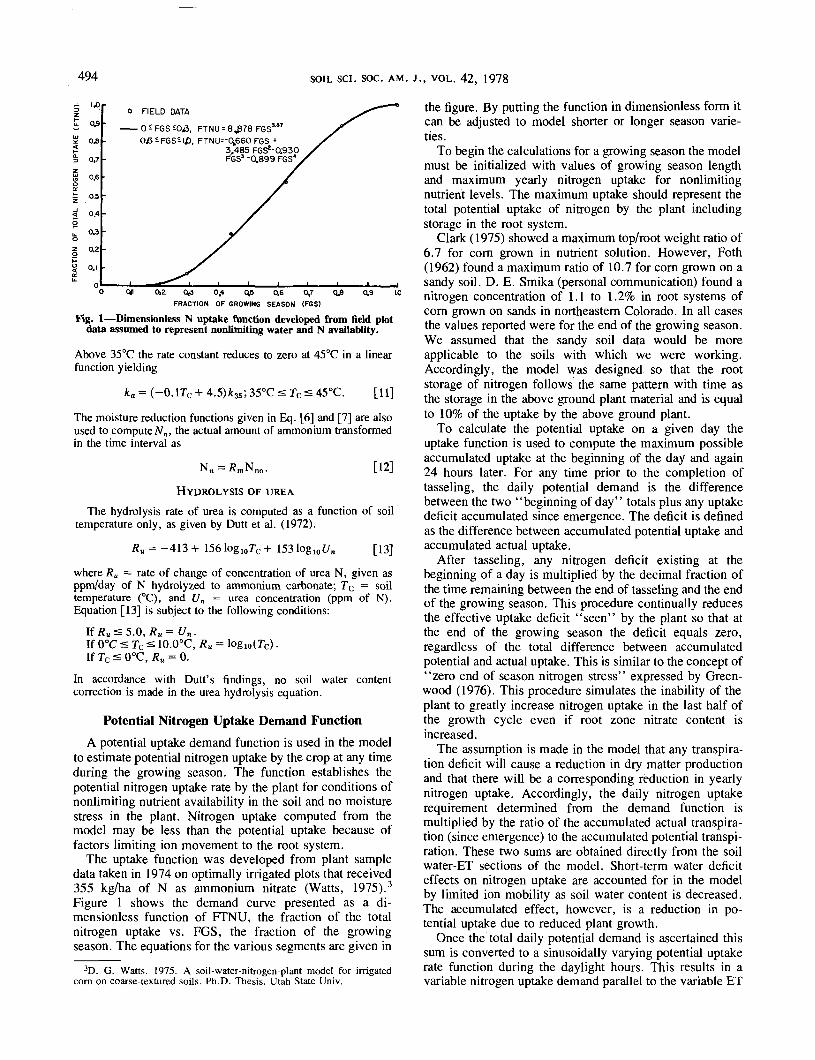
Fig. 3—Computed and measured nitrate concentration in the soilsolution at a depth of 150 cm.
MINERAL NITROGEN CONTENT - kg/ha/30cm increment
NITRATE AMMONIUM_0 10 20 30 40 50 0 10 20 30 40 50u
•»nO\J
90
120
150
r
r1
i
—— FIELD—— MODEL
1
J11iiiij
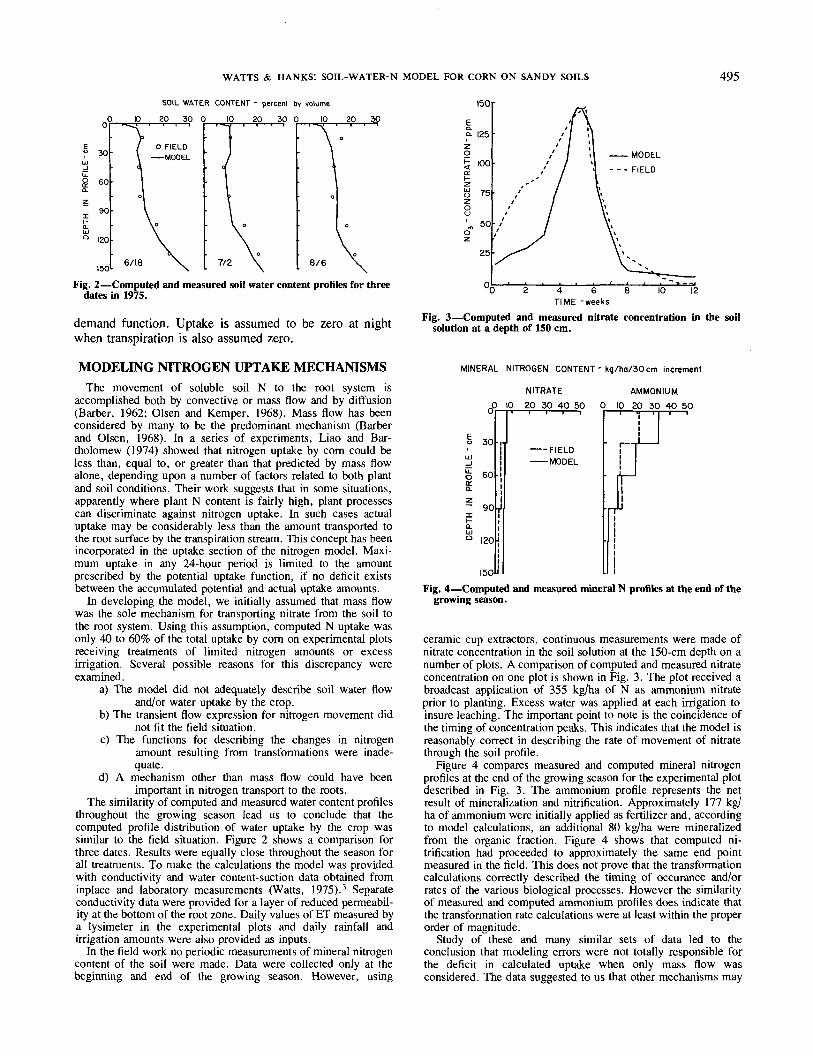
Fig. 4—Computed and measured mineral N profiles at the end of thegrowing season.
ceramic cup extractors, continuous measurements were made ofnitrate concentration in the soil solution at the 150-cm depth on anumber of plots. A comparison of computed and measured nitrateconcentration on one plot is shown in Fig. 3. The plot received abroadcast application of 355 kg/ha of N as ammonium nitrateprior to planting. Excess water was applied at each irrigation toinsure leaching. The important point to note is the coincidence ofthe timing of concentration peaks. This indicates that the model isreasonably correct in describing the rate of movement of nitratethrough the soil profile.
Figure 4 compares measured and computed mineral nitrogenprofiles at the end of the growing season for the experimental plotdescribed in Fig. 3. The ammonium profile represents the netresult of mineralization and nitrification. Approximately 177 kg/ha of ammonium were initially applied as fertilizer and, accordingto model calculations, an additional 80 kg/ha were mineralizedfrom the organic fraction. Figure 4 shows that computed ni-trification had proceeded to approximately the same end pointmeasured in the field. This does not prove that the transformationcalculations correctly described the timing of occurance and/orrates of the various biological processes. However the similarityof measured and computed ammonium profiles does indicate thatthe transformation rate calculations were at least within the properorder of magnitude.
Study of these and many similar sets of data led to theconclusion that modeling errors were not totally responsible forthe deficit in calculated uptake when only mass flow wasconsidered. The data suggested to us that other mechanisms may
496 SOIL SCI. SOC. AM. J . , VOL. 42, 1978
200 •
: 160
120
80
40
— — Model 1*250 Kg/Ho UAN sprinkle(applied
.. -Field 1. Total water 6cm>ET
——— Model ( 250 Kg/Ha NH4-NO,c Preplant Broadcast \plot I!
x x, x Field {.Total water 3lcm>ET——— Potential uptake
plot 2220
200
TIME6 8 10 12AFTER 5/12/75 — weeks
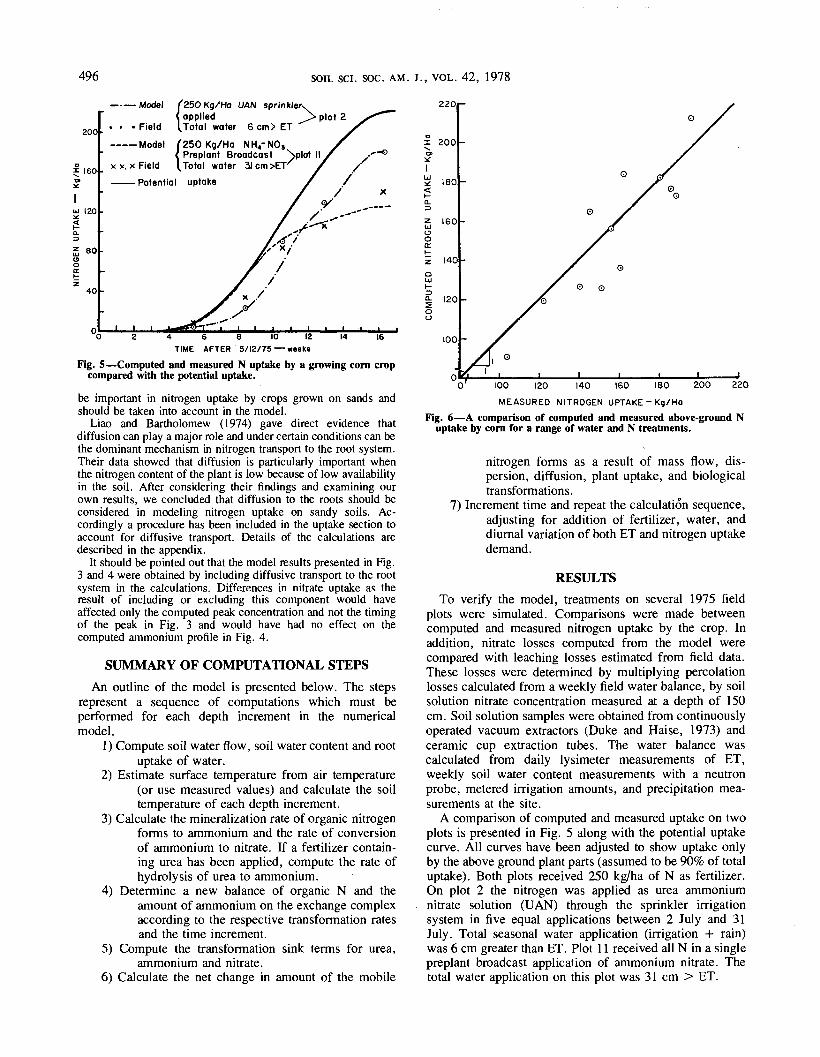
Fig. 5—Computed and measured N uptake by a growing corn cropcompared with the potential uptake.
be important in nitrogen uptake by crops grown on sands andshould be taken into account in the model.
Liao and Bartholomew (1974) gave direct evidence thatdiffusion can play a major role and under certain conditions can bethe dominant mechanism in nitrogen transport to the root system.Their data showed that diffusion is particularly important whenthe nitrogen content of the plant is low because of low availabilityin the soil. After considering their findings and examining ourown results, we concluded that diffusion to the roots should beconsidered in modeling nitrogen uptake on sandy soils. Ac-cordingly a procedure has been included in the uptake section toaccount for diffusive transport. Details of the calculations aredescribed in the appendix.
It should be pointed out that the model results presented in Fig.3 and 4 were obtained by including diffusive transport to the rootsystem in the calculations. Differences in nitrate uptake as theresult of including or excluding this component would haveaffected only the computed peak concentration and not the timingof the peak in Fig. 3 and would have had no effect on thecomputed ammonium profile in Fig. 4.
SUMMARY OF COMPUTATIONAL STEPSAn outline of the model is presented below. The steps
represent a sequence of computations which must beperformed for each depth increment in the numericalmodel.
1) Compute soil water flow, soil water content and rootuptake of water.
2) Estimate surface temperature from air temperature(or use measured values) and calculate the soiltemperature of each depth increment.
3) Calculate the mineralization rate of organic nitrogenforms to ammonium and the rate of conversionof ammonium to nitrate. If a fertilizer contain-ing urea has been applied, compute the rate ofhydrolysis of urea to ammonium.
4) Determine a new balance of organic N and theamount of ammonium on the exchange complexaccording to the respective transformation ratesand the time increment.
5) Compute the transformation sink terms for urea,ammonium and nitrate.
6) Calculate the net change in amount of the mobile
IUl
(Sotr
oo
180
160
140
120
100
100 120 140 160 180
MEASURED NITROGEN UPTAKE - Kg/Ha
200 220
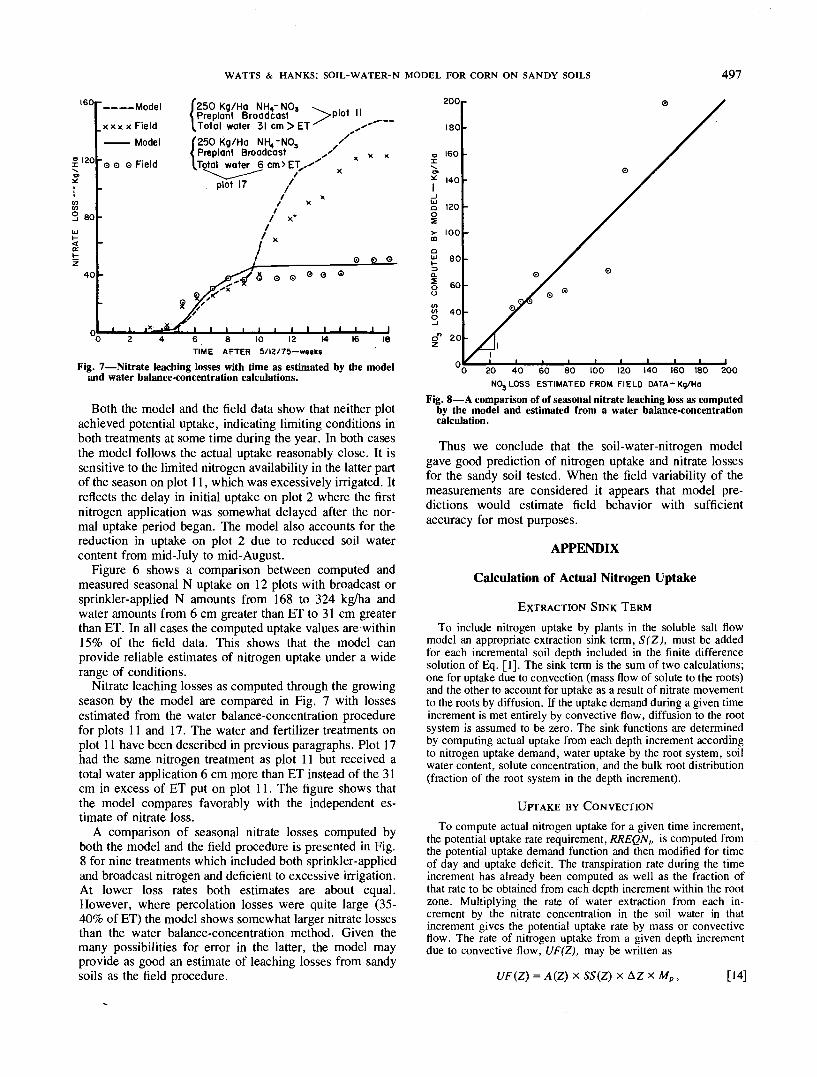
Fig. 6—A comparison of computed and measured above-ground Nuptake by corn for a range of water and N treatments.
nitrogen forms as a result of mass flow, dis-persion, diffusion, plant uptake, and biologicaltransformations.
7) Increment time and repeat the calculation sequence,adjusting for addition of fertilizer, water, anddiurnal variation of both ET and nitrogen uptakedemand.
RESULTSTo verify the model, treatments on several 1975 field
plots were simulated. Comparisons were made betweencomputed and measured nitrogen uptake by the crop. Inaddition, nitrate losses computed from the model werecompared with leaching losses estimated from field data.These losses were determined by multiplying percolationlosses calculated from a weekly field water balance, by soilsolution nitrate concentration measured at a depth of 150cm. Soil solution samples were obtained from continuouslyoperated vacuum extractors (Duke and Haise, 1973) andceramic cup extraction tubes. The water balance wascalculated from daily lysimeter measurements of ET,weekly soil water content measurements with a neutronprobe, metered irrigation amounts, and precipitation mea-surements at the site.
A comparison of computed and measured uptake on twoplots is presented in Fig. 5 along with the potential uptakecurve. All curves have been adjusted to show uptake onlyby the above ground plant parts (assumed to be 90% of totaluptake). Both plots received 250 kg/ha of N as fertilizer.On plot 2 the nitrogen was applied as urea ammoniumnitrate solution (UAN) through the sprinkler irrigationsystem in five equal applications between 2 July and 31July. Total seasonal water application (irrigation + rain)was 6 cm greater than ET. Plot 11 received all N in a singlepreplan! broadcast application of ammonium nitrate. Thetotal water application on this plot was 31 cm > ET.
WATTS & HANKS: SOIL-WATER-N MODEL FOR CORN ON SANDY SOILS 497
160
120
80
40
- ——— Model f 250 Kg/Ha NH4-N03 \ . . ..tPreplant Broadcast ~>plot II
_ x x x x Field I, Total water 31 cm > ET ̂ ^''——— Model (250 Kg/Ha NH,-NOS /
< Preplan! Broadcast ,f x x
"s o o Field \.Total waterplot 17
•
m
ef^S
*/£%
_6cm>ET^x
// X
/ x/ X*
/«/ 0 0 0
6TIME
8 10 12 14AFTER 5/12/75—weeks
18
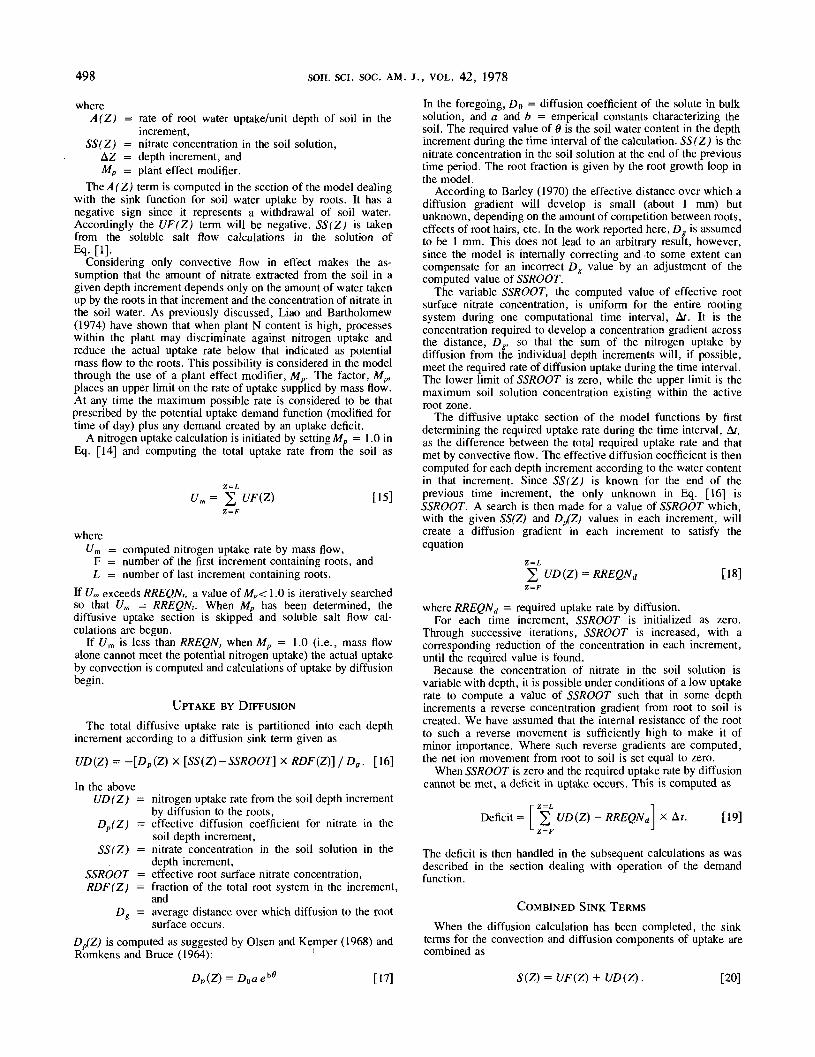
Fig. 7—Nitrate leaching losses with time as estimated by the modeland water balance-concentration calculations.
Both the model and the field data show that neither plotachieved potential uptake, indicating limiting conditions inboth treatments at some time during the year. In both casesthe model follows the actual uptake reasonably close. It issensitive to the limited nitrogen availability in the latter partof the season on plot 11, which was excessively irrigated. Itreflects the delay in initial uptake on plot 2 where the firstnitrogen application was somewhat delayed after the nor-mal uptake period began. The model also accounts for thereduction in uptake on plot 2 due to reduced soil watercontent from mid-July to mid-August.
Figure 6 shows a comparison between computed andmeasured seasonal N uptake on 12 plots with broadcast orsprinkler-applied N amounts from 168 to 324 kg/ha andwater amounts from 6 cm greater than ET to 31 cm greaterthan ET. In all cases the computed uptake values are within15% of the field data. This shows that the model canprovide reliable estimates of nitrogen uptake under a widerange of conditions.
Nitrate leaching losses as computed through the growingseason by the model are compared in Fig. 7 with lossesestimated from the water balance-concentration procedurefor plots 11 and 17. The water and fertilizer treatments onplot 11 have been described in previous paragraphs. Plot 17had the same nitrogen treatment as plot 11 but received atotal water application 6 cm more than ET instead of the 31cm in excess of ET put on plot 11. The figure shows thatthe model compares favorably with the independent es-timate of nitrate loss.
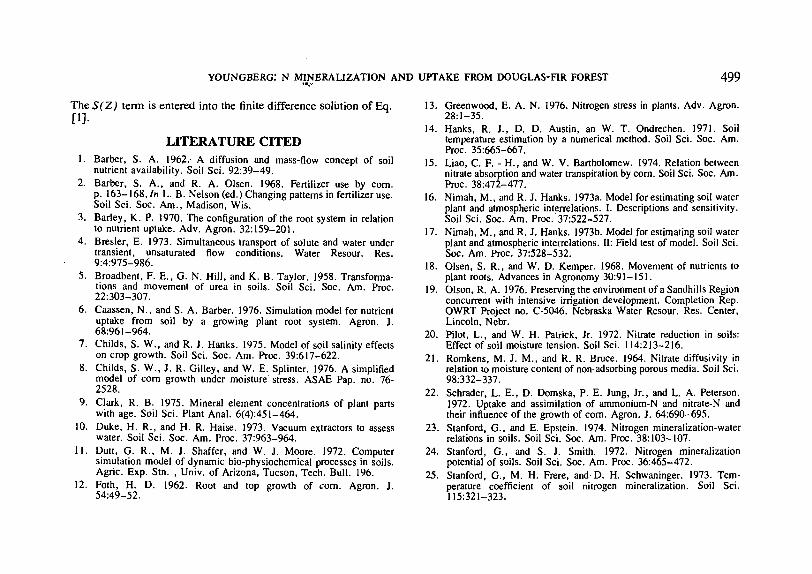
A comparison of seasonal nitrate losses computed byboth the model and the field procedure is presented in Fig.8 for nine treatments which included both sprinkler-appliedand broadcast nitrogen and deficient to excessive irrigation.At lower loss rates both estimates are about equal.However, where percolation losses were quite large (35-40% of ET) the model shows somewhat larger nitrate lossesthan the water balance-concentration method. Given themany possibilities for error in the latter, the model mayprovide as good an estimate of leaching losses from sandysoils as the field procedure.
200
180
o 160iN*
f 140
o 120o
>- 100
80
60
to 40
c? 20z
200"0 20 40 6O 80 100 120 140 160 180NO, LOSS ESTIMATED FROM FIELD DATA-Kg/Ha
Fig. 8—A comparison of of seasonal nitrate leaching loss as computedby the model and estimated from a water balance-concentrationcalculation.
Thus we conclude that the soil-water-nitrogen modelgave good prediction of nitrogen uptake and nitrate lossesfor the sandy soil tested. When the field variability of themeasurements are considered it appears that model pre-dictions would estimate field behavior with sufficientaccuracy for most purposes.
APPENDIX
Calculation of Actual Nitrogen Uptake
EXTRACTION SINK TERMTo include nitrogen uptake by plants in the soluble salt flow
model an appropriate extraction sink term, S(Z), must be addedfor each incremental soil depth included in the finite differencesolution of Eq. [1]. The sink term is the sum of two calculations;one for uptake due to convection (mass flow of solute to the roots)and the other to account for uptake as a result of nitrate movementto the roots by diffusion. If the uptake demand during a given timeincrement is met entirely by convective flow, diffusion to the rootsystem is assumed to be zero. The sink functions are determinedby computing actual uptake from each depth increment accordingto nitrogen uptake demand, water uptake by the root system, soilwater content, solute concentration, and the bulk root distribution(fraction of the root system in the depth increment).
UPTAKE BY CONVECTIONTo compute actual nitrogen uptake for a given time increment,
the potential uptake rate requirement, RREQN,, is computed fromthe potential uptake demand function and then modified for timeof day and uptake deficit. The transpiration rate during the timeincrement has already been computed as well as the fraction ofthat rate to be obtained from each depth increment within the rootzone. Multiplying the rate of water extraction from each in-crement by the nitrate concentration in the soil water in thatincrement gives the potential uptake rate by mass or convectiveflow. The rate of nitrogen uptake from a given depth incrementdue to convective flow, UF(Z), may be written as
UF(Z) = A(Z)x SS(Z) x AZ x Mp, [14]
498 SOIL SCI. SOC. AM. J . , VOL. 42, 1978
whereA(Z) = rate of root water uptake/unit depth of soil in the
increment,SS(Z) = nitrate concentration in the soil solution,
AZ = depth increment, andMp = plant effect modifier.
TheA(Z) term is computed in the section of the model dealingwith the sink function for soil water uptake by roots. It has anegative sign since it represents a withdrawal of soil water.Accordingly the UF(Z) term will be negative. SS(Z) is takenfrom the soluble salt flow calculations in the solution ofEq. [1].
Considering only convective flow in effect makes the as-sumption that the amount of nitrate extracted from the soil in agiven depth increment depends only on the amount of water takenup by the roots in that increment and the concentration of nitrate inthe soil water. As previously discussed, Liao and Bartholomew(1974) have shown that when plant N content is high, processeswithin the plant may discriminate against nitrogen uptake andreduce the actual uptake rate below that indicated as potentialmass flow to the roots. This possibility is considered in the modelthrough the use of a plant effect modifier, Mp. The factor, Mp,places an upper limit on the rate of uptake supplied by mass flow.At any time the maximum possible rate is considered to be thatprescribed by the potential uptake demand function (modified fortime of day) plus any demand created by an uptake deficit.
A nitrogen uptake calculation is initiated by setting Mp = 1.0 inEq. [14] and computing the total uptake rate from the soil as
Um = [15]
whereUm = computed nitrogen uptake rate by mass flow,
F = number of the first increment containing roots, andL = number of last increment containing roots.
If Um exceeds RREQN,, a value of Mp< 1.0 is iteratively searchedso that Um = RREQN,. When Mp has been determined, thediffusive uptake section is skipped and soluble salt flow cal-culations are begun.
If Um is less than RREQN, when Mp = 1.0 (i.e., mass flowalone cannot meet the potential nitrogen uptake) the actual uptakeby convection is computed and calculations of uptake by diffusionbegin.
UPTAKE BY DIFFUSIONThe total diffusive uptake rate is partitioned into each depth
increment according to a diffusion sink term given as
UD(Z) = ~[DP(Z) X [SS(Z)~ SSROOT] X R D F ( Z ) ] / D f . [16]
In the aboveUD(Z) = nitrogen uptake rate from the soil depth increment
by diffusion to the roots,DP(Z) = effective diffusion coefficient for nitrate in the
soil depth increment,SS(Z) = nitrate concentration in the soil solution in the
depth increment,SSROOT = effective root surface nitrate concentration,RDF(Z) = fraction of the total root system in the increment,
andDg = average distance over which diffusion to the root
surface occurs.Dp(Z) is computed as suggested by Olsen and Kemper (1968) andRomkens and Bruce (1964): '
In the foregoing, Do = diffusion coefficient of the solute in bulksolution, and a and b = emperical constants characterizing thesoil. The required value of 0 is the soil water content in the depthincrement during the time interval of the calculation. SS(Z) is thenitrate concentration in the soil solution at the end of the previoustime period. The root fraction is given by the root growth loop inthe model.
According to Barley (1970) the effective distance over which adiffusion gradient will develop is small (about 1 mm) butunknown, depending on the amount of competition between roots,effects of root hairs, etc. In the work reported here, Dg is assumedto be 1 mm. This does not lead to an arbitrary result, however,since the model is internally correcting and to some extent cancompensate for an incorrect Dg value by an adjustment of thecomputed value of SSROOT.
The variable SSROOT, the computed value of effective rootsurface nitrate concentration, is uniform for the entire rootingsystem during one computational time interval, Af. It is theconcentration required to develop a concentration gradient acrossthe distance, Dg, so that the sum of the nitrogen uptake bydiffusion from the individual depth increments will, if possible,meet the required rate of diffusion uptake during the time interval.The lower limit of SSROOT is zero, while the upper limit is themaximum soil solution concentration existing within the activeroot zone.
The diffusive uptake section of the model functions by firstdetermining the required uptake rate during the time interval, Af,as the difference between the total required uptake rate and thatmet by convective flow. The effective diffusion coefficient is thencomputed for each depth increment according to the water contentin that increment. Since SS (Z) is known for the end of theprevious time increment, the only unknown in Eq. [16] isSSROOT. A search is then made for a value of SSROOT which,with the given SS(Z) and D^Z) values in each increment, willcreate a diffusion gradient in each increment to satisfy theequation
UD(Z) = RREQN „ [18]
where RREQN d = required uptake rate by diffusion.For each time increment, SSROOT is initialized as zero.
Through successive iterations, SSROOT is increased, with acorresponding reduction of the concentration in each increment,until the required value is found.
Because the concentration of nitrate in the soil solution isvariable with depth, it is possible under conditions of a low uptakerate to compute a value of SSROOT such that in some depthincrements a reverse concentration gradient from root to soil iscreated. We have assumed that the internal resistance of the rootto such a reverse movement is sufficiently high to make it ofminor importance. Where such reverse gradients are computed,the net ion movement from root to soil is set equal to zero.
When SSROOT is zero and the required uptake rate by diffusioncannot be met, a deficit in uptake occurs. This is computed as
Deficitit = T*-
UD(Z) - RREQN d x A/. [19]
The deficit is then handled in the subsequent calculations as wasdescribed in the section dealing with operation of the demandfunction.
COMBINED SINK TERMSWhen the diffusion calculation has been completed, the sink
terms for the convection and diffusion components of uptake arecombined as
[17] S(Z) = VF(Z) + UD(Z). [20]
The S(Z) term is entered into the finite difference solution of Eq.[1].