a socio-economic and behavioral analysis of farmers
TRANSCRIPT

Project Information 2005 Proposal Number: 0070
Proposal Title: A socio−economic and behavioral analysis of farmers' decisions to adopt or reject the CALFED conservation initiatives
Applicant Organization Name: Sonoma State University
Total Amount Requested: $175,228
ERP Regions: Delta Region, Bay Region, Sacramento Region, San Joaquin Region
Short Description
Project proposes to evaluate farmers/ranchers attitdues towards conservation and management changes, identify and appraise constraints, and and identify the most important factors in influencing farmers' long term committments to conservation innovation.
Executive Summary
This proposed study will examine why farmers and ranchers choose to adopt or reject the CALFED−sponsored conservation initiatives that are funded through this solicitation. The objective of this research is to identify how policymakers and project designers can intervene to influence that choice, and increase adoption rates. This study meets ERP funding priorities by:
1. assessing the economic, agronomic, and social benefits and costs associated with agricultural activities benefiting wildlife and fish.
2. supporting future projects seeking to enhance ecosystem restoration in an agricultural landscape
The study will investigate 4−5 CALFED−sponsored agri−environmental projects that require farmers and ranchers to adopt some kind of techno−managerial change, such as
Project Information 1

altered cropping and harvesting patterns, vegetative filter strips, and irrigation management. It will focus on two or three regions, with the North Delta, Yolo Basin and San Joaquin Basin most preferred.
The study will explore the entire innovation adoption process. It will first (1) assess farmers’ and ranchers’ a−priori attitudes towards conservation and techno−managerial change, and create a typology to represent where they fall in a motivational spectrum. It will then (2) investigate the impact that projects’ recruitment activities have on those attitudes, and analyze their effects on adoption rates. It will also (3) observe the material and institutional constraints that impede farmers and ranchers from adopting the techno−managerial changes, and appraise how those, too, impact adoption rates. These analyses will reveal exactly where the impediments lie to broader adoption. Finally, the study will (4) identify the most important factors influencing farmers’ and ranchers’ long−term commitment to the conservation innovations.
The study will apply both behavioral and socio−economic analytical approaches. It will interview at least 150−200 farmers and ranchers, including adopters and rejecters of the conservation innovations. The interviews will collect data on their attitudes, perceptions and motivations, as well as the economic and agronomic impacts of the innovation on their production systems. It will use multivariate statistical techniques to test several hypotheses concerning how the motivational and economic factors impact adoption behavior.
This proposed study is an essential component of this CALFED initiative for three reasons. First, why farmers and ranchers accept or reject conservation initiatives is the least understood, and yet possibly the most critical factor in determining whether farm−based conservation initiatives will ever have a significant impact on the Bay−Delta Region. Second, the agri−environmental projects’ internal assessments will not likely focus on farmer behavior since the proposal solicitation demands that they concentrate on how their activities impact ecosystems and wildlife. Third, if the projects do any analysis of this kind, they will each develop
Project Information 2

their own assessment criteria, variables, and methods of analysis. It will, therefore, be extremely difficult for the CALFED Bay−Delta Program to make legitimate comparisons between projects, and discover the common patterns and lessons learned. Only a study that is specifically designed to systematically and uniformly investigate farmers’ and ranchers’ motivations and economic contexts, and one that investigates a large number of them, will be able to reach solid conclusions that can be used to guide future policies and project designs.
Project Information 3

A socio-economic and behavioral analysis of farmers' decisions to adopt or reject the CALFED conservation initiatives
Rheyna Laney, Principal Investigator Associate Professor
Department of Geography Sonoma State University

Contents
A. Project Description 1. Problem 3
2. Goals and Objectives 4
3. Conceptual Model 4
4. Approach and Scope of Work a. Behavioral and Socio-economic Approaches 8
b. Study Design 9 c. Task 1: Project management / administration 9
d. Task 2: Characterizing farmers’ a-priori attitudes and motivations 9
e. Task 3: Assessing the adoption decision 11
f. Task 4: Long-term commitment 14 g. Task 5: Outreach 14
5. Performance Evaluation 15
6. Feasibility 15
7. Data Handling and Storage 16
8. Information Value 16
9. Public Involvement and Outreach 16
B. Applicability to CALFED Bay-Delta Program 17 and ERP Goals, and priorities
C. Qualifications and Organization 17
D. Cost 17
E. Compliance with Standard Terms and Conditions 17
G. Literature Cited 17
2

A. Project Description
1. Problem CALFED-sponsored projects intended to promote farm-based conservation will confront
significant challenges when recruiting farmers and ranchers. The most important and difficult of these will be convincing farmers and ranchers (hereafter only referred to as farmers) to adopt and maintain techno-managerial practices that offer little or no advantage to their production system or increase to their profitability. Agri-environmental projects typically find it fairly easy to recruit a small subset of farmers who are already sympathetic to conservationist values (Smithers and Furman 2003). They are much less successful at enlisting the majority of farmers who are reluctant to adopt any innovation unless it offers them a sure and measurable advantage (Black and Reeve 1993; Guerin and Guerin 1994; Morris and Potter 1995). Without broader adoption, however, conservation initiatives will never make a significant impact at the regional level, which is essential for meeting the Ecosystem Restoration Program’s goals.
European governments, at the forefront of farm-based conservation, have addressed this problem by offering farmers substantial fiscal incentives. This strategy has successfully engaged a large percentage of the farm population, but there is concern that they will abandon the innovations unless the subsidies become permanent (Morris and Potter 1995). California is clearly taking a different policy approach. Proposition 50 explicitly disqualifies farmers from directly receiving its funds, leaving CALFED-sponsored agri-environmental projects with the challenge of enlisting large numbers of farmers through other methods.
CALFED-sponsored projects have few remaining choices. Bay-Delta farmers must either be strongly self-motivated to adopt conservation innovations, or they must be persuaded. The prospect for either of these is not high if the North Bay Agricultural Alliance (2005) spoke for many Bay-Delta farmers when it said of the CALFED grant: “Only [ ] those who know nothing about farming and little about restoration can receive $9-million to ‘educate’ farmers how to farm and restore habitats. . . it is regrettable that these agencies don’t consult with affected parties before launching wasteful programs.”
Motivations are only half the problem, however. Farmers also face significant constraints that can discourage even favorably inclined farmers from adopting conservation innovations (Colman et al. 1992; Ibery and Bowler 1993). Agri-environmental projects can try to reduce the economic costs and institutional constraints as much as possible. But long run costs, particularly after the projects expire, must be borne by the farmer. Farmers’ perceptions of these constraints, and their ability and willingness to overcome them, will greatly affect adoption rates.
This study seeks to understand farmers’ motivations and attitudes toward conservation and techno-managerial change, as well as the economic and institutional constraints that they face, in order to understand why farmers adopt or reject conservation innovations. It also explores how those motivations, constraints and adoption rates vary spatially within the Bay-Delta Region. With this understanding, policymakers and project managers will be better able to target their policies and design projects that engender broader participation and ultimately meet the Ecosystem Restoration Program’s goals.
This proposed study is an essential component of this CALFED initiative for three reasons. First, farmers’ reasons for accepting or rejecting conservation initiatives are the least understood, and yet possibly the most critical factor in determining whether farm-based conservation initiatives will ever have a significant impact on the Bay-Delta Region. Studies of conservation innovation adoption have identified some broad patterns in farmer behavior. These studies emphasize, however, that many
3

factors that affect farmers’ decisions, from attitudes to economics, are highly contextual and regionally specific (Morris and Potter 1995; Wilson and Hart 2000). A study of this kind needs to be done in the Bay-Delta Region. Second, the agri-environmental projects’ internal assessments will focus on the impacts of their activities on ecosystems and wildlife, since that is what the proposal solicitation demands. They will not likely develop a study of farmer behavior. Finally, if the projects do any analysis of this kind, each will develop their own assessment criteria, variables, and methods of analysis. It will, therefore, be extremely difficult for the CALFED Bay-Delta Program to make legitimate comparisons between projects, and discover the common patterns and lessons learned. Only a study that is specifically designed to systematically and uniformly investigate farmers’ motivations and economic contexts, and one that investigates a large number of farmers, will be able to reach solid conclusions that can be used to guide future policies and project designs.
2. Goals and Objectives This study’s primary goal is to understand why farmers choose to adopt or reject the CALFED-
sponsored conservation initiatives that are funded through this solicitation. The overall objective of this research is to identify how policymakers and project designers can intervene to influence that choice, and increase adoption rates.
3. Conceptual Model Innovation adoption theory is commonly applied to studies of farm-based conservation
initiatives (Smithers and Furman 2003). The theory identifies four main sets of factors that are believed to be influential in the adoption decision (Rogers 1983):
- the characteristics of the farmer, including his/her attitudes and motivations - the situational characteristics of the farm, such as land and labor constraints - the qualities of the innovation, including its compatibility and complexity - the extension activities used to promote the innovation.
These factors play out in a four-stage innovation decision process involving exposure, persuasion, a decision, and ongoing confirmation as farmers continue to evaluate their decision (Guerin and Guerin 1994; Rogers and Shoemaker 1971). This study adapts this classic diffusion model for the conservation-innovation case. It develops a new conceptual model and a new set of hypotheses designed to highlight and test the critical factors behind the adoption process that are unique to conservation innovations.
The model first addresses the issue of attitudes and motivations, the driving force behind the adoption process. Three theories explain farmer motivations. The first, socio-cultural theory, argues that farmers are predisposed to accept or reject conservation initiatives due to a set of socio-cultural values and attitudes, such as environmental sympathies, feelings towards governmental programs, and willingness to accept techno-managerial change. These predispositions can motivate some to adopt innovations despite economic costs, and others to reject them despite economic incentives (Ervin and Ervin, 1982; Potter and Gasson 1988; Wilson 1996). The second, liberal economic theory, contends that farmers are rational economists, primarily motivated by economic incentives. They will adopt any techno-managerial innovation that comes with assured economic benefits, as long as they do not face significant barriers, such as limits to labor or an onerous permitting process (Brotherton 1991; Wandel and Smithers 2000; Wilson and Hart 2000). From this perspective, conservation innovations that entail only costs, such as those that preserve natural environments on farmland, will require financial incentives to entice farmers to adopt them. The third, political economic theory, emphasizes that farming systems are not autonomous units. Farmers commonly participate in local organizations and networks, they enter into financial, business, and marketing contracts, and they face macro-economic
4

structures that together frame their business environment (Mardsen 1988; Roberts and Lighthall 1991; Ward and Lowe 1994). This context can limit farmers’ management options, such that they are unable to adopt conservation innovations, no matter their personal dispositions or the economic implications.
Most studies have drawn upon the first two perspectives, and have found that both attitudes and economics play important roles in farmers’ decisions (Black and Reeve 1993; D’Souza et al. 1993; Forté-Gardner 2004; Korsching et al. 1983; Napier et al. 1964; Pampel and van Es 1977; Wilson 1996). Black and Reeve (1993) uncover a pattern within this seemingly inconclusive evidence. They find that attitudinal variables are critical in a project’s early phases, where farmers with favorable dispositions towards conservation are recruited more quickly. Situational, or economic, factors become increasingly important as a project attempts to broaden its appeal to more utilitarian farmers. Morris and Potter (1995) build on these distinctions, developing a typology with four groups of farmers. ‘Resistant non-adopters’ firmly reject conservation innovations for various reasons anticipated by socio-cultural theory, such as their anti-environmentalist positions or their resistance to top-down bureaucratic projects. ‘Active adopters,’ on the other hand, enthusiastically implement the innovations for reasons again predicted by socio-cultural theory, mainly associated with a conservationist ethic. Typically, these first two groups represent a fairly small percentage of farmers. An overwhelming majority of farmers, they find, is utilitarian, as anticipated by liberal economic theory. These farmers are strongly motivated to increase productivity and profitability, and their socio-cultural values are fairly neutral toward conservation. Of these, ‘conditional non-adopters’ find a project’s fiscal incentives insufficient to overcome certain barriers to entry, while ‘passive adopters’ consider the incentives adequate, and the requirements not too onerous.
This evidence suggests that CALFED-sponsored agri-environmental projects that offer no substantial economic benefits to farmers will have limited impact. Pilot projects will likely draw upon the “active adopters,” optimistically demonstrating the projects’ successes. But the techno-managerial innovations will not spread to the majority of utilitarian farmers because they lack the motivation needed to take on the economic and managerial burdens.
Other evidence supports a more optimistic view. First, it is quite common for farmers, even those with a more utilitarian orientation, to identify themselves as land stewards, and to express some concern for wildlife (Wilson 1996; Wilson and Hart 2000). Utilitarian-oriented Bay-Delta farmers may have an even stronger conservation inclination than average, since a large number of them are also hunters and anglers (Cline 2005). Second, over 50% of European farmers explicitly cite their interest in promoting environmental conservation as an important reason for participating in agrienvironmental schemes, independent of fiscal incentives (Wilson and Hart 2000). Third, many farmers do not feel that they should receive payments for their conservation efforts, although this may be more indicative of their disdain for governmental programs than of their support for conservation (Wilson 1996).
The proposed study builds on Morris and Potter’s (1995) typology, anticipating that Bay-Delta farmers exhibit a spectrum of motivations, with a few farmers strongly motivated to accept or reject agri-environmental projects based on their socio-cultural values. Unlike Morris and Potter (1995), it
expects that the Bay-Delta Region’s utilitarian farmers also have underlying attitudes towards conservation, hypothesizing that:
(Hyp 1a) Some utilitarian farmers are weakly motivated to participate in agri-environmental projects based on socio-cultural values, such as their self-identity as land stewards and as hunters and anglers. The rest remain fairly dispassionate towards conservation, and disinclined to adopt an innovation.
5

These four types of farmers are depicted in the conceptual model (Figure 1), differentiated by the strength and orientation of their attitudes and motivations towards conservation innovations.
This study goes a step further, investigating whether Bay-Delta farmers’ attitudes also vary spatially throughout the region. Many studies of farm-based conservation initiatives, and particularly those by agricultural geographers, report that farmer attitudes and perceptions are highly contextual and regionally specific. They identify spatial patterns in these attitudes, as well as in adoption rates (e.g., Wilson 1996; Wilson and Hart 2000; Wossink et al. 1997). This study predicts that the Bay-Delta Region, with its many distinctive communities, histories and environments, also supports this variation, hypothesizing that:
(Hyp 1b) farm regions and communities host different dominant attitudes and motivations towards conservation initiatives.
Since most farmers are likely to be, at best, only weakly inclined to adopt conservation innovations, it will be especially important that extension activities to persuade farmers to adopt them are successful. Innovation adoption studies have long established that extension programs with strong staff-farmer communication channels have higher adoption rates (Rogers and Shoemaker 1971; Rogers 1983). Particularly effective programs develop a positive rapport between project staff and farmers, use methods of communication that match farmers’ preferred learning styles, and establish collaboration between staff and farmers (Campbell 1995; Guerin and Guerin 1994; Lanyon 1994). In most technology adoption situations, positive staff-farmer relations are enough to increase adoption rates because farmers have only to be convinced that the innovation will be profitable, which they are already motivated to seek. In the case of conservation innovations, the extension program will need to convince farmers that the innovation will have the desired positive impact on habitat and wildlife. However, they may also need to foster more positive attitudes and motivations toward conservation in order to increase farmer willingness to adopt a techno-managerial practice that may decrease their profitability (McDowell et al. 1989; Morris and Potter 1995).
This study examines whether conventional extension activities that foster strong staff-farmer relations are sufficient to usher in high adoption rates in weakly motivated utilitarian farmers; or, whether agri-environmental projects have to do more, finding ways to inculcate stronger positive attitudes in utilitarian farmers.
This study examines this issue, hypothesizing that:
(Hyp 2) Extension programs that strengthen positive attitudes towards conservation will increase adoption rates in utilitarian farmers
The conceptual model (Figure 1) illustrates this issue by showing that weakly motivated farmers who have poor extension experiences quickly reject an initiative. Whereas those that have positive encounters with project staff must also experience strengthened motivations before they increase their adoption rates. These newly inspired farmers are not expected to bypass structural constraints completely, as can be misread from the model, but they are expected to be much less influenced by those constraints (Figure 1).
In the absence of strong motivations to adopt the innovations, agri-environmental projects will need to design techno-managerial innovations that “fit” especially well within farmers’ production systems (Forté-Gardner 2004; Ibery and Bowler 1993). For example, innovations should not be risky or complex, and they should not require significant inputs, such as capital or labor. Low barriers to entry, rather than strong motivations to participate, may be the critical factor influencing whether most Bay-Delta farmers ultimately adopt the innovations. This study tests this aspect of the adoption process, hypothesizing that:
6

7

(Hyp 3) Projects that are easily compatible with farmers’ present management systems and are within their capabilities will allow even weakly motivated farmers to participate.
The conceptual model depicts this aspect of the process as the point at which more weakly motivated farmers face economic costs, and only choose to adopt an innovation if it has exceptionally low barriers to entry.
The adoption process is not over after the initial adoption decision. Attitudes and motivations continue to affect the level and quality of farmers’ management of the innovation, as well as farmers’ long-term commitment to it (Smithers and Furman 2003; Potter and Gasson 1988). Agri-environmental projects that continue to strengthen farmers’ positive attitudes towards conservation long after the initial adoption decision will encourage deeper participation and commitment. They will also increase the likelihood that the environmental gains will endure after the project expires (Coleman et al. 1992). How those attitudes might be strengthened is not well understood (Morris and Potter 1995). Continued extension activities may encourage positive attitudes, but this study anticipates that farmers will be more influenced by results. It hypothesizes that:
(Hyp 4) Projects that have a rapid and substantial positive impact on wildlife populations will strengthen farmers’ positive attitudes towards conservation, resulting in a greater commitment to maintain the innovation after the project expires.
This aspect of the innovation adoption process is represented in the conceptual model as a point at which farmers’ perceptions of the efficacy of the innovation shifts them towards either a stronger commitment to the innovation, or a weaker one, with a high likelihood of disadoption.
4. Approach and Scope of Work a. Behavioral and Socio-economic Approaches
This study applies behavioral and socio-economic analyses to investigate the reasons behind farmers’ adoption or rejection of conservation innovations. These approaches are particularly suited to exploring the conditions that frame an individual farmer’s decision-making process. Behavioral analysis reveals farmers’ attitudes and values, and shows how these socio-cultural factors influence their motivations and predispositions towards adopting conservation innovations. Behavioral analysis also reveals how farmers evaluate an innovation’s impact on their major factors of production, such as labor and capital, exposing the economic constraints that farmers perceive as critical in their choice. This perception data, backed by quantitative socio-economic data describing those factors, will reveal the economic conditions underlying farmers’ decisions to adopt or reject a conservation innovation.
Behavioral analysis is widely applied in several research fields analyzing agricultural change, and the uptake of agricultural innovations in particular, including agricultural geography, agricultural economics, behavioral economics, rural sociology and social psychology (e.g. Bowler 1979; Forté-Gardner 2004; Wolpert 1964; Gillmor 1986; Ilbery 1978; Jones 1963; Gilad and Kaish 1986; Beedell and Rehman 2000). Most notably in the U.S., behavioral perspectives were used to explain the uptake of soil conservation technologies (e.g. Earle et al. 1979; Davies 1985; Ervin and Ervin 1982; Napier et al. 1988). More recently, behavioral analysis has become the dominant analytical method behind conservation innovation adoption studies, with agricultural geographers at the forefront of this research (e.g., McDowell et al. 1989; Morris and Potter 1995; Smithers and Forman 2003; Wilson 1996; Wilson and Hart 2000).
Another common approach to understanding innovation adoption is quantitative economic modeling. These models evaluate the economic impact of each production alternative, including a
8

sustainable agricultural practice, and predict farmers’ choices based on profitability (see Roberts and Swinton 1996 for a review). Importantly, these standard techniques in agricultural economics de-emphasize the possibility that farmers act on other motivations, and do not account for farmers’ subjective assessments of agriculture technology (Adesina and Baidu-Forson 1995; Wossink et al. 1997).
This study uses behavioral analysis because it explicitly recognizes non-economic motivations behind production decisions, and because it allows farmers to identify directly the conditions that have the greatest impact on their decisions.
b. Study Design The exact number and nature of the agri-environmental projects that this study will investigate
will depend on what projects are funded. The intention is to examine agri-environmental projects that seek to recruit a significant number of farmers (i.e. more than 10), and that require some kind of techno-managerial change, such as altered cropping and harvesting patterns, vegetative filter strips and other wildlife buffers, integrated pest management, irrigation management, post-harvest flooding, or converting farmland into natural ecosystems. If possible, the study will focus on only two or three regions, with the North Delta and Yolo Basin and San Joaquin areas most preferred.
Ideally, the study would interview farmers both before and after they have been recruited by an agri-environmental project (a one-group pretest-post-test study design). This would make it easy to gauge farmers’ initial attitudes and motivations, and monitor how these change during the innovation adoption process. It is likely, however, that many projects will have already recruited some farmers before the projects are funded. Therefore, instead, the study will first interview, as a control, a random group of farmers that has not been approached by a project. Their attitudes and motivations will represent those of the farm population as a whole. The study will then interview another set of farmers after they have been recruited by a project, in order to see the impact of extension activities on their attitudes and motivations (a static group comparison design).
The study is organized in three major parts, delineating each of the major tasks: characterizing farmers’ a-priori attitudes and motivations, assessing the adoption decision, and characterizing levels of participation and long-term changes in attitudes and motivations.
c. Task 1: Project Management / Administrative Duties
The principal investigator will hire and manage a graduate research assistant and an undergraduate student. All other administrative tasks will be provided by Sonoma State University, funded through the indirect costs included in the budget.
d. Task 2: Characterizing farmers’ a-priori attitudes and motivations
The first task will be to characterize the strength and orientation of farmers’ attitudes and motivations toward conservation innovations.
Sampling The study will develop a spatial sampling regime. Land-use maps of the regions will be obtained from the California Department of Water Resources for the study counties and entered into a geographic information system (GIS). The GIS will be used to isolate the farmland and generate points in a spatially stratified random sampling scheme. At least 60 points will be generated per study region, with regional boundaries based on the California Bay Delta Authority’s Priority Regions. The landowners of these parcels will be identified from county assessor maps. They will be contacted by mail and phone and asked to participate in the short survey. Points will be generated until 50 farmers per region agree to participate.
9

Data Collection The questionnaire will focus on farmers’ motivations, attitudes, and perceptions towards conservation and techno-managerial change. The questions will be designed to fit a Likert Scale, with farmers scoring statements on a measurement scale of 1 to 5 with: strongly agree=5, mostly agree=4, neutral or not sure =3, mostly disagree=2, and strongly disagree=1. The statements will be designed to create variables describing:
1. Priorities given to various farming objectives, such as profits, productivity, and quality of life 2. Attitudes toward conservation, land stewardship, environmentalism and wildlife protection 3. Perceptions of the impact of agricultural practices on environmental quality 4. Perceptions on the environmental health of their land, and its suitability for wildlife 5. Strength of their interest in promoting wildlife on their land 6. Willingness to accept responsibility for the costs of ecosystem restoration for wildlife 7. Attitude towards outside advice and governmental programs 8. Attitude towards, and reasons for considering, techno-managerial change 9. Concerns with loss of privacy 10. Concerns with governmental regulations protecting endangered species
Demographic and socio-economic variables that studies have shown to be associated with conservation innovation adoption will also be gathered (D’Souza et al 1993; Smithers and Furman 2003; Wilson 1996; Black and Reeve 1993). These include:
1. Age 2. Education level 3. Area of land owned and/or rented 4. Years farming, and number of family generations that have farmed that land 5. Degree of off-farm income 6. Relevant hobbies, such as hunting and fishing
Analysis Using a multivariate statistical technique known as cluster analysis, the study will identify groups of farmers sharing similar patterns in their attitudes, motivations, perceptions, and socio-economic characteristics. These groups will be organized by a typology, accounting for the spectrum of farmers’ motivations towards conservation innovations, as anticipated in the conceptual model (Figure 1). The study will also generate descriptive statistics on each of these groups, and test the first hypothesis that some utilitarian farmers are weakly motivated to participate in agri-environmental projects. The rest remain fairly dispassionate towards conservation, and disinclined to adopt an innovation.
The study will use GIS to identify spatially contiguous groups of farmers that share similar attitudes and motivations. These data will be drawn upon to define subregions, delineating dominant attitudinal types. This data will be used to test the second part of the hypothesis that: farm regions and communities host different dominant attitudes and motivations towards conservation initiatives.
Task 2 Deliverables: The main products from Task 2 will be: 1. An attitudinal typology identifying groups of farmers with common attitudes, motivations,
perceptions, and socio-economic characteristics 2. An assessment of the distribution of farmers within the attitudinal typology 3. An attitudinal map for each region, delineating sub-regions with dominant attitudinal types 4. Policy recommendations for where to target future recruitment activities based on attitudinal
types
10

e. Task 3: Assessing the adoption decision The second task will be to assess the critical factors in a farmers’ decision to adopt or reject a
conservation innovation. This aspect of the study will explore the impact of the projects’ recruitment activities on their attitudes and motivations, and ultimately on adoption rates. It will also examine the economic and institutional constraints that set the context in which farmers operate, again assessing their impacts on adoption rates.
Sampling Targeted farmers will be all those in the study regions who have been contacted by, or are significantly aware of the agri-environmental projects, and who agree to participate in this study. The agri-environmental projects will be asked to share their list of participant farmers, as well as a list of farmers with whom they have had considerable contact, but who chose not to participate. Since the projects may continue to recruit farmers throughout the 3-year funding cycle, the study team will remain in close contact with the projects, and continue interviewing farmers as they are recruited. As well, with permission from the projects, the study team will attend any recruitment activities, such as workshops or meetings, in order to meet the farmers, and ask them to participate in the survey.
An ideal sample size will be 30-40 farmers per agri-environmental project, including those accepting and rejecting the innovation, totaling approximately 120-175 farmers. If a project’s nonparticipant list is too short, making a significantly uneven sample set of farmers accepting and rejecting the project, this study will attempt to find more non-participants. For example, participant farmers will be asked to identify neighboring farmers who are well aware of the project, but have chosen not to participate.
Data Collection The same questionnaire will be given to those who accepted and rejected the innovation. It will have five parts. The first section will be the same as the one described above, characterizing their attitudes, motivations and perceptions. The second section will elicit farmers’ own assessments of how the projects’ recruitment campaigns impacted their attitudes and motivations. For each statement in the first part of the questionnaire, farmers will specify whether, and to what degree, they feel the extension activities changed their Likert Scale scores.
The third section will gather information on the style and intensity of extension activities that farmers experienced, and that may have the power to change their attitudes. For example, field visits and personal contact with project staff can have persuasive power with farmers, even those who are unfavorably inclined towards conservation (Forté-Gardner 2004; McDowell et al. 1989). Farmer-tofarmer contact may be even more persuasive, since farmers share the same identity, community and many of the same socio-cultural values. Variables will include:
1. Methods of communication, such as workshops, personal contact, written documents etc. 2. Contact hours that farmers had with project staff 3. Contact hours that farmer had with other participants, such as neighboring farmers
The fourth section will elicit their perceptions of the extension experience, using Likert-style statements and scores. Statements will be designed to create variables describing:
1. Perceptions of the quality of the information received 2. Attitudes toward each of the methods of communication used 3. Rapport with project personnel, including: honesty, reliability, knowledge and experience
with agriculture and agri-business 4. The degree to which project staff fostered collaboration and compromise 5. Importance of others, such as neighboring farmers, in their decision whether to participate 6. Perceptions and confidence that the proposed conservation innovation will actually work
11

The fifth, and last, part of the questionnaire will assess the degree to which various economic and institutional constraints limit farmers’ abilities to adopt the conservation innovation. It will consider the incentives that agri-environmental projects offer, the economic and institutional requirements that the farmers will have to meet, and the production impacts that farmers will have to accept. The questionnaire will create variables that measure the innovations’ actual input requirements, and appraise farmers’ perceptions of, and ability/willingness to:
1. Accept production impacts: a. risk, yields and quality b. interference with the farm’s production practices c. change in profitability
2. Meet economic requirements: a. labor, including costs and labor bottlenecks b. land, including quantity, cover type and land tenure c. capital, particularly the cost of inputs d. management, including the complexity and divisibility (ability to adopt only parts) of
the innovation 3. Meet institutional requirements
a. governmental regulations associated with the innovation b. governmental regulations associated with endangered species and other wildlife c. adjustments in their supplier, marketing and/or financial contracts
For example, to measure labor requirements and their impact on farmers’ decisions to accept or reject the innovation, the questionnaire will ask:
a. the approximate number of days of labor that will be given by the agri-environmental project towards implementing the innovation at no cost to the farmer
b. the approximate number of days of labor that farmers will need to contribute in order to
implement the innovation c. the approximate number of extra days of labor per year that farmers will need to contribute
in order to maintain the innovation in the future
d. Likert-style statements assessing:
- farmers’ level of certainty concerning each of the above measures - their attitudes toward supplying the additional labor requirements - their attitudes toward how well the additional requirements fit into their present management system - the degree to which labor requirements caused them to consider rejecting the
innovation
Analysis The study will first compare the spatial distribution and attitudinal types of the recruited farmers (adopters and non-adopters) with the attitudinal map developed from the control-group. This will establish whether agri-environmental projects are reaching out to the less motivated, but possibly more numerous, farmers. To classify the recruited farmers into attitudinal types, the study will initially replicate the method developed for the control group, using the first part of the questionnaire. It will then examine the second part of the questionnaire, where farmers assess how their attitudes changed through the extension experience, and reclassify them to the correct category if they experienced significant changes. These data will then be analyzed in a GIS to compare the
12

recruited farmers with the dominant attitudinal type from their respective sub-regions, using the attitudinal map developed in Task 2.
Second, the study will consider whether extension activities have the power to change farmers’ attitudes towards conservation and increase adoption rates. And, if they do, the study will identify which activities have that persuasive power. It will use the first two parts of the questionnaire to classify each recruited farmer by whether or not they experienced a significant change in their attitudes. The study will then use bivariate analysis to examine the relationship between changed attitudes and the adoption/rejection decision, testing the hypothesis that: extension programs that instill a positive impression on farmers and strengthen their motivations towards conservation will increase adoption rates among weakly motivated, and even unfavorably inclined, utilitarian farmers.
As well, the study will identify those activities and methods of communication that establish positive perceptions, and that are strongly associated with increased positive attitudes towards conservation and higher adoption rates.
Third, the study will analyze the economic and institutional constraints that farmers find most critical in their decision to adopt or reject a conservation innovation. The third part of the questionnaire will reveal the inputs or production impacts that are of greatest concern to farmers. It will also provide some insight towards the “thresholds” at which farmers find the input quantities or cost, or the production impacts, too difficult to bear. These critical variables and thresholds will be analyzed by attitudinal type.
The study will isolate the utilitarian farmers that remain weakly motivated towards adoption, and use multivariate logit analysis to investigate the relationship between the adoption decision and the critical input and impact variables, testing the hypothesis that projects that are easily compatible with farmers’ present management systems and well within their capabilities will entice even weakly motivated farmers to participate.
Finally, using the results from the above analyses, the study will classify each farmer into an adoption decision typology, identifying “strong adopters,” “weak adopters,” “constrained non-adopters,” and “resistant non-adopters” (Figure 1).
Task 3 Deliverables: The main products from Task 3 will be: 1. An assessment of how well agri-environmental projects are reaching the farmer population
as a whole, by showing how the attitudinal types of recruited farmers and innovation adopters compare with the distribution of attitudinal types in the farm population as a whole.
2. A map of the spatial distribution of recruited farmers and innovation adopters, with an assessment of how their attitudinal types compare with the dominant attitudinal type in
their sub-region. 3. A list of extension activities or methods of communication that are particularly effective in
reaching farmers, and strongly associated with increasing farmers’ positive attitudes. 4. A list of the most critical constraints impeding farmers from adopting conservation
innovations, along with the thresholds in these critical variables at which farmers are unable/unwilling to adopt an innovation. 5. An empirically tested conceptual model of the conservation innovation adoption process. 6. Recommendations on how agri-environmental projects can better recruit the most prevalent,
but possibly more difficult, attitudinal types of farmers. 7. Recommendations on how agri-environmental projects may better design conservation
innovations to increase adoption rates.
13

f. Task 4: Long-term commitment The last stage of the study will investigate farmers’ long-term commitments to the innovations,
and attempt to understand what factors may influence that commitment.
Sampling The study will identify a stratified random subset of about 30 farmers who adopted an innovation early, such that by the time this study surveys them again in the third year of the funding cycle, they will have about 2 years of experience with the innovation. The sample will be stratified by attitudinal type, representing the distribution of strongly and weakly motivated farmers in the farm population as a whole.
Data Collection These farmers will be asked to take a final questionnaire. Three parts will largely repeat the first, second and fifth parts of the questionnaire that was given for Task 3. The first part of this new survey will assess their attitudes and motivations again, while the second part will allow them to explain how their attitudes have changed through the process of actually managing the conservation innovation.
A third part will ascertain the level of continued contact and help that the farmers receive from the agri-environmental projects. The fourth part will repeat the economic and institutional constraints section of the Task 3 questionnaire in order to understand how their perceptions of those constraints have changed with long-term participation. A new fifth section will ask farmers to assess how successful they believe the conservation innovations have been in restoring ecosystem habitat and promoting wildlife. Finally, the last section will evaluate their long-term commitment to the project.
Analysis The study will use the last section of the questionnaire to categorize the farmers by level of commitment. It will then use multivariate analyses to regress this ordinal dependent variable by four sets of explanatory variables, including a-priori attitudes, attitudinal changes, the level of continued extension activities, the change in perceptions of required inputs and production impacts, and the degree of success of the project in enhancing ecosystems and wildlife populations. This analysis will test the hypothesis that projects that have a rapid and substantial impact on wildlife populations will positively strengthen farmers’ positive attitudes towards conservation, resulting in a greater commitment to maintain the innovation after the length of the project.
Task 4 Deliverables: The main products from Task 4 will be: 1. An assessment of farmers’ long-term commitment to the conservation innovations 2. A list of key factors affecting farmers’ long-term commitment 3. Recommendations on how agri-environmental projects can promote long-term commitment
to the innovations by adopting farmers
g. Task 5: Outreach The study will make all of the raw data and the results of these analyses available to the public,
while protecting the confidentiality of the respondents. A website will be created on which the raw data will be posted. This will allow any interested party to conduct their own analyses and develop their own conclusions.
Presentations will be given to all agri-environmental projects and parties within the California Bay-Delta Program that are interested in the results. Presentations will also be made in the local communities in which most of the farmers were surveyed. Interested groups may include service organizations with significant agricultural interests, local chapters of the farm bureau, and local environmental organizations, such as local chapters of the Audubon Society.
14

Finally, written reports will be supplied to the Bay-Delta Authority. As well, articles will be submitted to journals which will make the study’s results available to the larger academic, agricultural and environmental communities.
5. Performance Evaluation This study will evaluate its performance as it tests its four main hypotheses. Each critical point
in the conservation innovation adoption process hinges upon a hypothesis. And each major task in this study focuses on testing those hypotheses. If the data do not support the first hypothesis in Task 2, the study will reconfigure its conceptual model, and develop a new set of hypotheses for testing in Task 3. For example, the actual typology of attitudinal types that will be developed inductively in Task 1 may not match the four types that are anticipated and depicted in the conceptual model. Later behaviors that are expected from these attitudinal types, as hypothesized in Task 3, may need to be adjusted to reflect farmers’ actual spectrum of motivations. Similar reassessments will be made for Task 4.
6. Feasibility This study will have to establish cooperation with the agri-environmental projects, and obtain
permission from the farmers to be interviewed. It is anticipated that, since this study will benefit the agri-environmental projects directly, they will support it. An informal conversation with one agrienvironmental project submitting a proposal for this solicitation confirms this assertion. To increase the probability that farmers will agree to participate, the study will not use mailed questionnaires, but instead will rely on personal interviews. This will require much more time, effort and travel, but it will increase the personal connection, and enable the interviewer to explain in detail the purpose of the study. As well, every effort will be made to accommodate farmers’ schedules, concerns with privacy, and other issues that may impact their willingness to participate.
The study will take place throughout all three years of the funding cycle (Table 1). The most intensive data collection, associated with Tasks 1 and 2, will be finished by late 2008.
2007 2008 2009 Jan.-Jun Jul-Dec Jan.-Jun Jul-Dec Jan.-Jun Jul-Dec
Task 1 project management & administration Task 2 data collection & analysis Task 3 data collection & analysis Task 4 data collection & analysis Task 5 outreach Table 1. Time Table
Although a three-person study team is small, the team will be able to spread the work over three years, making it feasible to conduct and analyze the nearly 350 interviews. Since the agrienvironmental projects will be recruiting farmers continuously throughout the funding cycle, the interviews can be accomplished on a part-time basis. Through budgeted release time, the principal investigator will work one-third time during the 9-month school year for two years, and half-time for the third year. She will also work full time for three weeks each year, paid directly from the project budget. She will manage the project and conduct many of the interviews for Tasks 2 and 3, and all for Task 4. She will perform the data analysis, write reports and articles, and make the presentations.
The graduate student will work half time for two years. This student will schedule and conduct most of the interviews for Tasks 2 and 3, and will help with the data analysis. The undergraduate will work one quarter time for two and a half years. This student will help identify and contact the farmers asked to participate in the project, help schedule the interviews, manage the interview sheets and tapes,
15

perform data entry both from paper and from the recorded tapes, maintain the study website, schedule presentations, and help develop materials for presentations.
In order to comply with California State University regulations concerning the use of human subjects in research project, this study will have to pass a review of the human subjects committee on the Sonoma State University Campus. There will be ample time to pass this review process before the study is funded.
7. Data Handling and Storage The Geographic Information Center at Sonoma State University has all of the computer
hardware that this study will need, including several desktop computers and massive data storage capacity. As well, the Center has all of the statistical, web publishing and geographic information software that this study requires. Sonoma State University has a server with the capacity to publish all of the raw data, as well as the results of this analysis, on the web.
8. Information Value This study is an essential component of the CALFED initiative for two reasons. First, farmers’
reasons for accepting or rejecting conservation initiatives are the least understood, and yet possibly the most critical factor determining whether farm-based conservation initiatives will ever have a significant impact on the Bay-Delta region and the Ecosystem Restoration Program’s environmental goals. Agri-environmental projects will never spread farther than a small number of environmentally friendly progressive farmers unless they are designed in a way that engages the more utilitarian farmers. Moreover, the little work that has been done in this area has shown that farmers’ behavior, including their attitudes and perceptions, are highly contextual and regionally specific (Morris and Potter 1995). Yet, no studies of this kind have been done in the Bay-Delta Region. Thus, a comprehensive study of why Bay-Delta farmers adopt, reject, commit to, or abandon the innovations may provide some of the most valuable information that will come from the CALFED initiative.
Second, internal project-level assessments are inadequate for the CALFED Bay-Delta Program or even the agri-environmental projects themselves to use to guide future policies and projects intending to increase conservation innovation adoption rates and broaden their impact. For one, the internal assessments will likely focus on the impacts of their activities on ecosystems and wildlife, as the proposal solicitation demands, and they will not develop a study of farmer behavior. As well, if individual projects do any analysis of this kind, they will each develop their own set of assessment criteria, variables, and methods of analysis. It will, therefore, be extremely difficult for the Authority to make legitimate comparisons between projects and discover the common patterns and lessons learned. Only a study that is specifically designed to systematically and uniformly investigate farmer motivations, attitudes and behavior, and one that investigates a large number of farmers, will be able to reach solid conclusions that can be used to guide future policies and project designs.
9. Public Involvement and Outreach The public groups and individuals that are likely to be the most interested in the results of this
research will be the agri-environmental projects that were included in the study, the other agrienvironmental projects funded by this grant, other NGOs that intend to promote farm-based conservation innovations in the Bay-Delta region, and the farmers who were interviewed. This study will actively disseminate the information to these groups and individuals through presentations, a website, reports and papers, as described in the deliverables section (4f).
16

B. Applicability to CALFED Bay-Delta Program and ERP Goals, and priorities for this solicitation This study meets the following ERP funding priorities:
1. Projects that contribute to understanding the relative effectiveness of different conservation-based farming practices and systems, and their contribution to larger restoration efforts, with an assessment of the economic, agronomic, social and environmental benefits and costs associated with agricultural activities benefiting wildlife and fish.
2. Projects that can be used to support future projects seeking to enhance ecosystem restoration in an agricultural landscape
C. Qualifications and Organization Rheyna Laney, the principal investigator, is a human ecologist with research experience and
expertise in agricultural change, farmer behavior and land-change science, as well as strong skills in geographic information science and statistical analyses. In past research projects, she has applied many of the methods and analytical techniques that will be used in this study, including interviews, behavioral and socio-economic analyses, and a wide range of quantitative multivariate statistical techniques. She also has extensive experience using geographic information science, both as a researcher and teacher.
The graduate student who will be hired for this study will be recruited from a qualified pool of U.C. Davis graduate students with interest and expertise in agricultural geography, agricultural economics, and resource economics. Rheyna Laney has developed ties with the Geography Program at U.C. Davis, and will be able to fund a graduate student from this program.
Sonoma State University will provide administrative support for this study.
D. Cost Cost share The budget includes release time for Rheyna Laney, making her available to work
on this project one-third time during the 9-month school year for two years, and half-time for the third year. Replacement costs for teaching are fairly low, and contribute a significant amount of savings to this project in lieu of hiring her directly. This savings of over $26,000 could be conceived of as cost sharing.
E. Compliance with Standard Terms and Conditions We will comply with the standard State and Federal contract terms described in the CALFED
ERP Exhibits A-D.
G. Literature cited Adesina, A. and Baidu-Forson, J. 1995. Farmers' perceptions and adoption of new agricultural
technology: evidence from analysis in Burkina Faso and Guinea, West Africa. Agricultural Economics 13:1-9.
Beedell, J. and Rehman, T. 2000. Using social-psychology models to understand farmers’ conservation behaviour. Journal of Rural Studies 16:117-127.
Black, A. W. and Reeve, I. 1993. Participation in Landcare Groups: the Relative Importance of Attitudinal and Situational Factors. Journal of Environmental Management 39:51-71.
17

Bowler, I.R. (1979) Government and Agriculture: A Spatial Perspective. Longman, London.
Bowler, I.R. and Ilbery, B.W. (1987) Redefining agricultural geography. Area 4: 327-332.
Brotherton, I. 1991. What limits participation in ESAs? Journal of Environmental Management 32:241-249.
Campbell, A.C., 1995. Landcare: participative Australian approaches to inquiry and learning for sustainability. Journal of Soil and Water Conservation 50(2):125–131.
Cline, H. 2005. Sacramento Valley rice growers winter flood, ducks keep coming. Western Farm Press. May 5, 2005.
Coleman, D., Crabtree, B., Froud, J. and O'Carroll, L. 1992. Comparative Effectiveness of Conservation Mechanisms. Department of Agricultural Economics, Manchester University.
Davies, R.M. 1985. Conservation: a matter of motivation. What will it take to move more landowners and operators to conservation action? Journal of Soil and Water Conservation 40:400-402.
D’Souza, G.; Cyphers, D. and Phipps, T. 1993. Factors affecting the adoption of sustainable agricultural practice. Agricultural and Resource Economics Review 22(2):159-165
Earle, T. R., Rose, C.W. and Brownlea, A.A. 1979. Socio-economic predictors of intention towards soil conservation and their implication in environmental management. Journal of Environmental Management 9:225-236.
Ervin, C.A. and Ervin, D.E. 1982. Factor affecting the use of soil conservation practices: hypotheses, evidence and policy implications. Land Economics 58:277-292.
Evans, N.J. and Ilberty, B.W. 1989. A conceptual framework for investigating farm-based accommodation. Journal of Rural Studies 5, 257-1388.
Fleskes, J. and Cassaza, M. 2004. As the Duck Flies South. California Game & Fish Magazine November 5, 2004.
Forté-Gardner, O., Young, F.L., Dillman, D.A., and Carrol, M.S. 2004. Increasing the Effectiveness of technology transfer for conservation cropping systems through research and field design. Renewable Agriculture & Food Systems 19(4):199-209.
Gilad, B. and Kaish, S. (eds). 1986. Handbook of behavioral economics. Greenwich JAI Press, Connecticut.
Gillmor, D. 1986. Behavioral studies in agriculture: goals, values and enterprise choice. Irish Journal of Agricultural Economics and Rural Sociology 11:19-33.
Guerin, D.J. and Guerin, T.F. 1994. Constraints to the adoption of innovations in agricultural research and environmental management; review. Australian Journal of Experimental Agriculture 34:549-571.
Hoose, P.M. 1981. Building an Ark. Tools for the Preservation of Natural Diversity through Land Protection. Covelo: Island Press.
Ilbery, B.W. 1978. Agricultural decision-making: a behavioral perspective. Progress in Human Geography 2, 448-466.
Ilbery, B.W. and Bowler, I. 1993. The farm diversification grant scheme: adoption and non-adoption in England and Wales. Environment and Planning C: Government and Policy 11, 161-170.
18

Jones, G.E. 1963. The diffusion of agricultural innovations. Journal of Agricultural Economics 15:387-409.
Korsching, P.F., Stofferahn, C.W., Nowak, P.J. and Wagener, D.J. 1993. Adopter characteristics and adoption patterns of minimum tillage: implications for soil conservation programs. Journal of Soil and Water Conservation, 48, 428-431.
Lanyon, L., 1994. Participatory assistance: an alternative to transfer of technology for promoting change on farms. American Journal of Alternative Agriculture 9(3):136–142.
McDowell, C. and Sparks, R. 1989. The Multivariate Modelling and Prediction of Farmers’ Conservation Behavior Towards Natural Ecosystems. Journal of Environmental Management 28: 185-210.
McDowell, C. Sparks, R., Grindley, J. and Moll, E. 1989. Persuading the landowner to conserve natural ecosystems through effective communication. Journal of Environmental Management 28: 211-225.
Mardsen, T. 1988. Exploring political economy approaches in agriculture. Area 20: 315-322.
Morris, C. and Potter, C. 1995. Recruiting the New Conservationists: Farmers’ Adoption of Agrienvironmental schemes in the U.K. Journal of Rural Studies 11(1):51-63.
Napier, T.L., Thraen, C.S., Gore, A. and Gore, W.R. 1984. Factors affecting the adoption of conventional and conservation tillage practices in Ohio. Journal of Soil and Water Conservation 39: 205-209.
North Bay Agricultural Alliance. 2005. “$9-Million for Farmers” NBAA Newsletter October 2005. Sonoma.
Pampel, F. Jr., and van Es, J.C. 1977. Environmental quality and issues of adoption research. Rural Sociology 42:57-71.
Potter, C.A. and Gasson, R. 1988. Farmer participation in voluntary land diversion schemes. Journal of Rural Studies 4, 365-375.
Roberts and Lighthall 1991. The political economy of agriculture, groundwater quality management and agricultural research. Water Resources Bulletin 27:437-446
Roberts, W.S., and S.M. Swinton. 1996. Economic methods for comparing alternative crop production systems; A review of the literature. American Journal of Alternative Agriculture 11:10-17.
Rogers, E. M. 1983. Diffusion of Innovations 3rd Edition. The Free Press. New York.
Rogers, E. M. and Shoemaker, F. F. 1971. Communication of Innovations: A Cross-Cultural Approach 2nd Edition. The Free Press: New York.
van der Meulen, H.A.B., de Snoo, G.R., and Wossink, G.A.A. 1996. Farmers’ Perception of Unsprayed Crop Edges in the Netherlands. Journal of Environmental Management. 47:241255.
Smithers, J. and Furman, M. 2003. Environmental farm planning in Ontario: exploring participation and the endurance of change. Land Use Policy 20:343-356.\
van der Meulen, H.A.B.; de Snoo, G.R. and Wossink, G.A.A. 1996. Perceptions of unsprayed crop edges in the Netherlands. Journal of Environmental Management 47:241-255.
Wandel, J. and Smithers, J. 2000. Factors affecting the adoption of conservation tillage on clay soils in southwestern Ontario. American Journal of Alternative Agriculture. 15(4):181-188.
19

Ward, N. and Lowe, P. 1994. Shifting values in agriculture: the farm family and pollution regulation. Journal of Rural Studies 10:173-184.
Wilson, G. 1996. Farmer environmental attitudes and (non) participation in the ESA scheme. Geoforum 27(2):115-131.
Wilson, G. and Hart, K. 2000. Financial imperative or conservation concern? EU farmers’ motivations for participation in voluntary agri-environmental schemes. Environment and Planning A 32:2161-2185.
Wolpert, J. 1964. The decision process in spatial context. Annals of the Association of American Geographers 5:537-538.
Wossink, G.A.A., de Buck, A.J., van Niejenhuis, J.H., and Haverkamp, H.C.M. 1997. Farmer perceptions of weed control techniques in sugarbeet. Agricultural Systems 55(3):409-423.
20

Tasks And Deliverables
Task ID
Task Name Start
Month End
Month Personnel Involved Deliverables
1
Project Management / Administrative Activities
1 36 Laney, Rheyna
1. Hire graduate and undergraduate students
2. Manage graduate and undergraduate students' work
3. All administrative support will be provided by Sonoma State University staff, funded through indirect costs
2 Characterizing famers' a−prior attitudes and motivations
1 12 Laney, Rheyna student, graduate student, undergraduate
1. An attitudinal typology identifying groups of farmers with common attitudes, motivations, perceptions and socio−economic characteristics
2. An assessment of the distribution of farmers within the attitudinal typology
3. An attitudinal map for each region, delineating sub−regions with
Tasks And Deliverables 1

dominant attitudinal types
4. Policy recommendations for where to target future recruitment activities based on attitudinal types
3 Assessing the adoption decision
6 24 Laney, Rheyna student, graduate student, undergraduate
1. An assessment of how well agri−environmental projects are reaching the farmer population as a whole, by showing how the attitudinal types of recruited farmers and innovation adopters compare with the distribution of attitudinal types in the farm population as a whole.
2. A map of the spatial distribution of recruited farmers and innovation adopters, with an assessment of how their attitudinal types compare with the dominant attitudinal type in their sub−region.
Tasks And Deliverables 2

3. A list of extension activities or methods of communication that are particularly effective in reaching farmers, and strongly associated with increasing farmers’ positive attitudes.
4. A list of the most critical constraints impeding farmers from adopting conservation innovations, along with the thresholds in these critical variables at which farmers are unable/unwilling to adopt an innovation.
5. An empirically tested conceptual model of the conservation innovation adoption process.
6. Recommendations on how agri−environmental projects can better recruit the most prevalent, but
Tasks And Deliverables 3

possibly more difficult, attitudinal types of farmers.
7. Recommendations on how agri−environmental projects may better design conservation innovations to increase adoption rates.
4Long−term commitments 25 36
Laney, Rheyna student,
1. An assessment of farmers’ long−term commitment to the conservation innovations
2. A list of key factors affecting farmers’ long−term commitment
undergraduate 3. Recommendations on how agri−environmental projects can promote long−term commitment to the innovations by adopting farmers
5 Outreach 12 36 Laney, Rheyna
student, undergraduate
1. Website with raw data and results of analysis
2. Presentations to all agri−environmental projects and parties within the
Tasks And Deliverables 4

California Bay−Delta Program with interested in the results
3. Presentations in the local communities in which most of the farmers were surveyed, targeting groups such as service organizations with significant agricultural interests, local chapters of the farm bureau, and local environmental organizations.
4. Reports for the California Bay−Delta Program
5. Articles to journals reaching the larger academic, agricultural and environmental communities.
Tasks And Deliverables 5

Proposal Number Total Project Budget Summary by Task and by Fiscal Year Applicant Name Proposal Name
Note: This budget summary automatically links to the costs and totals on the "Budget Detail" worksheet. DO NOT CHANGE FORMULAS OR ENTER NUMBERS INTO ANY CELLS EXCEPT THE SHADED CELLS for "Cost Share" and "Other Matching Funds".
BUDGET SUMMARY Total Amount for
Year 1 Total Amount for
Year 2 Total Amount for
Year 3 Total Amount for
All Years Total Costs for Task One $ 2,892.97 $ 2,004.52 $ 1,060.12 5,957.61$ Total Costs for Task Two $ 40,861.01 $ - $ - 40,861.01$ Total Costs for Task Three $ 23,955.18 $ 55,132.07 $ - 79,087.26$ Total Costs for Task Four $ - $ - $ 25,998.98 25,998.98$ Total Costs for Task Five $ - $ 7,980.22 $ 15,343.29 23,323.51$ Total Costs for Task Six $ - $ - $ - -$ Total Costs for Task Seven $ - $ - $ - -$ Total Costs for Task Eight $ - $ - $ - -$ Total Costs for Task Nine $ - $ - $ - -$ Total Costs for Task Ten $ - $ - $ - -$ Total Costs for Task Eleven $ - $ - $ - -$ Total Costs for Task Twelve $ - $ - $ - -$ Total Costs for Task Thirteen $ - $ - $ - -$ Total Costs for Task Fourteen $ - $ - $ - -$ Total Costs for Task Fifteen $ - $ - $ - -$
Total Costs for Project Tasks $ 67,709.16 $ 65,116.81 $ 42,402.40 $ 175,228.37
1/Cost Share $ - $ - $ -$ - $ - $ -
$ -2/ Other Matching Funds $ -
1/ Cost share funds are specifically dedicated to your project and can include private and other State and Federal grants. Any funds listed in this line must be further described in the text of your proposal (see Chapter 3, Section D, of the PSP document)
2/ Other matching funds include other funds invested consistent with your project in your project area for which the ERP grant applicant is not eligible. Any funds listed in this line must be further described in the text of your proposal (see Chapter 3, Section D, of the PSP document) updated 12/1/05
calfed budget.xls Budget Summary 1 of 1 12/15/2005

Proposal Number Detailed Budget Breakdown by Task and by Fiscal Year Applicant Name Proposal Name
BUDGET FOR TASK ONE (Administrative)
TOTAL AMOUNT TASK 1 All Years
Year 1 Year 2 Year 3
Amount per hour
Number of Hours
Total Amount for Year 1
Amount per hour
Number of Hours
Total Amount for Year 2
Amount per hour
Number of Hours
Total Amount for Year 3
Personnel Rheyna Laney (replacement rate for release time) $ 3,825.50 $ 25.00 75 $ 1,875.00 $ 25.75 50 $ 1,287.50 $ 26.52 25 $ 663.00
$ - $ - $ - $ - $ - $ - $
-$ - $ - $ - $ - $ - $ - $
-$ - $ - $ - $ - $ - $ - $
-$ - $ - $ - $ - $ - $ - $
-$ - $ - $ - $ - $ - $ - $
-$ - $ - $ - $ - $ - $ - $
-$ - $ - $ - $ - $ - $ - $
-$ - $ - $ - $ - $ - $ - $
-$ - $ - $ - $ - $ - $ - $
-$ - $ - $ - $ - $ - $ - $
-Personnel Subtotal $ 3,825.50 $ 1,875.00 $ 1,287.50 $ 663.00
1/ Benefits as percent of salary 32% $590.63 $405.56 $208.85
Personnel Total (salary + benefits) $5,030.53 $2,465.63 $1,693.06 $871.85
Other Costs Total All Years Total Year 1 Total Year 2 Total Year 3
Operating Expenses: (ex: seed, plant materials, irrigation supplies, software, office supplies, etc) 2/ Travel and Per Diem 3/ Equipment 4/ Sub-Contractor 4/ Sub-Contractor 4/ Sub-Contractor 4/ Sub-Contractor 4/ Sub-Contractor
$ 150.00 $ 50.00 $ 50.00 $ 50.00 $ - $ - $ - $ -$ - $ - $ - $ -$ - $ - $ - $ -$ - $ - $ - $ -$ - $ - $ - $ -$ - $ - $ - $ -$ - $ - $ - $ -
Other Costs Subtotal $ 150.00 $ 50.00 $ 50.00 $ 50.00
5/Overhead Percentage (Applied to Personnel & Other Costs) 15% $ 377.34 $ 261.46 $ 138.28
Total Costs for Task One $ 5,957.61 $ 2,892.97 $ 2,004.52 $ 1,060.12

Proposal Number Detailed Budget Breakdown by Task and by Fiscal Year Applicant Name Proposal Name
BUDGET FOR TASK TWO TOTAL AMOUNT TASK 2 All Years
Year 1 Year 2 Year 3
Amount per hour
Number of Hours
Total Amount for Year 1
Amount per hour
Number of Hours
Total Amount for Year 2
Amount per hour
Number of Hours
Total Amount for Year 3
Personnel Rheyna Laney (replacement rate for release time) $ 4,125.00 $ 25.00 165 $ 4,125.00 $ - $
-
$ - $ -Rheyna Laney (full time) $ 5,610.00 $ 46.75 120 $ 5,610.00 $ - $ - $ - $ -Graduate Student Research Assistant $ 11,542.50 $ 20.25 570 $ 11,542.50 $ - $ - $
-
$ -Undergraduate Student $ 1,560.00 $ 9.75 160 $ 1,560.00 $ - $ - $ - $
-
$ - $ - $ - $ - $ - $ - $
-$ - $ - $ - $ - $ - $ - $
-$ - $ - $ - $ - $ - $ - $
-$ - $ - $ - $ - $ - $ - $
-$ - $ - $ - $ - $ - $ - $
-$ - $ - $ - $ - $ - $ - $
-$ - $ - $ - $ - $ - $ - $
-Personnel Subtotal $ 22,837.50 $ 22,837.50 $ - $ -
1/ Benefits as percent of salary 32% $7,193.81 $0.00 $0.00
Personnel Total (salary + benefits) $30,031.31 $30,031.31 $0.00 $0.00
Other Costs Total All Years Total Year 1 Total Year 2 Total Year 3
Operating Expenses: (ex: seed, plant materials, irrigation supplies, software, office supplies, etc) 2/ Travel and Per Diem 3/ Equipment 4/ Sub-Contractor 4/ Sub-Contractor 4/ Sub-Contractor 4/ Sub-Contractor 4/ Sub-Contractor
$ 500.00 $ 500.00 $ - $ -$ 5,000.00 $ 5,000.00 $ - $ -$ - $ - $ - $ -$ - $ - $ - $ -$ - $ - $ - $ -$ - $ - $ - $ -$ - $ - $ - $ -$ - $ - $ - $ -
Other Costs Subtotal $ 5,500.00 $ 5,500.00 $ - $ -
5/Overhead Percentage (Applied to Personnel & Other Costs) 15% $ 5,329.70 $ - $ -
Total Costs for Task Two $ 40,861.01 $ 40,861.01 $ - $ -

Proposal Number Detailed Budget Breakdown by Task and by Fiscal Year Applicant Name Proposal Name
BUDGET FOR TASK THREE TOTAL AMOUNT TASK 3 All Years
Year 1 Year 2 Year 3
Amount per hour
Number of Hours
Total Amount for Year 1
Amount per hour
Number of Hours
Total Amount for Year 2
Amount per hour
Number of Hours
Total Amount for Year 3
Personnel Rheyna Laney (replacement rate for release time) $ 13,210.00 $ 25.00 240 $ 6,000.00 $ 25.75 280 $ 7,210.00 $ - $ -Rheyna Laney (full time) $ 5,778.00 $ - $ - $ - $ 48.15 120 $ 5,778.00 $ - $ -Graduate Student Research Assistant $ 23,639.70 $ 20.25 285 $ 5,771.25 $ 20.85 857 $ 17,868.45 $ - $ -Undergraduate Student $ 4,270.80 $ 9.75 160 $ 1,560.00 $ 10.04 270 $ 2,710.80 $ - $
-$ - $ - $ - $ - $ - $ - $
-$ - $ - $ - $ - $ - $ - $
-$ - $ - $ - $ - $ - $ - $
-$ - $ - $ - $ - $ - $ - $
-$ - $ - $ - $ - $ - $ - $
-$ - $ - $ - $ - $ - $ - $
-$ - $ - $ - $ - $ - $ - $
-Personnel Subtotal $ 46,898.50 $ 13,331.25 $ 33,567.25 $ -
1/ Benefits as percent of salary 32% $4,199.34 $10,573.68 $0.00
Personnel Total (salary + benefits) $61,671.53 $17,530.59 $44,140.93 $0.00
Other Costs Total All Years Total Year 1 Total Year 2 Total Year 3
Operating Expenses: (ex: seed, plant materials, irrigation supplies, software, office supplies, etc) 2/ Travel and Per Diem 3/ Equipment 4/ Sub-Contractor 4/ Sub-Contractor 4/ Sub-Contractor 4/ Sub-Contractor 4/ Sub-Contractor
$ 600.00 $ 300.00 $ 300.00 $ -$ 6,500.00 $ 3,000.00 $ 3,500.00 $ -$ - $ - $ - $ -$ - $ - $ - $ -$ - $ - $ - $ -$ - $ - $ - $ -$ - $ - $ - $ -$ - $ - $ - $ -
Other Costs Subtotal $ 7,100.00 $ 3,300.00 $ 3,800.00 $ -
5/Overhead Percentage (Applied to Personnel & Other Costs) 15% $ 3,124.59 $ 7,191.14 $ -
Total Costs for Task Three $ 79,087.26 $ 23,955.18 $ 55,132.07 $ -

Proposal Number Detailed Budget Breakdown by Task and by Fiscal Year Applicant Name Proposal Name
BUDGET FOR TASK FOUR TOTAL AMOUNT TASK 4 All Years
Year 1 Year 2 Year 3
Amount per hour
Number of Hours
Total Amount for Year 1
Amount per hour
Number of Hours
Total Amount for Year 2
Amount per hour
Number of Hours
Total Amount for Year 3
Personnel Rheyna Laney (replacement rate for release time) $ 8,353.80 $ - $ - $ - $
-
$ 26.52 315 $ 8,353.80 Rheyna Laney (full time) $ 5,952.00 $ - $ - $ - $ - $ 49.60 120 $ 5,952.00 Undergraduate Student $ 1,137.40 $ - $ - $ - $ - $ 10.34 110 $ 1,137.40
$ - $ - $ - $ - $ - $ - $
-$ - $ - $ - $ - $ - $ - $
-$ - $ - $ - $ - $ - $ - $
-$ - $ - $ - $ - $ - $ - $
-$ - $ - $ - $ - $ - $ - $
-$ - $ - $ - $ - $ - $ - $
-$ - $ - $ - $ - $ - $ - $
-$ - $ - $ - $ - $ - $ - $
-Personnel Subtotal $ 15,443.20 $ - $ - $ 15,443.20
1/ Benefits as percent of salary 32% $0.00 $0.00 $4,864.61
Personnel Total (salary + benefits) $20,307.81 $0.00 $0.00 $20,307.81
Other Costs Total All Years Total Year 1 Total Year 2 Total Year 3
Operating Expenses: (ex: seed, plant materials, irrigation supplies, software, office supplies, etc) 2/ Travel and Per Diem 3/ Equipment 4/ Sub-Contractor 4/ Sub-Contractor 4/ Sub-Contractor 4/ Sub-Contractor 4/ Sub-Contractor
$ 300.00 $ - $ - $ 300.00 $ 2,000.00 $ - $ - $ 2,000.00 $ - $ - $ - $ -$ - $ - $ - $ -$ - $ - $ - $ -$ - $ - $ - $ -$ - $ - $ - $ -$ - $ - $ - $ -
Other Costs Subtotal $ 2,300.00 $ - $ - $ 2,300.00
5/Overhead Percentage (Applied to Personnel & Other Costs) 15% $ - $ - $ 3,391.17
Total Costs for Task Four $ 25,998.98 $ - $ - $ 25,998.98
Proposal Number Detailed Budget Breakdown by Task and by Fiscal Year Applicant Name Proposal Name
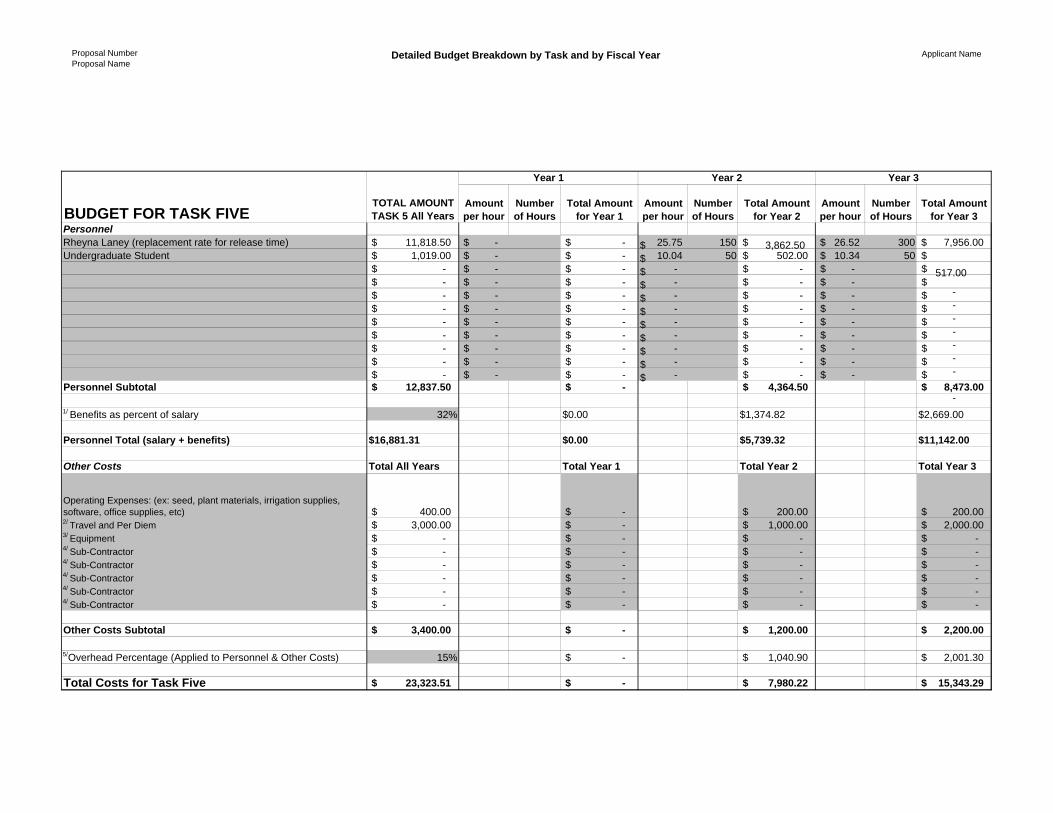
BUDGET FOR TASK FIVE TOTAL AMOUNT TASK 5 All Years
Year 1 Year 2 Year 3
Amount per hour
Number of Hours
Total Amount for Year 1
Amount per hour
Number of Hours
Total Amount for Year 2
Amount per hour
Number of Hours
Total Amount for Year 3
Personnel Rheyna Laney (replacement rate for release time) $ 11,818.50 $ - $ - $ 25.75 150 $ 3,862.50 $ 26.52 300 $ 7,956.00 Undergraduate Student $ 1,019.00 $ - $ - $ 10.04 50 $ 502.00 $ 10.34 50 $
517.00 $ - $ - $ - $ - $ - $ - $
-$ - $ - $ - $ - $ - $ - $
-$ - $ - $ - $ - $ - $ - $
-$ - $ - $ - $ - $ - $ - $
-$ - $ - $ - $ - $ - $ - $
-$ - $ - $ - $ - $ - $ - $
-$ - $ - $ - $ - $ - $ - $
-$ - $ - $ - $ - $ - $ - $
-$ - $ - $ - $ - $ - $ - $
-Personnel Subtotal $ 12,837.50 $ - $ 4,364.50 $ 8,473.00
1/ Benefits as percent of salary 32% $0.00 $1,374.82 $2,669.00
Personnel Total (salary + benefits) $16,881.31 $0.00 $5,739.32 $11,142.00
Other Costs Total All Years Total Year 1 Total Year 2 Total Year 3
Operating Expenses: (ex: seed, plant materials, irrigation supplies, software, office supplies, etc) 2/ Travel and Per Diem 3/ Equipment 4/ Sub-Contractor 4/ Sub-Contractor 4/ Sub-Contractor 4/ Sub-Contractor 4/ Sub-Contractor
$ 400.00 $ - $ 200.00 $ 200.00 $ 3,000.00 $ - $ 1,000.00 $ 2,000.00 $ - $ - $ - $ -$ - $ - $ - $ -$ - $ - $ - $ -$ - $ - $ - $ -$ - $ - $ - $ -$ - $ - $ - $ -
Other Costs Subtotal $ 3,400.00 $ - $ 1,200.00 $ 2,200.00
5/Overhead Percentage (Applied to Personnel & Other Costs) 15% $ - $ 1,040.90 $ 2,001.30
Total Costs for Task Five $ 23,323.51 $ - $ 7,980.22 $ 15,343.29

Environmental Compliance
CEQA Compliance
Which type of CEQA documentation do you anticipate? X none Skip the remaining questions in this section. − negative declaration or mitigated negative declaration − EIR − categorical exemption A categorical exemption may not be used for a project which may which may cause a substantial adverse change in the significance of a historical resource or result in damage to scenic resources within an officially designated state scenic highway.
If you are using a categorical exemption, choose all of the applicable classes below.
− Class 1. Operation, repair, maintenance, permitting, leasing, licensing, or minor alteration of existing public or private structures, facilities, mechanical equipment, or topographical features, involving negligible or no expansion of use beyond that existing at the time of the lead agency's determination. The types of "existing facilities" itemized above are not intended to be all−inclusive of the types of projects which might fall within Class 1. The key consideration is whether the project involves negligible or no expansion of an existing use.
− Class 2. Replacement or reconstruction of existing structures and facilities where the new structure will be located on the same site as the structure replaced and will have substantially the same purpose and capacity as the structure replaced.
− Class 3. Construction and location of limited numbers of new, small facilities or structures; installation of small new equipment and facilities in small structures; and the conversion of existing small structures from one use to another where only minor modifications are made in the exterior of the structure. The numbers of structures described in this section are the maximum allowable on any legal parcel, except where the project may impact on an environmental resource of hazardous or critical concern where designated, precisely mapped, and officially adopted pursuant to law by federal, state, or local agencies.
− Class 4. Minor public or private alterations in the condition of land, water, and/or vegetation which do not involve removal of healthy, mature, scenic trees except for forestry or agricultural purposes, except where the project may impact on an environmental resource of hazardous or critical concern where designated, precisely mapped, and officially adopted pursuant to law by federal, state, or local agencies.
Environmental Compliance 1

− Class 6. Basic data collection, research, experimental management, and resource evaluation activities which do not result in a serious or major disturbance to an environmental resource, except where the project may impact on an environmental resource of hazardous or critical concern where designated, precisely mapped, and officially adopted pursuant to law by federal, state, or local agencies. These may be strictly for information gathering purposes, or as part of a study leading to an action which a public agency has not yet approved, adopted, or funded.
− Class 11. Construction, or placement of minor structures accessory to (appurtenant to) existing commercial, industrial, or institutional facilities, except where the project may impact on an environmental resource of hazardous or critical concern where designated, precisely mapped, and officially adopted pursuant to law by federal, state, or local agencies.
Identify the lead agency.
Please write out all words in the agency title other than United States (Use the abbreviation "US".) and California (Use the abbreviation "CA".).
Is the CEQA environmental impact assessment complete?
If the CEQA environmental impact assessment process is complete, provide the following information about the resulting document.
Document Name State Clearinghouse Number
If the CEQA environmental impact assessment process is not complete, describe the plan for completing draft and/or final CEQA documents.
NEPA Compliance
Which type of NEPA documentation do you anticipate? X none Skip the remaining questions in this section. − environmental assessment/FONSI − EIS − categorical exclusion
Identify the lead agency or agencies.
Please write out all words in the agency title other than United States (Use the abbreviation
NEPA Compliance 2

"US".) and California (Use the abbreviation "CA".).
If the NEPA environmental impact assessment process is complete, provide the name of the resulting document.
If the NEPA environmental impact assessment process is not complete, describe the plan for completing draft and/or final NEPA documents.
Successful applicants must tier their project's permitting from the CALFED Record of Decision and attachments providing programmatic guidance on complying with the state and federal endangered species acts, the Coastal Zone Management Act, and sections 404 and 401 of the Clean Water Act.
Please indicate what permits or other approvals may be required for the activities contained in your proposal and also which have already been obtained. Please check all that apply. If a permit is not required, leave both Required? and Obtained? check boxes blank.
Permit Number
Local Permits And Approvals Required? Obtained? (If
Applicable) conditional Use Permit − −
variance − −
Subdivision Map Act − −
grading Permit − −
general Plan Amendment − −
specific Plan Approval − −
rezone − −
Williamson Act Contract Cancellation − −
other − −
Permit State Permits And Approvals Required? Obtained? Number
(If Applicable) scientific Collecting Permit − −
CESA Compliance: 2081 − −
NEPA Compliance 3

CESA Complance: NCCP − −
Lake Or Streambed Alteration Agreement − −
CWA 401 Certification − −
Bay Conservation And Development Commission Permit
− −
reclamation Board Approval − −
Delta Protection Commission Notification − −
state Lands Commission Lease Or Permit − −
action Specific Implementation Plan − −
SWRCB Water Transfer Approval − −
other − −
Federal Permits And Approvals Required? Obtained? Permit Number (If Applicable)
ESA Compliance Section 7 Consultation − −
ESA Compliance Section 10 Permit − −
Rivers And Harbors Act − −
CWA 404 − −
other − −
Permission To Access Property Required? Obtained? Permit
Number (If Applicable)
permission To Access City, County Or Other Local Agency Land
Agency Name − −
permission To Access State Land Agency Name
− −
permission To Access Federal Land Agency Name
− −
permission To Access Private Land Landowner Name
− −
If you have comments about any of these questions, enter them here.
NEPA Compliance 4

Land Use
Does the project involve land acquisition, either in fee or through easements? X No. Skip to the next set of questions. − Yes. Answer the following questions.
How many acres will be acquired by fee?
How many acres will be acquired by easement?
Describe the entity or organization that will manage the property and project activities, including operation and maintenance.
Is there an existing plan describing how the land and water will be managed? − No. − Yes. Cite the title and author or describe briefly.
Will the applicant require access across to or through public or private property that the applicant does not own to accomplish the activities in the proposal? − No. Skip to the next set of questions. X Yes. Answer the following question.
Describe briefly the provisions made to secure this access.
Interviews will be conducted in the farmers' homes. Farmers will be called on the phone, or contacted by letter, and asked if they would be willing to participate in this study, and if the interview may be conducted in their home.
Do the actions in the proposal involve physical changes in the current land use? X No. Skip to the next set of questions. − Yes. Answer the following questions.
Describe the current zoning, including the zoning designation and the principal permitted uses permitted in the zone.
Describe the general plan land use element designation, including the purpose and uses allowed in the designation.
Describe relevant provisions in other general plan elements affecting the site, if any.
Land Use 1

Is the land mapped as Prime Farmland, Farmland of Statewide Importance, Unique Farmland, or Farmland of Local Importance under the California Department of Conservation's Farmland Mapping and Monitoring Program? X No. Skip to the next set of questions. − Yes. Answer the following questions.
Land Designation Prime Farmland
Farmland Of Statewide Importance Unique Farmland
Farmland Of Local Importance
Acres Currently In Production? −
−
−
−
Is the land affected by the project currently in an agricultural preserve established under the Williamson Act? X No. Skip to the next set of questions. − Yes. Answer the following question.
Is the land affected by the project currently under a Williamson Act contract? − No. Skip to the next set of questions. − Yes. Answer the following question.
Why is the land use proposed consistent with the contract's terms?
Describe any additional comments you have about the projects land use.
Land Use 2