a social portrait of - office for social...
TRANSCRIPT

Department of Social and Family Affairs, Áras Mhic Dhiarmada, Store Street, Dublin 1.Tel: + 353 1 7043 851 Fax: + 353 1 7043 032 e-mail: [email protected] www.socialinclusion.ie
Building an Inclusive Society
Building an Inclusive Society
barcode / isbngoes here
Building an Inclusive Society
Building an Inclusive Society
A SOCIAL PORTRAIT OF OLDER PEOPLE IN IRELAND
A S
OC
IAL P
OR
TRA
IT OF
OLD
ER
PE
OP
LE IN
IRE
LAN
D

Printed on recycled papers with the following accreditations:

A SociAl PortrAit of older PeoPle in irelAnd
BAILE ÁTHA CLIATHARNA FHOILSIÚ AG OIFIG AN tSOLÁTHAIR
Le ceannach díreach ónOifig Dhíolta Foilseacháin Rialtas,
TEACH SUN ALLIANCE, SRÁID THEACH LAIGHEAN, BAILE ÁTHA CLIATH 2nó tríd an bpost ó
FOILSEACHÁN RIALTAS, AN RANNÓG POST-TRÁCHTA,51 FAICHE STIABHNA, BAILE ÁTHA CLIATH 2.
(Teil: 01 647 6834/35/36/37; Fax: 01 647 6843)nó trí aon díoltáir leabhar.
DublinPUBLISHED BY THE STATIONERY OFFICE
To be purchased directly from theGOVERNMENT PUBLICATIONS SALES OFFICE,
SUN ALLIANCE HOUSE, MOLESWORTH STREET, DUBLIN 2or by mail order from
GOVERNMENT PUBLICATIONS, POSTAL TRADE SECTION,51 ST. STEPHENíS GREEN, DUBLIN 2.
(Tel: 01 647 6834/35/36/37; Fax: 01 647 6843)Or through any bookseller.
Price s1.00
ISBN 0-7557-7501-5Government of Ireland 2007
(Prn: A7/0037)

�
A Social Portrait of older People in
irelandtony fahey, Bertrand Maitre, Brian nolan and christopher t. Whelan
the economic and Social research
institutefebruary �007
tony fahey, Bertrand Maitre, Brian nolan and christopher t. Whelan
the economic and Social research institutefebruary �007

�
Minister’s Foreword 4Brollach ón Aire 5Director’s Statement 6 Ráiteas an Stiúrthóra 7Introduction 8
What do we mean by ‘older people’? 9How many older people live in Ireland? 11Where do older people live? 13Older people, families and households 14
older people’s socio-economic circumstances 15 Income 16Consistent poverty 18‘At risk of poverty’ 19Types of deprivation 22
Access to services �5Housing 26Health 27Social contact 31Information and communication technologies 32
future prospects and data needs ��
Glossary 35 Bibliography and further reading 39
tABle of contentSC
ON
TEN
TS
A S
OC
IAL P
OR
TRA
IT OF O
LDE
R P
EO
PLE
IN IR
ELA
ND

�
It gives me great pleasure to introduce this social portrait on older people in Ireland, one of a series of reports commissioned by the Office for Social Inclusion from the Economic and Social Research Institute. These reports are based on the lifecycle approach, which underpins the social partnership agreement, Towards 2016, and the new National Action Plan for Social Inclusion 2007-2016 (NAPinclusion). This portrait aims to provide data and information on the situation of older people in Ireland in an easily understood manner and is designed to be of use to members of the public in general, as well as policy makers.
The overall aim of the lifecycle approach is to achieve a better balance between the scope and delivery of individual policies such as social welfare, health and care and the combined outcomes being achieved in improving welfare and well-being. The approach will promote greater coordination and integration of policies, and their implementation, to achieve better outcomes.
The social portraits also help in identifying the challenges we face in ensuring that the resources of Government are used to best effect in achieving social inclusion and wider social policy goals. There will be a particular emphasis in this context on the position of vulnerable groups.
We owe older people a decent standard of living. They have laid the foundations of our economic success and prosperity today through their sacrifices and hard work in more difficult times. Providing for the needs of older people is a key priority for this Government. I am particularly pleased, therefore, that in the recent Budget we have fulfilled our commitment to raise the State Pension to at least €200 per week. The importance of fulfilling this commitment is underlined by one of the findings in this report which shows that, on average, pensioners depend on benefits for up to 60% of their income.
Significant progress has been made in combating poverty, to which older people can be vulnerable. In less than a decade some 250,000 people have been lifted out of consistent poverty. Moreover, the
consistent poverty rate in 2005 for older people, at 3.7%, was much lower than the 7% rate for the population as a whole. The key goal over the next decade is not just to maintain progress in reducing consistent poverty but to aim to eliminate it by 2016. The Government is confident that the policies, targets and commitments set out in the NAPinclusion, and in Towards 2016 and the new National Development Plan, Transforming Ireland – A Better Quality of Life for All, will move us towards that goal. This portrait notes that the proportion of older people in our society is currently one of the lowest in the European Union. Our population, however, is projected to age significantly in the coming decades, mainly due to the impact of increasing life expectancy and a fall in the birth rate. This process will have wide ranging implications, particularly for pensions, health and long term care.
I am confident that this portrait and future editions will help us have a better knowledge and understanding of the lives of our older people, likely future trends, particularly in relation to ageing, and their implications for Government policy and society more generally. Finally, I would like to thank the Office for Social Inclusion and, especially, Tony Fahey, Bertrand Maitre, Brian Nolan, and Christopher T. Whelan of the ESRI who prepared this report. Thanks are also due to the National Adult Literacy Agency who provided guidance on plain English standards for the production of the portrait.
Séamus Brennan tdMinister for Social and Family Affairs
foreWord froM the MiniSter
THE
OF
FIC
E F
OR
SO
CIA
L INC
LUS
ION
5
BrollAch ón AireM
iNiS
TEr
’S fO
rE
wO
rd
Cuireann sé an-áthas orm an phortráid sóisialta seo de dhaoine níos sinne in Éirinn a thabhairt isteach, ceann de shraith tuarascálacha coimisiúnaithe ag an Oifig um Chuimsiú Sóisialta ón Institiúid um Thaighde Eacnamaíochta agus Sóisialta. Tá na tuarascálacha seo bunaithe ar chur chuige na saolré, a chuireann taca faoin gcomhaontú páirtíochta sóisialta, Towards 2016, agus an Plean Gníomhaíochta Náisiúnta um Chuimsiú Sóisialta 2007-2016 (cuimsitheacht PGN). Aimsíonn an phortráid seo chun sonraí agus eolas a sholáthar ar dháil na ndaoine níos sinne in Éirinn i mbealach atá éasca le tuiscint agus deartha chun a bheith úsáideach do bhaill an phobail go ginearálta, chomh maith le déantóirí polasaí.
Is í aidhm foriomlán cur chuige na saolré ná chun cothromaíocht níos fearr a bhaint amach idir scóip agus seachadadh polasaithe indibhidiúla ar nós leas sóisialta, sláinte agus cúram agus na torthaí comhcheangailte á bhaint amach i bhfeabhsú leasa agus folláine. Cuirfidh an cur chuige comhordú agus comhtháthú polasaithe chun cinn níos mó, agus a bhfeidhmiú, chun torthaí níos fearr a bhaint amach.
Cabhraíonn an phortráid sóisialta seo freisin in aithint na ndúshlán atá romhainn i gcinntiú go húsáidtear acmhainní an Rialtais chuig an éifeacht is fearr i mbaint amach cuimsitheacht sóisialta agus spriocanna polasaí sóisialta níos leithne. Beidh béim ar leithligh sa chomhthéacs seo ar sheasamh na ngrúpaí leochaileacha.
Dlitear dúinn é caighdeán maireachtála fiúntach a thabhairt do dhaoine níos sinne. Ta siad siúd na boinn a leagadh dár rathúlacht eacnamaíoch agus rathúnas inniu trína n-íobairtí agus obair chrua in amanna níos deacra. Tá soláthair do riachtanais na ndaoine níos sinne mar phríomhthosaíocht don Rialtas seo. Tá áthas ar leithligh orm, dá bharr sin, go bhfuilimid sa Bhuiséad déanaí tar éis ár ngealltanas a chomhlíonadh chun an Pinsean Stáit a ardú go ar a laghad €200 in aghaidh na seachtaine. Tá an tábhacht den ghealltanas seo a chomhlíonadh léirithe ag ceann de na torthaí sa tuarascáil seo a thaispeánann, ar an meán, go bhraitheann pinsinéirí ar shochair le haghaidh suas le 60% dá n-ioncam.
Tá dul chun cinn suntasach tar éis a bheith déanta i gcomhrac bochtaineacht, lena féidir le daoine
níos sinne a bheith leochaileach. I níos lú ná deich mbliana tá thart ar 250,000 duine tar éis a bheith tógtha ó bhochtaineacht chomhsheasmhach. Ina theannta sin, i 2005 bhí an ráta bochtaineachta chomhsheasmhach do dhaoine níos sinne, ag 3.7%, i bhfad níos ísle ná an ráta 7% don daonra in iomlán. Ní hí an phríomhsprioc thar an deich mbliana le teacht chun an dul chun cinn seo a choinneáil i laghdú bochtaineacht chomhsheasmhach amháin ach chun aimsiú chun í a dhíbirt faoi 2016. Tá an Rialtas muiníneach go bhfuil na polasaithe, spriocanna agus gealltanais leagtha amach sa chuimsitheacht PGN, agus i Towards 2016 agus an Plean Forbartha Náisiúnta 2007-2013, Athrú Mórar Éireann - Caighoeán Beatha Níos Fearr do Chách, chun sinn a bhogadh i dtreo an sprioc sin. Tugann an phortráid seo faoi deara go bhfuil líon na ndaoine níos sinne in ár sochaí ar cheann de na cinn is ísle san Aontas Eorpach faoi láthair. Mar sin féin, tá ár ndaonra réamh-mheasta d’aois go suntasach sa déaga le teacht, go príomha de bharr an tionchar d’ionchas saoil méadaithe agus titim sa rata breithe. Beidh impleachtaí leathan réimseacha ag an bpróiseas seo, go háirithe ar phinsin, sláinte agus cúram fadtéarmach.
Táim muiníneach go gcabhróidh an phortráid seo agus eagráin an todhchaí linn chun eolas agus tuiscint níos fearr a bheith againn ar shaoil ár ndaoine níos sinne, treochtaí dóchúla an todhchaí, go hairithe maidir le críonadh, agus a n-impleachtaí do pholasaí Rialtais agus an sochaí níos ginearálta. Ar deireadh, ba mhaith liom buíochas a ghabháil leis an Oifig um Chuimsiú Sóisialta agus, go háirithe, Tony Fahey, Bertrand Maitre, Brian Nolan, agus Christopher T. Whelan de chuid an ERSI a ullmhaigh an tuarascáil seo. Tá buíochas tuillte freisin ag an Gníomhaireacht Náisiúnta um Litearthacht d’Aosaigh a sholáthair treoir ar bhonn caighdeáin gnáth Bhéarla le haghaidh táirgeadh na portráide.
Séamus Brennan tdAire Gnóthaí Sóisialacha agus Teaghlaigh
A S
OC
IAL P
OR
TRA
IT OF O
LDE
R P
EO
PLE
IN IR
ELA
ND

�
director’S StAteMent
Social inclusion is about enabling people who are marginalised to obtain at a minimum the standards of living, access to services and the social life that are regarded as the norm for the majority of people in Ireland. Government policies and programmes make an enormous contribution to social well-being, but we need to focus more on the outcomes being achieved.
This new set of social portraits will help us to understand how people at various stages of the lifecycle are faring in relation to social inclusion, the progress being made in improving their standards of living and quality of life, and any data and information gaps that remain.
Traditionally, older people were among the groups most vulnerable to poverty. This is no longer the case in Ireland. Pensions have been increased substantially in real terms, as has access to essential services which are improving in quality, such as health, care and transport services. Steadily improving standards of living partly explain why life expectancy is continuing to improve.
It also explains why poverty has been reducing for older people. The level of consistent poverty among older people in 2005 was 3.7%, compared to 7% generally. The overall poverty goal in the NAPinclusion is to reduce the number of those experiencing consistent poverty to between 2% and 4% by 2012, with the aim of eliminating consistent poverty by 2016. Achievement of this goal is already well advanced in the case of older people.
The proportion of older people classified as being ‘at risk of poverty’ (below 60% of median income) fell in one year from 27.1% in 2004 to 20.1% in 2005. Moreover, only 7.2% were below the 50% median income threshold in 2005.
Vulnerability to poverty among older people, however, is most acute when circumstances change. This can include those living alone, especially after the death of a spouse or other family member and those who become increasingly frail and dependent. Other factors include isolation in remoter rural areas or in older urban areas, having poor quality or inappropriate housing and not having the support of family members to call on. People who have been poor before the onset of old age are more likely to remain vulnerable to poverty when they become pensioners.
These realities underline the importance, in particular, of quality service provision. Older people wish to remain living at home as long as possible, and a key aim is to provide them and their families with the necessary supports to enable them to do so.
This social portrait provides essential information on how older people are faring and will assist in promoting a more coordinated and integrated approach to meeting their needs, which is a key objective of the NAPinclusion.
Finally, I wish to join with the Minister in thanking the ESRI authors for producing this portrait, and the staff of this Office who worked on the project.
Gerry ManganDirectorOffice for Social Inclusion
THE
OF
FIC
E F
OR
SO
CIA
L INC
LUS
ION

7
dir
EC
TOr
’S S
TATEM
EN
T
ráiteAS An StiúrthórA
Baineann cuimsitheacht shóisialta le daoine atá imeallaithe a chumasú chun caighdeáin maireachtála, rochtain ar sheirbhísí agus an saol sóisialta a fháil a áirítear mar an norm do thromlach na ndaoine in Éirinn. Cuireann polasaithe agus cláir an Rialtais go mór le leas sóisialta, ach tá orainn díriú níos mó ar na torthaí á bhaint amach.
Cabhróidh an sraith nua portráidí sóisialta seo linn a thuiscint conas mar atá ag éirí le daoine ag céimeanna éagsúla na saolré maidir le cuimsitheacht shóisialta, an dul chun cinn á dhéanamh ina gcaighdeáin maireachtála agus cáilíocht na beatha a fheabhsú, agus aon bearnaí eolais agus sonraí atá fós ann.
Go traidisiúnta, bhíodh daoine níos sinne i measc na grúpaí is leochailí do bhochtaineacht. Ní hé seo an cás in Éirinn níos mó. Tá pinsin tar éis a bheith méadaithe go substainteach i ndáiríre, mar aon le rochtain ar sheirbhísí eisintiúla atá ag feabhsú i gcaighdeán, ar nós seirbhísí sláinte, cúraim agus iompair. Míníonn caighdeáin maireachtála feabhsaithe seasta i bpáirt an fáth go bhfuil ionchas saoil ag dul i bhfeabhas go leanúnach.
Míníonn sé freisin an fáth go bhfuil bochtaineacht tar éis a bheith ag laghdú do dhaoine níos sinne. Ba é 3.7% an leibhéal bochtaineachta comhsheasmhach i measc daoine níos sinne i 2005, i gcomparáid le 7% go ginearálta. Is í an sprioc foriomlán na bochtaineachta sa chuimsitheacht PGN ná chun líon na ndaoine ag eispéiriú bochtaineacht chomhsheasmhach a laghdú go idir 2% agus 4% faoi 2012, leis an aidhm de bhochtaineacht chomhsheasmhach a dhíbirt faoi 2016. Tá baint amach na sprice seo tosaithe go mór cheana féin i gcás daoine níos sinne.
Thit líon na ndaoine níos sinne rangaithe mar a bheith ‘i mbaol bochtaineachta’ (faoi bhun 60% d’ioncam meánach) in aon bhliain amháin ó 27.1% i 2004 go 20.1% i 2005. Ina theannta sin, ní raibh ach 7.2% faoi bhun tairseach 50% an ioncaim mheánach i 2005.
Mar sin féin tá leochaileacht bochtaineachta i measc daoine níos sinne, is géire nuair a athraíonn cúinsí. Is féidir le seo iad siúd ag cónaí ina aonair a áireamh, go hairithe i ndiaidh bás céile nó ball teaghlaigh eile agus iad siúd a éiríonn níos laige agus níos spleáiche. Áiríonn fachtóirí eile leithlisiú i gceantair tuaithe níos iargúlta nó i gceantair uirbeacha níos sinne, tithíocht drochchaighdeáin nó míchuí agus easpa tacaíochta ó bhaill teaghlaigh le glaoch orthu. Tá daoine ata tar éis a bheith bocht roimh seanaois a shroicheadh níos dóchúla chun fanacht leochaileach do bhochtaineacht nuair a déantar pinsinéirí díobh.
Léiríonn na réaltachta seo an tábhacht, ar leithligh, a bhaineann le seachadadh seirbhíse ardchaighdeáin. Is mian le daoine níos sinne fanacht ag maireachtáil sa bhaile chomh fada agus is féidir, agus príomhaidhm ná chun iad siúd agus a dteaghlaigh a sholáthar leis na tacaíochtaí riachtanacha chun iad a chumasú chun amhail a dhéanamh.
Soláthraíonn an phortráid sóisialta seo eolas eisintiúil ar conas mar ata ag éirí le daoine níos sinne agus cabhrófar i gcur chuige níos comhordaithe agus comhtháite a chur chun cinn d’fhonn freastal ar a gcuid riachtanais, atá mar phríomhchuspóir ag an gcuimsitheacht PGN.
Ar deireadh, ba mhian liom dul i dteannta an tAire i mbuíochas a ghabháil le húdair ERSI as ucht an phortráid seo a sholáthar, agus baill foirne na hOifige seo a oibrigh ar an dtionscnamh seo.
Gerry ManganStiúrthóirAn Oifig um Chuimsiú Sóisialta
A S
OC
IAL P
OR
TRA
IT OF O
LDE
R P
EO
PLE
IN IR
ELA
ND

�
introduction1
1 The authors wish to acknowledge the very helpful comments received from the staff of the Office for Social Inclusion on early drafts of this portrait.
This report aims to bring together some facts and figures about older people in Ireland today, drawing on a range of statistical sources and studies. It provides both a snapshot of the current situation and some discussion of recent trends and prospects for the future. The information will be particularly useful when developing policies that affect older people, such as the National Action Plan for Social Inclusion (NAPinclusion) and policy on pensions.
We start the report by describing the main trends in numbers of older people and their importance in the overall population. We then go on to look at the following topics:
the households in which older people live;
their socio-economic circumstances including income and material wellbeing;
their housing and neighbourhood environment;
their health and social contact; and
prospects for the future and data gaps.
We have tried to make the information as clear as possible for a wide range of readers. However, we have kept certain terms related to statistics, population changes and economics, as replacing these would lead to inaccurate reporting. These terms are defined in the glossary.
•
•
•
•
•
THE
OF
FIC
E F
OR
SO
CIA
L INC
LUS
ION

wh
AT iS A
Ch
ild?
WhAt do We MeAn By ‘older PeoPle’?
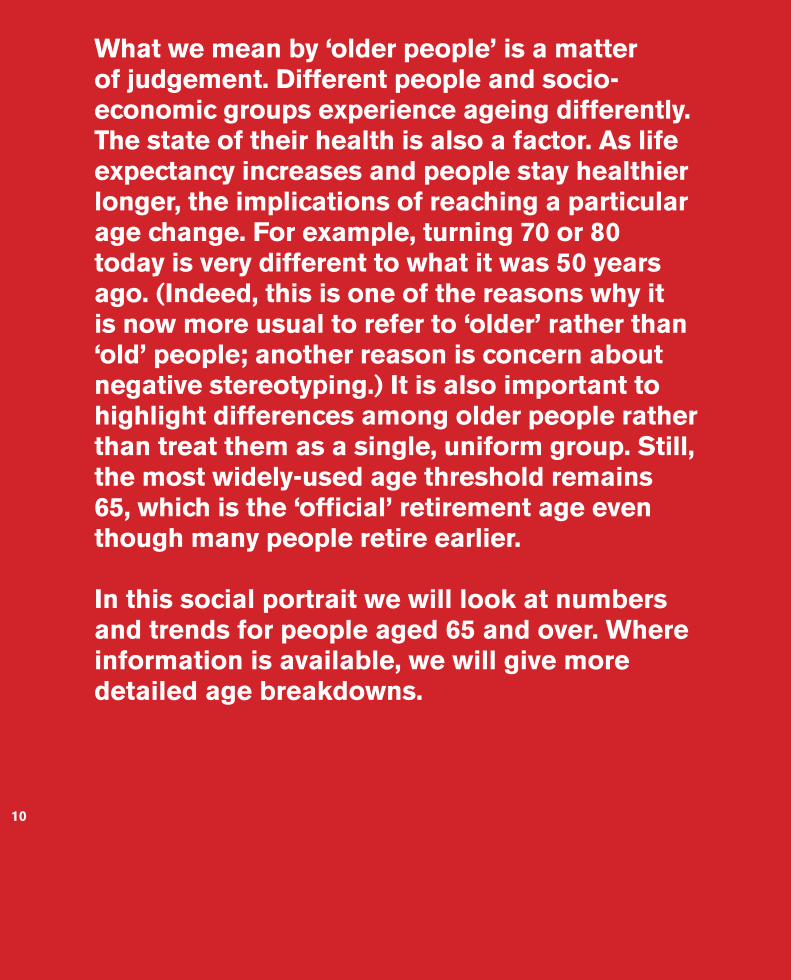
What we mean by ‘older people’ is a matter of judgement. different people and socio-economic groups experience ageing differently. the state of their health is also a factor. As life expectancy increases and people stay healthier longer, the implications of reaching a particular age change. for example, turning 70 or �0 today is very different to what it was 50 years ago. (indeed, this is one of the reasons why it is now more usual to refer to ‘older’ rather than ‘old’ people; another reason is concern about negative stereotyping.) it is also important to highlight differences among older people rather than treat them as a single, uniform group. Still, the most widely-used age threshold remains �5, which is the ‘official’ retirement age even though many people retire earlier.
in this social portrait we will look at numbers and trends for people aged �5 and over. Where information is available, we will give more detailed age breakdowns.
10
11
how many older people live in ireland?
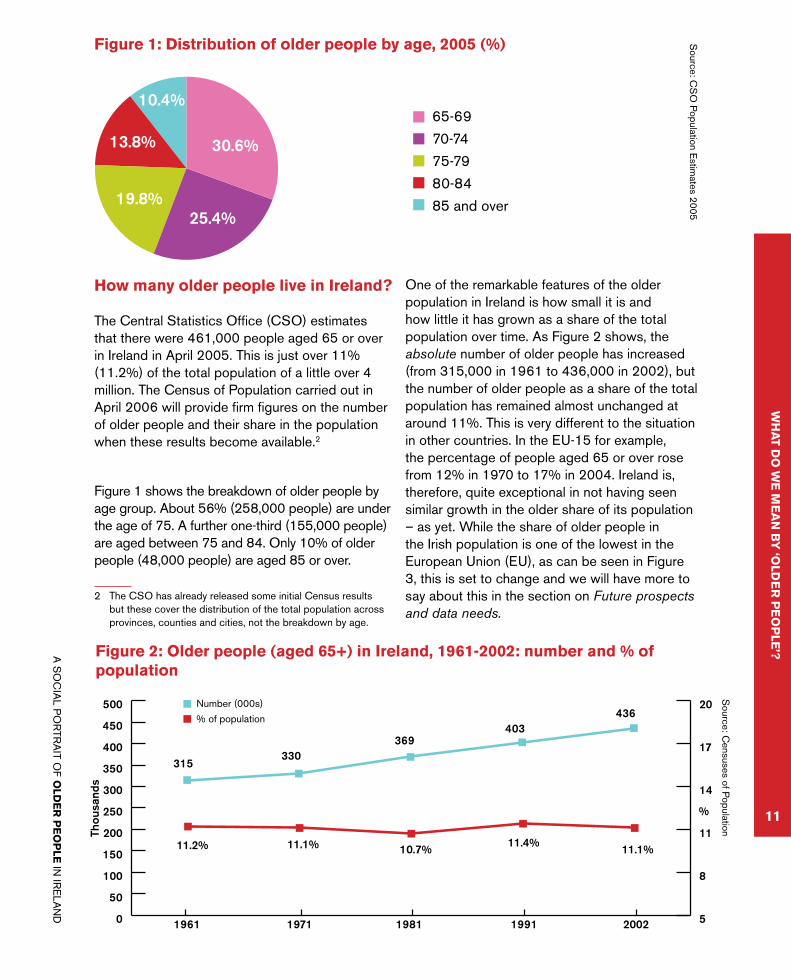
The Central Statistics Office (CSO) estimates that there were 461,000 people aged 65 or over in Ireland in April 2005. This is just over 11% (11.2%) of the total population of a little over 4 million. The Census of Population carried out in April 2006 will provide firm figures on the number of older people and their share in the population when these results become available.2
Figure 1 shows the breakdown of older people by age group. About 56% (258,000 people) are under the age of 75. A further one-third (155,000 people) are aged between 75 and 84. Only 10% of older people (48,000 people) are aged 85 or over.
2 The CSO has already released some initial Census results but these cover the distribution of the total population across provinces, counties and cities, not the breakdown by age.
One of the remarkable features of the older population in Ireland is how small it is and how little it has grown as a share of the total population over time. As Figure 2 shows, the absolute number of older people has increased (from 315,000 in 1961 to 436,000 in 2002), but the number of older people as a share of the total population has remained almost unchanged at around 11%. This is very different to the situation in other countries. In the EU-15 for example, the percentage of people aged 65 or over rose from 12% in 1970 to 17% in 2004. Ireland is, therefore, quite exceptional in not having seen similar growth in the older share of its population – as yet. While the share of older people in the Irish population is one of the lowest in the European Union (EU), as can be seen in Figure 3, this is set to change and we will have more to say about this in the section on Future prospects and data needs.
figure 1: distribution of older people by age, �005 (%) Source: C
SO
Population E
stimates 2005
figure �: older people (aged �5+) in ireland, 19�1-�00�: number and % of population
Source: C
ensuses of Population
1.0
1.5
2.0
2.5
3.0
3.5
4.0
4.5
0
50
100
150
200
250
300
65-69
70-74
75-79
80-84
85 and over
30.6%
25.4%19.8%
13.8%
10.4%
Wh
At d
o W
e M
eA
n B
y ‘o
lde
r P
eo
Ple
’?
0
50
100
150
200
250
300
350
400
450
500
5
8
11
14
17
20Number (000s)
% of population
1961 1971 1981 1991 2002
Thou
sand
s
%
315330
369403
436
11.2% 11.1% 10.7% 11.4% 11.1%
A S
OC
IAL P
OR
TRA
IT OF O
LDE
R P
EO
PLE
IN IR
ELA
ND

1�
Ireland
Sweden
Finland
UnitedKingdom Denmark
GermanyBelgium
Estonia
Spain
Italy
Cyprus
Latvia
Lithuania
Luxembourg
Hungary
Malta
Netherlands
Austria
Poland
Portugal Slovenia
SlovakiaFrance
Greece
CzechRepublic
EU 25 16.4
EU 15 17.0
16.916.9
11.1
16.0
16.3
13.9
17.1
14.1
18.0
14.9
19.2
13.1
15.5
15.0
14.0
15.5
11.5
13.0
16.2
16.1
15.0
15.6
17.2
17.8
11.9
Romania14.5
Bulgaria17.1
12
13
14
15
16
17
18
19
20
21EU-15 Women
Ireland Women
EU-15 Men
Ireland Men
1970 19901986 19941982 19981978 20021974
0
10
20
30
40
50
60
70
80
51.1% 57.3%52.6% 62.2% 68.8% 56.1%
65-69 70-74 75-79 80-84 85 and over all 65+
% o
f Fem
ales
Year
s
There are a number of reasons for this ‘non-ageing’ of the population in Ireland. One is the relatively high birth rate (compared with other developed countries) up to the early 1980s. This resulted in a relatively large youth population. Another reason is high emigration in the 1950s, which meant that the numbers of people reaching 65 in the 1990s and the early part of this decade were smaller than they otherwise would have been.
A third reason is the slow rate of improvement in life expectancy among older people in Ireland in the second half of the 20th century, especially among men. Up to the mid-1980s, as Figure 4 shows, older men’s life expectancy showed no sustained improvement. Indeed, this lack of improvement can be dated back to the 1920s. By contrast, women’s life expectancy grew only slightly slower than the European average. It is only since the second half of the 1990s that older Irish people began to close the life expectancy gap with the rest of Europe.
figure �: Percentage of older people aged �5+ in the population across �5 eu Member States, �00�
Source: E
urostat
figure �: life expectancy after age �5 in ireland and the eu-15, 1970-�00�
Source: W
HO
-Europe H
ealth for All D
atabase
THE
OF
FIC
E F
OR
SO
CIA
L INC
LUS
ION
1�
12
13
14
15
16
17
18
19
20
21EU-15 Women
Ireland Women
EU-15 Men
Ireland Men
1970 19901986 19941982 19981978 20021974
0
10
20
30
40
50
60
70
80
51.1% 57.3%52.6% 62.2% 68.8% 56.1%
65-69 70-74 75-79 80-84 85 and over all 65+
% o
f Fem
ales
Year
s
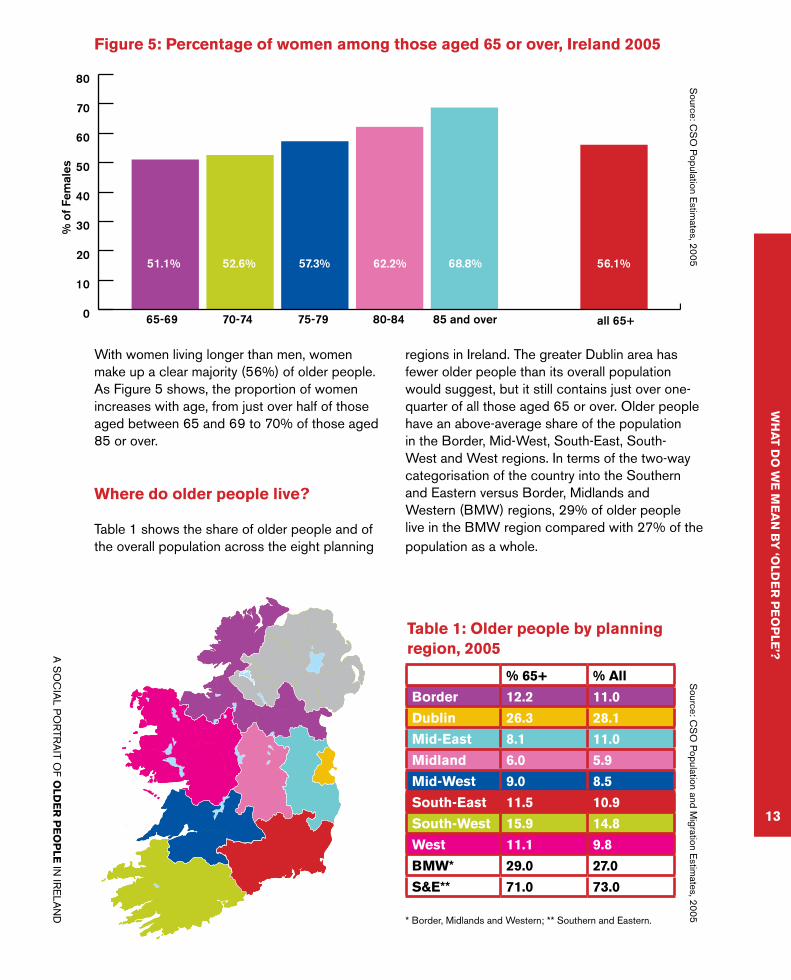
With women living longer than men, women make up a clear majority (56%) of older people. As Figure 5 shows, the proportion of women increases with age, from just over half of those aged between 65 and 69 to 70% of those aged 85 or over.
Where do older people live?
Table 1 shows the share of older people and of the overall population across the eight planning
regions in Ireland. The greater Dublin area has fewer older people than its overall population would suggest, but it still contains just over one-quarter of all those aged 65 or over. Older people have an above-average share of the population in the Border, Mid-West, South-East, South-West and West regions. In terms of the two-way categorisation of the country into the Southern and Eastern versus Border, Midlands and Western (BMW) regions, 29% of older people live in the BMW region compared with 27% of the population as a whole.
table 1: older people by planning region, �005
figure 5: Percentage of women among those aged �5 or over, ireland �005
Source: C
SO
Population E
stimates, 2005
% �5+ % All
Border 1�.� 11.0
dublin ��.� ��.1
Mid-east �.1 11.0
Midland �.0 5.9
Mid-West 9.0 �.5
South-east 11.5 10.9
South-West 15.9 1�.�
West 11.1 9.�
BMW* �9.0 �7.0
S&e** 71.0 7�.0
Wh
At d
o W
e M
eA
n B
y ‘o
lde
r P
eo
Ple
’?
Border
Dublin
Mid-East
Midland
Mid-West
South-East
South-West
West
Source: C
SO
Population and M
igration Estim
ates, 2005 * Border, Midlands and Western; ** Southern and Eastern.
A S
OC
IAL P
OR
TRA
IT OF O
LDE
R P
EO
PLE
IN IR
ELA
ND

1�
0
10
20
30
40
50
60
70
80
90
100
33.7%
41.9%
24.5%
33.0%
49.5%
17.5%
1981 2002
Single
Married
Widowed
%
Older people are also more likely than others to live in rural rather than urban areas, although most live in towns. In the 2002 Census, 55% of older people lived in towns compared with 60% of the overall population while 45% lived in rural areas compared with 40% of the total population.
older people, families and households
In this section, we look at the type of household in which older people live: alone, as a couple or with other people. In Ireland, as in other western countries, there is a growing tendency for older people to live apart from their children or other relatives. For example, in 2002, almost 60% of older people lived alone or as a couple.
Figure 6 shows that in 2002, 29% of older people were living alone and 30% were living in a couple household. In 1981 by comparison, 20% lived alone with another 20% living in a couple household. Those living as a couple with children or others have remained more or less the same, but those living in more complex households (for example, the widowed living with children or non-married older people living with brothers, sisters or other relatives) have become much less common.
This change in where older people live also suggests that more have been married at some point in their lives. During the early decades after independence, a time when the oldest of the present population were in their marriageable years, Ireland had a uniquely low marriage rate. Figure 7 shows that in 1981, for example, almost 25% of older people were single. No other country in the developed world had a similarly large proportion of older people who had never married.
In the 1960s and 1970s, however, Ireland experienced a marriage boom. Those who married at that time are now entering old age, increasing the proportion of married people in the older population. By 2002, for example, almost 50% of older people were married, compared to 42% in 1981, while the proportion who had never married had fallen to 17.5% and is likely to fall further over the coming period. In addition, those older people who remained single also usually remained childless, and so the shift away from singlehood means a fall in the proportion of older people who have neither a spouse nor adult children to look after them in old age.
From this, we can see that the growing tendency for older people to live alone or apart from their children does not necessarily mean a corresponding rise in the risk of isolation as older people are now more likely to have children and/or a spouse to care for them.
figure �: household circumstances of older people in ireland, 19�1 and �00�
Source: C
ensuses of Population
figure 7: Marital status of older people, 19�1 and �00�
Source: C
ensuses of Population
0
10
20
30
40
50
60
70
80
90
100
21%
16%
10%
13%
20%
20%
10%
9%
8%
14%
30%
29%
1981 2002
Living alone
Couple
Couple
+ children
Couple
+ others
Lone parent
+ children
Other
%
THE
OF
FIC
E F
OR
SO
CIA
L INC
LUS
ION

wh
AT iS A
Ch
ild?
older PeoPle’S Socio-econoMic circuMStAnceS

A S
OC
IAL P
OR
TRA
IT OF O
LDE
R P
EO
PLE
IN IR
ELA
ND
THE
OF
FIC
E F
OR
SO
CIA
L INC
LUS
ION
At this point we turn our attention to the material circumstances and well-being of older people. the main statistical source on this aspect of older people’s lives is the eu-Silc survey carried out by the central Statistics office in �00�. for trends over time, we can also draw on the living in ireland Survey carried out by the eSri between 199� and �001.
income
We start by looking at annual household income. The income of the household in which a person lives is a key influence on their living standards, and it is on household rather than individual income that we focus. However, a particular income level will mean a different standard of living for a large versus a small household, so differences in household size and composition are taken into account by calculating what is
known as ‘equivalised’ income.3 We see from Figure 8 that older people have average incomes that are a good deal lower than the working age population or the population as a whole. Older women also have slightly lower average incomes than older men.
3 This is achieved by giving a weight of 1 to the first adult, 0.66 to each remaining adult and 0.33 to each child, and dividing household income by the total number of “equivalent adults” in the household.
figure �: Average household (equivalised) income by age, �00�
0
10
20
30
40
50
60
70
80
90
100
33.7%
41.9%
24.5%
33%
49.5%
17.5%
1981 2002
Single
Married
Widowed
%
0
5000
10000
15000
20000
25000
Eur
os
Older people Older men Older women Working age population
Total population
�13,935 �14,513 �13,485 �20,198 �18,775
Source: E
U-S
ILC 200
4
1�

17
A S
OC
IAL P
OR
TRA
IT OF O
LDE
R P
EO
PLE
IN IR
ELA
ND
THE
OF
FIC
E F
OR
SO
CIA
L INC
LUS
ION
0
5
10
15
20
25
30
35
40
45
29 27 30 17 37 34 39 16 16 19 14 20 11 12 11 22 7 8 6 24
Bottom 2 3 4 Top
Older people
Older men
Older females
Working age population
%
0
5
10
15
20
25
30
35
40
45
29 27 30 17 37 3439 16 16 19 1420 11 12 1122 7 8 6 24
Bottom 2 3 4 Top
Older people
Older men
Older females
Working age population
%
Older people are also distinctive in terms of the sources of income their households receive. Results from the 2000 Living in Ireland Survey (see Gerard Hughes and Dorothy Watson, 2005), as illustrated in Figure 10 below, show the dependence of pensioners4 on social welfare income, which constitutes almost 60% of their income. Occupational pensions make up only one-fifth of their total income while investment income and earnings constitute 9% and 13% respectively.
4 A pensioner is defined as someone aged 65 years and over
In Figure 9 we turn our attention to where people are located across the income distribution, where the contrast between older people and the working age population is striking. Only 17% of the working age population versus 29% of those aged 65 or over are in the bottom one-fifth or quintile of the income distribution. The corresponding figures for location in the top one-fifth are 24% and 7%. Older women are marginally more likely to be located in the two bottom quintiles than older men. On the other hand, older men are more likely to be in the third to the top quintiles.
figure 9: household (equivalised) income position by age (bottom one-fifth up to top one-fifth of income distribution), �00�
Source: E
U-S
ILC 200
4
Source: Living In Ireland S
urvey, 2000
old
er
Pe
oP
le’S
So
cio
-ec
on
oM
ic c
irc
uM
StA
nc
eS

1�
0
5
10
15
20
25
30
35
16.8% 27.9% 8.1% 23.8% 31.6% 17.7% 24.4% 19.4% 28.3%
State Pension Transition (formerly Retirement Pension)
State Pension (Contributory)
State Pension (Non-contributory)
Older people
Older men
Older women
%
As far as earnings are concerned, data from EU-SILC 2004 shows that only a small proportion of older people, almost 7%, are at work. There is, however, a strong gender difference, as almost 13% of older men are at work versus 2% of older women. Figure 11 looks at the types of State pensions that older people receive and how this varies by gender. From it we can see that most older people (65%) are in receipt of state pension income, with older women being more likely to receive the means-tested non-contributory state pension rather than contributory pension.
consistent Poverty
We now shift our focus to the extent of consistent poverty, which is the principal measure used by the Irish Government in setting targets to reduce poverty. This measure focuses on people who are both on low incomes and experiencing deprivation in terms of a set of eight basic items they cannot afford to have or do.5 Using the 60% median income threshold,6
5 It is important to note that the surveys generally aim to record where a person or household lacks an item because they say they cannot afford it rather than because they do not want it.
6 The median income is the amount of income that is in the middle of the overall income distribution if each person’s income is listed in order from smallest to largest.
figure 11: Percentage of older people recipients of social welfare pension schemes, �00�
Source: E
U-S
ILC 200
4S
ource: EU
-SILC
2004
THE
OF
FIC
E F
OR
SO
CIA
L INC
LUS
ION

19
Figure 12 shows that the consistent poverty rate for older people is a good deal lower than that for people of working age. Reasons for this include the fact that older people:
experience lower housing costs;
benefit from the value of non cash benefits;
are more likely to be able to draw on accumulated resources; and
are particularly likely to enjoy support from family members.
These factors also help to explain why older women are not at a disadvantage compared with older men.7 However, comparisons over time are difficult because of the change in underlying survey data source, which is particularly problematic in measuring deprivation and consistent poverty. Nevertheless, there was little difference between working-age adults and older people in terms of consistent poverty in the late 1990s: by 2004 older people had a considerably lower rate.
A more up to date 11-item list for measuring consistent poverty, proposed by the ESRI, will form the basis of the consistent poverty measure
7 The same pattern holds when a higher threshold set at 70% of median income is employed in measuring consistent poverty.
•
•
•
•
in the new NAPinclusion. (The 11-item list is contained in the glossary.) The position of older people using that list, which employs a threshold of two deprivation items rather than one before the household is considered “deprived”, is shown in Figure 13. This picture is in fact similar to that seen with the original 8-item consistent poverty measure.
‘At risk of poverty’
We now turn to relative income poverty, also known as the ‘at risk of poverty’ indicator, where the position looks somewhat different for older people than under the consistent poverty measure. A person is said to be ‘at risk of poverty’ when their household receives less than 60% of median income.8 While the ‘at risk of poverty’ measure is often used to make comparisons between countries, there are several factors that limit its usefulness. These factors include difficulties when making comparisons between countries with different
8 The 60% threshold is most commonly used at EU level, but the Organisation for Economic Co-operation and Development (OECD) and the United Nations (UN) use a threshold of 50%. The threshold is adjusted for household size, so, for example, the threshold for a household with an adult couple and one child is about twice that for a single adult household.
old
er
Pe
oP
le’S
So
cio
-ec
on
oM
ic c
irc
uM
StA
nc
eS
A S
OC
IAL P
OR
TRA
IT OF O
LDE
R P
EO
PLE
IN IR
ELA
ND

�0
levels of economic development or within a country undergoing rapid economic growth, as has been the case in Ireland. However, the measure is one of several used at EU level to monitor progress in tackling poverty.
The greater concentration of older people towards the bottom of the income distribution has implications for the numbers falling below the ‘at risk of poverty’ thresholds. Figure 14 shows that in 2004 more than one-quarter of those aged 65 or over fell below the ‘at risk of poverty’ threshold set at 60% of median income. This is about one and a half times the rate for the total population and the working
age population. ‘At risk of poverty’ rates in 2004 for older women are marginally higher than for older men with respective figures of 28% versus 26%. While exact comparisons with earlier years are difficult to make due to the change in data source from the Living in Ireland Survey to the EU-SILC survey, these ‘at risk of poverty’ rates are considerably lower than those seen before 2001. Furthermore, recent results from the EU-SILC survey for 2005 show that these figures had fallen significantly to 20.3% for older men and 19.9% for older women.9
impact of social welfare pensions on ‘at risk of poverty’ rates The extent of reliance of older people on social welfare income (shown in Figure 10) and the impact of social welfare pensions on poverty can be illustrated in Figure 15 when examining the
9 A complete analysis of the results from the EU-SILC survey for 2005 was not available when developing this social portrait.
0
5
10
15
20
25
30
27% 26% 28% 17% 19%
60% Median
Older people
Older men
Older women
Working Age population
Total Population
0
20
40
60
80
100
85.3% 83.0% 87.1% 68.4% 62.7% 72.8% 63.4% 64.8% 62.3%
Before social transfers Including SW pensions but excluding other transfers
Including other transfers but excluding SW pensions
Older people
Older men
Older women
%
figure 15: ‘At risk of poverty’ rates before social welfare pensions and other social transfers for older people, �00�
Source: E
U-S
ILC 200
4
figure 1�: ‘At risk of poverty’ rates for older people, �00�
0
1
2
3
4
5
6
7
8 60% Median
3.4% 3.9% 3.0% 6.2% 6.8%
Older people
Older men
Older women
Working Age population
Total Population
0
5
10
15
20
25
30
27% 26% 28% 17% 19%
Older people
Older men
Older women
Working Age population
Total Population
%
Source: E
U-S
ILC 200
4
THE
OF
FIC
E F
OR
SO
CIA
L INC
LUS
ION

�1
0
5
10
15
20
25
30
35
27.9% 26.2% 27.1% 23.4% 28.6% 27.6%
All 65-74 All 75+ Males 65-74 Males 75+ Females 65-74 Females 75+
%
‘at risk of poverty’ rate before and after social welfare pensions. Prior to social transfers, 85% of older people are ‘at risk of poverty’ at the 60% median income line. When social welfare pensions are taken into account but not other social transfers it falls to almost 70%. Taking into account social transfers but not social welfare pensions, the ‘at risk of poverty’ rate falls to just above 60%. There are almost no differences between older men and older women. As well as greatly reducing the proportion of older people falling below the ‘at risk of poverty’ threshold, social transfers also substantially reduce the gap between the threshold and the incomes of those who remain below it – what is known as their ‘poverty gap’. This is evidenced by the fact that, using the OECD income threshold of 50% of median income, only 8.2% of older people are classified as being ‘at risk of poverty’ in 2004.
household type and ‘at risk of poverty’ As we saw earlier, household arrangements of older people are changing over time with a
growing trend towards living apart from their children. EU-SILC 2004 showed that almost 96% of older people are found in three forms of household. About 12% live in a household of at least 3 adults (without children), 36% in single households and 47% in a household with two adults only. As can be seen from Figure 16, the associated ‘at risk of poverty’ rate at the 60% median income line varies as one would expect with the size of household, going from a low of 14% for the larger household structure to a high of 37% for single person households.
risk of poverty and ageFigure 17 distinguishes within the older group between those aged 65-74 and those aged 75+. The extent of variation in ‘at risk of poverty’ rates is limited, but within age ranges women have higher rates than men. Also for both men and women, the EU-SILC results found that poverty rates are lower for those aged seventy-five or over than for those aged between 65 and 74.
old
er
Pe
oP
le’S
So
cio
-ec
on
oM
ic c
irc
uM
StA
nc
eS
0 5 10 15 20 25 30 35 40
27.1%
14.0%
23.6%
37.1%
All
Old
er P
eopl
e3
Adu
lts a
t le
ast 1
82
Adu
lts 1
81
Adu
lt 18
%
0
5
10
15
20
25
30
35
40
27.1% 14.0% 23.6% 37.1%
All Older People At least 3 Adults 2 Adults 1 Adult
%
Source: E
U-S
ILC 200
4
figure 1�: ‘At risk of poverty’ rates for older people by household type, �00�
figure 17: ‘At risk of poverty’ rates within the older population, �00�
Source: E
U-S
ILC 200
4
A S
OC
IAL P
OR
TRA
IT OF O
LDE
R P
EO
PLE
IN IR
ELA
ND

��
types of deprivation
In Figure 18 we now look at the specific deprivation items that make up the deprivation component of the revised 11-item consistent poverty measure referred to above. Here we can see that in no case do the older age group report higher levels of enforced deprivation than the working age population. The level of deprivation for older people ranges from a low of 1% in relation to a warm overcoat to a high of 11% in the case of new furniture. The corresponding figures for the working age population are 3% and 12%.
Mixed rates of deprivation of consumer durablesIn Figure 19 we extend the analysis of deprivation to a number of widely-owned consumer durables such as a telephone, video and stereo. Once again older people do not generally experience higher levels of enforced deprivation than those of working age. A slightly higher proportion of older people report having to do without a video and a stereo, but the differences are marginal, and a significantly lower proportion indicate that they have to do without a telephone or a car.10
10 This reflects the fact that a much higher proportion of working age people than older people without a telephone or a car say that is because they cannot afford them.
0 2 4 6 8 10 12 14
Go withoutheating
Two pairsof shoes
Roast jointor equivalent
Meals with meat,fish or chicken
New clothes
Warm overcoat
Houseadequately warm
New furniture
Family fordrink or meal
Afternoon orevening out
Presents forfamily/friends
Working Age Population %
Older people %
%
Source: E
U-S
ILC 200
4
figure 1�: economic strain items by age, �00�TH
E O
FF
ICE
FO
R S
OC
IAL IN
CLU
SIO
N

��
economic vulnerabilityFigure 20 looks at what we call ‘economic vulnerability’. Such vulnerability is captured by combining information about whether the household is below ‘at risk of poverty’ thresholds, experiencing enforced basic deprivation, and reporting difficulty in making ends meet. Statistical analysis (employing what is known as latent class analysis) identifies about one in six adults in 2004 as economically vulnerable. From Figure 20 we can see that this does not vary much by age: 17% of older people compared to 18% of the working age population are ‘vulnerable’ in this sense. Similarly there is very little differentiation by age among older people, those aged 75 or over having a slightly lower rate than those aged between 65 and 74.
old
er
Pe
oP
le’S
So
cio
-ec
on
oM
ic c
irc
uM
StA
nc
eS
Source: E
U-S
ILC 200
4
0
5
10
15
20
17.2% 18.2% 16.0% 17.8%
Older people
65-74 75+ Working Age
Population
%
figure �0: levels of economic vulnerability, �00�
A S
OC
IAL P
OR
TRA
IT OF O
LDE
R P
EO
PLE
IN IR
ELA
ND
Source: E
U-S
ILC 200
4

��
Subjective economic pressuresWe can extend the analysis beyond objective economic circumstances to take into account people’s subjective assessments of their own situation, using five indicators:
Going into arrears in relation to rent/mortgage or hire purchase commitments;
Incurring debts in relation to routine expenses;
Inability to cope with unexpected expenses;
Having difficulty or great difficulty in making ends meet;
Experiencing housing costs as a great burden.
Figure 21 compares older people with the working age population across this range of indicators, as well as comparing those aged 65-74 with those 75 or over. On the whole, older people are substantially less likely than those of working age to report experiencing such pressures. The greatest age disparity is for experiencing stress in relation to debt or arrears, aspects of economic risk that are much less common for the older age group.
•
•
•
•
•
0
5
10
15
20
25
1.8% 2%
1.5%
8.8%
1.4%
1.5%
1.2% 8%
16.2
%
17.3
%
14.8
%
20.1
%
16.9
%
18.4
%
15.4
%
23.7
%
11.6
%
13.1
%
9.7%
22.5
%
Arrears Debts Unable to cope with unexpected expenses
Difficulty in making ends meet
Housing costs agreat pressure
Older people
65-74
75+
Working age population
%
0
5
10
15
20
25
1.8% 2%
1.5%
8.8%
1.4%
1.5%
1.2% 8%
16.2
%17
.3%
14.8
%
20.1
%
16.9
%18
.4%
15.4
%23
.7%
11.6
%13
.1%
9.7%
22.5
%
Arrears Debts Unable to cope with unexpected expenses
Difficulty in making ends meet
Housing costs agreat pressure
Older people
65-74
75+
Working age population
%
figure �1: Subjective economic pressures by age, �00�
Source: E
U-S
ILC 200
4
THE
OF
FIC
E F
OR
SO
CIA
L INC
LUS
ION

�5
ch
ildr
en
’S S
oc
io-e
co
no
Mic
cir
cu
MS
tAn
ce
S
AcceSS to ServiceS
0
5
10
15
20
25
1.8% 2%
1.5%
8.8%
1.4%
1.5%
1.2% 8%
16.2
%
17.3
%
14.8
%
20.1
%
16.9
%
18.4
%
15.4
%
23.7
%
11.6
%
13.1
%
9.7%
22.5
%
Arrears Debts Unable to cope with unexpected expenses
Difficulty in making ends meet
Housing costs agreat pressure
Older people
65-74
75+
Working age population
%
0
5
10
15
20
25
1.8% 2%
1.5%
8.8%
1.4%
1.5%
1.2% 8%
16.2
%17
.3%
14.8
%
20.1
%
16.9
%18
.4%
15.4
%23
.7%
11.6
%13
.1%
9.7%
22.5
%
Arrears Debts Unable to cope with unexpected expenses
Difficulty in making ends meet
Housing costs agreat pressure
Older people
65-74
75+
Working age population
%

Access to services can play a crucial role in older people’s quality of life. Problems in relation to access, as might happen more in rural areas, could undermine that quality of life. in the following sections, we look at access in relation to:
• housing;
• health;
• social contact; and
• access to information and communication technologies.
housing
Most older people in Ireland own their own homes and very few have an outstanding mortgage. About 90% of those aged 65 or over own their houses, compared with 80% of households in the population as a whole. (There is little difference between those aged 65-74 and those aged 75 or over.) This gap between the owner-occupation rates of older versus younger households is similar to that in several other countries with high overall ownership rates, such as Spain, Italy and the USA.
In addition, very few older owner-occupiers have any mortgage left to pay, but nearly half of the owner-occupiers under 65 do. This means that many older people have a substantial asset in the form of debt-free property, particularly given the surge in house prices seen in recent years. Housing wealth thus offsets to some degree the inequalities in current income. Older people tend
to have low incomes but high housing wealth. Younger adults have higher incomes but bigger mortgages. In 2000, for example, households headed by people aged 65-74 had 11% of income compared to 15% of housing wealth. In contrast, households headed by people under 35 years of age had 25% of income but only 14% of housing wealth (Fahey, Nolan and Maitre 2004: 71).
Only a small minority of older people, about one in ten, live in rented accommodation. Most of these are in local authority rented housing, with only 2%-3% renting in the private sector.
We next look at the extent to which older people have the same housing-related amenities (such as a bath or shower, an indoor toilet, hot water and central heating) as working age adults. Whether they live in urban or rural areas is also a factor in this regard. Figure 22 shows that older people in urban areas have similar amenities to the working age population, except that they are
��

�7
0
20
40
60
80
1002.7% 1.7% 4% 0.7%
7.8% 5.7%10.4%
2.1%
35.4%31.5%
28.5%
11%
41.1%44.3%
36.9%
35.2%
16.9% 19.7% 13.3%
51%
Older people 65-74 75+ Working Age Population
Very Good
Good
Fair
Bad
Very Bad
%
more likely to lack central heating (with 9% of older adults doing without it compared with 5% of working age adults). On the other hand, older people in rural areas are more likely to do without basic amenities, with the largest difference again being for central heating. One in 11 of the rural working age population lack central heating compared with one in five older people in rural areas.
health
While life expectancy is rising and people are staying healthy longer, health-related problems can still be a major issue for older people. Figure
23 shows that when people were asked to rate their own health status, only one in six older people considered their health to be ‘very good’, compared with over one in two of the working age population. However, nine out of 10 older people considered their health to be ‘fair’ to ‘good’, with only 3% saying it was ‘very bad’.
Not surprisingly, there are significant differences by age within the older age group. About 4% of people aged 75 or over said their health was ‘very bad’ compared to 2% of those aged between 65 and 74. Similarly, about 14% of those aged 75 or over said their health was either ‘bad’ or ‘very bad’ compared with 7% of those aged 65-74.
figure ��: housing deprivation items by urban-rural location, �00�
Source: E
U-S
ILC 200
4
figure ��: Self-reported health status by age, �00�
Source: E
U-S
ILC 200
4
Ac
ce
SS
to S
er
vic
eS
0
5
10
15
20
25
Bath or Shower Toilet Central Heating Hot water Washing Machine
Urban older people
Urban working age population
Rural older people
Rural working age population0.
6%
0.5%
3.3%
1.3%
0.6%
0.6%
1.5%
0.7%
8.7%
4.9%
21.5
%
9.1%
1.7%
1.2%
5.2%
1.6%
1.7%
0.6%
3.3%
0.9%
%
0
5
10
15
20
25
Bath or Shower Toilet Central Heating Hot water Washing Machine
Urban older people
Urban working age population
Rural older people
Rural working age population
0.6%
0.5%
3.3%
1.3%
0.6%
0.6%
1.5%
0.7%
8.7%
4.9%
21.5
%9.
1%
1.7%
1.2%
5.2%
1.6%
1.7%
0.6%
3.3%
0.9%
%
A S
OC
IAL P
OR
TRA
IT OF O
LDE
R P
EO
PLE
IN IR
ELA
ND
��
A S
OC
IAL P
OR
TRA
IT OF O
LDE
R P
EO
PLE
IN IR
ELA
ND
THE
OF
FIC
E F
OR
SO
CIA
L INC
LUS
ION
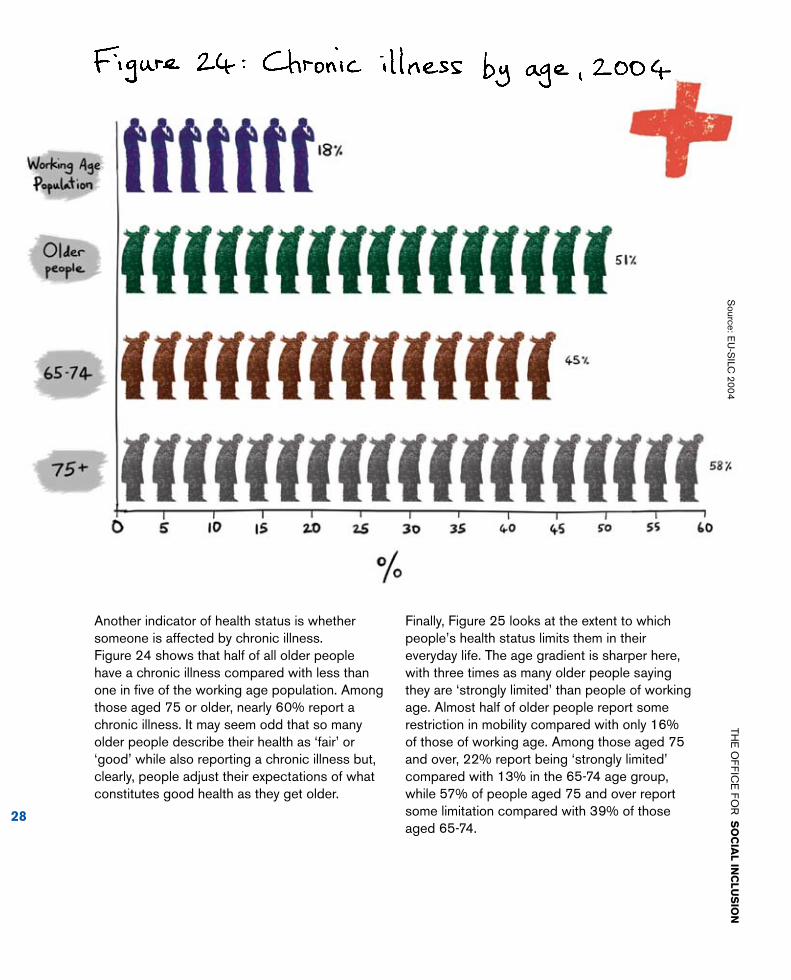
Another indicator of health status is whether someone is affected by chronic illness. Figure 24 shows that half of all older people have a chronic illness compared with less than one in five of the working age population. Among those aged 75 or older, nearly 60% report a chronic illness. It may seem odd that so many older people describe their health as ‘fair’ or ‘good’ while also reporting a chronic illness but, clearly, people adjust their expectations of what constitutes good health as they get older.
Finally, Figure 25 looks at the extent to which people’s health status limits them in their everyday life. The age gradient is sharper here, with three times as many older people saying they are ‘strongly limited’ than people of working age. Almost half of older people report some restriction in mobility compared with only 16% of those of working age. Among those aged 75 and over, 22% report being ‘strongly limited’ compared with 13% in the 65-74 age group, while 57% of people aged 75 and over report some limitation compared with 39% of those aged 65-74.
Source: E
U-S
ILC 200
4

A S
OC
IAL P
OR
TRA
IT OF O
LDE
R P
EO
PLE
IN IR
ELA
ND
THE
OF
FIC
E F
OR
SO
CIA
L INC
LUS
ION
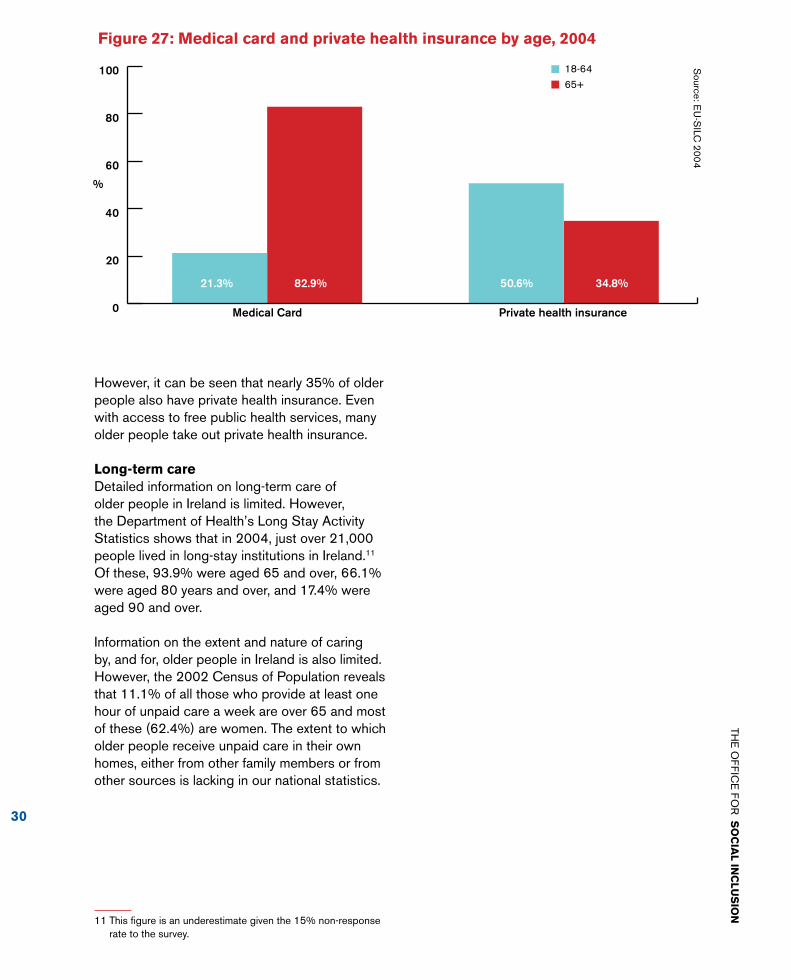
To be eligible for free GP visits, people must have a medical card. In July 2001, everyone over 70 became eligible for a medical card. As a result, nearly 83% of people aged 65 and over have a medical card compared with only 21% of those aged 18-64 years (see Figure 27). With a medical card, people have access to all public health services free of charge including GP services, prescription medicines and all public hospital and nursing home services.
how do older people use the health services?Figure 26A looks at the proportion of people who had free GP visits in the previous two weeks, while Figure 26B looks at people who spent at least one night in hospital in the previous year. As expected, older people had a higher number of free GP visits and twice as many older people spent at least one night in hospital compared with those of working age.
0
20
40
60
80
100
Older people 65-74 75+ Working Age Population
52.9% 60.5% 42.9% 84.1%
30.2% 26.9% 34.6%
10.8%16.8% 12.5% 22.5%5.1% Not Limited
Limited
Strongly Limited
0.0
0.2
0.4
0.6
0.8
1.0
0.7488 0.8942 0.0853 0.1853
%
figure �5: limitation in activity by age, �00�
Source: E
U-S
ILC 200
4S
ource: EU
-SILC
2004
0
20
40
60
80
100
Older people 65-74 75+ Working Age Population
52.9% 60.5% 42.9% 84.1%
30.2% 26.9% 34.6%
10.8%16.8% 12.5% 22.5%5.1% Not Limited
Limited
Strongly Limited
0.0
0.2
0.4
0.6
0.8
1.0
0.75 0.890.0853 0.1853
%
Average number of free GP visits per person in previous two weeks
18-64
65+
A
Percentage with at least one hospital night in previous year
0
5
10
15
20
8.5% 18.5%
%
B
18-64
65+
Source: E
U-S
ILC 200
4
figure ��: health services use by age
Ac
ce
SS
to S
er
vic
eS
�9
�0
However, it can be seen that nearly 35% of older people also have private health insurance. Even with access to free public health services, many older people take out private health insurance.
long-term care Detailed information on long-term care of older people in Ireland is limited. However, the Department of Health’s Long Stay Activity Statistics shows that in 2004, just over 21,000 people lived in long-stay institutions in Ireland.11 Of these, 93.9% were aged 65 and over, 66.1% were aged 80 years and over, and 17.4% were aged 90 and over.
Information on the extent and nature of caring by, and for, older people in Ireland is also limited. However, the 2002 Census of Population reveals that 11.1% of all those who provide at least one hour of unpaid care a week are over 65 and most of these (62.4%) are women. The extent to which older people receive unpaid care in their own homes, either from other family members or from other sources is lacking in our national statistics.
11 This figure is an underestimate given the 15% non-response rate to the survey.
figure �7: Medical card and private health insurance by age, �00�
0
20
40
60
80
100
21.3% 82.9% 50.6% 34.8%
Medical Card Private health insurance
18-64
65+
%
Source: E
U-S
ILC 200
4
THE
OF
FIC
E F
OR
SO
CIA
L INC
LUS
ION

�1
Social contact
Social isolation is a particular risk for older people, with potentially serious consequences. However, limited survey information is available about the quality and depth of social interactions by older people. An exception is the data from the Living in Ireland Surveys,12 which show that about two-thirds of older people talk to their neighbours most days, with most of the rest doing so once or twice a week (see Figure 28).
12 See Layte, Fahey and Whelan (1999), Chapter 9.
Similarly, Figure 29 shows that two-thirds of older people meet friends and relatives most days, with most of the rest doing so once or twice a week.
Importantly, older people living alone had similar levels of contact with other people. However, older rural women had less contact with others than older rural men. Older people were also less likely than younger people to be members of sports or social clubs or organisations, particularly in rural areas.
Ac
ce
SS
to S
er
vic
eS
figure ��: frequency of talking with neighbours, 1997
0
10
20
30
40
50
60
70
80 Older men
Older women
%
71.9
%
58.8
%
21.3
%
33.4
%
3.2%
4.0%
2.6%
2.7%
0.9%
1.1%
most days once or twice a week
once or twice a month
less than once a month
Never
Source: Living in Ireland S
urvey 1997
figure �9: frequency of meeting friends and relatives, 1997
0
10
20
30
40
50
60
70
80 Older men
Older women
%
73.2
%
63.5
%
22.4
%
28.0
%
2.6%
5.9%
1.4%
0.6%
0.5%
2.0%
most days once or twice a week
once or twice a month
less than once a month
Never
Source: Living in Ireland S
urvey 1997
A S
OC
IAL P
OR
TRA
IT OF O
LDE
R P
EO
PLE
IN IR
ELA
ND
��
information and communication technologies
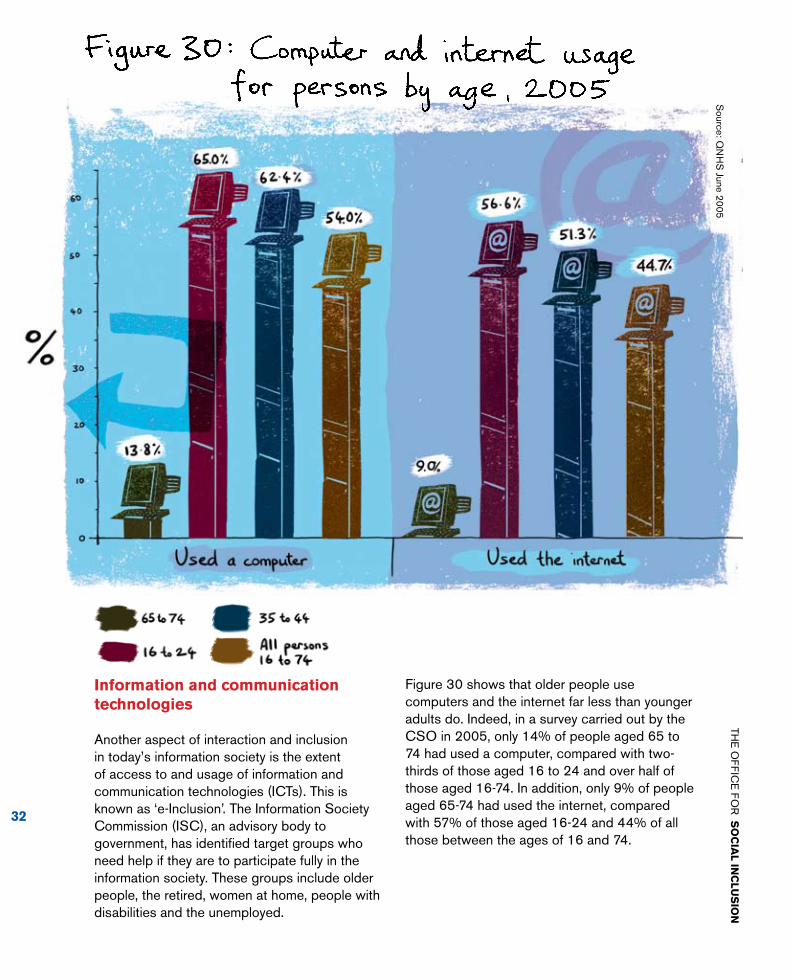
Another aspect of interaction and inclusion in today’s information society is the extent of access to and usage of information and communication technologies (ICTs). This is known as ‘e-Inclusion’. The Information Society Commission (ISC), an advisory body to government, has identified target groups who need help if they are to participate fully in the information society. These groups include older people, the retired, women at home, people with disabilities and the unemployed.
Figure 30 shows that older people use computers and the internet far less than younger adults do. Indeed, in a survey carried out by the CSO in 2005, only 14% of people aged 65 to 74 had used a computer, compared with two-thirds of those aged 16 to 24 and over half of those aged 16-74. In addition, only 9% of people aged 65-74 had used the internet, compared with 57% of those aged 16-24 and 44% of all those between the ages of 16 and 74.
Source: Q
NH
S June 2005
THE
OF
FIC
E F
OR
SO
CIA
L INC
LUS
ION
��
ed
uc
Atio
n
future ProSPectS And dAtA needS

��
At the beginning of this report, we noted that older people make up about 11% of the population of ireland. this is low compared to many other european countries, but is set to slowly change. Population projections by the central Statistics office suggest that by �0��, older people may make up �0% to ��% of the population. other projections suggest that older people could make up �9% of the population by �050 (Barrett and Bergin �005). this shift in population profile will have serious implications, particularly for pensions and other services that older people use or rely heavily on, such as health and long-term care.
In thinking about the future, it is clear that there are serious gaps in the information base on which policy has to be made. Perhaps the most pressing need is to know more about what really makes a difference to the quality of older people’s lives, whether in terms of the services already available to them or the ones they would like to access. This would be enormously helpful in planning for the future.
More detailed and regular information about the health of older people, the impact of ill-health or disability, and the use of and need for health and social care services, is another pressing need.
In addition, pension policy needs to be firmly underpinned by regular and detailed information not just about the pensions being received by those who are currently aged 65 or over, but also the pension entitlements of those who have not yet retired.
In this context, it would be useful to know more about the impact of older people’s growing wealth holdings, particularly housing wealth, on their lives. In principle, such wealth could be a resource to help finance retirement, for example, by trading down or in some other way releasing equity. At present, it is not known how widely this happens. Using housing wealth to help finance retirement could also have complex effects on family relationships, since the rising value of housing-related bequests and pre-mortem (before death) gifts could have an important bearing on the sense of obligation and entitlement that arises between generations within families. Again, however, this is unknown territory, since no aspect of inheritance has been adequately researched in Ireland in recent years.
THE
OF
FIC
E F
OR
SO
CIA
L INC
LUS
ION

�5
ed
uc
Atio
n
GloSSAry

��
A S
OC
IAL P
OR
TRA
IT OF O
LDE
R P
EO
PLE
IN IR
ELA
ND
THE
OF
FIC
E F
OR
SO
CIA
L INC
LUS
ION
‘At risk of poverty’ lines: Income thresholds derived as proportions of median income, for example, 60% of the median income in a sample.
consistent poverty: The original measure of consistent poverty identified from those people who were ‘at risk of poverty’ (i.e., receiving below 60% of median income), those who were also experiencing basic deprivation i.e. deprived of at least one out of � items considered necessary to ensure a basic standard of living. The 8 items were as follows:
Two pairs of strong shoes
A warm waterproof overcoat
Buy new not second-hand clothes
Eat meals with meat, chicken, fish (or vegetarian equivalent) every second day
Have a roast joint or its equivalent once a week
Had to go without heating during the last year through lack of money
Had a day in the last two weeks without a substantial meal due to lack of money
Experienced debt problems arising from ordinary living expenses
The revised consistent poverty measure identifies from those people who are ‘at risk of poverty’ (i.e., receiving below 60% of median income), those who are also deprived of at least two out of the following 11 items:
Without heating at some stage in the past year due to lack of money
Unable to afford two pairs of strong shoes
Unable to afford a roast joint (or its equivalent) once a week
•
•
•
•
•
•
•
•
•
•
•
Unable to afford a meal with meat, chicken or fish (or vegetarian equivalent) every second day
Unable to afford new (not second-hand) clothes
Unable to afford a warm waterproof coat
Keep the home adequately warm
Presents for family or friends at least once a year
Replace any worn out furniture
Have family or friends for a drink or meal once a month
Have a morning, afternoon or evening out in the last fortnight, for entertainment
economic vulnerability: A measure of the economic situation of a household that combines information about whether the household is below the ‘at risk of poverty’ threshold, experiencing enforced basic deprivation, and having difficulty making ends meet.
equivalence scales: A set of relativities between the needs of households of differing size and composition, used to adjust household income to take into account the greater needs of larger households.
eu 15: Member States of the European Union prior to the accession of 10 new member states on 1 May 2004, i.e. Austria, Belgium, Denmark, Finland, France, Germany, Greece, Ireland, Italy, Luxembourg, the Netherlands, Portugal, Spain, Sweden, United Kingdom.
eu �5: Member States of the European Union after the accession of 10 new member states on 1 May 2004, i.e. EU 15 plus Cyprus, the Czech
•
•
•
•
•
•
•
•
A S
OC
IAL P
OR
TRA
IT OF O
LDE
R P
EO
PLE
IN IR
ELA
ND
THE
OF
FIC
E F
OR
SO
CIA
L INC
LUS
ION
Poverty gap: The shortfall in incomes for those who fall below the ‘at risk of poverty’ threshold.
Quintile position: In income distribution terms, this is the fifth of the sample in which a person’s or household’s income is located (for example, the bottom quintile or bottom fifth).
risk of poverty: A term used by the European Union to denote whether a household falls below the 60% median income threshold.
Social welfare pensions: These include contributory pensions, which are based on a person’s social insurance record, and non-contributory pensions, which are based on a person’s means.
Social transfers: Cash receipts paid from various social welfare schemes to individuals or households.
urban/rural location: In EU-SILC each country is divided into eight levels based on population density. These areas are further grouped into urban and rural areas as follows:
urban:
cities, suburbs of cities, mixed urban/rural areas bordering on the suburbs of cities, towns and surrounding areas with populations of 5,000 or over (large urban);
mixed urban/rural areas bordering larger towns; and
towns and surrounding areas with a population of 1,000 to 5,000 (other urban).
rural:
mixed urban/rural areas, and rural areas.
•
•
•
•
•
•
Republic, Estonia, Hungary, Latvia, Lithuania, Malta, Poland, Slovakia, Slovenia.
eu-Silc: European Union Statistics on Income and Living Conditions; in Ireland an annual survey carried out by the Central Statistics Office since 2003.
household equivalent or (equivalised) income: Household income adjusted to take account of differences in household size and composition by means of equivalence scales.
life expectancy: The number of years that a person could expect to live on average, based on the mortality rates of the population in a given year.
liiS: Living in Ireland Survey, a household survey carried out by the Economic and Social Research Institute between 1994 and 2001.
Mean: The average value (for example, the average income in a sample obtained through a household survey).
Median: the value that divides a sample in half (e.g. the income level above and below which half the people in a sample fall).
occupational pension schemes: Schemes set up by employers to provide pension and other benefits to employees in retirement.
Planning region: The eight regions into which Ireland has been divided for certain planning and administrative purposes.
�7
��
A S
OC
IAL P
OR
TRA
IT OF O
LDE
R P
EO
PLE
IN IR
ELA
ND
THE
OF
FIC
E F
OR
SO
CIA
L INC
LUS
ION

�9
ch
ildc
Ar
e
The number of children aged under 15 living in households with only one or two children under 15 rose sharply between 1981 and 2002
•
A S
OC
IAL P
OR
TRA
IT OF O
LDE
R P
EO
PLE
IN IR
ELA
ND
THE
OF
FIC
E F
OR
SO
CIA
L INC
LUS
ION
BiBlioGrAPhy And further reAdinG

�0
Barrett, A.; Bergin, A. (2005): “Assessing Age-related Pressures on the Public Finances 2005 to 2050”, in Budget Perspectives 2006, Callan, T. and Doris, A (eds), Economic and Social Research Institute: Dublin.
Central Statistics Office (2006): Information Society and Telecommunications 2005, February 2006, Stationary Office: Dublin/Cork.
Central Statistics Office (2005): EU Survey on Income and Living Conditions (EU-SILC): First Results 2003, Statistical Release 24 January, Stationary Office: Dublin/Cork.
Fahey, T.; Maitre, B.; Nolan, B. (2004): Housing, Poverty and Wealth in Ireland, Institute of Public Administration and Combat Poverty Agency: Dublin.
Hughes, G.; Watson, D. (2005): Pensioners’ Incomes and Replacement Rates in 2000, Economic and Social Research Institute: Dublin.
Layte, R.; Fahey, T.; Whelan, C. T. (1999): “Social Interaction and Participation”, in Income, Deprivation and Well-Being Among Older Irish People, Layte, R.; Fahey, T.; Whelan, C. T. (eds), Economic and Social Research Institute: Dublin.
Maitre, B.; Nolan, B.; Whelan, C. T. (2006): Reconfiguring the Measurement of Deprivation and Consistent Poverty in Ireland, Economic and Social Research Institute: Dublin.
THE
OF
FIC
E F
OR
SO
CIA
L INC
LUS
ION

Printed on recycled papers with the following accreditations:

Department of Social and Family Affairs, Áras Mhic Dhiarmada, Store Street, Dublin 1.Tel: + 353 1 7043 851 Fax: + 353 1 7043 032 e-mail: [email protected] www.socialinclusion.ie
Building an Inclusive Society
Building an Inclusive Society
Building an Inclusive Society
Building an Inclusive Society
A SOCIAL PORTRAIT OF OLDER PEOPLE IN IRELAND
A S
OC
IAL P
OR
TRA
IT OF
OLD
ER
PE
OP
LE IN
IRE
LAN
D