a snapshot of drinking water, sanitation and hygiene
TRANSCRIPT

1
Phot
o: U
NIC
EF/U
N06
1863
/Bro
wn;
A snapshot of Drinking Water, Sanitation and Hygiene
in the UNICEF East Asia & Pacific Region
Prepared by: WHO/UNICEF Joint Monitoring Programme for Water Supply, Sanitation and Hygiene
September 2017

2
Sanitation coverage519 million people in the UNICEF East Asia & Pacific Region lacked a basic sanitation service in 2015, 75 million of whom practise open defecation
Safely managed Basic LimitedUnimproved Open defecation Countries in the region with the highest number of
people practising open defecation in 2015
Proportion of population using safely managed, basic, limited, unimproved sanitation services or practising open defecation, 2015
Safely managed - national Basic - national
>90%75-90%50-75%<50%
>95%75-95%
25-50%<25%
50-75%
T Safely managed sanitation estimate is available for 6 countries in the region
T Urban coverage of basic sanitation services exceeds 50% in 25 countries, rural coverage exceeds 50% in 19 countries
Insufficient dataNot applicable
Insufficient dataNot applicable
5541
5139
22
22
37
29
6
6
6
8
14
25
5
12
3 6 112
0
20
40
60
80
100
National Rural Urban World
Popu
latio
n (%
)
Safely managed Basic service
Limited service Unimproved
Open defecation
Indonesia, 32 China, 21 Cambodia, 6
Philippines, 6 Viet Nam, 4 Myanmar, 3
Rest of the Region, 3
0
20
40
60
80
100
TUV
PLW
CHN
AUS
NZL
MYS
KOR
JPN
SGP
PNG
SLB
KIR
TLS
KHM
VUT
MN
G
MM
R
NRU ID
N
LAO
PHL
PRK
VNM
MHL TK
L
TON
THA FJI
BRN
WSM NIU
COK
FSM
Safely managed Basic
Popu
latio
n (%
)
3
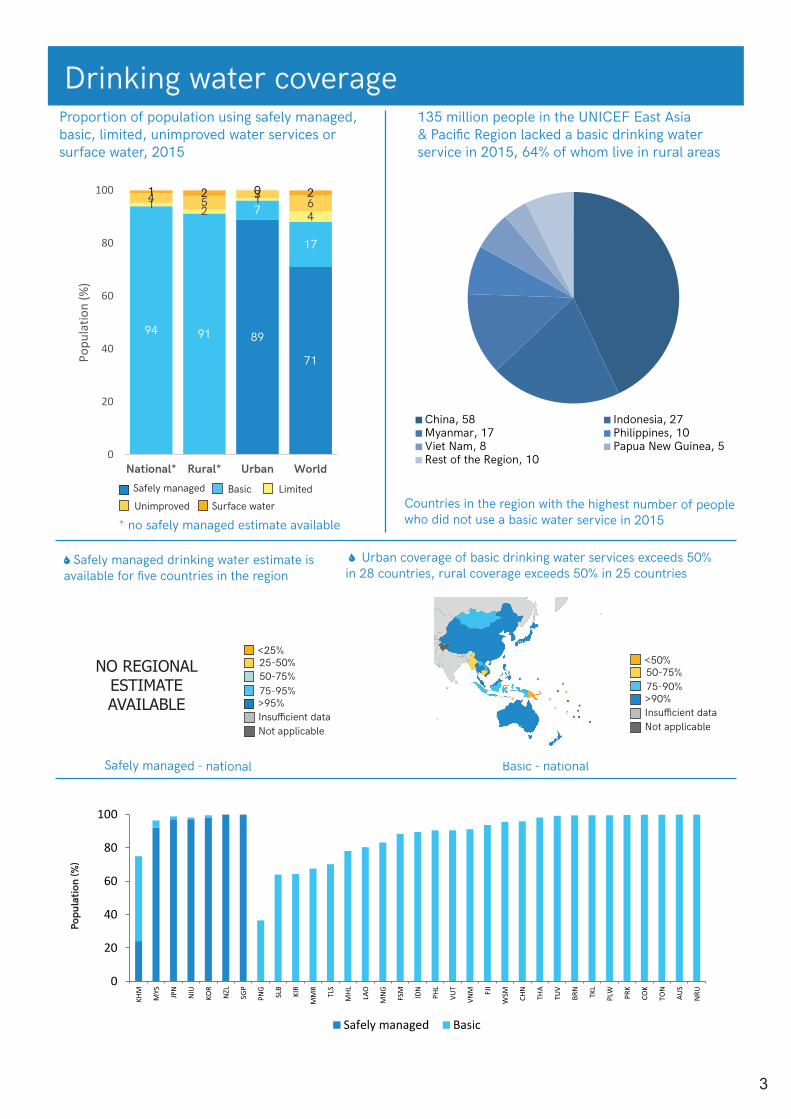
Drinking water coverage135 million people in the UNICEF East Asia & Pacific Region lacked a basic drinking water service in 2015, 64% of whom live in rural areas
Safely managed Basic LimitedUnimproved Surface water
* no safely managed estimate available
Proportion of population using safely managed, basic, limited, unimproved water services or surface water, 2015
Countries in the region with the highest number of people who did not use a basic water service in 2015
Safely managed - national Basic - national
>95%75-95%
25-50%<25%
50-75%
>90%75-90%50-75%<50%
£ Safely managed drinking water estimate is available for five countries in the region
£ Urban coverage of basic drinking water services exceeds 50% in 28 countries, rural coverage exceeds 50% in 25 countries
Insufficient dataNot applicable
Insufficient dataNot applicable
NO REGIONAL ESTIMATE AVAILABLE
89
71
94 91
7
17
1 21
44 5 3
61 2 0 2
0
20
40
60
80
100
National* Rural* Urban World
Popu
latio
n (%
)
Safely managed Basic service
Limited service Unimproved
Surface water
China, 58 Indonesia, 27Myanmar, 17 Philippines, 10Viet Nam, 8 Papua New Guinea, 5Rest of the Region, 10
0
20
40
60
80
100
KHM
MYS JPN
NIU
KOR
NZL
SGP
PNG
SLB
KIR
MM
R
TLS
MHL LAO
MN
G
FSM
IDN
PHL
VUT
VNM FJ
I
WSM CH
N
THA
TUV
BRN
TKL
PLW
PRK
COK
TON
AUS
NRU
Safely managed Basic
Popu
latio
n (%
)

4
Hygiene coverage
Basic - urban Basic - rural
> urban coverage of basic handwashing facilities exceeds 50% in 5 countries, rural coverage exceeds 50% in 4 countries
>90%76-90%50-75%<50%
Insufficient dataNot applicable
NO REGIONAL ESTIMATE AVAILABLE
“-”= no estimate; NA = data not applicable; for unrounded estimates see www.washdata.org
COUNTRY, AREA OR TERRITORY
Year
Popu
latio
n
(thou
sand
s)
% u
rban
NATIONAL RURAL URBAN
Bas
ic
Lim
ited
(with
out w
ater
or s
oap)
No
faci
lity
Bas
ic
Lim
ited
(w
ithou
t wat
er o
r soa
p)
No
faci
lity
Bas
ic
Lim
ited
(w
ithou
t wat
er o
r soa
p)
No
faci
lity
Cambodia 2015 15 578 21 66 13 22 60 15 26 88 5 7Indonesia 2015 257 564 54 77 6 18 66 8 26 86 4 11Mongolia 2015 2 959 72 72 7 21 49 10 41 81 6 12Myanmar 2015 53 897 34 80 14 6 74 19 7 92 5 3Viet Nam 2015 93 448 34 86 13 2 82 16 2 93 7 1

5
Inequalities
WorldEAPRO
Lao People's Democratic Republic
Reg
ions
Cou
ntrie
s
Urb
an/ru
ral
Wea
lthqu
intil
es
Sub
-nat
iona
lre
gion
s
0
20
40
60
80
100
Pro
porti
on o
f the
pop
ulat
ion
usin
g ba
sic
drin
king
wat
er s
ervi
ces
(%)
Note: Sub-national inequalities for Lao People's Democratic Republic 2012
Inequalities in basic drinking water
World
EAPRO
Timor-Leste
Reg
ions
Cou
ntrie
s
Urb
an/ru
ral
Wea
lthqu
intil
es
Sub
-nat
iona
lre
gion
s
0
20
40
60
80
100
Pro
porti
on o
f the
pop
ulat
ion
usin
g ba
sic
sani
tatio
n se
rvic
es (%
)
Note: Sub-national inequalities for Timor-Leste 2010
Inequalities in basic sanitation
World
EAPRO
Cambodia
Reg
ions
Cou
ntrie
s
Urb
an/ru
ral
Wea
lthqu
intil
es
Sub
-nat
iona
lre
gion
s
0
20
40
60
80
100
Pro
porti
on o
f the
pop
ulat
ion
not p
ract
isin
g op
en d
efec
atio
n (%
)
Note: Sub-national inequalities for Cambodia 2014
Inequalities in open defecation
Indonesia
Reg
ions
Cou
ntrie
s
Urb
an/ru
ral
Wea
lthqu
intil
es
Sub
-nat
iona
lre
gion
s
0
20
40
60
80
100
Pro
porti
on o
f the
pop
ulat
ion
usin
g ba
sic
hygi
ene
serv
ices
(%)
Note: Sub-national inequalities for Indonesia 2012
Inequalities in basic hygiene
Note: EAPRO - UNICEF East Asia & Pacific Region

6
0
200
400
600
800
1000
1200
1400
2000 2005 2010 2015
Popu
latio
n (m
illio
n)
At least basic Without basic
Trends
Drinking water
Sanitation
Open defecation
Urban Rural
Urban Rural
Urban Rural
In 2015, 96.2% of the urban population and 91.2% of the rural population used a basic drinking water service.
In 2015, 87.4% of the urban population and 63.5% of the rural population used a basic sanitation service.
In 2015, 1.1% of the urban population and 6.2% of the rural population practised open defecation.
0
200
400
600
800
1000
1200
1400
2000 2005 2010 2015
Popu
latio
n (m
illio
n)
At least basic Without basic
0
200
400
600
800
1000
1200
1400
2000 2005 2010 2015
Popu
latio
n (m
illio
n)
At least basic Without basic
0
200
400
600
800
1000
1200
1400
2000 2005 2010 2015
Popu
latio
n (m
illio
n)
At least basic Without basic
0
200
400
600
800
1000
1200
1400
2000 2005 2010 2015
Popu
latio
n (m
illio
n)
0
200
400
600
800
1000
1200
1400
2000 2005 2010 2015
Popu
latio
n (m
illio
n)

7
Safely managed services
83 77
37 4032
24
55
Improved Basic Sewerconnec�on
Onsitesanita�on
Wastewatertreated
Disposedin situ
Emp�ed andtreated
Safelymanaged
0
20
40
60
80
100
Prop
or�o
n of
pop
ula�
on (%
) 201
5
Safely managed elements:
55
22
6
14
3
Sanita�on ladder
Open defeca�on
Unimproved
Limited
Basic service
Safely managed
Safely managed sanita�on (2015)
75 75
58
24 24
Improved Basic Accessible Available Free fromon premises when
neededcontamina�on
Safelymanaged
0
20
40
60
80
100
Prop
or�o
n of
pop
ula�
on (%
) 201
5
Safely managed elements:
24
51
012
13
Water ladder
Surface water
Unimproved
Limited
Basic service
Safely managed
Safely managed drinking water (2015)Cambodia, na�onal

8
Sanitation estimates
“-”= no estimate; NA = data not applicable; for unrounded estimates see www.washdata.org
COUNTRY, AREA OR TERRITORY
Year
Popu
latio
n
(thou
sand
s)
% u
rban
NATIONAL RURAL URBAN
ISO
3
At l
east
bas
ic
Lim
ited
(sha
red)
Uni
mpr
oved
Ope
n de
feca
tion
Ann
ual r
ate
of c
hang
e in
bas
ic
Ann
ual r
ate
of c
hang
e in
ope
n de
feca
tion
At l
east
bas
ic
Lim
ited
(sha
red)
Uni
mpr
oved
Ope
n de
feca
tion
Ann
ual r
ate
of c
hang
e in
bas
ic
Ann
ual r
ate
of c
hang
e in
ope
n de
feca
tion
At l
east
bas
ic
Lim
ited
(sha
red)
Uni
mpr
oved
Ope
n de
feca
tion
Ann
ual r
ate
of c
hang
e in
bas
ic
Ann
ual r
ate
of c
hang
e in
ope
n de
feca
tion
Australia AUS2000 19 107 87 100 0 0 0
0.00 0.00- - - -
- -- - - -
- -2015 23 969 89 100 0 0 0 - - - - - - - -
Brunei Darussalam BRN2000 331 71 - - - -
- -- - - -
- -- - - -
- -2015 423 77 96 0 1 3 97 0 2 1 96 0 1 3
Cambodia KHM2000 12 198 19 12 1 4 83
2.44 -2.814 1 3 92
2.31 -2.7649 5 4 42
2.61 -2.652015 15 578 21 49 8 3 41 39 7 4 51 88 9 1 3
China CHN2000 1 269 975 36 61 4 33 2
0.96 -0.0652 3 42 4
0.63 -0.0777 5 18 0
0.64 0.042015 1 376 049 56 75 5 19 2 61 3 33 3 86 6 7 1
Cook Islands COK2000 18 65 92 0 7 1
0.37 -- - - -
- -- - - -
- -2015 21 75 98 0 2 - - - - - - - - -
Democratic People’s Re-public of Korea PRK
2000 22 840 59 - - - -- -
- - - -- -
- - - -- -
2015 25 155 61 77 4 18 0 68 3 29 0 83 6 12 0
Fiji FJI2000 811 48 80 3 16 1
1.01 -0.0371 3 25 1
1.63 -0.0691 3 5 0
0.33 0.002015 892 54 96 4 0 0 95 4 1 0 96 4 0 0
Indonesia IDN2000 211 540 42 44 9 14 32
1.58 -1.3128 7 19 45
1.92 -1.6466 13 7 14
0.73 -0.582015 257 564 54 68 15 5 12 57 14 8 21 77 15 2 5
Japan JPN2000 125 715 79 100 0 0 0
0.00 0.00- - - -
- -- - - -
- -2015 126 573 93 100 0 0 0 - - - - - - - -
Kiribati KIR2000 84 43 30 7 14 49
0.63 -0.9421 3 22 55
0.76 -0.3143 12 4 41
0.43 -1.712015 112 44 40 8 17 35 32 4 14 50 49 14 22 15
Lao People’s Democratic Republic LAO
2000 5 343 22 28 1 9 622.97 -2.66
17 0 9 732.85 -2.57
67 3 8 221.73 -1.33
2015 6 802 39 73 3 3 22 60 2 4 35 93 4 1 2
Malaysia MYS2000 23 421 62 97 0 2 2
0.19 -0.0894 0 2 3
0.30 -0.1698 0 1 0
0.10 -0.032015 30 331 75 100 0 0 0 99 0 0 1 100 0 0 0
Marshall Islands MHL2000 52 68 - - - -
- -- - - -
- -- - - -
- -2015 53 73 87 0 2 11 66 0 4 30 95 0 2 4
Micronesia (Federated States of) FSM
2000 107 22 - - - -- -
- - - -- -
- - - -- -
2015 104 22 - - - - - - - - - - - -
Mongolia MNG2000 2 397 57 48 26 11 16
0.75 -0.3926 18 20 35
0.97 -0.2864 31 4 1
0.14 0.042015 2 959 72 59 31 0 10 41 28 0 31 66 32 0 1
Myanmar MMR2000 47 670 27 70 12 8 11
-0.33 -0.4465 11 9 15
-0.42 -0.5382 13 3 2
-0.38 -0.082015 53 897 34 65 11 20 5 59 10 25 7 76 12 11 0
Nauru NRU2000 10 100 66 31 3 1
-0.01 0.11- - - -
- -66 31 3 1
-0.01 0.112015 10 100 66 31 1 3 - - - - 66 31 1 3
New Zealand NZL2000 3 858 86 100 0 0 0
0.00 0.00100 0 0 0
0.00 0.00100 0 0 0
0.00 0.002015 4 529 86 100 0 0 0 100 0 0 0 100 0 0 0
Niue NIU2000 2 33 100 0 0 0
-0.22 0.00- - - -
- -- - - -
- -2015 2 43 97 0 3 0 - - - - - - - -
Palau PLW2000 19 70 85 0 15 0
1.02 0.0067 0 33 0
2.20 0.0092 0 8 0
0.52 0.002015 21 87 100 0 0 0 100 0 0 0 100 0 0 0
Papua New Guinea PNG2000 5 374 13 19 3 65 13
-0.01 0.0013 3 70 14
0.00 0.0055 9 32 4
0.00 0.002015 7 619 13 19 3 65 13 13 3 70 14 55 9 32 4
Philippines PHL2000 77 932 48 67 15 7 11
0.53 -0.3459 14 11 16
0.85 -0.5275 16 3 5
0.23 -0.182015 100 699 44 75 17 3 6 72 16 3 8 79 17 2 3
Republic of Korea KOR2000 46 206 80 100 0 0 0
-0.01 0.00- - - -
- -- - - -
- -2015 50 293 82 100 0 0 0 - - - - - - - -
Samoa WSM2000 175 22 99 0 1 0
-0.14 0.0098 0 1 0
-0.14 0.0099 0 1 0
-0.09 0.022015 193 19 97 0 3 0 96 0 4 0 98 0 2 0
Singapore SGP2000 3 918 100 100 0 0 0
0.00 0.00- - - -
- -100 0 0 0
0.00 0.002015 5 604 100 100 0 0 0 - - - - 100 0 0 0
Solomon Islands SLB2000 412 16 21 3 13 63
0.69 -1.4713 2 12 73
0.36 -1.5362 12 17 9
0.91 0.022015 584 22 31 5 23 41 18 2 29 50 76 15 0 9
Thailand THA2000 62 693 31 95 4 0 1
0.01 -0.0595 3 0 1
0.06 -0.0694 6 0 0
0.00 -0.022015 67 959 50 95 5 0 0 96 3 0 0 94 6 0 0
Timor-Leste TLS2000 847 24 - - - -
- -- - - -
- -- - - -
- -2015 1 185 33 44 10 22 24 30 7 30 33 73 15 7 5
Tokelau TKL2000 2 0 77 4 19 0
1.07 0.0077 4 19 0
1.07 0.00- - - -
- -2015 1 0 93 5 2 0 93 5 2 0 - - - -
Tonga TON2000 98 23 89 1 10 0
0.32 0.0086 1 13 0
0.45 0.0099 1 0 0
-0.15 0.002015 106 24 93 1 6 0 92 1 6 0 97 1 3 0
Tuvalu TUV2000 9 46 - - - -
- -- - - -
- -- - - -
- -2015 10 60 91 0 1 7 91 0 0 9 92 0 2 6
Vanuatu VUT2000 185 22 53 17 28 2
0.03 -0.0151 13 34 2
0.00 -0.0361 32 7 0
0.00 0.072015 265 26 53 18 27 2 51 13 34 2 61 32 6 1
Viet Nam VNM2000 80 286 24 53 3 26 18
1.66 -0.9344 3 32 22
1.84 -1.1282 4 9 5
0.59 -0.232015 93 448 34 78 4 14 4 72 4 19 5 91 4 3 2
UNICEF East Asia & Pacific Region
2000 2 023 637 41 64 4 25 70.86 -0.25
52 4 34 100.75 -0.29
81 6 11 20.43 -0.06
2015 2 253 012 56 77 6 14 3 63 6 25 6 87 6 5 1

9
Sanitation estimates
COUNTRY, AREA OR TERRITORY
Year
NATIONAL Proportion of population using improved
sanitation facilities (excluding shared)
RURAL Proportion of population using improved
sanitation facilities (excluding shared)
URBAN Proportion of population using improved
sanitation facilities (excluding shared)
Safe
ly m
anag
ed
Dis
pose
d in
situ
Empt
ied
and
trea
ted
Was
tew
ater
trea
ted
Latr
ines
and
oth
er
Sept
ic ta
nks
Sew
er c
onne
ctio
ns
Safe
ly m
anag
ed
Dis
pose
d in
situ
Empt
ied
and
trea
ted
Was
tew
ater
trea
ted
Latr
ines
and
oth
er
Sept
ic ta
nks
Sew
er c
onne
ctio
ns
Safe
ly m
anag
ed
Dis
pose
d in
situ
Empt
ied
and
trea
ted
Was
tew
ater
trea
ted
Latr
ines
and
oth
er
Sept
ic ta
nks
Sew
er c
onne
ctio
ns
Australia2000 65 6 0 60 12 - 89 - - - - - - - - - - - - - -2015 74 6 0 68 12 - 89 - - - - - - - - - - - - - -
Brunei Darussalam2000 - - - - - - - - - - - - - - - - - - - - -2015 - - - - 1 - 95 - - - - 2 - 96 - - - - 1 - 95
Cambodia2000 - - - - 1 5 7 - - - - 1 1 2 - - - - 1 19 292015 - - - - 0 38 11 - - - - 0 36 3 - - - - 0 44 44
China2000 29 19 0 10 21 7 32 30 28 0 3 33 10 9 26 2 0 24 0 3 742015 60 20 0 40 30 0 45 42 34 0 8 52 0 9 73 8 0 65 12 1 74
Cook Islands2000 - - - - - - - - - - - - - - - - - - - - -2015 - - - - - - - - - - - - - - - - - - - - -
Democratic People’s Re-public of Korea
2000 - - - - - - - - - - - - - - - - - - - - -2015 - - - - 18 4 55 - - - - 23 6 40 - - - - 15 3 65
Fiji2000 - - - - - - - - - - - - - - - - - - - - -2015 - - - - - - - - - - - - - - - - - - - - -
Indonesia2000 - - - - 13 31 - - - - - 12 16 - - - - - 14 52 -2015 - - - - 15 53 - - - - - 15 42 - - - - - 14 63 -
Japan2000 98 1 37 61 22 18 61 - - - - - - - - - - - - - -2015 100 0 22 78 4 18 78 - - - - - - - - - - - - - -
Kiribati2000 - - - - 1 20 10 - - - - 0 16 5 - - - - 2 25 162015 - - - - 8 22 10 - - - - 7 20 5 - - - - 8 25 16
Lao People’s Democratic Republic
2000 - - - - 26 1 1 - - - - 17 0 0 - - - - 59 5 32015 - - - - 38 33 1 - - - - 43 17 0 - - - - 32 58 3
Malaysia2000 78 49 0 29 31 35 31 - - - 11 55 27 12 - - - 41 17 39 422015 82 49 0 33 29 36 35 - - - 11 60 27 12 - - - 41 18 39 42
Marshall Islands2000 - - - - - - - - - - - - - - - - - - - - -2015 - - - - 15 28 44 - - - - 29 36 0 - - - - 9 25 60
Micronesia (Federated States of)
2000 - - - - - - - - - - - - - - - - - - - - -2015 - - - - - - - - - - - - - - - - - - - - -
Mongolia2000 - - - - 33 0 15 - - - - 25 0 1 - - - - 37 0 272015 - - - - 46 0 13 - - - - 39 0 2 - - - - 48 0 18
Myanmar2000 - - - - 60 8 2 - - - - 59 6 0 - - - - 62 13 72015 - - - - 56 9 0 - - - - 56 3 0 - - - - 56 20 0
Nauru2000 - - - - 30 20 16 - - - - - - - - - - - 30 20 162015 - - - - 30 20 16 - - - - - - - - - - - 30 20 16
New Zealand2000 75 10 0 66 7 12 81 - - - - - - - - - - - - - -2015 76 9 0 67 6 12 82 - - - - - - - - - - - - - -
Niue2000 - - - - 15 78 7 - - - - - - - - - - - - - -2015 - - - - 12 78 7 - - - - - - - - - - - - - -
Palau2000 17 17 0 0 0 34 51 - - - 0 0 55 12 12 12 0 0 0 24 682015 20 20 0 0 0 39 61 - - - 0 0 88 12 16 16 0 0 0 32 68
Papua New Guinea2000 - - - 2 12 4 3 - - - 0 11 1 1 - - - 11 14 21 202015 - - - 2 12 4 3 - - - 0 11 1 1 - - - 11 14 21 20
Philippines2000 - - - - 10 54 4 - - - - 19 39 2 - - - - 0 69 62015 - - - - 6 67 2 - - - - 7 63 2 - - - - 5 72 2
Republic of Korea2000 86 13 0 73 0 26 74 - - - - - - - - - - - - - -2015 98 1 0 97 3 0 97 - - - - - - - - - - - - - -
Samoa2000 - - - - 15 83 0 - - - - 17 82 0 - - - - 9 90 02015 - - - - 10 87 0 - - - - 10 86 0 - - - - 7 91 0
Singapore2000 100 0 0 100 0 - 100 - - - - - - - 100 0 0 100 0 - 1002015 100 0 0 100 0 - 100 - - - - - - - 100 0 0 100 0 - 100
Solomon Islands2000 - - - - 10 11 - - - - - 9 4 - - - - - 15 47 -2015 - - - - 19 13 - - - - - 16 3 - - - - - 29 47 -
Thailand2000 - - - - 0 88 7 - - - - 0 90 6 - - - - 0 85 82015 - - - - 3 85 7 - - - - 4 88 4 - - - - 2 83 9
Timor-Leste2000 - - - - - - - - - - - - - - - - - - - - -2015 - - - - 23 11 9 - - - - 20 4 7 - - - - 31 26 15
Tokelau2000 - - - - - - - - - - - - - - - - - - - - -2015 - - - - - - - - - - - - - - - - - - - - -
Tonga2000 - - - - 9 80 0 - - - - 9 77 0 - - - - 9 90 02015 - - - - 14 80 0 - - - - 16 77 0 - - - - 7 90 0
Tuvalu2000 - - - - - - - - - - - - - - - - - - - - -2015 9 9 0 0 10 8 73 14 14 0 0 13 15 63 6 6 0 0 7 4 81
Vanuatu2000 - - - - 32 14 7 - - - - 41 3 7 - - - - 6 46 92015 - - - - 30 16 8 - - - - 41 3 7 - - - - 6 46 9
Viet Nam2000 - - - - 34 18 1 - - - - 36 7 1 - - - - 27 52 32015 - - - - 13 64 1 - - - - 20 51 1 - - - - 0 88 2
UNICEF East Asia & Pacific Region
2000 33 20 - 13 20 16 28 30 26 - 4 30 14 9 26 - - 26 6 18 562015 55 24 - 32 23 17 37 41 34 - 7 39 16 8 51 - - 51 11 17 59

10
Drinking water estimates
“-”= no estimate; NA = data not applicable; for unrounded estimates see www.washdata.org
UNICEF East Asia & Pacific Region2000 2 023 637 41 80 1 16 4
0.9668 1 25 6
1.5596 1 2 0
-0.022015 2 253 012 56 94 1 4 1 91 2 5 2 96 1 3 0
COUNTRY, AREA OR TERRITORY
Year
Popu
latio
n
(thou
sand
s)
NATIONAL RURAL URBAN
ISO
3
% u
rban
At l
east
bas
ic
Lim
ited
(mor
e th
an 3
0 m
ins)
Uni
mpr
oved
Surf
ace
wat
er
Ann
ual r
ate
of c
hang
e in
bas
ic
At l
east
bas
ic
Lim
ited
(mor
e th
an 3
0 m
ins)
Uni
mpr
oved
Surf
ace
wat
er
Ann
ual r
ate
of c
hang
e in
bas
ic
At l
east
bas
ic
Lim
ited
(mor
e th
an 3
0 m
ins)
Uni
mpr
oved
Surf
ace
wat
er
Ann
ual r
ate
of c
hang
e in
bas
ic
Australia AUS2000 19 107 87 100 - 0 0
0.0299 - 1 0
0.06100 - 0 0
0.012015 23 969 89 100 - 0 0 100 - 0 0 100 - 0 0
Brunei Darussalam BRN2000 331 71 - - - -
-- - - -
-100 - 0 0
0.002015 423 77 100 - 0 0 99 - 1 0 100 - 0 0
Cambodia KHM2000 12 198 19 52 0 21 26
1.5047 0 24 29
1.4975 0 11 14
1.392015 15 578 21 75 0 12 13 70 0 15 15 96 0 2 2
China CHN2000 1 269 975 36 78 1 19 3
1.2266 1 29 5
2.0298 1 1 0
-0.192015 1 376 049 56 96 1 3 0 96 1 2 1 96 1 3 0
Cook Islands COK2000 18 65 100 - 0 0
-0.00- - - -
-- - - -
-2015 21 75 100 - 0 0 - - - - - - - -
Democratic People’s Republic of Korea PRK
2000 22 840 59 100 0 0 0-0.02
100 0 0 0-0.04
100 0 0 0-0.01
2015 25 155 61 100 0 0 0 99 0 1 0 100 0 0 0
Fiji FJI2000 811 48 95 - 3 2
-0.0691 - 5 4
-0.1299 - 1 0
-0.072015 892 54 94 - 4 2 89 - 7 4 98 - 2 0
Indonesia IDN2000 211 540 42 75 1 21 4
1.0064 1 29 6
1.1289 0 10 1
0.542015 257 564 54 90 1 8 2 81 1 14 4 97 0 3 0
Japan JPN2000 125 715 79 98 - 2 0
0.03- - - -
-- - - -
-2015 126 573 93 99 - 1 0 - - - - - - - -
Kiribati KIR2000 84 43 61 1 39 0
0.2449 1 50 0
-0.2977 0 23 0
0.842015 112 44 64 1 35 0 44 1 55 0 90 0 10 0
Lao People’s Democratic Re-public LAO
2000 5 343 22 46 1 27 262.31
37 1 30 322.42
77 0 18 50.98
2015 6 802 39 80 1 14 4 73 2 18 7 92 0 7 1
Malaysia MYS2000 23 421 62 98 0 1 1
-0.1196 1 1 2
-0.47100 0 0 0
-0.042015 30 331 75 96 0 3 0 89 1 11 0 99 0 1 0
Marshall Islands MHL2000 52 68 - - - -
-- - - -
-- - - -
-2015 53 73 78 21 1 0 99 0 1 0 70 28 2 0
Micronesia (Federated States of) FSM2000 107 22 93 - 7 0
-0.2892 - 8 0
-0.4194 - 6 0
0.142015 104 22 88 - 12 0 86 - 14 0 97 - 3 0
Mongolia MNG2000 2 397 57 65 6 10 19
1.2132 6 20 42
1.6190 5 3 2
0.272015 2 959 72 83 7 5 5 56 10 15 19 94 5 1 0
Myanmar MMR2000 47 670 27 55 11 17 17
0.8547 12 20 21
0.8475 9 9 7
0.482015 53 897 34 68 13 10 9 60 15 13 13 82 9 5 3
Nauru NRU2000 10 100 95 0 5 0
0.33- - - -
-95 0 5 0
0.332015 10 100 100 0 0 0 - - - - 100 0 0 0
New Zealand NZL2000 3 858 86 100 - 0 0
0.00100 - 0 0
0.00100 - 0 0
0.002015 4 529 86 100 - 0 0 100 - 0 0 100 - 0 0
Niue NIU2000 2 33 99 - 1 0
-0.07- - - -
-- - - -
-2015 2 43 98 - 2 0 - - - - - - - -
Palau PLW2000 19 70 92 - 8 0
0.5380 - 20 0
1.0997 - 3 0
0.232015 21 87 100 - 0 0 97 - 3 0 100 - 0 0
Papua New Guinea PNG2000 5 374 13 37 2 20 42
-0.0129 1 21 48
0.0084 4 8 4
0.002015 7 619 13 37 2 20 42 29 1 21 48 84 4 8 4
Philippines PHL2000 77 932 48 86 3 6 5
0.2980 3 7 9
0.3692 2 4 2
0.282015 100 699 44 91 3 6 1 86 4 9 1 96 2 2 0
Republic of Korea KOR2000 46 206 80 - - - -
-- - - -
-- - - -
-2015 50 293 82 100 - 0 0 - - - - - - - -
Samoa WSM2000 175 22 93 2 5 0
0.1794 2 3 0
0.0389 0 10 0
0.692015 193 19 96 2 2 0 95 2 3 0 99 1 0 0
Singapore SGP2000 3 918 100 100 - 0 0
0.00- - - -
-100 - 0 0
0.002015 5 604 100 100 - 0 0 - - - - 100 - 0 0
Solomon Islands SLB2000 412 16 80 6 10 4
-1.0878 6 11 4
-1.4690 3 5 1
0.002015 584 22 64 4 17 15 56 5 20 19 90 3 5 1
Thailand THA2000 62 693 31 94 1 4 0
0.2792 1 6 1
0.3599 0 1 0
0.022015 67 959 50 98 1 1 0 97 1 1 1 99 0 0 0
Timor-Leste TLS2000 847 24 - - - -
-- - - -
-- - - -
-2015 1 185 33 70 6 18 6 60 8 24 8 91 2 7 0
Tokelau TKL2000 2 0 99 - 1 0
0.0799 - 1 0
0.07- - - -
-2015 1 0 100 - 0 0 100 - 0 0 - - - -
Tonga TON2000 98 23 98 - 2 0
0.0999 - 1 0
0.0797 - 3 0
0.162015 106 24 100 - 0 0 100 - 0 0 100 - 0 0
Tuvalu TUV2000 9 46 - - - -
-- - - -
-- - - -
-2015 10 60 99 - 1 0 99 - 1 0 100 - 0 0
Vanuatu VUT2000 185 22 82 1 11 7
0.5978 1 13 8
0.6496 0 4 0
0.252015 265 26 91 1 2 6 87 1 3 8 99 0 0 0
Viet Nam VNM2000 80 286 24 78 3 10 9
0.8974 2 12 12
1.1390 5 3 2
0.122015 93 448 34 91 3 5 0 91 1 7 1 92 6 2 0

11
Drinking water estimates
COUNTRY, AREA OR TERRITORY
Year
NATIONAL Proportion of population using
improved water supplies
RURAL Proportion of population using
improved water supplies
URBAN Proportion of population using
improved water supplies
Safe
ly m
anag
ed
Acc
essi
ble
on p
rem
ises
Avai
labl
e w
hen
need
ed
Free
from
con
tam
inat
ion
Pipe
d
Non
-pip
ed
Safe
ly m
anag
ed
Acc
essi
ble
on p
rem
ises
Avai
labl
e w
hen
need
ed
Free
from
con
tam
inat
ion
Pipe
d
Non
-pip
ed
Safe
ly m
anag
ed
Acc
essi
ble
on p
rem
ises
Avai
labl
e w
hen
need
ed
Free
from
con
tam
inat
ion
Pipe
d
Non
-pip
ed
Australia2000 - 97 90 - 84 15 - 87 - - 59 40 98 98 - 100 88 122015 - 98 96 - 91 8 - 89 - - 84 16 99 99 - 100 92 8
Brunei Darussalam2000 - - - - - - - - - - - - - 100 - - 100 02015 - 99 - - 99 0 - 99 - - 99 0 - 100 - - 100 0
Cambodia2000 17 37 - 17 7 45 11 30 - 11 1 46 43 69 - 43 34 412015 24 58 - 24 21 54 16 54 - 16 8 62 55 75 - 55 72 24
China2000 - 63 - - 48 30 - 43 - - 26 41 94 98 - 94 88 112015 - 94 - - 78 19 - 95 - - 62 35 91 94 - 91 90 6
Cook Islands2000 - 85 100 - 69 31 - - - - - - - - - - - -2015 - 87 100 - 75 25 - - - - - - - - - - - -
Democratic People’s Republic of Korea
2000 - 94 - - 82 18 - 91 - - 71 29 - 96 - - 90 102015 - 94 - - 90 10 - 91 - - 84 15 - 96 - - 93 6
Fiji2000 - 78 95 - - - - 60 - - - - - 97 - - - -2015 - 69 94 - 87 7 - 37 - - 74 15 - 96 - - 97 1
Indonesia2000 - 61 - - 20 56 - 45 - - 7 59 - 84 - - 37 522015 - 54 - - 18 72 - 57 - - 9 73 - 51 - - 25 72
Japan2000 97 97 - 98 97 1 - - - - - - - - - - - -2015 97 97 - 99 98 1 - - - - - - - - - - - -
Kiribati2000 - 52 - - 32 29 - 38 - - 21 29 - 72 - - 48 292015 - 56 - - 33 32 - 34 - - 3 42 - 84 - - 71 19
Lao People’s Democratic Re-public
2000 - 7 - - 15 32 - 0 - - 8 30 - 31 - - 39 382015 - 68 - - 42 40 - 53 - - 22 53 - 92 - - 73 19
Malaysia2000 94 94 - 98 95 4 - 87 - - 88 9 - 98 - - 99 12015 92 93 - 97 94 3 - 81 - - 79 10 - 97 - - 98 1
Marshall Islands2000 - - - - - - - - - - 0 - - - - - - -2015 - 74 - - 11 88 - 98 - - 0 99 - 65 - - 15 83
Micronesia (Federated States of)2000 - 66 - - - - - 66 - - - - - 69 - - - -2015 - 63 - - - - - 61 - - - - - 71 - - - -
Mongolia2000 - 22 - - 32 39 - 1 - - 3 35 - 38 - - 53 412015 - 25 - - 26 64 - 9 - - 4 63 - 32 - - 35 64
Myanmar2000 - 28 - - 12 53 - 19 - - 7 52 - 51 - - 26 582015 - 53 - - 23 57 - 41 - - 9 66 - 76 - - 52 40
Nauru2000 - 95 - - - - - - - - - - - 95 - - - -2015 - 99 - - 68 32 - - - - - - - 99 - - 68 32
New Zealand2000 77 100 - 77 100 0 - 100 - - 100 0 - 100 100 - 100 02015 100 100 - 100 100 0 - 100 - - 100 0 - 100 100 - 100 0
Niue2000 98 99 99 98 99 0 - - - - - - - - - - - -2015 97 98 98 97 87 11 - - - - - - - - - - - -
Palau2000 - 84 - - 92 0 - 74 - - 80 0 - 88 97 - 97 02015 - 95 - - 100 0 - 93 - - 97 0 - 95 100 - 100 0
Papua New Guinea2000 - 19 - - 20 18 - 16 - - 13 18 - 43 80 - 71 172015 - 19 - - 20 18 - 16 - - 13 18 - 43 80 - 71 17
Philippines2000 - 39 79 - 47 42 - 26 74 - 32 52 - 54 84 - 63 312015 - 61 83 - 43 50 - 47 79 - 31 58 - 78 88 - 59 40
Republic of Korea2000 - - - - - - - - - - - - - - - - - -2015 98 99 - 98 98 1 - - - - - - - - - - - -
Samoa2000 - 92 95 - 86 9 - 93 - - 85 11 - 88 - - 90 02015 - 94 97 - 82 15 - 93 - - 84 13 - 98 - - 77 23
Singapore2000 100 100 - 100 100 0 - - - - - - 100 100 - 100 100 02015 100 100 - 100 100 0 - - - - - - 100 100 - 100 100 0
Solomon Islands2000 - 62 44 - 59 27 - 58 68 - 57 28 - 83 - - 73 212015 - 51 35 - 47 21 - 42 49 - 40 21 - 83 - - 73 21
Thailand2000 - 90 - - 33 62 - 87 - - 15 78 - 97 - - 72 272015 - 97 - - 67 32 - 96 - - 49 49 - 99 - - 84 15
Timor-Leste2000 - - - - - - - - - - - - - - - - - -2015 - 50 - - 42 34 - 37 - - 30 38 - 78 - - 66 27
Tokelau2000 - 74 - - - - - 74 - - - - - - - - - -2015 - 91 - - 94 5 - 91 - - 94 5 - - - - - -
Tonga2000 - 98 - - 96 2 - 99 - - 97 2 - 97 - - 94 32015 - 71 - - 94 6 - 71 - - 97 3 - 74 - - 86 14
Tuvalu2000 - - - - - - - - - - - - - - - - - -2015 - 97 - - 99 0 - - - - 99 0 0 - 0 50 100 0
Vanuatu2000 - 45 - - 50 32 - 38 - - 41 38 - 68 - - 83 132015 - 50 - - 32 60 - 43 - - 23 65 - 71 - - 56 44
Viet Nam2000 - 65 - - 13 67 - 57 - - 2 74 - 90 95 - 49 472015 - 88 - - 40 55 - 91 - - 20 72 - 83 98 - 78 20
UNICEF East Asia & Pacific Region2000 - 65 - - 47 33 - 46 - - 24 45 93 93 - 93 80 172015 - 87 - - 67 28 - 84 - - 49 44 89 89 - 93 82 15

12
JMP website: www.washdata.org
SANITATION
In 2015,• 39 per cent of the global population
(2.9 billion people) used a safely managed sanitation service; that is, excreta safely disposed of in situ or treated off-site.
• 27 per cent of the global population (1.9 billion people) used private sanitation facilities connected to sewers from which wastewater was treated.
• 13 per cent of the global population (0.9 billion people) used toilets or latrines where excreta were disposed of in situ.
• Available data were insufficient to make a global estimate of the proportion of population using septic tanks and latrines from which excreta are emptied and treated off-site.
• 2.3 billion people still lacked even a basic sanitation service.
• 600 million people used a limited sanitation service.
• 892 million people worldwide still practised open defecation.
HYGIENE
In 2015,• 70 countries had comparable data
available on handwashing with soap and water, representing 30 per cent of the global population.
• Coverage of basic handwashing facilities with soap and water varied from 15 per cent in sub-Saharan Africa to 76 per cent in Western Asia and Northern Africa, but data are currently insufficient to produce a global estimate, or estimates for other SDG regions.
• In Least Developed Countries, 27 per cent of the population had basic handwashing facilities with soap and water, while 26 per cent had handwashing facilities lacking soap or water. The remaining 47 per cent had no facility.
• In sub-Saharan Africa, three out of five people with basic handwashing facilities (89 million people) lived in urban areas.
• Many high-income countries lacked sufficient data to estimate the population with basic handwashing facilities.
DRINKING WATER
In 2015,• 71 per cent of the global population
(5.2 billion people) used a safely managed drinking water service; that is, one located on premises, available when needed and free from contamination.
• Eight out of ten people (5.8 billion) used improved sources with water available when needed.
• Three out of four people (5.4 billion) used improved sources located on premises.
• Three out of four people (5.4 billion) used improved sources free from contamination.
• 844 million people still lacked even a basic drinking water service.
• 263 million people spent over 30 minutes per round trip to collect water from an improved source (a limited drinking water service).
• 159 million people still collected drinking water directly from surface water sources, 58% lived in sub-Saharan Africa.