a six-district study of educational change: direct and mediated effects of the child development...
TRANSCRIPT
Social Psychology of Education4: 3–51, 2000.© 2000Kluwer Academic Publishers. Printed in the Netherlands.
3
A six-district study of educational change:direct and mediated effects of the childdevelopment project
DANIEL SOLOMON?, VICTOR BATTISTICH, MARILYN WATSON, ERICSCHAPS and CATHERINE LEWISDevelopmental Studies Center, 2000 Embarcadero, Suite 305, Oakland, CA 94606
Abstract. A comprehensive elementary school program, the Child Development Project, was con-ducted in two schools in each of six school districts over a three-year period. Two additional schoolsin each district served as a comparison group. The program attempts to create a ‘caring communityof learners’ in school and classroom through classroom, schoolwide, and parent involvement com-ponents. The classroom component includes student collaboration, a literature-based approach toreading, and a student-centered approach to classroom management. Classroom observation, studentquestionnaire, teacher questionnaire, and test data were collected in a baseline year and in eachof the three years of program implementation. Results showed positive student results in the fiveprogram schools that made significant progress in implementation. Schools that progressed in im-plementation showed gains – relative to their comparison schools – in students’ personal, social, andethical attitudes, values, and motives. Significant effects on academic achievement were found onlyin two schools with a performance-based assessment and a highly consistent local reform mandate.Modeling analyses indicated that student sense of community was an important mediating variablefor almost all dependent variables – indicating that the program produced positive effects to thedegree that it was successful in establishing a caring community in the school.
1. Introduction
Schooling occurs in social settings with specific social environments. Many nat-uralistic investigations have explored relationships between aspects of these socialenvironments and the functioning of students within them (e.g., Fraser, 1991; Jack-son, Boostrom, & Hansen, 1993; Lightfoot, 1984; Lipsitz, 1984; Minuchin, Biber,Shapiro, & Zimiles, 1969; Serow & Solomon, 1979; Shouse, 1996; Solomon &Kendall, 1979; Wehlage, Rutter, Smith, Lesko, & Fernandez, 1989). Yet, althoughmany plausible hypotheses have emerged from such investigations, there have beenfew attempts to test them experimentally in intervention projects. One body ofresearch, that on cooperative learning, does do so but has been limited to relativelyrestricted aspects of the classroom environment (e.g., the goal structure), and, inmost cases, limited sets of outcomes (see Johnson & Johnson, 1989; Sharan, 1980,1990; Slavin, 1990).? Authors for correspondence: E-mail: [email protected]

4 DANIEL SOLOMON ET AL.
The project described in this paper, the Child Development Project (CDP), is anintervention project derived from research and theory on classroom environmentand child socialization. It began with the assumptions that:
(a) the social context of the school is critically important for fulfilling basic per-sonal and social needs of students,
(b) having these needs met is a prerequisite for promoting positive student devel-opment in schools, and
(c) it would be possible to deliberately create school contexts that could meet theseneeds and thereby help bring about optimal student outcomes in a broad rangeof areas – social, ethical, and intellectual.
In our view (see also Baumeister & Leary, 1995; deCharms, 1984; Deci &Ryan, 1985), an effective school environment supports students’ basic psycholo-gical needs to:
(a) belong to a social group whose members are mutually supportive and con-cerned,
(b) have age-appropriate opportunities to be autonomous, self-directing and influ-ential, and
(c) feel competent and effective in valued activities.
Fulfillment of these needs is influenced by both personal and social factors, andin the context of the school we consider both sets of influences to be important.From this perspective, autonomy/influence refers to the individual’s opportunitiesto contribute to the group and the group’s decisions as well as to direct his/her ownactivities; competence refers to the effectiveness and acceptance of the individual’scontributions to the group as well as his/her own academic and social efforts; andbelonging is feeling that one is personally accepted by others and also part of alarger cohesive entity.
Our general hypothesis is that the type of school social environment best suitedfor meeting these needs is one in which students experience:
(a) caring and supportive relationships with one another and with their teachersand other adults in the school,
(b) opportunities to participate in significant decision making concerning theirown learning and behavior and also in planning, norm-setting, and decisionmaking in the classroom and, to some extent, the school at large, and
(c) opportunities to experience success in their academic and interpersonal activit-ies and also in their contributions to classroom and school plans and decisions.
These characteristics, in combination, have been called a ‘caring communityof learners’ (see Battistich, Solomon, Watson, & Schaps, 1997; Lewis, Watson, &Schaps, 1999). (For discussions and findings concerning communal organizationsand atmospheres in schools, see Bryk & Driscoll, 1988; Comer, 1980; Gardner,

EFFECTS OF CDP 5
1992; Hallinger & Murphy, 1986; Lightfoot, 1984; Lipsitz, 1984; Noddings, 1992;Wehlage et al., 1989; Zeichner, 1978).
The community provides the integrative focus for the fulfillment of the needs forbelonging, autonomy, and competence – their group-related aspects in particular.In its emphasis on the importance of the social/interpersonal aspects of the threebasic needs and their relevance to the sense of community, our approach extendsthat taken by Deci, Ryan, and Connell (Connell, 1990; Connell & Ryan, 1987;Connell & Wellborn, 1991; Deci & Ryan, 1985), whose focus is more limited to thefulfillment of personal needs and goals (see Solomon, Battistich, Kim, & Watson,1997).
We expect that students who have these needs met by experiencing a caringschool community will feel strongly attached to the community and that this at-tachment will lead them to feel personally committed to the values and goals thecommunity promotes, particularly if those values and goals are clear and jointlyheld by the community members. In the school community that CDP endeavors toestablish, these values and goals extend across the social, ethical, and intellectualdomains, which we consider to be interdependent and commonly relevant to themission of education. Thus, the program stresses values and goals related to in-terpersonal behavior and concern (e.g., kindness, respect, and concern for others),broader social and ethical issues (e.g., equity and justice), and personal qualities(e.g., perseverance, self-control, and academic learning). Children who developcommitments to the values and goals stressed by the school community will tendto behave in ways consistent with them. Such behaviors in turn help to solidifychildren’s commitments to those values and goals and help to reinforce the schoolfactors that, in combination, constitute a caring community. In previous research,we have found suggestive evidence that specific aspects of classroom organiza-tion and practices are associated with students’ sense of community (Solomon,Battistich, Kim, & Watson, 1997) and that experiencing a sense of communityinclines students to be attached to school and to be committed to the norms andvalues emphasized by the school (Battistich, Solomon, Kim, Watson, & Schaps,1995; Solomon, Watson, Battistich, Schaps, & Delucchi, 1992, 1996). (For moredetailed discussion of the theoretical rationale for this project, see Battistich, Wat-son, Solomon, Schaps, & Solomon, 1991; Lewis, Watson, & Schaps, 1999; So-lomon, Battistich, Kim, & Watson, 1997; Watson, Solomon, Battistich, Schaps, &Solomon, 1989.)
2. The CDP program
The CDP program was designed to create caring communities in schools and class-rooms and to promote student development in the social, ethical, and intellectualrealms, including increasing understanding of, and commitment to, core valuesunderlying each realm. CDP teachers are encouraged to organize and conducttheir classrooms in ways that maximize students’ feelings of autonomy and in-

6 DANIEL SOLOMON ET AL.
fluence, competence, and social connectedness, and that help them understandthe importance and relevance of the academic and other tasks they do in school.Ideally, teachers support and encourage one another and work together to planand conduct lessons and solve problems. The following description of the ma-jor components of the program describes the program as intended. As we shallshow below, considerable variation appears among schools and teachers in thedegree to which these intentions are realized. The program has also changed insome respects from its earlier phases. We briefly describe here the most recentversion.
2.1. CLASSROOM COMPONENTS
The most comprehensive of CDP’s components is the classroom program whichhas three major facets: developmental discipline, cooperative learning, and aliterature-based language arts curriculum.
2.1.1. Developmental Discipline
The program approach to classroom management is designed to help children de-velop commitments to responsible, caring behavior. The goal of developmentaldiscipline is for students to act responsibly because they feel committed to thecommunity – not because of the prospect of rewards or punishments (see Deci& Ryan, 1985; Lepper, 1983). In developmental discipline, students participatein decision making and in setting and upholding the norms and rules of theirclassrooms. Many activities are designed to help students get to know one anotherand build a classroom environment characterized by mutual concern and support.Teachers work with students (often in class meetings) to agree on ‘what kind ofa class we want to be’ and to solve organizational, behavioral, and interpersonalproblems that may arise. The intent is to help build students’ interpersonal skillsand understanding, their commitment to democratic norms, and their sense of con-nection to the teacher, the other students, and the school. Development disciplinethus aims to meet students’ needs for autonomy, influence, and belonging and togive them opportunities to feel competent by making effective contributions toclassroom decisions.
2.1.2. Cooperative Learning
Many studies have demonstrated the academic and social benefits of cooperativelearning (see reviews by Johnson & Johnson, 1989; Johnson, Maruyama, Johnson,Nelson, & Skon, 1981; Johnson, Skon, & Johnson, 1980; Sharan, 1980; Sharan &Sharan, 1992; Slavin, 1983, 1990). In the CDP approach to cooperative learning,students work together in pairs or small groups on tasks that require collaborationand often have group products (e.g., a report or a performance). It differs fromsome other approaches in that students are not given rewards for their participation

EFFECTS OF CDP 7
or performance in the group; instead, academic tasks are designed to be inherentlyinteresting and challenging to students. Teachers discuss with students the values –such as fairness, consideration for others, responsibility – that underlie groupworkand the specific social skills and behavior that follow from the values (e.g., listeningrespectfully, sharing the workload). Another distinctive feature of this approach isan emphasis on both the social and academic goals of the activities, which studentsdiscuss before and after the collaborative work. When successfully implemented,cooperative activities help to meet all three of the identified basic needs of stu-dents. Although teachers oversee and monitor, students have opportunities to beself-directing, to divide tasks as they see fit, to make decisions, to provide sup-port to one another, and to make effective and valued contributions to the groupefforts.
2.1.3. Literature-Based Reading Instruction
Children read and listen to high-quality literature. Both higher-order understandingand reading fluency are emphasized. While controlled vocabulary books are oftenused, all are conceptually rich and judged likely to help students increase theirunderstanding of themselves and others, as well as of the role of fundamentalvalues such as responsibility and fairness in complex human situations. The morechallenging works are read aloud and then discussed so that readers of all levelscan participate in discussions. The literature discussions are teacher led and open-ended, and they center on important ethical and social issues raised by the works.Students are encouraged to express and support their own opinions, to listen andrespond respectfully to the opinions of others, and to relate the literature to theirown experiences. This program component is supported by evidence that open-ended discussion of meaningful issues promotes the development of children’scognitive understanding, interpersonal skills, and ethical development (Noddings,1994; Oser, 1986; Solomon, Watson, & Battistich, in press). The literature com-ponent responds to students’ needs by providing opportunities for autonomouscontributions to discussions, a supportive and ‘safe’ atmosphere for expressingopinions and having shared experiences with literature, and opportunities to think,express opinions, and hear others’ ideas about important ethical and social issuesevoked by the writings.
2.2. THE SCHOOLWIDE COMPONENT
Schoolwide activities are designed to increase inclusiveness, lessen competition,and build a sense of community throughout the school. They give students manyopportunities to increase their understanding of other people and their appreciationof the ways democratic values apply to their school community. For example,a ‘Buddies’ program pairs younger and older students and emphasizes helpfulrelationships.

8 DANIEL SOLOMON ET AL.
2.3. THE FAMILY COMPONENT
The goal of the family component is to help families experience school as a wel-coming, supportive place and to strengthen families’ support for students’ social,ethical, and intellectual development. An important aspect of this component inmost participating schools has been a teacher–parent coordinating team that plansvarious activities designed to strengthen the family-school bond. ‘Homeside’ activ-ities that involve students in discussions with family members about diverse topicssuch as family history, values, and school experiences constitute one element thatis designed to help family members become more closely connected both to theirchild and to the school.
3. Prior studies of CDP
The CDP was evaluated in two earlier studies, each involving a small number ofelementary schools in a single school district. Findings from the first study in-dicated that the major program elements were well implemented by many of theparticipating teachers and that it resulted in a broad range of benefits for studentsin elementary school, some of which persisted into intermediate school. In theelementary school years, students who participated in the program were helpedto grow in a number of areas, including their social and interpersonal skills andbehavior, their feelings of belonging and acceptance, their attitudes toward oth-ers, and their reading comprehension, but not their performance on standardizedachievement tests. When we examined the persistence of these outcomes beyondelementary school, a number of positive results were found for intermediate schoolstudents who had been with the project throughout elementary school. There wasalso evidence that the quality of program implementation experienced in element-ary school related positively to program students’ intermediate school perform-ance, including their academic performance. (For descriptions of the CDP findingsin this district, see Battistich, Solomon, & Delucchi, 1990; Battistich, Solomon,Watson, Solomon, & Schaps, 1989; Solomon, Watson, Delucchi, Schaps, & Bat-tistich, 1988; Solomon, Watson, Schaps, Battistich, & Solomon, 1990; Solomon,Watson, Battistich, Schaps, & Delucchi, 1992; Solomon, Battistich, & Watson,1993; Solomon, Watson, Battistich, Schaps, & Delucchi, 1996.)
Findings from the second study showed highly variable implementation of CDPin classrooms at the two program schools, along with indications that higher levelsof implementation produced some positive results. These findings are described ina document generated by the Developmental Studies Center (1998).
We thus learned that it was difficult to achieve consistent implementation ofthe program, but we also found suggestive evidence that good implementation,when achieved, had the potential to benefit a broad range of students with respectto various student outcomes. We next undertook a much broader extension of theprogram.

EFFECTS OF CDP 9
4. The Latest study: a multi-site evaluation of CDP in diverse settings
To continue with the investigation of the feasibility and effectiveness of CDP, weundertook an expansion of the program to 12 schools in six additional schooldistricts around the country. This phase of the project was designed to test twogeneral hypotheses:
(a) that the CDP program would produce positive effects on students’ social, eth-ical, and intellectual development in a wide range of school settings, and
(b) that these effects would depend on the program’s success in establishing acaring community in the school.
5. Procedures
5.1. SAMPLE SELECTION ANDCHARACTERISTICS
An iterative process was used to select districts and schools to participate in theproject. After receiving suggestions of likely districts from a variety of sources andholding discussions with the superintendents and other central office administratorsin a number of those districts, six districts were selected. Three of the districts wereon the West coast, one was in the lower Midwest, one in the Southeast, and onein the Northeast. Discussions with school principals and presentations to schoolstaffs (and some parent groups) led to the selection of two schools to implementthe CDP program in each of the six districts. In all but one of the schools, largemajorities of the school faculties expressed interest in participating via anonymousballots. (The one exception was a school that was just being formed, where oneof the criteria for selection of teachers was interest in participating in the pro-ject as described to them.) The schools selected to implement the program withineach district were judged the most likely to be able to do so successfully. Afterthese schools were selected to implement the program, comparison schools werechosen that matched the program schools as closely as possible with respect tovarious characteristics (school size, poverty level of student population, studentethnic distribution, percent of limited-English speakers, achievement test results).1
Background data on the paired schools are shown in Table I. In three districts (2,3, and 4) there were close comparison school matches for each of the two programschools individually; in the other three, the individual school comparisons wereless close, but the two comparison schools as a whole resembled the two programschools as a whole. In these latter districts we therefore pooled data from the twocomparison schools when examining contrasts with individual program schools.As can be seen in Table I, the participating schools encompassed a broad range ofdemographic characteristics: some were in large cities (Districts 3 and 5, part ofDistrict 2), some were in small cities (District 4), some were in suburbs (Districts1 and 6, part of District 2), some were relatively affluent (Districts 1 and 6), somewere poor (Pair A of District 2 and Pair B of District 3), and some had high,

10D
AN
IEL
SO
LO
MO
NE
TA
L.
Table I. Background data on demonstration and comparison schools, 1990–91.
District/School % % % % Oth. % Red., % LEP- %tile %tile Total Average
White Black Hisp. Nonwh. Free Lun NEP Math Reading Enrollment Class size
District 1
Pair A
Program school 72 03 09 16 09 00 81 64 534 30
Comparison school 57 04 09 30 35 00 72 56 386 30
Pair B
Program school 75 03 04 18 04 00 86 65 652 31
Comparison school 77 00 02 19 02 00 89 78 622 31
District 2
Pair A
Program school 01 93 06 00 94 03 12 08 612 20
Comparison school 00 100 00 00 95 02 12 08 677 27
Pair B
Program school∗ 37 08 53 02 22 21 59 52 966 31
Comparison school 40 06 49 04 13 14 62 51 651 26
District 3
Pair A
Program school 70 30 00 00 46 00 63 57 594 26
Comparison school 74 26 00 00 28 00 57 60 517 27
Pair B
Program school 72 28 00 00 88 00 44 37 607 26
Comparison school 67 33 00 00 77 00 47 38 534 24

EF
FE
CT
SO
FC
DP
11
Table I. (continued)
District/School % % % %Oth. %Red., % LEP- %tile %tile Total Average
White Black Hisp. Nonwh. Free Lun NEP Math Reading Enrollment Class size
District 4
Pair A
Program school 40 01 52 07 46 19 59 36 771 29
Comparison school 19 05 65 11 60 32 49 35 892 28
Pair B
Program school 50 02 32 16 05 10 69 54 600 29
Comparison school 67 04 20 09 09 02 78 63 432 26
District 5
Pair A
Program school 30 17 37 16 38 17 51 51 263 27
Comparison school 16 40 37 07 74 22 34 33 449 25
Pair B
Program school 14 42 09 35 53 23 37 31 378 30
Comparison school 27 24 12 37 14 08 70 65 537 31
District 6
Pair A
Program school 54 28 14 04 27 10 86 63 439 19
Comparison school 52 28 18 02 24 08 63 52 452 21
Pair B
Program School 50 23 21 06 20 12 64 53 412 19
Comparison school 46 32 22 00 26 11 49 34 487 20
∗This school was inaugurated in 1991–92; the data are therefore from that year.

12 DANIEL SOLOMON ET AL.
whereas others had low, proportions of minority students and prior achievementlevels.
5.2. PROFESSIONAL DEVELOPMENT ANDCONDUCTING THE PROGRAM
We approached professional development from a district as well as a school per-spective. During an advance year, 1991–92, the program was introduced to eightto 15 member ‘implementation teams’ in each district. Schoolwide training andimplementation of the program began in the following year and continued forthree years, through 1994–95. Each district’s implementation team consisted ofthe principals of each of the two schools selected to conduct the program, one tothree teachers from each of these two schools, and district-level personnel (suchas staff developers, administrators, and resource teachers). These teams spent theadvance year acquainting themselves with the program and trying out its practicesso that they would be able to assist their colleagues later. The CDP staff conductedworkshops for all the implementation teams each summer and for teachers withindistricts during each of the three subsequent school years, with implementationteam members taking increasing responsibility for the within-district workshopsand for other support to teachers implementing the program in successive years.Teachers were also encouraged to meet regularly in small ‘partner study and sup-port’ groups to discuss and help each other with implementation issues. A centralassumption underlying the professional development was that the same group-related needs that we believed were important for students in the class setting werealso important for teachers as they learned the program. (For more informationabout staff development and related issues, see Kendzior & Dasho, 1996; Watson,1996; Watson, Kendzior, Dasho, Rutherford, & Solomon, 1998.)
5.3. RESEARCH DESIGN
Baseline data were collected in the 1991–92 school year, and additional data werecollected in each of the subsequent three years of program implementation – 1992–93 through 1994–95. As with other intervention projects, the project can be thoughtof as two linked processes. The first provides staff development experiences andrelates these experiences to program implementation; the second links programimplementation to student outcomes. The basic plan was to assess changes overtime in implementation of the program and in various outcomes in both programand comparison schools, in order to determine the degree to which student gainscould be attributed to experiencing the program and whether program effects weremediated by effects on students’ sense of the school as a community (to test thehypothesis that the program will produce positive effects to the extent that it issuccessful in creating a sense of community in the school).
Four major types of data were collected using classroom observations, teacherquestionnaires, student questionnaires, and student achievement measures.

EFFECTS OF CDP 13
5.4. CLASSROOM OBSERVATIONS
We anticipated that there would be substantial variability in program implement-ation and, therefore, conducted systematic classroom observations each year inorder to assess progress toward implementation. The importance of assessing whatactually occurs in attempts to implement educational programs has been stressedby Cooley and Lohnes (1976), among others.
All regular classrooms in the 24 program and comparison schools (n =541–582) were observed four times during each school year. The classroom observa-tions were conducted with a structured observation system derived from those usedby Solomon and Kendall (1979); and Solomon, Watson, Delucchi, Schaps, andBattistich (1988). There were separate teams of four observers in each of the sixdistricts. In order to maintain observer blindness as to condition and hypotheses,largely new groups of observers were hired and trained each year.2 Each yeareach of the observers made one visit to each classroom in his/her district. Theobservers watched class activities during each of 12 four-minute periods and, aftereach, made a series of ratings of the occurrence of various activities, practices,and qualities during the period, using three-point scales (0=no occurrence orintensity, 1=minimal occurrence or intensity; 2=more than minimal occurrenceor intensity). The observers focused on the teacher and classroom activities forhalf of the four-minute periods (these are called ‘classroom focus’ periods) and onthe behavior and activities of small groups of students for the other half (‘studentfocus’ periods), alternating between the two in successive periods. Each classroomvisit took about 90 min in total.
Observers were trained in visits to nonproject classrooms and with a commonset of videotapes of a broad range of class activities. Criterion scoring of thesevideotapes was done by project staff members. Another set of similar videotapeswas used to help maintain observers’ accuracy and consistency during the courseof the year. Observers in all districts periodically scored the same videotape seg-ments independently, and their scoring was compared with the criterion scoring ofthe same segments. Average overall observer agreement with the criterion scoreswas 74.61% over all four years (using an index that controls for the likelihood ofagreement on infrequent events; see Clement, 1976).
5.5. TEACHER QUESTIONNAIRE
All teachers in the participating schools were given a questionnaire each spring,based in part on those used by Midgley, Feldlaufer, and Eccles (1988), and theCenter for Research on the Context of Secondary School Teaching (1990). Par-ticipation rates for the questionnaires ranged from 72% to 90% over the years,with a mean of 81%, and with sample sizes ranging from 417 to 489. Scales wereconstructed from the questionnaire items with the aid of factor analysis. For thepurpose of this paper, we will limit our attention to four scales that we considered

14 DANIEL SOLOMON ET AL.
particularly relevant to program implementation and were used as part of an indexof program implementation (see below).
5.6. STUDENT QUESTIONNAIRE
Questionnaires were administered to students in the upper three grades in allschools (Grades 3–5 in four districts and Grades 4–6 in two). There were two ques-tionnaires each year, with a common core of scales assessed for all students andothers given to students in only one or two grades. The within-year questionnaireparticipation rates of eligible students, by district, ranged from 62% to 78%, withan average of 73% across all districts and years. The scales administered at eachset of grades are shown at the left side of Table III3; the Appendix table presentssample items for the scales. Within-year sample sizes ranged from 4,374 to 5,011for questionnaire scales administered to students at all three grades, from 2,970 to3,326 for those administered at two grades only, and from 1,459 to 1,741 for thoseadministered at one grade only.
Except for several measures of academic performance (see below) and twoobservation scales, all of the dependent measures were obtained from the studentquestionnaires. The total battery of measures spanned five domains:
1. School environment. Sense of school as community, composed of three sub-scales: student autonomy and influence in the classroom, classroom supportive-ness, and school supportiveness. The total scale has 38 items (range 1–5; alpha,0.92).4
2. Academic attitudes and motives, including enjoyment of class (4 items; range,1–5; alpha, 0.65); liking for school (7 items; range, 1–5; alpha, 0.80); intrinsic aca-demic motivation (adapted from Connell & Ryan, 1987; Deer, Solomon, Watson, &Solomon, 1988; 6 items, range, 0–100);5 preference for challenging tasks (adaptedfrom Weiner & Kukla, 1970; Solomon & Kendall, 1979; 5 items; range, 1–2, alpha;0.66); measures of three achievement orientations (from Nicholls, 1989) – taskorientation (tendency to feel most satisfied when school work is challenging andleads to improved understanding; 8 items; range, 1–5; alpha, 0.82); ego orientation(tendency to feel most satisfied when school work allows one to demonstrate bet-ter performance than other students; 4 items; range, 1–5; alpha, 0.81); and workavoidance (tendency to feel most satisfied when work is easy; 5 items; range, 1–5;alpha, 0.82); frequency and enjoyment of reading (1 item each; range, 1–5); trust in,and respect for teachers (10 items; range, 1–3; alpha, 0.84); enjoyment of helpingothers learn (Deer et al., 1988; Solomon, Watson, Battistich, Schaps, & Delucchi,1992; 5 items; range, 1–5; alpha, 0.78); academic self-esteem (5 items; range, 1–5; alpha, 0.74); and educational aspirations and expectations (1 item each; range,1–4).
3. Personal attitudes, motives, and feelings, including general self-esteem (ad-apted from Solomon & Kendall, 1979; 4 items; range, 1–5; alpha, 0.74); senseof efficacy (Cowen, Work, Hightower, Wyman, Parker, & Lotyczewski, 1991; 10

EFFECTS OF CDP 15
items; range, 1–5; alpha, 0.74); sense of autonomy (8 items; range, 1–3; alpha,0.58); and loneliness at school (from Asher, Hymel & Renshaw, 1984; 9 items;range, 1–3; alpha, 0.87).
4. Social attitudes, motives, and behavior, including democratic values (adaptedfrom Solomon, Ali, Kfir, Houlihan, & Yaeger, 1972; Solomon & Kendall, 1979;10 items; range, 1–4; alpha, 0.70); acceptance of outgroups (10 items; range, 1–3;alpha, 0.83); conflict resolution skill (adapted from Battistich et al., 1989; 8 items;range, 1–5; alpha, 0.83); intrinsic prosocial motivation (adapted from Connell &Ryan, 1987, Deer et al., 1988, Solomon et al., 1992; 6 items; range, 0–100); al-truistic behavior (derived from Rushton, Chrisjohn, & Fekken, 1981; 10 items;range, 1–4; alpha, 0.82); social competence (10 items; range, 1–5; alpha, 0.80);and concern for others (adapted from Solomon & Kendall, 1979; 10 items; range,1–5; alpha, 0.79).
5. Cognitive/academic performance. Students in the top elementary grades (fifthor sixth) were given a measure of inductive reasoning skill (Ennis & Millman,1985; 23 items; range, 0–100; alpha, 0.70).
Measures of reading achievement and mathematics achievement were obtainedfrom standardized achievement tests given to students at each of the grades in alldistricts. With the exception of one district which introduced a state performance-based measure during the second year of the study, the achievement test scoreswere converted to a common metric (normal curve equivalents) for analysis.
5.7. CONSTRUCTING AN INDEX OF IMPLEMENTATION
Scores for each item in the classroom observation form were aggregated acrossthe segments and visits for each classroom each year. Items relating to severalprogram-relevant aspects of teacher practices were identified from the observationdata, and scales representing each were constructed after consideration of inter-item correlations, exploratory factor analyses, and the conceptual meaning of eachconstruct. To confirm the distinctness of these scales, we factor analyzed the finalset of selected teacher practices items, using principal axes factor analysis. Theseanalyses indicated that the items could reasonably be organized into seven teacherpractices factors (listed below) that appeared to represent central aspects of theintended CDP program.
Because we felt that the classroom observations alone might be missing someof the subtleties of CDP program implementation, and, particularly, that effect-ive program implementation involved teachers’ intentions and orientations towardstudents as well as their overt behaviors, we included measures of several of the at-titudes assessed in the teacher questionnaire in our measure of program implement-ation. Although these intentions and orientations were part of our conception ofimplementation from the start, we had not initially intended to include them as partof the index. When we attempted to validate several versions of the index againstprogram staff judgments of teachers’ implementation performance (as described

16 DANIEL SOLOMON ET AL.
below), we found that including the questionnaire scales substantially improvedagreement over that obtained using the observation scales alone. In creating theindex of implementation we, therefore, combined the seven scales derived fromthe classroom observations with four teacher attitude scales. The observation-basedscales were:
1. Promotion of student autonomy, freedom and influence (11 items; alpha, 0.63);2. Use of cooperative learning activities (6 items; alpha, 0.72);3. Promotion of social understanding and prosocial values (14 items; alpha, 0.83);4. Level of personal relationship between teacher and students (6 items; alpha,
0.69);5. Minimization of external control (7 items; alpha, 0.78);6. Emphasis on intrinsic motivation (5 items; alpha, 0.65); and7. Elicitation of student thinking and active discussion (13 items; alpha, 0.78);
The teacher questionnaire scales included in the implementation index were:
1. Optimism about students’ learning potential (10 items; alpha, 0.67);2. Trust in students (3 items; alpha, 0.61);3. Belief in importance of student self-direction, exploration, collaboration, and
understanding (9 items; alpha, 0.80); and4. Belief in promoting student autonomy (‘control ideology’– Deci, Schwartz,
Sheinman, & Ryan, 1981) (responses to hypothetical student problem situ-ations, varying in degree of advocated student autonomy vs. teacher control inselected solutions).6
The mean internal consistency reliability of the implementation index over thefour years, assessed by considering each of the 11 component subscales as an‘item’, was 0.74. Sample items for each of the components are shown in the Ap-pendix table. A discriminant function analysis comparing the implementation scoresof three groups – teachers nominated by CDP program staff as particularly goodimplementers, the rest of the program teachers, and the comparison teachers –strongly differentiated the three groups and produced a ‘correct’ prediction for 90%(18 of 20) of the nominated teachers which indicated that the measure had adequatevalidity, at least by this index. It should be noted that one important aspect ofthe program, the use of CDP’s literature-based reading program, was not includedin this implementation index. Although a number of items representing the useof literature were included in the classroom observation system, these items didnot coalesce and did not appear to be capable of distinguishing the CDP use ofliterature from other classroom approaches that involved the use of literature. Thevalidation indicated that the index agrees well with staff developers’ perceptions,but we do not have data that shows whether teachers who were implementing otheraspects of the classroom program were also implementing the literature compon-ent. This incompleteness should be borne in mind in considering findings involvingthe use of this index.

EFFECTS OF CDP 17
5.8. OBSERVATION MEASURES OF STUDENT CLASSROOM BEHAVIOR
In addition to the index of implementation, two scales representing students’ class-room behavior were also derived from the observations: positive behavior amongstudents (8 items; alpha, 0.74) and students’ engagement in class activities (6 items;alpha, 0.74).
5.9. STATISTICAL PROCEDURES
The direct effects of the program were assessed with a series of univariate analysesof variance and covariance, usinga priori contrasts that compared linear changesfrom baseline for students in the program schools with those in the comparisonschools.7 A second set of analyses used structural equations modeling techniques(Bentler, 1992) to test explicitly the hypothesis that students’ sense of communityfunctioned to mediate program effects on students.
6. Results
6.1. SCHOOLS SHOWING SIGNIFICANT INCREASES IN IMPLEMENTATION
We compared implementation index changes from baseline to the three programyears for teachers in each of the 12 program schools with those in their comparisonschools and found significantly greater changes in five of the program schools,with t values for the contrasts ranging from 1.77(p < 0.09) to 4.83(p < 0.001)and average effect sizes of the differences ranging from 0.41 to 1.10, while thecomparablet values for the other seven schools were all less than 1, with averageeffect sizes ranging from−0.06 to 0.20.
The five significantly changing schools, along with their matched comparisons,represented the full range of demographic characteristics. They included both pairsin District 1 (a relatively affluent suburban district), Pair A in District 2 (schoolswith high levels of poverty and almost completely African–American student bod-ies), and both pairs in District 3 (schools with moderate minority populationsand moderate-to-high levels of poverty). All of these program-comparison pairswere very closely matched, with the exception of the Pair A schools in District1 which were only moderately well matched (see Table I) – although the twoDistrict 1 comparison schools combined matched the two program schools com-bined, as mentioned above, and the pooled comparison school data were used inall examinations of contrasts in that district.

18D
AN
IEL
SO
LO
MO
NE
TA
L.
Table II. Student questionnaire variable means in high-change schools (with controls for gender, ethnicity, and grade)
Variable Status Year Contrast Mean ES
1992 1993 1994 1995 Chg fr Base change
t p
School environment
Sense of school as community Comparison 2.98 2.80 2.81 2.72 −0.20
(0.59)a (0.63) (0.61) (0.59)
Program 2.85 2.93 2.92 2.97 9.04 <0.001 0.09 0.47
(0.63) (0.67) (0.63) (0.62)
Academic attitudes, motives
Enjoyment of class Comparison 3.84 3.74 3.76 3.63 −0.13
(0.93) (0.97) (0.94) (0.95)
Program 3.77 3.73 3.67 3.79 1.72 <0.09 −0.04 0.09
(0.96) (0.97) (1.03) (0.98)
Liking for school Comparison 3.62 3.48 3.44 3.34 −0.20
(0.97) (1.00) (1.00) (1.02)
Program 3.50 3.42 3.38 3.56 2.96 <0.004 −0.05 0.15
(0.98) (1.07) (1.07) (1.02)
Intrinsic academic motivation Comparison 49.35 50.07 50.30 49.97 0.76
(5.61) (5.90) (6.01) (5.90)
Program 48.67 51.31 51.40 51.20 2.57<0.001 2.63 0.33
(5.08) (6.07) (5.59) (5.43)

EF
FE
CT
SO
FC
DP
19
Table II. (continued)
Variable Status Year Contrast Mean ES
1992 1993 1994 1995 Chg fr Base change
t p
Preference for challenging Comparison 1.64 1.67 1.67 1.68 0.03
tasks (0.31) (0.32) (0.30) (0.33)
Program 1.70 1.72 1.70 1.73 0.80 NS 0.02 −0.06
(0.29) (0.29) (0.31) (0.28)
Task orientation Comparison 3.82 3.67 3.68 3.64 −0.16
(0.83) (0.88) (0.87) (0.88)
Program 3.70 3.71 3.79 3.74 4.64 <0.001 0.05 0.24
(0.89) (0.85) (0.87) (0.85)
Ego orientation Comparison 3.44 3.66 3.58 3.60 0.17
(1.15) (1.13) (1.14) (1.12)
Program 3.45 3.70 3.65 3.59 0.43 NS 0.20 −0.02
(1.11) (1.10) (1.18) (1.12)
Work avoidance Comparison 3.45 3.58 3.63 3.68 0.18
(1.09) (1.10) (1.01) (1.05)
Program 3.53 3.68 3.68 3.60 1.14 NS 0.12 0.05
(1.08) (1.04) (1.08) (1.06)

20D
AN
IEL
SO
LO
MO
NE
TA
L.
Table II. (continued)
Variable Status Year Contrast Mean ES
1992 1993 1994 1995 Chg fr Base change
t p
Freq. reading self-chosen Comparison 3.72 3.41 3.41 3.52 −0.27
books outside of school (1.31) (1.42) (1.42) (1.38)
Program 3.49 3.38 3.37 3.35 2.16 <0.04 −0.12 0.11
(1.38) (1.41) (1.44) (1.36)
Freq. reading self-chosen Comparison 2.68 2.65 2.49 2.56 −0.11
books in school (1.01) (1.07) (0.94) (1.11)
Program 2.47 2.59 2.52 2.52 3.65 <0.001 0.07 0.19
(0.93) (1.02) (0.98) (.98)
Liking for reading Comparison 4.24 4.11 4.06 4.07 −0.16
(0.97) (1.10) (1.14) (1.11)
Program 4.11 4.01 4.00 4.05 1.20 NS −0.09 0.06
(1.06) (1.15) (1.19) (1.11)
Trust in and respect Comparison 2.23 2.32 2.33 2.30 0.09
for teachers (0.48) (0.46) (0.47) (0.46)
Program 2.24 2.32 2.39 2.36 1.01 NS 0.12 0.07
(0.47) (0.47) (0.46) (0.46)
Enjoyment of helping others Comparison 3.98 3.91 3.92 3.86 −0.08
learn (0.89) (0.91) (0.87) (0.91)
Program 4.02 3.91 4.04 3.98 0.37 NS −0.04 0.05
(0.85) (0.87) (0.84) (0.79)

EF
FE
CT
SO
FC
DP
21
Table II. (continued)
Variable Status Year Contrast Mean ES
1992 1993 1994 1995 Chg fr Base change
t p
Academic self-esteem Comparison 3.84 3.95 3.96 4.01 0.13
(0.95) (0.91) (0.85) (0.80)
Program 3.78 3.97 4.00 4.03 0.23 NS 0.22 0.10
(0.93) (0.83) (0.86) (0.84)
Educational aspirations Comparison 3.67 3.79 3.77 3.61 0.05
(0.77) (0.60) (0.67) (0.87)
Program 3.65 3.71 3.75 3.73 0.52 NS 0.08 0.04
(0.80) (0.75) (0.67) (0.74)
Educational expectations Comparison 3.43 3.61 3.67 3.55 0.18
(0.90) (0.75) (0.75) (0.82)
Program 3.41 3.52 3.51 3.60 0.53 NS 0.13 −0.06
(0.86) (0.82) (0.82) (0.76)
Personal attitudes, motives, feelings
General self-esteem Comparison 4.10 4.05 4.05 4.15 −0.02
(1.11) (1.07) (1.06) (1.01)
Program 4.08 4.03 4.14 4.11 0.84 NS 0.01 0.03
(1.02) (1.02) (0.99) (0.99)

22D
AN
IEL
SO
LO
MO
NE
TA
L.
Table II. (continued)
Variable Status Year Contrast Mean ES
1992 1993 1994 1995 Chg fr Base change
t p
Sense of efficacy Comparison 3.11 3.22 3.25 3.26 0.13
(0.73) (0.73) (0.73) (0.73)
Program 3.09 3.22 3.26 3.35 1.57 <0.12 0.19 0.08
(0.74) (0.72) (0.69) (0.67)
Sense of autonomy Comparison 2.27 2.17 2.16 2.14 −0.11
(0.31) (0.32) (0.31) (0.28)
Program 2.24 2.15 2.17 2.15 0.93 <0.06 −0.08 0.08
(0.31) (0.31) (0.30) (0.30)
Loneliness (at school) Comparison 1.45 1.42 1.48 1.38 −0.02
(0.46) (0.42) (0.49) (0.41)
Program 1.48 1.46 1.39 1.42 0.55 NS −0.06 0.07
(0.47) (0.51) (0.45) (0.47)
Social attitudes, motives, behavior
Democratic values Comparison 2.79 2.85 2.80 2.82 0.03
(0.64) (0.63) (0.63) (0.60)
Program 2.74 2.87 2.89 2.84 2.10 <0.02 0.13 0.16
(0.65) (0.63) (0.61) (0.63)

EF
FE
CT
SO
FC
DP
23
Table II. (continued)
Variable Status Year Contrast Mean ES
1992 1993 1994 1995 Chg fr Base change
t p
Acceptance of outgroups Comparison 2.19 2.22 2.13 2.22 0.00
(0.51) (0.45) (0.43) (0.47)
Program 2.18 2.27 2.16 2.24 0.92 NS 0.04 0.10
(0.47) (0.45) (0.44) (0.42)
Outgroups: Discrepancy score Comparison−0.45 −0.53 −0.55 −0.54 −0.09
(deviation from friend)b (0.57) (0.49) (0.50) (0.52)
Program −0.55 −0.48 −0.56 −0.55 2.37 <0.02 0.02 0.22
(0.51) (0.49) (0.51) (0.48)
Conflict resolution skills Comparison 2.76 2.74 2.91 2.84
(1.05) (1.05) (1.01) (1.03)
Program 2.61 2.85 2.92 2.96 4.17 <0.001 0.30 0.22
(1.03) (1.05) (1.06) (1.05)
Intrinsic prosocial Comparison 51.64 53.87 53.30 54.28 2.18
motivation (7.79) (7.82) (7.10) (7.72)
Program 50.37 55.90 55.31 55.30 3.06 <0.002 5.13 0.41
(7.21) (7.52) (7.56) (7.81)
Altruistic behavior Comparison 2.58 2.54 2.50 2.62 −0.03
(0.66) (0.68) (0.65) (0.66)
Program 2.58 2.57 2.61 2.67 1.29 <0.10 0.04 0.10
(0.67) (0.64) (0.62) (0.63)

24D
AN
IEL
SO
LO
MO
NE
TA
L.
Table II. (continued)
Variable Status Year Contrast Mean ES
1992 1993 1994 1995 Chg fr Base change
t p
Social competence Comparison 3.65 3.59 3.54 3.57 −0.08
(0.73) (0.75) (0.72) (0.71)
Program 3.65 3.56 3.61 3.61 0.36 NS −0.06 0.04
(0.73) (0.72) (0.70) (0.64)
Concern for others Comparison 3.53 3.46 3.47 3.42 −0.08
(0.79) (0.82) (0.82) (0.83)
Program 3.45 3.48 3.47 3.46 2.86 <0.002 0.02 0.13
(0.79) (0.85) (0.85) (0.85)
aStandard deviations shown in parentheses.bWith this measure, respondents were asked to indicate how much they would want to do a specific task with a close friend and withvarious other people differing in social distance. The ‘acceptance of outgroups’ score omits the friend’s score, while the discrepancy scoresubtracts scores for the members of other groups from that for the friend.

EFFECTS OF CDP 25
6.2. PROGRAM EFFECTS
6.2.1. Effects of Background Factors on Results
A series of analyses of variance examined the degree to which the effects of pro-gram participation on student outcomes might be conditioned by such backgroundcharacteristics of the students as ethnicity, gender, and grade level. While therewere many significant main effects (e.g., girls scored higher than boys on many ofthe ‘prosocial’ variables), there was no consistent pattern of interactions betweenprogram status and these background factors, and, overall, no more interactionsthan would be expected by chance. Thus, there was no indication that childrenwith different background characteristics responded differently to the CDP pro-gram. Subsequent analyses of the student outcomes statistically controlled for thesefactors in order to increase the precision of estimates of program effects.
6.2.2. Studywide Analyses of Direct Program Effects
We initially examined direct effects of the program on various student measuresby comparing changes from baseline in the 12 program schools with those in the12 comparison schools, with controls for student gender, ethnicity, and grade level.Five variables (sense of the school as a community, task orientation, frequencyof reading self-chosen books outside of school, frequency of reading self-chosenbooks in school, and altruistic behavior) showed significant effects favoring stu-dents in the program schools, but an almost equal number–four (enjoyment ofclass, preference for challenging tasks, acceptance of people in outgroups, andconcern for others)–showed significant effects favoring the comparison schools,leading to the conclusion that there were no consistent overall effects. However,because, as mentioned above, only five of the schools showed general increases inimplementation after the baseline year, we decided to examine the results for thesefive schools in particular (vis-a-vis their comparison schools), on the grounds thatit was only reasonable to assess the effects of the CDP program in the schools thathad actually made progress in implementing it.
6.2.3. Effects of Program on Student Attitudes, Motives, and Inclinations in FiveHigh-Change Schools
The sample sizes from the 10 schools (5 program and 5 comparison) used in theseanalyses varied. For variables assessed at all three grades, within-year Ns rangedfrom 1,970 to 2,105; for those assessed at two grades only, from 1,247 to 1,397; andfor those assessed at a single grade, from 559 to 731. The results of these analysesare shown in Table II. A sizable proportion of these variables showed changes frombaseline favoring the program students (relative to the comparison students), whilenone showed significant changes favoring comparison students. Those showingstatistically significant(p < 0.05) or marginal(p < 0.10) effects involved allthe domains represented in the student questionnaires, including school environ-

26 DANIEL SOLOMON ET AL.
ment (sense of school as community), academic attitudes and motives (liking forschool, enjoyment of class (marginal), intrinsic academic motivation, task orienta-tion, frequency of reading self-chosen books outside school, frequency of readingself-chosen books in school), personal attitudes, motives, and feelings (sense ofautonomy (marginal)), and social attitudes, motives, and behavior (democratic val-ues, outgroup acceptance, conflict resolution skill; intrinsic prosocial motivation,concern for others, and altruistic behavior (marginal)).
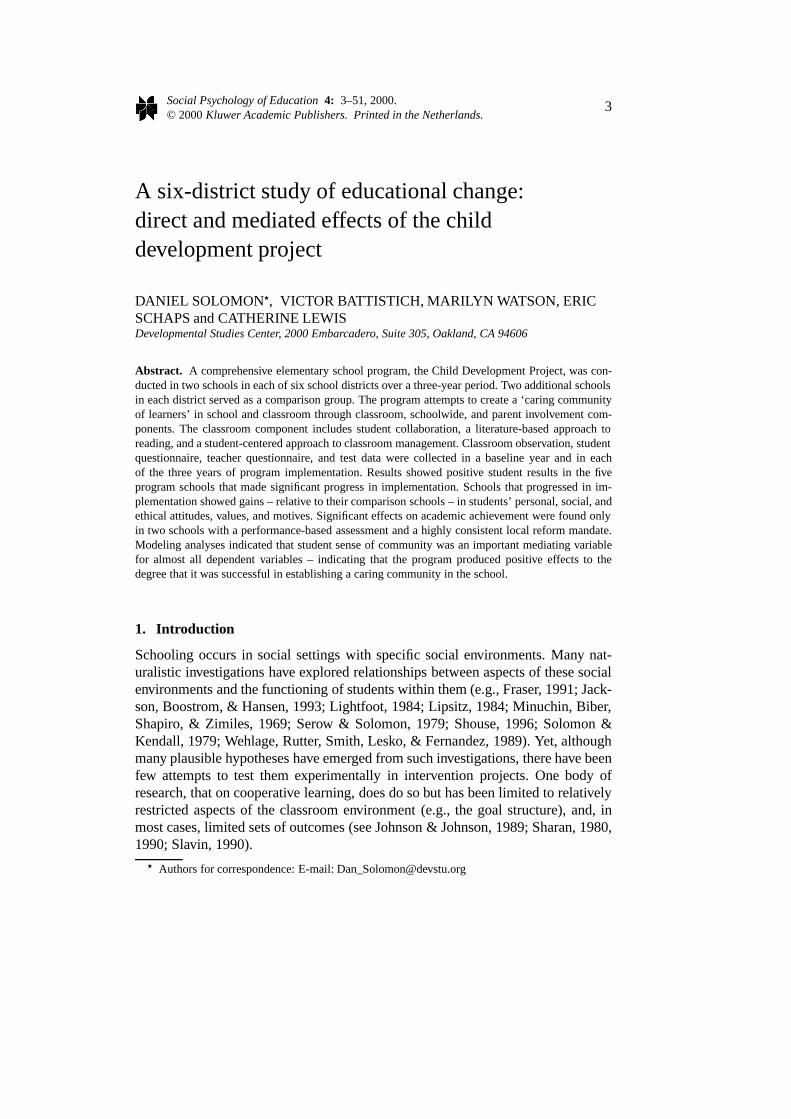
The results for four of these variables – sense of community, intrinsic academicmotivation, intrinsic prosocial motivation, and conflict resolution skill, are shownin Figures 1–4. It can be seen that each of the trends shown in the figures indic-ate crossover effects, or ‘disordinal’ interactions. To consider the possibility ofa regression-to-the-mean effect, we examined the baseline differences. Of the 14significant (or marginally significant) trends, 8 (including those shown in Figures1 and 4) were significantly different at baseline, with the comparison group higher.However, in most of these cases, the two groups do not approach a common mean,but rather diverge. There are only three instances in which they appear to converge– for reading books in school, the outgroups discrepancy score, and concern forothers. It is only in these three instances, out of the 14 significant contrasts, that wesee the possibility of a ‘regression artifact’.
To summarize, in the five high-change program schools there were numeroussmall-to-moderate positive student changes in attitudes, motives, or behavior, a fewlarge changes, and no significant negative changes. There were 28 of these vari-ables. Fourteen (50%) showed significant or marginal positive effects favoring theprogram students, while none showed significant effects favoring the comparisonstudents. Ignoring significance levels, the changes from baseline favored programstudents for 25 of these variables (89%).8
6.2.4. Effects on Students’ Classroom Behavior
The observation indices of student behavior did not show significant program ef-fects either overall or in the five schools that made progress in implementation.
6.2.5. Effects on Student Achievement
As mentioned above, the initial studies of CDP showed little overall effect onachievement. In the six-district project, we assessed achievement with district-administered achievement tests, with a measure of inductive reasoning, and witha measure of reading comprehension (which we later decided not to use). Weencountered problems in handling the district achievement test data because dif-ferent tests were used in different districts, the tests used were changed during theperiod of the study in three of the districts, and the grade levels assessed differedacross districts (and, in some cases, within a district over time). Therefore, wefound it necessary to examine the standardized achievement test results separately

EFFECTS OF CDP 27
Figure 1. Students’ sense of community in high-change schools.
Figure 2. Students’ intrinsic academic motivation in high-change schools.
in each district. Because of these limitations, the achievement findings should beinterpreted with some caution.
Given the available data, there was little evidence of consistent overall effects onachievement, with the exception of two schools (both in the high-change group) inone district that used performance-based state-administered achievement tests (aspart of a statewide educational reform that was very consistent with the emphasesof CDP).

28 DANIEL SOLOMON ET AL.
Figure 3. Students’ conflict resolution skill in high-change schools.
Figure 4. Students’ intrinsic prosocial motivation in high-change schools.
The five high-change schools showed no significant effects on the measureof inductive reasoning. Three of the five schools showed little effect on district-administered standardized achievement test scores, except for a negative effect onmath achievement in one(t = 3.62, p < 0.001, ES = −0.29). The remainingtwo schools, however, showed large positive within-year differences from theircomparison schools on a state-administered performance assessment.9 Students inone of these schools scored higher than those in their comparison school on readingperformance in program years one and two (Year 1:t = 1.79,p = 0.07, ES=0.26;

EFFECTS OF CDP 29
Year 2: t = 3.65, p = 0.0003, ES=0.61), on math performance in all threeyears (Year 1:t = 3.37, p = 0.001, ES=0.48; Year 2:t = 3.63, p = 0.0003,ES=0.61; Year 3:t = 2.21, p = 0.03, ES=0.39), on science performance inYear 2 (t = 3.77, p = 0.0002, ES=0.64), and on social studies performancein Years 1 and 2 (Year 1:t = 3.40, p = 0.001, ES=0.49; Year 2:t = 3.68,p = 0.0003, ES=0.62). Students in the second program school in this districtperformed less well than those in their comparison school in the first programyear in math, science, and social studies, but did better in subsequent years (Year1 math: t = 2.42, p = 0.02, ES = −0.33; Year 1 science:t = 2.01, p =0.05, ES= −0.27; Year 1 social studies:t = 1.92, p = 0.06, ES= −0.28;Year 2 math:t = 3.20, p = 0.002, ES= 0.52; Year 3 math:t = 3.31, p =0.001, ES= 0.54; Year 3 science:t = 2.10, p = 0.04, ES= 0.35; Year 3social studies:t = 1.93, p = 0.054, ES= 0.32). This second school did notshow a significant difference in reading performance in any of the three programyears.
6.3. MODELING ANALYSES
These analyses were conducted to test explicitly the hypothesis that program effectswould be mediated by effects on students’ sense of the school as a community.This hypothesis was assessed by applying structural equations modeling techniques(EQS; Bentler, 1992) to the data.
Because we were interested in assessing changes in practices, behavior, and out-comes due to CDP, we controlled for baseline scores in these analyses and includedall 24 schools (12 program and 12 comparison). We tested the linkages by estim-ating paths from program status (comparison or program) to classroom practicesin the three program years (with baseline practices controlled), from classroompractices to sense of community in the program years (with baseline classroompractices and sense of community controlled), and from sense of community tothe measured outcomes in the three program years (with baseline practices, senseof community and outcome scores at baseline controlled). With each dependentvariable, all of these linkages were examined in a single model.
These are classroom-level analyses, with the same teachers repeated acrossthe four years, teaching the same grades; thus the teachers are repeated, but thestudents in their classrooms are different between the baseline year and each ofthe later years.10 Because they are classroom level analyses, all student measureswere aggregated to the class level.11 These analyses were limited to teachers atany of the upper three grades for whom there were four years of data (classroomobservations, teacher questionnaires, and student questionnaires). The number ofclassrooms in these analyses was, therefore, reduced from the full sample. Therewere 134 classrooms for analyses including student variables assessed at all threegrades, 79 for those involving student variables assessed at two grades, and 34–41for those involving variables assessed only at a single grade. Analyses of available

30 DANIEL SOLOMON ET AL.
Table III. Structural equations modeling analyses.
Status to Impl. Sense of df χ2 CFI
implemen- change to community
tation sense of change to
changeβ community dept. var.
changeβ changeβ
A. Variables assessed at 0.21∗∗ 0.39∗∗all grades
Amount of reading outside 0.21∗∗ 13 29.13∗∗ 0.91
school
Amount of reading in 0.18∗∗ 13 16.64 0.98
school
Enjoyment of reading 0.39∗∗ 13 20.15+ 0.96
Enjoyment of class 0.72∗∗∗ 13 31.33∗∗ 0.94
Liking for school 0.66∗∗∗ 13 30.71∗∗ 0.95
Sense of personal efficacy 0.39∗∗ 13 23.18∗ 0.94
Sense of personal autonomy −0.05 13 44.86∗∗ 0.83
Task orientation 0.61∗∗ 13 20.89+ 0.96
Ego orientation −0.47∗∗ 13 27.95∗∗ 0.92
Work avoidance orientations −0.45∗∗ 13 18.13 0.97
Concern for others 0.48∗∗ 13 27.22∗ 0.95
Conflict resolution 0.59∗∗ 13 12.68 1.00
Engagement in class 0.22∗∗ 11 25.67∗∗ 0.93
Positive interpersonal 0.27∗∗ 11 17.95+ 0.96
behavior in class
B. Variables assessed at 0.25∗∗ 0.42∗∗Grades 3/4 and 4/5
Democratic values 0.21∗∗ 13 27.14∗∗ 0.88
Altruistic behavior 0.39∗∗ 13 8.00 1.00
C. Variables assessed 0.25+ 0.43∗∗at grades 3/4 only
Pref. for challenging tasks 0.34∗∗ 13 15.92 0.91
Intrinsic academic motivation 0.34∗∗ 13 6.40 1.00
Intrinsic prosocial motivation 0.34∗∗ 13 11.15 1.00
Attitude toward outgroups 0.46∗∗ 13 9.69 1.00
D. Variables assessed 0.25+ 0.49∗∗at grades 4/5 Only
Academic self-esteem 0.49∗∗ 13 10.66 1.00
General self-esteem 0.49∗∗ 13 15.53 0.95
Social competence 0.65∗∗ 13 15.11 0.97

EFFECTS OF CDP 31
Table III. (continued)
Status to Impl. Sense of df χ2 CFI
implemen- change to community
tation sense of change to
changeβ community dept. var.
changeβ changeβ
Loneliness −0.29+ 13 16.44 0.93
Trust in, respect teachers 0.71∗∗ 13 22.03+ 0.92
Enjoy helping others learn 0.72∗∗ 13 10.83 1.00
E. Variables assessed −0.02 0.41∗∗at grades 5/6 Only
Inductive reasoning skill 0.30∗∗ 13 14.00 0.99
Educational expectations 0.23 13 11.48 1.00
Educational aspirations 0.11 13 15.73 0.95
Student questionnaires were given at the upper three elementary grades. Four of the districts had K-5 elementary school configurations; the other two had K-6 configurations. Thus, for example, thevariables listed under ‘Grades 5/6’ were assessed at Grade 5 in the former districts and at Grade 6in the latter.+p < 0.10;∗∗ p < 0.05;∗∗ p < 0.01.
achievement test score data involved the classrooms of 86 teachers, or 64% of thosefor whom full data on other variables were present for all four years.
A separate modeling analysis was done with each dependent variable. Thefindings were largely consistent with the general hypothesis, indicating that pro-gram status (program vs. comparison school) led to increases over the four yearsin program implementation, that increases in program implementation led to in-creases in students’ sense of community, and that increases in sense of community,in turn, led to increases in most of the assessed student outcomes. These ana-lyses are summarized in Table III and Figures 5 and 6. As shown in Table III,two indices of overall model fit were used for each analysis – chi-square andBentler’s CFI index (Bentler, 1992). Figures 5 and 6 are simplified graphic rep-resentations of the analyses of the variables that showed significant linkages withsense of community, organized by the grade levels included for each dependentvariable.
With the exception of the three variables that did not show this linkage (sense ofpersonal autonomy, educational aspirations, and educational expectations), everyassessed variable did show the predicted linkages and good-to-excellent model fit(at least by the CFI index), in all of the assessed domains:
• social attitudes, motives, and behavior (concern for others, democratic values,prosocial conflict resolution skill, altruistic behavior, intrinsic prosocial motiv-

32 DANIEL SOLOMON ET AL.
Figure 5. Summary of class-level structural equations modeling analyses: variables assessedat all three grades. Note: The measures of classroom implementation, student sense of com-munity, and the student outcomes indicated in this figure all represent average scores for thethree program years, with baseline scores controlled. Thus, the paths represent, essentially,relationships of changes in one variable to changes in another.
ation, trust in teachers, attitude toward outgroups, and positive interpersonalbehavior in class);• personal attitudes, beliefs, and feelings (general self-esteem, sense of personal
efficacy, social competence, and loneliness in school – negatively related tosense of community);

EFFECTS OF CDP 33
Figure 6. Summary of class-level structural equations modeling analyses: variables assessedat one or two grades only. Notes: The measures of classroom implementation, student sense ofcommunity, and the student outcomes indicated in this figure all represent average scores forthe three program years, with baseline scores controlled. Thus, the paths represent, essentially,relationships of changes in one variable to changes in another. a. Coefficients obtained inanalyses involving outcome variables assessed at Grades 3/4 and 4/5 only. b. Coefficientsobtained in analyses involving outcome variables assessed at Grades 3/4 only. c. Coefficientsobtained in analyses involving outcome variables assessed at Grades 4/5 only. d. Coefficientsobtained in analyses involving outcome variables assessed at Grades 5/6 only.
• academic attitudes, motives, and behavior (reading in school, reading outsideof school, enjoyment of reading, liking for school, enjoyment of class, engage-ment in class, enjoyment of helping others learn, academic self-esteem, prefer-ence for challenging tasks, intrinsic academic motivation, task orientation, ego

34 DANIEL SOLOMON ET AL.
orientation, and work avoidance orientation – a negative association with senseof community was predicted, and found, for the latter two variables).
The models tested with the dependent variables assessed only at Grades 5 or6 did not show a significant linkage between program status and program imple-mentation, although they did show a linkage between implementation and senseof community, and one of them (inductive reasoning skill) was also significantlylinked with sense of community.
All but two of the student outcome variables shown in Table III and Figure 5were assessed with the student questionnaire. Those two variables, engagement inclass and positive interpersonal behavior, were derived from the classroom obser-vations and reflect students’ observed behavior in class. These last two variablesalso show direct as well as mediated effects (therefore leaving two less degrees offreedom than the other SEM analyses): program implementation relates directlyto students’ engagement in class and program status relates directly to students’positive interpersonal behavior.
We also examined the possibility that similar mediated relationships might oc-cur with the various measures of achievement. These analyses examined the samemodel shown above as well as additional models in which engagement in classand student motivation were explored as alternative or additional mediating vari-ables. The analyses involving district-administered achievement tests, again usingaggregated class-level data, were based on relatively small numbers of classroomsbecause the tests were not given at all grades in most districts. We found no evid-ence of mediated relationships with such test data. We also tested such modelswith the measure of inductive reasoning and here also did not find evidence ofsuch relationships.12
7. Discussion
The CDP is predicated on a vision of education that holds that the intellectual,social, and ethical realms are interdependent, that simultaneous development in allshould be central goals of schooling, and that the social context and emphases ofclassroom and school can be fashioned in ways that will enhance development inall three realms. The results of this study, including both the tests of contrasts andthe modeling analyses, suggest that this is indeed the case: that where progress wasmade toward implementing the basic aspects of the program, students showed cleargains in academic motivation and engagement (the intellectual realm), personaland interpersonal concerns and skills (the social realm), and prosocial values andbehavior (the ethical realm).
While we cannot totally account for the particular pattern of results obtainedacross the 28 separate measures, we would note that positive effects were found inevery domain assessed (with the partial exception of academic achievement, wherepositive effects were found only in one district), but that the results were strongestand most widespread with respect to the social domain (e.g., conflict resolution

EFFECTS OF CDP 35
skill, intrinsic prosocial motivation, and concern for others). This is not surprisingin that the earliest versions of the program began with a primary emphasis on proso-cial development which we later came to see as entirely consistent with, and indeedessential for, optimal academic development. Whether this linkage was clearly andconsistently in our professional development efforts, however, may be question-able. Our emphasis was on helping teachers create a caring community in theclassroom, with the assumption that this was the essential ingredient from whichall else would flow. But because an explicit emphasis on social/ethical concernswas relatively unusual in most teachers’ prior educational experience, this generalarea was given particular focus, perhaps inadvertently causing the academic side tobe relatively underemphasized. Our more recent approaches to staff developmenthave attempted to rectify this apparent imbalance.
7.1. IMPLEMENTATION VARIATION
One general finding of this study is that there was considerable variation in thelevels of implementation achieved among schools and among teachers. Generalmovement toward implementation of the program was found in 5 of the 12 pro-gram schools (i.e., a preponderance of teachers in those schools made signific-ant progress in their implementation of the program, relative to their comparisonschool counterparts, over the four years). Analyses of outcomes for students inthe five schools that made significant gains in implementation (vis-a-vis those intheir comparison schools) showed a broad range of positive effects. These oc-curred for various student perceptions, attitudes, and motivations (including senseof the school as a community, liking for school, achievement motivation, prosocialmotivation, democratic values, conflict resolution skill, and concern for others).These positive effects did not generally extend to standardized measures of stu-dent achievement (although, because the measures used, grades assessed, and testtiming varied among districts, and, in some cases within districts across years,the achievement findings are somewhat problematic). Relative to their comparisonschools, three of the five schools showed no effects on standardized multiple choicetests. The two remaining schools did show strong positive achievement perform-ance relative to their comparison schools. Both schools were in a district in whicha state-developed performance-based achievement test was used – part of a stateeducational reform which was consistent with CDP in many respects.
Given the scope of the CDP program, the cautionary experience of others whohave attempted to implement complex educational programs, and the writings ofFullan and Stiegelbauer (1991), Sarason (1993), Miles (1964), and others who haveemphasized the time, effort, commitment, and supports necessary to implementmeaningful educational innovations, we were not surprised that widespread move-ment toward implementation was achieved in only 5 of the 12 program schools,relative to their particular comparison schools. This is not to say that teachersmaking significant implementation progress were entirely limited to these schools;

36 DANIEL SOLOMON ET AL.
there were some in every school but only in sufficient numbers to move the schoolas a whole in these five instances. But in those schools in which there were wide-spread gains in implementation, a broad range of positive effects on students wasalso found.
We have conducted comparative case studies trying to determine the factors thatdifferentiated the five schools that made significant progress toward implementingthe program from the seven schools that did not (Lewis, Battistich, Solomon, Wat-son, & Schaps, 1999). The case studies suggest that the high-change sites weredistinguished by such factors as adult safety to learn (e.g., principals who madetheir own learning public and who helped teachers feel comfortable with tryingproject activities and occasionally failing); steady positive press (from teachers andadministrators) for the changes advocated by CDP; perceived need for improve-ment by principals and school faculties; and opportunities for collegial work amongteachers (discussing program issues and problems on a regular basis, observing oneanother, working on joint projects). The schools that did not exhibit these factorsfailed to do so in various particular ways. In some the faculty saw no real needfor change, in others intra-organizational conflicts prevented a concerted collegialfocus on mastering and implementing a new program, while in others externaldemands (e.g., for boosting achievement test scores) became the top priority forextended periods during the school year, overwhelming other concerns and issues.
7.2. THE DESIGN
Because this quasi-experiment compared a treatment with a no-treatment con-dition, rather than an alternative treatment (or ‘placebo’) condition, it might beargued that it is inappropriate to attribute the specific results to this particular treat-ment rather than to any (versus no) treatment or simply to the increased attentionreceived by teachers and the school (i.e., the ‘Hawthorne’ effect). While these arereasonable concerns in some situations, the following considerations suggest thatthey are of little concern in this one:
(a) rather than being devoid of other programs, the comparison schools, as withmany schools in this country, were involved in varied other programs;
(b) the extra attention was paid to teachers and schools, not to students directly(for them, the form and nature of their activities changed, but not the amountof attention);
(c) if extra attention to teachers and schools were sufficient to produce the specificeffects of the program, more than 5 of the 12 program schools would havebeen successful, since all 12 received about the same attention from our staffdevelopers.

EFFECTS OF CDP 37
7.3. MODELING ANALYSES AND THE ROLE OF COMMUNITY
The modeling analyses were undertaken, in part, to investigate the effects of in-dividual teacher (as opposed to schoolwide) changes in implementation. Theseanalyses were more sensitive to variations in implementation because they used theimplementation index, a continuous measure, as a key mediating factor rather thanbeing limited to the simple dichotomous measure of program participation, as wasthe case with the tests of contrasts. This, plus the fact that the modeling analysesused the teacher as the unit of analysis while the contrast tests used the individualstudent, may account for the fact that the modeling analyses showed a larger pro-portion of significant effects on student outcome variables (although in both sets ofanalyses all the investigated domains showed at least some positive effects). Themodeling analyses showed that, on average, the teachers who participated in theprogram increased in program implementation over the years of the project, vis-a-vis the comparison teachers, and that their increases in implementation led to gainsin students’ sense of community which, in turn, led to student improvements inseveral areas, including their social attitudes and inclinations, their connection toschool, and their personal well-being. These improvements did not extend to meas-ures of achievement, however, with the partial exception of inductive reasoningskills.
The structural equations modeling analyses clearly indicate the importance ofthe level of implementation achieved, and, in particular, the critical mediating roleof students’ developing sense of community. While in earlier papers from thebaseline data in this project we demonstrated contemporaneous linkages betweensimilar indices of classroom practices and the sense of community (Solomon etal., 1997) and between the sense of community and various student outcomes(Battistich et al., 1995), in the present analyses we have also incorporated pro-gram intervention and changes over time in each of the model components, thusproviding a stronger case for causal inferences.
7.4. GENERALITY
Our earlier work demonstrated that students’ sense of community and teachers’classroom practices are strongly and similarly related in schools serving studentsof radically different socio-economic levels (see Solomon et al., 1997). Furtherexplorations of the generality of these findings are warranted, but we should notethat the schools in the present sample comprised a broad range of demographiccharacteristics. In particular, among the five schools that made significant stridestoward program implementation and also achieved generally positive student res-ults, some had high and some had low levels of student poverty, some were inurban and some were in suburban locations, some had high and some had lowlevels of minority populations, and some had high and some had low levels ofprior achievement. This seems to indicate fairly clearly that the program can beeffective for a broad variety of students.

38 DANIEL SOLOMON ET AL.
7.5. CONTENT OF COMMUNITY NORMS AND VALUES
It should be noted that while the sense of community appears to incline studentstoward abiding by and adopting the norms and values of the community, this cantheoretically apply to negative as well as positive norms and values. Thus, thegoals and ‘presses’ that are pervasive in the school environment are extremelyimportant. We have earlier presented findings indicating that students’ sense ofthe classroom as a community related to their level of moral reasoning in differentways depending on the authority structure of the classroom (Solomon et al., 1996).Findings by Shouse (1996), showing the positive effects on achievement of senseof community combined with an academic press in the school, are also consistentwith this position. To test this hypothesis more thoroughly, it would be valuable toconduct further research comparing schools that meet the community criteria buthave differing norms and emphases.
7.6. ISSUES CONCERNING ACHIEVEMENT
Our results indicate that effects of the CDP program, as well as students’ devel-oping sense of community, on students’ academic development have not as yetbeen broadly realized (although, as stated above, the achievement data in thisstudy are problematic). The fact that gains were achieved in two schools in whichlocal educational reform mandates and a state-developed performance-based as-sessment were both consistent with CDP’s goals and emphases leads to some hopethat CDP can lead to gains in the intellectual realm, given proper fit with localgoals and assessments. Inasmuch as the statewide reform and the same assess-ment were being experienced by all schools in that district, including the twoprogram and two comparison schools in this project, it is reasonable to attributethe achievement differences to the experience of the program. The reform hadmandated understanding-based goals but had not provided recommended meansfor achieving them. Many of the program teachers in this district felt that the CDPliterature and cooperative learning activities that emphasized understanding helpedthem to realize their state’s mandated goals. This contrasted with the situations inother districts which still emphasized assessing traditional goals with standardizedachievement tests.
While the current findings did show academic motivation to be enhanced in theschools that showed positive change consistent with implementation, this translatedinto academic gains in only two schools. One possible explanation is that a changein motivation must precede a change in academic performance and that we did notallow enough time for the second phase of this process to become evident. The factthat the follow-up results are showing positive effects on student achievement inmiddle school (see Note 11) is consistent with this hypothesis.

EFFECTS OF CDP 39
7.7. ENHANCING THE SCHOOL EXPERIENCE
In the CDP, children ideally become integrated into a school community in whichthe members are mutually supportive, concerned about one another’s welfare, andinterested in contributing to the life of the community. These and our earlier find-ings have shown that children in schools that are making significant progress inimplementing CDP do see their classrooms and schools as caring communities andthat such perceptions correlate with and help to promote advances in their personaland social development. The findings are thus consistent with the hypothesis thatthe sense of community reflects a commitment to school and the values promotedtherein (note the strong relationships between sense of community and both likingfor school and enjoyment of class) and that this commitment translates into variouspositive student outcomes. The motivating effect of positive group membership isundoubtedly a central factor in this process. Students whose group-related needsare met by participating in, and contributing to, a cohesive and supportive groupbecome emotionally bonded with the group and motivated to abide by the group’snorms, goals, and values. (For a related discussion of the importance of socialbonding in school prevention programs, see Hawkins & Weis, 1985).
The major finding of this study, as well as our earlier ones, is that when teach-ers in a school do make widespread positive movement toward implementationof CDP, their students show progress in several areas. Most centrally, students’sense of the school as a community is enhanced. Along with this, and perhapslargely due to it, there are gains in student prosocial development, academic mo-tivation and attitudes, and feelings of personal well-being and satisfaction. Schoolfor these students becomes a more supportive and responsive environment, capableof stimulating their growth in each of these areas.
Endnotes
1. We used this approach to maximize the likelihood of achieving effective programimplementation. While random selection from among equivalently inclined anddemographically similar schools would have been neater methodologically, we feltthat maximizing the likelihood of effective program implementation had to be thetop priority, and that subsequent matching could make the schools equivalent, atleast with respect to student characteristics.
2. Jane Deer conducted all observer training in each district each year and alsohelped to develop and refine the observation system. After the first year, ‘observersupervisors’ in each district aided in the training and monitoring of the observers.
3. The last two of the scales assessed at all grades shown in Table III werederived from the class observations rather than the student questionnaires. In ad-dition, some variables assessed at fifth and sixth grades only are not shown. Sev-eral referred to problem behavior measures that have been reported in a separ-ate paper (Battistich, Schaps, Watson, Solomon, & Lewis, in press), while one

40 DANIEL SOLOMON ET AL.
was a measure of reading comprehension that was discarded due to questionablevalidity.
4. Internal consistency (alpha) coefficients were computed each year. Becausethe values were very similar from year to year, we present only the mean values forthe four years for all scales.
5. This and a parallel measure of intrinsic prosocial motivation were combin-ations of separate measures of intrinsic and extrinsic motivation – the ratio of theformer to the sum of the two. Thus, overall internal consistency measures couldnot be computed. Mean alpha coefficients for the component measures were 0.76for intrinsic academic motivation, 0.64 for extrinsic academic motivation, 0.71 forintrinsic prosocial motivation, and 0.64 for extrinsic prosocial motivation.
6. Because this index was a combination of four differentially weighted sub-scores, a measure of internal consistency of the overall scale could not be calcu-lated.
7. A preferable analytic approach would be multi-level regression, which takesthe clustering of students within schools into account. Unfortunately, with a sampleof only 24 schools, statistical power to detect the statusx year interaction effectsof interest here is quite poor; and with the reduced sample of five program and fivecomparison schools, it is virtually nonexistent (Bassiri, 1988; Snijders & Bosker,1993).
8. Given that we conducted independent tests of program effects on each of28 outcome variables, the probability of a Type I error in one or more of thesetests is quite large (it is slightly greater than 0.75 forp = 0.05, and almost 1.0for p = 0.10). Using the Bonferroni inequality, maintaining a probability of nolarger than 0.05 of one or more Type I errors across 28 tests would require settingp = 0.002 for each test. However, as Hays (1981) notes, the Bonferroni correctionis ‘intolerably conservative’ (p. 435) when the number of tests is large, as in thepresent case. A reader concerned about Type I errors might adoptp = 0.01 whenconsidering which differences in Table II are ‘statistically significant’. However,it should also be kept in mind that there are no significant differences favoringcomparison students in Table II, even atp < 0.10, and ignoring significance levels,25 of the 28 effects (89%) favor program students. The probability of 25 of the 28tests favoring one group is< 0.0001 (sign test).
9. Because the state tests used by this district were just developed at the startof this project, individual-level data were not available until the second year (i.e.,the first program year), thus providing us with no data for the baseline year. Forthis reason, plus the fact that the prior year standardized achievement scores werequite similar between program and comparison schools in this district (see Table I,District 3), we analyzed within-year differences rather than change scores for theseachievement data in this district.
10. It is because these analyses focused on individual teachers’ implementa-tion changes that all 24 schools were included, as contrasted with the direct pro-gram effects analyses, which were limited to schools that had made significant

EFFECTS OF CDP 41
implementation progress as a whole. Individual teachers who made significantprogress were spread over all the program schools (and were also found in somecomparison schools); we predicted that students in their classrooms would benefitaccordingly.
11. We also conducted individual student level analyses for the variables thatwere repeated across grades with two longitudinal cohorts of students. The resultswith these analyses confirmed those obtained with the classroom level analyses.
12. An important issue is the degree to which the effects of an educationalprogram persist after the conclusion of students’ experience with the program.We are investigating this issue through a continuation study, currently in the finalyear of data collection, which is following students from three ‘high-risk’ districts(Districts 2, 3, and 4) through middle school. Students from six pairs of formerprogram and comparison schools, including three of the program schools that madesignificant gains in implementation, are being assessed. Preliminary results indic-ate generally positive results for students from the six former program schools(vis-α-vis their comparison matches) and more widespread and stronger positiveresults for those from the high-change schools. Students from the latter group ofschools scored significantly better than those from the matched comparison schoolswith respect to various school-related attitudes and perceptions (e.g., educationalexpectations), some personal characteristics (e.g., loneliness, self-esteem), involve-ment in positive group activities, involvement in problem behaviors (e.g., seriousdelinquency), course grades, and achievement test scores. Detailed reports of thesefindings will be forthcoming.
Acknowledgements
The project described in this paper was funded by grants from the William andFlora Hewlett Foundation; the San Francisco Foundation; the Robert Wood John-son Foundation; the Danforth Foundation; the Stuart Foundations; the Pew Char-itable Trusts; the John D. and Catherine T. MacArthur Foundation; the AnnenbergFoundation; Spunk Fund, Inc.; the DeWitt Wallace-Reader’s Digest Fund, Inc.;Louise and Claude Rosenberg; the MacArthur/Spencer Professional Development,Research and Documentation Program; and the Center for Substance Abuse Pre-vention, U.S. Department of Health and Human Services. The views expressedin this paper are those of the authors and not necessarily of the funders. We aregrateful to the many educators, students, and colleagues who cooperated with uson this project.

42 DANIEL SOLOMON ET AL.
Appendix: Scales and sample items
Instrument and scale Sample items
Student questionnaire
Amount of reading How often outside of school do you read books
that you picked yourself?
Enjoyment of reading How do you feel about reading?
Enjoyment of class My classroom is a fun place to be
What we do in class is a waste of time (R)
Liking for school I like my school
I wish I could go to a different school (R)
School as community
(Combination of
following
three subscales)
Classroom Students in my class help each other learn
supportiveness Students in my class just look out for
themselves (R)
Student autonomy In my class the teacher and students decide
and influence in together what the rules will be
classroom In my class students have a say in deciding
what goes on
School Students at this school really care about each other
supportiveness My school is like a family.
Sense of personal How sure are you that things will work out well for
efficacy you when:
you are having trouble with your school work?
you have to give a talk in class?
Sense of personal I am the one who decides what happens to me.
autonomy I don’t have any choice about most of the things
I do (R)
Task orientation The times I feel best are when:
I learn something really interesting
I solve a problem by working hard
Ego orientation The times I feel best are when:

EFFECTS OF CDP 43
Appendix (continued)
Instrument and scale Sample items
I do better work than other students
I get a higher grade than other students
Work avoidance The times I feel best are when:
orientation all the work is easy
I don’t have to work hard.
Concern for others Everybody has enough problems of their own without
worrying about other people’s problems
When I hear about people who are sad or lonely,
I want to do something to help.
Conflict resolution Four vignettes describing interpersonal conflicts,
two with boys, two with girls, e.g.:
Suppose you put your pencil down for a minute
and a boy in your class comes along and takes it.
You ask him to give it back but he says "no."
What would you do next?
A. Take the pencil away from him
B. Tell him that you really need your pencil to
finish your work
C. Ask the teacher to make him give it back
D. Help him try to find another pencil, or tell
him he can use yours after you are finished
with it
Democratic values Four kids are making up some rules for a new
game
Three of them agree on a rule, but the fourth one
doesn’t like it. Since the others agree, he should
not say anything about it. (R)
The best students in a class should be the ones to
decide which new project the class should start (R)
Altruistic behavior Since the start of school this year:
I helped someone who was hurt
I stopped someone from hurting another child

44 DANIEL SOLOMON ET AL.
Appendix (continued)
Instrument and scale Sample items
Preference for I would rather:
challenging tasks work a puzzle I know I can do (or)
work a hard puzzle I’ve never done before
play a game that is hard for me to win (or)
play a game that is easy for me to win
Intrinsic academic
motivation (ratio of two
following scales)
Intrinsic academic When you (do academic work) why do you
usually do it?
Because the work is interesting to me
Because I want to learn as much as I can
Extrinsic academic When you (do academic work) why do you
usually do it?
Because I want to get good grades
Because I’ll get in trouble if I don’t
Intrinsic prosocial
motivation (ratio of two
following scales)
Intrinsic prosocial When you (act prosocially) why do you
usually do it?
Because I am concerned about the other person
Because I would feel bad if I didn’t
Extrinsic prosocial When you (act prosocially) why do you usually
do it?
So I will get help in return
Because I want to get a reward or praise from
the teacher
Attitude toward When building a new playground in a park, would
outgroups you want to work with:
people who look different?
kids from other neighborhoods?

EFFECTS OF CDP 45
Appendix (continued)
Instrument and scale Sample items
Academic self-esteem I am doing a good job in school
I am not a very good student (R)
Global self-esteem I like myself
I wish I were different from the way I am (R)
Social competence I can always cheer up someone who is feeling sad
I’m good at finding fair ways to solve problems
Loneliness in school I feel alone at school
It’s hard for me to make friends at school
Trust in and respect for The teachers here always keep their promises
teachers The teachers here always try to be fair
Enjoyment of helping I always enjoy helping other students in my class
others learn I think it’s boring to try to help someone learn
something (R)
Inductive reasoning skill Series of questions about implications of various
clues for solving mystery of what happened to
missing crew exploring a planet
Educational aspirations How far would you like to go in school?
Educational How far do you think you will go in school?
expectations
Student behavior scales
from classroom obser-
vations
Positive behavior Student helpfulness
among students Student friendliness
Engagement in class Student active participation in learning
activities Student on-task behavior
Student enthusiasm
Classroom observation
scales included in imple-
mentation index

46 DANIEL SOLOMON ET AL.
Appendix (continued)
Instrument and scale Sample items
Promotion of student Teacher gives students choice of activities
autonomy, freedom, Students participate in planning
and influence
Use of cooperative Teacher encourages helping and cooperation
learning activities % of periods with cooperative groups
% of periods with structured cooperative activity
Promotion of social Teacher mentions, discusses, encourages
understanding and understanding of others’ motives, feelings,
prosocial values perspectives
Teacher reads, uses media, assigns/leads activity
focused on prosocial values
Level of personal Teacher makes effort to relate personally to students
relationship between Teacher shows interest in student feelings about
teacher and students tasks
Minimization of Teacher uses or promises rewards/grades/points
external control Teacher uses or threatens punishment
Pervasiveness of teacher’s control over students
Emphasis on intrinsic Teacher talks about the inherent interest of
motivation academic activities
Teacher talks about relevance of academic
task/activity to other or long-range goals
Elicitation of student Teacher asks for inferences/hypotheses
thinking and active Teacher draws connections between students’ ideas
discussion Teacher encourages students to follow-up on
each others’ ideas
Teacher questionnaire
scales in implementation
index
Optimism about There is really very little I can do to insure that
students’ learning most of my students achieve at a high level (R)
potential If students aren’t given the right values and habits at
home, there is little that schools can do for them (R)

EFFECTS OF CDP 47
Appendix (continued)
Instrument and scale Sample items
Trust in students Students can be trusted to correct their own tests
Students can be trusted to work together
without supervision
Belief in importance of Students learn best when they are involved in
student self-direction, exploring things, inventing and trying out their
exploration, own ways of doing things
collaboration, and Students need to talk about their ideas in order to
understanding really learn
Students are strongly motivated by the need to
understand things for themselves
Hearing each others’ ideas is essential for student
learning
Belief in promoting Responses about appropriateness of alternative
student autonomy ways for teachers to handle four described student
problems
References
Asher, Steven R., Hymel, Shelley, & Renshaw, Peter D. (1984). Loneliness in children.ChildDevelopment, 55, 1456–1464.
Bassiri, Dina (1988). Large and small sample properties of maximum likelihood estimates for thehierarchical linear model, Paper presented at the annual meeting of the American EducationalResearch Association, New Orleans.
Battistich, Victor, Schaps, Eric, Watson, Marilyn, Solomon, Daniel, & Lewis, Catherine (In press).Effects of the Child Development Project on students’ drug use and other problem behaviors.Journal of Primary Prevention.
Battistich, Victor, Solomon, Daniel, & Delucchi, Kevin (1990). Effects of a program to en-hance prosocial development on adjustment, Paper presented at annual meeting of AmericanPsychological Association, Boston.
Battistich, Victor, Solomon, Daniel, Kim, Dongil, Watson, Marilyn, & Schaps, Eric (1995). Schoolsas communities, poverty levels of student populations, and students’ attitudes, motives, andperformance: A multilevel analysis.American Educational Research Journal, 32(3), 627–658.
Battistich, Victor, Solomon, Daniel, Watson, Marilyn, & Schaps, Eric (1997). Caring schoolcommunities.Educational Psychologist, 32(3), 137–151.
Battistich, Victor, Solomon, Daniel, Watson, Marilyn, Solomon, Judith, & Schaps, Eric (1989).Effects of an elementary school program to enhance prosocial behavior on children’s so-cial problem-solving skills and strategies.Journal of Applied Developmental Psychology, 10,147–169.
Battistich, Victor, Watson, Marilyn, Solomon, Daniel, Schaps, Eric, & Solomon, Judith (1991).The Child Development Project: A comprehensive program for the development of prosocial

48 DANIEL SOLOMON ET AL.
character. In William M. Kurtines & Jacob L. Gewirtz (Eds.),Handbook of moral behavior anddevelopment: Application(Vol. 3). Hillsdale, NJ: Erlbaum, pp. 1–34.
Baumeister, Roy F. & Leary, Mark R. (1995). The need to belong: Desire for interpersonalattachments as a fundamental human motivation.Psychological Bulletin, 117(3), 497–529.
Bentler, Peter M. (1992).EQS. Structural equations program manual. Los Angeles: BMDPStatistical Software.
Bryk, Anthony S. & Driscoll, Mary E. (1988).The school as community: Theoretical foundations,contextual influences, and consequences for students and teachers. Madison: National Center onEffective Secondary Schools, University of Wisconsin.
Center for Research on the Context of Secondary School Teaching (1990).Teacher survey. Stanford:School of Education, Stanford University.
Clement, Paul W. (1976). A formula for computing inter-observer agreement.Psychological Reports,39, 257–258.
Comer, James P. (1980).School power. New York: Macmillan.Connell, James P. (1990). Context, self, and action: A motivational analysis of self-system processes
across the life span. In Dante Ciccheti & Marjorie Beeghly (Eds.),The self in transition: Infancyto childhood. Chicago: The University of Chicago Press, pp. 61–97.
Connell, James P. & Ryan, Richard (1987). A developmental theory of motivation in the classroom.Teacher Education Quarterly, 11, 64–77.
Connell, James P. & Wellborn, James G. (1991). Competence, autonomy, and relatedness: A mo-tivational analysis of self-system processes. In Megan Gunnar & Alan Sroufe (Eds.),Minnesotasymposium on child psychology(Vol. 22). Hillsdale, NJ: Erlbaum, pp. 43–77.
Cooley, William W. & Lohnes, Paul R. (1976).Evaluation research in education: Theory, principles,and practices. New York: Irvington.
Cowen, Emory L., Work, William C., Hightower, A. Dirk, Wyman, Peter A., Parker, Gayle R., &Lotyczewski, Bohdan S. (1991). Toward the development of a measure of perceived self-efficacyin children.Journal of Clinical Child Psychology, 20, 169–178.
deCharms, Richard (1984). Motivation enhancement in educational settings. In Russell E. Ames &Carol Ames (Eds.),Motivation in education(Vol. 1). New York: Academic Press, pp. 275–310.
Deci, Edward L. & Ryan, Richard M. (1985).Intrinsic motivation and self-determination in humanbehavior. New York: Plenum.
Deci, Edward L., Schwartz, Allan J., Sheinman, Louise, & Ryan, Richard M. (1981). An instru-ment to assess adults’ orientation toward control versus autonomy with children: Reflections onintrinsic motivation and perceived competence.Journal of Educational Psychology, 73, 642–650.
Deer, Jane, Solomon, Judith, Watson, Marilyn, & Solomon, Daniel (1988). Assessment of children’smotives, attitudes and perceptions.Moral Education Forum, 13, 18–34, 37.
Developmental Studies Center (1998).The Child Development Project: Summary of the project andfindings from three evaluation studies. Oakland, CA: Author.
Ennis, Robert H. & Millman, Jason (1985).Cornell critical thinking tests. Pacific Grove, CA:Midwest Publications.
Fraser, Barry J. (1991). Two decades of classroom environment research. In Barry J. Fraser & Her-bert J. Walberg (Eds.),Educational environments: Evaluation, antecedents and consequences.Oxford: Pergamon, pp. 3–27.
Fullan, Michael & Stiegelbauer, Suzanne (1991).The new meaning of educational change. NewYork: Teachers College Press.
Gardner, John (1992).Building community. Washington, DC: Independent Sector.Hallinger, Philip & Murphy, Joseph F. (1986). The social context of effective schools.American
Journal of Education, 94, 328–355.Hawkins, J. David & Weis, Joseph G. (1985). The social development model: An integrated approach
to delinquency prevention.Journal of Primary Prevention, 6, 73–79.Hays, William L. (1981).Statistics(3rd ed.). New York: CBS College Publishing.

EFFECTS OF CDP 49
Jackson, Philip W., Boostrom, Robert E., & Hansen, David T. (1993).The moral life of schools. SanFrancisco: Jossey-Bass.
Johnson, David W. & Johnson, Roger T. (1989).Cooperation and competition: Theory and research.Edina, MN: Interaction Book Company.
Johnson, David W., Maruyama, Geoffrey, Johnson, Roger T., Nelson, Deborah, & Skon, Linda(1981). Effects of cooperative, competitive, and individualistic goal structures on achievement:A meta-analysis.Psychological Bulletin, 89, 47–62.
Johnson, David W., Skon, Linda, & Johnson, Roger T. (1980). The effects of cooperative, competitiveand individualistic goal structures on student achievement on different types of tasks.AmericanEducational Research Journal, 17, 83–93.
Kendzior, Sylvia & Dasho, Stefan (1996, April). A model for deep, long-term change in teachers’ be-liefs and practices, Paper presented at the annual meeting of the American Educational ResearchAssociation, San Francisco.
Lepper, Mark (1983). Social control processes, attributions of motivation, and the internalization ofsocial values. In E. Tory Higgins, Diane N. Ruble, & Willard W. Hartup (Eds.),Social cognitionand social development: A sociocultural perspective. New York: Cambridge University Press,pp. 294–330.
Lewis, Catherine, Battistich, Victor, Solomon, Daniel, Watson, Marilyn, & Schaps, Eric (1999).Whatmakes reform work? The fate of a comprehensive school reform in six districts. Unpublishedmanuscript.
Lewis, Catherine, Watson, Marilyn, & Schaps, Eric (1999). Recapturing education’s full mis-sion: Educating for social, ethical, and intellectual development. In Charles Reigeluth (Ed.),Instructional-design theories and models: A new paradigm of instructional theory. Mahwah,NJ: Lawrence Erlbaum Associates, pp. 511–536.
Lightfoot, Sarah Lawrence (1984).The good high school. New York: Basic Books.Lipsitz, Joan (1984).Successful schools for young adolescents. New Brunswick, NJ: Transaction.Midgley, Carol, Feldlaufer, Helen, & Eccles, Jacqueline S. (1988). The transition to junior high
school: Beliefs of pre- and post-transition teachers.Journal of Youth and Adolescence, 17, 543–562.
Miles, Matthew B. (1964).Innovation in education. New York: Teachers College Press.Minuchin, Patricia, Biber, Barbara, Shapiro, Edward, & Zimiles, Herbert (1969).The psychological
impact of school experience. New York: Basic Books.Nicholls, John G. (1989).The competitive ethos and democratic education. Cambridge,MA: Harvard
University Press.Noddings, Nel (1992).The challenge to care in schools: An alternative approach to education. New
York: Teachers College Press.Noddings, Nel (1994). Conversation as moral education.Journal of Moral Education, 23, 107–118.Oser, Fritz K. (1986). Moral education and values education: The discourse perspective. In Merlin C.
Wittrock (Ed.),Handbook of research on teaching(3rd ed.). New York: Macmillan PublishingCompany, pp. 917–941.
Rushton, J. Philippe, Chrisjohn, Roland D., & Fekken, Cynthia (1981). The altruistic personality andthe self-report altruism scale.Personality and Individual Differences, 2, 293–302.
Sarason, Seymour (1993).The case for change: Rethinking the preparation of educators. SanFrancisco: Jossey-Bass.
Serow, Robert & Solomon, Daniel (1979). Classroom climates and students’ intergroup behavior.Journal of Educational Psychology, 71, 669–676.
Sharan, Shlomo (1980). Cooperative learning in small groups: Recent methods and effects onachievement, attitudes and ethnic relations.Review of Educational Research, 50, 241–271.
Sharan, Shlomo (Ed.). (1990).Cooperative learning: Theory and research. New York: Praeger.Sharan, Yael & Sharan, Shlomo (1992).Expanding cooperative learning through group investiga-
tion. New York: Teachers College Press.

50 DANIEL SOLOMON ET AL.
Shouse, Roger C. (1996). Academic press and sense of community: Conflict, congruence, andimplications for student achievement.Social Psychology of Education, 1, 47–68.
Slavin, Robert E. (1983).Cooperative learning. New York: Longman.Slavin, Robert E. (1990).Cooperative learning. Theory, research, and practice. Englewood Cliffs,
NJ: Prentice-Hall.Snijders, Tom A. & Bosker, Roel J. (1993). Standard errors and sampling sizes for two-level research.
Journal of Educational Statistics, 18, 237–261.Solomon, Daniel, Ali, Faizunisa A., Kfir, Drora, Houlihan, Kevin A., & Yaeger, Judy (1972).
The development of democratic values and behavior among Mexican-American children.ChildDevelopment, 43, 625–638.
Solomon, Daniel, Battistich, Victor, Kim, Dongil, & Watson, Marilyn (1997). Teacher practices as-sociated with students’ sense of the classroom as a community.Social Psychology of Education,1(3), 235–267.
Solomon, Daniel, Battistich, Victor, & Watson, Marilyn (1993).A longitudinal investigation of theeffects of a school intervention program on children’s social development, Paper presented at theannual meeting of Society for Research in Child Development, New Orleans.
Solomon, Daniel & Kendall, Arthur J. (1979).Children in classrooms: An investigation of person-environment interaction. New York: Praeger.
Solomon, Daniel, Watson, Marilyn, & Battistich, Victor (In press). Effects of teaching and school-ing on moral/prosocial development. In Virginia Richardson (Ed.),Handbook of research onteaching(4th ed.). Washington, DC: American Educational Research Association.
Solomon, Daniel, Watson, Marilyn, Battistich, Victor, Schaps, Eric, & Delucchi, Kevin (1992). Cre-ating a caring community: Educational practices that promote children’s prosocial development.In Fritz K. Oser, Andreas Dick, & Jean-Luc Patry (Eds.),Effective and responsible teaching: Thenew synthesis. San Francisco: Jossey-Bass, pp. 383–396.
Solomon, Daniel, Watson, Marilyn, Battistich, Victor, Schaps, Eric, & Delucchi, Kevin (1996).Creating classrooms that students experience as communities.American Journal of CommunityPsychology, 24(6), 719–748.
Solomon, Daniel, Watson, Marilyn, Delucchi, Kevin, Schaps, Eric, & Battistich, Victor (1988). En-hancing children’s prosocial behavior in the classroom.American Educational Research Journal,25(3), 527–554.
Solomon, Daniel, Watson, Marilyn, Schaps, Eric, Battistich, Victor, & Solomon, Judith (1990).Cooperative learning as part of a comprehensive program designed to promote prosocial develop-ment. In Shlomo Sharan (Ed.).Cooperative learning: Theory and research. New York: Praeger,pp. 231–260.
Watson, Marilyn (1996, April).Giving content to restructuring: A social, ethical and intellectualagenda for elementary education, Paper presented at annual meeting of American EducationalResearch Association, San Francisco.
Watson, Marilyn, Kendzior, Sylvia, Dasho, Stefan, Rutherford, Stanley, & Solomon, Daniel (1998).A social constructivist approach to cooperative learning and staff development: Ideas from theChild Development Project. In Celeste M. Brody & Neil Davidson (Eds.),Professional devel-opment for cooperative learning: Issues and approaches. Albany: State University of New YorkPress, pp. 147–168.
Watson, Marilyn, Solomon, Daniel, Battistich, Victor, Schaps, Eric, & Solomon, Judith (1989). TheChild Development Project: Combining traditional and developmental approaches to values edu-cation. In Larry Nucci (Ed.),Moral development and character education: A dialogue. Berkeley:McCutchan, pp. 51–92.
Wehlage, Gary G., Rutter, Robert A., Smith, Gregory A., Lesko, Nancy, & Fernandez, Ricardo R.(1989).Reducing the risk: Schools as communities of support. New York: Falmer.
Weiner, Bernard & Kukla, Andy (1970). An attributional analysis of achievement motivation.Journalof Personality and Social Psychology, 15, 1–20.

EFFECTS OF CDP 51
Zeichner, Kenneth (1978). Group membership in the elementary school classroom.Journal ofEducational Psychology, 70, 237–244.
Biographical Notes
Daniel Solomonwas Director of Research at the Developmental Studies Centeruntil retiring in 1997. He currently consults in social and educational research andevaluation. He received a Ph.D. degree from the University of Michigan in SocialPsychology in 1960. Research interests include social and ethical development,motivation, classroom and school environments, and small-group processes.
Victor Battistich is Deputy Director of Research at the Developmental StudiesCenter. He received his Ph.D. degree in personality-social psychology from MichiganState University in 1979. He was previously an Assistant Professor of Psychologyat Cleveland State University. His research interests are in personality, social de-velopment, and the social context of education.
Marilyn Watson is Program Director at the Developmental Studies Center. Shereceived her Ph.D. in Education from the University of California at Berkeley in1975. Before coming to the Center, she was Assistant Professor of Education andDirector of the Children’s School at Mills College, Oakland, California. Her re-search interests include child development, social constructivist education, teachereducation, and moral/social development.
Eric Schapsis President, Developmental Studies Center, San Ramon, California,and Project Director of the Child Development Project. He received a Ph.D. de-gree in Social Psychology from Northwestern University in 1970. His previousinstitutional affiliations were with the Pacific Institute for Research and Evaluationand the University of Chicago. Research interests include educational reform andprevention of problem behaviors.
Catherine Lewis received her Ph.D. in Developmental Psychology from StanfordUniversity in 1979 and is currently a member of the Education Department atMills College in Oakland, California. She directed the formative evaluation of theChild Development Project and has research interests in prosocial development,educational innovation, and Japanese elementary education. She is the author ofEducating Hearts and Minds: Reflections on Japanese Preschool and ElementaryEducation.