a single-site model for divalent transition and heavy metal
TRANSCRIPT

Journal of Colloid and Interface Science 253, 329–352 (2002)doi:10.1006/jcis.2002.8529
A Single-Site Model for Divalent Transition and Heavy Metal Adsorptionover a Range of Metal Concentrations
Louise J. Criscenti and Dimitri A. Sverjensky1
Earth and Planetary Sciences Department, The Johns Hopkins University, Baltimore, Maryland 21218
Received February 5, 2001; accepted June 14, 2002; published online August 27, 2002
Metal adsorption data over a range of surface coverages typi-cally are characterized by curvilinear metal adsorption isotherms.These isotherms generally have a slope of 1 at low surface coverageand a shallower slope at higher surface coverages. The curvatureof metal adsorption isotherms with increasing surface coverage isfrequently interpreted in terms of sequential adsorption onto dif-ferent types of surface sites, multinuclear surface complexation, ornonideality of metal adsorption. We demonstrate that the curvatureof metal adsorption isotherms can also be attributed to changes insurface charge and potential that depend on the predominant typeof metal surface complex. A single-site extended triple-layer modelis used to reinterpret previously studied metal adsorption isothermsand pH edges for a wide variety of metals (Cd2+, Co2+, Cu2+, Pb2+,and Zn2+) and solids (goethite, hydrous ferric oxide, corundum, andmagnetite) in different electrolyte solutions (NaNO3 and NaClO4).Only metal adsorption on ferrihydrite at very low surface cover-ages is not consistent with the single-site triple-layer model. Thisdiscrepancy might be explained if ferrihydrite is in fact not a singlephase but a mixture of two or more phases. Metal surface cov-erages ranging from 10−4 to 10.2 mmol/m2 on the other mineralscan be accounted for with a single-site extended triple-layer modelif appropriate metal adsorption reactions are chosen. In addition,several examples suggest that, within the context of the model, sur-face complexation schemes can be established that describe metaladsorption over both a wide range of surface coverage and a widerange of ionic strength. C© 2002 Elsevier Science (USA)
Key Words: adsorption; metal; oxide; triple-layer model;isotherm.
INTRODUCTION
Metal adsorption from aqueous solution onto solid surfacesdepends on both the nature of the solid phase and the solu-tion composition including the background electrolyte, the ionicstrength, the pH, and metal concentration (1–5). In this study, thetriple-layer model (TLM) (6–10) has been selected to investigatemetal adsorption onto oxide surfaces because it can account formetal adsorption over the full scope of the compositional space
1 To whom correspondence should be addressed at the Earth and PlanetarySciences Department, The Johns Hopkins University, 3400 N. Charles St., OlinHall, Baltimore, MD 21218. E-mail: [email protected].
32
defined by these variables. In a previous paper (5), we investi-gated transition and heavy metal adsorption onto oxide surfacesover a wide range of ionic strengths using the single-site TLMin combination with values for surface-site densities, surfaceprotonation constants, adsorption constants for the electrolyteanions and cations, and capacitances that have been demon-strated to be functions of specific solid phase properties (i.e.,the dielectric constant and the Pauling bond strength) (11–14).Because the majority of the TLM parameters have been estab-lished in a systematic manner, the number of adjustable modelparameters is reduced to the reaction stoichiometries and equi-librium constants necessary to describe metal adsorption. Fromthis previous study, we found that surface complexes involvinga transition or heavy metal in combination with the electrolyteanion frequently describes the majority of metal adsorption overa range of ionic strengths.
In this paper, we continue to develop a comprehensive sur-face speciation scheme for metal adsorption onto oxide surfacesusing a single-site TLM by extending this model to accountfor adsorption over a range of metal concentrations and surfacecoverages. Metal adsorption data over a range of surface cover-age are frequently collected at a constant pH and plotted as thelogarithms of the equilibrium concentrations of adsorbed metalversus aqueous metal. These data describe curvilinear isothermsthat have received considerable attention (e.g., 2, 15–24). Typ-ically, the isotherms have a slope of 1 at extremely low metalconcentrations and a slope of <1 at higher metal concentrationsthat give rise to maximum surface coverages well below the sur-face coverage for one monolayer. The slopes of 1 suggest idealmetal partitioning between the solution and the surface, whileslopes of <1 under these conditions have been accounted for inseveral ways.
Many investigators (e.g., 2, 15, 19, 21, 24–31) have proposedthat metal adsorption isotherms with slopes of <1 are a resultof adsorption to more than one site type. Metal adsorption withincreasing metal concentration occurs progressively onto twoor more different types of surface sites. For example, Dzombakand Morel (2, 27) proposed the two-site diffuse double-layermodel (DDLM) for the adsorption of metal cations onto hy-drous ferric oxide (HFO; Fe2O3 · H2O) based in part on the datafor cadmium (Cd2+) adsorption shown in Fig. 1. The two-siteisotherm depicted in Fig. 1 has a slope of 1.0 at log (Cd2+
aq )
9 0021-9797/02 $35.00C© 2002 Elsevier Science (USA)
All rights reserved.

330 CRISCENTI AND
FIG. 1. Isotherm for equilibrium sorption of Cd2+ on hydrous ferric oxide atpH 7.50. This diagram is a modified version of Fig. 1 in Dzombak and Morel (27).The adsorption isotherm is described by a two-site model, in which each surfacesite exhibits Langmuir behavior. At low Cd2+ concentrations, proportional (1 : 1)adsorption can be modeled using one type of surface site with a maximum sitedensity of 10−2.3 mol/mol that is suggested by a change in isotherm slope. Athigher Cd2+ concentrations (10−6 to 10−3 M), the shallower isotherm slope canbe described by a two-site model where the density of the second type of surfacesite is indicated to be 0.2 mol/mol by the maximum reached in Cd2+ adsorption.
(mol/L) ≤−6.5, corresponding to the filling of the high-energysite 1 (maximum occupancy 0.005 mol/mol Fe). For −5.5 ≤log (Cd2+
aq ) (mol/L) ≤−3.0, the isotherm has a slope of <1.0,corresponding to the filling of the low-energy site 2 (maximumoccupancy 0.2 mol/mol of Fe). These site densities were widelyapplied to the adsorption of many divalent metals onto HFO (2).
However, application of the DDLM to uranium (UO2+2 ) ad-
sorption on HFO over a very wide range of pH, ionic strength,and metal concentrations resulted in surface site concentrationsof 0.0018 and 0.873 mol/mol of Fe (32, 33), which are substan-tially different from those selected by Dzombak and Morel (2).These differences underscore the fact that the nature of the high-energy sites on HFO is unclear. The very low abundance of the“high-energy” sites has been attributed to the role of lattice de-fects, crystal edges, dislocations, or surface sites on the smallestcrystallographic faces (29, 34–36). If the concentrations of theseanomalies varied from one HFO to another, it would explainthe low and variable apparent abundances of the high-energysites. However, intensive X-ray and extended X-ray absorptionfine-structure spectroscopy (EXAFS) investigations of ferrihy-drite have established that it is a mixture of Fe2O3 · H2O andminor amounts of Fe2O3 (37–39). This suggests an alternativeexplanation for the low and variable apparent abundances of thehigh-energy sites. If HFO is a physical mixture of two solids,the high-energy sites may reflect the presence of minor amountsof phases such as Fe2O3 mixed with Fe2O3 · H2O. This inter-pretation is supported by studies of the adsorption of calcium(Ca2+) and copper (Cu2+) with organic ligands onto goethite(40), and for the adsorption of divalent metals onto goethite in
general (41), which was described with a single-site version ofthe DDLM involving multiple surface species.SVERJENSKY
Other models that describe the curvilinear nature of metaladsorption isotherms by adsorption onto different types of sur-face sites account for different types of hydroxide groups at themineral surface based on the crystal structure (e.g., 30, 31, 42–44). In these models, different types and numbers of surfacesites are determined for each crystal face. Then, metal surfacecomplexes are selected to be consistent with EXAFS spectra.Although these models provide more accurate representationsof mineral surfaces, they require substantially more parametersand more detailed knowledge of the solid surface than single-sitemodels.
Both mineralogical and spectroscopic studies provide sub-stantial evidence that there are several different types of sitesavailable for adsorption on each mineral surface. For example,in a comprehensive study, Koretsky et al. (11) calculated thenumber and types of surface sites per unit of surface area onideal crystal surfaces for several oxide and silicate minerals. Inaddition, numerous spectroscopic studies (36, 45–49) suggestthat metal adsorption occurs onto different site types, formingdifferent types of metal surface complexes. For example, fromevidence of two cadmium–iron distances, Spadini et al. (36) con-cluded that both edge-sharing and corner-sharing Cd2+ surfacecomplexes form on goethite surfaces.
However, after making several assumptions regarding the re-activity of different site types, Venema et al. (30) modeled Cd2+
adsorption onto goethite using only two site types, each foundon a different crystal face. To confirm that the choice of surfacesites was appropriate, Venema et al. (30) conducted a second setof experiments with goethite crystals of a different geometry,expecting the affinity for Cd2+ to change due to the different pro-portion of crystal faces. This change was not observed, possiblydue to the presence of crystal imperfections. In addition, recentmolecular static studies on the surface sites of goethite suggestthat the difference in surface site types of an ideal goethite crys-tal does not give rise to large differences in surface protonationconstants (50). Other researchers (e.g., 24) have examined theoverall averaged effect of random surface heterogeneity on metaladsorption calculated by Stern layer models like the TLM andhave found that electrostatic effects and competition betweenthe metal and protons for the same surface sites strongly reducethe model sensitivity to surface heterogeneity. Because the mor-phology of the crystals used in experimental studies is frequentlynot well characterized, and there is no clear evidence that metaladsorption to the different site types found on idealized crystalsurfaces result in observable differences in bulk metal adsorptionbehavior, the use of a single-site surface complexation model fora range of surface coverages is investigated here.
Although decreases in isotherm slope may be attributed tometal adsorption onto different site types, Katz and Hayes (17)showed that a single-site triple-layer model (TLM) could beused to predict cobalt (Co2+) adsorption onto corundum over alimited range of surface coverages. With a single surface com-
2+ +
plex of Co (>SOCo ), they demonstrated that surface cover-ages from 0.04 to 2 mmol/m2 (0.05–10%) could be described.
ADSORPTION MODEL FOR RANG
However, higher surface coverages required a multinuclearsurface complexation approach (3, 18) or precipitation (51,52). Alternate mononuclear surface complexes of Co2+ (e.g.,>SOCoOH, >SOCoNO+
3 ) were not considered by Katz andHayes (17, 18). In contrast, other studies have suggested theformation of surface complexes involving both the metal cationand either the hydroxide or electrolyte anion (29, 51, 53–60).For example, it can be seen in Figs. 2A and 2B (61) that the cur-vature of isotherms calculated with a single-site diffuse-layermodel or triple-layer model will differ depending on the choiceof metal surface complex. For example, the isotherm calculatedusing the TLM and the reaction
>SOH + M2+aq + H2O ↔ >SOMOH + 2H+
aq , [1]
where >SOH represents a neutral surface site, M2+aq and H+
aqrepresent aqueous metal and hydronium ions in solution, re-spectively, and >SOMOH is a metal surface complex in whichMOH binds to the 0-plane of the triple-layer model, is analogousto the Langmuir isotherm because the electrostatic term that ac-counts for changes in surface potential and charge associatedwith this reaction is zero.
On the other hand, on a positively charged surface, theisotherm calculated using the reaction
>SOH + M2+aq ↔ >SO−–M2+ + H+
aq , [2]
where the metal, M2+aq , that binds to theβ-plane of the triple-layer
model2 exhibits a shallower slope with a substantially lowermaximum surface coverage because the electrostatic potentialterm associated with the complex is positive and opposes metaladsorption. Taken together, the results of Katz and Hayes (17)and Robertson and Leckie (61) suggest that a single-site triple-layer model with two or more metal surface complexes mightbe able to account for a significant range of surface coverages.Accordingly, the observed differences in adsorption isothermcurvature will reflect the formation of different types of surfacecomplexes. This approach might be termed a single-site mul-tispecies approach. Single-site multispecies models have beensuccessfully applied based on the constant capacitance modelfor the electric double layer (55, 56, 61–65) and for the DDLM(40, 42). In addition, several investigators have applied a single-site multispecies TLM to describe divalent metal adsorption(e.g., 10, 66). However, the extent of the applicability of asingle-site multispecies model based on the triple-layer model
of the mineral–water interface has not yet been investigatedadequately.2 The nomenclature for surface complexes within the context of the triple-layer model indicates whether an adsorbed species is located on the 0-plane orthe β-plane of the model. For adsorption onto the 0-plane of the model, thesurface site and the adsorbed species are simply combined to form the name ofthe surface complex (e.g., >SOMOH); for adsorption onto the β-plane, a dashis used (e.g., >SO−–M2+).
E OF METAL CONCENTRATIONS 331
FIG. 2. Calculated adsorption isotherm behavior using two different sur-face complexation models with different metal surface complexes. Metal con-centration adsorbed per gram of solid is plotted against the activity of the baremetal cation in solution. For this illustration, goethite and Cu2+ were usedby Robertson and Leckie (61) as a representative solid and metal (M2+). Thegoethite has a ZPC of 8.9 and a BET surface area of 49 m2/g. The calculationsare for Cu2+ adsorption from a 0.1 N NaClO4 solution at pH 6. Therefore,Cu2+ adsorption is occurring on a positively charged surface. (A) Diffuse-layermodel calculations with log K1 = 7.719 and log K2 = −10.088. (B) Triple-layermodel calculations with log K1 = 7.90, log K2 = −9.90, log KClO−
4= 8.334,
log KNa+ = −9.332, C1 = 1.2 F/m2, and C2 = 0.2 F/m2. These triple-layermodel parameters are those used by Robertson and Leckie (61) and differ fromthose used later in this study (see Tables 1 and 2). Equilibrium constants foreach surface complex were chosen such that for a total metal concentration of10−7 mol/g of goethite, the activity of aqueous metal in solution is 10−9.8 M afteradsorption. The adsorption isotherm calculated for the neutral surface complex>SOMOH exhibits Langmuir behavior in which metal adsorption is propor-tional to metal concentration in solution until the maximum surface site densityis approached. Adsorption isotherms calculated for other surface complexes ex-hibit shallower slopes and lower maximum surface coverages reflecting different
coulombic effects that result from the electrostatic potential terms associatedwith each type of surface complex.
332 CRISCENTI AND
In this study, the extended triple-layer model, or extendedTLM (14, 15), as implemented in the speciation/surface-complexation code, GEOSURF (67), is used to re-examine metaladsorption isotherms and pH edges that have previously beeninterpreted in terms of two-site, multinuclear surface precipi-tation or nonideal metal adsorption. The extended TLM wasselected because it accounts for the specific adsorption of theelectrolyte and can therefore be used to describe metal adsorp-tion over a wide range of ionic strengths (5) and electrolytetypes. This model was also selected because the extended TLMincorporates a systematic approach to establishing values fortriple-layer model parameters including the surface site density(11), inner-layer capacitance (C1), and surface equilibrium con-stants for protonation and electrolyte adsorption (12–14). Thispermits the development of a unique database of metal adsorp-tion reactions and equilibrium constants. However, this modelonly accounts for adsorption, not surface precipitation or absorp-tion; therefore, we use the term adsorption throughout this paperto describe both the metal uptake data and the modeling effortsregardless of surface coverage and experimental interpretation.
We first develop an adsorption isotherm equation within thecontext of a single-site extended triple-layer model to investi-gate the effects of surface charge and potential on calculatedisotherms. We then demonstrate that much of the existing metaladsorption data over a wide range of metal concentrations maybe described reasonably well using a single-site model. Finally,several examples are provided that demonstrate that adsorp-tion reactions and equilibrium constants established in Criscentiand Sverjensky (5) for metal adsorption over a range of ionicstrengths can also be used to predict adsorption over a rangeof metal concentrations in the same system. These results sug-gest that when appropriate metal surface complexes are selectedwithin the framework of the single-site extended TLM, the ad-sorption reactions and equilibrium constants established can beused to predict metal adsorption over wide ranges of both ionicstrengths and surface coverages.
RELATIONSHIP BETWEEN LANGMUIR BEHAVIORAND THE TRIPLE-LAYER MODEL
The Langmuir isotherm equation has frequently been appliedto solute adsorption from aqueous solution, although it derivesfrom studies of gas adsorption (68). In its simplest form, it de-scribes the distribution of a single species between an ideal so-lution and a mineral surface with a finite number of adsorptionsites. Charge interactions between aqueous ions and the mineralsurface are not considered. Assuming a total of two types of sur-face species, >SOH and >SOHM2+, the mass action expressionfor
>SOH + M2+aq ↔ >SOHM2+ [3]
is written as
2+
K = C>SOHMC>SOHCM2+aq
, [4]
SVERJENSKY
where K is an equilibrium constant and C j is the concentration(moles per liter of solution) of the j th species. The Langmuirisotherm equation can be written
C>SOHM2+ =NsCM2+
aqK
1 + CM2+aq
K, [5]
where Ns is the moles of surface sites per liter of solution (69,70). This equation can be rewritten in logarithmic form suchthat, for CM2+
aqK 1,
log C>SOHM2+ ≈ log CM2+aq
+ log Ns K , [6]
and for CM2+aq
K � 1, then
log C>SOHM2+ ≈ log Ns . [7]
These equations, [6] and [7], emphasize that, at low metalconcentrations, the slope of the Langmuir isotherm plotted aslog C>SOHM2+ versus log CM2+
aqis 1 and that the isotherm reaches
a maximum at log Ns . It is important to emphasize that theseLangmuir equations were developed without consideration ofthe surface charge at the mineral–water interface.
Within adsorption models that have been developed specif-ically to examine the interface between an aqueous solutionand a mineral surface, trace metal adsorption cannot be cal-culated without also accounting for other surface reactions suchas protonation and deprotonation. Adsorption equations of asimilar form to the Langmuir equation have been developedfor a primitive interfacial model (71) and for the diffuse layermodel (72). Surface complexation models, including the TLM,were developed for use in combination with aqueous specia-tion models in which divalent metals may be present in sev-eral forms in aqueous solution (e.g., M2+, MOH+, MCl+) andin which nonideal solution effects are determined through theuse of an activity coefficient expression. To derive an equa-tion for the concentration of metal adsorbed in a system con-taining one solid phase and one adsorbing metal species froman electrolyte solution, five reactions and equilibrium constantexpressions for the protonation and deprotonation of surfacesites, for the adsorption of the electrolyte anion and cation, andfor the adsorption of the metal cation must be considered inthe TLM:
>SOH + H+aq ↔ >SOH+
2 ; K1 = a>SOH+2
a>SOHaH+aq
10F�o/2.303RT
[8]
>SO− + H+aq ↔ >SOH ; K2 = a>SOH
a>SO−aH+aq
10F�o/2.303RT
[9]
>SOH + CA+aq ↔ >SO−–CA+ + H+
aq ;[10]a>SO−−CA+aH+
aq
KCA+ =a>SOHaCA+aq
10F(�β−�o)/2.303RT

ADSORPTION MODEL FOR RANG
>SOH + H+aq + AN−
aq ↔ >SOH+2 –AN−;
[11]KAN− = a>SOH+
2 −AN−
a>SOHaH+aq
aAN−aq
10F(�o−�β )/2.303RT
>SOH + M2+aq ↔ >SOHM2+;
[12]K>SOHM2+ = a>SOHM2+
a>SOHaM2+aq
102F�o/2.303RT ,
where ai represents the activity of the species i , CA+ and AN−
are the electrolyte cation and anion respectively, �o and �β rep-resent the electric potential on the 0-plane and the β-plane of theTLM respectively, F is Faraday’s constant, R is the universalgas constant, and T is temperature. The ratio of the activity coef-ficients for the surface species is assumed to be unity. Therefore,the activities of the surface species in the equilibrium expres-sions can be replaced by concentrations.
As suggested by Eqs. [8]–[12], the equilibrium constants inthe TLM are given by the product of a chemical mass action termand an electrostatic term that accounts for the energy requiredto move an ion from the bulk aqueous solution to the chargedmineral surface due to the electric field created by this surface.Because the TLM equilibrium constant expressions include thiselectrostatic term, they are distinctly different from equilibriumconstant expressions like Eq. [4] in the Langmuir adsorptionmodel.
The adsorption equation for M2+ in the TLM can be derivedby first rearranging Eq. [12]:
C>SOHM2+ = K>SOHM2+aM2+aq
10−2F�o/2.303RT C>SOH. [13]
Given that the total moles of surface sites per liter of solution,Ns , is the sum of the moles of each surface species present onthe mineral surface,
Ns = C>SOH + C>SO− + C>SOH+2
+ C>SO−–CA+
+ C>SOH+2 –AN− + C>SOHM2+ , [14]
Eq. [13] can be rewritten as
C>SOHM2+ = K>SOHM2+aM2+aq
10−2F�o/2.303RT
× (Ns − C>SO− − C>SOH+
2− C>SO−–CA+
− C>SOH+2 –AN− − C>SOHM2+
). [15]
This equation can be further rearranged so that the concentrationof adsorbed M2+ only appears on one side of the expression
C>SOHM2+ + K>SOHM2+aM2+aq
10−2F�o/2.303RT C>SOHM2+
= K>SOHM2+aM2+aq
10−2F�o/2.303RT(Ns − C>SO− − C>SOH+
2
− C>SO−–CA+ − C>SOH+2 –AN−
). [16]
E OF METAL CONCENTRATIONS 333
They, the final adsorption equation that gives the concentrationof adsorbed metal C>SOHM2+ in terms of the activity of the freemetal ion in solution aM2+
aqand the concentration of each of the
other surface species can be written as:
C>SOHM2+ =(
K>SOHM2+aM2+aq
10−2F�o/2.303RTN
1 + K>SOHM2+aM2+aq
10−2F�o/2.303RT
). [17]
The concentrations of >SO−, >SOH+2 , >SO−–CA+, and
>SOH+2 –AN−, included in the expression for N , can be cal-
culated by rearranging Eqs. [8]–[11] to give
C>SOH+2
= K1C>SOHaH+aq
10−F�o/2.303RT [18]
C>SO− = C>SOH
aH+aq
K210F�o/2.303RT , [19]
C>SO−–CA+ =KCA+C>SOHaCA+
aq
aH+aq
10−F(�β−�o)/2.303RT [20]
and
C>SOH+2 –AN− = KAN−C>SOHaAN−
aqaH+
aq10−F(�o−�β )/2.303RT .
[21]
In terms of aqueous concentrations, the adsorption equation(Eq. [17]) is
C>SOHM2+ =(
K>SOHM2+γM2+aq
CM2+aq
10−2F�o/2.303RTN
1+ K>SOHM2+γM2+aq
CM2+aq
10−2F�o/2.303RT
), [22]
where CM2+aq
represents the concentration of the free metal ionin solution and γM2+
aqis the aqueous activity coefficient for
M2+aq . The electrostatic term in the equilibrium constant ex-
pression carries through into the isotherm equation and appearsin both the numerator and denominator of the equation. WhenK>SOHM2+γM2+
aqCM2+
aq10−2F�o/2.303RT 1, then
log C>SOHM2+ ≈ log CM2+aq
+ log γM2+aq
N K>SOHM2+ − 2F�o
2.303RT.
[23]
If K>SOHM2+γM2+aq
CM2+aq
10−2F�o/2.303RT � 1, then
log C>SOHM2+ ≈ log N . [24]
At very low surface coverages, �o is not influenced by metaladsorption and the isotherm slope is equal to 1. At higher sur-face coverages, �o will not remain constant with increasingmetal adsorption and will influence the slope of the isothermand maximum metal surface coverage. The electrostatic poten-
tial term differs for each type of metal surface. For example,the electrostatic term associated with the formation reaction
334 CRISCENTI AND
for >SOH–M2+ is 2F�β/2.303RT . For this surface com-plex, the slope of the isotherm will be influenced by the valueof �β .
It can be seen in Fig. 2 that adsorption isotherms calculatedusing different surface complexes exhibit different characteris-tic slopes on a log–log diagram of aqueous metal versus metaladsorbed. On a positively charged mineral surface, like the sur-face of goethite, the electric potential opposes metal adsorption;therefore, as the electrostatic term increases, metal adsorptionis suppressed more and more. The “Langmuir” portion of theisotherm, with slope equal to 1, decreases, and the “Freundlich”portion of the isotherm, with slope <1, increases. The overallslope of the isotherm becomes progressively shallower.
Plotted on a log–log diagram of adsorbed metal versus aque-ous metal, the spacing between isotherms at different pH val-ues will also differ depending on the metal surface complexinvolved. For >SOHM2+, the spacing will depend primarily onthe electrostatic potential term 2F�o/2.303RT because �o is afunction of pH. For deprotonated metal surface complexes like>SOM+ given by the reaction
>SOH + M2+aq ↔ >SOM+ + H+
aq , [25]
equilibrium constant expression
K>SOM+ = C>SOM+aH+aq
C>SOHaM2+aq
10F�o/2.303RT , [26]
and adsorption equation
C>SOM+ =(
K>SOM+aM2+aq
a−1H+
aq10−F�o/2.303RTN
1 + K>SOM+aM2+aq
a−1H+
aq10−F�o/2.303RT
), [27]
adsorption isotherms at different pH values will differ by aH+aq
and �o. When K>SOM+aM2+aq
a−1H+
aq10−F�o/2.303RT 1, then
log C>SOM+ = log CM2+aq
+ log K>SOM+γM2+aq
N
− F�o
2.303RT+ pH. [28]
It can be seen in Eq. [28] that the shape of the adsorptionisotherms for the surface complex >SOM+ will be influencedby the term F�o/2.303RT . Furthermore, the spacing betweenthe isotherms is a function of not only the electrostatic potentialterm but also the pH that appears explicitly in Eq. [28].
Calculated adsorption isotherms using two different surfacecomplexes, >SOCoOH and >SOHCo2+, for Co2+ adsorptiononto quartz are illustrated in Fig. 3. The adsorption isothermscalculated for the neutral surface complex >SOCoOH exhibitslopes of 1 except at the highest pH and/or metal coverages.However, the isotherms for >SOHCo2+ show much greater cur-
vature, even at the lower pH values. The adsorption of posi-tively charged cations onto neutral surface sites (>SOHCo2+)SVERJENSKY
FIG. 3. Calculated adsorption isotherm behavior using the single-site triple-layer model for Co2+ adsorption onto quartz for two different Co2+ surfacecomplexes for several different pH values. Cobalt adsorption calculated usingthe surface complex >SOCoOH exhibits Langmuir behavior, and will only reacha maximum due to surface site saturation (1.42 × 10⁻⁷ M). Cobalt adsorptioncalculated using the surface complex >SOHCo2+ is influenced by the electricpotential term 2�o that contributes to the electrochemical equilibrium constantfor the formation of this surface complex. In this case, the surface charge andpotential are a function of pH and concentration of adsorbed Co2+, and as a con-sequence, these isotherms differ from those calculated using >SOCoOH, evenat low (i.e., 10−14 M) Co2+ concentrations. Input parameters for these calcula-tions are based on triple-layer model fits to data for Co2+ adsorption onto quartzfrom James and Healy (51) (Criscenti, (73)). These input parameters includefor quartz: 15 g/L, 5 m2/g surface area, and 11.4 sites/nm2. Triple-layer param-eters are C1 = 1.05 F/m2, log K1 = −2.20, log K2 = −6.20, log KK+ = −4.79,log KNO−
3= −1.03. The equilibrium constant for >SOHCo2+ is that found from
fitting the data from James and Healy (51) while the equilibrium constant for>SOCoOH has been selected such that the calculated pH 5 adsorption isothermsmerge at low metal concentrations.
increases the surface potential, and this in turn suppressesCo2+ adsorption. The spacing between calculated adsorptionisotherms at different pH values for these two complexes differs,even at relatively low metal concentrations. Clearly, the slopeof a single isotherm at a specific pH conveys little information.However, many isotherms over a range of metal concentrationsand pH values may aid in the determination of metal surfacespeciation schemes.
REINTERPRETATION OF CURVILINEAR METALADSORPTION ISOTHERMS IN TERMS OF A
SINGLE-SITE TRIPLE-LAYER MODEL
In this section, several data sets that have been describedpreviously with a two-site or multisite model are re-examinedusing the single-site extended triple-layer model. First, were-examine the data cited in support of the development of a two-site model (the DDLM, 2 and 27) for cadmium (Cd2+) adsorp-tion onto hydrous ferric oxide from Dzombak and Morel (27)discussed above and zinc (Zn2+) adsorption onto hydrous ferric
oxide from Benjamin (15) and Kinniburgh and Jackson (74).In addition, we re-examine additional data for Cd2+ adsorption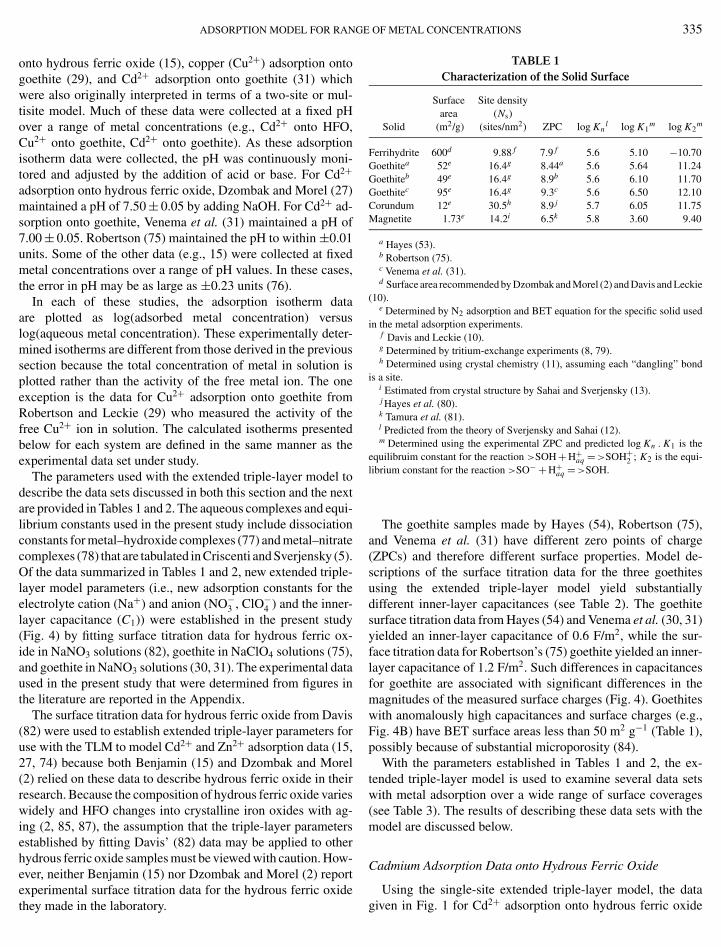
E
ADSORPTION MODEL FOR RANGonto hydrous ferric oxide (15), copper (Cu2+) adsorption ontogoethite (29), and Cd2+ adsorption onto goethite (31) whichwere also originally interpreted in terms of a two-site or mul-tisite model. Much of these data were collected at a fixed pHover a range of metal concentrations (e.g., Cd2+ onto HFO,Cu2+ onto goethite, Cd2+ onto goethite). As these adsorptionisotherm data were collected, the pH was continuously moni-tored and adjusted by the addition of acid or base. For Cd2+
adsorption onto hydrous ferric oxide, Dzombak and Morel (27)maintained a pH of 7.50 ± 0.05 by adding NaOH. For Cd2+ ad-sorption onto goethite, Venema et al. (31) maintained a pH of7.00 ± 0.05. Robertson (75) maintained the pH to within ±0.01units. Some of the other data (e.g., 15) were collected at fixedmetal concentrations over a range of pH values. In these cases,the error in pH may be as large as ±0.23 units (76).
In each of these studies, the adsorption isotherm dataare plotted as log(adsorbed metal concentration) versuslog(aqueous metal concentration). These experimentally deter-mined isotherms are different from those derived in the previoussection because the total concentration of metal in solution isplotted rather than the activity of the free metal ion. The oneexception is the data for Cu2+ adsorption onto goethite fromRobertson and Leckie (29) who measured the activity of thefree Cu2+ ion in solution. The calculated isotherms presentedbelow for each system are defined in the same manner as theexperimental data set under study.
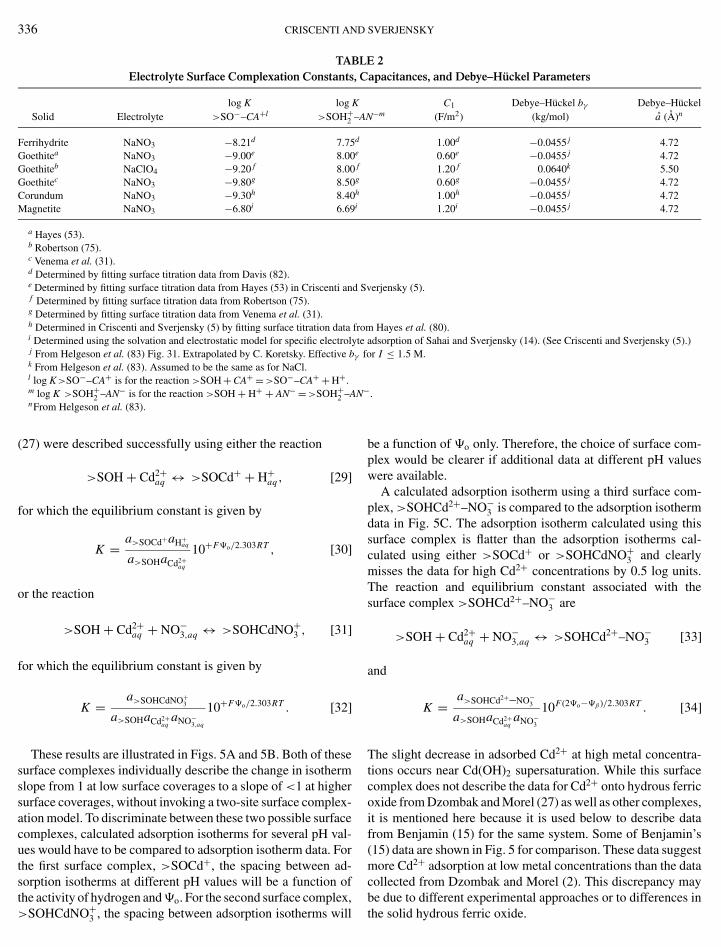
The parameters used with the extended triple-layer model todescribe the data sets discussed in both this section and the nextare provided in Tables 1 and 2. The aqueous complexes and equi-librium constants used in the present study include dissociationconstants for metal–hydroxide complexes (77) and metal–nitratecomplexes (78) that are tabulated in Criscenti and Sverjensky (5).Of the data summarized in Tables 1 and 2, new extended triple-layer model parameters (i.e., new adsorption constants for theelectrolyte cation (Na+) and anion (NO−
3 , ClO−4 ) and the inner-
layer capacitance (C1)) were established in the present study(Fig. 4) by fitting surface titration data for hydrous ferric ox-ide in NaNO3 solutions (82), goethite in NaClO4 solutions (75),and goethite in NaNO3 solutions (30, 31). The experimental dataused in the present study that were determined from figures inthe literature are reported in the Appendix.
The surface titration data for hydrous ferric oxide from Davis(82) were used to establish extended triple-layer parameters foruse with the TLM to model Cd2+ and Zn2+ adsorption data (15,27, 74) because both Benjamin (15) and Dzombak and Morel(2) relied on these data to describe hydrous ferric oxide in theirresearch. Because the composition of hydrous ferric oxide varieswidely and HFO changes into crystalline iron oxides with ag-ing (2, 85, 87), the assumption that the triple-layer parametersestablished by fitting Davis’ (82) data may be applied to otherhydrous ferric oxide samples must be viewed with caution. How-ever, neither Benjamin (15) nor Dzombak and Morel (2) report
experimental surface titration data for the hydrous ferric oxidethey made in the laboratory.OF METAL CONCENTRATIONS 335
TABLE 1Characterization of the Solid Surface
Surface Site densityarea (Ns)
Solid (m2/g) (sites/nm2) ZPC log Knl log K1
m log K2m
Ferrihydrite 600d 9.88 f 7.9 f 5.6 5.10 −10.70Goethitea 52e 16.4g 8.44a 5.6 5.64 11.24Goethiteb 49e 16.4g 8.9b 5.6 6.10 11.70Goethitec 95e 16.4g 9.3c 5.6 6.50 12.10Corundum 12e 30.5h 8.9 j 5.7 6.05 11.75Magnetite 1.73e 14.2i 6.5k 5.8 3.60 9.40
a Hayes (53).b Robertson (75).c Venema et al. (31).d Surface area recommended by Dzombak and Morel (2) and Davis and Leckie
(10).e Determined by N2 adsorption and BET equation for the specific solid used
in the metal adsorption experiments.f Davis and Leckie (10).g Determined by tritium-exchange experiments (8, 79).h Determined using crystal chemistry (11), assuming each “dangling” bond
is a site.i Estimated from crystal structure by Sahai and Sverjensky (13).j Hayes et al. (80).k Tamura et al. (81).l Predicted from the theory of Sverjensky and Sahai (12).m Determined using the experimental ZPC and predicted log Kn . K1 is the
equilibruim constant for the reaction >SOH + H+aq = >SOH+
2 ; K2 is the equi-librium constant for the reaction >SO− + H+
aq = >SOH.
The goethite samples made by Hayes (54), Robertson (75),and Venema et al. (31) have different zero points of charge(ZPCs) and therefore different surface properties. Model de-scriptions of the surface titration data for the three goethitesusing the extended triple-layer model yield substantiallydifferent inner-layer capacitances (see Table 2). The goethitesurface titration data from Hayes (54) and Venema et al. (30, 31)yielded an inner-layer capacitance of 0.6 F/m2, while the sur-face titration data for Robertson’s (75) goethite yielded an inner-layer capacitance of 1.2 F/m2. Such differences in capacitancesfor goethite are associated with significant differences in themagnitudes of the measured surface charges (Fig. 4). Goethiteswith anomalously high capacitances and surface charges (e.g.,Fig. 4B) have BET surface areas less than 50 m2 g−1 (Table 1),possibly because of substantial microporosity (84).
With the parameters established in Tables 1 and 2, the ex-tended triple-layer model is used to examine several data setswith metal adsorption over a wide range of surface coverages(see Table 3). The results of describing these data sets with themodel are discussed below.
Cadmium Adsorption Data onto Hydrous Ferric Oxide
Using the single-site extended triple-layer model, the datagiven in Fig. 1 for Cd2+ adsorption onto hydrous ferric oxide
336 CRISCENTI AND SVERJENSKY
TABLE 2Electrolyte Surface Complexation Constants, Capacitances, and Debye–Huckel Parameters
log K log K C1 Debye–Huckel bγ Debye–HuckelSolid Electrolyte >SO−–CA+l >SOH+
2 –AN−m (F/m2) (kg/mol) a (A)n
Ferrihydrite NaNO3 −8.21d 7.75d 1.00d −0.0455 j 4.72Goethitea NaNO3 −9.00e 8.00e 0.60e −0.0455 j 4.72Goethiteb NaClO4 −9.20 f 8.00 f 1.20 f 0.0640k 5.50Goethitec NaNO3 −9.80g 8.50g 0.60g −0.0455 j 4.72Corundum NaNO3 −9.30h 8.40h 1.00h −0.0455 j 4.72Magnetite NaNO3 −6.80i 6.69i 1.20i −0.0455 j 4.72
a Hayes (53).b Robertson (75).c Venema et al. (31).d Determined by fitting surface titration data from Davis (82).e Determined by fitting surface titration data from Hayes (53) in Criscenti and Sverjensky (5).f Determined by fitting surface titration data from Robertson (75).g Determined by fitting surface titration data from Venema et al. (31).h Determined in Criscenti and Sverjensky (5) by fitting surface titration data from Hayes et al. (80).i Determined using the solvation and electrostatic model for specific electrolyte adsorption of Sahai and Sverjensky (14). (See Criscenti and Sverjensky (5).)j From Helgeson et al. (83) Fig. 31. Extrapolated by C. Koretsky. Effective bγ for I ≤ 1.5 M.k From Helgeson et al. (83). Assumed to be the same as for NaCl.l log K>SO−–CA+ is for the reaction >SOH + CA+ = >SO−–CA+ + H+.
m log K >SOH+–AN− is for the reaction >SOH + H+ + AN− = >SOH+–AN−. 2 2nFrom Helgeson et al. (83).(27) were described successfully using either the reaction
>SOH + Cd2+aq ↔ >SOCd+ + H+
aq , [29]
for which the equilibrium constant is given by
K = a>SOCd+aH+aq
a>SOHaCd2+aq
10+F�o/2.303RT , [30]
or the reaction
>SOH + Cd2+aq + NO−
3,aq ↔ >SOHCdNO+3 , [31]
for which the equilibrium constant is given by
K = a>SOHCdNO+3
a>SOHaCd2+aq
aNO−3,aq
10+F�o/2.303RT . [32]
These results are illustrated in Figs. 5A and 5B. Both of thesesurface complexes individually describe the change in isothermslope from 1 at low surface coverages to a slope of <1 at highersurface coverages, without invoking a two-site surface complex-ation model. To discriminate between these two possible surfacecomplexes, calculated adsorption isotherms for several pH val-ues would have to be compared to adsorption isotherm data. Forthe first surface complex, >SOCd+, the spacing between ad-sorption isotherms at different pH values will be a function of
the activity of hydrogen and �o. For the second surface complex,>SOHCdNO+3 , the spacing between adsorption isotherms will
be a function of �o only. Therefore, the choice of surface com-plex would be clearer if additional data at different pH valueswere available.
A calculated adsorption isotherm using a third surface com-plex, >SOHCd2+–NO−
3 is compared to the adsorption isothermdata in Fig. 5C. The adsorption isotherm calculated using thissurface complex is flatter than the adsorption isotherms cal-culated using either >SOCd+ or >SOHCdNO+
3 and clearlymisses the data for high Cd2+ concentrations by 0.5 log units.The reaction and equilibrium constant associated with thesurface complex >SOHCd2+–NO−
3 are
>SOH + Cd2+aq + NO−
3,aq ↔ >SOHCd2+–NO−3 [33]
and
K = a>SOHCd2+–NO−3
a>SOHaCd2+aq
aNO−3
10F(2�o−�β )/2.303RT . [34]
The slight decrease in adsorbed Cd2+ at high metal concentra-tions occurs near Cd(OH)2 supersaturation. While this surfacecomplex does not describe the data for Cd2+ onto hydrous ferricoxide from Dzombak and Morel (27) as well as other complexes,it is mentioned here because it is used below to describe datafrom Benjamin (15) for the same system. Some of Benjamin’s(15) data are shown in Fig. 5 for comparison. These data suggestmore Cd2+ adsorption at low metal concentrations than the datacollected from Dzombak and Morel (2). This discrepancy may
be due to different experimental approaches or to differences inthe solid hydrous ferric oxide.
ADSORPTION MODEL FOR RANGE OF METAL CONCENTRATIONS 337
TABLE 3Surface Coverages Covered for Each Experimental Data Set
IonicSolid conc. Metal strength
Solid Metal (g/L) conc. (M) (M) mmol/m2 Reference
Hydrous ferric oxide Cd2+ 0.089 1 × 10⁻⁷ to 1 × 10⁻² 0.1 1.87 × 10⁻³ to 0.187 Dzombak and Morel (27)
Hydrous ferric oxide Zn2+ 0.089 1 × 10⁻⁷ 0.1 1.87 × 10⁻³ Benjamin (15)0.089 5 × 10⁻⁷ 9.36 × 10⁻³
0.089 2 × 10⁻⁶ 3.74 × 10⁻²
0.089 1 × 10⁻⁵ 0.1870.089 5 × 10⁻⁵ 0.936
0.027 5 × 10⁻⁷ 0.0310.270 5 × 10⁻⁷ 0.003
Hydrous ferric oxide Zn2+ 8.303 1 × 10⁻⁷ 1.0 2.00 × 10⁻⁵ Kinniburgh and Jackson (74)8.303 1 × 10⁻⁵ 2.00 × 10⁻³
8.303 1 × 10⁻⁴ 0.028.303 1 × 10⁻³ 0.208.303 1 × 10⁻² 2.00
Hydrous ferric oxide Cd2+ 1.16 5 × 10⁻⁷ 0.1 8.6 × 10⁻⁴ Benjamin (15)0.347 5 × 10⁻⁷ 2.9 × 10⁻³
0.116 5 × 10⁻⁷ 8.6 × 10⁻³
0.0579 5 × 10⁻⁷ 0.0170.0116 5 × 10⁻⁷ 0.086
0.089 1 × 10⁻⁸ 2.2 × 10⁻⁴
0.089 1 × 10⁻⁷ 2.25 × 10⁻³
0.089 5 × 10⁻⁷ 0.0110.089 2 × 10⁻⁶ 0.0450.089 1 × 10⁻⁵ 0.2250.089 5 × 10⁻⁵ 1.12
0.89 2 × 10⁻⁸ 4.5 × 10⁻⁵
0.89 5 × 10⁻⁸ 1.1 × 10⁻⁴
0.89 2 × 10⁻⁷ 4.5 × 10⁻⁴
Goethite Pb2+ 30 2 × 10⁻³ 0.1 1.282 Hayes (53)30 1.5 × 10⁻² 9.61530 3.0 × 10⁻² 19.23
Goethite Cu2+ 1 approx. 1 × 10⁻⁷ to 5 × 10⁻⁴ 0.01 approx. 2.04 × 10⁻³ to 10.2 Robertson (75)1 0.10
Goethite Cd2+ fr. 39@pH 5 1.8 × 10⁻⁶ to 2.07 × 10⁻⁴ 0.10 0.0189 to 2.18 Venema et al. (31)to 4.4@pH 9
Corundum Co2+ 0.2 2 × 10⁻⁶ 0.01 0.833 Katz and Hayes (17)2 2 × 10⁻⁶ 0.083
20 2 × 10⁻⁶ 0.0082 1 × 10⁻⁴ 4.167
Magnetite Co2+ 10 1 × 10⁻⁸ to 1 × 10⁻⁴ 0.1 1 × 10⁻⁴ to 3.16 Tamura et al. (81)
Benjamin (15) and Benjamin and Leckie (25) also studied theadsorption of Cd2+ onto Fe2O3 · H2O(am) and concluded thatthe data are inconsistent with a homogeneous surface site modelexcept at very low adsorption density. Their data for Cd2+ ad-sorption are reported as adsorption edges (% adsorbed versuspH) for a specific solid and metal concentration (Fig. 6). Withincreasing solid concentration, Cd2+ adsorption increases, andthe adsorption edges shift from high pH to low pH (Fig. 6A).
2+
With constant solid concentration, and increasing Cd con-centration, adsorption edges migrate from low pH to high pH(Fig. 6B). At very low surface coverages, the adsorption edgesare not affected by changes in metal concentration (Fig. 6C).
Using the single-site extended triple-layer model, severalattempts were made to describe the Cd2+ adsorption datafrom Benjamin (15) with different surface complexes (i.e.,>SOHCd2+, >SOHCd2+–NO−
3 , >SOHCdNO+3 ). The results
of calculations using the surface complex >SOHCd2+–NO−3
are presented in Fig. 6. The adsorption reaction and equilib-
rium constant expression for this surface complex are givenin Eqs. [33] and [34]. From a fit to the adsorption edge for
338 CRISCENTI AND
FIG. 4. Surface titration data and extended triple-layer model calibrationsfor hydrous ferric oxide and goethite. The calibrations were conducted assumingthat surface protonation and deprotonation constants can be predicted from theexperimentally determined ZPC and the pK . (A) Surface titration data forhydrous ferric oxide in NaNO3 solutions are from Davis (82) as reported inFigs. 1T1 to 1T3 in Dzombak and Morel (2). This calibration is used to fit Cd2+adsorption data from Dzombak and Morel (27) and Benjamin (15). (B) Surfacetitration data for goethite in NaClO4 solutions are from tables in Robertson (75).(C) Surface titration data for goethite in NaNO3 solutions presented in Venemaet al. (31) were provided in tabular form by Venema (personal communication).
5 × 10⁻⁷ M Cd2+ and 0.089 g/L hydrous ferric oxide (1.0 ×10⁻³ M Fe), other adsorption edges were predicted for a rangeof metal and solid concentrations and compared to the experi-mental results. In Fig. 6A, Cd2+ adsorption data over a rangeof solid concentrations, from 0.0116 to 1.16 g/L, are depictedalong with the corresponding Cd2+ adsorption edges calculatedusing the extended triple-layer model with >SOHCd2+–NO−
3 .The model successfully predicts adsorption at high solid concen-trations, but overpredicts adsorption at solid concentrations less
than or equal to 0.0579 g/L, which corresponds to 0.017 mmolof Cd2+/m2.SVERJENSKY
Adsorption of different Cd2+ concentrations onto 0.089 g/Lhydrous ferric oxide is illustrated in Fig. 6B. Like the experi-mental data, calculated adsorption edges migrate from low pHto high pH as Cd2+ concentration increases. Figure 6C illus-trates very low surface coverage data (4.5 × 10⁻⁵ mmol/m2 to4.5 × 10−4 mmol Cd2+/m2) from Benjamin (15), which exhibitsLangmuir behavior, that is, no pH shift in adsorption edges fordifferent Cd2+ concentrations and the corresponding predictedadsorption edges from the extended triple-layer model. The cal-culations, using >SOHCd2+–NO−
3 , predict less Cd2+ adsorptionthan the data.
FIG. 5. Isotherm data and single-site extended triple-layer model calibra-tions for Cd2+ adsorption onto hydrous ferric oxide at pH 7.50. The model iscalibrated to data from Dzombak and Morel (27). Data from Benjamin (15) areshown for comparison. Both sets of data were read from Fig. 1 in Dzombakand Morel (27). The curves represent model calculations using the surface com-plexes (A) >SOCd+, (B) >SOHCdNO+
3 , and (C) >SOHCd2+–NO−3 . The first
two surface complexes both describe the isotherm data equally well, while thecalculated isotherm in (C) is flatter than the isotherm delineated by the data.

+ 2+ −
ADSORPTION MODEL FOR RANG
FIG. 6. Adsorption of Cd2+ onto hydrous ferric oxide from 0.1 M NaNO3
solutions. The data are from Benjamin (15). (A) Cd2+ adsorption data andmodel predictions for 5 × 10⁻⁷ M Cd2+ over a range of hydrous ferric oxideconcentrations from 0.0116 g/L (1.3 × 10⁻⁴ M Fe) to 1.16 g/L (1.3 × 10⁻² MFe). (B) Cd2+ adsorption data for a range of Cd2+ concentrations (1 × 10⁻⁸
to 5 × 10⁻⁵ M) onto 0.089 g/L hydrous ferric oxide (10−3 M Fe). (C) Cd2+adsorption data for a range of Cd2+ concentrations (2 × 10⁻⁸ to 2 × 10⁻⁷ M)onto 0.89 g/L hydrous ferric oxide (10−2 M Fe). These data represent very lowsurface coverages ranging from 10−11 to 10−10 mol/m2.
Although the calculated curves in Figs. 6A, 6B, and 6C do notdescribe the data well at extremely low (≤2.2 × 10⁻⁴ mmol/m2)or at extremely high surface coverages (>0.017 mmol/m2), thecalculations do suggest that a single-site extended triple-layermodel may be used over a wide range of surface coverages. Thediscrepancies at extremely low surface coverage could probablybe accounted for with a second site, which might be attributedto the possible existence of a physical mixture in HFO (see
Introduction). These discrepancies might also be a result of ex-perimental difficulties encountered because the radiotracer Cd2+E OF METAL CONCENTRATIONS 339
concentrations used in Benjamin’s experiments may have beencomparable to the contamination level of the laboratory. Thediscrepancies at high surface coverage might be attributable toan insufficient time in the experiments to reach equilibrium. Thereaction kinetics reported by Dzombak and Morel (27) are slow-est at the very solid concentrations where these high-coveragediscrepancies appear in Fig. 6.
Zinc Adsorption onto Hydrous Ferric Oxide
Dzombak and Morel (27) also examined a set of adsorptionisotherm data for Zn2+ adsorption onto hydrous ferric oxide ata pH of 6.5 that includes data from Benjamin (15) at an ionicstrength of 0.1 M and data from Kinniburgh and Jackson (74)at an ionic strength of 1.0 M. The data from Benjamin (15) arefor low surface coverages and the data from Kinniburgh andJackson (74) are for higher surface coverages. Again, the ad-sorption isotherm exhibits a change in slope with increasing sur-face coverage. Comparisons between the calculated isothermsand these data are given in Fig. 7. Again two different surface
FIG. 7. Isotherm data and single-site extended triple-layer model calibra-tions to an isotherm for Zn2+ adsorption onto hydrous ferric oxide at pH 6.5.Data collected for Zn2+ adsorption onto 0.089 g/L HFO (10−3 M Fe) from a0.1 M NaNO3 solution are from Benjamin (15). Data collected for Zn2+ adsorp-tion onto 8.303 g/L HFO (9.33 × 10⁻²M Fe) from a 1.0 M NaNO3 solution arefrom Kinniburgh and Jackson (74). These data were extracted from Dzombakand Morel (27, Fig. 4). The curves represent triple-layer model calculations for
the surface complexes (A) >SOZn and (B) >SOHZn –NO3 . Either surfacecomplex fits the Zn2+ adsorption isotherm successfully.
340 CRISCENTI AND
complexes were found that may describe the data, >SOZn+ and>SOHZn2+–NO−
3 . The reaction and equilibrium constant asso-ciated with >SOZn+ is analogous to those given for >SOCd+
in Eqs. [29] and [30] above, and the reaction and equilibriumconstant associated with >SOHZn2+–NO−
3 are analogous tothose given for >SOHCd2+–NO−
3 in Eqs. [33] and [34]. Data forZn2+ adsorption at different pH values are necessary to distin-guish between these two surface complexes within the context ofthe extended triple-layer model. Calculations at high Zn2+ con-centrations, superceding Zn(OH)2 saturation, do not describe thedata successfully because the single-site extended triple-layermodel does not include surface precipitation.
Although a unique choice of surface complex cannot be iden-tified using the extended triple-layer model to describe one ad-sorption isotherm at one pH, it is clear from the calculationsfor Cd2+ and Zn2+ on hydrous ferric oxide that the single-siteextended triple-layer model is adequate to describe the Cd2+
and Zn2+ adsorption isotherm data that were used to justifya two-site model by Dzombak and Morel (27). This suggests
that the need to invoke a two-site model was a function of the of the likely presence of minor amounts of hematite mixed with limitations of the diffuse-layer model or the metal surface com-FIG. 8. Single-site extended triple-layer model predictions for Zn2+ adsorption onto hydrous ferric oxide. The data are from Kinniburgh and Jackson (74)and were read from figures in Dzombak and Morel (2). With use of the equilibrium constants found in Fig. 7 for the adsorption isotherm at pH 6.5, adsorptionisotherms at a pH 5.5 are calculated using (A) >SOZn+ and (B) >SOHZn2+–NO−
3 . Adsorption edges over a range of metal concentrations are illustrated in (C)
the HFO as discussed above.
and (D) with calculated curves using either the surface complex >SOZn+ or >SO>SOHZn2+–NO−
3 describes Zn2+ adsorption onto hydrous ferric oxide better tha
SVERJENSKY
plex selected to represent metal adsorption with the diffuse-layermodel.
Additional data for Zn2+ adsorption onto hydrous ferric ox-ide are provided by Kinniburgh and Jackson (74). With use ofthe equilibrium constants established in Fig. 7 for >SOZn+
and >SOHZn2+–NO−3 by fitting the adsorption isotherm data
at pH 6.5, adsorption isotherms are calculated at pH 5.5 andcompared to experimental data (see Figs. 8A and 8B). In addi-tion, these surface complexes and their equilibrium constants areused in Figs. 8C and 8D to predict Zn2+ adsorption edges overa range of metal concentrations (10−7 to 10−2 M). These resultssuggest that the surface complex >SOHZn2+–NO−
3 describesthe adsorption data better than >SOZn+. However, Zn2+ ad-sorption at low metal concentrations (10−7 to 10−4 M) and thelowest surface coverages (2.0 × 10⁻¹¹ to 2.0 × 10⁻⁸ mol/m2)is underpredicted, even with >SOHZn2+–NO−
3 (Fig. 8D). Thisresult suggests that a second surface complex may be necessaryto describe these data within the context of a single-site model.Alternatively, a second site might be needed possibly because
HZn2+–NO−3 , respectively. These calculations suggest that the surface complex
n >SOZn+.

E
ADSORPTION MODEL FOR RANGFIG. 9. Adsorption of Cu2+ onto goethite from NaClO4 solutions. Adsorp-tion isotherm data at two ionic strengths (A) 0.01 and (B) 0.1 M are reported intabular form in Robertson (75). These data are fit using the single-site extendedtriple-layer model with two Cu2+ surface complexes >SOHCu2+–ClO−
4 and>SOCu+–ClO−
4 .
Copper Adsorption onto Goethite
Robertson (75) and Robertson and Leckie (29) report Cu2+
adsorption isotherm data at three pHs (4, 5, and 6), two ionicstrengths (0.01 and 0.1 M NaClO4), and over 3 orders of mag-nitude surface coverage (Fig. 9). These data were describedwith the extended triple-layer model using a combinationof two surface complexes, >SOHCu2+–ClO−
4 and >SOCu+–ClO−
4 . The surface complex >SOHCu2+–ClO−4 is given by the
reaction
>SOH + Cu2+aq + ClO−
4,aq ↔ >SOHCu2+–ClO−4 [35]
and equilibrium constant
K = a>SOHCu2+−ClO−4
a>SOHaCu2+aq
aClO−4,aq
10F(2�o−�β )/2.303RT . [36]
The surface complex >SOCu+–ClO−4 is given by the reac-
tion
>SOH + Cu2+aq + ClO−
4,aq ↔ >SOCu+–ClO−4 + H+
aq [37]
OF METAL CONCENTRATIONS 341
and equilibrium constant
K =a>SOCu+−ClO−
4,aq
a>SOHaCu2+aq
aClO−4,aq
10F(�o−�β )/2.303RT . [38]
It can be seen in Fig. 9 that the calculated curves describethe majority of the adsorption isotherm data at all three pHsand at both ionic strengths, with the exception of the adsorp-tion isotherm data for 0.01 M NaClO4 and a pH of 6, wherethe calculated adsorption isotherm predicts less Cu2+ adsorp-tion than measured. This suggests the need for a third surfacecomplex or surface precipitation under these conditions. At bothionic strengths and all three pH values, the surface complex>SOHCu2+–ClO−
4 dominates at low metal concentrations andthe second complex, >SOCu+–ClO−
4 dominates at metal con-centrations greater than 10−5 M.
Robertson and Leckie (29) fit the same data with three differ-ent surface complexation models and a variety of surface com-plexes. In each case, Robertson and Leckie (29) used one type ofsurface complex and two or three types of sites. They assume thatmore than one type of surface site is necessary because the slopeof the isotherm is <1 below 10−5 mol of Cu2+ adsorbed/g ofgoethite, far from surface saturation. In general, both the modelresults of Robertson and Leckie (29) and the single-site extendedTLM describe the shallow slope of the isotherm at concentra-tions less than 10−5 mol of Cu2+ adsorbed/g of goethite. One ofRobertson and Leckie’s (29) better fits to the data uses the sur-face complex >SOCu+–ClO−
4 with three surface site types. Theuse of more than one type of surface site with the triple-layermodel appears to give a better description of the data between10−4.5 and 10−5.5 mol of Cu2+/g of goethite than the extendedtriple-layer model calculations. The problem with the low ionicstrength 0.01 M, pH 6 isotherm at high surface coverages is alsonot encountered when multiple site types are considered.
Cadmium Adsorption onto Goethite
Venema et al. (31) collected Cd2+ adsorption isotherm dataat three ionic strengths (0.01, 0.1, and 0.5 M) at a pH of 7 andisotherm data at five pH values (5, 6, 7, 8, and 9) at an ionicstrength of 0.1 M. Using the single-site extended triple-layermodel, the isotherm data at a pH of 7 were described using twosurface complexes, >SOHCdNO+
3 and >SOHCd2+–NO−3 (see
Fig. 10A). With use of the surface complexes and equilibriumconstants found to describe the ionic strength data, calculatedadsorption isotherms are compared to the collected data for arange of pH values at a single ionic strength (Fig. 10B). Whilethe data are predicted successfully at pH values of 8 and 9, thecalculated adsorption isotherms overpredict Cd2+ adsorption ata pH of 5. A better fit to the adsorption isotherms at different pHvalues is shown in Fig. 10C. In this case, a log K>SOHCdNO+
3of 6.25 is used rather than 6.75, found by fitting the ionic strength
2+ −
data at a pH of 7. The log K for >SOHCd –NO3 used in bothfits is 7.50.
342 CRISCENTI AND
FIG. 10. Adsorption of Cd2+ onto goethite from NaNO3 solutions. Adsorp-tion isotherm data were provided in tabular form by Venema (personal communi-cation) and are published in figures in Venema et al. (31). (A) Cd2+ adsorptionisotherm data at pH 7, at three ionic strengths, are used to calibrate the ex-tended triple-layer model with two Cd2+ surface complexes, >SOHCdNO+
3 and>SOHCd2+–NO−
3 . (B) With use of the calibration in (A), adsorption isothermsover a range of different pH values for 0.1 M NaNO3 are predicted. (C) In thiscase, the Cd2+ adsorption isotherm data over a range of pH values is used tocalibrate the model.
The two surface complexes, >SOHCd2+–NO−3 and
>SOHCdNO+3 , chosen to fit the data with the extended triple-
layer model vary in importance depending on the pH of thesystem. At low pH values, the surface complex >SOHCdNO+
3dominates, while at higher pH values, the surface complex>SOHCd2+–NO−
3 dominates. The uncertainty in the equilib-rium constant for the surface complex >SOHCdNO+
3 used
to describe the adsorption data may reflect uncertainties inmeasured pH values or in measured differences in metalSVERJENSKY
concentrations in solution at low pH values. The shift from>SOHCdNO+
3 to >SOHCd2+–NO−3 as pH changes reflects
changes in surface charge and potential with increasing pH andsurface coverage.
Venema et al. (31) fit the same data with a complexation modelthat assumed two Cd2+ sites, a single protonation and electrolyteadsorption site, and a modified electrostatic term for each Cd2+
site. With this procedure, four parameters were obtained: twolog K values for Cd2+ as a high-affinity complex and a low-affinity complex as well as the two modified electrostatic terms.However, this fit to the data is similar to that provided by theextended triple-layer model in Figs. 10A and 10B, which is basedon only two fitting parameters.
PREDICTIONS OF METAL ADSORPTION OVERA RANGE OF SURFACE COVERAGES
In this section, the analysis of several data sets for metal ad-sorption at different ionic strengths, reported in Criscenti andSverjensky (5), is extended by examining additional data re-ported in the same studies for metal adsorption over a rangeof metal concentrations. These data sets include Co2+ adsorp-tion onto magnetite (81), Pb2+ adsorption onto goethite (54),and Co2+ adsorption onto corundum (17, 67). Tamura et al.(81) and Hayes (54) do not discuss uncertainty in their data. Onthe other hand, Katz (76) thoroughly investigated uncertainty inpH and concentration measurements for adsorption edge data.The error found in pH measurements is much larger than ±0.05.Katz (76) suggested that this large uncertainty arises because thepresence of solids in solution affects the pH probe and leads tomajor errors in measured pH (±0.23). By comparison, errors inmeasuring metal concentrations are relatively small. Katz (76)also observed that duplicate experiments using different solidsamples lead to greater variability in experimental results thanvariation in experimental procedure. In addition, although theexperiments are conducted in an N2 environment, CO2 con-tamination was introduced through the solid phase. The surfacecomplexes and equilibrium constants previously found by fit-ting the ionic strength data for each system are used here topredict metal adsorption in each case over a range of metalconcentrations.
Cobalt Adsorption onto Magnetite
Adsorption edge data from Tamura et al. (81) for Co2+ ad-sorption onto magnetite from NaNO3 solutions over a widerange of ionic strengths were described using two surfacecomplexes, >SOCo+ and >SOHCo2+–NO−
3 , which form ac-cording to reactions analogous to Eqs. [29] and [33] withequilibrium constant expressions given by Eqs. [30] and [34],respectively. With use of these surface complexes and theirassociated equilibrium constants, adsorption isotherms for pH
values of 6, 6.5, 7, and 7.5 and over 6 orders of magnitudein Co2+ concentration are predicted in Fig. 11. The calculated
ADSORPTION MODEL FOR RANG
FIG. 11. Adsorption of Co2+ onto magnetite from NaNO3 solutions. Thedata were read from figures in Tamura et al. (81). (A) Adsorption edge dataover a range of ionic strengths were fit with the extended triple-layer modelusing two surface complexes, >SOCo+ and >SOHCo2+–NO−
3 . (B) The surfacecomplexes and equilibrium constants established in (A) are used to fit Co2+adsorption isotherms for a range of metal concentrations at different pH values.(C) The surface complexes and equilibrium constants established in (A) are usedto fit Co2+ adsorption edges over a range of metal concentrations.
adsorption isotherms pass through many of the data points,suggesting that the single-site extended triple-layer model canbe used to fit metal adsorption over a range of metal concen-trations.
Lead Adsorption onto Goethite
In Criscenti and Sverjensky (5), the data for Pb2+ adsorp-tion onto goethite from NaNO3 solutions over a range of ionicstrengths (0.01, 0.10, and 0.30 M) were fit using an adsorp-tion reaction and equilibrium constant expression for the surfacecomplex >SOHPb2+–NO−
3 similar to those given in Eqs. [33]and [34] for >SOHCd2+–NO−
3 . In Fig. 12B, data for Pb2+ ad-sorption onto goethite at different Pb2+ concentrations are illus-trated on a % Pb2+ adsorbed versus pH diagram. With use of the
surface complex and equilibrium constant found from examin-E OF METAL CONCENTRATIONS 343
ing the ionic strength data (Fig. 12A), the single-site extendedtriple-layer model can predict the data for a range of Pb2+ con-centrations, from 2.0 × 10⁻³ to 3.0 × 10⁻² M.
Cobalt Adsorption onto Corundum
Using the extended triple-layer model, adsorption edge datafrom Katz (76) for the adsorption of 2 × 10⁻⁶ M Co2+ onto2 g/L corundum over a range of ionic strengths were describedin Criscenti and Sverjensky (5) using the surface complex>SOHCo2+–NO−
3 and a log K of 8.10. Data for adsorption overa range of Co2+ concentrations is also provided in Katz (76)and Katz and Hayes (17). These data include Co2+ adsorptionedge data for a single Co2+ concentration and a range of solidconcentrations, for a range of Co2+ concentrations and a singlesolid concentration, and for adsorption isotherm data at two pHvalues.
Figure 13A illustrates that with increasing solid concentra-tion, Co2+ adsorption edges migrate to lower pH values. Thesurface complex and equilibrium constant (>SOHCo2+–NO−
3 ,log K = 8.10) established in Criscenti and Sverjensky (5) pro-vide a good fit to the adsorption data for 20 g/L corundum and2 × 10−6 M Co2+, but underpredict the amount of adsorptionfor 0.2 g/L corundum and 2 × 10⁻⁶ M Co2+. This adsorptionedge can be accounted for by adding a second surface complex,
FIG. 12. Adsorption of Pb2+ onto goethite from NaNO3 solutions. Thedata are tabulated in Hayes (53). (A) Adsorption edge data over a range of ionicstrengths were fit using the surface complex >SOHPb2+–NO−
3 . (B) The surface2+ −
complex, >SOHPb –NO3 , and equilibrium constant established in (A) areused to predict Pb2+ adsorption over a range of Pb2+ concentrations.

344 CRISCENTI AND SVERJENSKY
FIG. 13. Adsorption of Co2+ onto corundum from NaNO3 solutions. The data were read from figures in Katz (76). (A) Adsorption of 2 × 10⁻⁶ M Co2+onto three different corundum concentrations. (B) Adsorption of 1 × 10⁻⁴ M Co2+ onto 2 g/L corundum. (C) Adsorption isotherm at pH 6.9. Calculations usingone surface complex at three different pH values illustrate the effects of pH uncertainty on predicted isotherms. (D) Adsorption isotherm at pH 6.9. The isothermcalculated using two surface complexes >SOHCo2+–NO−
3 and >SOCoOH fits the data at both low and high surface coverages. (E) Adsorption isotherm at pH
7.6. The isotherm calculated using two surface complexes fits the adsorption isotherm at both low and high surface coverages. The data plotted in (C), (D), and (E)%
are divided into two groups that represent mineral surface coverages less than 10>SOCoOH, given by the reaction
>SOH + Co2+aq + H2O ↔ >SOCoOH + 2H+
aq [39]
and equilibrium constant expression
K =a>SOCoOHa2
H+aq
a>SOHaCo2+aq
. [40]
The adsorption data for 2 g/L corundum and 1 × 10⁻⁴ MCo2+, which corresponds to a higher surface coverage (2 mmol/m2), are well predicted using the same two surface com-plexes, >SOHCo2+–NO−
3 and >SOCoOH (see Fig. 13B). These
high surface coverage data were not described successfullyby Katz (76) and Katz and Hayes (17, 18) without consider-(SurCov < 10%) and greater than 10% (SurCov > 10%).
ing the formation of multinuclear complexes or surface preci-pitation.
Adsorption isotherm data at two pH values are presented inFigs. 13D and 13E. It can be seen in Figs. 13D and 13E thatthe calculated isotherms agree quite well with the experimentaldata points. Although the isotherm at pH 6.9 lies slightly abovemuch of the data, the calculated curve is quite sensitive to pH.To examine the effects of pH uncertainty, adsorption isothermswere also calculated at pH values of 6.8 and 7.0. Figure 13Cdemonstrates that such a pH variation is sufficient to improvethe fit to the adsorption isotherm through the Co2+ adsorptiondata for moderate surface coverages.
Figure 13D illustrates the effects of adding the second surfacecomplex,>SOCoOH. This surface complex has little or no affect
2+
on Co adsorption at low surface coverages nor on the originalfits to Co2+ adsorption over the range of ionic strengths presented
E
ADSORPTION MODEL FOR RANGin Criscenti and Sverjensky (5). However, it becomes importantat high Co2+ surface coverages and dramatically changes theshape of the adsorption isotherm, suggesting that the adsorptionmaximum for Co2+ at a pH of 6.9 is much higher than that sug-gested by the adsorption isotherm data available. Figure 13E alsoshows that with the two surface complexes, >SOHCo2+–NO−
3and >SOCoOH, adsorption data at high surface coverages canbe described using the single-site extended triple-layer modelwithout considering multinuclear surface complexes or surfaceprecipitation.
Katz (76) and Towle et al. (87) have studied Co2+ adsorp-tion onto corundum using X-ray absorption fine-structure spec-troscopy. Katz (76) investigated samples ranging in surface cov-erage from 0.38 to 3.2 mmol/m2 that were prepared in the samemanner (i.e., same solid and Co2+ concentrations, same time toequilibrium, etc.) as the adsorption data discussed above. Towleet al. (87) prepared samples at a pH of 8.0 that ranged in surfacecoverage from 0.28 to 23.1 mmol/m2. Towle et al. (87) reportthat the samples studied were either prepared 2 days in advanceor 2 months in advance, while Katz (76) does not report timebetween sample preparation and analysis. The spectroscopic re-sults of Katz (76) suggest that multinuclear complexes form atthe lowest surface coverage studied. Towle et al.’s (87) spectro-scopic analysis concurs, suggesting that multinuclear complexesform at low surface coverages and that surface precipitates thathave a structure similar to that of Co(OH)2 form at higher sur-face coverages. However, using our approach, the adsorptionedge and isotherm data from Katz (78), which range in surfacecoverage from 0.04 to 2 mmol/m2, can be modeled effectivelywithout incorporating multinuclear complexes or precipitation.This result suggests that multinuclear complexes and precipita-tion may not arise in the bulk adsorption experiments. Instead,spectroscopic evidence for multinuclear complexation may bedue to the use of samples with a much higher solid-to-liquidratio than found in the bulk adsorption experiments or be-cause the samples prepared for spectroscopic study were an-alyzed after a few days or months unlike the samples fromthe bulk adsorption experiments which were analyzed morequickly.
CONCLUDING REMARKS
This study demonstrates that a single-site extended triple-layer model can account for curvilinear metal adsorptionisotherms to fit metal adsorption over a wide range of metalconcentrations in the following systems:
(1) Cd2+ adsorption onto HFO (15): from 1.87 × 10⁻³ mmol/m2 to 0.187 mmol/m2.
(2) Zn2+ adsorption onto HFO (74, 15): from 1.87 ×10⁻³ mmol/m2 to 2.00 mmol/m2.
2+
(3) Cu adsorption onto goethite (75): from 2.04 ×10⁻³ mmol/m2 to 10.2 mmol/m2.OF METAL CONCENTRATIONS 345
(4) Cd2+ adsorption onto goethite (31): from 0.0189 mmol/m2 to 2.18 mmol/m2.
(5) Co2+ adsorption onto magnetite (81): from 10−4 mmol/m2 to 3.16 mmol/m2.
It is noteworthy that the two isotherms for Cd2+ (4.5 × 10⁻⁵
to 4.5 × 10⁻⁴ mmol/m2) and Zn2+ (2 × 10⁻⁵ to 0.02 mmol/m2)adsorption at pHs equal to 7.5 and 6.5, respectively, onto hy-drous ferric oxide were used by Dzombak and Morel (27) todemonstrate the need for a two-site model. The present studyshows that these isotherms can be described adequately withone surface complex and the single-site extended triple-layermodel. However, these isotherms are for pH values at which lowmetal concentrations are completely adsorbed; adsorption edgedata for Cd2+ and Zn2+ adsorption for low surface coverages(<1.1 × 10⁻⁴ and <0.02 mmol/m2, respectively) are not con-sistent with the model adopted in the present study. This resultcould be used to argue for a two-site model under some condi-tions. An alternative explanation lies in the likelihood that theHFO used by Benjamin (15) and Kinniburgh and Jackson (74)was a physical mixture of two or more solids (37–39). In addi-tion, the data for Cu2+ adsorption onto goethite from Robertson(75) are described reasonably well at low Cu2+ concentrationswith the single-site model.
In addition to surface-site heterogeneity, the curvilinear na-ture of metal adsorption isotherms and the shifts of pH edgeswith increasing surface coverage have also been attributed tothe adsorption of multinuclear surface complexes (e.g., 76) orthe nonideality of metal adsorption (e.g., 72). Although all ofthese are plausible explanations, we wish to emphasize that thecurvature of metal isotherms can also be attributed to changesin surface charge and potential associated with the predominantmetal surface complexes. As demonstrated by Robertson andLeckie (61), the curvature of a single isotherm depends verystrongly on the type of metal complex. This result indicatesthat the slope of the adsorption isotherm cannot be used uncrit-ically as a criterion for determining the number of surface-sitetypes involved in metal adsorption. In addition, it follows thatchanges in metal adsorption with increasing surface coveragecan also be a function of changes in metal surface speciation.Single-site multispecies models have already been widely em-ployed (e.g., 40, 41, 55, 56, 62, 64–66). Honeyman and Leckie(88) also suggested that changes in macroscopic adsorption be-havior and adsorption energy with increasing surface coveragemight be a function of surface speciation. Two of the data setsmodeled in our study reinforce this possibility. For Cu2+ ad-sorption onto goethite (75) >SOHCu2+–ClO−
4 dominates at lowCu2+ surface coverages and >SOCu+–ClO−
4 dominates at highsurface coverages. For Co2+ adsorption onto corundum (76),the surface complex >SOHCo2+–NO−
3 dominates at low sur-face coverages whereas >SOCoOH dominates at higher surfacecoverages.
The present study, together with the study of metal adsorp-
tion over a range of ionic strengths discussed in Criscenti and
SVER
0.0
9. 8. 7. 6. 6. 5. ot
346 CRISCENTI AND
Sverjensky (5), suggests that the nature of metal surface spe-ciation on solid surfaces is a function of pH, surface coverage,ionic strength, and electrolyte type. One very complete data setincludes data for Co2+ adsorption onto magnetite (81) over botha range of ionic strengths from 0.0001 to 0.1 M and a range ofsurface coverages from 10−4 to 3.16 mmol/m2 at pHs from 6 to7.5. The extended TLM with two surface complexes, >SOCo+
and >SOHCo2+–NO−3 , can successfully describe Co2+ adsorp-
tion over this full spectrum of variation in solution composition(i.e., pH, ionic strength, and electrolyte) and solid surface prop-erties (i.e., charge and potential as a function of pH, solid, andsurface coverage).
As in Criscenti and Sverjensky (5), much of the data exam-ined in this study can be described by the extended TLM andsurface complexes that involve both the metal cation and theelectrolyte anion. Evidence that there is no direct correspon-dence between aqueous and surface metal speciation was foundfor transition and heavy metal adsorption over a range of ionicstrengths in both NaCl and NaClO4 solutions (5). This differencein metal speciation schemes is not entirely unexpected giventhat the physical properties of the mineral–solution interfaceare quite distinct from those of the bulk aqueous solution. Themetal–anion complexes suggested by fitting metal adsorptiondata with the extended TLM have also been previously dis-cussed in terms of recent spectroscopic studies (i.e., XAS) onmetal adsorption onto oxide surfaces (5). It is not yet possi-ble to identify the exact nature of all relevant surface com-plexes with spectroscopic techniques (24). Only a few XASstudies have investigated the possible co-adsorption of the elec-trolyte anion with a heavy metal cation (89, 90). Althoughnot conclusive, these studies lend support to the possibil-ity that these ternary complexes may indeed form on oxidesurfaces.
Finally, two of the data sets studied here include sufficientdata to examine uncertainties in model predictions (31, 76).In both cases, discrepancies in fitting different subsets of theexperimental data may arise directly from uncertainties in thedata itself. For other data sets (54, 81) metal surface com-plexes and equilibrium constants found by fitting adsorptiondata over a range of ionic strengths successfully predict metaladsorption over a range of metal concentrations. Further in-vestigation into the uncertainties associated with the surfacecomplexes and equilibrium constants established with the ex-tended triple-layer model awaits comparative studies betweendifferent adsorption data sets involving the same solid andmetal.
ACKNOWLEDGMENTS
This paper has benefited from reviews by J. Ferry, S. Brantley, J. Kubicki,and two anonymous reviewers. It has also benefited from discussions with L.Katz and J. Bargar. P. Venema and H. Tamura both freely shared their data withus. L.J.C. was on educational leave from Battelle Pacific Northwest NationalLaboratory during this study. This research was supported by NSF Grant EAR
9526623 and DOE Grant DE-FG02-96ER-14616 to D.A.S.JENSKY
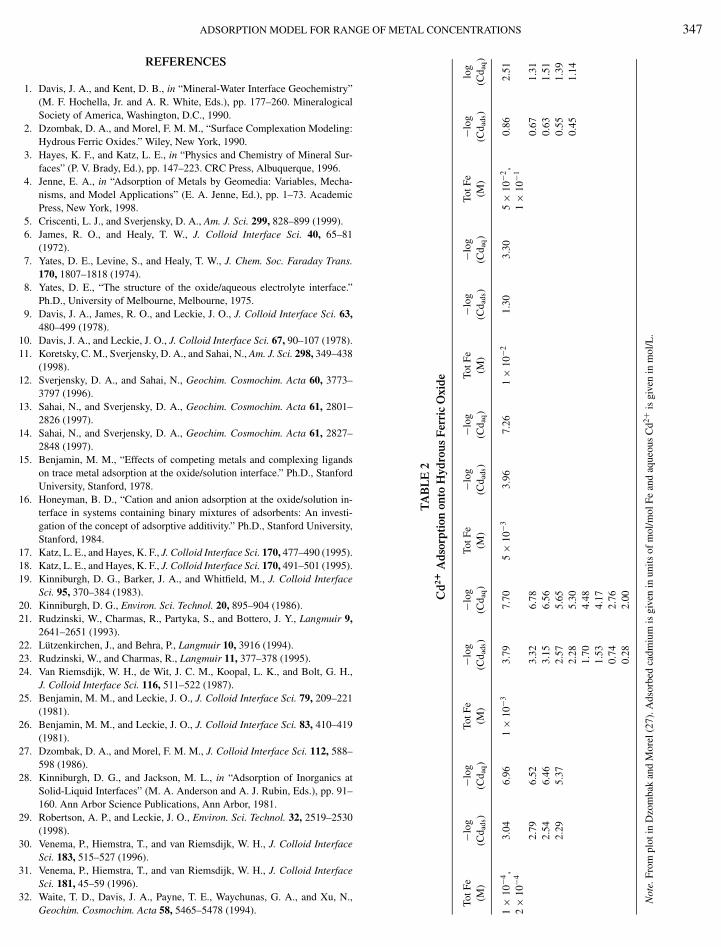
APPENDIX
Experimental Data Extracted from Figuresin Original Sources
TA
BL
E1
Surf
ace
Tit
rati
onD
ata
for
Hyd
rous
Fer
ric
Oxi
defr
omD
avis
(82)
01M
TotH
(mM
)m
H+
(ads
)si
gH
pH0.
01M
TotH
(mM
)m
H+
(ads
)si
gH
pH0.
1M
TotH
(mM
)m
H+
(ads
)si
gH
000
042.
5310
50.
022
9.00
0.05
04.
1010
50.
037
9.00
0.06
96.
1210
5.0
5654
001
8.64
106
0.00
88.
540.
019
1.61
105
0.01
48.
460.
033
3.07
105
0.02
700
002
1.50
105
0.01
37.
540.
008
8.28
106
0.00
77.
920.
000
6.29
105
0.00
056
500
022.
2710
50.
020
7.00
0.02
52.
5010
50.
022
7.50
0.01
51.
5210
50.
0134
000
043.
4010
50.
030
6.54
0.05
04.
9710
50.
044
7.00
0.04
64.
5910
50.
041
540
065.
5010
50.
049
6.00
0.07
37.
1910
50.
064
6.46
0.07
37.
2810
50.
065
6.00
0.10
80.
0001
0.09
55.
500.
146
0.00
010.
127
5.00
0.17
70.
0002
0.14
7
e.D
ata
poin
tsde
term
ined
from
Dzo
mba
kan
dM
orel
(2).
× × × × ××× × × × ××
× × × × ××− − − − − −
− − − − − −
− − − − − −
. . . . . .
0−−
−−−−
−−−−
−−−−
−−−−
figu
res
in
pH
N
OF M 347
ADSORPTION MODEL FOR RANGEREFERENCES
1. Davis, J. A., and Kent, D. B., in “Mineral-Water Interface Geochemistry”(M. F. Hochella, Jr. and A. R. White, Eds.), pp. 177–260. MineralogicalSociety of America, Washington, D.C., 1990.
2. Dzombak, D. A., and Morel, F. M. M., “Surface Complexation Modeling:Hydrous Ferric Oxides.” Wiley, New York, 1990.
3. Hayes, K. F., and Katz, L. E., in “Physics and Chemistry of Mineral Sur-faces” (P. V. Brady, Ed.), pp. 147–223. CRC Press, Albuquerque, 1996.
4. Jenne, E. A., in “Adsorption of Metals by Geomedia: Variables, Mecha-nisms, and Model Applications” (E. A. Jenne, Ed.), pp. 1–73. AcademicPress, New York, 1998.
5. Criscenti, L. J., and Sverjensky, D. A., Am. J. Sci. 299, 828–899 (1999).6. James, R. O., and Healy, T. W., J. Colloid Interface Sci. 40, 65–81
(1972).7. Yates, D. E., Levine, S., and Healy, T. W., J. Chem. Soc. Faraday Trans.
170, 1807–1818 (1974).8. Yates, D. E., “The structure of the oxide/aqueous electrolyte interface.”
Ph.D., University of Melbourne, Melbourne, 1975.9. Davis, J. A., James, R. O., and Leckie, J. O., J. Colloid Interface Sci. 63,
480–499 (1978).10. Davis, J. A., and Leckie, J. O., J. Colloid Interface Sci. 67, 90–107 (1978).11. Koretsky, C. M., Sverjensky, D. A., and Sahai, N., Am. J. Sci. 298, 349–438
(1998).12. Sverjensky, D. A., and Sahai, N., Geochim. Cosmochim. Acta 60, 3773–
3797 (1996).13. Sahai, N., and Sverjensky, D. A., Geochim. Cosmochim. Acta 61, 2801–
2826 (1997).14. Sahai, N., and Sverjensky, D. A., Geochim. Cosmochim. Acta 61, 2827–
2848 (1997).15. Benjamin, M. M., “Effects of competing metals and complexing ligands
on trace metal adsorption at the oxide/solution interface.” Ph.D., StanfordUniversity, Stanford, 1978.
16. Honeyman, B. D., “Cation and anion adsorption at the oxide/solution in-terface in systems containing binary mixtures of adsorbents: An investi-gation of the concept of adsorptive additivity.” Ph.D., Stanford University,Stanford, 1984.
17. Katz, L. E., and Hayes, K. F., J. Colloid Interface Sci. 170, 477–490 (1995).18. Katz, L. E., and Hayes, K. F., J. Colloid Interface Sci. 170, 491–501 (1995).19. Kinniburgh, D. G., Barker, J. A., and Whitfield, M., J. Colloid Interface
Sci. 95, 370–384 (1983).20. Kinniburgh, D. G., Environ. Sci. Technol. 20, 895–904 (1986).21. Rudzinski, W., Charmas, R., Partyka, S., and Bottero, J. Y., Langmuir 9,
2641–2651 (1993).22. Lutzenkirchen, J., and Behra, P., Langmuir 10, 3916 (1994).23. Rudzinski, W., and Charmas, R., Langmuir 11, 377–378 (1995).24. Van Riemsdijk, W. H., de Wit, J. C. M., Koopal, L. K., and Bolt, G. H.,
J. Colloid Interface Sci. 116, 511–522 (1987).25. Benjamin, M. M., and Leckie, J. O., J. Colloid Interface Sci. 79, 209–221
(1981).26. Benjamin, M. M., and Leckie, J. O., J. Colloid Interface Sci. 83, 410–419
(1981).27. Dzombak, D. A., and Morel, F. M. M., J. Colloid Interface Sci. 112, 588–
598 (1986).28. Kinniburgh, D. G., and Jackson, M. L., in “Adsorption of Inorganics at
Solid-Liquid Interfaces” (M. A. Anderson and A. J. Rubin, Eds.), pp. 91–160. Ann Arbor Science Publications, Ann Arbor, 1981.
29. Robertson, A. P., and Leckie, J. O., Environ. Sci. Technol. 32, 2519–2530(1998).
30. Venema, P., Hiemstra, T., and van Riemsdijk, W. H., J. Colloid InterfaceSci. 183, 515–527 (1996).
31. Venema, P., Hiemstra, T., and van Riemsdijk, W. H., J. Colloid InterfaceSci. 181, 45–59 (1996).
32. Waite, T. D., Davis, J. A., Payne, T. E., Waychunas, G. A., and Xu, N.,Geochim. Cosmochim. Acta 58, 5465–5478 (1994).
ETAL CONCENTRATIONS
TA
BL
E2
Cd2+
Ads
orpt
ion
onto
Hyd
rous
Fer
ric
Oxi
de
Fe−l
og−l
ogTo
tFe
−log
−log
TotF
e−l
og−l
ogTo
tFe
−log
−log
TotF
e−l
oglo
g)
(Cd a
ds)
(Cd a
q)
(M)
(Cd a
ds)
(Cd a
q)
(M)
(Cd a
ds)
(Cd a
q)
(M)
(Cd a
ds)
(Cd a
q)
(M)
(Cd a
ds)
(Cd a
q)
0−4,
3.04
6.96
1×
10−3
3.79
7.70
5×
10−3
3.96
7.26
1×
10−2
1.30
3.30
5×
10−2
,0.
862.
510−
41
×10
−12.
796.
523.
326.
780.
671.
312.
546.
463.
156.
560.
631.
512.
295.
372.
575.
650.
551.
392.
285.
300.
451.
141.
704.
481.
534.
170.
742.
760.
282.
00
te.F
rom
plot
inD
zom
bak
and
Mor
el(2
7).A
dsor
bed
cadm
ium
isgi
ven
inun
itsof
mol
/mol
Fean
daq
ueou
sC
d2+is
give
nin
mol
/L.
Tot (M
1×
12
×1
No

348 CRISCENTI AND SVERJENSKY
TABLE 3Zn2+ Adsorption onto Hydrous Ferric Oxide
pH 6.5 pH 5.5
−log (Znads) −log (Znaq) −log (Znads) −log (Znaq) −log (Znads) −log (Znaq)
4.21 7.35 2.95 6.05 4.00 5.703.89 7.00 2.68 5.53 3.62 5.203.53 6.62 2.50 5.26 3.50 4.953.16 6.51 2.40 5.05 3.45 4.952.90 6.00 2.32 4.89 3.30 4.702.25 5.32 2.20 4.74 3.10 4.501.66 4.47 2.15 4.63 3.05 4.35
2.10 4.53 2.85 4.102.05 4.42 2.82 3.902.00 4.16 2.80 3.851.84 4.10 2.70 3.751.68 3.84 2.60 3.651.53 3.58 2.55 3.581.41 3.42 2.48 3.421.32 3.32 2.40 3.351.32 3.21 2.32 3.321.26 3.13 2.30 3.251.26 3.08 2.05 2.901.13 3.00 1.90 2.701.16 2.92 1.85 2.551.05 2.89 1.80 2.501.16 2.81 1.75 2.401.05 2.81 1.70 2.351.14 2.68 1.65 2.151.13 2.57 1.60 2.050.89 2.16 1.40 1.900.74 1.940.60 1.810.53 1.700.47 1.62
Note. From plots in Dzombak and Morel (27). The first set of data is from Benjamin (15) at 0.1 M NaNO and the other two sets of data are from Kinniburgh
3and Jackson (74) at 1.0 M NaNO3. Adsorbed Zn2+ is given in units of mol/mol Fe and aqueous Zn2+ is given in units of mol/L.
33. Payne, T. E., LuPampkin, G. R., and Waite, T. D., in “Adsorption of Metalsby Geomedia: Variables, Mechanisms, and Model Applications” (E. A.Jenne, Ed.), pp. 75–97. Academic Press, New York, 1998.
34. Misra, D. N., J. Colloid Interface Sci. 28, 24–27 (1968).35. Catts, J. G., and Langmuir, D., Appl. Geochem. 1, 255–264 (1986).36. Spadini, L., Manceau, A., Schindler, P. W., and Charlet, L., J. Colloid
Interface Sci. 168, 73–86 (1994).37. Drits, V. A., Sakharov, B. A., Salyn, A. L., and Manceau, A., Clay Miner.
28, 185–207 (1993).38. Manceau, A., and Drits, V. A., Clay Miner. 28, 165–184 (1993).39. Manceau, A., and Gates, W. P., Clays Clay Miner. 45, 448–460 (1997).40. Ali, M. A., and Dzombak, D. A., Geochim. Cosmochim. Acta 60, 291–304
(1996).41. Mathur, S. S., “Development of a database for ion sorption on goethite
using surface complexation modeling.” M.S., Carnegie Mellon University,Pittsburgh, 1995.
42. Hiemstra, T., Van Riemsdijk, W. H., and Bolt, G. H., J. Colloid InterfaceSci. 133, 91–104 (1989).
43. Hiemstra, T., De Wit, J. C. M., and Van Riemsdijk, W. H., J. Colloid Inter-face Sci. 133, 105–117 (1989).
44. Hiemstra, T., and van Riemsdijk, W. H., J. Colloid Interface Sci. 179, 488–508 (1996).
45. Bargar, J. R., Towle, S. N., Brown, G. E., Jr., and Parks, G. A., Geochim.Cosmochim. Acta 60, 3541–3547 (1996).
46. Bargar, J. R., Brown, G. E., Jr., and Parks, G. A., Geochim. Cosmochim.Acta 61, 2639–2652 (1997).
47. Bargar, J. R., Brown, G. E., Jr., and Parks, G. A., Geochim. Cosmochim.Acta 61, 2617–2637 (1997).
48. Bargar, J. R., Towle, S. N., Brown, G. E., Jr., and Parks, G. A., J. ColloidInterface Sci. 185, 473–492 (1997) .
49. Manceau, A., Nagy, K. L., Spadini, L., and Ragnasdottir, K. V., J. ColloidInterface Sci. 228, 306–316 (2000).
50. Rustad, J. R., Felmy, A. R., and Hay, B. P., Geochim. Cosmochim. Acta 60,1563–1576 (1996).
51. James, R. O., and Healy, T. W., J. Colloid Interface Sci. 40, 42–52 (1972).52. Farley, K. J., Dzombak, D. A., and Morel, F. M. M., J. Colloid Interface
Sci. 106, 226– 242 (1985).53. Hayes, K. F., “Equilibrium, spectroscopic, and kinetic studies of ion adsorp-
tion at the oxide/aqueous interface.” Ph.D., Stanford University, Stanford,1987.
54. Hayes, K. F., and Leckie, J. O., in “Geochemical Processes at MineralSurfaces” (J. A. Davis and K. F. Hayes, Eds.), pp. 114–141. Am. Chem.
Soc., Washington, D.C., 1986.55. Gunneriusson, L., J. Colloid Interface Sci. 163, 484–492 (1994).

R RANGE 49
1 ot
ADSORPTION MODEL FO
TA
BL
E4
Cd2+
Ads
orpt
ion
onto
Hyd
rous
Fer
ric
Oxi
de(5
×10
−7
MC
d T)
1.3
×10
−2M
%A
ds.
pH3.
9×
10−3
M%
Ads
.pH
1.3
×10
−3M
%A
ds.
pH6.
5×
10−4
M%
Ads
.pH
1.3
×10
−4M
%A
ds.
5.41
16.1
45.
528.
216.
0813
.61
5.84
2.22
6.57
1.19
5.59
29.8
45.
8220
.75
6.14
14.3
46.
117.
606.
737.
265.
8040
.28
5.94
18.8
66.
3529
.26
6.09
10.9
07.
1420
.02
6.10
61.3
45.
9919
.96
6.47
38.6
96.
4829
.63
7.43
39.6
46.
3082
.45
5.97
27.7
46.
6049
.01
6.64
38.7
97.
8983
.89
6.51
91.5
86.
0330
.64
6.80
62.3
16.
8349
.95
6.13
39.7
07.
0072
.96
6.35
56.3
07.
1089
.75
6.40
59.6
96.
5472
.44
6.65
81.6
66.
8187
.46
ote.
Con
cent
ratio
nsof
FeT
indi
cate
din
pHco
lum
nhe
adin
gs.F
rom
Fig.
13of
Ben
jam
in(1
5).
pH
N
OF METAL CONCENTRATIONS 3
TA
BL
E5
Cd2+
Ads
orpt
ion
onto
Hyd
rous
Fer
ric
Oxi
de(1
×10
−3
MF
e T)
×10
−8M
%A
ds.
pH1
×10
−7M
%A
ds.
pH5
×10
−7M
%A
ds.
pH2
×10
−6M
%A
ds.
pH1
×10
−5M
%A
ds.
pH5
×10
−5M
%A
ds.
6.24
37.1
25.
650.
155.
937.
435.
964.
755.
991.
616.
364.
336.
3558
.51
6.00
10.7
06.
2827
.03
6.17
11.4
66.
187.
836.
5813
.56.
5065
.92
6.33
23.9
26.
5647
.54
6.45
21.8
86.
5120
.60
6.83
22.9
26.
9496
.08
6.34
32.2
16.
7967
.35
6.81
49.8
96.
6623
.98
6.99
34.0
46.
4535
.72
6.95
72.7
47.
0875
.97
6.85
41.4
17.
2145
.92
6.50
56.0
76.
9677
.04
7.31
82.0
77.
4079
.35
7.39
58.8
26.
6464
.57
7.84
97.8
87.
5696
.42
7.47
77.5
97.
8075
.82
6.60
68.4
18.
0593
.80
6.77
79.6
96.
8680
.79
7.01
85.6
67.
1287
.12
7.20
92.4
37.
9210
0.05
e.C
once
ntra
tions
ofC
d Tin
dica
ted
inpH
colu
mn
head
ings
.Fro
mFi
g.14
ofB
enja
min
(15)
.
pH
N

350 CRISCENTI AND
TABLE 6Cd2+ Adsorption onto Hydrous Ferric Oxide (1 × 10⁻² M FeT)
pH % pH % pH %2 × 10⁻⁸ M Ads. 5 × 10⁻⁸ M Ads. 2 × 10⁻⁷ M Ads.
5.28 1.06 5.31 10.45 5.36 24.075.48 20.23 5.44 12.98 5.51 28.545.73 44.94 5.56 27.49 5.63 32.595.91 61.33 5.76 44.31 5.82 47.686.18 85.38 6.02 72.02 6.05 74.986.37 96.71 6.20 80.86 6.35 85.546.37 96.71 6.35 84.21 6.56 94.43
6.45 92.29
Note. Concentrations of CdT presented in pH column headings. From Fig. 16of Benjamin (15).
56. Gunneriusson, L., Lovgren, L., and Sjoberg, S., Geochim. Cosmochim. Acta58, 4973–4983 (1994).
57. Kosmulski, M., Colloids Surf. 117, 201–214 (1996).58. Kosmulski, M., J. Colloid Interface Sci. 190, 212–223 (1997).59. Tamura, H., and Furuichi, R., J. Colloid Interface Sci. 195, 241–249 (1997).60. Tamura, H., Katayama, N., and Furuichi, R., J. Colloid Interface Sci. 195,
192–202 (1997).
61. Robertson, A. P., and Leckie, J. O., J. Colloid Interface Sci. 188, 444–472(1997).77. Shock, E. L., Sassani, D. C., Willis, M., and Sverjensky, D. A., Geochim.
Cosmochim. Acta 61, 907–950 (1997).
TABLE 7Cd2+ Adsorption onto Goethite
pH 5 log log pH 6 log log pH 7 log log pH 8 log log pH 9 log log pH 7 log log(Cd diss) (Cd ads) (Cd diss) (Cd ads) (Cd diss) (Cd ads) (Cd diss) (Cd ads) (Cd diss) (Cd ads) (Cd diss) (Cd ads)
−5.74 −3.82 −5.67 −2.57 −5.86 −1.50 −6.38 −1.20 −7.99 −1.42 −5.04 −0.94−4.83 −2.83 −4.96 −1.84 −5.09 −1.02 −5.19 −0.54 −6.52 −0.61 −4.41 −0.63−4.65 −2.60 −4.64 −1.61 −4.48 −0.76 −5.07 −0.46 −6.52 −0.45 −3.85 −0.36−4.11 −2.18 −4.28 −1.40 −4.27 −0.52 −4.96 −0.40 −5.78 −0.32 −3.54 −0.21−3.95 −2.03 −3.78 −1.00 −3.95 −0.38 −4.59 −0.29 −5.36 −0.13 −3.37 −0.15−3.68 −1.84 −3.63 −0.92 −7.39 −1.98 −5.06 0.008 −3.28 −0.11
−3.54 −0.76 −7.46 −1.98 −5.52 −1.44−3.56 −0.96 −7.94 −1.97 −4.85 −0.96−3.54 −0.92 −7.73 −1.97 −4.33 −0.71−5.51 −2.23 −4.18 −0.10 −3.83 −0.54−5.51 −2.22 −4.21 −0.10 −3.61 −0.37
−4.25 −0.09 −3.47 −0.28−3.36 −0.25−5.70 −1.48−4.92 −0.99−4.49 −0.67−3.90 −0.47−5.70 −1.50−5.00 −1.01−4.49 −0.72−4.02 −0.51−3.76 −0.40−5.10 −1.12−4.07 −0.51−3.84 −0.42−3.70 −0.34
Note. Venema (pers. comm.).
SVERJENSKY
62. Lovgren, L., Sjoberg, S., and Schindler, P. W., Geochim. Cosmochim. Acta54, 1301–1306 (1990).
63. Ludwig, C., and Schindler, P. W., J. Colloid Interface Sci. 169, 284–290(1995).
64. Palmqvist, U., Ahlberg, E., Lovgren, L., and Sjoberg, S., J. Colloid InterfaceSci. 196, 254–266 (1997).
65. Boily, J. F., and Fein, J. B., Geochim. Cosmochim. Acta 60, 2929–2938(1996).
66. Kosmulski, M., Colloids Surf. 117, 201–214 (1996).67. Sahai, N., and Sverjensky, D. A., Comput. Geosci. 24, 853–873 (1998).68. Langmuir, I., J. Am. Chem. Soc. 40, 1361–1403 (1918).69. Langmuir, D., “Aqueous Environmental Geochemistry.” Prentice Hall,
Upper Saddle River, 1997.70. Adamson, A. W., “Physical Chemistry of Surfaces.” Wiley, New York, 1990.71. Wingrave, J. A., J. Colloid Interface Sci. 183, 579–596 (1996).72. Lutzenkirchen, J., and Behra, Ph., Aquatic Geochem. 1, 375–397 (1996).73. Criscenti, L. J., “Metal adsorption onto oxides from aqueous solutions: The
influence of the electrolyte, ionic strength, and surface coverage on surfacecomplexation.” Ph.D., Johns Hopkins University, Baltimore, 2000.
74. Kinniburgh, D. G., and Jackson, M. L., Soil Sci. Soc. Am. J. 46, 56–61(1982).
75. Robertson, A. P., “Goethite/humic acid interactions and their effects oncopper(II) binding.” Ph.D., Stanford University, Stanford, 1996.
76. Katz, L. E., “Surface complexation modeling of cobalt ion sorption at thealpha-aluminum oxide-water interface: Monomer, polymer, and precipita-tion reactions.” Ph.D., University of Michigan, Ann Arbor, 1993.

ADSORPTION MODEL FOR RANGE OF METAL CONCENTRATIONS 351
TABLE 8Co2+ Adsorption onto Magnetite over a Range of Metal Concentrations
pH 6 log(Aq) log Ads. (mol/m2) pH 6.5 log(Aq) log Ads. (mol/m2) pH 7.0 log(Aq) log Ads. (mol/m2) pH 8 log(Aq) log Ads. (mol/m2)
−7.8 −9.9 −8.1 −9.3 −8.6 −9.1 −9.5 −9.0−6.8 −8.9 −7.2 −8.7 −7.6 −8.1 −8.4 −8.0−5.8 −7.9 −6.0 −7.6 −6.4 −7.1 −5.5 −6.2−4.8 −7.1 −4.9 −6.6 −5.1 −6.7 −3.8 −5.6
−3.8 −6.1 −3.8 −5.8
Note. Tamura et al. (81).
78. Hogfeldt, E., “Stability Constants of Metal-Ion Complexes. Part A: Inor-ganic Ligands.” Pergamon Press, Oxford, 1982.
79. Yates, D. E., Greiser, F., Cooper, R., and Healy, T. W., Australian J. Chem.30, 1655–1660 (1977).
80. Hayes, K. F., Redden, G., Ela, W., and Leckie, J. O., J. Colloid InterfaceSci. 125, 717–726 (1991).
81. Tamura, H., Matijevic, E., and Meites, L., J. Colloid Interface Sci. 92,303–314 (1983).
82. Davis, J. A., “Adsorption of trace metals and complexing ligands at theoxide/water interface.” Ph.D., Stanford University, Stanford, 1977.
83. Helgeson, H. C., Kirkham, D. H., and Flowers, G. C., Am. J. Sci. 281,
1249–1516 (1981).84. Hiemstra, T., and van Riemsdijk, W. H., Colloids Surf. 59, 7–25 (1991). Meeting of the American Chemical Society, Orlando, 2002.
TABLE 9Co2+ Adsorption onto Corundum
pH (0.2 g/L) % Ads. pH (2.0 g/L) % Ads. pH (20 g/L) % Ads.
6.30 1.46 6.62 0.29 5.46 0.006.50 0.58 6.17 7.68 5.81 7.216.80 1.24 6.90 35.43 5.96 13.126.96 4.38 7.12 61.07 6.06 17.57.15 4.23 7.56 87.09 6.15 23.937.59 15.02 8.26 97.24 6.30 32.647.84 42.29 6.30 38.468.48 76.64 6.54 55.378.92 88.97 6.50 57.85
6.58 69.846.67 73.486.78 82.506.93 91.527.02 91.437.17 93.317.13 95.957.30 97.607.30 96.107.49 98.607.59 94.427.84 99.478.32 96.548.89 98.88
Note. Total Co: 2 × 10⁻⁶ M. Katz (76).
85. Ford, R. G., Bertsch, P. M., and Farley, K. J., Environ. Sci. Technol. 31,2028–2033 (1997).
86. Schwertmann, U., Friedl, J., and Stanjek, H., J. Colloid Interface Sci. 209,215–223 (1999).
87. Towle, S. N., Bargar, J. R., Brown, G. E., Jr., and Parks, G. A., J. ColloidInterface Sci. 187, 62–82 (1997).
88. Honeyman, B. D., and Leckie, J. O., in “Geochemical Processes at MineralSurfaces” (J. A. Davis and K. F. Hayes, Eds.), pp. 162–190. Am. Chem.Soc., Washington, D.C., 1986.
89. Bargar, J. R., Brown, G. E., Jr., and Parks, G. A., Geochim. Cosmochim.Acta 62, 193–207 (1998).
90. Bargar, J. R., Fuller, C. C., and Davis, J. A., Abstracts, 223rd National

D
352 CRISCENTI ANTABLE 10Co2+ Adsorption onto Corundum
pH % Ads.
6.45 2.56.7 4.56.8 56.9 16.85 106.9 66.9 57.2 7.57.3 87.2 107.05 177.12 207.3 167.38 367.39 407.395 387.55 437.65 427.7 587.75 667.8 687.75 737.9 768.30 928.37 968.39 97
Note. Total Co: 1 × 10⁻⁴ M. Solid: 2 g/L. Katz (76).
SVERJENSKY
TABLE 11Co2+ Adsorption onto Corundum
Conc. Aq. Conc. Ads. Conc. Aq. (mol/L) Conc. Ads. (mol/L)(mol/L) (mol/L) (≥10% Surf. Cov.) (≥10% Surf. Cov.)
7.00 × 10⁻⁷ 3.10 × 10⁻⁷ 2.00 × 10⁻⁴ 1.38 × 10⁻⁵
8.00 × 10⁻⁷ 2.50 × 10⁻⁷ 2.00 × 10⁻⁴ 1.68 × 10⁻⁵
7.50 × 10⁻⁶ 1.50 × 10⁻⁶ 3.60 × 10⁻⁴ 1.38 × 10⁻⁵
8.00 × 10⁻⁶ 1.75 × 10⁻⁶ 4.00 × 10⁻⁴ 1.56 × 10⁻⁵
9.50 × 10⁻⁶ 1.88 × 10⁻⁶
2.00 × 10⁻⁵ 2.00 × 10⁻⁶
2.80 × 10⁻⁵ 4.50 × 10⁻⁶
6.00 × 10⁻⁵ 4.00 × 10⁻⁶
9.00 × 10⁻⁵ 7.00 × 10⁻⁶
2.00 × 10⁻⁴ 1.00 × 10⁻⁵
3.00 × 10⁻⁴ 8.00 × 10⁻⁶
Note. Katz (76). Isotherm at pH 6.9.
TABLE 12Co2+ Adsorption onto Corundum
Conc. Aq. Conc. Ads. Conc. Aq. (mol/L) Conc. Ads. (mol/L)(mol/L) (mol/L) (≥10% Surf. Cov.) (≥10% Surf. Cov.)
2.40 × 10⁻⁷ 1.88 × 10⁻⁶ 1.40 × 10⁻⁵ 1.60 × 10⁻⁵
2.00 × 10⁻⁶ 2.80 × 10⁻⁶ 3.67 × 10⁻⁵ 4.50 × 10⁻⁵
2.17 × 10⁻⁶ 3.00 × 10⁻⁶ 5.00 × 10⁻⁵ 5.00 × 10⁻⁵
2.83 × 10⁻⁶ 6.00 × 10⁻⁶ 7.00 × 10⁻⁵ 8.00 × 10⁻⁵
1.10 × 10⁻⁴ 1.00 × 10⁻⁴
2.00 × 10⁻⁴ 1.00 × 10⁻⁴
2.16 × 10⁻⁴ 1.00 × 10⁻⁴
Note. Katz (76). Isotherm at pH 7.6.