a single atom change turns insulating saturated wires into
TRANSCRIPT

A Single Atom Change Turns Insulating SaturatedWires into Molecular ConductorsXiaoping Chen
National University of SingaporeBernhard Kretz
Technical University of MunichFrancis Adoah
University of Central FloridaCameron Nickle
University of Central FloridaXiao Chi
National University of SingaporeXiao-Jiang Yu
National University of Singapore https://orcid.org/0000-0002-7044-6417Enrique del Barco
University of Central Florida https://orcid.org/0000-0002-5763-0076Damien Thompson
University of Limerick https://orcid.org/0000-0003-2340-5441David Egger
University of Regensburgchristian nijhuis ( [email protected] )
National University of Singapore https://orcid.org/0000-0003-3435-4600
Article
Keywords: tunnelling methods, terminal-atom substitution, new charge transport models, moleculartunnelling junctions
Posted Date: September 9th, 2020
DOI: https://doi.org/10.21203/rs.3.rs-69097/v1
License: This work is licensed under a Creative Commons Attribution 4.0 International License. Read Full License

Version of Record: A version of this preprint was published at Nature Communications on June 8th, 2021.See the published version at https://doi.org/10.1038/s41467-021-23528-8.

1
A Single Atom Change Turns Insulating Saturated Wires
into Molecular Conductors
Xiaoping Chen1,2, Bernhard Kretz3, Francis Adoah4, Cameron Nickle4, Xiao Chi5, Xiaojiang
Yu5, Enrique del Barco4, Damien Thompson6, David A. Egger3*, and Christian A. Nijhuis1,2*
1Department of Chemistry, National University of Singapore, 3 Science Drive 3, Singapore
117543, Singapore.
2Centre for Advanced 2D Materials and Graphene Research Centre, National University of
Singapore, 6 Science Drive 2, Singapore 117546, Singapore.
3Department of Physics, Technical University of Munich, 85748 Garching, Germany
4Department of Physics, University of Central Florida, Orlando, Florida 32816 - USA
5Singapore Synchrotron Light Source, National University of Singapore, 5 Research Link,
Singapore 117603, Singapore.
6Department of Physics, Bernal Institute, University of Limerick, V94 T9PX, Ireland
*Correspondence to: [email protected]; [email protected]

2
Abstract:
We present an efficient strategy to modulate tunnelling in molecular junctions by changing the
tunnelling decay coefficient, β, by terminal-atom substitution which avoids altering the
molecular backbone. By varying X=H, F, Cl, Br, I in junctions with S(CH2)(10-18)X, current
densities (J) increases >4 orders of magnitude, creating molecular conductors via reduction of
β from 0.75 to 0.25Å-1. Impedance measurements shows tripled dielectric constants (εr) with
X=I, reduced HOMO-LUMO gaps and tunnelling-barrier heights, and 5-times reduced contact
resistance. These effects alone cannot explain the large change in β. Density-functional theory
shows highly localized, X-dependent potential drop at the S(CH2)nX//electrode interface that
modifies the tunnelling barrier shape. Commonly-used tunnelling models neglect localized
potential drops and changes in εr. We demonstrate experimentally that 𝛽 ∝ 1/√𝜀', suggesting
highly-polarizable terminal-atom sites act as charge traps as proposed by Berlin and Ratner.
Our work shows the need for new charge transport models that account for dielectric effects in
molecular tunnelling junctions.
Introduction
Significant effort has been dedicated to study and manipulate tunnelling rates across
molecular wires, which serve as model systems to improve our understanding of the
mechanisms of charge transport across molecules which, in turn, play a central role in, e.g.,
biological processes, catalysis, and energy conversion.1, 2, 3, 4 It is well-known that the
tunnelling current density (J in A/cm2) decreases exponentially with the length of the molecular
wire (d in Å) given by the general tunnelling equation
𝐽 = 𝐽*(𝑉)𝑒/01 = 𝐽*(𝑉)10/01/3.5*5 , (1)
where J0 is a pre-exponential factor and the tunnelling decay coefficient (β in Å-1) determines
how quickly the measured current decays with d.2, 5, 6, 7 In this context, unsaturated molecules
with conjugated π-bonds are usually thought of as “molecular conductors” with low values of

3
β (0.1-0.4 Å-1)2, 5, 8, 9, 10 and saturated molecular wires with localized σ-bonds provide
“molecular insulators” with large values of β (0.8-1.2 Å-1)2, 5, 7, 11, 12, 13. This rule of thumb
stands in sharp contrast with the high tunnelling rates established for various biomolecules,14,
15 molecular wires of oligo-peptides,16, 17 and oligosilanes18. These all have saturated molecular
backbones yet they exhibit low values of β (0.1-0.5 Å-1), and support long-range tunnelling
over remarkably large distances of up to tens of nanometres 15, 19, 20.
Here, we show that the value of β of molecular wires with an alkyl chain backbone can be
reduced from 0.75 Å-1 to 0.25 Å-1, in effect turning them from insulators into conductors, by
introducing one distal polarizable atom at one end of the molecular wire of the form
HS(CH2)nX, with X = H, F, Cl, Br, or I, with n = 10-18 (only even values of n). To the best of
our knowledge, this is the first example of tuning β across alkyl chains opening up new ways
to control tunnelling rates in junctions. On the basis of experimental and theoretical data, we
discuss how introducing this polarizable atom changes the electrostatic potential profile of the
tunnelling barrier, the static dielectric constant (εr) of the junction, and the contact resistance,
which are important to consider when modifying tunnelling efficiency across molecular wires.
So far, it has been challenging to engineer β in experiments, and this difficulty is also
reflected in various established mechanisms of charge transport across molecular wires. Often,
coherent tunnelling is assumed (Eq. 1), where β can be related to the tunnelling barrier height
𝛿𝐸89 (defined by the offset in energy between the energy of the Fermi level, EF, of the
electrode and the energy of the molecular frontier orbital relevant for charge transport), as 𝛽 ∝:𝛿𝐸89 .2, 5, 21 This explains why conjugated molecules, which often have frontier orbitals
aligned close to EF, have lower values of β than saturated molecules, which have frontier
orbitals further from EF. Conversely, in the McConnell superexchange model, charge carriers
tunnel via virtual states defined by the repeat units of the molecular wire; here, the tunnelling
rate depends on the interaction strength between the repeat units of the molecular bridge.2, 5, 22,

4
23, 24 This model has been used to explain low β values (0.2-0.5 Å-1) measured across tunnel
junctions with self-assembled monolayers (SAMs) that have σ-bond backbones of
oligoglycines,16 oligoprolines,25 and oligoglycols17. Furthermore, for very long molecules (e.g.,
proteins), a flickering resonance model has been proposed to explain long-range tunnelling and
low β values.15, 26, 27 Finally, different types of hopping models have been proposed to explain
low β values of, for instance, bacterial nanowires,26 DNA,28 proteins,29 and long conjugated
molecular wires18, 30, 31, 32; here the value of β also depends on the coupling strength between
the repeat units, but these models predict a thermally activated component10, 30, 31, 32. To
summarize, all previous models suggest the necessity of tuning the chemical nature of the
molecular wire in order to change the value of β.
We note that the value of β also depends, besides the chemical nature of the molecular
backbone,2, 5, 15, 16, 17 on the molecule−electrode coupling strength Γ that is naturally related to
𝛿𝐸8931, 33, 34. For molecular wires, where 𝛿𝐸89 decreases with the number of repeat units due
to an increase in conjugation with increasing molecular length, extremely low (<0.1 Å-1)30, 31,
35, 36 and even negative β values have been reported35, 37, 38, 39, 40. Such low β values are also a
signature of incoherent hopping and these junctions, in particular those containing redox
centres, may operate in this hopping regime (also called incoherent tunnelling regime).30, 31, 37
So far, the influence of electrostatic effects in molecular tunnelling junctions on β has been
largely ignored. One way of quantifying trends in the electrostatics of various systems is by
studying the εr of molecular junctions, a macroscopic observable that can be measured via
impedance spectroscopy.41 Previous work focused mainly on p-conjugated systems and
established that in densely-packed SAMs, εr hardly changes when the polarizability of the
molecules of a SAM, α, is tuned due to depolarization effects (e.g., induced dipoles in
neighbouring molecules).42, 43, 44 However, it is not known how α affects the tunnelling
behaviour of junctions in which depolarization effects are reduced to a minimum. In addition,

5
the molecular ionization potential (IP) directly relates to α and, consequently, changing α
affects molecular frontier orbital energies45, 46 and the energy level alignment of
molecule−electrode interfaces47, 48, but it is disputed whether an increase in α changes the
conductance of the junction46, 47, 48, 49. Also not currently understood is how α affects the
relationship between εr and β. In principle, polarizable groups screen applied electric fields50
or result in an induced dipole and, therefore, also affect the potential drop profile inside
junctions46, 47, 51. Thus, polarizable atoms or moieties are expected to have a large effect on the
measured tunnelling rates, but so far experimental examples are rare and conflicting.46, 47, 49, 51
Here, we show that by introducing a single polarizable atom per molecule inside the junctions,
the value of β can be reduced by a factor of 3 without changing the chemical structure of the
backbone of the molecular wire. In terms of absolute values of J along long molecular wires of
S(CH2)18X, the value of J increases by a factor of 104.5 when X is changed from H to I. Our
results demonstrate how an increasing polarizability of X changes the energy level alignment,
the molecule−electrode coupling, and εr. These findings may stimulate new strategies for
optimizing tunnelling rates across junctions.
Results and Discussions
The Junctions. Figure 1 shows a schematic illustration of the Ag-S(CH2)nX//GaOx/EGaIn
junctions with n = 10, 12, 14, 16, or 18, and X = H, F, Cl, Br, or I, and indicates how the
coupling and energy level alignment (i.e., Γ and δEME) change with X as discussed in detail
below. The schematic also includes the equivalent circuit consisting of the contact resistance
(RC, in mΩ•cm2) in series with a parallel combination of the SAM resistance (RSAM, in Ω•cm2)
and the capacitance of the SAM (CSAM, in µF/cm2) in the junction. It highlights that the
junctions are essentially parallel plate capacitors in which dielectric behaviour depends on the
chemical structure of the junctions, which, as we show below, is also important to explain

6
tunnelling rates. All SAM precursors were synthesized following previously reported methods
and characterised with 1H NMR, 13C NMR, and mass spectroscopy (Sections S1-2). The SAMs
were formed on template-stripped Ag electrodes using well-established methods and the
junctions were completed with cone-shaped GaOx/EGaIn top contacts52 (Sections S3 and S6).
Previously, we have reported that for EGaIn junctions with S(CH2)nX SAMs (there only n =
11 was studied) the measured current increased by 3 orders of magnitude and the value of εr
increased by a factor of 4, when X was changed along the halogen series from F to I46. Here
we address whether this increase in current is caused by changes in RC or changes inherent to
the tunnelling process (i.e., b). Changing the value of n for each X allows us to investigate in
detail how and why β changes as a function of X while keeping the nature of the molecule-
electrode interfaces and the molecular backbone the same.
Figure 1. (a) Schematic illustration of the Ag-S(CH2)nX//GaOx/EGaIn junction (shown for n
= 14) together with the equivalent circuit diagram. In this work we investigated junctions with
n = 10, 12, 14, 16, or 18, and X = H, F, Cl, Br, or I. (b) Energy level diagram of the junction
showing how ΓandδEMEchange with X.

7
Characterisation of the SAMs. We characterised the SAMs on Ag with n = 14 for X = H, F,
Cl, Br, or I, and n = 10, 14, or 18 for X = Br with angle resolved X-ray photoelectron
spectroscopy (ARXPS) and molecular dynamics (MD) simulations (for all combinations of n
and X) and all results are summarized in Table 1 (see Sections S4-5 for details). Figure 2a
shows a representative snapshot from the MD simulations of Ag-S(CH2)14I SAM with
computed molecule heights in excellent agreement with film thicknesses dSAM measured by
XPS (Figs. 2b-c, Table 1) indicating that the S(CH2)14I precursor readily forms dense layers
with all molecules in a fully-upright position. We determined the relative values of surface
coverage (ΨSAM) with XPS which confirms that all SAMs have indistinguishable packing
densities (Figs. 2b-c) within experimental error. The value of dSAM,MD increases by about 1.4
Å overall on increasing van der Waals radius of X from H to I (Table S1), but this small increase
falls within the experimental error of dSAM,XPS (Fig. 2b). Figure 2c shows that for X = Br,
dSAM,XPS increases linearly with n with a slope of 1.5 ± 0.1 Å per carbon (solid blue line, error
represents standard error from linear fit), which is in close agreement with the MD value of 1.3
± 0.1 Å per carbon (dashed blue line; see Fig. S11 for dSAM,MD values of all the SAMs). Figure
2d shows the packing energies per molecule (Emol,MD, in eV) and per methylene CH2 unit
(Emeth,MD, in meV) extracted from the MD calculations. The values of Emol,MD and Emeth,MD
improve slightly as X shifts from H (-1.8 ± 0.1 eV per molecule) to Br (-2.4 ± 0.2 eV per
molecule), which is due to the increasing intermolecular van der Waals interaction. For SAMs
with X = I, the packing energies weaken slightly due to small competing effects caused by mild
steric repulsion between the large I headgroups. These observations confirm that the halogen
functionality does not significantly disrupt the supramolecular structure of the SAM. Finally,
we determined the energy level alignment of the SAMs on Ag using ultra-violet photoemission
spectroscopy (UPS) in Section S4 and Fig. S10, which we used to validate our DFT calculations
as discussed in more detail below (Table 1).

8
Figure 2. (a) Representative slice-through of a large-area Ag-S(CH2)14I SAM structure
calculated by MD computer simulations. (b) ΨSAM of Ag-S(CH2)14X SAMs as a function of X
determined with ARXPS (filled circles) and dSAM determined with ARXPS (filled triangles)
and MD (empty triangles). (c) ΨSAM of Ag-S(CH2)nBr SAMs as a function of n determined
with ARXPS (filled circles) and dSAM determined with ARXPS (filled triangles) and MD (open
triangles). The solid and dashed blue lines are linear fits to the experimental and MD data with
R2 of 0.94 and 0.99, respectively. The horizontal dashed line in panels b and c indicates the
ΨSAM used in the MD calculations. (d) Computed MD packing energy per molecule Emol,MD
and per methylene -CH2- unit Emeth,MD of Ag-S(CH2)14X SAMs as a function of X. Dashed lines
are guides to the eye. The errors on the XPS data represent instrumental and fitting errors of
10% in total (see Section S4). The error bars in the MD data represent the standard deviations
in the time- and molecule-averages calculated across 500 snapshots taken during the final 50

9
ns of 100 ns of room temperature MD of 128-molecule Ag-S(CH2)14X SAMs with the average
experimental coverage of 1 nmol/cm2 on Ag(111).
Table 1. Summary of properties of the Ag-S(CH2)14X and Ag-S(CH2)nBr SAMs
X and n ΨSAM,XPS
(nmol/cm2)a dSAM,XPS
(Å) dSAM,MD
(Å) Emol,MD
(eV) ΦSECO (eV)b
ΦDFT (eV)
β (Å-1)
εr εDFT-
VdW
n = 14, X = H 0.74 18 20.4±0.5 -1.8±0.1 3.46 3.76 0.75±0.04 2.9±0.3 2.2 n = 14, X = F 1.0 21 21.1±0.3 -2.0±0.1 4.42 5.05 0.70±0.02 2.5±0.6 2.2 n = 14, X = Cl 0.86 21 21.5±0.3 -2.2±0.2 4.45 5.33 0.60±0.03 3.0±0.2 2.3 n = 14, X = Br 1.1 20 21.7±0.3 -2.4±0.2 4.34 5.36 0.39±0.04 4.7±0.9 2.3 n = 14, X = I 1.2 21 21.8±0.3 -2.2±0.1 4.05 5.26 0.25±0.01 8.9±1.6 2.4
n = 10, X = Br 1.0 15 16.2±0.4 -1.7±0.1 4.28 - - 4.4±0.4 - n = 18, X = Br 1.1 29 26.8±0.3 -3.0±0.2 3.96 - - 4.6±0.2 -
a The ΨSAM,XPS are relative to ΨSAM of Ag-S(CH2)14F SAM as measured by XPS. b The experimental error is ±0.05 eV.
Electrical characterisation of the junctions. To study how the halogen functionality affects
the tunnelling rates across the SAMs, we measured the electrical characteristics of the junctions
as a function of X and n using J(V) measurements and impedance spectroscopy. The SAMs
were contacted with cone-shaped GaOx/EGaIn electrodes following a previously reported
method.52 To minimize leakage currents and to ensure that molecular effects dominate the
junction characteristics, we used junctions with a small contact area of ~350 µm2, as large
junctions suffer from leakage currents across defective sites.53 We recorded statistically large
numbers of J(V) curves to determine the Gaussian log-average J(V) curves, <log10|J|>G, and
associated Gaussian log-standard deviations (σlog,G) which are plotted in Fig. 3a for junctions
with X = F, and in Fig. 3b for junctions with X = I, for n = 10-18 (all Gaussian log-average
J(V) curves and histograms of the log10|J| at ±0.5 V are given in Section S6). Clearly, the
tunnelling rates are more attenuated for X = F than for X = I. Figure 3c shows the decay of
<log10|J|>G at –0.5 V as a function of dSAM,MD (Section S5, Table S1) for all X. The solid lines
are fits to Eq. 1 from which we determined the values of β which are listed in Table 1.
Interestingly, the value of β steadily decreases from 0.75 ± 0.01 Å-1 for X = H – a typical value
for tunnelling along alkyl chains – to 0.25 ± 0.01 Å-1 for X = I which is a typical value for

10
tunnelling along π-conjugated molecules (the error in β represents the standard error of the fit
to Eq. 1). We measured the J(V) characteristics as a function of temperature, T in K, of Ag-
S(CH2)14X//GaOx/EGaIn junctions for all X. Figure 3d shows that the tunnelling rates are
independent of T in the range of T from 250 to 340 K which is consistent with coherent off-
resonant tunneling.54
Figure 3. <log10|J|>G vs. V obtained from Ag-S(CH2)nX//GaOx/EGaIn junctions with X = F (a)
or I (b) and n = 10 (solid black line), 12 (solid red line), 14 (solid blue line), 16 (solid pink
line), and 18 (solid green line). The dashed-line error bars represent the Gaussian log-standard
deviation, σlog,G. (c) Decay plots of <log10|J|>G at –0.5 V against dSAM,MD with X = H (black
square), F (red circle), Cl (blue triangle), Br (pink inverted triangle), or I (green diamond). The
solid lines are fits to Eq. 1. The dashed lines represent the 95% confidence bands. (d) Plots of

11
log10|J| vs. V as a function of T (T = 250 – 340 K) recorded from Ag-S(CH2)14X//GaOx/EGaIn
junctions.
Dielectric constant of the junctions. To characterise the dielectric response of the junctions,
we conducted impedance spectroscopy using a sinusoidal voltage perturbation with an
amplitude of 30 mV around 0 V in the frequency range of 100 Hz to 1.00 MHz and the data
were fitted to the equivalent circuit shown in Fig. 1a following a previously reported method41
(See Section S7 for details). Figs. S21 shows the Bode, Nyquist, and the corresponding phase
angle (ϛ) vs. frequency (f) plots along with the fits to the equivalent circuit (Tables S7-9 list all
fitting results). Figure 4a shows that RC decreases by a factor of 5 when X is changed from H
or F to I while RC is independent of n (inset to Fig. 4b). This change in RC is substantially larger
than the odd-even effect in RC which results in a 2.5 mΩ/cm2 modulation of RC in S(CH2)n-
1CH3 SAMs55 and indicates that Γ substantially increases as function of X. This increase in Γ
can be rationalized by the increase in polarizability α and associated induced dipoles as a
function of X resulting in an increase in the van der Waals interaction strength between the
SAM and the top contact.46
To confirm the consistency between the J(V) and impedance measurements, we determined
the value of β from the impedance measurements for junctions with X = Br. The value of RSAM
increases exponentially with n (Eq. 2)
𝑅CDE = 𝑅CDE,*(𝑉)𝑒01GHI,IJ = 𝑅CDE,*(𝑉)1001GHI,IJ/3.5*5 (2)
where RSAM,0 is a pre-exponential factor. Figure 4b shows the plot of log10RSAM vs. n along with
a fit to Eq. 2 from which we extracted the values of β = 0.41 ± 0.03 Å-1 and log|J0| = 2.0 ± 0.2
A/cm2 which are, within error, the same as those values determined with the J(V)
measurements (Fig. 3c and Table 1).

12
To gain further insight into the dielectric properties of the junctions, we use the parallel
plate capacitor equation (Eq. 3) to determine εr as a function of X and n
𝐶CDE = 𝜀*𝜀' LMNO1GHI,IJ (3)
wherein ε0 is the vacuum permittivity and Ageo is the geometrical area of the junction. Figure
4c shows that εr increases by a factor of 3 by changing X from H or F to I, yet εr is independent
of n (Tables S8-9). Although this factor 3 increase in εr is expected for bulk systems which can
be described via the Clausius-Mosotti relation,56 this observation cannot be explained as an
intrinsic electrostatic property of the molecular wires, as we will show and discuss below.

13
Figure 4. (a) RC vs. X for Ag-S(CH2)14X//GaOx/EGaIn junctions at 0 V. (b) log10RSAM and RC
(inset) vs. n for Ag-S(CH2)nBr//GaOx/EGaIn junctions at 0 V. The solid black line represents a
fit to Eq. 2. (c) εr vs. X for Ag-S(CH2)14X//GaOx/EGaIn junctions at 0 V. The error bars are
the standard deviations of three independent measurements. Dashed lines are visual guides.
Density functional theory calculations. To provide further microscopic insight into the
electrostatic properties and electronic structure of the molecular wires, we performed first-
principles calculations based on DFT using the VASP code57 (see Section S8 for full details).
For Ag-S(CH2)14X, we find significantly different tilting angles with respect to the surface
normal, which span the range of 14.7° (X=H) to 32.8° (X=Cl). Note that these calculated
interface geometries are the result of a 0 K optimization of a single-molecule unit cell.
Fig. 5a shows that the shape of the potential energy towards the tail of the alkyl chain
strongly depends on the functionalization at the X site. Specifically, the vacuum level changes
with X functionalization owing to the polarity of the C-X bond, which translates into a change
of the Ag work function, Φ, as expected for SAMs with different tail groups.46, 47, 58, 59, 60
Comparing the DFT-calculated Φ to the experimental Φ, it can be seen that the agreement for
X=H is excellent (Fig. 5b), while both the absolute values and to a lesser degree also the
chemical trends agree not as favourably for the halogen-substituted systems. We tentatively
ascribe these deviations to the often observed overestimation of polar effects in periodic DFT
calculations of metal-SAM interfaces due to the assumption of perfect molecular order and
periodicity,61 while practical systems have defects (e.g., step edged, grain boundaries, or phase
domains) and are dynamic in nature53, 62.
Fig. 5c reports the density of states (DOS) projected onto the molecular part of Ag-
S(CH2)14X. All systems show a feature at ~1.5 eV (marked by * in Fig. 5c) that is due to Ag-S
hybridization (see Section S8). Interestingly, we find that lower lying occupied states as well

14
as the lowest unoccupied state strongly shift in energy (on the order of 1-2 eV) with varying X
(see arrows in Fig. 5c). These energy shifts clearly correlate with X functionalization and
increase in magnitude along the halogen series, so that the X=I SAM shows pronounced new
features close to the band edges when compared to the X=H or X=F SAM. Fig. 5d shows the
DOS projected onto just the X-site in Ag-S(CH2)14X, which confirms that these new occupied
and unoccupied states are due to the halogen functionalization. For both the occupied and
unoccupied parts of the DOS, these halogen-derived states do partially overlap in energy with
other features but are localized primarily at the tail of the SAM (see Section S8).
Finally, we determined εr as a function of X for the free-standing and hydrogen-terminated
HS(CH2)14X SAMs using previously reported protocols44, 63 (see Table 1 and Section S8). In
contrast to the above-discussed experimental results, we find that εr hardly changes with X
functionalization in our DFT calculations. This result is expected from purely electrostatic
reasoning and fully in line with previous work by various groups.42, 43, 44 Briefly, in these studies
it has been shown from electrostatic and DFT calculations that varying the molecular
polarizability of the SAM-forming molecules does not result in significant changes of εr in the
densely-packed conjugated SAMs due to depolarization effects arising from the neighbouring
molecular dipoles in the SAM42, 43, 44. Therefore, the calculations show that tuning the
molecular polarizability by changing X does not strongly impact the calculated εr of the
HS(CH2)14X SAM.

15
Figure 5. (a) DFT-calculated plane-averaged electrostatic potential of Ag(111)-S(CH2)14X
where X = H, F, Cl, Br, or I, along the surface-normal coordinate. (b) Work function (Φ) of the
SAMs, calculated from DFT (red squares) and measured experimentally (black dots). Density
of states (DOS) projected onto the molecular backbone (c) and onto the X-site (d) of Ag(111)-
S(CH2)14X. Note that X contributes very little to the band edges for X=H, F.
Discussion. Our theoretical finding that X functionalization does not dramatically alter εr of
the SAM is in line with electrostatic considerations discussed in previous theoretical work.42,
43, 44 As pointed out by Kronik et al.,43 a competition between suppression of in-plane
polarization and enhancement of out-of-plane polarization occurs in SAMs. The suppression
dominates for densely-packed SAMs and, thus, the substituent X should not affect the
a b
d c

16
calculated εr of the SAM in sharp contrast to our experimental findings59. Our calculations as
well as previous theoretical studies, however, only probe the intrinsic dielectric properties of
the isolated highly organized SAM without contacts. The interaction between the SAM and the
top electrode that is naturally present in the experimental determination of εr could affect the
dielectric behaviour of the junction considerably, which would be consistent with the
experimentally recorded trends for the RC shown in Fig. 4a. Given the high electric fields on
the order of GV/m and the polarizable nature of X, the substituents may be partially charged
during charge transport (especially iodines are well-known to readily accommodate
electrons)64, 65. We note that the physical significance and so predictive power of periodic DFT
calculations previously reported by some of us46 were limited by simulation artefacts of
uncompensated dipoles in the unit cell which may have created a spurious correlation with
measured εr values.
In the following, we discuss our results in the context of commonly used models to
interpret charge transport through the S(CH2)nX molecular junctions. The single-level
Landauer model is frequently used to model the current flowing across molecular tunnel
junctions.66 The single-level Landauer model is also frequently used to model the current
flowing across molecules junctions.66 Here we modelled the current using the following
expression:
𝐼 = 𝑁 RS∬ 𝑑𝐸V
/V 𝑑𝐸′𝐷9Y(𝐸)𝐺[9\](𝐸′) ^_^`^_a^` [𝑓d(𝐸) − 𝑓f(𝐸)], (4)
where 𝑁 is the number of molecules contributing to conduction, 𝛾d and 𝛾f are the tunneling
rates between the molecule and the left and right electrodes (respectively), and 𝑓d(𝐸) and
𝑓f(𝐸) are the Fermi functions representing the electronic occupation of the left and right
electrodes, respectively.66 In addition, 𝐷9Y(𝐸) is the electronic density of states of the
molecular level given by the following normalized Lorentzian function

17
𝐷9Y(𝐸) = ^ 3i⁄k9/l9maln/opqrqs
pa(^ 3⁄ )p, (5)
centred at energy 𝐸Y + l𝜂 − v3q 𝑉, where 𝜂 = 𝑉f/(𝑉d + 𝑉f) is the voltage division parameter
accounting for the capacitive coupling with the left and right electrodes, and with a level width
𝛾 = 𝛾d + 𝛾f , where 𝛾d,f are the electron tunneling rates between the molecule and the
respective electrodes. A Gaussian function (with center𝛿𝐸Ew and width 𝜎) represents the
inherent dispersion (𝜎) of the molecular level energy (𝛿𝐸89 ) in an ensemble of molecules
(rather than a single-molecule junction), as given by the following expression:
𝐺[9\](𝐸Y) = 𝐴𝑒𝑥𝑝|(𝐸Y − 𝛿𝐸Ew)32𝜎3 ~ (6)
Good fittings to the data for all molecules (Fig. 6a and Table S11) are achieved for T = 300 K
and the following common parameters are obtained across all molecules: 𝑁 = 50, 𝜂 ∈ 0.48 ±0.02, and 𝜎 = 0.19𝑒𝑉. Figures 6b and 6c show the two parameters that vary across molecules:
the energy 𝛿𝐸89 of the frontier orbital, which decreases on moving through the sequence H-
F-Cl-Br-I (Fig. 6b), in agreement with the behaviour observed in spectroscopic data and
determined by DFT calculations (although of lower values due to energy renormalization
absent in our DFT calculations), and the overall tunnelling rate through the junction (i.e.,
molecule—electrode coupling strength), defined as 𝛤 = ^_^`^_a^`, which increases exponentially
along the halogen sequence (Fig. 6c) and accounts for the observed exponential increase of the
current through the junctions.
Figure 6e shows a linear relationship between calculated :𝛿𝐸89 and measured β, which
agrees with commonly used coherent tunnelling models2, 5, 21 including the Simmons model
which also accounts for εr. However, the Simmons model also predicts a decrease of the
tunnelling rates with increasing εr due to a reduction of the image charge effects in the

18
electrodes due to screening within the SAM.21, 67 This reduction of image charge in effect
increases δEME and, consequently, b, but we observe the opposite trend. Using the same model,
a reduction of the effective electron mass could also account for an increase in tunnelling rates,
but it is not clear how the effective electron mass would change as a function of X with the
essentially localized features derived from the highest occupied molecular orbital (HOMO) and
lowest unoccupied molecular orbital (LUMO). Furthermore, Vilan argued that changes in the
electron mass are equivalent to changes in the 𝛿𝐸89 within the Simmons model, which further
complicates the interpretation of our findings within this framework.68
The experimentally determined values of 𝑅�have been related to 𝛤 as 𝑅� ∝ 𝛤/3,34 i.e.,
the coupling of the molecules with the electrode we have determined above (Fig. 6e). To test
whether this holds for the SAMs studied here, Fig. 6e shows a double-log plot of RC vs. 1/𝛤2
indicating that our results can be explained, at least qualitatively, using this picture: changes in
both 𝛿𝐸89 and 𝛤 can lower β, in accordance with findings by others.10, 30, 31, 32, 33, 34, 35, 36, 37, 38,
39, 40 This approach, however, does not capture the observed changes in the dielectric response
of the junctions directly, and, of course, it does not explicitly account for the local changes in
the electrostatic potential profile induced by X observed in the DFT calculations; these effects
are essentially compensated by the large change in Γ of 3 orders of magnitude.
An interesting finding was reported by Berlin and Ratner based on an alternative model to
describe tunnelling across barriers with charge traps, with the finding that 𝛽 ∝ 1/√𝜀' .69 In
this framework, the distance dependence of the conductance is related to a thickness-dependent
barrier akin to the one inherent to the Simmons model.68, 70 In their model, however, the barrier
arises from the presence of localized charge traps along the path of charge migration leading
to a non-linear potential drop between the macroscopic leads. Figure 6f shows the linear
relation of the double-log plot of β vs.𝜀' with a slope of -0.82 which is lower than the expected
-0.5 from the model by Berlin et al.69, but note that a change in the contact resistance or further

19
changes in the barrier shape are not taken into consideration in this model. In our experiments,
however, the contact resistance changes and our DFT calculations show that the barrier shape
at the SAM//top electrode interface is affected by X.
Figure 6. (a) The modelled current through the junctions using Landauer theory for a single
level tunnel junction (orange solid lines are fits to the single level Landauer model, symbols
represent experimental data). The values of 𝛿𝐸Ew (b) and 𝛤 (c) used for modelling the current
through the junctions. (d) β vs. :𝛿𝐸89 with a linear fit (red line). (e) Double-log plot of RC vs.
1/Γ2 where the red line is a power-law fit with a slope of 0.15 and R2 = 0.99. (f) Double-log
plot of β vs.𝜀' where the red line is a fit with a slope of -0.82 and R2 = 0.99.
Conclusions
This work shows that substitution of a single highly polarizable atom can have a
pronounced effect on the energy level alignment, charge transport rate and dielectric response

20
of molecular junctions. We were able to tune the tunnelling decay coefficient β over a wide
range from 0.25 Å-1 to 0.75 Å-1 across saturated alkyl chains by changing one atom per
molecule inside large-area (~350 µm2)53 junctions. Combining experiment with DFT and
Landauer charge transport models, we established three factors that contribute to the dramatic
change in β of these aliphatic halogenated junctions with varying X and associated increase in
α and εr: 1) The HOMO-LUMO gap5, 46 and associated 𝛿EME is reduced which lowers β, 2) the
shape of the tunnelling barrier is modified at the SAM-top electrode interface, resulting in
larger potential drops at this interface, and 3) the electronic coupling Γ of the molecular orbitals
with the electrodes increases (potentially because of an increase in the van der Waals
interactions along the halogen series).
In a broad context of widely used charge tunnelling mechanisms, our findings point out
their limitations highlighting the need for improved models that take dielectric (or collective)
effects of the junctions into consideration. Specifically, the popular Simmons model predicts
that image charge effects in the electrodes are reduced with increasing εr, resulting in lowering
of the tunnelling rates68, which is in sharp contrast to what we find. Superexchange models22,
23, 24 also fail to explain our observations, since the coupling between the molecular repeat unit
(i.e., the CH2 units) was not changed here. Conversely, the Landauer model66 could explain our
results at least qualitatively, but not quantitatively. This is because it does not treat electrostatic
effects in the junctions explicitly and self-consistently which resulted in our case in a very
broad range of 3 orders of magnitude in the values of Γ even though the contact resistance only
changed by a factor of 5 in our experiments. Interestingly, a mechanism proposed by Berlin
and Ratner69 that is based on charge traps provides a hypothesis for how the value of β could
decrease with increasing εr. Although the physical interpretation differs as the tunnelling
behaviour is explained in terms of charge traps rather than the electrostatic response of the
SAM inside the junction, this line of thought stimulates further theoretical and experimental

21
testing of the presence of “impurities” – here in the form of polarizable atoms – as charge
carriers that move across the energy band profiles. Although our findings suggest a correlation
between β and εr, the increase of εr as function of X could not be reproduced in our DFT
calculations, which may be because the calculations do not take the SAM−metal interface into
consideration and, perhaps other factors are important such as (partial) charging of highly
polarizable molecules during charge transport inside the junctions. To summarize, our work
proposes an effective way of tuning the tunnelling rates across molecular junctions without
chemically altering the backbone of the molecules and highlights the importance of
understanding dielectric effects in these junctions. We hope that our findings will stimulate
further experimental and theoretical investigations towards establishing improved transport
mechanisms for junctions in their in situ physicochemical and electronic states inside working
devices.
Data availability
The data that support the findings of this study are available from the corresponding author
upon reasonable request.
References
1. Shah, A. et al. Electron transfer in peptides. Chem. Soc. Rev. 44, 1015-1027 (2015).
2. Vilan, A., Aswal, D. & Cahen, D. Large-area, ensemble molecular electronics: motivation and
challenges. Chem. Rev. 117, 4248-4286 (2017).
3. Jortner, J., Nitzan, A. & Ratner, M. A. Foundations of Molecular Electronics – Charge
Transport in Molecular Conduction Junctions. In Introducing Molecular Electronics (eds
Cuniberti, G., Richter, K. & Fagas, G.) 13-54 (Springer, 2005).
4. Jia, C. & Guo, X. Molecule–electrode interfaces in molecular electronic devices. Chem. Soc.
Rev. 42, 5642-5660 (2013).
5. Metzger, R. M. Unimolecular electronics. Chem. Rev. 115, 5056-5115 (2015).

22
6. Jeong, H., Kim, D., Xiang, D. & Lee, T. High-yield functional molecular electronic devices. ACS
Nano 11, 6511-6548 (2017).
7. Hylke, B. A. & Bert de, B. Electrical conduction through single molecules and self-assembled
monolayers. J. Phys.: Condens. Matter 20, 013001 (2008).
8. Nitzan, A. Electron transmission through molecules and molecular interfaces. Annu. Rev.
Phys. Chem. 52, 681-750 (2001).
9. Xie, Z., Bâldea, I. & Frisbie, C. D. Determination of energy-level alignment in molecular tunnel
junctions by transport and spectroscopy: self-consistency for the case of oligophenylene
thiols and dithiols on Ag, Au, and Pt electrodes. J. Am. Chem. Soc. 141, 3670-3681 (2019).
10. Choi, S. H., Kim, B. & Frisbie, C. D. Electrical resistance of long conjugated molecular wires.
Science 320, 1482 (2008).
11. Kumar, K, S., Neoh, E. H. L., Vilan, A. & Nijhuis, C. A. Protective layers based on carbon paint
to yield high-quality large-area molecular junctions with low contact resistance. J. Am. Chem.
Soc. 142, 3513-3524 (2020).
12. Simeone, F. C. et al. Defining the value of injection current and effective electrical contact
area for EGaIn-based molecular tunneling junctions. J. Am. Chem. Soc. 135, 18131-18144
(2013).
13. Wold, D. J., Haag, R., Rampi, M. A. & Frisbie, C. D. Distance dependence of electron tunneling
through self-assembled monolayers measured by conducting probe atomic force
microscopy: unsaturated versus saturated molecular junctions. J. Phys. Chem. B 106, 2813-
2816 (2002).
14. Karuppannan, S. K., Pasula, R. R., Lim, S. & Nijhuis, C. A. Long-range tunneling processes
across ferritin-based junctions. Adv. Mater. 28, 1824-1830 (2016).
15. Christopher, D. B. et al. Protein bioelectronics: a review of what we do and do not know.
Rep. Prog. Phys. 81, 026601 (2018).
16. Baghbanzadeh, M. et al. Charge tunneling along short oligoglycine chains. Angew. Chem. Int.
Ed. 54, 14743-14747 (2015).
17. Baghbanzadeh, M. et al. Anomalously rapid tunneling: charge transport across self-
assembled monolayers of oligo(ethylene glycol). J. Am. Chem. Soc. 139, 7624-7631 (2017).
18. Su, T. A., Li, H., Steigerwald, M. L., Venkataraman ,L., & Nuckolls, C. Stereoelectronic
switching in single-molecule junctions. Nat. Chem. 7, 215-220 (2015).
19. Merces, L., de Oliveira, R. F., de Camargo, D. H. S. & Bufon, C. C. B. Long-range coherent
tunneling in physisorbed molecular ensembles. J. Phys. Chem. C 121, 16673-16681 (2017).
20. Yan, H. et al. Activationless charge transport across 4.5 to 22 nm in molecular electronic
junctions. Proc. Natl. Acad. Sci. USA 110, 5326-5330 (2013).

23
21. Simmons, J. G. Generalized formula for the electric tunnel effect between similar electrodes
separated by a thin insulating film. J. Appl. Phys. 34, 1793-1803 (1963).
22. Naleway, C. A., Curtiss, L. A. & Miller, J. R. Superexchange-pathway model for long-distance
electronic couplings. J. Phys. Chem. 95, 8434-8437 (1991).
23. McConnell, H. M. Intramolecular charge transfer in aromatic free radicals. J. Chem. Phys. 35,
508-515 (1961).
24. Todd, M. D., Nitzan, A. & Ratner, M. A. Electron transfer via superexchange: a time-
dependent approach. J. Phys. Chem. 97, 29-33 (1993).
25. Juhaniewicz, J. & Sek, S. Peptide molecular junctions: Distance dependent electron
transmission through oligoprolines. Bioelectrochem. 87, 21-27 (2012).
26. Beratan, D. N. et al. Charge transfer in dynamical biosystems, or the treachery of (static)
images. Acc. Chem. Res. 48, 474-481 (2015).
27. Zhang, Y., Liu, C., Balaeff, A., Skourtis, S. S. & Beratan, D. N. Biological charge transfer via
flickering resonance. Proc. Natl. Acad. Sci. USA. 111, 10049-10054 (2014).
28. Berlin, Y. A., Kurnikov, I. V., Beratan, D., Ratner, M. A. & Burin, A. L. DNA Electron Transfer
Processes: Some Theoretical Notions. In Long-Range Charge Transfer in DNA II (eds Schuster,
G. B.) 1-36 (Springer, 2004).
29. Amdursky, N. et al. Electronic transport via proteins. Adv. Mater. 26, 7142-7161 (2014).
30. Sangeeth, C. S. S. et al. Comparison of DC and AC transport in 1.5–7.5 nm oligophenylene
imine molecular wires across two junction platforms: eutectic Ga–In versus conducting
probe atomic force microscope junctions. J. Am. Chem. Soc. 138, 7305-7314 (2016).
31. Nguyen, Q. V. et al. Highly efficient long-range electron transport in a viologen-based
molecular junction. J. Am. Chem. Soc. 140, 10131-10134 (2018).
32. Choi, S.H. et al. Transition from tunneling to hopping transport in long, conjugated oligo-
imine wires connected to metals. J. Am. Chem. Soc. 132, 4358-4368 (2010).
33. Sepunaru, L. et al. Electronic transport via homopeptides: the role of side chains and
secondary structure. J. Am. Chem. Soc. 137, 9617-9626 (2015).
34. Xie, Z., Bâldea, I., Smith, C. E., Wu, Y. & Frisbie, C. D. Experimental and theoretical analysis of
nanotransport in oligophenylene dithiol junctions as a function of molecular length and
contact work function. ACS Nano 9, 8022-8036 (2015).
35. Gunasekaran, S. et al. Near length-independent conductance in polymethine molecular
wires. Nano Lett. 18, 6387-6391 (2018).
36. Sedghi, G. et al. Long-range electron tunnelling in oligo-porphyrin molecular wires. Nat.
Nanotechnol. 6, 517-523 (2011).

24
37. Leary, E. et al. Bias-driven conductance increase with length in porphyrin tapes. J. Am. Chem.
Soc. 140, 12877-12883 (2018).
38. Zhang, Y. et al. Tunneling probability increases with distance in junctions comprising self-
assembled monolayers of oligothiophenes. J. Am. Chem. Soc. 140, 15048-15055 (2018).
39. Algethami, N., Sadeghi, H., Sangtarash, S. & Lambert, C. J. The conductance of porphyrin-
based molecular nanowires increases with length. Nano Lett. 18, 4482-4486 (2018).
40. Stuyver, T., Zeng, T., Tsuji, Y., Geerlings, P. & De Proft, F. Diradical character as a guiding
principle for the insightful design of molecular nanowires with an increasing conductance
with length. Nano Lett. 18, 7298-7304 (2018).
41. Sangeeth, C. S. S., Wan, A. & Nijhuis, C. A. Equivalent circuits of a self-assembled monolayer-
based tunnel junction determined by impedance spectroscopy. J. Am. Chem. Soc. 136,
11134-11144 (2014).
42. Van Dyck, C., Marks, T. J. & Ratner, M. A. Chain length dependence of the dielectric constant
and polarizability in conjugated organic thin films. ACS Nano 11, 5970-5981 (2017).
43. Natan, A., Kuritz, N. & Kronik, L. Polarizability, susceptibility, and dielectric constant of
nanometer-scale molecular films: a microscopic view. Adv. Funct. Mater. 20, 2077-2084
(2010).
44. Romaner, L., Heimel, G., Ambrosch-Draxl, C. & Zojer, E. The dielectric constant of self-
assembled monolayers. Adv. Funct. Mater. 18, 3999-4006 (2008).
45. Obersteiner, V. et al. Electrostatic design of 3d covalent organic networks. Adv. Mater. 29,
1700888 (2017).
46. Wang, D. et al. Tuning the tunneling rate and dielectric response of SAM-based junctions via
a single polarizable atom. Adv. Mater. 27, 6689-6695 (2015).
47. Haj-Yahia, A-E. et al. Substituent variation drives metal/monolayer/semiconductor junctions
from strongly rectifying to ohmic behavior. Adv. Mater. 25, 702-706 (2013).
48. Mazinani, S. K. S. et al. Polarizability as a molecular descriptor for conductance in organic
molecular circuits. J. Phys. Chem. C 120, 26054-26060 (2016).
49. Baghbanzadeh, M., Pieters, P. F., Yuan, L., Collison, D. & Whitesides, G. M. The rate of charge
tunneling in EGaIn junctions is not sensitive to halogen substituents at the self-assembled
monolayer//Ga2O3 interface. ACS Nano 12, 10221-10230 (2018).
50. Stone, A. J. The theory of intermolecular forces, 2nd ed. Oxford University Press (2013).
51. Lamport, Z. A. et al. Fluorinated benzalkylsilane molecular rectifiers. Sci. Rep. 6, 38092
(2016).
52. Nerngchamnong, N. et al. The role of van der Waals forces in the performance of molecular
diodes. Nat. Nanotechnol. 8, 113-118 (2013).

25
53. Chen, X., Hu, H., Trasobares, J. & Nijhuis, C. A. Rectification ratio and tunneling decay
coefficient depend on the contact geometry revealed by in situ imaging of the formation of
EGaIn junctions. ACS Appl. Mater. Inter. 11, 21018-21029 (2019).
54. Wang, W., Lee, T. & Reed, M. A. Mechanism of electron conduction in self-assembled
alkanethiol monolayer devices. Phys. Rev. B 68, 035416 (2003).
55. Jiang, L., Sangeeth, C. S. S. & Nijhuis, C. A. The origin of the odd–even effect in the tunneling
rates across EGaIn junctions with self-assembled monolayers (SAMs) of n-alkanethiolates. J.
Am. Chem. Soc. 137, 10659-10667 (2015).
56. Ashcroft, N. W. & Mermin, N. D. Solid State Physics (Holt, Rinehart and Winston, 1976).
57. Kresse, G. & Furthmüller, J. Efficient iterative schemes for ab initio total-energy calculations
using a plane-wave basis set. Phys. Rev. B 54, 11169-11186 (1996).
58. Lee, H. J., Jamison, A. C. & Lee, T. R. Surface Dipoles: a growing body of evidence supports
their impact and importance. Acc. Chem. Res. 48, 3007-3015 (2015).
59. Chen, X. et al. Interplay of collective electrostatic effects and level alignment dictates the
tunneling rates across halogenated aromatic monolayer junctions. J. Phys. Chem. Lett. 10,
4142-4147 (2019).
60. Asyuda, A., Wan, X. & Zharnikov, M. Binary aromatic self-assembled monolayers:
electrostatic properties and charge tunneling rates across the molecular framework. Phys.
Chem. Chem. Phys. 22, 10957-10967 (2020).
61. Abu-Husein, T. et al. The effects of embedded dipoles in aromatic self-assembled
monolayers. Adv. Funct. Mater. 25, 3943-3957 (2015).
62. Jiang, L., Sangeeth, C. S. S., Yuan, L., Thompson, D. & Nijhuis, C. A. One-nanometer thin
monolayers remove the deleterious effect of substrate defects in molecular tunnel
junctions. Nano Lett. 15, 6643-6649 (2015).
63. Heitzer, H. M., Marks, T. J. & Ratner, M. A. First-principles calculation of dielectric response
in molecule-based materials. J. Am. Chem. Soc. 135, 9753-9759 (2013).
64. Rozhkov, I. N., Raevsky, A. M., Gushchin, S. I., Ignatova, J. L. & Semin, G. K. Evaluation of
charge changes on chlorine, bromine and iodine atoms in perfluoroalkyl halogenides based
on nuclear quadrupole resonance data. J. Fluor. Chem. 58, 234-234 (1992).
65. Probst, A., Raab, K., Ulm, K. & von Werner, K. Synthesis and chemistry of perfluoro-2-iodo-2-
methyl-alkanes. J. Fluor. Chem. 37, 223-245 (1987).
66. Simmons, J. G. Electric tunnel effect between dissimilar electrodes separated by a thin
insulating film. J. Appl. Phys. 34, 2581-2590 (1963).

26
67. Vilan, A. Analyzing molecular current-voltage characteristics with the simmons tunneling
model: scaling and linearization. J. Phys. Chem. C 111, 4431-4444 (2007).
68. Garrigues, A. R. et al. A single-level tunnel model to account for electrical transport through
single molecule- and self-assembled monolayer-based junctions. Sci. Rep. 6, 26517 (2016).
69. Berlin, Y. A. & Ratner, M. A. Conduction of metal–thin organic film–metal junctions at low
bias. J. Phys. Chem. C 122, 7557-7563 (2018).
70. Karuppannan, S. K., Hu, H., Troadec, C., Vilan, A. & Nijhuis, C. A. Ultrasmooth and
photoresist-free micropore-based EGaIn molecular junctions: fabrication and how roughness
determines voltage response. Adv. Funct. Mater. 29, 1904452 (2019).
Acknowledgements
We acknowledge fruitful discussions with Ayelet Vilan (Weizmann Institute of Science) and
Gemma Solomon (University of Copenhagen). Funding by the Ministry of Education (MOE)
for supporting this research under award No. MOE2019-T2-1-137 is acknowledged. Prime
Minister’s Office, Singapore under its Medium sized centre program is also acknowledged for
supporting this research. The authors would furthermore like to acknowledge the Singapore
Synchrotron Light Source (SSLS) for providing the facilities at the Surface, Interface and
Nanostructure Science (SINS) beam line under NUS core support C-380-003-003-001. The
Laboratory is a National Research Infrastructure under the National Research Foundation
Singapore. We moreover acknowledge funding from the Alexander von Humboldt Foundation
within the framework of the Sofja Kovalevskaja Award, endowed by the German Federal
Ministry of and Research, and the Technical University of Munich - Institute for Advanced
Study, funded by the German Excellence Initiative and the European Union Seventh
Framework Programme under Grant Agreement No. 291763. DT thanks Science Foundation
Ireland (SFI) for support (awards Grant Numbers 15/CDA/3491 and 12/RC/2275_P2) and for
computing resources at the SFI/Higher Education Authority Irish Centre for High-End
Computing (ICHEC). Finally, we also acknowledge support from the U.S. National Science
Foundation (Grant no. ECCS#1916874).
Author information
Affiliations
Department of Chemistry, National University of Singapore, 3 Science Drive 3, Singapore
117543, Singapore

27
Xiaoping Chen, Christian A. Nijhuis
Centre for Advanced 2D Materials and Graphene Research Centre, National University
of Singapore, 6 Science Drive 2, Singapore 117546, Singapore
Xiaoping Chen, Christian A. Nijhuis
Department of Physics, Technical University of Munich, 85748 Garching, Germany
Bernhard Kretz, David A. Egger
Department of Physics, University of Central Florida, Orlando, Florida 32816 - USA
Francis Adoah, Cameron Nickle, Enrique del Barco
Singapore Synchrotron Light Source, National University of Singapore, 5 Research Link,
Singapore 117603, Singapore
Xiao Chi, Xiaojiang Yu
Department of Physics, Bernal Institute, University of Limerick, V94 T9PX, Ireland
Damien Thompson
Contributions
X. C., D. A. E.; and C. A. N. conceived and designed the project. X. C. synthesized the
compounds, performed electrical characterizations, and associated data analysis; B. K. and D.
A. E. performed the DFT calculations; F. A., C. N.; and E. B. performed the Landauer model
analysis; X. C. and X. Y. conducted the XPS and UPS measurements; D. T. conducted the
molecular dynamics; all the authors discussed the results and prepared the manuscript.
Corresponding authors
Correspondence to Christian A. Nijhuis or David A. Egger
Competing interests
The authors declare no competing financial interest.
Additional information
Peer review information Nature Communications thanks the anonymous reviewers for their
contributions to the peer review of this work. Peer review reports are available.

28
Publisher’s note Springer Nature remains neutral with regard to jurisdictional claims in
published maps and institutional affiliations.
Supplementary information
Supporting Information contains materials and methods used in the paper, the synthesis of the
molecules, the surface characterization of the SAMs on Ag, the electrical J(V) and
impedance results, the details of DFT calculations (PDF).

Figures
Figure 1
(a) Schematic illustration of the Ag-S(CH2)nX//GaOx/EGaIn junction (shown for n = 14) together with theequivalent circuit diagram. In this work we investigated junctions with n = 10, 12, 14, 16, or 18, and X = H,F, Cl, Br, or I. (b) Energy level diagram of the junction showing how Γ and δEME change with X.
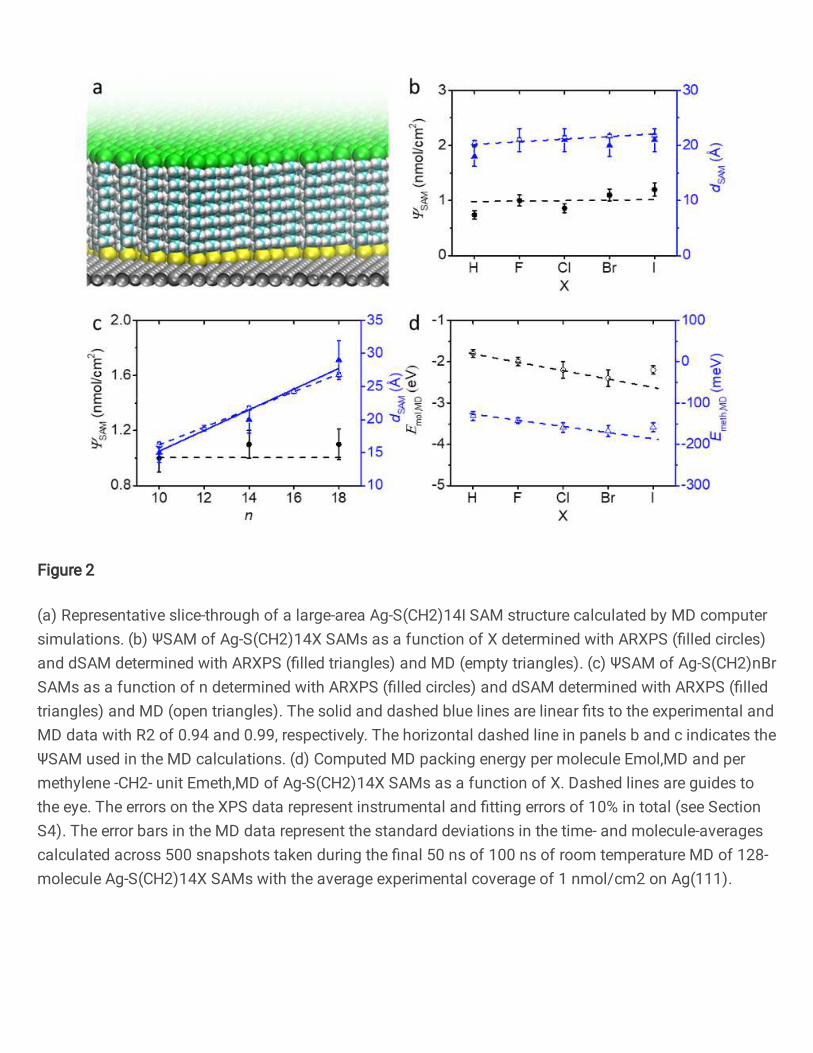
Figure 2
(a) Representative slice-through of a large-area Ag-S(CH2)14I SAM structure calculated by MD computersimulations. (b) ΨSAM of Ag-S(CH2)14X SAMs as a function of X determined with ARXPS (�lled circles)and dSAM determined with ARXPS (�lled triangles) and MD (empty triangles). (c) ΨSAM of Ag-S(CH2)nBrSAMs as a function of n determined with ARXPS (�lled circles) and dSAM determined with ARXPS (�lledtriangles) and MD (open triangles). The solid and dashed blue lines are linear �ts to the experimental andMD data with R2 of 0.94 and 0.99, respectively. The horizontal dashed line in panels b and c indicates theΨSAM used in the MD calculations. (d) Computed MD packing energy per molecule Emol,MD and permethylene -CH2- unit Emeth,MD of Ag-S(CH2)14X SAMs as a function of X. Dashed lines are guides tothe eye. The errors on the XPS data represent instrumental and �tting errors of 10% in total (see SectionS4). The error bars in the MD data represent the standard deviations in the time- and molecule-averagescalculated across 500 snapshots taken during the �nal 50 ns of 100 ns of room temperature MD of 128-molecule Ag-S(CH2)14X SAMs with the average experimental coverage of 1 nmol/cm2 on Ag(111).

Figure 3
<log10|J|>G vs. V obtained from Ag-S(CH2)nX//GaOx/EGaIn junctions with X = F (a) or I (b) and n = 10(solid black line), 12 (solid red line), 14 (solid blue line), 16 (solid pink line), and 18 (solid green line). Thedashed-line error bars represent the Gaussian log-standard deviation, σlog,G. (c) Decay plots of<log10|J|>G at –0.5 V against dSAM,MD with X = H (black square), F (red circle), Cl (blue triangle), Br(pink inverted triangle), or I (green diamond). The solid lines are �ts to Eq. 1. The dashed lines representthe 95% con�dence bands. (d) Plots of log10|J| vs. V as a function of T (T = 250 – 340 K) recorded fromAg-S(CH2)14X//GaOx/EGaIn junctions.

Figure 4
(a) RC vs. X for Ag-S(CH2)14X//GaOx/EGaIn junctions at 0 V. (b) log10RSAM and RC (inset) vs. n for Ag-S(CH2)nBr//GaOx/EGaIn junctions at 0 V. The solid black line represents a �t to Eq. 2. (c) εr vs. X for Ag-S(CH2)14X//GaOx/EGaIn junctions at 0 V. The error bars are the standard deviations of three independentmeasurements. Dashed lines are visual guides.

Figure 5
(a) DFT-calculated plane-averaged electrostatic potential of Ag(111)-S(CH2)14X where X = H, F, Cl, Br, or I,along the surface-normal coordinate. (b) Work function (Φ) of the SAMs, calculated from DFT (redsquares) and measured experimentally (black dots). Density of states (DOS) projected onto the molecularbackbone (c) and onto the X-site (d) of Ag(111)-S(CH2)14X. Note that X contributes very little to the bandedges for X=H, F.

Figure 6
(a) The modelled current through the junctions using Landauer theory for a single level tunnel junction(orange solid lines are �ts to the single level Landauer model, symbols represent experimental data). Thevalues of δE_ME (b) and Γ (c) used for modelling the current through the junctions. (d) β vs. √(δE_ME )with a linear �t (red line). (e) Double-log plot of RC vs. 1/Γ2 where the red line is a power-law �t with aslope of 0.15 and R2 = 0.99. (f) Double-log plot of β vs. ε_r where the red line is a �t with a slope of -0.82and R2 = 0.99.
Supplementary Files
This is a list of supplementary �les associated with this preprint. Click to download.
Supplementaryinformation.docx