a simple nutrient-dependence mechanism for predicting the stoichiometry of marine ... · a simple...
TRANSCRIPT

A simple nutrient-dependence mechanism forpredicting the stoichiometry of marine ecosystemsEric D. Galbraitha,1 and Adam C. Martinyb,c
aDepartment of Earth and Planetary Science, McGill University, Montreal, QC, Canada H3A 2A7; bDepartment of Ecology and Evolutionary Biology,University of California, Irvine, CA 92697; and cDepartment of Earth System Science, University of California, Irvine, CA 92697
Edited by François M. M. Morel, Princeton University, Princeton, NJ, and approved May 11, 2015 (received for review December 13, 2014)
It is widely recognized that the stoichiometry of nutrient elementsin phytoplankton varies within the ocean. However, there aremany conflicting mechanistic explanations for this variability, and it isoften ignored in global biogeochemical models and carbon cyclesimulations. Here we show that globally distributed particulate P:Cvaries as a linear function of ambient phosphate concentrations,whereas the N:C varies with ambient nitrate concentrations, but onlywhen nitrate is most scarce. This observation is consistent with theadjustment of the phytoplankton community to local nutrient avail-ability, with greater flexibility of phytoplankton P:C because P is aless abundant cellular component than N. This simple relationship isshown to predict the large-scale, long-term average composition ofsurface particles throughout large parts of the ocean remarkablywell. The relationship implies that most of the observed variationin N:P actually arises from a greater plasticity in the cellular P:C con-tent, relative to N:C, such that as overall macronutrient concentra-tions decrease, N:P rises. Although other mechanisms are certainlyalso relevant, this simple relationship can be applied as a first-orderbasis for predicting organic matter stoichiometry in large-scale bio-geochemical models, as illustrated using a simple box model. Theresults show that including variable P:C makes atmospheric CO2 moresensitive to changes in low latitude export and ocean circulation thana fixed-stoichiometry model. In addition, variable P:C weakens therelationship between preformed phosphate and atmospheric CO2
while implying a more important role for the nitrogen cycle.
marine ecosystem | nutrients | stoichiometry | phytoplankton |carbon dioxide
Nutrient elements are used by phytoplankton to synthesizemolecules, in order to accomplish biochemical functions.
Some of these molecules are absolutely necessary, and the nu-trient elements have no substitutes. Examples are P in nucleicacids, N in amino acids, and Fe in the photosynthetic apparatus(1). However, there is a degree of plasticity in the molecular as-semblage required per phytoplankton cell, which varies betweenspecies and between clades (2, 3). Furthermore, there is a capacityfor plasticity in molecular composition of even a given species, asshown in culture experiments (4, 5). Such plasticity leads to vari-ability in the elemental ratios of nutrients in marine phytoplank-ton, widely documented in laboratory and field measurements (2,6, 7). Recent analyses of global nutrient and particulate observa-tions have shown that N:P, the most commonly discussed ratio,varies regionally, including low N:P in the high-latitude SouthernOcean and high N:P in the oligotrophic regions (7–9). Explana-tions of high N:P in oligotrophic waters have often invoked anenhanced reliance on N-rich proteins for gathering scarce re-sources (1, 10), whereas low N:P in the Southern Ocean has beenvariously attributed to the abundance of P-rich molecules in cold,fast-growing plankton (11), or to the availability of Si, whichsupports P-rich diatom communities (8, 12).Despite an abundant literature on stoichiometric variability
and its potential causes, no simple predictive relationship hasbeen widely adopted in global biogeochemical models. Instead,the vast majority of global biogeochemical models assumesfixed C:N:P in organic matter, including most participants in
the recent Coupled Model Intercomparison Project, CMIP5 (13).Thus, the potential impact of changes in organic matter stoichi-ometry on ocean carbon storage and oxygen consumption remainlargely unexplored. The neglect of stoichiometric variability is due,at least in part, to the lack of a clear predictive framework.Here, it is argued that the concentration of a nutrient element
in seawater can provide a suitable predictive framework, becauseit is a critical determinant of the rate at which that element willtend to be taken up by the organisms in the local community. Thishypothesis builds on classic resource competition theory (14),which argues that if the concentration of an element is low, suchthat uptake is difficult, the community will be dominated by or-ganisms that are well adapted to a low cellular quota of that nu-trient (10). If, on the other hand, the concentration is high,facilitating high uptake rates, the community will be dominated byorganisms that are capable of taking advantage of that nutrient togrow faster. This suggestion leads to clear predictions with sig-nificant biogeochemical consequences, as outlined below.
Observed PatternsThe cellular abundances of N and P are most often discussed interms of the N:P ratio. However, carbon is by far the dominantelement in biomass (not counting H and O, derived from water).It typically outweighs nitrogen by a factor of about seven, be-cause of its central structural role in most organic molecules, andis thus the most logical normalizing factor for considering nu-trient ratios. Relative to carbon, the ∼30 essential nutrient ele-ments display a range of plasticities in their cellular requirements(15). Nitrogen tends to be the least plastic, varying in cellularN:C molar ratios from ∼1/5 to 1/10, a factor of two (2). The
Significance
The elemental ratios of nitrogen, phosphorus, and carbon in ma-rine phytoplankton can diverge significantly from the “Redfieldratio,” but the underlying reasons have been hard to elucidate. Asa result, global biogeochemical models often ignore this stoi-chiometric variability. Here we show that, hidden within thenoise of a large dataset of particulate measurements, a sur-prisingly consistent relationship exists between communityP:C and dissolved phosphate concentrations. The plasticity ofecosystem stoichiometry in the face of nutrient scarcity, withgreater plasticity for P relative to N, appears to explain themain divergences from the Redfield ratio. When included in asimple model, the relationship implies a more important rolefor low latitude nutrient cycling in the biological pump than iscommonly assumed.
Author contributions: E.D.G. designed and performed the data analysis and model sim-ulations; and E.D.G. and A.C.M. wrote the paper.
The authors declare no conflict of interest.
This article is a PNAS Direct Submission.
See Commentary on page 8162.1To whom correspondence should be addressed. Email: [email protected].
This article contains supporting information online at www.pnas.org/lookup/suppl/doi:10.1073/pnas.1423917112/-/DCSupplemental.
www.pnas.org/cgi/doi/10.1073/pnas.1423917112 PNAS | July 7, 2015 | vol. 112 | no. 27 | 8199–8204
ENVIRONMEN
TAL
SCIENCE
SSE
ECO
MMEN
TARY
Dow
nloa
ded
by g
uest
on
June
10,
202
0
cellular P:C ratio is more variable, due to the ability of organismsto substitute phosphorus compounds such as phospholipids (16),and ranges from ∼1/50 to 1/500, or by about a factor of 10. Iron iseven more variable, given the ability to substitute with other ele-ments, such that Fe:C varies from about 1/1,000 to 1/1,000,000, orthree orders of magnitude (17).If we examine oceanographic data in terms of N:C and P:C,
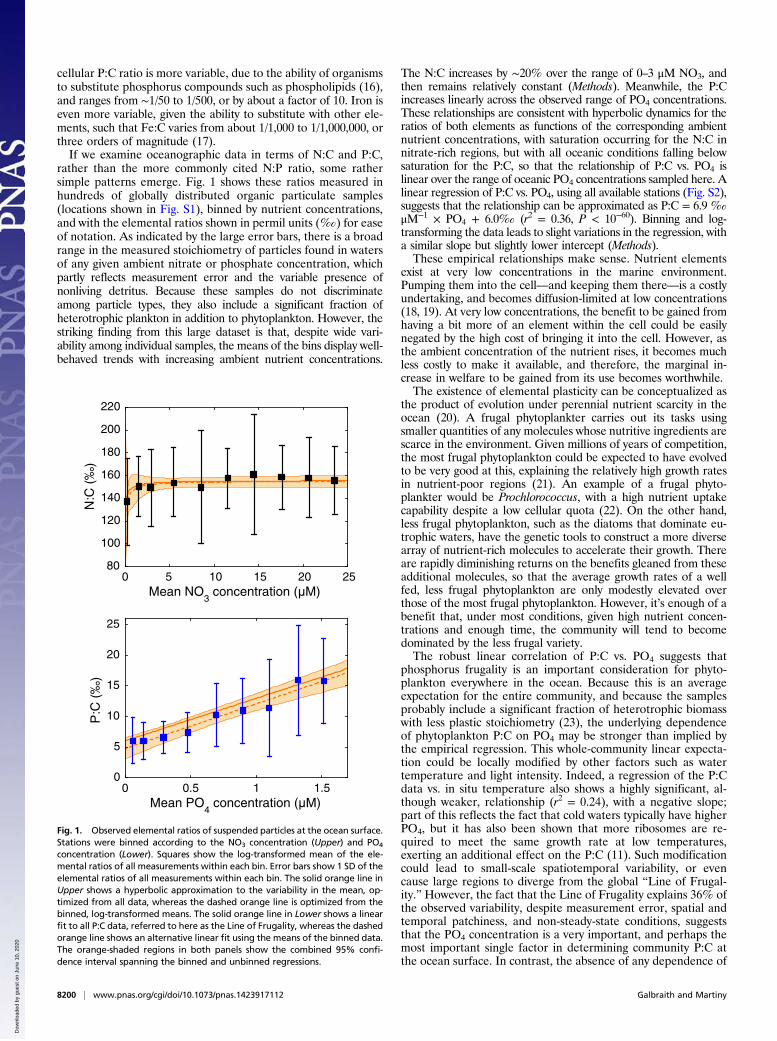
rather than the more commonly cited N:P ratio, some rathersimple patterns emerge. Fig. 1 shows these ratios measured inhundreds of globally distributed organic particulate samples(locations shown in Fig. S1), binned by nutrient concentrations,and with the elemental ratios shown in permil units (‰) for easeof notation. As indicated by the large error bars, there is a broadrange in the measured stoichiometry of particles found in watersof any given ambient nitrate or phosphate concentration, whichpartly reflects measurement error and the variable presence ofnonliving detritus. Because these samples do not discriminateamong particle types, they also include a significant fraction ofheterotrophic plankton in addition to phytoplankton. However, thestriking finding from this large dataset is that, despite wide vari-ability among individual samples, the means of the bins display well-behaved trends with increasing ambient nutrient concentrations.
The N:C increases by ∼20% over the range of 0–3 μM NO3, andthen remains relatively constant (Methods). Meanwhile, the P:Cincreases linearly across the observed range of PO4 concentrations.These relationships are consistent with hyperbolic dynamics for theratios of both elements as functions of the corresponding ambientnutrient concentrations, with saturation occurring for the N:C innitrate-rich regions, but with all oceanic conditions falling belowsaturation for the P:C, so that the relationship of P:C vs. PO4 islinear over the range of oceanic PO4 concentrations sampled here. Alinear regression of P:C vs. PO4, using all available stations (Fig. S2),suggests that the relationship can be approximated as P:C = 6.9 ‰
μM−1 × PO4 + 6.0‰ (r2 = 0.36, P < 10−60). Binning and log-transforming the data leads to slight variations in the regression, witha similar slope but slightly lower intercept (Methods).These empirical relationships make sense. Nutrient elements
exist at very low concentrations in the marine environment.Pumping them into the cell—and keeping them there—is a costlyundertaking, and becomes diffusion-limited at low concentrations(18, 19). At very low concentrations, the benefit to be gained fromhaving a bit more of an element within the cell could be easilynegated by the high cost of bringing it into the cell. However, asthe ambient concentration of the nutrient rises, it becomes muchless costly to make it available, and therefore, the marginal in-crease in welfare to be gained from its use becomes worthwhile.The existence of elemental plasticity can be conceptualized as
the product of evolution under perennial nutrient scarcity in theocean (20). A frugal phytoplankter carries out its tasks usingsmaller quantities of any molecules whose nutritive ingredients arescarce in the environment. Given millions of years of competition,the most frugal phytoplankton could be expected to have evolvedto be very good at this, explaining the relatively high growth ratesin nutrient-poor regions (21). An example of a frugal phyto-plankter would be Prochlorococcus, with a high nutrient uptakecapability despite a low cellular quota (22). On the other hand,less frugal phytoplankton, such as the diatoms that dominate eu-trophic waters, have the genetic tools to construct a more diversearray of nutrient-rich molecules to accelerate their growth. Thereare rapidly diminishing returns on the benefits gleaned from theseadditional molecules, so that the average growth rates of a wellfed, less frugal phytoplankton are only modestly elevated overthose of the most frugal phytoplankton. However, it’s enough of abenefit that, under most conditions, given high nutrient concen-trations and enough time, the community will tend to becomedominated by the less frugal variety.The robust linear correlation of P:C vs. PO4 suggests that
phosphorus frugality is an important consideration for phyto-plankton everywhere in the ocean. Because this is an averageexpectation for the entire community, and because the samplesprobably include a significant fraction of heterotrophic biomasswith less plastic stoichiometry (23), the underlying dependenceof phytoplankton P:C on PO4 may be stronger than implied bythe empirical regression. This whole-community linear expecta-tion could be locally modified by other factors such as watertemperature and light intensity. Indeed, a regression of the P:Cdata vs. in situ temperature also shows a highly significant, al-though weaker, relationship (r2 = 0.24), with a negative slope;part of this reflects the fact that cold waters typically have higherPO4, but it has also been shown that more ribosomes are re-quired to meet the same growth rate at low temperatures,exerting an additional effect on the P:C (11). Such modificationcould lead to small-scale spatiotemporal variability, or evencause large regions to diverge from the global “Line of Frugal-ity.” However, the fact that the Line of Frugality explains 36% ofthe observed variability, despite measurement error, spatial andtemporal patchiness, and non-steady-state conditions, suggeststhat the PO4 concentration is a very important, and perhaps themost important single factor in determining community P:C atthe ocean surface. In contrast, the absence of any dependence of
Mean NO3
concentration ( M)0 5 10 15 20 25
80
100
120
140
160
180
200
220
Mean PO4
concentration ( M)0 0.5 1 1.5
0
5
10
15
20
25
Fig. 1. Observed elemental ratios of suspended particles at the ocean surface.Stations were binned according to the NO3 concentration (Upper) and PO4
concentration (Lower). Squares show the log-transformed mean of the ele-mental ratios of all measurements within each bin. Error bars show 1 SD of theelemental ratios of all measurements within each bin. The solid orange line inUpper shows a hyperbolic approximation to the variability in the mean, op-timized from all data, whereas the dashed orange line is optimized from thebinned, log-transformed means. The solid orange line in Lower shows a linearfit to all P:C data, referred to here as the Line of Frugality, whereas the dashedorange line shows an alternative linear fit using the means of the binned data.The orange-shaded regions in both panels show the combined 95% confi-dence interval spanning the binned and unbinned regressions.
8200 | www.pnas.org/cgi/doi/10.1073/pnas.1423917112 Galbraith and Martiny
Dow
nloa
ded
by g
uest
on
June
10,
202
0

N:C on NO3 above a NO3 concentration of ∼3 μM indicates thatother environmental and ecological factors determine N:C at allbut the lowest NO3 concentrations. The saturation of average N:Cat nitrate concentrations of about 3 μM does not indicate thatnitrate is not limiting in the ocean. On the contrary, it is the mostimportant limiting element, at least in a proximal sense, as clearlyshown by nutrient assays everywhere outside of High Nitrate LowChlorophyll (HNLC) regions (15). The observations here simplyimply that higher N:C does not, on average, confer a consistentcompetitive advantage above a ratio of ∼155 ‰.It follows that the common observation that N:P increases
under oligotrophy would arise simply due to low N:C plasticitycompared with P:C plasticity. The observed particulate datasuggest that the average N:C of planktonic communities in-creases by less than 30% above its minimum value of ∼125 ‰ inresponse to an increase of NO3, whereas community average P:Ccan increase by a factor of at least 3 above its minimum of ∼5‰under increasing PO4, exhibiting an order of magnitude moreresponse to nutrient availability than the N:C. Thus, movingfrom eutrophic waters that are rich in both NO3
− and PO43- to
oligotrophic waters that are poor in both NO3− and PO4
3- in-volves a small decrease of N:C but a very large P:C decrease. Asa result, nutrient-dependent stoichiometric plasticity would tendto drive high N:P in oligotrophic regions and low N:P in eutro-phic regions. In agreement with the underlying dynamic of che-mostat models (10, 19), this mechanism suggests that N:P inphytoplankton is determined by the absolute concentrations ofNO3
− and PO43-, rather than their ratio, and explains why the
NO3:PO4 ratio of ambient waters is a poor predictor of phyto-plankton N:P (24).
Global PictureThe simple predictive model proposed here can be used togenerate global predictions of organic matter stoichiometry fromobserved surface nitrate and phosphate concentrations. The re-sults are shown in Fig. 2. The predicted P:C agrees broadly withrecent estimates from two global inverse models (Fig. S3), withthe only significant discrepancy being that the inverse modelssuggest higher P:C in the subpolar North Atlantic than predictedhere. The calculated N:C and P:C in Fig. 2 follow similar spatialpatterns, given the strong correlation of NO3 and PO4 at the oceansurface. However, as expected from the reasoning laid out above,the N:P varies roughly inversely with the macronutrient concen-trations, because N:C varies less than P:C. It should be empha-sized that this result arises entirely from the elevated plasticity ofP:C relative to N:C, and is not dependent on assumptions re-garding the allocation of nutrient elements to cellular machineryor taxonomic groups.That is not to say that this simple mechanism is inconsistent
with either of these other hypotheses. It is entirely possible thatfrugal phytoplankton do, in fact, produce more resource-gath-ering molecules relative to RNA (1). Similarly, the taxonomiccomposition of ecosystems in different parts of the ocean couldreflect the fit between phytoplankton elemental compositionsand the available nutrients (7). Diatoms with high P:C flourish inphosphate-rich regions (which also happen to be nitrate-rich),and therefore diatom-dominated communities have low N:P.It is also important to emphasize that this prediction is sug-
gested to hold only at large spatial and temporal scales, withimportant exceptions. Perhaps most importantly, Phaocystis, aprymnesiophyte that tends to have relatively low P:C, frequentlyblooms in the PO4-rich Southern Ocean (12). The suggestionhere would be that the success of Phaocystis reflects the relativelysmall advantage that less frugal phytoplankton gain by usingmore P such that, given other environmental factors (such asgrazing pressures, temperature, light intensity, or iron availabil-ity), the more frugal Phaocystis can be very successful withouttaking full advantage of the abundant PO4. This wrinkle would
appear to be given additional weight by the analysis of DeVriesand Deutsch (25), which suggests that the domains of polaroceans with seasonal sea ice may be typified by low P:C despitehigh phosphate concentrations. If it turns out that seasonal seaice zones are indeed typified by anomalously low P:C, this couldbe an important consideration for carbon cycling during ice agesas well as in the future (8). At the same time, the availability ofsilicate could potentially expand the range of P-rich diatoms inthe Southern Ocean northward into lower-PO4 waters, drivingrelatively high P:C export at relatively low phosphate concen-trations as proposed by Weber and Deutsch (8). For the timebeing, we assume these other factors to be stationary with re-spect to the distribution of phosphate, and explore the impactof changes in P:C driven exclusively by phosphate cycling onocean carbon storage.
Implications for Carbon Export and Atmospheric CO2
The global oceanic phosphorus inventory is determined by thebalance between the supply rate, ultimately derived from theweathering of minerals on land, and the removal by burial inseafloor sediments (26). If the P:C of organic matter were fixed,the maximum amount of C that could be stored in the oceaninterior by the biological pump would simply be equal to the Pinventory divided the P:C ratio. This concept led to some early
50S
50S
50S
eq
eq
eq
50N
50N
50N
5
10
15
20
130
135
140
145
150
155
160
150W 100W 50W 0 50E 100E 150E
150W 100W 50W 0 50E 100E 150E
150W 100W 50W 0 50E 100E 150E
10
15
20
25
P:C predicted from PO4
N:C predicted from NO3
N:P resulting from P:C and N:C predictions
Fig. 2. Predicted elemental ratios at the ocean surface. The elemental ratiosindicated are predicted from the Line of Frugality shown in Fig. 1, using theobserved PO4 and NO3 concentrations from the upper 30 m in the WorldOcean Atlas (45).
Galbraith and Martiny PNAS | July 7, 2015 | vol. 112 | no. 27 | 8201
ENVIRONMEN
TAL
SCIENCE
SSE
ECO
MMEN
TARY
Dow
nloa
ded
by g
uest
on
June
10,
202
0

suggestions that glacial-interglacial changes in the global bi-ological pump strength could have been caused by changes ineither the global P inventory, or the P:C ratio (27). In addition,the use of preformed phosphate (i.e., phosphate that is transportedphysically to the ocean interior from phosphate-rich regions of thesurface ocean, rather than being exported to the interior as acomponent of organic matter and subsequently remineralized) as ametric for the global strength of the biological pump is typicallysimplified to assume a constant P:C ratio, although the possibilitythat P:C varies is acknowledged (28–30). The theory associated withthe concept of preformed phosphate suggests that the combinedinfluences of ocean circulation and carbon export on atmosphericpCO2 can be approximated quite well by the concentration ofphosphate in the high-latitude regions that ventilate the deepocean, most importantly the Southern Ocean.The argument advanced here suggests that less-frugal phyto-
plankton in phosphate-rich regions actually use up P rapidly,without attaching much Corg to it. This profligate use of P makesfor a relatively weak biological pump, for a given inventory of P. Incontrast, more frugal phytoplankton attach a lot of Corg to everyatom of P they export, storing a lot more respired carbon in theocean interior per unit P exported. As such, in terms of carbonstorage, not all use of a PO4 molecule can be seen as equal.We use a standard three-box ocean model coupled to a one-
box atmosphere (Fig. S4), after Sarmiento and Toggweiler (31), toillustrate how P:C variability alters carbon export and atmosphericCO2. Ref. 8 followed a similar approach to test the impact of aprescribed change in the P:C of export in the Southern Ocean.Although greatly simplified, the box model framework allows therapid computation of a large number of experiments to plumb themain sensitivities of carbon storage to circulation and communityexport given different stoichiometries. The ocean boxes include alow-latitude surface box, high-latitude surface box, and a deep box,with realistic proportions (Methods). The box model predicts P:Cas a function of PO4 using the linear fit to the unbinned datashown by the solid line in Fig. 1. The model is then used to explore
the impact of varying P:C, compared with fixed P:C, through aseries of experiments. These experiments test the effect of variablehigh-latitude export Φh (which could vary due to iron supply to theSouthern Ocean, or sea ice coverage), in combination with simul-taneous changes in low-latitude phosphate concentration PO4l(which might vary with changes in nitrogen fixation and de-nitrification rates), and the large-scale ocean circulation (varying thethermohaline overturning T and high-latitude vertical mixing fhd).When the P:C is fixed, the prescribed changes modify atmo-
spheric pCO2 in a fairly strict relationship with preformed PO4, asdetermined by the PO4 concentration in the high-latitude box (Fig.3) (31, 32). This strict relationship holds true over the range ofchanges in PO4l, T, fhd, and Φh, and indicates that in a world withfixed stoichiometry, it is hard to change the strength of the bi-ological pump without changing preformed PO4. However, whenP:C is plastic, the effects of PO4l and T can diverge significantlyfrom the strict preformed-PO4 relationship, producing a range ofpCO2 for a given preformed PO4 concentration. This divergence isparticularly pronounced for PO4l, which has a far greater impacton pCO2 under variable P:C than under fixed P:C (Fig. 4).The reason for these divergences is fairly straightforward:
when P:C varies, export that occurs under low PO4 concentra-tions stores more C for the same P inventory, thereby loweringpCO2. Because the low-latitude export flux (Φl) has a lower P:Cthan Φh, increasing the fraction of total export that occurs at lowlatitudes leads to lower pCO2. In the model, Φl is simply equal toT(PO4d − PO4l), where PO4d is the phosphate concentration inthe deep box, which is essentially fixed by the total PO4 in-ventory. Therefore, increasing T drives a linear increase of Φl,causing pCO2 to decrease. Similarly, decreasing PO4l increasesΦl, an effect that is compounded by decreasing the P:C of Φl asthe ambient PO4 concentration becomes more scarce. Alto-gether, this could produce more than a 20 ppm difference inatmospheric CO2 for a change in PO4l of only 0.1 μM (Fig. 4),such as might occur given a change in nitrogen limitation at lowlatitudes. Thus, the export of low P:C organic matter at low
Variable P:C
Fixed P:C
fhd T PO4l
High latitude PO4 ( M) High latitude PO4 ( M) High latitude PO4 ( M)
High latitude PO4 ( M) High latitude PO4 ( M) High latitude PO4 ( M)
0.5 0.5 0.5
0.5 0.5 0.5
1 1 1
1 1 1
increasing fhdincreasing T
increasingPO4l
increasingPO4l
increasing Tincreasing fhd
increasing h
increasing hincreasing h
increasing h
increasing h increasing h200 200 200
200 200 200
250 250 250
250 250 250
Atm
osph
eric
CO
2(p
pm)
Atm
osph
eric
CO
2(p
pm)
Atm
osph
eric
CO
2(p
pm)
Atm
osph
eric
CO
2(p
pm)
Atm
osph
eric
CO
2(p
pm)
Atm
osph
eric
CO
2(p
pm)
300 300 300
300 300 300
350 350 350
350 350 350
2 2 2
2 2 2
1.5 1.5 1.5
1.5 1.5 1.5
Fig. 3. Relationship between preformed PO4 and pCO2 in box model simulations. Top panels show results with fixed P:C, bottom panels show variable P:Cfollowing the Line of Frugality illustrated in Fig. 1. Each panel shows the pCO2 predicted by 100 model simulations that simultaneously vary the high-latitudeexport flux (Φh, each value of which is shown by a single color) along a range of values for the other variable as indicated (shown as a continuous line for eachvalue of high-latitude export), where PO4l is low-latitude PO4, T is thermohaline overturning and fhd is high-latitude vertical mixing. For example, for thevariable P:C model, varying PO4l over the full range of values produces pCO2 changes of more than 70 ppm, with little effect on the preformed PO4.
8202 | www.pnas.org/cgi/doi/10.1073/pnas.1423917112 Galbraith and Martiny
Dow
nloa
ded
by g
uest
on
June
10,
202
0

latitudes could be a more significant player than often realized indetermining the strength of the global soft tissue pump. BecausePO4l would be dependent on the availability of nitrogen in low-latitude surface waters, it would be expected to respond tochanges in denitrification and N2 fixation, emphasizing theirimportance to the carbon cycle (33).Despite the reduced applicability of the preformed-PO4 metric
under variable P:C, the smaller variability of N:C would suggestthat the relationship between remineralized NO3 (i.e., the non-preformed component of NO3) and soft tissue pump carbon stor-age should be more robust. This general principle could makeremineralized NO3 a better monitor of changes in the biologicalpump, particularly given the fact that past changes in relative NO3consumption can be reconstructed using the stable isotopes of ni-trogen recorded in marine sediments (34, 35). The difficulty in theuse of remineralized NO3 is the fact that denitrification can reduceNO3 concentrations along circulation pathways, so that the nitrateconcentration is less than the sum of the preformed and remin-eralized components. Furthermore, variability of N:C may be suf-ficient to cause a significant divergence of the soft tissue pumpstrength from remineralized nitrate, although this is difficult tojudge without a better understanding of what controls the N:C (36).
ConclusionsThe stoichiometric ratios P:C and N:C are usually held constantin global biogeochemical models, despite evidence for significantvariability from field and laboratory studies. Based on globalsuspended particulate measurements, it would appear that thecommunity-averaged N:C varies linearly with the dissolved con-centrations of NO3 over low NO3 concentrations, and that thecommunity-averaged P:C varies linearly with PO4 across therange of modern ocean PO4 concentrations. We suggest that thisis because the phytoplankton community tends to adjust to theavailable nutrient concentrations, either by intraspecific plasticityof elemental composition (e.g., ref. 37), or by shifting the speciesassemblage. All else being equal, the most frugal phytoplankton—those with the lowest requirements for a nutrient—dominate whenthe concentrations of that nutrient are lowest, and therefore mostdifficult to obtain. Because N is an integral component of manyorganic molecules, the N:C varies by less than 30% in response tochanges in NO3, whereas P:C varies by a factor of three in re-sponse to changes in PO4. As a corollary, changes in the N:P ratio
of phytoplankton communities are mostly due to changes in theconcentration of PO4 in the ambient waters, with little de-pendence on the ambient ratio of NO3:PO4.A simple model based on these observations predicts the P:C
of export as a function of PO4. When included in a classic boxmodel, the flexible P:C model shows heightened sensitivity of at-mospheric CO2 to ocean circulation and the low-latitude PO4concentration. Significant variations in the P:C of sinking organicmatter weaken the relationship between preformed PO4 and CO2storage, suggesting that mechanisms of change in the biologicalpump could be better framed in terms of remineralized NO3. Thesimple predictive model can be tested against future observationsand laboratory study.The large impacts of variable P:C on ocean carbon storage
illustrated by the simple box model suggest that global bio-geochemical models should place a high priority on resolving P:Cplasticity, in order to improve the understanding of past and presentvariability, and to account for this important aspect of the marineecosystem in future projections of N2 fixation, denitrification, oceancarbon uptake and oxygen distributions.
MethodsData Analysis. The particulate data of ref. 7 is reanalyzed here as follows. Foreach station (i.e., geographic location at which samples were collected), allavailable measurements of particulate organic carbon (POC), particulateorganic nitrogen (PON), particulate organic phosphorus (POP), nitrate, andphosphate within the upper 30 m of the water column were averaged.Wherever particulate data existed without corresponding nutrient mea-surements, the climatological nutrient concentration for the same locationwas taken from the monthly WOA climatology (7). The P:C and N:C werecalculated for all stations at which the mean POP and PON concentrationswere greater than 0.005 μmol l−1. This selection process resulted in 610stations with P:C and 4,064 stations with N:C data (Fig. S1).
A linear regression of P:C vs. PO4 was calculated using all 610 (unbinned)data points, giving an intercept of 6.0 ± 0.2 ‰ and slope of 6.9 ± 0.4 ‰
μmol−1 L as shown by the solid orange lines in Fig. 1 and Fig. S2, referred toas the Line of Frugality. The linear regression coefficient (r2, Pearson) againstall 610 data points is 0.36 (P < 10−60). In addition, the log-transformed meansof the binned data were used to generate an alternative linear regression,given that the log-transformed values within each bin showed a morenormal distribution. The binned-lognormal mean regression gives a signifi-cantly lower intercept of 4.8 ± 0.5 ‰ and a slightly higher slope of 7.3 ±0.6‰ μmol−1 L, shown by the dashed orange lines in Fig. 1 and Fig. S2. Thelinear regression coefficient of the binned-lognormal mean regression lineagainst the nine binned means is 0.95 (r2, Pearson, P < 10−5). To illustrate thefull uncertainty in the Line of Frugality, the combined range of the 95%confidence intervals for both regressions is shown by the shaded areas inFigs. 1 and 4.
A linear regression of N:C vs. NO3 using all 4,064 stations shows a weak(0.8 ‰ μM−1), but highly significant (P < 10−10) linear increase over the fullrange of NO3 concentrations. However, if only the stations with >5 μM NO3
are analyzed, the linear regression has a near-zero slope that is only weaklysignificant (P < 0.1), whereas a regression over the lowermost 3 μM NO3 rangeshows a strong slope (11 ‰ μM−1) with very high significance (P < 10−10). Thisrapid increase of N:C over low NO3 concentrations, followed by negligiblechange, is consistent with a saturating hyperbolic relationship. An optimizedfit using a Holling type 2 functional form is given by N:C = 125 ‰ + 30 ‰ ×NO3/(0.32 μM + NO3), shown in Fig. 1 and Fig. S2 along with a shaded intervalthat spans the 95% confidence intervals of the nonlinear fit using both the fullunbinned dataset as well as binned log-transformed means.
Model. The biogeochemical model used here includes three ocean boxes andone atmospheric box, following ref. 31. The low-latitude surface PO4 con-centration is restored to a defined value, generating an export flux Φl thatdepends on the physical supply of PO4 to the low latitudes by the thermo-haline circulation T, whereas the high-latitude surface export flux Φh is im-posed as an input parameter, representing iron-light-temperature-limitedgrowth. A prescribed vertical mixing flux exchanges water between thehigh-latitude surface and the deep box, fhd. Carbonate exported from thesurface by calcifying organisms is set to 20% of the organic carbon exportflux, within the observational range given by Berelson et al. (38). Within thesurface boxes, the carbonate equilibria are solved as a function of DissolvedInorganic Carbon (DIC) and alkalinity concentrations, to determine the
Low latitude surface PO4 ( M)0 0.2 0.4 0.6
Atm
osph
eric
CO
2(p
pm)
150
200
250
300
variable P:C
Fig. 4. Relationship between low-latitude PO4 and pCO2 in box modelsimulations. High-latitude export Φh is held constant at an intermediatevalue for the simulations shown here. The variable P:C simulations (orange)show a much larger impact of low-latitude PO4 on pCO2 than the fixed P:Csimulations (gray). The enhanced sensitivity of the variable P:C simulationsarises from the greater carbon storage achieved by low-latitude export, permol of P export, compared with high-latitude export. The range of possibleCO2, corresponding to the 95% confidence intervals of the Line of Frugalityregression shown in Fig. 1, are indicated by the region of orange shading.
Galbraith and Martiny PNAS | July 7, 2015 | vol. 112 | no. 27 | 8203
ENVIRONMEN
TAL
SCIENCE
SSE
ECO
MMEN
TARY
Dow
nloa
ded
by g
uest
on
June
10,
202
0

saturation state of CO2. Air–sea exchange is a linear function of CO2 satu-ration state and a constant air sea exchange coefficient (the “piston veloc-ity”), as described in ref. 39.
For the purposes at hand, we assume that the P:C of sinking particulateexport follows the same relationship with surface phosphate as themeasuredsurface particles. The real world is undoubtedly more complex, given pref-erential export by specific taxa (such as diatom aggregates) at particulartimes of year, and the consumption of phytoplankton by heterotrophs,producing rapidly sinking fecal pellets with P:C that differs from that ofthe food source (40). Additionally, it has been observed that P disappearsmore rapidly than C from sinking particles within the upper water column,implying preferential remineralization of P that would add a vertical di-mension to differential P:C cycling (41–43). Nonetheless, two recent globalinverse models incorporating ocean circulation and chemical data (25, 44)found a close match across ocean basins between the stoichiometry of netorganic matter export and the suspended particulate data used here, as
well as with the Line of Frugality prediction (Fig. S3). The good agreementbetween these alternative methods suggests that the Line of Frugality pre-diction captures the first order variability in P:C of exported organic matter.
The low-latitude PO4 concentration PO4l is restored to a prescribed valuethat is varied between 0–0.6 μM. The export flux of carbon from the high-latitude box Φh is prescribed to vary from 0.25 to 4 Pg C y−1, as might occurunder large changes of iron fertilization. The thermohaline overturning T isvaried over a range of 10–45 Sv. The high-latitude vertical mixing fhd isvaried over a range of 30–130 Sv. Varying each of PO4l, T, and fhd over10 values with simultaneous variations in Φh over 10 values results in a totalof 300 simulations, each of which was repeated with both fixed and flexibleP:C, run to equilibrium (20,000 y).
ACKNOWLEDGMENTS.We thank Daniele Bianchi for help with the box modelcode, and for comments on an early version of themanuscript. We are gratefulto John Dunne, Jorge Sarmiento, and François Primeau for discussions, and totwo anonymous reviewers for their thoughtful and constructive suggestions.
1. Sterner RW, Elser JJ (2002) Ecological Stoichiometry (Princeton University Press,Princeton), p 439.
2. Geider RJ, La Roche J (2002) Redfield revisited: variability of C: N: P in marine mi-croalgae and its biochemical basis. Eur J Phycol 37(1):1–17.
3. Quigg A, et al. (2003) The evolutionary inheritance of elemental stoichiometry inmarine phytoplankton. Nature 425(6955):291–294.
4. Rhee G-Y (1978) Effects of N: P atomic ratios and nitrate limitation on algal growth,cell composition, and nitrate uptake. Limnol Oceanogr 23(1):10–25.
5. Goldman JC, McCarthy JJ, Peavey DG (1979) Growth rate influence on the chemicalcomposition of phytoplankton in oceanic waters. Nature 279:210–215.
6. Karl DM, et al. (2001) Ecological nitrogen-to-phosphorus stoichiometry at stationALOHA. Deep Sea Res Part II Top Stud Oceanogr 48(8):1529–1566.
7. Martiny AC, et al. (2013) Strong latitudinal patterns in the elemental ratios of marineplankton and organic matter. Nat Geosci 6(4):279–283.
8. Weber TS, Deutsch C (2010) Ocean nutrient ratios governed by plankton bio-geography. Nature 467(7315):550–554.
9. Deutsch C, Weber T (2012) Nutrient ratios as a tracer and driver of ocean bio-geochemistry. Annu Rev Mar Sci 4:113–141.
10. Klausmeier CA, Litchman E, Daufresne T, Levin SA (2004) Optimal nitrogen-to-phos-phorus stoichiometry of phytoplankton. Nature 429(6988):171–174.
11. Toseland A, et al. (2013) The impact of temperature on marine phytoplankton re-source allocation and metabolism. Nature Climate Change 3(11):979–984.
12. Arrigo KR, et al. (1999) Phytoplankton community structure and the drawdown ofnutrients and CO2 in the southern ocean. Science 283(5400):365–367.
13. Bopp L, et al. (2013) Multiple stressors of ocean ecosystems in the 21st century: Pro-jections with CMIP5 models. Biogeosciences 10(10):6225–6245.
14. Tilman D, Kilham SS, Kilham P (1982) Phytoplankton community ecology: the role oflimiting nutrients. Annu Rev Ecol Syst 13:349–372.
15. Moore C, et al. (2013) Processes and patterns of oceanic nutrient limitation. NatGeosci 6:701–710.
16. Van Mooy BA, et al. (2009) Phytoplankton in the ocean use non-phosphorus lipids inresponse to phosphorus scarcity. Nature 458(7234):69–72.
17. Boyd PW, et al. (2007) Mesoscale iron enrichment experiments 1993-2005: synthesisand future directions. Science 315(5812):612–617.
18. Morel FM (1987) Kinetics of nutrient uptake and growth in phytoplankton. J Phycol23(1):137–150.
19. Bonachela JA, Raghib M, Levin SA (2011) Dynamic model of flexible phytoplanktonnutrient uptake. Proc Natl Acad Sci USA 108(51):20633–20638.
20. Falkowski PG, et al. (2004) The evolution of modern eukaryotic phytoplankton. Sci-ence 305(5682):354–360.
21. Liu H, Nolla HA, Campbell L (1997) Prochlorococcus growth rate and contribution toprimary production in the equatorial and subtropical North Pacific Ocean. AquatMicrob Ecol 12(1):39–47.
22. Lomas MW, Bonachela JA, Levin SA, Martiny AC (2014) Impact of ocean phytoplanktondiversity on phosphate uptake. Proc Natl Acad Sci USA 111(49):17540–17545.
23. Makino W, Cotner J, Sterner R, Elser J (2003) Are bacteria more like plants or animals?Growth rate and resource dependence of bacterial C: N: P stoichiometry. Funct Ecol17(1):121–130.
24. Hall SR, Smith VH, Lytle DA, Leibold MA (2005) Constraints on primary producer N:P stoichiometry along N: P supply ratio gradients. Ecology 86(7):1894–1904.
25. DeVries T, Deutsch C (2014) Large-scale variations in the stoichiometry of marine
organic matter respiration. Nat Geosci 7(12):890–894.26. Ruttenberg KC (2003) The Global Phosphorus Cycle. Treatise on Geochemistry, ed
Elderfield H (Elsevier, Amsterdam), Vol 8, pp 585–643.27. Broecker WS (1982) Ocean chemistry during glacial time. Geochim Cosmochim Acta
46(10):1689–1705.28. Sigman DM, Boyle EA (2000) Glacial/interglacial variations in atmospheric carbon
dioxide. Nature 407(6806):859–869.29. Ito T, Follows MJ (2005) Preformed phosphate, soft tissue pump and atmospheric
CO2. J Mar Res 63(4):813–839.30. Marinov I, et al. (2008) Impact of oceanic circulation on biological carbon storage in
the ocean and atmospheric pCO2. Global Biogeochem Cycles 22(3):GB3007.31. Sarmiento JL, Toggweiler JR (1984) A new model for the role of the oceans in de-
termining atmophericpCO2. Nature 308:621–624.32. Sigman DM, Haug GH (2003) The Biological Pump in the Past. Treatise on Geo-
chemistry, eds Holland D, Turekian KK (Elsevier, Amsterdam), Vol 6, pp 491–528.33. Falkowski PG (1997) Evolution of the nitrogen cycle and its influence on the biological
sequestration of CO2in the ocean. Nature 387(6630):272–275.34. Altabet MA, Francois R (1994) Sedimentary Nitrogen Isotopic Ratio As a Recorder For
Surface Ocean Nitrate Utilization. Global Biogeochem Cycles 8(1):103–116.35. Galbraith ED, Kienast M; NICOPP-Working-Group (2013) The acceleration of oceanic
denitrification during deglacial warming. Nat Geosci 6(7):579–584.36. Martiny AC, Vrugt JA, Primeau FW, Lomas MW (2013) Regional variation in the
particulate organic carbon to nitrogen ratio in the surface ocean. Global Biogeochem
Cycles 27(3):723–731.37. White AE, Spitz Y, Karl D, Letelier RM (2006) Flexible elemental stoichiometry in Tri-
chodesmium spp. and its ecological implications. Limnol Oceanogr 51(4):1777–1790.38. Berelson W, et al. (2007) Relating estimates of CaCO3 production, export, and dis-
solution in the water column to measurements of CaCO3 rain into sediment traps and
dissolution on the sea floor: A revised global carbonate budget. Global Biogeochem
Cycles 21(1):GB1024.39. Sarmiento J, Gruber N (2006) Ocean Biogeochemical Dynamics (Princeton University
Press, Princeton, Oxford).40. Sterner RW (1990) The ratio of nitrogen to phosphorus resupplied by herbivores:
zooplankton and the algal competitive arena. Am Nat 136(2):209–229.41. Faul KL, Paytan A, Delaney ML (2005) Phosphorus distribution in sinking oceanic
particulate matter. Mar Chem 97(3):307–333.42. Lyons G, Benitez-Nelson CR, Thunell RC (2011) Phosphorus composition of sinking
particles in the Guaymas Basin, Gulf of California. Limnol Oceanogr 56(3):1093.43. Sekula‐Wood E, Benitez‐Nelson CR, Bennett MA, Thunell R (2012) Magnitude and
composition of sinking particulate phosphorus fluxes in Santa Barbara Basin, Cal-
ifornia. Global Biogeochem Cycles 26(2):GB2023.44. Teng Y-C, Primeau FW, Moore JK, Lomas MW, Martiny AC (2014) Global-scale vari-
ations of the ratios of carbon to phosphorus in exported marine organic matter.
Nat Geosci 7(12):895–898.45. Garcia HE, et al. (2014) Dissolved Inorganic Nutrients (Phosphate, Nitrate, Silicate),
World Ocean Atlas 2013, eds Levitus S, Mishonov A (NOAA Atlas NESDIS 76, Silver
Spring, MD), Vol 4.
8204 | www.pnas.org/cgi/doi/10.1073/pnas.1423917112 Galbraith and Martiny
Dow
nloa
ded
by g
uest
on
June
10,
202
0